| | |
| | OMB APPROVAL |
| | OMB Number: 3235-0570 Expires: January 31, 2017 Estimated average burden hours per response: 20.6 |
UNITED STATES
SECURITIES AND EXCHANGE COMMISSION
Washington, D.C. 20549
FORM N-CSR
CERTIFIED SHAREHOLDER REPORT OF REGISTERED
MANAGEMENT INVESTMENT COMPANIES
| | | | |
Investment Company Act file | | |
number | | 811-07452 | | |
| | | | |
| | AIM Variable Insurance Funds (Invesco Variable Insurance Funds) | | |
| | (Exact name of registrant as specified in charter) | | |
| | | | |
| | 11 Greenway Plaza, Suite 1000 Houston, Texas 77046 | | |
| | (Address of principal executive offices) (Zip code) | | |
| | |
Philip A. Taylor 11 Greenway Plaza, Suite 1000 Houston, Texas 77046 | | |
| (Name and address of agent for service) | | |
|
Registrant’s telephone number, including area code: (713) 626-1919 |
| | | | |
Date of fiscal year end: | | 12/31 | | |
| | |
Date of reporting period: | | 12/31/15 | | |
Item 1. Report to Stockholders.
| | | | |
| | |

| | Annual Report to Shareholders | | December 31, 2015 |
| | |
| | Invesco V.I. American Franchise Fund |

| | |
| | The Fund provides a complete list of its holdings four times in each fiscal year, at the quarter-ends. For the second and fourth quarters, the lists appear in the Fund’s semiannual and annual reports to shareholders. For the first and third quarters, the Fund files the lists with the Securities and Exchange Commission (SEC) on Form N-Q. The Fund’s Form N-Q filings are available on the SEC website, sec.gov. Copies of the Fund’s Forms N-Q may be reviewed and copied at the SEC Public Reference Room in Washington, D.C. You can obtain information on the operation of the Public Reference Room, including information about duplicating fee charges, by calling 202 551 8090 or 800 732 0330, or by electronic request at the following email address: publicinfo@sec.gov. The SEC file numbers for the Fund are 811-07452 and 033-57340. The Fund’s most recent portfolio holdings, as filed on Form N-Q, have also been made available to insurance companies issuing variable annuity contracts and variable life insurance policies (“variable products”) that invest in the Fund. A description of the policies and procedures that the Fund uses to determine how to vote proxies relating to portfolio securities is available without charge, upon request, from our Client Services department at 800 959 4246 or at invesco.com/proxyguidelines. The information is also available on the SEC website, sec.gov. Information regarding how the Fund voted proxies related to its portfolio securities during the most recent 12-month period ended June 30 is available at invesco.com/ proxysearch. The information is also available on the SEC website, sec.gov. Invesco Advisers, Inc. is an investment adviser; it provides investment advisory services to individual and institutional clients and does not sell securities. Invesco Distributors, Inc. is the US distributor for Invesco Ltd.’s retail mutual funds, exchange-traded funds and institutional money market funds. Both are wholly owned, indirect subsidiaries of Invesco Ltd. This report must be accompanied or preceded by a currently effective Fund prospectus and variable product prospectus, which contain more complete information, including sales charges and expenses. Investors should read each carefully before investing. Invesco Distributors, Inc. VK-VIAMFR-AR-1 NOT FDIC INSURED | MAY LOSE VALUE | NO BANK GUARANTEE |
Management’s Discussion of Fund Performance
Performance summary
For the year ended December 31, 2015, Series I shares of Invesco V.I. American Franchise Fund (the Fund) underperformed the Russell 1000 Growth Index, the Fund’s style-specific benchmark.
Your Fund’s long-term performance appears later in this report.
Fund vs. Indexes
Total returns, 12/31/14 to 12/31/15, excluding variable product issuer charges.
If variable product issuer charges were included, returns would be lower.
| | | | | |
| Series I Shares | | | | 5.01 | % |
| Series II Shares | | | | 4.75 | |
| S&P 500 Index▼ (Broad Market Index) | | | | 1.38 | |
| Russell 1000 Growth Index▼ (Style-Specific Index) | | | | 5.67 | |
| Lipper VUF Large-Cap Growth Funds Indexn (Peer Group Index) | | | | 7.52 | |
Source(s): ▼FactSet Research Systems Inc.; nLipper Inc.
Market conditions and your Fund
The US economy continued its modest, but steady growth, during the year ended December 31, 2015 – although the health of individual economic sectors varied dramatically. The headline economic story was a steady decline in already-battered energy markets, as oil prices plummeted when increased supply overwhelmed demand. This decline particularly affected companies with US-based offshore or shale-based resources – companies whose cost to recover oil is higher than many traditional producers. On the other end of the spectrum, the improved position of the US consumer was the more subtle story which drove the US economy forward during the year.
As the year began, economic growth appeared to be stronger in the US than in the rest of the world. US equity markets were recovering from the crash of oil prices initiated by OPEC’s decision to maintain high production despite low prices and slowing global growth. The view that the US Federal Reserve (the Fed) would begin raising rates while other central banks were loosening monetary policy led the US dollar to strengthen
against many currencies. This hurt commodity- and materials-based economies – and companies in related sectors. Additionally, US-based multinational companies faced foreign exchange headwinds. Low interest rates, the increasing availability of credit and an improving employment picture all contributed to higher consumer confidence and consumer spending, which drove US equity markets higher, particularly through the spring, and helped overcome fears that Greece and the eurozone would fail to reach an agreement on a financial bailout plan.
In the summer of 2015, US equity markets moved sharply lower. A significant downturn in China’s financial markets and weak global economic growth led the Fed to delay raising interest rates; this, in turn, increased investor uncertainty and market volatility. A continued decline in oil prices also contributed to market volatility. In the fall, however, US markets rallied, the Fed saw enough economic stabilization to finally raise interest rates, and most major US market indexes ended the year barely in positive territory.
During the year, the Fund produced positive returns, slightly trailing the
Fund’s style-specific benchmark. The Fund outperformed its style-specific benchmark in the industrials, information technology (IT) and materials sectors, while it underperformed in the consumer discretionary, energy and telecommunication services sectors.
The Fund outperformed its style-specific benchmark by the widest margin in the industrials sector due to both strong stock selection and underweight exposure to this weak area of the market. Within the sector, Raytheon was a strong contributor to Fund performance as it realized solid orders for missile defense systems and reported better-than-expected results for the integration of a recently acquired business. Roper Technologies continued to intelligently enter new lines of businesses, and produced significant and growing cash flows, making it a solid performer for the Fund during the year.
In the IT sector, Facebook, a high-conviction holding, significantly benefited shareholders. Throughout the year, the company reported increased usage, increased migration to mobile devices, and increased video usage, which also led to increased video advertising revenue. In addition, the company reduced guidance for its future expenses. Google and the restructured holding company it launched during the year, Alphabet, contributed to the Fund’s performance versus its style-specific benchmark. During the year, a new chief financial officer enhanced communication with investors and stressed cost discipline for the company. This responsible messaging combined with strength in its YouTube and mobile-search businesses led the company’s stock higher.
The materials sector was fairly weak during the year. The Fund outperformed its style-specific benchmark in this sector due to stock selection and modest under-
| | |
| Portfolio Composition | | |
By sector | | % of total net assets |
| | |
| |
| Information Technology | | 35.0% |
| Consumer Discretionary | | 20.9 |
| Health Care | | 20.6 |
| Industrials | | 6.8 |
| Consumer Staples | | 6.1 |
| Financials | | 5.3 |
| Telecommunication Services | | 1.5 |
| Materials | | 1.4 |
| Energy | | 1.1 |
| Money Market Funds | | |
| Plus Other Assets Less Liabilities | | 1.3 |
| | | | | | | |
| Top 10 Equity Holdings* |
| | % of total net assets |
| | | | | | | |
| | |
| 1. | | Alphabet Inc.-Class A | | | | 6.7 | % |
| 2. | | Facebook Inc.-Class A | | | | 5.6 | |
| 3. | | Amazon.com, Inc. | | | | 5.1 | |
| 4. | | Apple Inc. | | | | 4.9 | |
| 5. | | MasterCard, Inc.-Class A | | | | 3.7 | |
| 6. | | Lowe’s Cos., Inc. | | | | 3.5 | |
| 7. | | Carnival Corp. | | | | 2.7 | |
| 8. | | Gilead Sciences, Inc. | | | | 2.7 | |
| 9. | | Celgene Corp. | | | | 2.6 | |
| 10. | | Alkermes PLC | | | | 2.5 | |
| | | | | |
| Total Net Assets | | | | $655.2 million | |
| |
| Total Number of Holdings* | | | | 65 | |
The Fund’s holdings are subject to change, and there is no assurance that the Fund will continue to hold any particular security.
*Excluding money market fund holdings.
Data presented here are as of December 31, 2015.
Invesco V.I. American Franchise Fund
weight exposure. Martin Marietta Materials and Dow Chemical were two Fund holdings in this sector which significantly outperformed the Fund’s style-specific benchmark. We sold our position in Martin Marietta Materials before the end of the reporting period.
The consumer discretionary sector was a strong-performing sector during the year. Fund holdings in this sector had solid positive returns, but underperformed those of the style-specific benchmark. Dish Network was a significant holding in the Fund based on its wireless spectrum assets; however, the stock pulled back as the potential catalysts to unlock spectrum value seemed to move further into the future and the pay television business was weak. Michael Kors was another large detractor from Fund performance and was sold during the year.
The energy sector was the worst-performing sector of the market again this year. As a result, energy holdings now represent a very small slice of the large-cap growth market overall. The Fund trailed its style-specific index in this sector primarily due to modest overweight exposure to energy stocks. Whiting Petroleum was a significant detractor from Fund performance and was sold during the year as the imbalance of supply and demand evolved.
The Fund’s lone holding in the telecommunication services sector was Sprint, which underperformed the style-specific benchmark. The company generally improved its subscriber and network metrics through the year. However, investors focused on financing, considering the company’s relatively high debt levels and available cash flow within a skittish high yield financing environment, and the stock pulled back as a result.
Thank you for your commitment to Invesco V.I. American Franchise Fund and for sharing our long-term investment horizon.
The views and opinions expressed in management’s discussion of Fund performance are those of Invesco Advisers, Inc. These views and opinions are subject to change at any time based on factors such as market and economic conditions. These views and opinions may not be relied upon as investment advice or recommendations, or as an offer for a particular security. The information is not a complete analysis of every aspect of any market, country, industry, security or the Fund. Statements of fact are from sources considered reliable, but Invesco Advisers, Inc. makes no representation or warranty as to their completeness or accuracy. Although historical performance is no guarantee of future results, these insights may help you understand our investment management philosophy.
See important Fund and, if applicable, index disclosures later in this report.
| | |
 | | Erik Voss Chartered Financial Analyst, Portfolio Manager, is lead manager of Invesco V.I. American |
| Franchise Fund. He joined Invesco in 2010. Mr. Voss earned a BS in mathematics and an MS in finance from the University of Wisconsin. |
| |
 | | Ido Cohen Portfolio Manager, is manager of Invesco V.I. American Franchise Fund. He joined Invesco in 2010. |
| Mr. Cohen earned a BS in economics from The Wharton School of the University of Pennsylvania. |
Invesco V.I. American Franchise Fund
Your Fund’s Long-Term Performance
Results of a $10,000 Investment – Oldest Share Class(es)
Fund and index data from 12/31/05
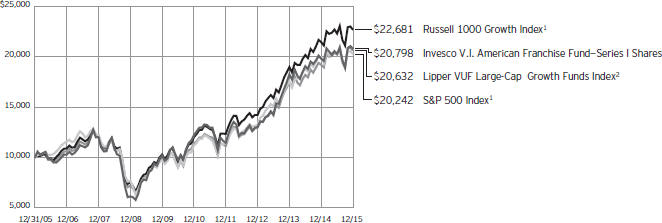
| 1 | Source: FactSet Research Systems Inc. |
Past performance cannot guarantee
comparable future results.
| | | | | |
Average Annual Total Returns | | | | | |
As of 12/31/15 | | | | | |
| |
| Series I Shares | | | | | |
Inception (7/3/95) | | | | 9.03 | % |
10 Years | | | | 7.60 | |
5 Years | | | | 11.23 | |
1 Year | | | | 5.01 | |
| |
| Series II Shares | | | | | |
Inception (9/18/00) | | | | 0.36 | % |
10 Years | | | | 7.33 | |
5 Years | | | | 10.95 | |
1 Year | | | | 4.75 | |
Effective June 1, 2010, Class I and Class II shares of the predecessor fund, Van Kampen Life Investment Trust Capital Growth Portfolio, advised by Van Kampen Asset Management were reorganized into Series I and Series II shares, respectively, of Invesco Van Kampen V.I. Capital Growth Fund (renamed Invesco V.I. American Franchise Fund on April 29, 2013). Returns shown above for Series I and Series II shares are blended returns of the predecessor fund and Invesco V.I. American Franchise Fund. Share class returns will differ from the predecessor fund because of different expenses.
The performance data quoted represent past performance and cannot guarantee comparable future results; current performance may be lower or higher. Please contact your variable product issuer or financial adviser for the most recent month-end variable product performance. Performance figures reflect Fund expenses, reinvested distributions and changes in net asset value. Investment return and principal value will fluctuate so that you may have a gain or loss when you sell shares.
The total annual Fund operating expense ratio set forth in the most recent Fund prospectus as of the date of this report for Series I and Series II shares was 0.95% and 1.20%, respectively. The expense ratios presented above may vary from the expense ratios presented in other sections of this report that are based on expenses incurred during the period covered by this report.
Invesco V.I. American Franchise Fund, a series portfolio of AIM Variable Insurance Funds (Invesco Variable Insurance Funds), is currently offered
through insurance companies issuing variable products. You cannot purchase shares of the Fund directly. Performance figures given represent the Fund and are not intended to reflect actual variable product values. They do not reflect sales charges, expenses and fees assessed in connection with a variable product. Sales charges, expenses and fees, which are determined by the variable product issuers, will vary and will lower the total return.
The most recent month-end performance at the Fund level, excluding variable product charges, is available at 800 451 4246. As mentioned above, for the most recent month-end performance including variable product charges, please contact your variable product issuer or financial adviser.
Fund performance reflects any applicable fee waivers and/or expense reimbursements. Had the adviser not waived fees and/or reimbursed expenses currently or in the past, returns would have been lower. See current prospectus for more information.
Invesco V.I. American Franchise Fund
Invesco V.I. American Franchise Fund’s investment objective is to seek capital growth.
| n | | Unless otherwise stated, information presented in this report is as of December 31, 2015, and is based on total net assets. |
| n | | Unless otherwise noted, all data provided by Invesco. |
| n | | To access your Fund’s reports/prospectus, visit invesco.com/fundreports. |
Principal risks of investing in the Fund
Foreign securities risk. The Fund’s foreign investments may be affected by changes in a foreign country’s exchange rates, political and social instability, changes in economic or taxation policies, difficulties when enforcing obligations, decreased liquidity, and increased volatility. Foreign companies may be subject to less regulation resulting in less publicly available information about the companies.
Growth investing risk. Growth stocks tend to be more expensive relative to their earnings or assets compared with other types of stock. As a result they tend to be more sensitive to changes in their earnings and can be more volatile.
Management risk. The investment techniques and risk analysis used by the Fund’s portfolio managers may not produce the desired results.
Market risk. The prices of and the income generated by the Fund’s securities may decline in response to, among other things, investor sentiment, general economic and market conditions, regional or global instability, and currency and interest rate fluctuations.
Mid-capitalization risk. Stocks of mid-sized companies tend to be more vulnerable to adverse developments and may have little or no operating history or track record of success, and limited product lines, markets, management and financial resources. The securities of mid-sized companies may be more volatile due to less market interest and less publicly available information about the issuer. They also may be illiquid or restricted as to resale, or may trade less frequently and in smaller volumes, all of which may cause difficulty when establishing or closing a position at a desirable price.
About indexes used in this report
The S&P 500® Index is an unmanaged index considered representative of the US stock market.
The Russell 1000® Growth Index is an unmanaged index considered representative of large-cap growth stocks. The Russell 1000 Growth Index is a trademark/service mark of the Frank Russell Co. Russell® is a trademark of the Frank Russell Co.
The Lipper VUF Large-Cap Growth Funds Index is an unmanaged index considered representative of large-cap growth variable insurance underlying funds tracked by Lipper.
The Fund is not managed to track the performance of any particular index, including the index(es) described here, and consequently, the performance of the Fund may deviate significantly from the performance of the index(es).
A direct investment cannot be made in an index. Unless otherwise indicated, index results include reinvested dividends, and they do not reflect sales charges. Performance of the peer group, if applicable, reflects fund expenses; performance of a market index does not.
Other information
The returns shown in management’s discussion of Fund performance are based on net asset values calculated for shareholder transactions. Generally accepted accounting principles require adjustments to be made to the net assets of the Fund at period end for financial reporting purposes, and as such, the net asset values for shareholder transactions and the returns based on those net asset values may differ from the net asset values and returns reported in the Financial Highlights. Additionally, the returns and net asset values shown throughout this report are at the Fund level only and do not include variable product issuer charges. If such charges were included, the total returns would be lower.
Industry classifications used in this report are generally according to the Global Industry Classification Standard, which was developed by and is the exclusive property and a service mark of MSCI Inc. and Standard & Poor’s.
Invesco V.I. American Franchise Fund
Schedule of Investments(a)
December 31, 2015
| | | | | | | | |
| | | Shares | | | Value | |
Common Stocks & Other Equity Interests–98.67% | |
| Aerospace & Defense–2.06% | |
Honeywell International Inc. | | | 51,411 | | | $ | 5,324,637 | |
Raytheon Co. | | | 65,543 | | | | 8,162,070 | |
| | | | | | | | 13,486,707 | |
|
| Air Freight & Logistics–0.72% | |
FedEx Corp. | | | 31,810 | | | | 4,739,372 | |
|
| Airlines–1.52% | |
Southwest Airlines Co. | | | 231,256 | | | | 9,957,883 | |
|
| Application Software–2.31% | |
salesforce.com, inc.(b) | | | 193,166 | | | | 15,144,214 | |
|
| Biotechnology–12.13% | |
Alexion Pharmaceuticals, Inc.(b) | | | 21,496 | | | | 4,100,362 | |
Alkermes PLC(b) | | | 208,893 | | | | 16,581,927 | |
Amgen Inc. | | | 57,158 | | | | 9,278,458 | |
Biogen Inc.(b) | | | 23,686 | | | | 7,256,206 | |
Celgene Corp.(b) | | | 143,440 | | | | 17,178,375 | |
Gilead Sciences, Inc. | | | 172,622 | | | | 17,467,620 | |
Vertex Pharmaceuticals Inc.(b) | | | 60,351 | | | | 7,593,966 | |
| | | | | | | | 79,456,914 | |
|
| Cable & Satellite–3.43% | |
DISH Network Corp.–Class A(b) | | | 282,442 | | | | 16,150,033 | |
Time Warner Cable Inc. | | | 34,142 | | | | 6,336,414 | |
| | | | | | | | 22,486,447 | |
|
| Communications Equipment–0.94% | |
Palo Alto Networks, Inc.(b) | | | 35,017 | | | | 6,167,894 | |
|
| Consumer Electronics–2.43% | |
Harman International Industries, Inc. | | | 86,042 | | | | 8,106,017 | |
Sony Corp. (Japan) | | | 320,100 | | | | 7,841,934 | |
| | | | | | | | 15,947,951 | |
|
| Data Processing & Outsourced Services–5.64% | |
First Data Corp.–Class A(b) | | | 353,657 | | | | 5,665,585 | |
MasterCard, Inc.–Class A | | | 251,176 | | | | 24,454,495 | |
Visa Inc.–Class A | | | 87,758 | | | | 6,805,633 | |
| | | | | | | | 36,925,713 | |
|
| Distillers & Vintners–0.96% | |
Constellation Brands, Inc.–Class A | | | 43,914 | | | | 6,255,110 | |
|
| Diversified Chemicals–0.15% | |
Dow Chemical Co. (The) | | | 19,486 | | | | 1,003,139 | |
|
| Drug Retail–0.74% | |
CVS Health Corp. | | | 49,889 | | | | 4,877,648 | |
|
| Environmental & Facilities Services–1.08% | |
Republic Services, Inc. | | | 161,394 | | | | 7,099,722 | |
| | | | | | | | |
| | | Shares | | | Value | |
| Fertilizers & Agricultural Chemicals–0.52% | | | | | |
Monsanto Co. | | | 34,352 | | | $ | 3,384,359 | |
|
| Health Care Equipment–1.08% | |
Medtronic PLC | | | 91,775 | | | | 7,059,333 | |
|
| Home Entertainment Software–1.47% | |
Activision Blizzard, Inc. | | | 91,948 | | | | 3,559,307 | |
Electronic Arts Inc.(b) | | | 88,375 | | | | 6,073,130 | |
| | | | | | | | 9,632,437 | |
|
| Home Improvement Retail–3.52% | |
Lowe’s Cos., Inc. | | | 303,341 | | | | 23,066,050 | |
|
| Hotels, Resorts & Cruise Lines–2.71% | |
Carnival Corp. | | | 326,205 | | | | 17,771,648 | |
|
| Household Appliances–1.22% | |
Whirlpool Corp. | | | 54,352 | | | | 7,982,678 | |
|
| Industrial Conglomerates–1.46% | |
Danaher Corp. | | | 63,673 | | | | 5,913,949 | |
Roper Technologies, Inc. | | | 19,261 | | | | 3,655,545 | |
| | | | | | | | 9,569,494 | |
|
| Industrial Gases–0.76% | |
Air Products and Chemicals, Inc. | | | 38,465 | | | | 5,004,681 | |
|
| Internet Retail–7.56% | |
Amazon.com, Inc.(b) | | | 49,450 | | | | 33,422,761 | |
Netflix Inc.(b) | | | 58,861 | | | | 6,732,521 | |
Priceline Group Inc. (The)(b) | | | 7,371 | | | | 9,397,656 | |
| | | | | | | | 49,552,938 | |
|
| Internet Software & Services–14.67% | |
Alibaba Group Holding Ltd.–ADR (China)(b) | | | 98,419 | | | | 7,998,512 | |
Alphabet Inc.–Class A(b) | | | 56,774 | | | | 44,170,740 | |
Facebook Inc.–Class A(b) | | | 349,794 | | | | 36,609,440 | |
LinkedIn Corp.–Class A(b) | | | 32,692 | | | | 7,358,315 | |
| | | | | | | | 96,137,007 | |
|
| Investment Banking & Brokerage–2.42% | |
Charles Schwab Corp. (The) | | | 481,426 | | | | 15,853,358 | |
|
| IT Consulting & Other Services–0.10% | |
Cognizant Technology Solutions Corp.–Class A(b) | | | 10,915 | | | | 655,118 | |
|
| Life Sciences Tools & Services–0.77% | |
Thermo Fisher Scientific, Inc. | | | 35,694 | | | | 5,063,194 | |
|
| Managed Health Care–1.73% | |
UnitedHealth Group Inc. | | | 96,321 | | | | 11,331,203 | |
|
| Oil & Gas Exploration & Production–1.11% | |
Cimarex Energy Co. | | | 14,188 | | | | 1,268,124 | |
Pioneer Natural Resources Co. | | | 48,071 | | | | 6,027,142 | |
| | | | | | | | 7,295,266 | |
See accompanying Notes to Financial Statements which are an integral part of the financial statements.
Invesco V.I. American Franchise Fund
| | | | | | | | |
| | | Shares | | | Value | |
| Packaged Foods & Meats–0.99% | |
JM Smucker Co. (The) | | | 20,241 | | | $ | 2,496,525 | |
Tyson Foods, Inc.–Class A | | | 74,792 | | | | 3,988,657 | |
| | | | | | | | 6,485,182 | |
|
| Pharmaceuticals–4.88% | |
Allergan PLC(b) | | | 39,875 | | | | 12,460,938 | |
Bristol-Myers Squibb Co. | | | 156,050 | | | | 10,734,680 | |
Eli Lilly and Co. | | | 103,867 | | | | 8,751,833 | |
| | | | | | | | 31,947,451 | |
|
| Semiconductors–3.43% | |
Avago Technologies Ltd. (Singapore) | | | 54,788 | | | | 7,952,478 | |
NXP Semiconductors N.V. (Netherlands)(b) | | | 172,481 | | | | 14,531,525 | |
| | | | | | | | 22,484,003 | |
|
| Soft Drinks–0.80% | |
Monster Beverage Corp.(b) | | | 35,002 | | | | 5,213,898 | |
|
| Specialized Finance–2.07% | |
CME Group Inc.–Class A | | | 66,814 | | | | 6,053,349 | |
McGraw Hill Financial, Inc. | | | 76,042 | | | | 7,496,220 | |
| | | | | | | | 13,549,569 | |
|
| Specialized REIT’s–0.79% | |
American Tower Corp. | | | 53,300 | | | | 5,167,435 | |
|
| Systems Software–1.52% | |
Check Point Software Technologies Ltd. (Israel)(b)(c) | | | 15,908 | | | | 1,294,593 | |
Microsoft Corp. | | | 35,503 | | | | 1,969,706 | |
ServiceNow, Inc.(b) | | | 77,023 | | | | 6,667,111 | |
| | | | | | | | 9,931,410 | |
| | | | | | | | |
| | | Shares | | | Value | |
| Technology Hardware, Storage & Peripherals–4.87% | |
Apple Inc. | | | 303,104 | | | $ | 31,904,727 | |
|
| Tobacco–2.66% | |
Altria Group, Inc. | | | 87,466 | | | | 5,091,396 | |
Philip Morris International Inc. | | | 139,956 | | | | 12,303,532 | |
| | | | | | | | 17,394,928 | |
|
| Wireless Telecommunication Services–1.45% | |
Sprint Corp.(b) | | | 2,618,284 | | | | 9,478,188 | |
Total Common Stocks & Other Equity Interests
(Cost $426,950,985) | | | | 646,464,269 | |
| |
Money Market Funds–1.43% | | | | | |
Liquid Assets Portfolio–Institutional Class, 0.29%(d) | | | 4,695,981 | | | | 4,695,981 | |
Premier Portfolio–Institutional Class, 0.24%(d) | | | 4,695,981 | | | | 4,695,981 | |
Total Money Market Funds
(Cost $9,391,962) | | | | 9,391,962 | |
TOTAL INVESTMENTS (excluding investments purchased with cash collateral from securities on loan)–100.10%
(Cost $436,342,947) | | | | 655,856,231 | |
| |
Investments Purchased with Cash Collateral from Securities on Loan | | | | | |
Money Market Funds–0.15% | |
Liquid Assets Portfolio–Institutional Class, 0.29%
(Cost $1,005,187)(d)(e) | | | 1,005,187 | | | | 1,005,187 | |
TOTAL INVESTMENTS–100.25%
(Cost $437,348,134) | | | | 656,861,418 | |
OTHER ASSETS LESS LIABILITIES–(0.25)% | | | | (1,644,577 | ) |
NET ASSETS–100.00% | | | $ | 655,216,841 | |
Investment Abbreviations:
| | |
| ADR | | – American Depositary Receipt |
| REIT | | – Real Estate Investment Trust |
Notes to Schedule of Investments:
| (a) | Industry and/or sector classifications used in this report are generally according to the Global Industry Classification Standard, which was developed by and is the exclusive property and a service mark of MSCI Inc. and Standard & Poor’s. |
| (b) | Non-income producing security. |
| (c) | All or a portion of this security was out on loan at December 31, 2015. |
| (d) | The money market fund and the Fund are affiliated by having the same investment adviser. The rate shown is the 7-day SEC standardized yield as of December 31, 2015. |
| (e) | The security has been segregated to satisfy the commitment to return the cash collateral received in securities lending transactions upon the borrower’s return of the securities loaned. See Note 1I. |
See accompanying Notes to Financial Statements which are an integral part of the financial statements.
Invesco V.I. American Franchise Fund
Statement of Assets and Liabilities
December 31, 2015
Statement of Operations
For the year ended December 31, 2015
| | | | |
Assets: | |
Investments, at value (Cost $426,950,985)* | | $ | 646,464,269 | |
Investments in affiliated money market funds, at value and cost | | | 10,397,149 | |
Total investments, at value (Cost $437,348,134) | | | 656,861,418 | |
Foreign currencies, at value (Cost $6,455) | | | 6,406 | |
Receivable for: | | | | |
Investments sold | | | 335,286 | |
Fund shares sold | | | 28,610 | |
Dividends | | | 665,170 | |
Investment for trustee deferred compensation and retirement plans | | | 341,256 | |
Other assets | | | 386 | |
Total assets | | | 658,238,532 | |
| |
Liabilities: | | | | |
Payable for: | | | | |
Fund shares reacquired | | | 1,122,015 | |
Collateral upon return of securities loaned | | | 1,005,187 | |
Accrued fees to affiliates | | | 496,670 | |
Accrued trustees’ and officers’ fees and benefits | | | 246 | |
Accrued other operating expenses | | | 19,957 | |
Trustee deferred compensation and retirement plans | | | 377,616 | |
Total liabilities | | | 3,021,691 | |
Net assets applicable to shares outstanding | | $ | 655,216,841 | |
| |
Net assets consist of: | | | | |
Shares of beneficial interest | | $ | 386,466,017 | |
Undistributed net investment income (loss) | | | (393,011 | ) |
Undistributed net realized gain | | | 49,631,245 | |
Net unrealized appreciation | | | 219,512,590 | |
| | | $ | 655,216,841 | |
|
Net Assets: | |
Series I | | $ | 479,298,302 | |
Series II | | $ | 175,918,539 | |
|
Shares outstanding, $0.001 par value per share,
with an unlimited number of shares authorized: | |
Series I | | | 8,364,199 | |
Series II | | | 3,149,863 | |
Series I: | | | | |
Net asset value per share | | $ | 57.30 | |
Series II: | | | | |
Net asset value per share | | $ | 55.85 | |
| * | At December 31, 2015, securities with an aggregate value of $970,945 were on loan to brokers. |
| | | | |
Investment income: | |
Dividends (net of foreign withholding taxes of $4,591) | | $ | 6,346,572 | |
Dividends from affiliated money market funds (includes securities lending income of $9,401) | | | 15,383 | |
Interest | | | 20,823 | |
Total investment income | | | 6,382,778 | |
| |
Expenses: | | | | |
Advisory fees | | | 4,700,408 | |
Administrative services fees | | | 1,795,503 | |
Custodian fees | | | 34,175 | |
Distribution fees — Series II | | | 468,556 | |
Transfer agent fees | | | 84,249 | |
Trustees’ and officers’ fees and benefits | | | 39,502 | |
Other | | | 77,792 | |
Total expenses | | | 7,200,185 | |
Less: Fees waived | | | (7,801 | ) |
Net expenses | | | 7,192,384 | |
Net investment income (loss) | | | (809,606 | ) |
| |
Realized and unrealized gain (loss) from: | | | | |
Net realized gain from: | | | | |
Investment securities | | | 52,372,803 | |
Foreign currencies | | | 9,682 | |
| | | | 52,382,485 | |
Change in net unrealized appreciation (depreciation) of: | | | | |
Investment securities | | | (17,202,875 | ) |
Foreign currencies | | | (943 | ) |
| | | | (17,203,818 | ) |
Net realized and unrealized gain | | | 35,178,667 | |
Net increase in net assets resulting from operations | | $ | 34,369,061 | |
See accompanying Notes to Financial Statements which are an integral part of the financial statements.
Invesco V.I. American Franchise Fund
Statement of Changes in Net Assets
For the years ended December 31, 2015 and 2014
| | | | | | | | |
| | | 2015 | | | 2014 | |
Operations: | | | | | |
Net investment income (loss) | | $ | (809,606 | ) | | $ | (1,908,252 | ) |
Net realized gain | | | 52,382,485 | | | | 115,649,421 | |
Change in net unrealized appreciation (depreciation) | | | (17,203,818 | ) | | | (54,154,967 | ) |
Net increase in net assets resulting from operations | | | 34,369,061 | | | | 59,586,202 | |
| | |
Distributions to shareholders from net investment income: | | | | | | | | |
Series l | | | — | | | | (227,487 | ) |
Series ll | | | — | | | | — | |
Total distributions from net investment income | | | — | | | | (227,487 | ) |
| | |
Distributions to shareholders from net realized gains: | | | | | | | | |
Series l | | | (2,611,057 | ) | | | — | |
Series ll | | | (990,300 | ) | | | — | |
Total distributions from net realized gains | | | (3,601,357 | ) | | | — | |
| | |
Share transactions–net: | | | | | | | | |
Series l | | | (85,531,558 | ) | | | (82,553,486 | ) |
Series ll | | | (31,089,512 | ) | | | (74,143,144 | ) |
Net increase (decrease) in net assets resulting from share transactions | | | (116,621,070 | ) | | | (156,696,630 | ) |
Net increase (decrease) in net assets | | | (85,853,366 | ) | | | (97,337,915 | ) |
| | |
Net assets: | | | | | | | | |
Beginning of year | | | 741,070,207 | | | | 838,408,122 | |
End of year (includes undistributed net investment income (loss) of $(393,011) and $(425,299), respectively) | | $ | 655,216,841 | | | $ | 741,070,207 | |
Notes to Financial Statements
December 31, 2015
NOTE 1—Significant Accounting Policies
Invesco V.I. American Franchise Fund (the “Fund”) is a series portfolio of AIM Variable Insurance Funds (Invesco Variable Insurance Funds) (the “Trust”). The Trust is a Delaware statutory trust registered under the Investment Company Act of 1940, as amended (the “1940 Act”), as an open-end series management investment company consisting of twenty-four separate portfolios, (each constituting a “Fund”). The assets, liabilities and operations of each portfolio are accounted for separately. Information presented in these financial statements pertains only to the Fund. Matters affecting each Fund or class will be voted on exclusively by the shareholders of such Fund or class. Current Securities and Exchange Commission (“SEC”) guidance, however, requires participating insurance companies offering separate accounts to vote shares proportionally in accordance with the instructions of the contract owners whose investments are funded by shares of each Fund or class.
The Fund’s investment objective is to seek capital growth.
The Fund currently offers two classes of shares, Series I and Series II, both of which are offered to insurance company separate accounts funding variable annuity contracts and variable life insurance policies (“variable products”).
The following is a summary of the significant accounting policies followed by the Fund in the preparation of its financial statements.
| A. | Security Valuations — Securities, including restricted securities, are valued according to the following policy. |
A security listed or traded on an exchange (except convertible securities) is valued at its last sales price or official closing price as of the close of the customary trading session on the exchange where the security is principally traded, or lacking any sales or official closing price on a particular day, the security may be valued at the closing bid price on that day. Securities traded in the over-the-counter market are valued based on prices furnished by independent pricing services or market makers. When such securities are valued by an independent pricing service they may be considered fair valued. Futures contracts are valued at the final settlement price set by an exchange on which they are principally traded. Listed options are valued at the mean between the last bid and asked prices from the exchange on which they are principally traded. Options not listed on an exchange are valued by an independent source at the mean between the last bid and asked prices. For purposes of determining net asset value (“NAV”) per share, futures and option contracts generally are valued 15 minutes after the close of the customary trading session of the New York Stock Exchange (“NYSE”).
Investments in open-end and closed-end registered investment companies that do not trade on an exchange are valued at the end-of-day net asset value per share. Investments in open-end and closed-end registered investment companies that trade on an exchange are valued at the last sales price or official closing price as of the close of the customary trading session on the exchange where the security is principally traded.
Debt obligations (including convertible securities) and unlisted equities are fair valued using an evaluated quote provided by an independent pricing service. Evaluated quotes provided by the pricing service may be determined without exclusive reliance on quoted prices, and may reflect
Invesco V.I. American Franchise Fund
appropriate factors such as institution-size trading in similar groups of securities, developments related to specific securities, dividend rate (for unlisted equities), yield (for debt obligations), quality, type of issue, coupon rate (for debt obligations), maturity (for debt obligations), individual trading characteristics and other market data. Debt obligations are subject to interest rate and credit risks. In addition, all debt obligations involve some risk of default with respect to interest and/or principal payments.
Foreign securities’ (including foreign exchange contracts) prices are converted into U.S. dollar amounts using the applicable exchange rates as of the close of the NYSE. If market quotations are available and reliable for foreign exchange-traded equity securities, the securities will be valued at the market quotations. Because trading hours for certain foreign securities end before the close of the NYSE, closing market quotations may become unreliable. If between the time trading ends on a particular security and the close of the customary trading session on the NYSE, events occur that the Adviser determines are significant and make the closing price unreliable, the Fund may fair value the security. If the event is likely to have affected the closing price of the security, the security will be valued at fair value in good faith using procedures approved by the Board of Trustees. Adjustments to closing prices to reflect fair value may also be based on a screening process of an independent pricing service to indicate the degree of certainty, based on historical data, that the closing price in the principal market where a foreign security trades is not the current value as of the close of the NYSE. Foreign securities’ prices meeting the approved degree of certainty that the price is not reflective of current value will be priced at the indication of fair value from the independent pricing service. Multiple factors may be considered by the independent pricing service in determining adjustments to reflect fair value and may include information relating to sector indices, American Depositary Receipts and domestic and foreign index futures. Foreign securities may have additional risks including exchange rate changes, potential for sharply devalued currencies and high inflation, political and economic upheaval, the relative lack of issuer information, relatively low market liquidity and the potential lack of strict financial and accounting controls and standards.
Securities for which market prices are not provided by any of the above methods may be valued based upon quotes furnished by independent sources. The last bid price may be used to value equity securities. The mean between the last bid and asked prices is used to value debt obligations, including corporate loans.
Securities for which market quotations are not readily available or became unreliable are valued at fair value as determined in good faith by or under the supervision of the Trust’s officers following procedures approved by the Board of Trustees. Issuer specific events, market trends, bid/asked quotes of brokers and information providers and other market data may be reviewed in the course of making a good faith determination of a security’s fair value.
The Fund may invest in securities that are subject to interest rate risk, meaning the risk that the prices will generally fall as interest rates rise and, conversely, the prices will generally rise as interest rates fall. Specific securities differ in their sensitivity to changes in interest rates depending on their individual characteristics. Changes in interest rates may result in increased market volatility, which may affect the value and/or liquidity of certain Fund investments.
Valuations change in response to many factors including the historical and prospective earnings of the issuer, the value of the issuer’s assets, general economic conditions, interest rates, investor perceptions and market liquidity. Because of the inherent uncertainties of valuation, the values reflected in the financial statements may materially differ from the value received upon actual sale of those investments.
| B. | Securities Transactions and Investment Income — Securities transactions are accounted for on a trade date basis. Realized gains or losses on sales are computed on the basis of specific identification of the securities sold. Interest income (net of withholding tax, if any) is recorded on the accrual basis from settlement date. Dividend income (net of withholding tax, if any) is recorded on the ex-dividend date. |
The Fund may periodically participate in litigation related to Fund investments. As such, the Fund may receive proceeds from litigation settlements. Any proceeds received are included in the Statement of Operations as realized gain (loss) for investments no longer held and as unrealized gain (loss) for investments still held.
Brokerage commissions and mark ups are considered transaction costs and are recorded as an increase to the cost basis of securities purchased and/or a reduction of proceeds on a sale of securities. Such transaction costs are included in the determination of net realized and unrealized gain (loss) from investment securities reported in the Statement of Operations and the Statement of Changes in Net Assets and the net realized and unrealized gains (losses) on securities per share in the Financial Highlights. Transaction costs are included in the calculation of the Fund’s net asset value and, accordingly, they reduce the Fund’s total returns. These transaction costs are not considered operating expenses and are not reflected in net investment income reported in the Statement of Operations and the Statement of Changes in Net Assets, or the net investment income per share and the ratios of expenses and net investment income reported in the Financial Highlights, nor are they limited by any expense limitation arrangements between the Fund and the investment adviser.
The Fund allocates income and realized and unrealized capital gains and losses to a class based on the relative net assets of each class.
| C. | Country Determination — For the purposes of making investment selection decisions and presentation in the Schedule of Investments, the investment adviser may determine the country in which an issuer is located and/or credit risk exposure based on various factors. These factors include the laws of the country under which the issuer is organized, where the issuer maintains a principal office, the country in which the issuer derives 50% or more of its total revenues and the country that has the primary market for the issuer’s securities, as well as other criteria. Among the other criteria that may be evaluated for making this determination are the country in which the issuer maintains 50% or more of its assets, the type of security, financial guarantees and enhancements, the nature of the collateral and the sponsor organization. Country of issuer and/or credit risk exposure has been determined to be the United States of America, unless otherwise noted. |
| D. | Distributions — Distributions from net investment income and net realized capital gain, if any, are generally declared and paid to separate accounts of participating insurance companies annually and recorded on the ex-dividend date. |
| E. | Federal Income Taxes — The Fund intends to comply with the requirements of Subchapter M of the Internal Revenue Code of 1986, as amended (the “Internal Revenue Code”), necessary to qualify as a regulated investment company and to distribute substantially all of the Fund’s taxable earnings to shareholders. As such, the Fund will not be subject to federal income taxes on otherwise taxable income (including net realized capital gain) that is distributed to shareholders. Therefore, no provision for federal income taxes is recorded in the financial statements. |
The Fund recognizes the tax benefits of uncertain tax positions only when the position is more likely than not to be sustained. Management has analyzed the Fund’s uncertain tax positions and concluded that no liability for unrecognized tax benefits should be recorded related to uncertain tax positions. Management is not aware of any tax positions for which it is reasonably possible that the total amounts of unrecognized tax benefits will change materially in the next 12 months.
Invesco V.I. American Franchise Fund
The Fund files tax returns in the U.S. Federal jurisdiction and certain other jurisdictions. Generally, the Fund is subject to examinations by such taxing authorities for up to three years after the filing of the return for the tax period.
| F. | Expenses — Fees provided for under the Rule 12b-1 plan of a particular class of the Fund and which are directly attributable to that class are charged to the operations of such class. All other expenses are allocated among the classes based on relative net assets. |
| G. | Accounting Estimates — The preparation of financial statements in conformity with accounting principles generally accepted in the United States of America (“GAAP”) requires management to make estimates and assumptions that affect the reported amounts of assets and liabilities at the date of the financial statements and the reported amounts of revenues and expenses during the reporting period including estimates and assumptions related to taxation. Actual results could differ from those estimates by a significant amount. In addition, the Fund monitors for material events or transactions that may occur or become known after the period-end date and before the date the financial statements are released to print. |
| H. | Indemnifications — Under the Trust’s organizational documents, each Trustee, officer, employee or other agent of the Trust is indemnified against certain liabilities that may arise out of the performance of their duties to the Fund. Additionally, in the normal course of business, the Fund enters into contracts, including the Fund’s servicing agreements, that contain a variety of indemnification clauses. The Fund’s maximum exposure under these arrangements is unknown as this would involve future claims that may be made against the Fund that have not yet occurred. The risk of material loss as a result of such indemnification claims is considered remote. |
| I. | Securities Lending — The Fund may lend portfolio securities having a market value up to one-third of the Fund’s total assets. Such loans are secured by collateral equal to no less than the market value of the loaned securities determined daily by the securities lending provider. Such collateral will be cash or debt securities issued or guaranteed by the U.S. Government or any of its sponsored agencies. Cash collateral received in connection with these loans is invested in short-term money market instruments or affiliated money market funds and is shown as such on the Schedule of Investments. The Fund bears the risk of loss with respect to the investment of collateral. It is the Fund’s policy to obtain additional collateral from or return excess collateral to the borrower by the end of the next business day, following the valuation date of the securities loaned. Therefore, the value of the collateral held may be temporarily less than the value of the securities on loan. When loaning securities, the Fund retains certain benefits of owning the securities, including the economic equivalent of dividends or interest generated by the security. Lending securities entails a risk of loss to the Fund if, and to the extent that, the market value of the securities loaned were to increase and the borrower did not increase the collateral accordingly, and the borrower failed to return the securities. The securities loaned are subject to termination at the option of the borrower or the Fund. Upon termination, the borrower will return to the Fund the securities loaned and the Fund will return the collateral. Upon the failure of the borrower to return the securities, collateral may be liquidated and the securities may be purchased on the open market to replace the loaned securities. The Fund could experience delays and costs in gaining access to the collateral and the securities may lose value during the delay which could result in potential losses to the Fund. Some of these losses may be indemnified by the lending agent. The Fund bears the risk of any deficiency in the amount of the collateral available for return to the borrower due to any loss on the collateral invested. Dividends received on cash collateral investments for securities lending transactions, which are net of compensation to counterparties, are included in Dividends from affiliated money market funds on the Statement of Operations. The aggregate value of securities out on loan, if any, is shown as a footnote on the Statement of Assets and Liabilities. |
| J. | Foreign Currency Translations — Foreign currency is valued at the close of the NYSE based on quotations posted by banks and major currency dealers. Portfolio securities and other assets and liabilities denominated in foreign currencies are translated into U.S. dollar amounts at date of valuation. Purchases and sales of portfolio securities (net of foreign taxes withheld on disposition) and income items denominated in foreign currencies are translated into U.S. dollar amounts on the respective dates of such transactions. The Fund does not separately account for the portion of the results of operations resulting from changes in foreign exchange rates on investments and the fluctuations arising from changes in market prices of securities held. The combined results of changes in foreign exchange rates and the fluctuation of market prices on investments (net of estimated foreign tax withholding) are included with the net realized and unrealized gain or loss from investments in the Statement of Operations. Reported net realized foreign currency gains or losses arise from (1) sales of foreign currencies, (2) currency gains or losses realized between the trade and settlement dates on securities transactions, and (3) the difference between the amounts of dividends, interest, and foreign withholding taxes recorded on the Fund’s books and the U.S. dollar equivalent of the amounts actually received or paid. Net unrealized foreign currency gains and losses arise from changes in the fair values of assets and liabilities, other than investments in securities at fiscal period end, resulting from changes in exchange rates. |
The Fund may invest in foreign securities, which may be subject to foreign taxes on income, gains on investments or currency repatriation, a portion of which may be recoverable. Foreign taxes, if any, are recorded based on the tax regulations and rates that exist in the foreign markets in which the Fund invests and are shown in the Statement of Operations.
| K. | Forward Foreign Currency Contracts — The Fund may engage in foreign currency transactions either on a spot (i.e. for prompt delivery and settlement) basis, or through forward foreign currency contracts, to manage or minimize currency or exchange rate risk. |
The Fund may also enter into forward foreign currency contracts for the purchase or sale of a security denominated in a foreign currency in order to “lock in” the U.S. dollar price of that security, or the Fund may also enter into forward foreign currency contracts that do not provide for physical settlement of the two currencies, but instead are settled by a single cash payment calculated as the difference between the agreed upon exchange rate and the spot rate at settlement based upon an agreed upon notional amount (non-deliverable forwards). The Fund will set aside liquid assets in an amount equal to daily mark-to-market obligation for forward foreign currency contracts.
A forward foreign currency contract is an obligation between two parties (“Counterparties”) to purchase or sell a specific currency for an agreed-upon price at a future date. The use of forward foreign currency contracts does not eliminate fluctuations in the price of the underlying securities the Fund owns or intends to acquire but establishes a rate of exchange in advance. Fluctuations in the value of these contracts are measured by the difference in the contract date and reporting date exchange rates and are recorded as unrealized appreciation (depreciation) until the contracts are closed. When the contracts are closed, realized gains (losses) are recorded. Realized and unrealized gains (losses) on the contracts are included in the Statement of Operations. The primary risks associated with forward foreign currency contracts include failure of the Counterparty to meet the terms of the contract and the value of the foreign currency changing unfavorably. These risks may be in excess of the amounts reflected in the Statement of Assets and Liabilities.
Invesco V.I. American Franchise Fund
NOTE 2—Advisory Fees and Other Fees Paid to Affiliates
The Trust has entered into a master investment advisory agreement with Invesco Advisers, Inc. (the “Adviser” or “Invesco”). Under the terms of the investment advisory agreement, the Fund pays an advisory fee to the Adviser based on the annual rate of the Fund’s average daily net assets as follows:
| | | | | | |
| Average Daily Net Assets | | Rate |
First $250 million | | | 0 | .695% | | |
Next $250 million | | | 0 | .67% | | |
Next $500 million | | | 0 | .645% | | |
Next $550 million | | | 0 | .62% | | |
Next $3.45 billion | | | 0 | .60% | | |
Next $250 million | | | 0 | .595% | | |
Next $2.25 billion | | | 0 | .57% | | |
Next $2.5 billion | | | 0 | .545% | | |
Over $10 billion | | | 0 | .52% | | |
For the year ended December 31, 2015, the effective advisory fees incurred by the Fund was 0.67%.
Under the terms of a master sub-advisory agreement between the Adviser and each of Invesco Asset Management Deutschland GmbH, Invesco Asset Management Limited, Invesco Asset Management (Japan) Limited, Invesco Hong Kong Limited, Invesco Senior Secured Management, Inc. and Invesco Canada Ltd. (collectively, the “Affiliated Sub-Advisers”) the Adviser, not the Fund, may pay 40% of the fees paid to the Adviser to any such Affiliated Sub-Adviser(s) that provide(s) discretionary investment management services to the Fund based on the percentage of assets allocated to such Affiliated Sub-Adviser(s).
The Adviser has contractually agreed, through at least June 30, 2016, to waive advisory fees and/or reimburse expenses to the extent necessary to limit total annual fund operating expenses after fee waiver and/or expense reimbursement (excluding certain items discussed below) of Series I shares to 2.00% and Series II shares to 2.25% of average daily net assets. In determining the Adviser’s obligation to waive advisory fees and/or reimburse expenses, the following expenses are not taken into account, and could cause the total annual operating expenses after fee waiver and/or expense reimbursement to exceed the numbers reflected above: (1) interest; (2) taxes; (3) dividend expense on short sales; (4) extraordinary or non-routine items, including litigation expenses; and (5) expenses that the Fund has incurred but did not actually pay because of an expense offset arrangement. Unless Invesco continues the fee waiver agreement, it will terminate on June 30, 2016. The fee waiver agreement cannot be terminated during its term. The Adviser did not waive fees and/or reimburse expenses during the period under this expense limitation.
Further, the Adviser has contractually agreed, through at least June 30, 2017, to waive the advisory fee payable by the Fund in an amount equal to 100% of the net advisory fees the Adviser receives from the affiliated money market funds on investments by the Fund of uninvested cash (excluding investments of cash collateral from securities lending) in such affiliated money market funds.
For the year ended December 31, 2015, the Adviser waived advisory fees of $7,801.
The Trust has entered into a master administrative services agreement with Invesco pursuant to which the Fund has agreed to pay Invesco a fee for costs incurred in providing accounting services and fund administrative services to the Fund and to reimburse Invesco for administrative services fees paid to insurance companies that have agreed to provide services to the participants of separate accounts. These administrative services provided by the insurance companies may include, among other things: the printing of prospectuses, financial reports and proxy statements and the delivery of the same to existing participants; the maintenance of master accounts; the facilitation of purchases and redemptions requested by the participants; and the servicing of participants’ accounts. Pursuant to such agreement, for the year ended December 31, 2015, Invesco was paid $165,925 for accounting and fund administrative services and reimbursed $1,629,578 for services provided by insurance companies.
The Trust has entered into a transfer agency and service agreement with Invesco Investment Services, Inc. (“IIS”) pursuant to which the Fund has agreed to pay IIS a fee for providing transfer agency and shareholder services to the Fund and reimburse IIS for certain expenses incurred by IIS in the course of providing such services. For the year ended December 31, 2015, expenses incurred under the agreement are shown in the Statement of Operations as Transfer agent fees.
The Trust has entered into a master distribution agreement with Invesco Distributors, Inc. (“IDI”) to serve as the distributor for the Fund. The Trust has adopted a plan pursuant to Rule 12b-1 under the 1940 Act with respect to the Fund’s Series II shares (the “Plan”). The Fund, pursuant to the Plan, pays IDI compensation at the annual rate of 0.25% of the Fund’s average daily net assets of Series II shares. Of the Plan payments, up to 0.25% of the average daily net assets of the Series II shares may be paid to insurance companies who furnish continuing personal shareholder services to customers who purchase and own Series II shares of the Fund. For the year ended December 31, 2015, expenses incurred under the Plan are detailed in the Statement of Operations as Distribution fees.
For the year ended December 31, 2015, the Fund incurred $11,472 in brokerage commissions with Invesco Capital Markets, Inc., an affiliate of the Adviser and IDI, for portfolio transactions executed on behalf of the Fund.
Certain officers and trustees of the Trust are officers and directors of the Adviser, IIS and/or IDI.
Invesco V.I. American Franchise Fund
NOTE 3—Additional Valuation Information
GAAP defines fair value as the price that would be received to sell an asset or paid to transfer a liability in an orderly transaction between market participants at the measurement date, under current market conditions. GAAP establishes a hierarchy that prioritizes the inputs to valuation methods, giving the highest priority to readily available unadjusted quoted prices in an active market for identical assets (Level 1) and the lowest priority to significant unobservable inputs (Level 3), generally when market prices are not readily available or are unreliable. Based on the valuation inputs, the securities or other investments are tiered into one of three levels. Changes in valuation methods may result in transfers in or out of an investment’s assigned level:
| | Level 1 — | Prices are determined using quoted prices in an active market for identical assets. |
| | Level 2 — | Prices are determined using other significant observable inputs. Observable inputs are inputs that other market participants may use in pricing a security. These may include quoted prices for similar securities, interest rates, prepayment speeds, credit risk, yield curves, loss severities, default rates, discount rates, volatilities and others. |
| | Level 3 — | Prices are determined using significant unobservable inputs. In situations where quoted prices or observable inputs are unavailable (for example, when there is little or no market activity for an investment at the end of the period), unobservable inputs may be used. Unobservable inputs reflect the Fund’s own assumptions about the factors market participants would use in determining fair value of the securities or instruments and would be based on the best available information. |
The following is a summary of the tiered valuation input levels, as of December 31, 2015. The level assigned to the securities valuations may not be an indication of the risk or liquidity associated with investing in those securities. Because of the inherent uncertainties of valuation, the values reflected in the financial statements may materially differ from the value received upon actual sale of those investments.
| | | | | | | | | | | | | | | | |
| | | Level 1 | | | Level 2 | | | Level 3 | | | Total | |
Equity Securities | | $ | 649,019,484 | | | $ | 7,841,934 | | | $ | — | | | $ | 656,861,418 | |
NOTE 4—Trustees’ and Officers’ Fees and Benefits
Trustees’ and Officers’ Fees and Benefits include amounts accrued by the Fund to pay remuneration to certain Trustees and Officers of the Fund. Trustees have the option to defer compensation payable by the Fund, and Trustees’ and Officers’ Fees and Benefits also include amounts accrued by the Fund to fund such deferred compensation amounts. Those Trustees who defer compensation have the option to select various Invesco Funds in which their deferral accounts shall be deemed to be invested. Finally, certain current Trustees were eligible to participate in a retirement plan that provided for benefits to be paid upon retirement to Trustees over a period of time based on the number of years of service. The Fund may have certain former Trustees who also participate in a retirement plan and receive benefits under such plan. Trustees’ and Officers’ Fees and Benefits include amounts accrued by the Fund to fund such retirement benefits. Obligations under the deferred compensation and retirement plans represent unsecured claims against the general assets of the Fund.
NOTE 5—Cash Balances
The Fund is permitted to temporarily carry a negative or overdrawn balance in its account with State Street Bank and Trust Company, the custodian bank. Such balances, if any at period end, are shown in the Statement of Assets and Liabilities under the payable caption Amount due custodian. To compensate the custodian bank for such overdrafts, the overdrawn Fund may either (1) leave funds as a compensating balance in the account so the custodian bank can be compensated by earning the additional interest; or (2) compensate by paying the custodian bank at a rate agreed upon by the custodian bank and Invesco, not to exceed the contractually agreed upon rate.
NOTE 6—Distributions to Shareholders and Tax Components of Net Assets
Tax Character of Distributions to Shareholders Paid During the Fiscal Years Ended December 31, 2015 and 2014:
| | | | | | | | |
| | | 2015 | | | 2014 | |
Ordinary income | | $ | — | | | $ | 227,487 | |
Long-term capital gain | | | 3,601,357 | | | | — | |
Total Distributions | | $ | 3,601,357 | | | $ | 227,487 | |
Tax Components of Net Assets at Period-End:
| | | | |
| | | 2015 | |
Undistributed long-term gain | | $ | 52,641,901 | |
Net unrealized appreciation — investments | | | 216,502,628 | |
Net unrealized appreciation (depreciation) — other investments | | | (694 | ) |
Temporary book/tax differences | | | (393,011 | ) |
Shares of beneficial interest | | | 386,466,017 | |
Total net assets | | $ | 655,216,841 | |
The difference between book-basis and tax-basis unrealized appreciation (depreciation) is due to differences in the timing of recognition of gains and losses on investments for tax and book purposes. The Fund’s net unrealized appreciation difference is attributable primarily to wash sales.
The temporary book/tax differences are a result of timing differences between book and tax recognition of income and/or expenses. The Fund’s temporary book/tax differences are the result of the trustee deferral of compensation and retirement plan benefits.
Invesco V.I. American Franchise Fund
Capital loss carryforward is calculated and reported as of a specific date. Results of transactions and other activity after that date may affect the amount of capital loss carryforward actually available for the Fund to utilize. Capital losses generated in years beginning after December 22, 2010 can be carried forward for an unlimited period, whereas previous losses expire in eight tax years. Capital losses with an expiration period may not be used to offset capital gains until all net capital losses without an expiration date have been utilized. Capital loss carryforwards with no expiration date will retain their character as either short-term or long-term capital losses instead of as short-term capital losses as under prior law. The ability to utilize capital loss carryforwards in the future may be limited under the Internal Revenue Code and related regulations based on the results of future transactions.
The Fund does not have a capital loss carryforward as of December 31, 2015.
NOTE 7—Investment Securities
The aggregate amount of investment securities (other than short-term securities, U.S. Treasury obligations and money market funds, if any) purchased and sold by the Fund during the year ended December 31, 2015 was $471,883,595 and $599,330,322, respectively. Cost of investments on a tax basis includes the adjustments for financial reporting purposes as of the most recently completed federal income tax reporting period-end.
| | | | |
| Unrealized Appreciation (Depreciation) of Investment Securities on a Tax Basis | |
Aggregate unrealized appreciation of investment securities | | $ | 225,374,790 | |
Aggregate unrealized (depreciation) of investment securities | | | (8,872,162 | ) |
Net unrealized appreciation of investment securities | | $ | 216,502,628 | |
Cost of investments for tax purposes is $440,358,790.
NOTE 8—Reclassification of Permanent Differences
Primarily as a result of differing book/tax treatment of net operating losses, on December 31, 2015, undistributed net investment income (loss) was increased by $841,894, undistributed net realized gain was increased by $11,436 and shares of beneficial interest was decreased by $853,330. This reclassification had no effect on the net assets of the Fund.
NOTE 9—Share Information
| | | | | | | | | | | | | | | | |
| | | Summary of Share Activity | |
| | | Years ended December 31, | |
| | | 2015(a) | | | 2014 | |
| | | Shares | | | Amount | | | Shares | | | Amount | |
Sold: | | | | | | | | | | | | | | | | |
Series I | | | 254,518 | | | $ | 14,486,619 | | | | 497,166 | | | $ | 25,779,760 | |
Series II | | | 180,274 | | | | 9,991,611 | | | | 265,604 | | | | 13,450,608 | |
| | | | |
Issued as reinvestment of dividends: | | | | | | | | | | | | | | | | |
Series I | | | 48,878 | | | | 2,611,057 | | | | 4,272 | | | | 227,487 | |
Series II | | | 19,008 | | | | 990,300 | | | | — | | | | — | |
| | | | |
Reacquired: | | | | | | | | | | | | | | | | |
Series I | | | (1,813,621 | ) | | | (102,629,234 | ) | | | (2,094,994 | ) | | | (108,560,733 | ) |
Series II | | | (762,570 | ) | | | (42,071,423 | ) | | | (1,752,048 | ) | | | (87,593,752 | ) |
Net increase (decrease) in share activity | | | (2,073,513 | ) | | $ | (116,621,070 | ) | | | (3,080,000 | ) | | $ | (156,696,630 | ) |
| (a) | There are entities that are record owners of more than 5% of the outstanding shares of the Fund and in the aggregate own 24% of the outstanding shares of the Fund. The Fund and the Fund’s principal underwriter or adviser, are parties to participation agreements with these entities whereby these entities sell units of interest in separate accounts funding variable products that are invested in the Fund. The Fund, Invesco and/or Invesco affiliates may make payments to these entities, which are considered to be related to the Fund, for providing services to the Fund, Invesco and/or Invesco affiliates including but not limited to services such as, securities brokerage, third party record keeping and account servicing and administrative services. The Fund has no knowledge as to whether all or any portion of the shares owned of record by these entities are also owned beneficially. |
Invesco V.I. American Franchise Fund
NOTE 10—Financial Highlights
The following schedule presents financial highlights for a share of the Fund outstanding throughout the periods indicated.
| | | | | | | | | | | | | | | | | | | | | | | | | | | | | | | | | | | | | | | | | | | | | | | | | | | | | | | | | | | | | | | | | | | | | | |
| | | Net asset
value,
beginning
of period | | Net
investment
income (loss)(a) | | Net gains
(losses) on securities (both
realized and
unrealized) | | Total from
investment operations | | Dividends
from net
investment income | | Distributions from net
realized gains | | Total
distributions | | Net asset value, end of period | | Total
return(b) | | Net assets,
end of period (000’s omitted) | | Ratio of
expenses to average net assets
with fee waivers and/or expenses absorbed | | Ratio of
expenses
to average net
assets without
fee waivers
and/or expenses
absorbed | | Ratio of net
investment
income (loss)
to average
net assets | | Portfolio
turnover(c) |
Series I | | | | | | | | | | | | | | | | | | | | | | | | | | | | | | | | | | | | | | | | | | | | | | | | | | | | | | | | | | | | | |
Year ended 12/31/15 | | | $ | 54.88 | | | | $ | (0.03 | ) | | | $ | 2.76 | | | | $ | 2.73 | | | | $ | — | | | | $ | (0.31 | ) | | | $ | (0.31 | ) | | | $ | 57.30 | | | | | 5.01 | % | | | $ | 479,298 | | | | | 0.96 | %(d) | | | | 0.96 | %(d) | | | | (0.05 | )%(d) | | | | 68 | % |
Year ended 12/31/14 | | | | 50.63 | | | | | (0.09 | ) | | | | 4.36 | | | | | 4.27 | | | | | (0.02 | ) | | | | — | | | | | (0.02 | ) | | | | 54.88 | | | | | 8.44 | | | | | 541,929 | | | | | 0.92 | | | | | 0.95 | | | | | (0.17 | ) | | | | 64 | |
Year ended 12/31/13 | | | | 36.28 | | | | | 0.04 | | | | | 14.50 | | | | | 14.54 | | | | | (0.19 | ) | | | | — | | | | | (0.19 | ) | | | | 50.63 | | | | | 40.13 | | | | | 580,620 | | | | | 0.90 | | | | | 0.96 | | | | | 0.08 | | | | | 75 | |
Year ended 12/31/12 | | | | 31.90 | | | | | 0.19 | | | | | 4.19 | | | | | 4.38 | | | | | — | | | | | — | | | | | — | | | | | 36.28 | | | | | 13.73 | | | | | 496,341 | | | | | 0.88 | | | | | 0.98 | | | | | 0.52 | | | | | 190 | |
Year ended 12/31/11 | | | | 34.00 | | | | | (0.05 | ) | | | | (2.05 | ) | | | | (2.10 | ) | | | | — | | | | | — | | | | | — | | | | | 31.90 | | | | | (6.18 | ) | | | | 122,986 | | | | | 0.84 | | | | | 0.99 | | | | | (0.15 | ) | | | | 126 | |
Series II | | | | | | | | | | | | | | | | | | | | | | | | | | | | | | | | | | | | | | | | | | | | | | | | | | | | | | | | | | | | | | | | | | | | | | |
Year ended 12/31/15 | | | | 53.63 | | | | | (0.16 | ) | | | | 2.69 | | | | | 2.53 | | | | | — | | | | | (0.31 | ) | | | | (0.31 | ) | | | | 55.85 | | | | | 4.75 | | | | | 175,919 | | | | | 1.21 | (d) | | | | 1.21 | (d) | | | | (0.30 | )(d) | | | | 68 | |
Year ended 12/31/14 | | | | 49.58 | | | | | (0.22 | ) | | | | 4.27 | | | | | 4.05 | | | | | — | | | | | — | | | | | — | | | | | 53.63 | | | | | 8.17 | | | | | 199,141 | | | | | 1.17 | | | | | 1.20 | | | | | (0.42 | ) | | | | 64 | |
Year ended 12/31/13 | | | | 35.55 | | | | | (0.07 | ) | | | | 14.20 | | | | | 14.13 | | | | | (0.10 | ) | | | | — | | | | | (0.10 | ) | | | | 49.58 | | | | | 39.79 | | | | | 257,788 | | | | | 1.15 | | | | | 1.21 | | | | | (0.17 | ) | | | | 75 | |
Year ended 12/31/12 | | | | 31.35 | | | | | 0.10 | | | | | 4.10 | | | | | 4.20 | | | | | — | | | | | — | | | | | — | | | | | 35.55 | | | | | 13.40 | | | | | 224,334 | | | | | 1.13 | | | | | 1.23 | | | | | 0.27 | | | | | 190 | |
Year ended 12/31/11 | | | | 33.49 | | | | | (0.14 | ) | | | | (2.00 | ) | | | | (2.14 | ) | | | | — | | | | | — | | | | | — | | | | | 31.35 | | | | | (6.39 | ) | | | | 85,724 | | | | | 1.09 | | | | | 1.24 | | | | | (0.40 | ) | | | | 126 | |
| (a) | Calculated using average shares outstanding. |
| (b) | Includes adjustments in accordance with accounting principles generally accepted in the United States of America and as such, the net asset value for financial reporting purposes and the returns based upon those net asset values may differ from the net asset value and returns for shareholder transactions. Total returns are not annualized for periods less than one year, if applicable and do not reflect charges assessed in connection with a variable product, which if included would reduce total returns. |
| (c) | Portfolio turnover is calculated at the fund level and is not annualized for periods less than one year, if applicable. For the year ended December 31, 2012, the portfolio turnover calculation excludes the value of securities purchased of $14,357,093 and sold of $15,173,740 in the effort to realign the Fund’s portfolio holdings after the reorganization of Invesco V.I. Capital Appreciation Fund and Invesco V.I. Leisure Fund into the Fund. For the year ended December 31, 2011, the portfolio turnover calculation excludes the value of securities purchased of $81,993,574 and sold of $49,870,241 in the effort to realign the Fund’s portfolio holdings after the reorganization of Invesco V.I. Large Cap Growth Fund into the Fund. |
| (d) | Ratios are based on average daily net assets (000’s omitted) of $512,253 and $187,422 for Series I and Series II Shares, respectively. |
Invesco V.I. American Franchise Fund
Report of Independent Registered Public Accounting Firm
To the Board of Trustees of AIM Variable Insurance Funds (Invesco Variable Insurance Funds)
and Shareholders of Invesco V.I. American Franchise Fund:
In our opinion, the accompanying statement of assets and liabilities, including the schedule of investments, and the related statements of operations and of changes in net assets and the financial highlights present fairly, in all material respects, the financial position of Invesco V.I. American Franchise Fund (one of the funds constituting AIM Variable Insurance Funds (Invesco Variable Insurance Funds), hereafter referred to as the “Fund”) at December 31, 2015, the results of its operations for the year then ended, the changes in its net assets for each of the two years in the period then ended and the financial highlights for each of the five years in the period then ended, in conformity with accounting principles generally accepted in the United States of America. These financial statements and financial highlights (hereafter referred to as “financial statements”) are the responsibility of the Fund’s management. Our responsibility is to express an opinion on these financial statements based on our audits. We conducted our audits of these financial statements in accordance with the standards of the Public Company Accounting Oversight Board (United States). Those standards require that we plan and perform the audit to obtain reasonable assurance about whether the financial statements are free of material misstatement. An audit includes examining, on a test basis, evidence supporting the amounts and disclosures in the financial statements, assessing the accounting principles used and significant estimates made by management, and evaluating the overall financial statement presentation. We believe that our audits, which included confirmation of securities at December 31, 2015 by correspondence with the custodian and brokers, provide a reasonable basis for our opinion.
PRICEWATERHOUSECOOPERS LLP
Houston, Texas
February 15, 2016
Invesco V.I. American Franchise Fund
Calculating your ongoing Fund expenses
Example
As a shareholder of the Fund, you incur ongoing costs, including management fees; distribution and/or service fees (12b-1); and other Fund expenses. This example is intended to help you understand your ongoing costs (in dollars) of investing in the Fund and to compare these costs with ongoing costs of investing in other mutual funds. The example is based on an investment of $1,000 invested at the beginning of the period and held for the entire period July 1, 2015 through December 31, 2015.
The actual and hypothetical expenses in the examples below do not represent the effect of any fees or other expenses assessed in connection with a variable product; if they did, the expenses shown would be higher while the ending account values shown would be lower.
Actual expenses
The table below provides information about actual account values and actual expenses. You may use the information in this table, together with the amount you invested, to estimate the expenses that you paid over the period. Simply divide your account value by $1,000 (for example, an $8,600 account value divided by $1,000 = 8.6), then multiply the result by the number in the table under the heading entitled “Actual Expenses Paid During Period” to estimate the expenses you paid on your account during this period.
Hypothetical example for comparison purposes
The table below also provides information about hypothetical account values and hypothetical expenses based on the Fund’s actual expense ratio and an assumed rate of return of 5% per year before expenses, which is not the Fund’s actual return.
The hypothetical account values and expenses may not be used to estimate the actual ending account balance or expenses you paid for the period. You may use this information to compare the ongoing costs of investing in the Fund and other funds. To do so, compare this 5% hypothetical example with the 5% hypothetical examples that appear in the shareholder reports of the other funds.
Please note that the expenses shown in the table are meant to highlight your ongoing costs. Therefore, the hypothetical information is useful in comparing ongoing costs, and will not help you determine the relative total costs of owning different funds.
| | | | | | | | | | | | | | | | | | | | | | | | |
| Class | | Beginning Account Value (07/01/15) | | | ACTUAL | | | HYPOTHETICAL (5% annual return before
expenses) | | | Annualized Expense Ratio | |
| | | Ending Account Value (12/31/15)1 | | | Expenses Paid During Period2 | | | Ending Account Value (12/31/15) | | | Expenses Paid During Period2 | | |
| Series I | | $ | 1,000.00 | | | $ | 1,024.90 | | | $ | 4.90 | | | $ | 1,020.37 | | | $ | 4.89 | | | | 0.96 | % |
| Series II | | | 1,000.00 | | | | 1,023.70 | | | | 6.17 | | | | 1,019.11 | | | | 6.16 | | | | 1.21 | |
| 1 | The actual ending account value is based on the actual total return of the Fund for the period July 1, 2015 through December 31, 2015, after actual expenses and will differ from the hypothetical ending account value which is based on the Fund’s expense ratio and a hypothetical annual return of 5% before expenses. |
| 2 | Expenses are equal to the Fund’s annualized expense ratio as indicated above multiplied by the average account value over the period, multiplied by 184/365 to reflect the most recent fiscal half year. |
Invesco V.I. American Franchise Fund
Tax Information
Form 1099-DIV, Form 1042-S and other year–end tax information provide shareholders with actual calendar year amounts that should be included in their tax returns. Shareholders should consult their tax advisors.
The following distribution information is being provided as required by the Internal Revenue Code or to meet a specific state’s requirement.
The Fund designates the following amounts or, if subsequently determined to be different, the maximum amount allowable for its fiscal year ended December 31, 2015:
| | | | |
Federal and State Income Tax | |
Long-Term Capital Gain Distributions | | $ | 3,601,357 | |
Corporate Dividends Received Deduction* | | | 0.00 | % |
U.S. Treasury Obligations* | | | 0.00 | % |
| | * | The above percentages are based on ordinary income dividends paid to shareholders during the Fund’s fiscal year. |
Invesco V.I. American Franchise Fund
Trustees and Officers
The address of each trustee and officer is AIM Variable Insurance Funds (Invesco Variable Insurance Funds) (the “Trust”), 11 Greenway Plaza, Suite 1000, Houston, Texas 77046-1173. The trustees serve for the life of the Trust, subject to their earlier death, incapacitation, resignation, retirement or removal as more specifically provided in the Trust’s organizational documents. Each officer serves for a one year term or until their successors are elected and qualified. Column two below includes length of time served with predecessor entities, if any.
| | | | | | | | |
Name, Year of Birth and
Position(s) Held with the Trust | | Trustee and/
or Officer Since | | Principal Occupation(s)
During Past 5 Years | | Number of Funds in Fund Complex Overseen by Trustee | | Other Directorship(s) Held by Trustee During Past 5 Years |
| Interested Persons | | | | | | | | |
| Martin L. Flanagan1 — 1960 Trustee | | 2007 | | Executive Director, Chief Executive Officer and President, Invesco Ltd. (ultimate parent of Invesco and a global investment management firm); Advisor to the Board, Invesco Advisers, Inc. (formerly known as Invesco Institutional (N.A.), Inc.); Trustee, The Invesco Funds; Vice Chair, Investment Company Institute; and Member of Executive Board, SMU Cox School of Business Formerly: Chairman and Chief Executive Officer, Invesco Advisers, Inc. (registered investment adviser); Director, Chairman, Chief Executive Officer and President, IVZ Inc. (holding company), INVESCO Group Services, Inc. (service provider) and Invesco North American Holdings, Inc. (holding company); Director, Chief Executive Officer and President, Invesco Holding Company Limited (parent of Invesco and a global investment management firm); Director, Invesco Ltd.; Chairman, Investment Company Institute and President, Co-Chief Executive Officer, Co-President, Chief Operating Officer and Chief Financial Officer, Franklin Resources, Inc. (global investment management organization) | | 146 | | None |
Philip A. Taylor2 — 1954 Trustee, President and Principal Executive Officer | | 2006 | | Head of North American Retail and Senior Managing Director, Invesco Ltd.; Director, Co-Chairman, Co-President and Co-Chief Executive Officer, Invesco Advisers, Inc. (formerly known as Invesco Institutional (N.A.), Inc.) (registered investment adviser); Director, Chairman, Chief Executive Officer and President, Invesco Management Group, Inc. (formerly known as Invesco Aim Management Group, Inc.) (financial services holding company); Director and Chairman, Invesco Investment Services, Inc. (formerly known as Invesco Aim Investment Services, Inc.) (registered transfer agent) Chief Executive Officer, Invesco Corporate Class Inc. (corporate mutual fund company) Director, Chairman and Chief Executive Officer, Invesco Canada Ltd. (formerly known as Invesco Trimark Ltd./Invesco Trimark Ltèe) (registered investment adviser and registered transfer agent); Trustee, President and Principal Executive Officer, The Invesco Funds (other than AIM Treasurer’s Series Trust (Invesco Treasurer’s Series Trust), Short-Term Investments Trust and Invesco Management Trust); Trustee and Executive Vice President, The Invesco Funds (AIM Treasurer’s Series Trust (Invesco Treasurer’s Series Trust), Short-Term Investments Trust and Invesco Management Trust only); Director, Invesco Investment Advisers LLC (formerly known as Van Kampen Asset Management); Director, Chief Executive Officer and President, Van Kampen Exchange Corp. Formerly: Director and President, INVESCO Funds Group, Inc. (registered investment adviser and registered transfer agent); Director and Chairman, IVZ Distributors, Inc. (formerly known as INVESCO Distributors, Inc.) (registered broker dealer); Director, President and Chairman, Invesco Inc. (holding company), Invesco Canada Holdings Inc. (holding company), Trimark Investments Ltd./Placements Trimark Ltèe and Invesco Financial Services Ltd/Services Financiers Invesco Ltèe; Chief Executive Officer, Invesco Canada Fund Inc (corporate mutual fund company); Director and Chairman, Van Kampen Investor Services Inc.; Director, Chief Executive Officer and President, 1371 Preferred Inc. (holding company) and Van Kampen Investments Inc.; Director and President, AIM GP Canada Inc. (general partner for limited partnerships) and Van Kampen Advisors, Inc.; Director and Chief Executive Officer, Invesco Trimark Dealer Inc. (registered broker dealer); Director, Invesco Distributors, Inc. (formerly known as Invesco Aim Distributors, Inc.) (registered broker dealer); Manager, Invesco PowerShares Capital Management LLC; Director, Chief Executive Officer and President, Invesco Advisers, Inc.; Director, Chairman, Chief Executive Officer and President, Invesco Aim Capital Management, Inc.; President, Invesco Trimark Dealer Inc. and Invesco Trimark Ltd./Invesco Trimark Ltèe; Director and President, AIM Trimark Corporate Class Inc. and AIM Trimark Canada Fund Inc.; Senior Managing Director, Invesco Holding Company Limited; Director and Chairman, Fund Management Company (former registered broker dealer); President and Principal Executive Officer, The Invesco Funds (AIM Treasurer’s Series Trust (Invesco Treasurer’s Series Trust), and Short-Term Investments Trust only); President, AIM Trimark Global Fund Inc. and AIM Trimark Canada Fund Inc | | 146 | | None |
| 1 | Mr. Flanagan is considered an interested person (within the meaning of Section 2(a)(19) of the 1940 Act) of the Trust because he is an officer of the Adviser to the Trust, and an officer and a director of Invesco Ltd., ultimate parent of the Adviser. |
| 2 | Mr. Taylor is considered an interested person (within the meaning of Section 2(a)(19) of the 1940 Act) of the Trust because he is an officer and a director of the Adviser. |
Invesco V.I. American Franchise Fund
Trustees and Officers—(continued)
| | | | | | | | |
Name, Year of Birth and
Position(s) Held with the Trust | | Trustee and/
or Officer Since | | Principal Occupation(s)
During Past 5 Years | | Number of Funds in Fund Complex Overseen by Trustee | | Other Directorship(s)
Held by Trustee During Past 5 Years |
| Independent Trustees | | | | | | | | |
Bruce L. Crockett — 1944 Trustee and Chair | | 2003 | | Chairman, Crockett Technologies Associates (technology consulting company) Formerly: Director, Captaris (unified messaging provider); Director, President and Chief Executive Officer, COMSAT Corporation; Chairman, Board of Governors of INTELSAT (international communications company); ACE Limited (insurance company); Independent Directors Council and Investment Company Institute | | 146 | | ALPS (Attorneys Liability Protection Society) (insurance company) and Globe Specialty Metals, Inc. (metallurgical company) |
David C. Arch — 1945 Trustee | | 2010 | | Chairman of Blistex Inc., a consumer health care products manufacturer | | 146 | | Board member of the Illinois Manufacturers’ Association; Member of the Board of Visitors, Institute for the Humanities, University of Michigan |
James T. Bunch — 1942 Trustee | | 2000 | | Managing Member, Grumman Hill Group LLC (family office/private equity investments) Formerly: Chairman of the Board of Trustees, Evans Scholars Foundation and Chairman, Board of Governors, Western Golf Association | | 146 | | Trustee, Evans Scholars Foundation; and Chairman of the Board, Denver Film Society |
Albert R. Dowden — 1941 Trustee | | 2003 | | Director of a number of public and private business corporations, including the Boss Group, Ltd. (private investment and management); Nature’s Sunshine Products, Inc. and Reich & Tang Funds (5 portfolios) (registered investment company) Formerly: Director, Homeowners of America Holding Corporation/Homeowners of America Insurance Company (property casualty company); Director, Continental Energy Services, LLC (oil and gas pipeline service); Director, CompuDyne Corporation (provider of product and services to the public security market) and Director, Annuity and Life Re (Holdings), Ltd. (reinsurance company); Director, President and Chief Executive Officer, Volvo Group North America, Inc.; Senior Vice President, AB Volvo; Director of various public and private corporations; Chairman, DHJ Media, Inc.; Director, Magellan Insurance Company; and Director, The Hertz Corporation, Genmar Corporation (boat manufacturer), National Media Corporation; Advisory Board of Rotary Power International (designer, manufacturer, and seller of rotary power engines); and Chairman, Cortland Trust, Inc. (registered investment company) | | 146 | | Director of: Nature’s Sunshine Products, Inc., Reich & Tang Funds, Homeowners of America Holding Corporation/ Homeowners of America Insurance Company, the Boss Group |
Jack M. Fields — 1952 Trustee | | 2003 | | Chief Executive Officer, Twenty First Century Group, Inc. (government affairs company); Owner and Chief Executive Officer, Dos Angeles Ranch, L.P. (cattle, hunting, corporate entertainment); and Discovery Global Education Fund (non-profit) Formerly: Chief Executive Officer, Texana Timber LP (sustainable forestry company); Director of Cross Timbers Quail Research Ranch (non-profit); and member of the U.S. House of Representatives | | 146 | | Insperity, Inc. (formerly known as Administaff) |
Eli Jones — Trustee | | 2016 | | Professor and Dean, Mays Business School, Texas A&M University Formerly: Professor and Dean, Walton College of Business, University of Arkansas, and E.J. Ourso College of Business, Louisiana State University | | 146 | | Director, Insperity, Inc., (2011-present) and ARVEST Bank (2012-2015) |
Prema Mathai-Davis — 1950 Trustee | | 2003 | | Retired. Formerly: Chief Executive Officer, YWCA of the U.S.A. | | 146 | | None |
Larry Soll — 1942 Trustee | | 1997 | | Retired. Formerly: Chairman, Chief Executive Officer and President, Synergen Corp. (a biotechnology company) | | 146 | | None |
Robert C. Troccoli — Trustee | | 2016 | | Retired. Formerly: Senior Partner, KPMG LLP | | 146 | | None |
Raymond Stickel, Jr. — 1944 Trustee | | 2005 | | Retired. Formerly: Director, Mainstay VP Series Funds, Inc. (25 portfolios) and Partner, Deloitte & Touche | | 146 | | None |
Suzanne H. Woolsey — 1941 Trustee | | 2014 | | Chief Executive Officer of Woolsey Partners LLC | | 146 | | Emeritus Chair of the Board of Trustees of the Institute for Defense Analyses; Trustee of Colorado College; Trustee of California Institute of Technology; Prior to 2014, Director of Fluor Corp.; Prior to 2010, Trustee of the German Marshall Fund of the United States; Prior to 2010 Trustee of the Rocky Mountain Institute |
Invesco V.I. American Franchise Fund
Trustees and Officers—(continued)
| | | | | | | | |
Name, Year of Birth and
Position(s) Held with the Trust | | Trustee and/
or Officer Since | | Principal Occupation(s)
During Past 5 Years | | Number of Funds in Fund Complex Overseen by Trustee | | Other Directorship(s)
Held by Trustee During Past 5 Years |
| Other Officers | | | | | | | | |
Russell C. Burk — 1958 Senior Vice President and Senior Officer | | 2005 | | Senior Vice President and Senior Officer, The Invesco Funds | | N/A | | N/A |
John M. Zerr — 1962 Senior Vice President, Chief Legal Officer and Secretary | | 2006 | | Director, Senior Vice President, Secretary and General Counsel, Invesco Management Group, Inc. (formerly known as Invesco Aim Management Group, Inc.) and Van Kampen Exchange Corp.; Senior Vice President, Invesco Advisers, Inc. (formerly known as Invesco Institutional (N.A.), Inc.) (registered investment adviser); Senior Vice President and Secretary, Invesco Distributors, Inc. (formerly known as Invesco Aim Distributors, Inc.); Director, Vice President and Secretary, Invesco Investment Services, Inc. (formerly known as Invesco Aim Investment Services, Inc.); Senior Vice President, Chief Legal Officer and Secretary, The Invesco Funds; Managing Director, Invesco PowerShares Capital Management LLC; Director, Secretary and General Counsel, Invesco Investment Advisers LLC (formerly known as Van Kampen Asset Management); Secretary and General Counsel, Invesco Capital Markets, Inc. (formerly known as Van Kampen Funds Inc.) and Chief Legal Officer, PowerShares Exchange-Traded Fund Trust, PowerShares Exchange-Traded Fund Trust II, PowerShares India Exchange-Traded Fund Trust, PowerShares Actively Managed Exchange-Traded Fund Trust, and PowerShares Actively Managed Exchange-Traded Commodity Fund Trust Formerly: Director, Vice President and Secretary, IVZ Distributors, Inc. (formerly known as INVESCO distributors, Inc.); Director and Vice President, INVESCO Funds Group, Inc.; Director and Vice President, Van Kampen Advisors Inc.; Director, Vice President, Secretary and General Counsel, Van Kampen Investor Services Inc.; Director, Invesco Distributors, Inc. (formerly known as Invesco Aim Distributors, Inc.); Director, Senior Vice President, General Counsel and Secretary, Invesco Aim Advisers, Inc. and Van Kampen Investments Inc.; Director, Vice President and Secretary, Fund Management Company; Director, Senior Vice President, Secretary, General Counsel and Vice President, Invesco Aim Capital Management, Inc.; Chief Operating Officer and General Counsel, Liberty Ridge Capital, Inc. (an investment adviser); Vice President and Secretary, PBHG Funds (an investment company) and PBHG Insurance Series Fund (an investment company); Chief Operating Officer, General Counsel and Secretary, Old Mutual Investment Partners (a broker-dealer); General Counsel and Secretary, Old Mutual Fund Services (an administrator) and Old Mutual Shareholder Services (a shareholder servicing center); Executive Vice President, General Counsel and Secretary, Old Mutual Capital, Inc. (an investment adviser); and Vice President and Secretary, Old Mutual Advisors Funds (an investment company) | | N/A | | N/A |
Sheri Morris — 1964 Vice President, Treasurer and Principal Financial Officer | | 2003 | | Vice President, Treasurer and Principal Financial Officer, The Invesco Funds; Vice President, Invesco Advisers, Inc. (formerly known as Invesco Institutional (N.A.), Inc.) (registered investment adviser); and Vice President, PowerShares Exchange-Traded Fund Trust, PowerShares Exchange-Traded Fund Trust II, PowerShares India Exchange-Traded Fund Trust, PowerShares Actively Managed Exchange-Traded Fund Trust, and PowerShares Actively Managed Exchange-Traded Commodity Fund Trust Formerly: Vice President, Invesco Aim Advisers, Inc., Invesco Aim Capital Management, Inc. and Invesco Aim Private Asset Management, Inc.; Assistant Vice President and Assistant Treasurer, The Invesco Funds and Assistant Vice President, Invesco Advisers, Inc., Invesco Aim Capital Management, Inc. and Invesco Aim Private Asset Management, Inc.; and Treasurer, PowerShares Exchange-Traded Fund Trust, PowerShares Exchange-Traded Fund Trust II, PowerShares India Exchange-Traded Fund Trust and PowerShares Actively Managed Exchange-Traded Fund Trust | | N/A | | N/A |
Invesco V.I. American Franchise Fund
Trustees and Officers—(continued)
| | | | | | | | |
Name, Year of Birth and
Position(s) Held with the Trust | | Trustee and/
or Officer Since | | Principal Occupation(s)
During Past 5 Years | | Number of Funds in Fund Complex Overseen by Trustee | | Other Directorship(s)
Held by Trustee During Past 5 Years |
| Other Officers—(continued) | | | | | | | | |
Karen Dunn Kelley — 1960 Vice President | | 2003 | | Senior Managing Director, Investments, Invesco Ltd.; Director, Co-President, Co-Chief Executive Officer, and Co-Chairman, Invesco Advisers, Inc. (formerly known as Invesco Institutional (N.A.), Inc.) (registered investment adviser); Chairman, Invesco Senior Secured Management, Inc.; Senior Vice President, Invesco Management Group, Inc. (formerly known as Invesco Aim Management Group, Inc.); Executive Vice President, Invesco Distributors, Inc. (formerly known as Invesco Aim Distributors, Inc.); Director, Invesco Mortgage Capital Inc. and Invesco Management Company Limited; Vice President, The Invesco Funds (other than AIM Treasurer’s Series Trust (Invesco Treasurer’s Series Trust), Short-Term Investments Trust and Invesco Management Trust); and President and Principal Executive Officer, The Invesco Funds (AIM Treasurer’s Series Trust (Invesco Treasurer’s Series Trust), Short-Term Investments Trust and Invesco Management Trust only) Formerly: Director and President, INVESCO Asset Management (Bermuda) Ltd., Director, INVESCO Global Asset Management Limited and INVESCO Management S.A.; Senior Vice President, Van Kampen Investments Inc. and Invesco Advisers, Inc. (formerly known as Invesco Institutional (N.A.), Inc.) (registered investment adviser); Vice President, Invesco Advisers, Inc. (formerly known as Invesco Institutional (N.A.), Inc.); Director of Cash Management and Senior Vice President, Invesco Advisers, Inc. and Invesco Aim Capital Management, Inc.; Director and President, Fund Management Company; Chief Cash Management Officer, Director of Cash Management, Senior Vice President, and Managing Director, Invesco Aim Capital Management, Inc.; Director of Cash Management, Senior Vice President, and Vice President, Invesco Advisers, Inc. and The Invesco Funds (AIM Treasurer’s Series Trust (Invesco Treasurer’s Series Trust), and Short-Term Investments Trust only) | | N/A | | N/A |
Crissie M. Wisdom — 1969 Anti-Money Laundering Compliance Officer | | 2013 | | Anti-Money Laundering Compliance Officer, Invesco Advisers, Inc. (formerly known as Invesco Institutional (N.A.), Inc.) (registered investment adviser), Invesco Capital Markets, Inc. (formerly known as Van Kampen Funds Inc.), Invesco Distributors, Inc., Invesco Investment Services, Inc., Invesco Management Group, Inc., Van Kampen Exchange Corp., The Invesco Funds, and PowerShares Exchange-Traded Fund Trust, PowerShares Exchange-Traded Fund Trust II, PowerShares India Exchange-Traded Fund Trust, PowerShares Actively Managed Exchange-Traded Fund Trust and PowerShares Actively Managed Exchange-Traded Commodity Fund Trust; Anti-Money Laundering Compliance Officer and Bank Secrecy Act Officer, INVESCO National Trust Company and Invesco Trust Company; and Fraud Prevention Manager and Controls and Risk Analysis Manager for Invesco Investment Services, Inc. | | N/A | | N/A |
Lisa O. Brinkley — 1959 Chief Compliance Officer | | 2015 | | Senior Vice President and Chief Compliance Officer, Invesco Advisers, Inc. (registered investment adviser) (formerly known as Invesco Institutional (N.A., Inc.); and Chief Compliance Officer, The Invesco Funds Formerly: Global Assurance Officer, Invesco Ltd. and Vice President, The Invesco Funds; Chief Compliance Officer, Invesco Distributors, Inc. (formerly known as Invesco Aim Distributors, Inc.), Invesco Investment Services, Inc.(formerly known as Invesco Aim Investment Services, Inc.) and Van Kampen Investor Services Inc.; Senior Vice President, Invesco Management Group, Inc.; Senior Vice President and Chief Compliance Officer, Invesco Advisers, Inc. and The Invesco Funds; Vice President and Chief Compliance Officer, Invesco Aim Capital Management, Inc. and Invesco Distributors, Inc.; Vice President, Invesco Investment Services, Inc. and Fund Management Company | | N/A | | N/A |
The Statement of Additional Information of the Trust includes additional information about the Fund’s Trustees and is available upon request, without charge, by calling 1.800.959.4246. Please refer to the Fund’s prospectus for information on the Fund’s sub-advisers.
| | | | | | |
Office of the Fund 11 Greenway Plaza, Suite 1000 Houston, TX 77046-1173 | | Investment Adviser Invesco Advisers, Inc. 1555 Peachtree Street, N.E. Atlanta, GA 30309 | | Distributor Invesco Distributors, Inc. 11 Greenway Plaza, Suite 1000 Houston, TX 77046-1173 | | Auditors PricewaterhouseCoopers LLP 1000 Louisiana Street, Suite 5800 Houston, TX 77002-5678 |
| | | |
| | | | | | |
Counsel to the Fund Stradley Ronon Stevens & Young, LLP 2005 Market Street, Suite 2600 Philadelphia, PA 19103-7018 | | Counsel to the Independent Trustees Goodwin Procter LLP 901 New York Avenue, N.W. Washington, D.C. 20001 | | Transfer Agent Invesco Investment Services, Inc. 11 Greenway Plaza, Suite 1000 Houston, TX 77046-1173 | | Custodian State Street Bank and Trust Company 225 Franklin Street Boston, MA 02110-2801 |
Invesco V.I. American Franchise Fund
| | | | |
| | |

| | Annual Report to Shareholders | | December 31, 2015 |
| | |
| | Invesco V.I. American Value Fund |

| | |
| | The Fund provides a complete list of its holdings four times in each fiscal year, at the quarter-ends. For the second and fourth quarters, the lists appear in the Fund’s semiannual and annual reports to shareholders. For the first and third quarters, the Fund files the lists with the Securities and Exchange Commission (SEC) on Form N-Q. The Fund’s Form N-Q filings are available on the SEC website, sec.gov. Copies of the Fund’s Forms N-Q may be reviewed and copied at the SEC Public Reference Room in Washington, D.C. You can obtain information on the operation of the Public Reference Room, including information about duplicating fee charges, by calling 202 551 8090 or 800 732 0330, or by electronic request at the following email address: publicinfo@sec.gov. The SEC file numbers for the Fund are 811-07452 and 033-57340. The Fund’s most recent portfolio holdings, as filed on Form N-Q, have also been made available to insurance companies issuing variable annuity contracts and variable life insurance policies (“variable products”) that invest in the Fund. A description of the policies and procedures that the Fund uses to determine how to vote proxies relating to portfolio securities is available without charge, upon request, from our Client Services department at 800 959 4246 or at invesco.com/proxyguidelines. The information is also available on the SEC website, sec.gov. Information regarding how the Fund voted proxies related to its portfolio securities during the most recent 12-month period ended June 30 is available at invesco.com/ proxysearch. The information is also available on the SEC website, sec.gov. Invesco Advisers, Inc. is an investment adviser; it provides investment advisory services to individual and institutional clients and does not sell securities. Invesco Distributors, Inc. is the US distributor for Invesco Ltd.’s retail mutual funds, exchange-traded funds and institutional money market funds. Both are wholly owned, indirect subsidiaries of Invesco Ltd. This report must be accompanied or preceded by a currently effective Fund prospectus and variable product prospectus, which contain more complete information, including sales charges and expenses. Investors should read each carefully before investing. Invesco Distributors, Inc. VK-VIAMVA-AR-1 NOT FDIC INSURED | MAY LOSE VALUE | NO BANK GUARANTEE |
Management’s Discussion of Fund Performance
Performance summary
For the year ended December 31, 2015, Series I shares of Invesco V.I. American Value Fund (the Fund) underperformed the Russell Midcap Value Index, the Fund’s style-specific benchmark.
Your Fund’s long-term performance appears later in this report.
Fund vs. Indexes
Total returns, 12/31/14 to 12/31/15, excluding variable product issuer charges.
If variable product issuer charges were included, returns would be lower.
| | | | | |
| Series I Shares | | | | -9.13 | % |
| Series II Shares | | | | -9.36 | |
| S&P 500 Index▼ (Broad Market Index) | | | | 1.38 | |
| Russell Midcap Value Index▼ (Style-Specific Index) | | | | -4.78 | |
| Lipper VUF Mid-Cap Value Funds Indexn (Peer Group Index) | | | | -4.84 | |
Source(s): ▼FactSet Research Systems Inc.; nLipper Inc.
Market conditions and your Fund
The US economy continued its modest, but steady growth, during the year ended December 31, 2015 – although the health of individual economic sectors varied dramatically. The headline economic story was a steady decline in already-battered energy markets, as oil prices plummeted when increased supply overwhelmed demand. This decline particularly affected companies with US-based offshore or shale-based resources – companies whose cost to recover oil is higher than many traditional producers. On the other end of the spectrum, the improved position of the US consumer was the more subtle story which drove the US economy forward during the year.
As the year began, economic growth appeared to be stronger in the US than in the rest of the world. US equity markets were recovering from the crash of oil prices initiated by OPEC’s decision to maintain high production despite low prices and slowing global growth. The view that the US Federal Reserve (the Fed) would begin raising rates while other central banks were loosening monetary policy led the US dollar to strengthen
against many currencies. This hurt commodity- and materials-based economies – and companies in related sectors. Additionally, US-based multinational companies faced foreign exchange headwinds. Low interest rates, the increasing availability of credit and an improving employment picture all contributed to higher consumer confidence and consumer spending, which drove US equity markets higher, particularly through the spring, and helped overcome fears that Greece and the eurozone would fail to reach an agreement on a financial bailout plan.
In the summer of 2015, US equity markets moved sharply lower. A significant downturn in China’s financial markets and weak global economic growth led the Fed to delay raising interest rates; this, in turn, increased investor uncertainty and market volatility. A continued decline in oil prices also contributed to market volatility. In the fall, however, US markets rallied, the Fed saw enough economic stabilization to finally raise interest rates, and most major US market indexes ended the year barely in positive territory.
Stock selection in the industrials sector was the largest contributor to the Fund’s
performance relative to its style-specific index for the reporting period. Within the sector, Owens Corning and Masco were strong contributors to Fund performance. Both companies benefited from improved residential construction during the year. In particular, Owens Corning reported stronger sales and improved profitability for its asphalt roofing and insulation products. Masco had strong results in its cabinet division, which drove earnings.
Stock selection in and underweight exposure to the materials sector benefited the Fund’s relative return, as the sector was one of the worst-performing sectors in the style-specific benchmark for the reporting period. Our lack of exposure to some of the weaker names in the sector helped Fund performance relative to its style-specific index.
Similarly, stock selection in and underweight exposure to the energy sector also had a positive impact on Fund performance relative to the style-specific index. The Fund’s performance in the sector was the result of the companies that we owned, as well as the companies we avoided – many of which sustained double-digit losses for the year. Given the widespread dislocation within the energy sector, particularly in the oil and gas industry, energy was the largest detractor from the Fund’s absolute return, and two of the Fund’s largest individual detractors, Amec Foster Wheeler and Williams Companies, were in this sector.
Stock selection in the consumer discretionary sector was the largest detractor from the Fund’s return relative to the style-specific index for the year. Fund performance in the sector was driven primarily by Fossil, which reported weakening sales and earnings due to declining demand for watches and leather goods. The company also faced headwinds from the stronger US dollar, and it lowered its
| | | | | |
| Portfolio Composition |
By sector | | | | % of total net assets | |
| | | | | |
| |
| Financials | | | | 27.7 | % |
| Industrials | | | | 16.7 | |
| Information Technology | | | | 11.7 | |
| Consumer Discretionary | | | | 10.7 | |
| Health Care | | | | 8.8 | |
| Materials | | | | 6.8 | |
| Energy | | | | 6.0 | |
| Consumer Staples | | | | 3.1 | |
| Telecommunication Services | | | | 2.8 | |
| Utilities | | | | 2.8 | |
Money Market Funds | | | | | |
| Plus Other Assets Less Liabilities | | | | 2.9 | |
|
| Top 10 Equity Holdings* |
| % of total net assets |
| | | | | |
| |
1. Forest City Enterprises, Inc.-Class A | | | | 3.1 | % |
2. Willis Group Holdings PLC | | | | 3.1 | |
3. ConAgra Foods, Inc. | | | | 3.1 | |
4. Johnson Controls, Inc. | | | | 3.0 | |
5. Level 3 Communications, Inc. | | | | 2.8 | |
6. FNF Group | | | | 2.8 | |
7. Universal Health Services, | | | | | |
| Inc.-Class B | | | | 2.7 | |
8. HealthSouth Corp. | | | | 2.7 | |
9. BB&T Corp. | | | | 2.7 | |
10. Textron Inc. | | | | 2.7 | |
| | | | | |
| Total Net Assets | | | $ | 336.0 million | |
| | | | | |
| |
Total Number of Holdings* | | | | 48 | |
The Fund’s holdings are subject to change, and there is no assurance that the Fund will continue to hold any particular security.
*Excluding money market fund holdings.
Data presented here are as of December 31, 2015.
Invesco V.I. American Value Fund
earnings guidance. We eliminated the stock from the portfolio during the year.
In the consumer discretionary sector, auto parts suppliers Johnson Controls and Dana Holding also detracted from Fund performance. During the reporting period, Johnson Controls announced plans to spin off its automotive division from its other business lines, which include building efficiency and power solutions. The company has exposure to China’s weakening economy, and this hurt the stock’s performance during the year. Dana Holding was hurt by weakness in emerging markets, and the company reported disappointing earnings during the reporting period. In our view, these companies are experiencing temporary headwinds, and we maintained our positions in both companies.
Stock selection in the health care sector also detracted from the Fund’s performance relative to the style-specific index for the reporting period. Health care was the best-performing sector for 2015, and much of the Fund’s underperformance relative to the style-specific index was due to stocks we did not hold, but which performed very strongly in the index. In addition, assisted living operator Brookdale Senior Living was a key detractor from the Fund’s relative and absolute performance during the reporting period. The firm’s earnings results came in below expectations, and company management lowered earnings estimates for the remainder of the company’s fiscal year, as occupancy was lower than anticipated.
Stock selection in the information technology (IT) sector also detracted from the Fund’s performance relative to the style-specific index. Teradata was the largest detractor in the sector. The company reported disappointing earnings due to shrinking margins and foreign currency headwinds.
Stock selection in and underweight exposure to the financials sector detracted from the Fund’s performance relative to the style-specific index, due in part to the Fund’s lack of exposure to some strong-performing real estate names. The Fund’s exposure to insurance and banks also drove underperformance in the sector. Banks, in particular, were hurt by uncertainty for much of the year regarding the Fed’s intent to raise interest rates; the Fed ultimately voted to raise rates at its December meeting.
We used currency forward contracts during the reporting period for the purpose of hedging currency exposure of non-US-based companies held in the Fund. Derivatives were used for the
purpose of hedging and not for speculative purposes or leverage. Due to the continued strength of the US dollar, the use of currency forward contracts had a slight positive impact on the Fund’s performance relative to the Russell Midcap Value Index for the year.
During the year, we increased our exposure to the materials, energy and financials sectors and decreased our exposure to the IT, industrials and health care sectors. At the end of the reporting period, our largest overweight positions versus the style-specific benchmark were in the industrials and health care sectors; our largest underweight positions were in the utilities and financials sectors.
US equity markets experienced continued volatility during the reporting period as concerns about global economic growth, low oil prices and uncertainty regarding the Fed’s stance on interest rates weighed on investors. We believe market volatility creates opportunities to invest in companies with attractive valuations and strong fundamentals. We believe that ultimately those valuations and fundamentals will be reflected in those companies’ stock prices.
As always, we are committed to working to achieve positive returns for the Fund’s shareholders through an entire market cycle. Thank you for your continued investment in Invesco V.I. American Value Fund.
The views and opinions expressed in management’s discussion of Fund performance are those of Invesco Advisers, Inc. These views and opinions are subject to change at any time based on factors such as market and economic conditions. These views and opinions may not be relied upon as investment advice or recommendations, or as an offer for a particular security. The information is not a complete analysis of every aspect of any market, country, industry, security or the Fund. Statements of fact are from sources considered reliable, but Invesco Advisers, Inc. makes no representation or warranty as to their completeness or accuracy. Although historical performance is no guarantee of future results, these insights may help you understand our investment management philosophy.
See important Fund and, if applicable, index disclosures later in this report.
| | |
 | | Thomas Copper Chartered Financial Analyst, Portfolio Manager, is co-lead manager of Invesco V.I. American Value |
| Fund. He joined Invesco in 2010. Mr. Copper earned a BA in economics and political science from Tulane University and an MBA from Baylor University. |
| |
 | | John Mazanec Portfolio Manager, is co-lead manager of Invesco V.I. American Value Fund. He joined Invesco in 2010. |
| Mr. Mazanec earned a BS from DePauw University and an MBA from Harvard University. |
| |
 | | Sergio Marcheli Portfolio Manager, is manager of Invesco V.I. American Value Fund. He joined Invesco in 2010. Mr. Marcheli |
| earned a BBA from the University of Houston and an MBA from the University of St. Thomas. |
Invesco V.I. American Value Fund
Your Fund’s Long-Term Performance
Results of a $10,000 Investment – Oldest Share Class(es)
Fund and index data from 12/31/05
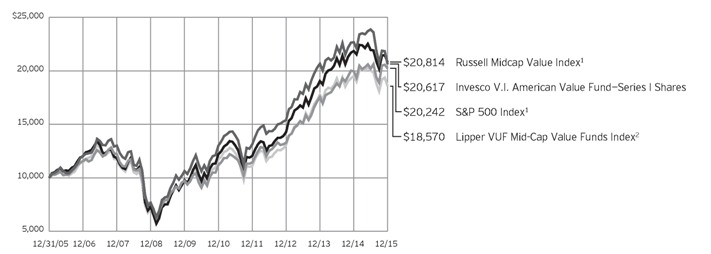
| 1 | Source: FactSet Research Systems Inc. |
Past performance cannot guarantee
comparable future results.
| | | | | |
| Average Annual Total Returns |
As of 12/31/15 | | | | | |
| |
| Series I Shares | | | | | |
| Inception (1/2/97) | | | | 9.58 | % |
| 10 Years | | | | 7.50 | |
| 5 Years | | | | 9.65 | |
| 1 Year | | | | -9.13 | |
| |
| Series II Shares | | | | | |
| Inception (5/5/03) | | | | 10.29 | % |
| 10 Years | | | | 7.34 | |
| 5 Years | | | | 9.42 | |
| 1 Year | | | | -9.36 | |
Effective June 1, 2010, Class I and Class II shares of the predecessor fund, Universal Institutional Funds Mid Cap Value Portfolio, advised by Morgan Stanley Investment Management Inc. were reorganized into Series I and Series II shares, respectively, of Invesco Van Kampen V.I. Mid Cap Value Fund (renamed Invesco V.I. American Value Fund on April 29, 2013). Returns shown above for Series I and Series II shares are blended returns of the predecessor fund and Invesco V.I. American Value Fund. Share class returns will differ from the predecessor fund because of different expenses.
The performance data quoted represent past performance and cannot guarantee comparable future
results; current performance may be lower or higher. Please contact your variable product issuer or financial adviser for the most recent month-end variable product performance. Performance figures reflect Fund expenses, reinvested distributions and changes in net asset value. Investment return and principal value will fluctuate so that you may have a gain or loss when you sell shares.
The net annual Fund operating expense ratio set forth in the most recent Fund prospectus as of the date of this report for Series I and Series II shares was 1.03% and 1.28%, respectively.1 The total annual Fund operating expense ratio set forth in the most recent Fund prospectus as of the date of this report for Series I and Series II shares was 1.04% and 1.29%, respectively. The expense ratios presented above may vary from the expense ratios presented in other sections of this report that are based on expenses incurred during the period covered by this report.
Invesco V.I. American Value Fund, a series portfolio of AIM Variable Insurance Funds (Invesco Variable Insurance Funds), is currently offered through insurance companies issuing variable products. You cannot purchase
shares of the Fund directly. Performance figures given represent the Fund and are not intended to reflect actual variable product values. They do not reflect sales charges, expenses and fees assessed in connection with a variable product. Sales charges, expenses and fees, which are determined by the variable product issuers, will vary and will lower the total return.
The most recent month-end performance at the Fund level, excluding variable product charges, is available at 800 451 4246. As mentioned above, for the most recent month-end performance including variable product charges, please contact your variable product issuer or financial adviser.
Fund performance reflects any applicable fee waivers and/or expense reimbursements. Had the adviser not waived fees and/or reimbursed expenses currently or in the past, returns would have been lower. See current prospectus for more information.
| 1 | Total annual Fund operating expenses after any contractual fee waivers and/or expense reimbursements by the adviser in effect through at least June 30, 2017. See current prospectus for more information. |
Invesco V.I. American Value Fund
Invesco V.I. American Value Fund’s investment objective is to provide above-average total return over a market cycle of three to five years by investing in common stocks and other equity securities.
| n | | Unless otherwise stated, information presented in this report is as of December 31, 2015, and is based on total net assets. |
| n | | Unless otherwise noted, all data provided by Invesco. |
| n | | To access your Fund’s reports/prospectus, visit invesco.com/fundreports. |
Principal risks of investing in the Fund
Depositary receipts risk. Depositary receipts involve many of the same risks as those associated with direct investment in foreign securities. In addition, the underlying issuers of certain depositary receipts, particularly unsponsored or unregistered depositary receipts, are under no obligation to distribute shareholder communications to the holders of such receipts or to pass through to them any voting rights with respect to the deposited securities.
Derivatives risk. The value of a derivative instrument depends largely on (and is derived from) the value of an underlying security, currency, commodity, interest rate, index or other asset (each referred to as an underlying asset). In addition to risks relating to the underlying assets, the use of derivatives may include other, possibly greater, risks, including counterparty, leverage and liquidity risks. Counterparty risk is the risk that the counterparty to the derivative contract will default on its obligation to pay the Fund the amount owed or otherwise perform under the derivative contract. Derivatives create leverage risk because they do not require payment up front equal to the economic exposure created by owning the derivative. As a result, an adverse change in the value of the underlying asset could result in the Fund sustaining a loss that is substantially greater than the amount invested in the derivative, which may make the Fund’s returns more volatile and increase the risk of loss. Derivative instruments may also be less liquid than more traditional investments and the Fund may be unable to sell or close out its derivative positions at a desirable time or price. This risk may be more acute under adverse market conditions, during which the Fund may be most in need of liquidating its derivative positions. Derivatives may also be harder to value, less tax efficient and subject to changing government regulation that could impact the Fund’s ability to use certain derivatives or their cost. Also, derivatives used for hedging or to gain or limit exposure to a particular market segment may not provide the expected benefits, particularly during adverse market conditions.
Foreign securities risk. The Fund’s foreign investments may be affected by changes in a foreign country’s exchange rates, political and social instability, changes in economic or taxation policies, difficulties when enforcing obligations, decreased liquidity, and increased volatility. Foreign companies may be subject to less regulation resulting in less publicly available information about the companies.
Management risk. The investment techniques and risk analysis used by the Fund’s portfolio managers may not produce the desired results.
Market risk. The prices of and the income generated by the Fund’s securities may decline in response to, among other things, investor sentiment, general economic and market conditions, regional or global instability, and currency and interest rate fluctuations.
Real estate investment trust (REIT)/real estate risk. Investments in real estate related instruments may be affected by economic, legal, cultural, environmental or technological factors that affect property values, rents or occupancies of real estate related to the Fund’s holdings. Shares of real estate related companies, which tend to be small- and mid-cap companies, may be more volatile and less liquid.
Small- and mid-capitalization risks. Stocks of small- and mid-sized companies tend to be more vulnerable to adverse developments and may have little or no operating history or track record of success, and limited product lines, markets, management and financial resources. The securities of small- and mid-sized companies may be more volatile due to less market interest and less publicly available information about the issuer. They also may be illiquid or restricted as to resale, or may trade less frequently and in smaller volumes, all of which may cause difficulty when establishing or closing a position at a desirable price.
Value investing style risk. The Fund emphasizes a value style of investing, which focuses on undervalued companies with characteristics for improved valuations. This style of investing is subject to the risk that the valuations never improve or that the returns on value equity securities are less than returns on other styles of investing or the overall stock market. Value stocks also may decline in price,
even though in theory they are already underpriced.
About indexes used in this report
The S&P 500® Index is an unmanaged index considered representative of the US stock market.
The Russell Midcap® Value Index is an unmanaged index considered representative of mid-cap value stocks. The Russell Midcap Value Index is a trademark/service mark of the Frank Russell Co. Russell® is a trademark of the Frank Russell Co.
The Lipper VUF Mid-Cap Value Funds Index is an unmanaged index considered representative of mid-cap value variable insurance underlying funds tracked by Lipper.
The Fund is not managed to track the performance of any particular index, including the index(es) described here, and consequently, the performance of the Fund may deviate significantly from the performance of the index(es).
A direct investment cannot be made in an index. Unless otherwise indicated, index results include reinvested dividends, and they do not reflect sales charges. Performance of the peer group, if applicable, reflects fund expenses; performance of a market index does not.
Other information
The returns shown in management’s discussion of Fund performance are based on net asset values calculated for shareholder transactions. Generally accepted accounting principles require adjustments to be made to the net assets of the Fund at period end for financial reporting purposes, and as such, the net asset values for shareholder transactions and the returns based on those net asset values may differ from the net asset values and returns reported in the Financial Highlights. Additionally, the returns and net asset values shown throughout this report are at the Fund level only and do not include variable product issuer charges. If such charges were included, the total returns would be lower.
Industry classifications used in this report are generally according to the Global Industry Classification Standard, which was developed by and is the exclusive property and a service mark of MSCI Inc. and Standard & Poor’s.
Invesco V.I. American Value Fund
Schedule of Investments(a)
December 31, 2015
| | | | | | | | |
| | | Shares | | | Value | |
Common Stocks & Other Equity Interests–97.10% | |
| Aerospace & Defense–4.07% | |
BWX Technologies, Inc. | | | 148,938 | | | $ | 4,731,760 | |
Textron Inc. | | | 213,132 | | | | 8,953,676 | |
| | | | | | | | 13,685,436 | |
| | |
| Alternative Carriers–2.81% | | | | | | | | |
Level 3 Communications, Inc.(b) | | | 173,947 | | | | 9,455,759 | |
| | |
| Apparel Retail–1.63% | | | | | | | | |
Ascena Retail Group, Inc.(b) | | | 557,124 | | | | 5,487,671 | |
| | |
| Application Software–2.14% | | | | | | | | |
Citrix Systems, Inc.(b) | | | 95,193 | | | | 7,201,350 | |
|
| Asset Management & Custody Banks–3.97% | |
American Capital Ltd.(b) | | | 540,282 | | | | 7,450,489 | |
Northern Trust Corp. | | | 81,524 | | | | 5,877,065 | |
| | | | | | | | 13,327,554 | |
|
| Auto Parts & Equipment–4.76% | |
Dana Holding Corp. | | | 421,730 | | | | 5,819,874 | |
Johnson Controls, Inc. | | | 257,655 | | | | 10,174,796 | |
| | | | | | | | 15,994,670 | |
|
| Broadcasting–2.24% | |
TEGNA Inc. | | | 295,447 | | | | 7,539,807 | |
|
| Building Products–4.57% | |
Masco Corp. | | | 232,294 | | | | 6,573,920 | |
Owens Corning | | | 186,442 | | | | 8,768,368 | |
| | | | | | | | 15,342,288 | |
|
| Communications Equipment–2.31% | |
Ciena Corp.(b) | | | 375,032 | | | | 7,759,412 | |
|
| Construction & Engineering–1.81% | |
Fluor Corp. | | | 129,139 | | | | 6,097,944 | |
|
| Construction Materials–1.93% | |
Eagle Materials Inc. | | | 107,577 | | | | 6,500,878 | |
|
| Diversified Banks–2.41% | |
Comerica Inc. | | | 193,225 | | | | 8,082,602 | |
|
| Diversified Chemicals–2.62% | |
Eastman Chemical Co. | | | 130,462 | | | | 8,807,490 | |
|
| Education Services–2.09% | |
DeVry Education Group Inc. | | | 277,609 | | | | 7,026,284 | |
|
| Electric Utilities–1.93% | |
Edison International | | | 109,322 | | | | 6,472,956 | |
|
| Electronic Equipment & Instruments–2.07% | |
Keysight Technologies, Inc.(b) | | | 245,046 | | | | 6,942,153 | |
| | | | | | | | |
| | | Shares | | | Value | |
| Environmental & Facilities Services–1.98% | |
Clean Harbors, Inc.(b) | | | 159,536 | | | $ | 6,644,674 | |
|
| Health Care Facilities–6.26% | |
Brookdale Senior Living Inc.(b) | | | 156,486 | | | | 2,888,732 | |
HealthSouth Corp. | | | 260,366 | | | | 9,063,340 | |
Universal Health Services, Inc.–Class B | | | 76,154 | | | | 9,099,642 | |
| | | | | | | | 21,051,714 | |
|
| Heavy Electrical Equipment–1.23% | |
Babcock & Wilcox Enterprises, Inc.(b) | | | 197,355 | | | | 4,118,799 | |
|
| Industrial Machinery–2.23% | |
Ingersoll-Rand PLC | | | 135,725 | | | | 7,504,235 | |
|
| Insurance Brokers–6.32% | |
Arthur J. Gallagher & Co. | | | 151,891 | | | | 6,218,417 | |
Marsh & McLennan Cos., Inc. | | | 82,045 | | | | 4,549,395 | |
Willis Group Holdings PLC | | | 215,601 | | | | 10,471,741 | |
| | | | | | | | 21,239,553 | |
|
| Investment Banking & Brokerage–2.29% | |
Stifel Financial Corp.(b) | | | 181,267 | | | | 7,678,470 | |
|
| IT Consulting & Other Services–1.94% | |
Teradata Corp.(b) | | | 247,323 | | | | 6,534,274 | |
|
| Life Sciences Tools & Services–2.55% | |
PerkinElmer, Inc. | | | 159,663 | | | | 8,553,147 | |
|
| Multi-Utilities–0.83% | |
CenterPoint Energy, Inc. | | | 152,745 | | | | 2,804,398 | |
|
| Oil & Gas Equipment & Services–3.02% | |
Amec Foster Wheeler PLC (United Kingdom) | | | 535,511 | | | | 3,385,838 | |
Amec Foster Wheeler PLC–ADR (United Kingdom) | | | 42,166 | | | | 271,549 | |
Baker Hughes Inc. | | | 140,803 | | | | 6,498,058 | |
| | | | | | | | 10,155,445 | |
|
| Oil & Gas Exploration & Production–1.75% | |
Devon Energy Corp. | | | 183,620 | | | | 5,875,840 | |
|
| Oil & Gas Storage & Transportation–1.28% | |
Williams Cos., Inc. (The) | | | 167,101 | | | | 4,294,496 | |
|
| Packaged Foods & Meats–3.11% | |
ConAgra Foods, Inc. | | | 248,139 | | | | 10,461,540 | |
|
| Property & Casualty Insurance–2.79% | |
FNF Group | | | 270,698 | | | | 9,385,100 | |
|
| Real Estate Operating Companies–3.14% | |
Forest City Enterprises, Inc.–Class A(b) | | | 480,523 | | | | 10,537,869 | |
| | |
| Regional Banks–6.79% | | | | | | | | |
BB&T Corp. | | | 237,724 | | | | 8,988,344 | |
Wintrust Financial Corp. | | | 172,028 | | | | 8,346,799 | |
See accompanying Notes to Financial Statements which are an integral part of the financial statements.
Invesco V.I. American Value Fund
| | | | | | | | |
| | | Shares | | | Value | |
| Regional Banks–(continued) | | | | | | | | |
Zions Bancorp. | | | 200,847 | | | $ | 5,483,123 | |
| | | | | | | | 22,818,266 | |
| | |
| Specialty Chemicals–2.21% | | | | | | | | |
W.R. Grace & Co.(b) | | | 74,677 | | | | 7,437,082 | |
|
| Technology Hardware, Storage & Peripherals–3.20% | |
Diebold, Inc. | | | 177,682 | | | | 5,346,451 | |
NetApp, Inc. | | | 203,841 | | | | 5,407,902 | |
| | | | | | | | 10,754,353 | |
| | |
| Trucking–0.82% | | | | | | | | |
Swift Transportation Co.(b) | | | 198,305 | | | | 2,740,575 | |
Total Common Stocks & Other Equity Interests (Cost $300,334,652) | | | | 326,314,084 | |
| | | | | | | | |
| | | Shares | | | Value | |
Money Market Funds–2.89% | |
Liquid Assets Portfolio–Institutional Class, 0.29%(c) | | | 4,854,188 | | | $ | 4,854,188 | |
Premier Portfolio–Institutional Class, 0.24%(c) | | | 4,854,188 | | | | 4,854,188 | |
Total Money Market Funds
(Cost $9,708,376) | | | | | | | 9,708,376 | |
TOTAL INVESTMENTS–99.99%
(Cost $310,043,028) | | | | | | | 336,022,460 | |
OTHER ASSETS LESS LIABILITIES–0.01% | | | | | | | 17,973 | |
NET ASSETS–100.00% | | | | | | $ | 336,040,433 | |
Investment Abbreviations:
| | |
| ADR | | – American Depositary Receipt |
Notes to Schedule of Investments:
| (a) | Industry and/or sector classifications used in this report are generally according to the Global Industry Classification Standard, which was developed by and is the exclusive property and a service mark of MSCI Inc. and Standard & Poor’s. |
| (b) | Non-income producing security. |
| (c) | The money market fund and the Fund are affiliated by having the same investment adviser. The rate shown is the 7-day SEC standardized yield as of December 31, 2015. |
See accompanying Notes to Financial Statements which are an integral part of the financial statements.
Invesco V.I. American Value Fund
Statement of Assets and Liabilities
December 31, 2015
Statement of Operations
For the year ended December 31, 2015
| | | | |
Assets: | |
Investments, at value (Cost $300,334,652) | | $ | 326,314,084 | |
Investments in affiliated money market funds, at value and cost | | | 9,708,376 | |
Total investments, at value (Cost $310,043,028) | | | 336,022,460 | |
Cash | | | 39,360 | |
Receivable for: | | | | |
Fund shares sold | | | 87,010 | |
Dividends | | | 532,269 | |
Investment for trustee deferred compensation and retirement plans | | | 47,702 | |
Unrealized appreciation on forward foreign currency contracts outstanding | | | 46,438 | |
Total assets | | | 336,775,239 | |
|
Liabilities: | |
Payable for: | | | | |
Investments purchased | | | 152,712 | |
Fund shares reacquired | | | 178,863 | |
Accrued fees to affiliates | | | 329,844 | |
Accrued trustees’ and officers’ fees and benefits | | | 160 | |
Accrued other operating expenses | | | 17,833 | |
Trustee deferred compensation and retirement plans | | | 55,394 | |
Total liabilities | | | 734,806 | |
Net assets applicable to shares outstanding | | $ | 336,040,433 | |
|
Net assets consist of: | |
Shares of beneficial interest | | $ | 290,530,065 | |
Undistributed net investment income | | | 651,605 | |
Undistributed net realized gain | | | 18,835,900 | |
Net unrealized appreciation | | | 26,022,863 | |
| | | $ | 336,040,433 | |
|
Net Assets: | |
Series I | | $ | 125,686,064 | |
Series II | | $ | 210,354,369 | |
|
Shares outstanding, $0.001 par value per share,
with an unlimited number of shares authorized: | |
Series I | | | 8,011,731 | |
Series II | | | 13,529,775 | |
Series I: | | | | |
Net asset value per share | | $ | 15.69 | |
Series II: | | | | |
Net asset value per share | | $ | 15.55 | |
| | | | |
Investment income: | |
Dividends | | $ | 5,318,802 | |
Dividends from affiliated money market funds | | | 9,584 | |
Total investment income | | | 5,328,386 | |
| |
Expenses: | | | | |
Advisory fees | | | 2,896,955 | |
Administrative services fees | | | 984,721 | |
Custodian fees | | | 16,111 | |
Distribution fees — Series II | | | 645,805 | |
Transfer agent fees | | | 26,427 | |
Trustees’ and officers’ fees and benefits | | | 25,282 | |
Other | | | 49,829 | |
Total expenses | | | 4,645,130 | |
Less: Fees waived | | | (18,202 | ) |
Net expenses | | | 4,626,928 | |
Net investment income | | | 701,458 | |
| |
Realized and unrealized gain (loss) from: | | | | |
Net realized gain (loss) from: | | | | |
Investment securities | | | 19,513,657 | |
Foreign currencies | | | (172 | ) |
Forward foreign currency contracts | | | 168,401 | |
| | | | 19,681,886 | |
Change in net unrealized appreciation (depreciation) of: | | | | |
Investment securities | | | (56,062,335 | ) |
Foreign currencies | | | (1,658 | ) |
Forward foreign currency contracts | | | (2,275 | ) |
| | | | (56,066,268 | ) |
Net realized and unrealized gain (loss) | | | (36,384,382 | ) |
Net increase (decrease) in net assets resulting from operations | | $ | (35,682,924 | ) |
See accompanying Notes to Financial Statements which are an integral part of the financial statements.
Invesco V.I. American Value Fund
Statement of Changes in Net Assets
For the years ended December 31, 2015 and 2014
| | | | | | | | |
| | | 2015 | | | 2014 | |
Operations: | | | | | |
Net investment income | | $ | 701,458 | | | $ | 714,909 | |
Net realized gain | | | 19,681,886 | | | | 74,535,529 | |
Change in net unrealized appreciation (depreciation) | | | (56,066,268 | ) | | | (39,221,322 | ) |
Net increase (decrease) in net assets resulting from operations | | | (35,682,924 | ) | | | 36,029,116 | |
| | |
Distributions to shareholders from net investment income: | | | | | | | | |
Series I | | | (434,781 | ) | | | (696,392 | ) |
Series ll | | | (18,546 | ) | | | (507,414 | ) |
Total distributions from net investment income | | | (453,327 | ) | | | (1,203,806 | ) |
| | |
Distributions to shareholders from net realized gains: | | | | | | | | |
Series l | | | (17,091,017 | ) | | | (12,432,585 | ) |
Series ll | | | (27,976,630 | ) | | | (21,321,269 | ) |
Total distributions from net realized gains | | | (45,067,647 | ) | | | (33,753,854 | ) |
| | |
Share transactions–net: | | | | | | | | |
Series l | | | 2,717,293 | | | | (5,402,205 | ) |
Series ll | | | (9,319,758 | ) | | | (49,400,679 | ) |
Net increase (decrease) in net assets resulting from share transactions | | | (6,602,465 | ) | | | (54,802,884 | ) |
Net increase (decrease) in net assets | | | (87,806,363 | ) | | | (53,731,428 | ) |
| | |
Net assets: | | | | | | | | |
Beginning of year | | | 423,846,796 | | | | 477,578,224 | |
End of year (includes undistributed net investment income of $651,605 and $358,554, respectively) | | $ | 336,040,433 | | | $ | 423,846,796 | |
Notes to Financial Statements
December 31, 2015
NOTE 1—Significant Accounting Policies
Invesco V.I. American Value Fund (the “Fund”) is a series portfolio of AIM Variable Insurance Funds (Invesco Variable Insurance Funds) (the “Trust”). The Trust is a Delaware statutory trust registered under the Investment Company Act of 1940, as amended (the “1940 Act”), as an open-end series management investment company consisting of twenty-four separate portfolios, (each constituting a “Fund”). The assets, liabilities and operations of each portfolio are accounted for separately. Information presented in these financial statements pertains only to the Fund. Matters affecting each Fund or class will be voted on exclusively by the shareholders of such Fund or class. Current Securities and Exchange Commission (“SEC”) guidance, however, requires participating insurance companies offering separate accounts to vote shares proportionally in accordance with the instructions of the contract owners whose investments are funded by shares of each Fund or class.
The Fund’s investment objective is to provide above-average total return over a market cycle of three to five years by investing in common stocks and other equity securities.
The Fund currently offers two classes of shares, Series I and Series II, both of which are offered to insurance company separate accounts funding variable annuity contracts and variable life insurance policies (“variable products”).
The following is a summary of the significant accounting policies followed by the Fund in the preparation of its financial statements.
| A. | Security Valuations — Securities, including restricted securities, are valued according to the following policy. |
A security listed or traded on an exchange (except convertible securities) is valued at its last sales price or official closing price as of the close of the customary trading session on the exchange where the security is principally traded, or lacking any sales or official closing price on a particular day, the security may be valued at the closing bid price on that day. Securities traded in the over-the-counter market are valued based on prices furnished by independent pricing services or market makers. When such securities are valued by an independent pricing service they may be considered fair valued. Futures contracts are valued at the final settlement price set by an exchange on which they are principally traded. Listed options are valued at the mean between the last bid and asked prices from the exchange on which they are principally traded. Options not listed on an exchange are valued by an independent source at the mean between the last bid and asked prices. For purposes of determining net asset value (“NAV”) per share, futures and option contracts generally are valued 15 minutes after the close of the customary trading session of the New York Stock Exchange (“NYSE”).
Investments in open-end and closed-end registered investment companies that do not trade on an exchange are valued at the end-of-day net asset value per share. Investments in open-end and closed-end registered investment companies that trade on an exchange are valued at the last sales price or official closing price as of the close of the customary trading session on the exchange where the security is principally traded.
Invesco V.I. American Value Fund
Debt obligations (including convertible securities) and unlisted equities are fair valued using an evaluated quote provided by an independent pricing service. Evaluated quotes provided by the pricing service may be determined without exclusive reliance on quoted prices, and may reflect appropriate factors such as institution-size trading in similar groups of securities, developments related to specific securities, dividend rate (for unlisted equities), yield (for debt obligations), quality, type of issue, coupon rate (for debt obligations), maturity (for debt obligations), individual trading characteristics and other market data. Debt obligations are subject to interest rate and credit risks. In addition, all debt obligations involve some risk of default with respect to interest and/or principal payments.
Foreign securities’ (including foreign exchange contracts) prices are converted into U.S. dollar amounts using the applicable exchange rates as of the close of the NYSE. If market quotations are available and reliable for foreign exchange-traded equity securities, the securities will be valued at the market quotations. Because trading hours for certain foreign securities end before the close of the NYSE, closing market quotations may become unreliable. If between the time trading ends on a particular security and the close of the customary trading session on the NYSE, events occur that the Adviser determines are significant and make the closing price unreliable, the Fund may fair value the security. If the event is likely to have affected the closing price of the security, the security will be valued at fair value in good faith using procedures approved by the Board of Trustees. Adjustments to closing prices to reflect fair value may also be based on a screening process of an independent pricing service to indicate the degree of certainty, based on historical data, that the closing price in the principal market where a foreign security trades is not the current value as of the close of the NYSE. Foreign securities’ prices meeting the approved degree of certainty that the price is not reflective of current value will be priced at the indication of fair value from the independent pricing service. Multiple factors may be considered by the independent pricing service in determining adjustments to reflect fair value and may include information relating to sector indices, American Depositary Receipts and domestic and foreign index futures. Foreign securities may have additional risks including exchange rate changes, potential for sharply devalued currencies and high inflation, political and economic upheaval, the relative lack of issuer information, relatively low market liquidity and the potential lack of strict financial and accounting controls and standards.
Securities for which market prices are not provided by any of the above methods may be valued based upon quotes furnished by independent sources. The last bid price may be used to value equity securities. The mean between the last bid and asked prices is used to value debt obligations, including corporate loans.
Securities for which market quotations are not readily available or became unreliable are valued at fair value as determined in good faith by or under the supervision of the Trust’s officers following procedures approved by the Board of Trustees. Issuer specific events, market trends, bid/asked quotes of brokers and information providers and other market data may be reviewed in the course of making a good faith determination of a security’s fair value.
The Fund may invest in securities that are subject to interest rate risk, meaning the risk that the prices will generally fall as interest rates rise and, conversely, the prices will generally rise as interest rates fall. Specific securities differ in their sensitivity to changes in interest rates depending on their individual characteristics. Changes in interest rates may result in increased market volatility, which may affect the value and/or liquidity of certain Fund investments.
Valuations change in response to many factors including the historical and prospective earnings of the issuer, the value of the issuer’s assets, general economic conditions, interest rates, investor perceptions and market liquidity. Because of the inherent uncertainties of valuation, the values reflected in the financial statements may materially differ from the value received upon actual sale of those investments.
| B. | Securities Transactions and Investment Income — Securities transactions are accounted for on a trade date basis. Realized gains or losses on sales are computed on the basis of specific identification of the securities sold. Interest income (net of withholding tax, if any) is recorded on the accrual basis from settlement date. Dividend income (net of withholding tax, if any) is recorded on the ex-dividend date. |
The Fund may periodically participate in litigation related to Fund investments. As such, the Fund may receive proceeds from litigation settlements. Any proceeds received are included in the Statement of Operations as realized gain (loss) for investments no longer held and as unrealized gain (loss) for investments still held.
Brokerage commissions and mark ups are considered transaction costs and are recorded as an increase to the cost basis of securities purchased and/or a reduction of proceeds on a sale of securities. Such transaction costs are included in the determination of net realized and unrealized gain (loss) from investment securities reported in the Statement of Operations and the Statement of Changes in Net Assets and the net realized and unrealized gains (losses) on securities per share in the Financial Highlights. Transaction costs are included in the calculation of the Fund’s net asset value and, accordingly, they reduce the Fund’s total returns. These transaction costs are not considered operating expenses and are not reflected in net investment income reported in the Statement of Operations and the Statement of Changes in Net Assets, or the net investment income per share and the ratios of expenses and net investment income reported in the Financial Highlights, nor are they limited by any expense limitation arrangements between the Fund and the investment adviser.
The Fund allocates income and realized and unrealized capital gains and losses to a class based on the relative net assets of each class.
| C. | Distributions — Distributions from net investment income and net realized capital gain, if any, are generally declared and paid to separate accounts of participating insurance companies annually and recorded on the ex-dividend date. |
| D. | Federal Income Taxes — The Fund intends to comply with the requirements of Subchapter M of the Internal Revenue Code of 1986, as amended (the “Internal Revenue Code”), necessary to qualify as a regulated investment company and to distribute substantially all of the Fund’s taxable earnings to shareholders. As such, the Fund will not be subject to federal income taxes on otherwise taxable income (including net realized capital gain) that is distributed to shareholders. Therefore, no provision for federal income taxes is recorded in the financial statements. |
The Fund recognizes the tax benefits of uncertain tax positions only when the position is more likely than not to be sustained. Management has analyzed the Fund’s uncertain tax positions and concluded that no liability for unrecognized tax benefits should be recorded related to uncertain tax positions. Management is not aware of any tax positions for which it is reasonably possible that the total amounts of unrecognized tax benefits will change materially in the next 12 months.
The Fund files tax returns in the U.S. Federal jurisdiction and certain other jurisdictions. Generally, the Fund is subject to examinations by such taxing authorities for up to three years after the filing of the return for the tax period.
| E. | Country Determination — For the purposes of making investment selection decisions and presentation in the Schedule of Investments, the investment adviser may determine the country in which an issuer is located and/or credit risk exposure based on various factors. These factors include the laws of the country under which the issuer is organized, where the issuer maintains a principal office, the country in which the issuer |
Invesco V.I. American Value Fund
| | derives 50% or more of its total revenues and the country that has the primary market for the issuer’s securities, as well as other criteria. Among the other criteria that may be evaluated for making this determination are the country in which the issuer maintains 50% or more of its assets, the type of security, financial guarantees and enhancements, the nature of the collateral and the sponsor organization. Country of issuer and/or credit risk exposure has been determined to be the United States of America, unless otherwise noted. |
| F. | Expenses — Fees provided for under the Rule 12b-1 plan of a particular class of the Fund and which are directly attributable to that class are charged to the operations of such class. All other expenses are allocated among the classes based on relative net assets. |
| G. | Accounting Estimates — The preparation of financial statements in conformity with accounting principles generally accepted in the United States of America (“GAAP”) requires management to make estimates and assumptions that affect the reported amounts of assets and liabilities at the date of the financial statements and the reported amounts of revenues and expenses during the reporting period including estimates and assumptions related to taxation. Actual results could differ from those estimates by a significant amount. In addition, the Fund monitors for material events or transactions that may occur or become known after the period-end date and before the date the financial statements are released to print. |
| H. | Indemnifications — Under the Trust’s organizational documents, each Trustee, officer, employee or other agent of the Trust is indemnified against certain liabilities that may arise out of the performance of their duties to the Fund. Additionally, in the normal course of business, the Fund enters into contracts, including the Fund’s servicing agreements, that contain a variety of indemnification clauses. The Fund’s maximum exposure under these arrangements is unknown as this would involve future claims that may be made against the Fund that have not yet occurred. The risk of material loss as a result of such indemnification claims is considered remote. |
| I. | Foreign Currency Translations — Foreign currency is valued at the close of the NYSE based on quotations posted by banks and major currency dealers. Portfolio securities and other assets and liabilities denominated in foreign currencies are translated into U.S. dollar amounts at date of valuation. Purchases and sales of portfolio securities (net of foreign taxes withheld on disposition) and income items denominated in foreign currencies are translated into U.S. dollar amounts on the respective dates of such transactions. The Fund does not separately account for the portion of the results of operations resulting from changes in foreign exchange rates on investments and the fluctuations arising from changes in market prices of securities held. The combined results of changes in foreign exchange rates and the fluctuation of market prices on investments (net of estimated foreign tax withholding) are included with the net realized and unrealized gain or loss from investments in the Statement of Operations. Reported net realized foreign currency gains or losses arise from (1) sales of foreign currencies, (2) currency gains or losses realized between the trade and settlement dates on securities transactions, and (3) the difference between the amounts of dividends, interest, and foreign withholding taxes recorded on the Fund’s books and the U.S. dollar equivalent of the amounts actually received or paid. Net unrealized foreign currency gains and losses arise from changes in the fair values of assets and liabilities, other than investments in securities at fiscal period end, resulting from changes in exchange rates. |
The Fund may invest in foreign securities, which may be subject to foreign taxes on income, gains on investments or currency repatriation, a portion of which may be recoverable. Foreign taxes, if any, are recorded based on the tax regulations and rates that exist in the foreign markets in which the Fund invests and are shown in the Statement of Operations.
| J. | Forward Foreign Currency Contracts — The Fund may engage in foreign currency transactions either on a spot (i.e. for prompt delivery and settlement) basis, or through forward foreign currency contracts, to manage or minimize currency or exchange rate risk. |
The Fund may also enter into forward foreign currency contracts for the purchase or sale of a security denominated in a foreign currency in order to “lock in” the U.S. dollar price of that security, or the Fund may also enter into forward foreign currency contracts that do not provide for physical settlement of the two currencies, but instead are settled by a single cash payment calculated as the difference between the agreed upon exchange rate and the spot rate at settlement based upon an agreed upon notional amount (non-deliverable forwards). The Fund will set aside liquid assets in an amount equal to daily mark-to-market obligation for forward foreign currency contracts.
A forward foreign currency contract is an obligation between two parties (“Counterparties”) to purchase or sell a specific currency for an agreed-upon price at a future date. The use of forward foreign currency contracts does not eliminate fluctuations in the price of the underlying securities the Fund owns or intends to acquire but establishes a rate of exchange in advance. Fluctuations in the value of these contracts are measured by the difference in the contract date and reporting date exchange rates and are recorded as unrealized appreciation (depreciation) until the contracts are closed. When the contracts are closed, realized gains (losses) are recorded. Realized and unrealized gains (losses) on the contracts are included in the Statement of Operations. The primary risks associated with forward foreign currency contracts include failure of the Counterparty to meet the terms of the contract and the value of the foreign currency changing unfavorably. These risks may be in excess of the amounts reflected in the Statement of Assets and Liabilities.
NOTE 2—Advisory Fees and Other Fees Paid to Affiliates
The Trust has entered into a master investment advisory agreement with Invesco Advisers, Inc. (the “Adviser” or “Invesco”). Under the terms of the investment advisory agreement, the Fund pays an advisory fee to the Adviser based on the annual rate of the Fund’s average daily net assets as follows:
| | | | |
| Average Daily Net Assets | | Rate | |
First $1 billion | | | 0.72% | |
Over $1 billion | | | 0.65% | |
For the year ended December 31, 2015, the effective advisory fee incurred by the Fund was 0.72%.
Under the terms of a master sub-advisory agreement between the Adviser and each of Invesco Asset Management Deutschland GmbH, Invesco Asset Management Limited, Invesco Asset Management (Japan) Limited, Invesco Hong Kong Limited, Invesco Senior Secured Management, Inc. and Invesco Canada Ltd. (collectively, the “Affiliated Sub-Advisers”) the Adviser, not the Fund, may pay 40% of the fees paid to the Adviser to any such Affiliated Sub-Adviser(s) that provide(s) discretionary investment management services to the Fund based on the percentage of assets allocated to such Affiliated Sub-Adviser(s).
Invesco V.I. American Value Fund
The Adviser has contractually agreed, through at least June 30, 2016, to waive advisory fees and/or reimburse expenses of all shares to the extent necessary to limit total annual fund operating expenses after fee waiver and/or expense reimbursement (excluding certain items discussed below) of Series I shares to 2.00% and Series II shares to 2.25% of average daily net assets. In determining the Adviser’s obligation to waive advisory fees and/or reimburse expenses, the following expenses are not taken into account, and could cause the total annual fund operating expenses after fee waiver and/or expense reimbursement to exceed the numbers reflected above: (1) interest; (2) taxes; (3) dividend expense on short sales; (4) extraordinary or non-routine items, including litigation expenses; and (5) expenses that the Fund has incurred but did not actually pay because of an expense offset arrangement. Unless Invesco continues the fee waiver agreement, it will terminate on June 30, 2016. The fee waiver agreement cannot be terminated during its term. The Adviser did not waive fees and/or reimburse expenses during the period under this expense limitation.
Further, the Adviser has contractually agreed, through at least June 30, 2017, to waive the advisory fee payable by the Fund in an amount equal to 100% of the net advisory fees the Adviser receives from the affiliated money market funds on investments by the Fund of uninvested cash in such affiliated money market funds.
For the year ended December 31, 2015, the Adviser waived advisory fees of $18,202.
The Trust has entered into a master administrative services agreement with Invesco pursuant to which the Fund has agreed to pay Invesco a fee for costs incurred in providing accounting services and fund administrative services to the Fund and to reimburse Invesco for administrative services fees paid to insurance companies that have agreed to provide services to the participants of separate accounts. These administrative services provided by the insurance companies may include, among other things: the printing of prospectuses, financial reports and proxy statements and the delivery of the same to existing participants; the maintenance of master accounts; the facilitation of purchases and redemptions requested by the participants; and the servicing of participants’ accounts. Pursuant to such agreement, for the year ended December 31, 2015, Invesco was paid $97,541 for accounting and fund administrative services and reimbursed $887,180 for services provided by insurance companies.
The Trust has entered into a transfer agency and service agreement with Invesco Investment Services, Inc. (“IIS”) pursuant to which the Fund has agreed to pay IIS a fee for providing transfer agency and shareholder services to the Fund and reimburse IIS for certain expenses incurred by IIS in the course of providing such services. For the year ended December 31, 2015, expenses incurred under the agreement are shown in the Statement of Operations as Transfer agent fees.
The Trust has entered into a master distribution agreement with Invesco Distributors, Inc. (“IDI”) to serve as the distributor for the Fund. The Trust has adopted a plan pursuant to Rule 12b-1 under the 1940 Act with respect to the Fund’s Series II shares (the “Plan”). The Fund, pursuant to the Plan, pays IDI compensation at the annual rate of 0.25% of the Fund’s average daily net assets of Series II shares. Of the Plan payments, up to 0.25% of the average daily net assets of the Series II shares may be paid to insurance companies who furnish continuing personal shareholder services to customers who purchase and own Series II shares of the Fund. For the year ended December 31, 2015, expenses incurred under the Plan are detailed in the Statement of Operations as Distribution fees.
For the year ended December 31, 2015, the Fund incurred $3,123 in brokerage commissions with Invesco Capital Markets, Inc., an affiliate of the Adviser and IDI, for portfolio transactions executed on behalf of the Fund.
Certain officers and trustees of the Trust are officers and directors of the Adviser, IIS and/or IDI.
NOTE 3—Additional Valuation Information
GAAP defines fair value as the price that would be received to sell an asset or paid to transfer a liability in an orderly transaction between market participants at the measurement date, under current market conditions. GAAP establishes a hierarchy that prioritizes the inputs to valuation methods, giving the highest priority to readily available unadjusted quoted prices in an active market for identical assets (Level 1) and the lowest priority to significant unobservable inputs (Level 3), generally when market prices are not readily available or are unreliable. Based on the valuation inputs, the securities or other investments are tiered into one of three levels. Changes in valuation methods may result in transfers in or out of an investment’s assigned level:
| | Level 1 — | Prices are determined using quoted prices in an active market for identical assets. |
| | Level 2 — | Prices are determined using other significant observable inputs. Observable inputs are inputs that other market participants may use in pricing a security. These may include quoted prices for similar securities, interest rates, prepayment speeds, credit risk, yield curves, loss severities, default rates, discount rates, volatilities and others. |
| | Level 3 — | Prices are determined using significant unobservable inputs. In situations where quoted prices or observable inputs are unavailable (for example, when there is little or no market activity for an investment at the end of the period), unobservable inputs may be used. Unobservable inputs reflect the Fund’s own assumptions about the factors market participants would use in determining fair value of the securities or instruments and would be based on the best available information. |
The following is a summary of the tiered valuation input levels, as of December 31, 2015. The level assigned to the securities valuations may not be an indication of the risk or liquidity associated with investing in those securities. Because of the inherent uncertainties of valuation, the values reflected in the financial statements may materially differ from the value received upon actual sale of those investments.
| | | | | | | | | | | | | | | | |
| | | Level 1 | | | Level 2 | | | Level 3 | | | Total | |
Equity Securities | | $ | 336,022,460 | | | $ | — | | | $ | — | | | $ | 336,022,460 | |
Forward Foreign Currency Contracts* | | | — | | | | 46,438 | | | | — | | | | 46,438 | |
Total Investments | | $ | 336,022,460 | | | $ | 46,438 | | | $ | — | | | $ | 336,068,898 | |
| * | Unrealized appreciation. |
Invesco V.I. American Value Fund
NOTE 4—Derivative Investments
Value of Derivative Investments at Period-End
The table below summarizes the value of the Fund’s derivative investments, detailed by primary risk exposure, held as of December 31, 2015:
| | | | | | | | |
| | | Value | |
| Risk Exposure/Derivative Type | | Assets | | | Liabilities | |
Currency risk: | | | | | | | | |
Forward foreign currency contracts(a) | | $ | 46,438 | | | $ | — | |
| (a) | Values are disclosed on the Statement of Assets and Liabilities under the caption Unrealized appreciation on forward foreign currency contracts outstanding. |
Effect of Derivative Investments for the year ended December 31, 2015
The table below summarizes the gains (losses) on derivative investments, detailed by primary risk exposure, recognized in earnings during the period:
| | | | |
| | | Location of Gain (Loss) on
Statement of Operations | |
| | Forward Foreign
Currency Contracts | |
Realized Gain: | | | | |
Currency risk | | $ | 168,401 | |
Change in Unrealized Appreciation (Depreciation): | | | | |
Currency risk | | | (2,275 | ) |
Total | | $ | 166,126 | |
The table below summarizes the average notional value of forward foreign currency contracts outstanding during the year.
| | | | |
| | | Forward Foreign
Currency Contracts | |
Average notional value | | $ | 6,401,900 | |
| | | | | | | | | | | | | | | | | | | | | | | | | | |
| Open Forward Foreign Currency Contracts | |
Settlement
Date | | | | Contract to | | | Notional
Value | | | Unrealized
Appreciation | |
| | Counterparty | | Deliver | | | Receive | | | |
01/15/16 | | Bank of New York Mellon (The) | | | GBP | | | | 866,404 | | | | USD | | | | 1,300,264 | | | $ | 1,277,262 | | | $ | 23,002 | |
01/15/16 | | State Street Bank and Trust Co. | | | GBP | | | | 866,404 | | | | USD | | | | 1,300,698 | | | | 1,277,262 | | | | 23,436 | |
Total open forward foreign currency contracts — Currency Risk | | | | | | | $ | 46,438 | |
Currency Abbreviations:
| | |
| GBP | | – British Pound Sterling |
| USD | | – U.S. Dollar |
Offsetting Assets and Liabilities
Accounting Standards Update (“ASU”) No. 2011-11, Disclosures about Offsetting Assets and Liabilities, which was subsequently clarified in Financial Accounting Standards Board ASU 2013-01 “Clarifying the Scope of Disclosures about Offsetting Assets and Liabilities” is intended to enhance disclosures about financial instruments and derivative instruments that are subject to offsetting arrangements on the Statement of Assets and Liabilities and to enable investors to better understand the effect of those arrangements on the Fund’s financial position. In order for an arrangement to be eligible for netting, the Fund must have a basis to conclude that such netting arrangements are legally enforceable. The Fund enters into netting agreements and collateral agreements in an attempt to reduce the Fund’s Counterparty credit risk by providing for a single net settlement with a Counterparty of all financial transactions covered by the agreement in an event of default as defined under such agreement.
The following tables present derivative instruments that are either subject to an enforceable netting agreement or offset by collateral arrangements as of December 31, 2015.
| | | | | | | | | | | | | | | | | | | | |
| Counterparty | | Gross amounts
of Recognized
Assets | | | Gross Amounts Not Offset in the Statement
of Assets and Liabilities | | | Net
Amount | |
| | | Financial
Instruments | | | Collateral Received | | |
| | | | Non-Cash | | | Cash | | |
Bank of New York Mellon (The) | | $ | 23,002 | | | $ | — | | | $ | — | | | $ | — | | | $ | 23,002 | |
State Street Bank and Trust Co. | | | 23,436 | | | | — | | | | — | | | | — | | | | 23,436 | |
Total | | $ | 46,438 | | | $ | — | | | $ | — | | | $ | — | | | $ | 46,438 | |
Invesco V.I. American Value Fund
NOTE 5—Trustees’ and Officers’ Fees and Benefits
Trustees’ and Officers’ Fees and Benefits include amounts accrued by the Fund to pay remuneration to certain Trustees and Officers of the Fund. Trustees have the option to defer compensation payable by the Fund, and Trustees’ and Officers’ Fees and Benefits also include amounts accrued by the Fund to fund such deferred compensation amounts. Those Trustees who defer compensation have the option to select various Invesco Funds in which their deferral accounts shall be deemed to be invested. Finally, certain current Trustees were eligible to participate in a retirement plan that provided for benefits to be paid upon retirement to Trustees over a period of time based on the number of years of service. The Fund may have certain former Trustees who also participate in a retirement plan and receive benefits under such plan. Trustees’ and Officers’ Fees and Benefits include amounts accrued by the Fund to fund such retirement benefits. Obligations under the deferred compensation and retirement plans represent unsecured claims against the general assets of the Fund.
NOTE 6—Cash Balances
The Fund is permitted to temporarily carry a negative or overdrawn balance in its account with State Street Bank and Trust Company, the custodian bank. Such balances, if any at period end, are shown in the Statement of Assets and Liabilities under the payable caption Amount due custodian. To compensate the custodian bank for such overdrafts, the overdrawn Fund may either (1) leave funds as a compensating balance in the account so the custodian bank can be compensated by earning the additional interest; or (2) compensate by paying the custodian bank at a rate agreed upon by the custodian bank and Invesco, not to exceed the contractually agreed upon rate.
NOTE 7—Distributions to Shareholders and Tax Components of Net Assets
Tax Character of Distributions to Shareholders Paid During the Fiscal Years Ended December 31, 2015 and 2014:
| | | | | | | | |
| | | 2015 | | | 2014 | |
Ordinary income | | $ | 3,252,317 | | | $ | 1,203,806 | |
Long-term capital gain | | | 42,268,657 | | | | 33,753,854 | |
Total distributions | | $ | 45,520,974 | | | $ | 34,957,660 | |
Tax Components of Net Assets at Period-End:
| | | | |
| | | 2015 | |
Undistributed ordinary income | | $ | 709,236 | |
Undistributed long-term gain | | | 20,735,186 | |
Net unrealized appreciation — investments | | | 24,367,954 | |
Net unrealized appreciation (depreciation) — other investments | | | (3,005 | ) |
Temporary book/tax differences | | | (299,003 | ) |
Shares of beneficial interest | | | 290,530,065 | |
Total net assets | | $ | 336,040,433 | |
The difference between book-basis and tax-basis unrealized appreciation (depreciation) is due to differences in the timing of recognition of gains and losses on investments for tax and book purposes. The Fund’s net unrealized appreciation difference is attributable primarily to wash sales.
The temporary book/tax differences are a result of timing differences between book and tax recognition of income and/or expenses. The Fund’s temporary book/tax differences are the result of the trustee deferral of compensation and retirement plan benefits.
Capital loss carryforward is calculated and reported as of a specific date. Results of transactions and other activity after that date may affect the amount of capital loss carryforward actually available for the Fund to utilize. Capital losses generated in years beginning after December 22, 2010 can be carried forward for an unlimited period, whereas previous losses expire in eight tax years. Capital losses with an expiration period may not be used to offset capital gains until all net capital losses without an expiration date have been utilized. Capital loss carryforwards with no expiration date will retain their character as either short-term or long-term capital losses instead of as short-term capital losses as under prior law. The ability to utilize capital loss carryforwards in the future may be limited under the Internal Revenue Code and related regulations based on the results of future transactions.
The Fund does not have a capital loss carryforward as of December 31, 2015.
NOTE 8—Investment Securities
The aggregate amount of investment securities (other than short-term securities, U.S. Treasury obligations and money market funds, if any) purchased and sold by the Fund during the year ended December 31, 2015 was $99,847,207 and $145,445,202, respectively. Cost of investments on a tax basis includes the adjustments for financial reporting purposes as of the most recently completed federal income tax reporting period-end.
| | | | |
| Unrealized Appreciation (Depreciation) of Investment Securities on a Tax Basis | |
Aggregate unrealized appreciation of investment securities | | $ | 58,918,519 | |
Aggregate unrealized (depreciation) of investment securities | | | (34,550,565 | ) |
Net unrealized appreciation of investment securities | | $ | 24,367,954 | |
Cost of investments for tax purposes is $311,654,506.
Invesco V.I. American Value Fund
NOTE 9—Reclassification of Permanent Differences
Primarily as a result of differing book/tax treatment of real estate investment trust distributions on December 31, 2015, undistributed net investment income was increased by $44,920, and undistributed net realized gain was decreased by $44,920. This reclassification had no effect on the net assets of the Fund.
NOTE 10—Share Information
| | | | | | | | | | | | | | | | |
| | | Summary of Share Activity | |
| | | Years ended December 31, | |
| | | 2015(a) | | | 2014 | |
| | | Shares | | | Amount | | | Shares | | | Amount | |
Sold: | | | | | | | | | | | | | | | | |
Series I | | | 620,709 | | | $ | 11,648,963 | | | | 740,950 | | | $ | 14,637,823 | |
Series II | | | 2,540,649 | | | | 47,863,159 | | | | 4,478,574 | | | | 89,149,298 | |
| | | | |
Issued as reinvestment of dividends: | | | | | | | | | | | | | | | | |
Series I | | | 1,088,559 | | | | 17,525,798 | | | | 691,727 | | | | 13,128,977 | |
Series II | | | 1,752,985 | | | | 27,995,176 | | | | 1,159,250 | | | | 21,828,683 | |
| | | | |
Reacquired: | | | | | | | | | | | | | | | | |
Series I | | | (1,373,907 | ) | | | (26,457,468 | ) | | | (1,642,472 | ) | | | (33,169,005 | ) |
Series II | | | (4,479,285 | ) | | | (85,178,093 | ) | | | (8,183,599 | ) | | | (160,378,660 | ) |
Net increase (decrease) in share activity | | | 149,710 | | | $ | (6,602,465 | ) | | | (2,755,570 | ) | | $ | (54,802,884 | ) |
| (a) | There are entities that are record owners of more than 5% of the outstanding shares of the Fund and in the aggregate own 64% of the outstanding shares of the Fund. The Fund and the Fund’s principal underwriter or adviser, are parties to participation agreements with these entities whereby these entities sell units of interest in separate accounts funding variable products that are invested in the Fund. The Fund, Invesco and/or Invesco affiliates may make payments to these entities, which are considered to be related to the Fund, for providing services to the Fund, Invesco and/or Invesco affiliates including but not limited to services such as, securities brokerage, third party record keeping and account servicing and administrative services. The Fund has no knowledge as to whether all or any portion of the shares owned of record by these entities are also owned beneficially. |
NOTE 11—Financial Highlights
The following schedule presents financial highlights for a share of the Fund outstanding throughout the periods indicated.
| | | | | | | | | | | | | | | | | | | | | | | | | | | | | | | | | | | | | | | | | | | | | | | | | | | | | | | | |
| | | Net asset
value,
beginning
of period | | | Net
investment
income(a) | | | Net gains
(losses)
on securities
(both
realized and
unrealized) | | | Total from
investment
operations | | | Dividends
from net
investment
income | | | Distributions
from net
realized
gains | | | Total
distributions | | | Net asset
value, end
of period | | | Total
return(b) | | | Net assets,
end of period
(000’s omitted) | | | Ratio of
expenses
to average
net assets
with fee waivers
and/or expenses
absorbed | | | Ratio of
expenses
to average net
assets without
fee waivers
and/or expenses
absorbed | | | Ratio of net
investment
income
to average
net assets | | | Portfolio
turnover(c) | |
Series I | |
Year ended 12/31/15 | | $ | 19.92 | | | $ | 0.06 | | | $ | (1.82 | ) | | $ | (1.76 | ) | | $ | (0.06 | ) | | $ | (2.41 | ) | | $ | (2.47 | ) | | $ | 15.69 | | | | (9.13 | )% | | $ | 125,686 | | | | 0.99 | %(d) | | | 0.99 | %(d) | | | 0.33 | %(d) | | | 26 | % |
Year ended 12/31/14 | | | 19.89 | | | | 0.07 | | | | 1.78 | | | | 1.85 | | | | (0.10 | ) | | | (1.72 | ) | | | (1.82 | ) | | | 19.92 | | | | 9.75 | | | | 152,938 | | | | 0.99 | | | | 1.00 | | | | 0.32 | | | | 48 | |
Year ended 12/31/13 | | | 14.91 | | | | 0.07 | | | | 5.03 | | | | 5.10 | | | | (0.12 | ) | | | — | | | | (0.12 | ) | | | 19.89 | | | | 34.27 | | | | 156,824 | | | | 0.99 | | | | 1.00 | | | | 0.39 | | | | 42 | |
Year ended 12/31/12 | | | 12.81 | | | | 0.12 | | | | 2.08 | | | | 2.20 | | | | (0.10 | ) | | | — | | | | (0.10 | ) | | | 14.91 | | | | 17.21 | | | | 131,233 | | | | 0.99 | | | | 1.00 | | | | 0.86 | | | | 26 | |
Year ended 12/31/11 | | | 12.79 | | | | 0.10 | | | | 0.01 | | | | 0.11 | | | | (0.09 | ) | | | — | | | | (0.09 | ) | | | 12.81 | | | | 1.00 | | | | 129,658 | | | | 0.96 | | | | 0.97 | | | | 0.80 | | | | 30 | |
Series II | | | | | | | | | | | | | | | | | | | | | | | | | | | | | | | | | | | | | | | | | | | | | | | | | | | | | | | | |
Year ended 12/31/15 | | | 19.75 | | | | 0.02 | | | | (1.80 | ) | | | (1.78 | ) | | | (0.01 | ) | | | (2.41 | ) | | | (2.42 | ) | | | 15.55 | | | | (9.36 | ) | | | 210,354 | | | | 1.24 | (d) | | | 1.24 | (d) | | | 0.08 | (d) | | | 26 | |
Year ended 12/31/14 | | | 19.73 | | | | 0.01 | | | | 1.77 | | | | 1.78 | | | | (0.04 | ) | | | (1.72 | ) | | | (1.76 | ) | | | 19.75 | | | | 9.48 | | | | 270,908 | | | | 1.24 | | | | 1.25 | | | | 0.07 | | | | 48 | |
Year ended 12/31/13 | | | 14.81 | | | | 0.03 | | | | 4.99 | | | | 5.02 | | | | (0.10 | ) | | | — | | | | (0.10 | ) | | | 19.73 | | | | 33.93 | | | | 320,754 | | | | 1.24 | | | | 1.25 | | | | 0.14 | | | | 42 | |
Year ended 12/31/12 | | | 12.74 | | | | 0.10 | | | | 2.06 | | | | 2.16 | | | | (0.09 | ) | | | — | | | | (0.09 | ) | | | 14.81 | | | | 16.98 | | | | 220,711 | | | | 1.17 | | | | 1.25 | | | | 0.68 | | | | 26 | |
Year ended 12/31/11 | | | 12.72 | | | | 0.09 | | | | 0.01 | | | | 0.10 | | | | (0.08 | ) | | | — | | | | (0.08 | ) | | | 12.74 | | | | 0.91 | | | | 163,194 | | | | 1.06 | | | | 1.22 | | | | 0.70 | | | | 30 | |
| (a) | Calculated using average shares outstanding. |
| (b) | Includes adjustments in accordance with accounting principles generally accepted in the United States of America and as such, the net asset value for financial reporting purposes and the returns based upon those net asset values may differ from the net asset value and returns for shareholder transactions. Total returns are not annualized for periods less than one year, if applicable and do not reflect charges assessed in connection with a variable product, which if included would reduce total returns. |
| (c) | Portfolio turnover is calculated at the fund level and is not annualized for periods less than one year, if applicable. |
| (d) | Ratios are based on average daily net assets (000’s omitted) of $144,033 and $258,322 for Series I and Series II shares, respectively. |
Invesco V.I. American Value Fund
Report of Independent Registered Public Accounting Firm
To the Board of Trustees of AIM Variable Insurance Funds (Invesco Variable Insurance Funds)
and Shareholders of Invesco V.I. American Value Fund:
In our opinion, the accompanying statement of assets and liabilities, including the schedule of investments, and the related statements of operations and of changes in net assets and the financial highlights present fairly, in all material respects, the financial position of Invesco V.I. American Value Fund (one of the funds constituting AIM Variable Insurance Funds (Invesco Variable Insurance Funds), hereafter referred to as the “Fund”) at December 31, 2015, the results of its operations for the year then ended, the changes in its net assets for each of the two years in the period then ended and the financial highlights for each of the five years in the period then ended, in conformity with accounting principles generally accepted in the United States of America. These financial statements and financial highlights (hereafter referred to as “financial statements”) are the responsibility of the Fund’s management. Our responsibility is to express an opinion on these financial statements based on our audits. We conducted our audits of these financial statements in accordance with the standards of the Public Company Accounting Oversight Board (United States). Those standards require that we plan and perform the audit to obtain reasonable assurance about whether the financial statements are free of material misstatement. An audit includes examining, on a test basis, evidence supporting the amounts and disclosures in the financial statements, assessing the accounting principles used and significant estimates made by management, and evaluating the overall financial statement presentation. We believe that our audits, which included confirmation of securities at December 31, 2015 by correspondence with the custodian and brokers, and the application of alternative auditing procedures where confirmations of security purchases have not been received, provide a reasonable basis for our opinion.
PRICEWATERHOUSECOOPERS LLP
Houston, Texas
February 15, 2016
Invesco V.I. American Value Fund
Calculating your ongoing Fund expenses
Example
As a shareholder of the Fund, you incur ongoing costs, including management fees; distribution and/or service fees (12b-1); and other Fund expenses. This example is intended to help you understand your ongoing costs (in dollars) of investing in the Fund and to compare these costs with ongoing costs of investing in other mutual funds. The example is based on an investment of $1,000 invested at the beginning of the period and held for the entire period July 1, 2015 through December 31, 2015.
The actual and hypothetical expenses in the examples below do not represent the effect of any fees or other expenses assessed in connection with a variable product; if they did, the expenses shown would be higher while the ending account values shown would be lower.
Actual expenses
The table below provides information about actual account values and actual expenses. You may use the information in this table, together with the amount you invested, to estimate the expenses that you paid over the period. Simply divide your account value by $1,000 (for example, an $8,600 account value divided by $1,000 = 8.6), then multiply the result by the number in the table under the heading entitled “Actual Expenses Paid During Period” to estimate the expenses you paid on your account during this period.
Hypothetical example for comparison purposes
The table below also provides information about hypothetical account values and hypothetical expenses based on the Fund’s actual expense ratio and an assumed rate of return of 5% per year before expenses, which is not the Fund’s actual return.
The hypothetical account values and expenses may not be used to estimate the actual ending account balance or expenses you paid for the period. You may use this information to compare the ongoing costs of investing in the Fund and other funds. To do so, compare this 5% hypothetical example with the 5% hypothetical examples that appear in the shareholder reports of the other funds.
Please note that the expenses shown in the table are meant to highlight your ongoing costs. Therefore, the hypothetical information is useful in comparing ongoing costs, and will not help you determine the relative total costs of owning different funds.
| | | | | | | | | | | | | | | | | | | | | | | | |
| Class | | Beginning
Account Value
(07/01/15) | | | ACTUAL | | | HYPOTHETICAL
(5% annual return before expenses) | | | Annualized
Expense Ratio | |
| | | Ending
Account Value
(12/31/15)1 | | | Expenses Paid During Period2 | | | Ending Account Value
(12/31/15) | | | Expenses Paid During
Period2 | | |
Series I | | $ | 1,000.00 | | | $ | 863.20 | | | $ | 4.70 | | | $ | 1,020.16 | | | $ | 5.09 | | | | 1.00 | % |
Series II | | | 1,000.00 | | | | 862.30 | | | | 5.87 | | | | 1,018.90 | | | | 6.36 | | | | 1.25 | |
| 1 | The actual ending account value is based on the actual total return of the Fund for the period July 1, 2015 through December 31, 2015, after actual expenses and will differ from the hypothetical ending account value which is based on the Fund’s expense ratio and a hypothetical annual return of 5% before expenses. |
| 2 | Expenses are equal to the Fund’s annualized expense ratio as indicated above multiplied by the average account value over the period, multiplied by 184/365 to reflect the most recent fiscal half year. |
Invesco V.I. American Value Fund
Tax Information
Form 1099-DIV, Form 1042-S and other year–end tax information provide shareholders with actual calendar year amounts that should be included in their tax returns. Shareholders should consult their tax advisors.
The following distribution information is being provided as required by the Internal Revenue Code or to meet a specific state’s requirement.
The Fund designates the following amounts or, if subsequently determined to be different, the maximum amount allowable for its fiscal year ended December 31, 2015:
| | | | |
Federal and State Income Tax | |
Long-Term Capital Gain Distributions | | $ | 42,268,657 | |
Corporate Dividends Received Deduction* | | | 100 | % |
U.S. Treasury Obligations* | | | 0.00 | % |
| | * | The above percentages are based on ordinary income dividends paid to shareholders during the Fund’s fiscal year. |
Invesco V.I. American Value Fund
Trustees and Officers
The address of each trustee and officer is AIM Variable Insurance Funds (Invesco Variable Insurance Funds) (the “Trust”), 11 Greenway Plaza, Suite 1000, Houston, Texas 77046-1173. The trustees serve for the life of the Trust, subject to their earlier death, incapacitation, resignation, retirement or removal as more specifically provided in the Trust’s organizational documents. Each officer serves for a one year term or until their successors are elected and qualified. Column two below includes length of time served with predecessor entities, if any.
| | | | | | | | |
Name, Year of Birth and
Position(s) Held with the Trust | | Trustee and/
or Officer Since | | Principal Occupation(s)
During Past 5 Years | | Number of Funds in Fund Complex Overseen by Trustee | | Other Directorship(s) Held by Trustee During Past 5 Years |
| Interested Persons | | | | | | | | |
| Martin L. Flanagan1 — 1960 Trustee | | 2007 | | Executive Director, Chief Executive Officer and President, Invesco Ltd. (ultimate parent of Invesco and a global investment management firm); Advisor to the Board, Invesco Advisers, Inc. (formerly known as Invesco Institutional (N.A.), Inc.); Trustee, The Invesco Funds; Vice Chair, Investment Company Institute; and Member of Executive Board, SMU Cox School of Business Formerly: Chairman and Chief Executive Officer, Invesco Advisers, Inc. (registered investment adviser); Director, Chairman, Chief Executive Officer and President, IVZ Inc. (holding company), INVESCO Group Services, Inc. (service provider) and Invesco North American Holdings, Inc. (holding company); Director, Chief Executive Officer and President, Invesco Holding Company Limited (parent of Invesco and a global investment management firm); Director, Invesco Ltd.; Chairman, Investment Company Institute and President, Co-Chief Executive Officer, Co-President, Chief Operating Officer and Chief Financial Officer, Franklin Resources, Inc. (global investment management organization) | | 146 | | None |
Philip A. Taylor2 — 1954 Trustee, President and Principal Executive Officer | | 2006 | | Head of North American Retail and Senior Managing Director, Invesco Ltd.; Director, Co-Chairman, Co-President and Co-Chief Executive Officer, Invesco Advisers, Inc. (formerly known as Invesco Institutional (N.A.), Inc.) (registered investment adviser); Director, Chairman, Chief Executive Officer and President, Invesco Management Group, Inc. (formerly known as Invesco Aim Management Group, Inc.) (financial services holding company); Director and Chairman, Invesco Investment Services, Inc. (formerly known as Invesco Aim Investment Services, Inc.) (registered transfer agent) Chief Executive Officer, Invesco Corporate Class Inc. (corporate mutual fund company) Director, Chairman and Chief Executive Officer, Invesco Canada Ltd. (formerly known as Invesco Trimark Ltd./Invesco Trimark Ltèe) (registered investment adviser and registered transfer agent); Trustee, President and Principal Executive Officer, The Invesco Funds (other than AIM Treasurer’s Series Trust (Invesco Treasurer’s Series Trust), Short-Term Investments Trust and Invesco Management Trust); Trustee and Executive Vice President, The Invesco Funds (AIM Treasurer’s Series Trust (Invesco Treasurer’s Series Trust), Short-Term Investments Trust and Invesco Management Trust only); Director, Invesco Investment Advisers LLC (formerly known as Van Kampen Asset Management); Director, Chief Executive Officer and President, Van Kampen Exchange Corp. Formerly: Director and President, INVESCO Funds Group, Inc. (registered investment adviser and registered transfer agent); Director and Chairman, IVZ Distributors, Inc. (formerly known as INVESCO Distributors, Inc.) (registered broker dealer); Director, President and Chairman, Invesco Inc. (holding company), Invesco Canada Holdings Inc. (holding company), Trimark Investments Ltd./Placements Trimark Ltèe and Invesco Financial Services Ltd/Services Financiers Invesco Ltèe; Chief Executive Officer, Invesco Canada Fund Inc (corporate mutual fund company); Director and Chairman, Van Kampen Investor Services Inc.; Director, Chief Executive Officer and President, 1371 Preferred Inc. (holding company) and Van Kampen Investments Inc.; Director and President, AIM GP Canada Inc. (general partner for limited partnerships) and Van Kampen Advisors, Inc.; Director and Chief Executive Officer, Invesco Trimark Dealer Inc. (registered broker dealer); Director, Invesco Distributors, Inc. (formerly known as Invesco Aim Distributors, Inc.) (registered broker dealer); Manager, Invesco PowerShares Capital Management LLC; Director, Chief Executive Officer and President, Invesco Advisers, Inc.; Director, Chairman, Chief Executive Officer and President, Invesco Aim Capital Management, Inc.; President, Invesco Trimark Dealer Inc. and Invesco Trimark Ltd./Invesco Trimark Ltèe; Director and President, AIM Trimark Corporate Class Inc. and AIM Trimark Canada Fund Inc.; Senior Managing Director, Invesco Holding Company Limited; Director and Chairman, Fund Management Company (former registered broker dealer); President and Principal Executive Officer, The Invesco Funds (AIM Treasurer’s Series Trust (Invesco Treasurer’s Series Trust), and Short-Term Investments Trust only); President, AIM Trimark Global Fund Inc. and AIM Trimark Canada Fund Inc | | 146 | | None |
| 1 | Mr. Flanagan is considered an interested person (within the meaning of Section 2(a)(19) of the 1940 Act) of the Trust because he is an officer of the Adviser to the Trust, and an officer and a director of Invesco Ltd., ultimate parent of the Adviser. |
| 2 | Mr. Taylor is considered an interested person (within the meaning of Section 2(a)(19) of the 1940 Act) of the Trust because he is an officer and a director of the Adviser. |
Invesco V.I. American Value Fund
Trustees and Officers—(continued)
| | | | | | | | |
Name, Year of Birth and
Position(s) Held with the Trust | | Trustee and/
or Officer Since | | Principal Occupation(s)
During Past 5 Years | | Number of Funds in Fund Complex Overseen by Trustee | | Other Directorship(s)
Held by Trustee During Past 5 Years |
| Independent Trustees | | | | | | | | |
Bruce L. Crockett — 1944 Trustee and Chair | | 2003 | | Chairman, Crockett Technologies Associates (technology consulting company) Formerly: Director, Captaris (unified messaging provider); Director, President and Chief Executive Officer, COMSAT Corporation; Chairman, Board of Governors of INTELSAT (international communications company); ACE Limited (insurance company); Independent Directors Council and Investment Company Institute | | 146 | | ALPS (Attorneys Liability Protection Society) (insurance company) and Globe Specialty Metals, Inc. (metallurgical company) |
David C. Arch — 1945 Trustee | | 2010 | | Chairman of Blistex Inc., a consumer health care products manufacturer | | 146 | | Board member of the Illinois Manufacturers’ Association; Member of the Board of Visitors, Institute for the Humanities, University of Michigan |
James T. Bunch — 1942 Trustee | | 2000 | | Managing Member, Grumman Hill Group LLC (family office/private equity investments) Formerly: Chairman of the Board of Trustees, Evans Scholars Foundation and Chairman, Board of Governors, Western Golf Association | | 146 | | Trustee, Evans Scholars Foundation; and Chairman of the Board, Denver Film Society |
Albert R. Dowden — 1941 Trustee | | 2003 | | Director of a number of public and private business corporations, including the Boss Group, Ltd. (private investment and management); Nature’s Sunshine Products, Inc. and Reich & Tang Funds (5 portfolios) (registered investment company) Formerly: Director, Homeowners of America Holding Corporation/Homeowners of America Insurance Company (property casualty company); Director, Continental Energy Services, LLC (oil and gas pipeline service); Director, CompuDyne Corporation (provider of product and services to the public security market) and Director, Annuity and Life Re (Holdings), Ltd. (reinsurance company); Director, President and Chief Executive Officer, Volvo Group North America, Inc.; Senior Vice President, AB Volvo; Director of various public and private corporations; Chairman, DHJ Media, Inc.; Director, Magellan Insurance Company; and Director, The Hertz Corporation, Genmar Corporation (boat manufacturer), National Media Corporation; Advisory Board of Rotary Power International (designer, manufacturer, and seller of rotary power engines); and Chairman, Cortland Trust, Inc. (registered investment company) | | 146 | | Director of: Nature’s Sunshine Products, Inc., Reich & Tang Funds, Homeowners of America Holding Corporation/ Homeowners of America Insurance Company, the Boss Group |
Jack M. Fields — 1952 Trustee | | 2003 | | Chief Executive Officer, Twenty First Century Group, Inc. (government affairs company); Owner and Chief Executive Officer, Dos Angeles Ranch, L.P. (cattle, hunting, corporate entertainment); and Discovery Global Education Fund (non-profit) Formerly: Chief Executive Officer, Texana Timber LP (sustainable forestry company); Director of Cross Timbers Quail Research Ranch (non-profit); and member of the U.S. House of Representatives | | 146 | | Insperity, Inc. (formerly known as Administaff) |
Eli Jones — Trustee | | 2016 | | Professor and Dean, Mays Business School, Texas A&M University Formerly: Professor and Dean, Walton College of Business, University of Arkansas, and E.J. Ourso College of Business, Louisiana State University | | 146 | | Director, Insperity, Inc., (2011-present) and ARVEST Bank (2012-2015) |
Prema Mathai-Davis — 1950 Trustee | | 2003 | | Retired. Formerly: Chief Executive Officer, YWCA of the U.S.A. | | 146 | | None |
Larry Soll — 1942 Trustee | | 1997 | | Retired. Formerly: Chairman, Chief Executive Officer and President, Synergen Corp. (a biotechnology company) | | 146 | | None |
Robert C. Troccoli — Trustee | | 2016 | | Retired. Formerly: Senior Partner, KPMG LLP | | 146 | | None |
Raymond Stickel, Jr. — 1944 Trustee | | 2005 | | Retired. Formerly: Director, Mainstay VP Series Funds, Inc. (25 portfolios) and Partner, Deloitte & Touche | | 146 | | None |
Suzanne H. Woolsey — 1941 Trustee | | 2014 | | Chief Executive Officer of Woolsey Partners LLC | | 146 | | Emeritus Chair of the Board of Trustees of the Institute for Defense Analyses; Trustee of Colorado College; Trustee of California Institute of Technology; Prior to 2014, Director of Fluor Corp.; Prior to 2010, Trustee of the German Marshall Fund of the United States; Prior to 2010 Trustee of the Rocky Mountain Institute |
Invesco V.I. American Value Fund
Trustees and Officers—(continued)
| | | | | | | | |
Name, Year of Birth and
Position(s) Held with the Trust | | Trustee and/
or Officer Since | | Principal Occupation(s)
During Past 5 Years | | Number of Funds in Fund Complex Overseen by Trustee | | Other Directorship(s)
Held by Trustee During Past 5 Years |
| Other Officers | | | | | | | | |
Russell C. Burk — 1958 Senior Vice President and Senior Officer | | 2005 | | Senior Vice President and Senior Officer, The Invesco Funds | | N/A | | N/A |
John M. Zerr — 1962 Senior Vice President, Chief Legal Officer and Secretary | | 2006 | | Director, Senior Vice President, Secretary and General Counsel, Invesco Management Group, Inc. (formerly known as Invesco Aim Management Group, Inc.) and Van Kampen Exchange Corp.; Senior Vice President, Invesco Advisers, Inc. (formerly known as Invesco Institutional (N.A.), Inc.) (registered investment adviser); Senior Vice President and Secretary, Invesco Distributors, Inc. (formerly known as Invesco Aim Distributors, Inc.); Director, Vice President and Secretary, Invesco Investment Services, Inc. (formerly known as Invesco Aim Investment Services, Inc.); Senior Vice President, Chief Legal Officer and Secretary, The Invesco Funds; Managing Director, Invesco PowerShares Capital Management LLC; Director, Secretary and General Counsel, Invesco Investment Advisers LLC (formerly known as Van Kampen Asset Management); Secretary and General Counsel, Invesco Capital Markets, Inc. (formerly known as Van Kampen Funds Inc.) and Chief Legal Officer, PowerShares Exchange-Traded Fund Trust, PowerShares Exchange-Traded Fund Trust II, PowerShares India Exchange-Traded Fund Trust, PowerShares Actively Managed Exchange-Traded Fund Trust, and PowerShares Actively Managed Exchange-Traded Commodity Fund Trust Formerly: Director, Vice President and Secretary, IVZ Distributors, Inc. (formerly known as INVESCO distributors, Inc.); Director and Vice President, INVESCO Funds Group, Inc.; Director and Vice President, Van Kampen Advisors Inc.; Director, Vice President, Secretary and General Counsel, Van Kampen Investor Services Inc.; Director, Invesco Distributors, Inc. (formerly known as Invesco Aim Distributors, Inc.); Director, Senior Vice President, General Counsel and Secretary, Invesco Aim Advisers, Inc. and Van Kampen Investments Inc.; Director, Vice President and Secretary, Fund Management Company; Director, Senior Vice President, Secretary, General Counsel and Vice President, Invesco Aim Capital Management, Inc.; Chief Operating Officer and General Counsel, Liberty Ridge Capital, Inc. (an investment adviser); Vice President and Secretary, PBHG Funds (an investment company) and PBHG Insurance Series Fund (an investment company); Chief Operating Officer, General Counsel and Secretary, Old Mutual Investment Partners (a broker-dealer); General Counsel and Secretary, Old Mutual Fund Services (an administrator) and Old Mutual Shareholder Services (a shareholder servicing center); Executive Vice President, General Counsel and Secretary, Old Mutual Capital, Inc. (an investment adviser); and Vice President and Secretary, Old Mutual Advisors Funds (an investment company) | | N/A | | N/A |
Sheri Morris — 1964 Vice President, Treasurer and Principal Financial Officer | | 2003 | | Vice President, Treasurer and Principal Financial Officer, The Invesco Funds; Vice President, Invesco Advisers, Inc. (formerly known as Invesco Institutional (N.A.), Inc.) (registered investment adviser); and Vice President, PowerShares Exchange-Traded Fund Trust, PowerShares Exchange-Traded Fund Trust II, PowerShares India Exchange-Traded Fund Trust, PowerShares Actively Managed Exchange-Traded Fund Trust, and PowerShares Actively Managed Exchange-Traded Commodity Fund Trust Formerly: Vice President, Invesco Aim Advisers, Inc., Invesco Aim Capital Management, Inc. and Invesco Aim Private Asset Management, Inc.; Assistant Vice President and Assistant Treasurer, The Invesco Funds and Assistant Vice President, Invesco Advisers, Inc., Invesco Aim Capital Management, Inc. and Invesco Aim Private Asset Management, Inc.; and Treasurer, PowerShares Exchange-Traded Fund Trust, PowerShares Exchange-Traded Fund Trust II, PowerShares India Exchange-Traded Fund Trust and PowerShares Actively Managed Exchange-Traded Fund Trust | | N/A | | N/A |
Invesco V.I. American Value Fund
Trustees and Officers—(continued)
| | | | | | | | |
Name, Year of Birth and
Position(s) Held with the Trust | | Trustee and/
or Officer Since | | Principal Occupation(s)
During Past 5 Years | | Number of Funds in Fund Complex Overseen by Trustee | | Other Directorship(s)
Held by Trustee During Past 5 Years |
| Other Officers—(continued) | | | | | | | | |
Karen Dunn Kelley — 1960 Vice President | | 2003 | | Senior Managing Director, Investments, Invesco Ltd.; Director, Co-President, Co-Chief Executive Officer, and Co-Chairman, Invesco Advisers, Inc. (formerly known as Invesco Institutional (N.A.), Inc.) (registered investment adviser); Chairman, Invesco Senior Secured Management, Inc.; Senior Vice President, Invesco Management Group, Inc. (formerly known as Invesco Aim Management Group, Inc.); Executive Vice President, Invesco Distributors, Inc. (formerly known as Invesco Aim Distributors, Inc.); Director, Invesco Mortgage Capital Inc. and Invesco Management Company Limited; Vice President, The Invesco Funds (other than AIM Treasurer’s Series Trust (Invesco Treasurer’s Series Trust), Short-Term Investments Trust and Invesco Management Trust); and President and Principal Executive Officer, The Invesco Funds (AIM Treasurer’s Series Trust (Invesco Treasurer’s Series Trust), Short-Term Investments Trust and Invesco Management Trust only) Formerly: Director and President, INVESCO Asset Management (Bermuda) Ltd., Director, INVESCO Global Asset Management Limited and INVESCO Management S.A.; Senior Vice President, Van Kampen Investments Inc. and Invesco Advisers, Inc. (formerly known as Invesco Institutional (N.A.), Inc.) (registered investment adviser); Vice President, Invesco Advisers, Inc. (formerly known as Invesco Institutional (N.A.), Inc.); Director of Cash Management and Senior Vice President, Invesco Advisers, Inc. and Invesco Aim Capital Management, Inc.; Director and President, Fund Management Company; Chief Cash Management Officer, Director of Cash Management, Senior Vice President, and Managing Director, Invesco Aim Capital Management, Inc.; Director of Cash Management, Senior Vice President, and Vice President, Invesco Advisers, Inc. and The Invesco Funds (AIM Treasurer’s Series Trust (Invesco Treasurer’s Series Trust), and Short-Term Investments Trust only) | | N/A | | N/A |
Crissie M. Wisdom — 1969 Anti-Money Laundering Compliance Officer | | 2013 | | Anti-Money Laundering Compliance Officer, Invesco Advisers, Inc. (formerly known as Invesco Institutional (N.A.), Inc.) (registered investment adviser), Invesco Capital Markets, Inc. (formerly known as Van Kampen Funds Inc.), Invesco Distributors, Inc., Invesco Investment Services, Inc., Invesco Management Group, Inc., Van Kampen Exchange Corp., The Invesco Funds, and PowerShares Exchange-Traded Fund Trust, PowerShares Exchange-Traded Fund Trust II, PowerShares India Exchange-Traded Fund Trust, PowerShares Actively Managed Exchange-Traded Fund Trust and PowerShares Actively Managed Exchange-Traded Commodity Fund Trust; Anti-Money Laundering Compliance Officer and Bank Secrecy Act Officer, INVESCO National Trust Company and Invesco Trust Company; and Fraud Prevention Manager and Controls and Risk Analysis Manager for Invesco Investment Services, Inc. | | N/A | | N/A |
Lisa O. Brinkley — 1959 Chief Compliance Officer | | 2015 | | Senior Vice President and Chief Compliance Officer, Invesco Advisers, Inc. (registered investment adviser) (formerly known as Invesco Institutional (N.A., Inc.); and Chief Compliance Officer, The Invesco Funds Formerly: Global Assurance Officer, Invesco Ltd. and Vice President, The Invesco Funds; Chief Compliance Officer, Invesco Distributors, Inc. (formerly known as Invesco Aim Distributors, Inc.), Invesco Investment Services, Inc.(formerly known as Invesco Aim Investment Services, Inc.) and Van Kampen Investor Services Inc.; Senior Vice President, Invesco Management Group, Inc.; Senior Vice President and Chief Compliance Officer, Invesco Advisers, Inc. and The Invesco Funds; Vice President and Chief Compliance Officer, Invesco Aim Capital Management, Inc. and Invesco Distributors, Inc.; Vice President, Invesco Investment Services, Inc. and Fund Management Company | | N/A | | N/A |
The Statement of Additional Information of the Trust includes additional information about the Fund’s Trustees and is available upon request, without charge, by calling 1.800.959.4246. Please refer to the Fund’s prospectus for information on the Fund’s sub-advisers.
| | | | | | |
Office of the Fund 11 Greenway Plaza, Suite 1000 Houston, TX 77046-1173 | | Investment Adviser Invesco Advisers, Inc. 1555 Peachtree Street, N.E. Atlanta, GA 30309 | | Distributor Invesco Distributors, Inc. 11 Greenway Plaza, Suite 1000 Houston, TX 77046-1173 | | Auditors PricewaterhouseCoopers LLP 1000 Louisiana Street, Suite 5800 Houston, TX 77002-5678 |
| | | |
| | | | | | |
Counsel to the Fund Stradley Ronon Stevens & Young, LLP 2005 Market Street, Suite 2600 Philadelphia, PA 19103-7018 | | Counsel to the Independent Trustees Goodwin Procter LLP 901 New York Avenue, N.W. Washington, D.C. 20001 | | Transfer Agent Invesco Investment Services, Inc. 11 Greenway Plaza, Suite 1000 Houston, TX 77046-1173 | | Custodian State Street Bank and Trust Company 225 Franklin Street Boston, MA 02110-2801 |
Invesco V.I. American Value Fund
| | | | |
| | |

| | Annual Report to Shareholders | | December 31, 2015 |
| | |
| | Invesco V.I. Balanced-Risk Allocation Fund |

| | |
| | The Fund provides a complete list of its holdings four times in each fiscal year, at the quarter-ends. For the second and fourth quarters, the lists appear in the Fund’s semiannual and annual reports to shareholders. For the first and third quarters, the Fund files the lists with the Securities and Exchange Commission (SEC) on Form N-Q. The Fund’s Form N-Q filings are available on the SEC website, sec.gov. Copies of the Fund’s Forms N-Q may be reviewed and copied at the SEC Public Reference Room in Washington, D.C. You can obtain information on the operation of the Public Reference Room, including information about duplicating fee charges, by calling 202 551 8090 or 800 732 0330, or by electronic request at the following email address: publicinfo@sec.gov. The SEC file numbers for the Fund are 811-07452 and 033-57340. The Fund’s most recent portfolio holdings, as filed on Form N-Q, have also been made available to insurance companies issuing variable annuity contracts and variable life insurance policies (“variable products”) that invest in the Fund. A description of the policies and procedures that the Fund uses to determine how to vote proxies relating to portfolio securities is available without charge, upon request, from our Client Services department at 800 959 4246 or at invesco.com/proxyguidelines. The information is also available on the SEC website, sec.gov. Information regarding how the Fund voted proxies related to its portfolio securities during the most recent 12-month period ended June 30 is available at invesco.com/ proxysearch. The information is also available on the SEC website, sec.gov. Invesco Advisers, Inc. is an investment adviser; it provides investment advisory services to individual and institutional clients and does not sell securities. Invesco Distributors, Inc. is the US distributor for Invesco Ltd.’s retail mutual funds, exchange-traded funds and institutional money market funds. Both are wholly owned, indirect subsidiaries of Invesco Ltd. This report must be accompanied or preceded by a currently effective Fund prospectus and variable product prospectus, which contain more complete information, including sales charges and expenses. Investors should read each carefully before investing. Invesco Distributors, Inc. VIIBRA-AR-1 NOT FDIC INSURED | MAY LOSE VALUE | NO BANK GUARANTEE |
Management’s Discussion of Fund Performance
Performance summary
For the year ended December 31, 2015, Series I shares of Invesco V.I. Balanced-Risk Allocation Fund (the Fund) underperformed the Custom Invesco V.I. Balanced-Risk Allocation Index, the Fund’s custom style-specific index.
Your Fund’s long-term performance appears later in this report.
Fund vs. Indexes
Total returns, 12/31/14 to 12/31/15, excluding variable product issuer charges.
If variable product issuer charges were included, returns would be lower.
| | | | | |
| Series I Shares | | | | -4.10 | % |
| Series II Shares | | | | -4.40 | |
| MSCI World Index▼ (Broad Market Index) | | | | -0.87 | |
| Custom Invesco V.I. Balanced-Risk Allocation Indexn (Style-Specific Index) | | | | 0.05 | |
| Lipper VUF Absolute Return Funds Classification Average¿ (Peer Group) | | | | -2.37 | |
Source(s): ▼FactSet Research Systems Inc.; nInvesco, FactSet Research Systems Inc.; ¿Lipper Inc.
Market conditions and your Fund
During the year ended December 31, 2015, global markets produced mixed results due to volatility from a variety of geopolitical developments. The Fund ended the reporting period in negative territory. The Fund invests in derivatives, specifically, swaps, futures and commodity-linked notes, that are expected to correspond to US and international fixed income, equity and commodity markets. The strategic portion of our investment process involves first selecting representative assets for each asset class from a universe of over 50 assets. Next, we seek to construct the portfolio so that an approximately equal amount of risk comes from the equity, fixed income and commodity allocations. Tactical adjustments to the Fund’s portfolio are then made on a monthly basis to try to take advantage of short term market dynamics.
Positive performance from strategic positioning in equity and fixed income markets, obtained through the use of swaps and futures, boosted Fund results for the reporting period. Tactical positioning in commodities, achieved through the use of swaps, futures and commodity-linked notes, also contributed to Fund results, while tactical positioning in equities and fixed income through the use of swaps and futures slightly detracted from Fund results. The net effect was a positive
contribution from our tactical allocation process to Fund results for the year.
Equity markets in developed nations generally rose in the first quarter of 2015, especially those markets in which central banks were still actively involved in quantitative easing. Most fixed income markets saw yields decline in the first quarter, continuing the strong price gains from 2014. Factors supporting lower yields included sharp declines in commodity prices, which also tempered fears of an increase in inflation, renewed geopolitical tensions in the Middle East, and ongoing negotiations regarding Greece’s efforts to secure fresh funding from its international creditors. Commodities continued their decline over the first quarter of 2015 in large part due to the collapse in energy and agricultural prices. The tactical allocation element of our strategy contributed to the Fund’s quarterly results, with all three asset classes contributing fairly equally to Fund results for the quarter.
The Fund ended the second quarter of 2015 on a weak note; small gains from our equity exposure, achieved through the use of swaps and futures, and our commodity exposure, achieved through the use of swaps, futures and commodity-linked notes, were not enough to compensate for losses from government bond exposure, which was achieved through the use of swaps and futures. Within equities, gains from the beginning
of the quarter were largely erased in June as concern about the Greek financial crisis and a correction in Chinese equities triggered a substantial increase in volatility. Commodity markets generated mixed results, with agricultural commodities posting gains, primarily because of strength in grains late in the quarter and on indications that the glut in certain key agricultural commodities might be easing. Government bonds posted large losses for the second quarter as threats of an increase in US interest rates, improving economic data out of Europe and indications of rising inflation led to a substantial re-pricing of the highest-quality fixed income markets. Tactical allocations across all three asset classes detracted from Fund returns for the quarter, mainly driven by exposure to the various commodity complexes. April 2015 was particularly difficult for the Fund, as we had generally underweight exposure to commodities, achieved through the use of swaps, futures and commodity-linked notes, at a time when commodity prices, at least temporarily, rose strongly.
Bonds rebounded in the third quarter of 2015. Nervous investors sought perceived safe haven assets after commodity prices resumed their slide, creating renewed volatility in equities.1 During the quarter, indicators of economic activity and inflation came in weak across key geographies, which enhanced the appeal of bonds and allayed concerns of sustained interest rate hikes across major markets. All of the bond markets in which the Fund invested through the use of swaps and futures posted gains for the quarter, and this contributed to Fund performance. Several factors caused weakness in equities during the third quarter of 2015, including the surprise Chinese renminbi devaluation, disappointing gross domestic product data from Europe and Canada, weak manufacturing data from a host of countries and uncertainty regarding the US Federal Reserve’s (the Fed’s) policy direction. The combination of these factors suggested that global economic growth was slowing well beyond what equity prices
| | | | | | | | | | |
Target Risk Allocation and Notional Asset Weights as of 12/31/15 |
| By asset class | | | | | | | | | | |
| | |
| Asset Class | | |
| Target
Risk
Allocation* |
| | |
| Notional
Asset
Weights** |
|
| | |
| Equities | | | | 39.56 | % | | | | 37.83 | % |
| Fixed Income | | | | 43.41 | | | | | 86.53 | |
| Commodities | | | | 17.03 | | | | | 21.63 | |
Total | | | | 100.00 | | | | | 145.99 | |
| * | Reflects the risk that each asset class is expected to contribute to the overall risk of the Fund as measured by standard deviation and estimates of risk based on historical data. Standard deviation measures the annualized fluctuations (volatility) of monthly returns. |
| ** | Proprietary models determine the Notional Asset Weights necessary to achieve the Target Risk Allocations. Total Notional Asset Weight greater than 100% is achieved through derivatives and other instruments that create leverage. |
| | | | | |
| Total Net Assets | | | $ | 966.2 million | |
Data presented here are as of December 31, 2015.
Invesco V.I. Balanced-Risk Allocation Fund
reflected. Consequently, several equity markets experienced double-digit declines, notably Hong Kong, Japan and US small-cap companies, while only markets in Europe and Japan showed year-to-date gains through the third quarter of 2015. Commodities continued to fall during the third quarter of 2015, with energy suffering the steepest price declines, as US stockpiles remained well above the five-year seasonal average, the Chinese economy weakened, and Iran increased its oil production, thereby adding to fears of a worsening global oil glut. The Fund’s tactical allocation process generated a positive return for the third quarter of 2015. The Fund’s general overweight exposure to bonds, achieved through the use of swaps and futures, proved timely and benefited Fund performance. Tactical shifts to equities, achieved through the use of swaps and futures, in the Fund’s portfolio detracted from Fund performance, due primarily to the Fund’s overweight exposure to all equity markets during August, when volatility increased, offsetting positive results from equity positioning in July and September. The Fund’s defensive posture in commodities, achieved through the use of swaps, futures and commodity-linked notes, produced contributions every month during the third quarter.
Exposure to developed-market equities, which was achieved through the use of swaps and futures, were the sole contributor to Fund performance in the fourth quarter of 2015, but performance diverged between markets. Equities saw broad strength in October as share prices rebounded from the third quarter. Equity markets experienced a broad sell-off in December as the US began the long-anticipated process of normalizing interest rates and as the actions of the European Central Bank did not meet market expectations. Over the course of the quarter, Japanese, European, Hong Kong and US small-cap equities gained while UK and US large-cap equities declined. Bonds, exposure to which we achieved through swaps and futures, were mild detractors from Fund performance in the fourth quarter as investors digested comments from the Fed about the need to begin normalizing interest rates. Additionally, relatively strong performance from equity markets in October and November reduced the perceived safe haven appeal of bonds.1 Exposure to commodities, which we achieved through the use of swaps, futures and commodity-linked notes, was the largest drag on Fund performance for the quarter. Energy was the largest detractor, as oil prices continued to be
pressured by a rising US dollar and rising supplies. Declining oil prices hurt distillates such as gasoil and unleaded gasoline, while natural gas prices collapsed due to warmer weather across the eastern US. Industrial metals remained under pressure for most of the quarter due to dollar strength, oversupply and weakening demand from China; however, by quarter’s end, announced supply cuts from major producers began to lift prices. Precious metals prices fell as the Fed raised interest rates for the first time in nine years, which caused the dollar to rise. Gold achieved both its highest and lowest price for the year during the quarter. Gold peaked for the year in October after the Fed deferred an interest rate increase in September, and then reached its low for the year in December after the interest rate increase was enacted. The aggregate result of the Fund’s tactical positioning for the fourth quarter was positive. The largest contributor to Fund results was the defensive posture across commodities, particularly energy, for the quarter. We achieved that defensive posture through the use of swaps, futures and commodity-linked notes.
Please note that our strategy is principally implemented with derivative instruments including swaps, futures and other instruments that provide economic leverage, such as commodity-linked notes. Therefore, all or most of the performance of the strategy, both positive and negative, can be attributed to these instruments. Derivatives and other instruments that provide economic leverage can be a cost-effective way to gain exposure to asset classes. However, they may amplify traditional investment risks through the creation of leverage and may be less liquid than traditional securities.
Thank you for your continued commitment to Invesco V.I. Balanced-Risk Allocation Fund.
| 1 | So-called “safe haven” assets do not imply risk-free investing. |
The views and opinions expressed in management’s discussion of Fund performance are those of Invesco Advisers, Inc. These views and opinions are subject to change at any time based on factors such as market and economic conditions. These views and opinions may not be relied upon as investment advice or recommendations, or as an offer for a particular security. The information is not a complete analysis of every aspect of any market, country, industry, security or the Fund. Statements of fact are from sources considered reliable, but Invesco Advisers, Inc. makes no representation or warranty as to their completeness or accuracy. Although historical performance is no guarantee of future results, these insights may help you understand our investment management philosophy.
See important Fund and, if applicable, index disclosures later in this report.
| | |
 | | Mark Ahnrud Chartered Financial Analyst, Portfolio Manager, is manager of Invesco V.I. Balanced-Risk Allocation Fund. |
He joined Invesco in 2000. Mr. Ahnrud earned a BS in finance and investments from Babson College and an MBA from Duke University Fuqua School of Business. |
| |

| | Chris Devine Chartered Financial Analyst, Portfolio Manager, is manager of Invesco V.I. Balanced-Risk Allocation Fund. |
He joined Invesco in 1998. Mr. Devine earned a BA in economics from Wake Forest University and an MBA from the University of Georgia. |
| |

| | Scott Hixon Chartered Financial Analyst, Portfolio Manager, is manager of Invesco V.I. Balanced-Risk Allocation Fund. |
He joined Invesco in 1994. Mr. Hixon earned a BBA in finance from Georgia Southern University and an MBA in finance from Georgia State University. |
| |

| | Christian Ulrich Chartered Financial Analyst, Portfolio Manager, is manager of Invesco V.I. Balanced-Risk Allocation Fund. |
He joined Invesco in 2000. Mr. Ulrich earned the equivalent of a BBA from the KV Zurich Business School in Zurich, Switzerland. |
| |

| | Scott Wolle Chartered Financial Analyst, Portfolio Manager, is manager of Invesco V.I. Balanced-Risk Allocation Fund. |
He joined Invesco in 1999. Mr. Wolle earned a BS in finance from Virginia Polytechnic Institute and State University and an MBA from Duke University Fuqua School of Business. |
|
Assisted by Invesco’s Global Asset Allocation Team |
Invesco V.I. Balanced-Risk Allocation Fund
Your Fund’s Long-Term Performance
Results of a $10,000 Investment – Oldest Share Class(es) since Inception
Fund and index data from 1/23/09*
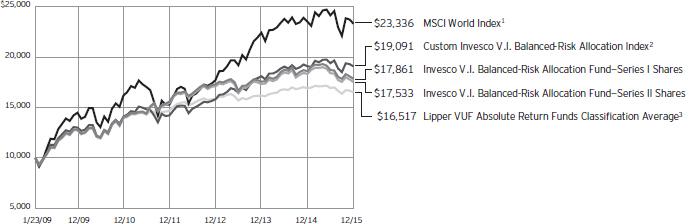
* Data for Lipper VUF Absolute Return Funds Classification Average are from January 31, 2009.
| 1 | Source: FactSet Research Systems Inc. |
| 2 | Source(s): Invesco, FactSet Research Systems Inc. |
Past performance cannot guarantee comparable future results.
| | | | | |
| Average Annual Total Returns |
As of 12/31/15 | | | | | |
| |
| Series I Shares | | | | | |
| Inception (1/23/09) | | | | 8.72 | % |
| 5 Years | | | | 4.92 | |
| 1 Year | | | | -4.10 | |
| |
| Series II Shares | | | | | |
| Inception (1/23/09) | | | | 8.43 | % |
| 5 Years | | | | 4.64 | |
| 1 Year | | | | -4.40 | |
The returns shown above include the returns of Invesco Van Kampen V.I. Global Tactical Asset Allocation Fund (the first predecessor fund) for the period June 1, 2010, to May 2, 2011, the date the first predecessor fund was reorganized into the Fund, and the returns of Van Kampen Life Investment Trust Global Tactical Asset Allocation Portfolio (the second predecessor fund) for the period prior to June 1, 2010, the date the second predecessor fund was reorganized into the first predecessor fund. The second predecessor fund was advised by Van Kampen Asset Management. Returns shown above for Series I and Series II shares are blended returns of the predecessor funds and Invesco V.I. Balanced-Risk Allocation Fund. Share class returns will differ from the predecessor funds because of different expenses.
The performance data quoted represent past performance and cannot
guarantee comparable future results; current performance may be lower or higher. Please contact your variable product issuer or financial adviser for the most recent month-end variable product performance. Performance figures reflect Fund expenses, reinvested distributions and changes in net asset value. Investment return and principal value will fluctuate so that you may have a gain or loss when you sell shares.
The net annual Fund operating expense ratio set forth in the most recent Fund prospectus as of the date of this report for Series I and Series II shares was 0.80% and 1.05%, respectively.1,2,3 The total annual Fund operating expense ratio set forth in the most recent Fund prospectus as of the date of this report for Series I and Series II shares was 1.20% and 1.45%, respectively.1 The expense ratios presented above may vary from the expense ratios presented in other sections of this report that are based on expenses incurred during the period covered by this report.
Invesco V.I. Balanced-Risk Allocation Fund, a series portfolio of AIM Variable Insurance Funds (Invesco Variable Insurance Funds), is currently offered through insurance companies issuing variable products. You cannot purchase shares of the Fund directly. Performance figures given represent
the Fund and are not intended to reflect actual variable product values. They do not reflect sales charges, expenses and fees assessed in connection with a variable product. Sales charges, expenses and fees, which are determined by the variable product issuers, will vary and will lower the total return.
The most recent month-end performance at the Fund level, excluding variable product charges, is available at 800 451 4246. As mentioned above, for the most recent month-end performance including variable product charges, please contact your variable product issuer or financial adviser.
Fund performance reflects any applicable fee waivers and/or expense reimbursements. Had the adviser not waived fees and/or reimbursed expenses currently or in the past, returns would have been lower. See current prospectus for more information.
| 1 | The expense ratio includes acquired fund fees and expenses of the underlying funds in which the Fund invests of 0.09% for Invesco V.I. Balanced-Risk Allocation Fund. |
| 2 | Total annual Fund operating expenses after any contractual fee waivers and/or expense reimbursements by the adviser in effect through at least April 30, 2017. See current prospectus for more information. |
| 3 | Total annual Fund operating expenses after any contractual fee waivers and/or expense reimbursements by the adviser in effect through at least June 30, 2017. See current prospectus for more information. |
Invesco V.I. Balanced-Risk Allocation Fund
Invesco V.I. Balanced-Risk Allocation Fund’s investment objective is total return with a low to moderate correlation to traditional financial market indices.
| n | | Unless otherwise stated, information presented in this report is as of December 31, 2015, and is based on total net assets. |
| n | | Unless otherwise noted, all data provided by Invesco. |
| n | | To access your Fund’s reports/prospectus, visit invesco.com/fundreports. |
Principal risks of investing in the Fund
Changing fixed income market conditions risk. The current low interest rate environment was created in part by the Federal Reserve Board (FRB) and certain foreign central banks keeping the federal funds and equivalent foreign rates at or near zero. There is a risk that interest rates will rise when the FRB and central banks raise these rates. This risk is heightened due to the FRB’s quantitative easing program and the “tapering” of other similar foreign central bank actions. This eventual increase in the federal funds and equivalent foreign rates may expose fixed income markets to heightened volatility and reduced liquidity for certain fixed income investments, particularly those with longer maturities. In addition, decreases in fixed income dealer market-making capacity may also potentially lead to heightened volatility and reduced liquidity in the fixed income markets. As a result, the value of the Fund’s investments and share price may decline. Changes in central bank policies could also result in higher than normal shareholder redemptions, which could potentially increase portfolio turnover and the Fund’s transaction costs.
Commodities tax risk. The tax treatment of commodity-linked derivative instruments may be adversely affected by changes in legislation, regulations or other legally binding authority. If, as a result of any such adverse action, the income of the Fund from certain commodity-linked derivatives was treated as non-qualifying income, the Fund might fail to qualify as a regulated investment company and be subject to federal income tax at the Fund level. The Internal Revenue Service has issued a number of private letter rulings to other mutual funds, including to another Invesco fund (upon which only the fund that received the private letter ruling can rely), which indicate that income from a fund’s investment in certain commodity linked notes and a wholly owned foreign subsidiary that invests in commodity-linked derivatives, such as the Subsidiary, constitutes qualifying income. However, the Internal Revenue Service suspended issuance of any further private letter rulings in July 2011 pending a review of its position. Should the Internal Revenue Service
issue guidance, or Congress enact legislation, that adversely affects the tax treatment of the Fund’s use of commodity-linked notes or the Subsidiary (which guidance might be applied to the Fund retroactively), it could limit the Fund’s ability to pursue its investment strategy and the Fund might not qualify as a regulated investment company for one or more years. In this event, the Fund’s Board of Trustees may authorize a significant change in investment strategy or Fund liquidation. The Fund also may incur transaction and other costs to comply with any new or additional guidance from the Internal Revenue Service.
Commodity-linked notes risk. The Fund’s investments in commodity-linked notes may involve substantial risks, including risk of loss of a significant portion of their principal value. In addition to risks associated with the underlying commodities, they may be subject to additional special risks, such as the lack of a secondary trading market and temporary price distortions due to speculators and/ or the continuous rolling over of futures contracts underlying the notes. Commodity-linked notes are also subject to counterparty risk, which is the risk that the other party to the contract will not fulfill its contractual obligation to complete the transaction with the Fund.
Commodity risk. The Fund’s significant investment exposure to the commodities markets and/or a particular sector of the commodities markets, which may subject the Fund to greater volatility than investments in traditional securities, such as stocks and bonds. The commodities markets may fluctuate widely based on a variety of factors, including changes in overall market movements, domestic and foreign political and economic events and policies, war, acts of terrorism, changes in domestic or foreign interest rates and/ or investor expectations concerning interest rates, domestic and foreign inflation rates and investment and trading activities of mutual funds, hedge funds and commodities funds. Prices of various commodities may also be affected by factors such as drought, floods, weather, livestock disease, embargoes, tariffs and other regulatory developments. The prices of commodities can also fluctuate widely due to supply and demand disruptions in major producing or consuming
regions. Because the Fund’s performance is linked to the performance of potentially volatile commodities, investors should be willing to assume the risks of potentially significant fluctuations in the value of the Fund’s shares.
Correlation risk. Changes in the value of two investments or asset classes may not track or offset each other in the manner anticipated by the portfolio managers. Because the Fund’s investment strategy seeks to balance risk across three asset classes and, within each asset class, to balance risk across different countries and commodities, to the extent either the three asset classes or the selected countries and commodities are correlated in a way not anticipated by the portfolio managers the Fund’s risk allocation process may not succeed in achieving its investment objective.
Credit risk. The issuer of instruments in which the Fund invests may be unable to meet interest and/or principal payments, thereby causing its instruments to decrease in value and lowering the issuer’s credit rating.
Currency/exchange rate risk. The dollar value of the Fund’s foreign investments will be affected by changes in the exchange rates between the dollar and the currencies in which those investments are traded.
Derivatives risk. The value of a derivative instrument depends largely on (and is derived from) the value of an underlying security, currency, commodity, interest rate, index or other asset (each referred to as an underlying asset). In addition to risks relating to the underlying assets, the use of derivatives may include other, possibly greater, risks, including counterparty, leverage and liquidity risks. Counterparty risk is the risk that the counterparty to the derivative contract will default on its obligation to pay the Fund the amount owed or otherwise perform under the derivative contract. Derivatives create leverage risk because they do not require payment up front equal to the economic exposure created by owning the derivative. As a result, an adverse change in the value of the underlying asset could result in the Fund sustaining a loss that is substantially greater than the amount invested in the derivative, which may make the Fund’s returns more volatile and increase the
|
| Invesco V.I. Balanced-Risk Allocation Fund |
risk of loss. Derivative instruments may also be less liquid than more traditional investments and the Fund may be unable to sell or close out its derivative positions at a desirable time or price. This risk may be more acute under adverse market conditions, during which the Fund may be most in need of liquidating its derivative positions. Derivatives may also be harder to value, less tax efficient and subject to changing government regulation that could impact the Fund’s ability to use certain derivatives or their cost. Also, derivatives used for hedging or to gain or limit exposure to a particular market segment may not provide the expected benefits, particularly during adverse market conditions. These risks are greater for the Fund than most other mutual funds because the Fund will implement its investment strategy primarily through derivative instruments rather than direct investments in stocks and bonds.
Developing/emerging markets securities risk. The prices of securities issued by foreign companies and governments located in developing/emerging markets countries may be affected more negatively by inflation, devaluation of their currencies, higher transaction costs, delays in settlement, adverse political developments, the introduction of capital controls, withholding taxes, nationalization of private assets, expropriation, social unrest, war or lack of timely information than those in developed countries.
Exchange-traded funds risk. An investment by the Fund in exchange-traded funds generally presents the same primary risks as an investment in a mutual fund. In addition, an exchange-traded fund may be subject to the following: (1) a discount of the exchange-traded fund’s shares to its net asset value; (2) failure to develop an active trading market for the exchange-traded fund’s shares; (3) the listing exchange halting trading of the exchange-traded fund’s shares; (4) failure of the exchange-traded fund’s shares to track the referenced asset; and (5) holding troubled securities in the referenced index or basket of investments. Investments in exchange-traded funds may involve duplication of management fees and certain other expenses, as the Fund indirectly bears its proportionate share of any expenses paid by the exchange-traded funds in which it
invests. Further, certain of the exchange-traded funds in which the Fund may invest are leveraged. The more the Fund invests in such leveraged exchange-traded funds, the more this leverage will magnify any losses on those investments.
Exchange-traded notes risk. Exchange-traded notes are subject to credit risk, including the credit risk of the issuer, and the value of the exchange-traded note may drop due to a downgrade in the issuer’s credit rating, despite the underlying market benchmark or strategy remaining unchanged. The value of an exchange-traded note may also be influenced by time to maturity, level of supply and demand for the exchange-traded note, volatility and lack of liquidity in the underlying market, changes in the applicable interest rates, changes in the issuer’s credit rating, and economic, legal, political, or geographic events that affect the referenced underlying market or strategy. Exchange-traded notes are also subject to the risk that the other party to the contract will not fulfill its contractual obligations, which may cause losses or additional costs to the Fund.
Foreign government debt risk. Investments in foreign government debt obligations involve certain risks in addition to those relating to foreign securities or debt securities generally. The issuer of the debt or the governmental authorities that control the repayment of the debt may be unable or unwilling to repay principal or interest when due in accordance with the terms of such debt, and the Fund may have limited recourse in the event of a default against the defaulting government. Without the approval of debt holders, some governmental debtors have in the past been able to reschedule or restructure their debt payments or declare moratoria on payments.
Foreign securities risk. The Fund’s foreign investments may be affected by changes in a foreign country’s exchange rates, political and social instability, changes in economic or taxation policies, difficulties when enforcing obligations, decreased liquidity, and increased volatility. Foreign companies may be subject to less regulation resulting in less publicly available information about the companies.
Interest rate risk. Interest rate risk refers to the risk that bond prices generally fall as interest rates rise; conversely,
bond prices generally rise as interest rates fall. Specific bonds differ in their sensitivity to changes in interest rates depending on their individual characteristics, including duration. The risk may be magnified due to the Fund’s use of derivatives that provided leveraged exposure to government bonds.
Liquidity risk. The Fund may hold illiquid securities that it is unable to sell at the preferred time or price and could lose its entire investment in such securities. The Fund’s significant use of derivative instruments may cause liquidity risk to be greater than other mutual funds that invest in more traditional assets such as stocks and bonds, which trade on markets with more market participants.
Management risk. The investment techniques and risk analysis used by the Fund’s portfolio managers may not produce the desired results. Because the Fund’s investment process relies heavily on its asset allocation process, market movements that are counter to the portfolio managers’ expectations may have a significant adverse effect on the Fund’s net asset value. Further, the portfolio managers’ use of short derivative positions and instruments that provide economic leverage increases the volatility of the Fund’s net asset value, which increases the potential of greater losses that may cause the Fund to liquidate positions when it may not be advantageous to do so.
Market risk. The prices of and the income generated by the Fund’s securi- ties may decline in response to, among other things, investor sentiment, general economic and market conditions, regional or global instability, and currency and interest rate fluctuations.
Subsidiary risk. By investing in the Subsidiary, the Fund is indirectly exposed to risks associated with the Subsidiary’s investments. The Subsidiary is not registered under the Investment Company Act of 1940, as amended (1940 Act), and, except as otherwise noted in this prospectus is not subject to the investor protections of the 1940 Act. Changes in the laws of the United States and/or the Cayman Islands, under which the Fund and the Subsidiary, respectively, are organized, could result in the inability of the Fund and/or the Subsidiary to operate as described in this prospectus and could negatively affect the Fund and its shareholders.
Invesco V.I. Balanced-Risk Allocation Fund
US government obligations risk. The Fund may invest in obligations issued by US government agencies and instrumentalities that may receive varying levels of support from the government, which could affect the Fund’s ability to recover should they default.
Volatility risk. The Fund may have investments that appreciate or decrease significantly in value over short periods of time. This may cause the Fund’s net asset value per share to experience significant increases or declines in value over short periods of time.
About indexes used in this report
The MSCI World IndexSM is an unmanaged index considered representative of stocks of developed countries. The index is computed using the net return, which withholds applicable taxes for non-resident investors.
The Custom Invesco V.I. Balanced-Risk Allocation Index, created by Invesco to serve as a benchmark for Invesco V.I. Balanced-Risk Allocation Fund, comprises the following indexes: MSCI World Index (60%) and Barclays U.S. Aggregate Index (40%). Prior to May 2, 2011, the index comprised the (65%) MSCI World Index, (30%) J.P. Morgan GBI Global Index, and (5%) Citigroup 3-Month Treasury Bill Index.
The Lipper VUF Absolute Return Funds Classification Average represents an average of all variable insurance underlying funds in the Lipper Absolute Return Funds Classification.
The Barclays U.S. Aggregate Index is an unmanaged index considered representative of the US investment-grade, fixed-rate bond market.
The J.P. Morgan GBI Global Index is a total return, market cap-weighted index that is rebalanced monthly and includes the following countries: Australia, Belgium, Canada, Denmark, Germany, Italy, Japan, Netherlands, Spain, Sweden, the UK and the US.
The Citigroup 3-Month Treasury Bill Index is an unmanaged index representing monthly return equivalents of yield averages of the last three month Treasury bill issues.
The Fund is not managed to track the performance of any particular index, including the index(es) described here, and consequently, the performance of the Fund may deviate significantly from the performance of the index(es).
A direct investment cannot be made in an index. Unless otherwise indicated, index results include reinvested dividends, and they do not reflect sales charges. Performance of the peer group, if applicable, reflects fund expenses; performance of a market index does not.
Other information
The returns shown in management’s discussion of Fund performance are based on net asset values calculated for shareholder transactions. Generally accepted accounting principles require adjustments to be made to the net assets of the Fund at period end for financial reporting purposes, and as such, the net asset values for shareholder transactions and the returns based on those net asset values may differ from the net asset values and returns reported in the Financial Highlights. Additionally, the returns and net asset values shown throughout this report are at the Fund level only and do not include variable product issuer charges. If such charges were included, the total returns would be lower.
Invesco V.I. Balanced-Risk Allocation Fund
Consolidated Schedule of Investments
December 31, 2015
| | | | | | | | | | | | | | | | |
| | | Interest
Rate | | | Maturity
Date | | | Principal
Amount | | | Value | |
U.S. Treasury Securities–13.38% | |
| U.S. Treasury Bills–7.91%(a) | |
U.S. Treasury Bills(b) | | | 0.08 | % | | | 01/07/16 | | | $ | 10,500,000 | | | $ | 10,499,947 | |
U.S. Treasury Bills(b)(c) | | | 0.08 | % | | | 01/07/16 | | | | 3,000,000 | | | | 2,999,985 | |
U.S. Treasury Bills(c) | | | 0.10 | % | | | 01/14/16 | | | | 4,500,000 | | | | 4,499,850 | |
U.S. Treasury Bills(b)(c) | | | 0.13 | % | | | 01/21/16 | | | | 4,200,000 | | | | 4,199,762 | |
U.S. Treasury Bills(b) | | | 0.14 | % | | | 01/28/16 | | | | 10,500,000 | | | | 10,499,055 | |
U.S. Treasury Bills(c) | | | 0.14 | % | | | 01/28/16 | | | | 5,360,000 | | | | 5,359,517 | |
U.S. Treasury Bills(c) | | | 0.24 | % | | | 03/03/16 | | | | 3,980,000 | | | | 3,979,413 | |
U.S. Treasury Bills(b) | | | 0.12 | % | | | 03/10/16 | | | | 2,100,000 | | | | 2,099,595 | |
U.S. Treasury Bills(b) | | | 0.26 | % | | | 03/10/16 | | | | 10,390,000 | | | | 10,387,998 | |
U.S. Treasury Bills(b)(c) | | | 0.26 | % | | | 03/10/16 | | | | 16,540,000 | | | | 16,536,814 | |
U.S. Treasury Bills(b)(c) | | | 0.25 | % | | | 03/17/16 | | | | 5,370,000 | | | | 5,369,128 | |
| | | | | | | | | | | | | | | | 76,431,064 | |
|
| U.S. Treasury Notes–5.47%(d) | |
U.S. Treasury Notes(c) | | | 0.06 | % | | | 01/31/16 | | | | 19,970,000 | | | | 19,970,163 | |
U.S. Treasury Notes(b)(e) | | | 0.08 | % | | | 04/30/16 | | | | 10,191,000 | | | | 10,191,670 | |
U.S. Treasury Notes(c)(e) | | | 0.08 | % | | | 04/30/16 | | | | 17,534,000 | | | | 17,535,154 | |
U.S. Treasury Notes(c) | | | 0.09 | % | | | 07/31/16 | | | | 5,100,000 | | | | 5,100,057 | |
| | | | | | | | | | | | | | | | 52,797,044 | |
Total U.S. Treasury Securities (Cost $129,213,036) | | | | | | | | | | | | | | | 129,228,108 | |
| | | | |
| | | | | | Expiration
Date | | | | | | | |
Commodity-Linked Securities–2.27% | | | | | | | | | | | | | | | | |
Canadian Imperial Bank of Commerce EMTN, U.S. Federal Funds Effective Rate minus 0.04% (linked to the Canadian Imperial Bank of Commerce Custom 3 Agriculture Commodity Index, multiplied by 2)(c)(f) | | | | | | | 06/21/16 | | | | 9,050,000 | | | | 8,231,113 | |
Cargill, Inc., Commodity Linked Notes, one month LIBOR rate minus 0.10% (linked to the Monthly Rebalance Commodity Excess Return Index, multiplied by 2)(c)(f) | | | | | | | 06/15/16 | | | | 14,762,003 | | | | 13,680,357 | |
Total Commodity-Linked Securities (Cost $23,812,003) | | | | | | | | | | | | | | | 21,911,470 | |
| | | | |
| | | | | | | | | Shares | | | | |
Money Market Funds–83.88% | | | | | | | | | | | | | | | | |
Government & Agency Portfolio—Institutional Class, 0.13%(g) | | | | | | | | | | | 134,960,050 | | | | 134,960,050 | |
Invesco V.I. Money Market Fund—Series I, 0.01%(g) | | | | | | | | | | | 16,640,310 | | | | 16,640,310 | |
Liquid Assets Portfolio—Institutional Class, 0.29%(g) | | | | | | | | | | | 148,682,630 | | | | 148,682,630 | |
Premier Portfolio—Institutional Class, 0.24%(g) | | | | | | | | | | | 106,875,235 | | | | 106,875,235 | |
STIC (Global Series) PLC—U.S. Dollar Liquidity Portfolio—Institutional Class (Ireland), 0.23%(c)(g) | | | | | | | | | | | 119,336,753 | | | | 119,336,753 | |
STIC Prime Portfolio—Institutional Class, 0.26%(g) | | | | | | | | | | | 122,067,556 | | | | 122,067,556 | |
Treasury Portfolio—Institutional Class, 0.13%(g) | | | | | | | | | | | 161,924,714 | | | | 161,924,714 | |
Total Money Market Funds (Cost $810,487,248) | | | | | | | | | | | | | | | 810,487,248 | |
TOTAL INVESTMENTS–99.53% (Cost $963,512,287) | | | | | | | | | | | | | | | 961,626,826 | |
OTHER ASSETS LESS LIABILITIES��0.47% | | | | | | | | | | | | | | | 4,581,539 | |
NET ASSETS–100.00% | | | | | | | | | | | | | | $ | 966,208,365 | |
See accompanying Notes to Consolidated Financial Statements which are an integral part of the financial statements.
Invesco V.I. Balanced-Risk Allocation Fund
| | | | | | | | | | | | | | | | | | | | | | |
| Open Futures Contracts(h) | |
| Futures Contracts | | Type of Contract | | | | | Number of Contracts | | | Expiration Month | | | Notional Value | | | Unrealized Appreciation (Depreciation) | |
Brent Crude(c) | | | Long | | | | | | 176 | | | | March-2016 | | | $ | 6,629,920 | | | $ | (2,677,466 | ) |
Gasoline Reformulated Blendstock Oxygenate Blending(c) | | | Long | | | | | | 234 | | | | February-2016 | | | | 12,491,388 | | | | 221,714 | |
Silver(c) | | | Long | | | | | | 323 | | | | March-2016 | | | | 22,291,845 | | | | (606,195 | ) |
WTI Crude(c) | | | Long | | | | | | 128 | | | | June-2016 | | | | 5,210,880 | | | | (653,399 | ) |
Subtotal-Commodity Risk | | | | | | | | | | | | | | | | | | | | | (3,715,346 | ) |
| | | | | | |
Australia 10 Year Bonds | | | Long | | | | | | 1,388 | | | | March-2016 | | | | 128,352,236 | | | | 510,884 | |
Canada 10 Year Bonds | | | Long | | | | | | 1,791 | | | | March-2016 | | | | 182,431,882 | | | | 3,525,444 | |
Euro Bonds | | | Long | | | | | | 864 | | | | March-2016 | | | | 148,279,300 | | | | (1,706,651 | ) |
Japan 10 Year Bonds | | | Long | | | | | | 77 | | | | March-2016 | | | | 95,478,847 | | | | 214,366 | |
Long Gilt | | | Long | | | | | | 1,128 | | | | March-2016 | | | | 194,169,967 | | | | (893,506 | ) |
U.S. Treasury 20 Year Bonds | | | Long | | | | | | 616 | | | | March-2016 | | | | 94,710,000 | | | | 123,008 | |
Subtotal — Interest Rate Risk | | | | | | | | | | | | | | | | | | | | | 1,773,545 | |
| | | | | | |
Dow Jones EURO STOXX 50 Index | | | Long | | | | | | 1,815 | | | | March-2016 | | | | 64,735,850 | | | | 1,320,177 | |
E-Mini S&P 500 Index | | | Long | | | | | | 501 | | | | March-2016 | | | | 50,986,770 | | | | 163,053 | |
FTSE 100 Index | | | Long | | | | | | 695 | | | | March-2016 | | | | 63,500,633 | | | | 2,522,540 | |
Hang Seng Index | | | Long | | | | | | 407 | | | | January-2016 | | | | 57,530,677 | | | | 121,692 | |
Russell 2000 Index Mini | | | Long | | | | | | 453 | | | | March-2016 | | | | 51,256,950 | | | | 852,330 | |
Tokyo Stock Price Index | | | Long | | | | | | 518 | | | | March-2016 | | | | 66,692,042 | | | | (1,389,695 | ) |
Subtotal — Equity Risk | | | | | | | | | | | | | | | | | | | | | 3,590,097 | |
Total Futures Contracts | | | | | | | $ | 1,648,296 | |
| | | | | | |
| | | | | | | | | | | | | | | | | | | | | | |
| Open Over-The-Counter Total Return Swap Agreements | |
| Swap Agreements | | Type of Contract | | | Counterparty | | Number of Contracts | | | Termination Date | | | Notional Value | | | Unrealized Appreciation (Depreciation) | |
Receive a return equal to the Barclays Commodity Strategy 1452 Excess Return Index and pay the product of (i) 0.33% of the Notional Amount multiplied by (ii) days in the period divided by 365.(c) | | | Long | | | Barclays Bank PLC | | | 20,800 | | | | October-2016 | | | $ | 7,794,205 | | | $ | 247,075 | |
Receive a return equal to the Barclays Commodity Strategy 1715 Excess Return Index and pay the product of (i) 0.45% of the Notional Amount multiplied by (ii) days in the period divided by 365.(c) | | | Long | | | Barclays Bank PLC | | | 24,200 | | | | May-2016 | | | | 6,959,596 | | | | 3,509 | |
Receive a return equal to the Monthly Rebalance Commodity Excess Return Index and pay the product of (i) 0.47% of the Notional Amount multiplied by (ii) days in the period divided by 365.(c) | | | Long | | | Cargill, Inc. | | | 14,500 | | | | May-2016 | | | | 13,845,390 | | | | 0 | |
Receive a return equal to the Single Commodity Index Excess Return and pay the product of (i) 0.12% of the Notional Amount multiplied by (ii) days in the period divided by 365.(c) | | | Long | | | Cargill, Inc. | | | 8,200 | | | | January-2016 | | | | 6,229,406 | | | | 0 | |
Receive a return equal to the CIBC Dynamic Roll LME Copper Excess Return Index 2 and pay the product of (i) 0.30% of the Notional Amount multiplied by (ii) days in the period divided by 365.(c) | | | Long | | | Canadian Imperial
Bank of Commerce | | | 330,500 | | | | April-2016 | | | | 19,725,529 | | | | 20,887 | |
Receive a return equal to the Goldman Sachs Alpha Basket B784 Excess Return Strategy and pay the product of (i) 0.40% of the Notional Amount multiplied by (ii) days in the period divided by 365.(c) | | | Long | | | Goldman Sachs
International | | | 43,200 | | | | May-2016 | | | | 11,521,077 | | | | 0 | |
Receive a return equal to the S&P GSCI Gold Index Excess Return and pay the product of (i) 0.09% of the Notional Amount multiplied by (ii) days in the period divided by 365.(c) | | | Long | | | J.P. Morgan Chase
Bank, N.A. | | | 155,500 | | | | October-2016 | | | | 13,951,662 | | | | (180,551 | ) |
See accompanying Notes to Consolidated Financial Statements which are an integral part of the financial statements.
Invesco V.I. Balanced-Risk Allocation Fund
| | | | | | | | | | | | | | | | | | | | |
| Open Over-The-Counter Total Return Swap Agreements—(continued) | |
| Swap Agreements | | Type of Contract | | Counterparty | | Number of Contracts | | | Termination Date | | | Notional Value | | | Unrealized Appreciation (Depreciation) | |
Receive a return equal to the MLCX Aluminum Annual Excess Return Index and pay the product of (i) 0.28% of the Notional Amount multiplied by (ii) days in the period divided by 365.(c) | | Long | | Merrill Lynch
International | | | 4,000 | | | | September-2016 | | | $ | 338,346 | | | $ | 0 | |
Receive a return equal to the Merrill Lynch Gold Excess Return Index and pay the product of (i) 0.14% of the Notional Amount multiplied by (ii) days in the period divided by 365.(c) | | Long | | Merrill Lynch
International | | | 120,500 | | | | June-2016 | | | | 16,805,051 | | | | 0 | |
Receive a return equal to the S&P GSCI Aluminum Dynamic Roll Index Excess Return and pay the product of (i) 0.38% of the Notional Amount multiplied by (ii) days in the period divided by 365.(c) | | Long | | Morgan Stanley
Capital Services
LLC | | | 235,000 | | | | October-2016 | | | | 19,646,502 | | | | 297,430 | |
Subtotal — Commodity Risk | | | | | | | | | | | | | | | | | | | 388,350 | |
Receive a return equal to Hang Seng Index Futures multiplied by the Notional Value | | Long | | Goldman Sachs
International | | | 28 | | | | February-2016 | | | | 3,957,884 | | | | 1,774 | |
Subtotal — Equity Risk | | | | | | | | | | | | | | | | | | | 1,774 | |
Total Swap Agreements | | | | | | | | | | | | | | | | | | $ | 390,124 | |
Investments Abbreviations:
| | |
| EMTN | | — European Medium Term Notes |
| LIBOR | | — London Interbank Offered Rate |
Index Information:
| | | | |
Canadian Imperial Bank of Commerce
Custom 3 Agriculture | | — | | a basket of indices that provide exposure to various components of the agriculture markets. The underlying commodities comprising the indices are: Coffee ‘C’, Corn, Cotton, Sugar, Soybeans, Soybean Meal Soybean Oil, and Wheat. |
Monthly Rebalance Commodity Excess
Return Index | | — | | a commodity index composed of futures contracts on Coffee ‘C’, Corn, Cotton No.2, Soybean Meal, Soybean Oil, Soybeans, Sugar No.11 and Wheat. |
Barclays Commodity Strategy 1452 Index | | — | | a commodity index that provides exposure to future contracts on Copper. |
Barclays Commodity Strategy 1715 Index | | — | | a commodity index that provides exposure to future contracts on Coffee ‘C’, Corn, Cotton, Soybeans, Soybean Meal, Soybean Oil, Sugar, and Wheat. |
Single Commodity Index Excess Return | | — | | a commodity index composed of future contracts on Gold. |
Goldman Sachs Alpha Basket B784
Excess Return Strategy | | — | | a basket of eight indices that provide exposure to various components of the agriculture markets. The underlying commodities comprising the indices are: Coffee ‘C’, Corn, Cotton, Soybean Meal, Soybean Oil, Soybeans, Sugar and Wheat. |
Notes to Consolidated Schedule of Investments:
| (a) | Securities traded on a discount basis. The interest rates shown represent the discount rates at the time of purchase by the Fund. |
| (b) | All or a portion of the value was pledged as collateral to cover margin requirements for open futures contracts. See Note 1L and Note 4. |
| (c) | The investment is owned by the subsidiary. See Note 5. |
| (d) | Interest or dividend rate is redetermined periodically. Rate shown is the rate in effect on December 31, 2015. |
| (e) | All or a portion of the value was designated as collateral for swap agreements. See Note 1M and Note 4. |
| (f) | Security purchased or received in a transaction exempt from registration under the Securities Act of 1933, as amended (the “1933 Act”). The security may be resold pursuant to an exemption from registration under the 1933 Act, typically to qualified institutional buyers. The aggregate value of these securities at December 31, 2015 was $21,911,470, which represented 2.27% of the Fund’s Net Assets. |
| (g) | The money market fund and the Fund are affiliated by having the same investment adviser. The rate shown is the 7-day SEC standardized yield as of December 31, 2015. |
| (h) | Futures collateralized by $5,560,000 cash held with Goldman Sachs & Co., the futures commission merchant. |
See accompanying Notes to Consolidated Financial Statements which are an integral part of the financial statements.
Invesco V.I. Balanced-Risk Allocation Fund
Consolidated Statement of Assets and Liabilities
December 31, 2015
Consolidated Statement of Operations
For the year ended December 31, 2015
| | | | |
Assets: | |
Investments, at value (Cost $153,025,039) | | $ | 151,139,578 | |
Investments in affiliated money market funds, at value and cost | | | 810,487,248 | |
Total investments, at value (Cost $963,512,287) | | | 961,626,826 | |
Cash | | | 587,127 | |
Receivable for: | | | | |
Deposits with brokers — futures | | | 5,560,000 | |
Fund shares sold | | | 274,849 | |
Dividends and interest | | | 110,213 | |
Swaps receivables | | | 13,634 | |
Premiums paid on swap agreements | | | 97 | |
Investment for trustee deferred compensation and retirement plans | | | 86,903 | |
Unrealized appreciation on swap agreements — OTC | | | 570,675 | |
Total assets | | | 968,830,324 | |
|
Liabilities: | |
Payable for: | | | | |
Fund shares reacquired | | | 241,445 | |
Swaps payable | | | 466,153 | |
Variation margin — futures | | | 501,471 | |
Accrued fees to affiliates | | | 1,076,675 | |
Accrued trustees’ and officers’ fees and benefits | | | 279 | |
Accrued other operating expenses | | | 53,938 | |
Trustee deferred compensation and retirement plans | | | 101,447 | |
Unrealized depreciation on swap agreements — OTC | | | 180,551 | |
Total liabilities | | | 2,621,959 | |
Net assets applicable to shares outstanding | | $ | 966,208,365 | |
|
Net assets consist of: | |
Shares of beneficial interest | | $ | 964,762,663 | |
Undistributed net investment income (loss) | | | 1,567,191 | |
Undistributed net realized gain (loss) | | | (274,055 | ) |
Net unrealized appreciation | | | 152,566 | |
| | | $ | 966,208,365 | |
| |
Net Assets: | | | | |
Series I | | $ | 26,854,092 | |
Series II | | $ | 939,354,273 | |
| |
Shares outstanding, $0.001 par value per share, with an unlimited number of shares authorized: | | | | |
Series I | | | 2,632,559 | |
Series II | | | 93,145,718 | |
Series I: | | | | |
Net asset value and offering price per share | | $ | 10.20 | |
Series II: | | | | |
Net asset value per share | | $ | 10.08 | |
| | | | |
Investment income: | |
Dividends from affiliated money market funds | | $ | 658,258 | |
Interest | | | 139,326 | |
Total investment income | | | 797,584 | |
| |
Expenses: | | | | |
Advisory fees | | | 9,445,443 | |
Administrative services fees | | | 2,224,275 | |
Custodian fees | | | 25,311 | |
Distribution fees — Series II | | | 2,516,726 | |
Transfer agent fees | | | 22,538 | |
Trustees’ and officers’ fees and benefits | | | 36,333 | |
Other | | | 101,757 | |
Total expenses | | | 14,372,383 | |
Less: Fees waived | | | (4,732,868 | ) |
Net expenses | | | 9,639,515 | |
Net investment income (loss) | | | (8,841,931 | ) |
| |
Realized and unrealized gain (loss) from: | | | | |
Net realized gain (loss) from: | | | | |
Investment securities | | | (9,327,992 | ) |
Foreign currencies | | | (238,284 | ) |
Futures contracts | | | 4,317,390 | |
Swap agreements | | | (22,502,006 | ) |
| | | | (27,750,892 | ) |
Change in net unrealized appreciation (depreciation) of: | | | | |
Investment securities | | | 2,020,367 | |
Foreign currencies | | | (146 | ) |
Futures contracts | | | (11,832,436 | ) |
Swap agreements | | | 702,821 | |
| | | | (9,109,394 | ) |
Net realized and unrealized gain (loss) | | | (36,860,286 | ) |
Net increase (decrease) in net assets resulting from operations | | $ | (45,702,217 | ) |
See accompanying Notes to Consolidated Financial Statements which are an integral part of the financial statements.
Invesco V.I. Balanced-Risk Allocation Fund
Consolidated Statement of Changes in Net Assets
For the years ended December 31, 2015 and 2014
| | | | | | | | |
| | | 2015 | | | 2014 | |
Operations: | | | | | |
Net investment income (loss) | | $ | (8,841,931 | ) | | $ | (11,788,758 | ) |
Net realized gain (loss) | | | (27,750,892 | ) | | | 84,160,472 | |
Change in net unrealized appreciation (depreciation) | | | (9,109,394 | ) | | | (4,269,630 | ) |
Net increase (decrease) in net assets resulting from operations | | | (45,702,217 | ) | | | 68,102,084 | |
| | |
Distributions to shareholders from net investment income: | | | | | | | | |
Series I | | | (1,076,721 | ) | | | — | |
Series ll | | | (38,929,666 | ) | | | — | |
Total distributions from net investment income | | | (40,006,387 | ) | | | — | |
| | |
Distributions to shareholders from net realized gains: | | | | | | | | |
Series l | | | (2,241,364 | ) | | | (588,237 | ) |
Series ll | | | (87,763,065 | ) | | | (78,667,991 | ) |
Total distributions from net realized gains | | | (90,004,429 | ) | | | (79,256,228 | ) |
| | |
Share transactions–net: | | | | | | | | |
Series l | | | 20,107,013 | | | | 2,645,706 | |
Series ll | | | 107,582,311 | | | | (355,564,687 | ) |
Net increase (decrease) in net assets resulting from share transactions | | | 127,689,324 | | | | (352,918,981 | ) |
Net increase (decrease) in net assets | | | (48,023,709 | ) | | | (364,073,125 | ) |
| | |
Net assets: | | | | | | | | |
Beginning of year | | | 1,014,232,074 | | | | 1,378,305,199 | |
End of year (includes undistributed net investment income (loss) of $1,567,191 and $40,798,593, respectively) | | $ | 966,208,365 | | | $ | 1,014,232,074 | |
Consolidated Notes to Financial Statements
December 31, 2015
NOTE 1—Significant Accounting Policies
Invesco V.I. Balanced-Risk Allocation Fund (the “Fund”) is a series portfolio of AIM Variable Insurance Funds (Invesco Variable Insurance Funds) (the “Trust”). The Trust is a Delaware statutory trust registered under the Investment Company Act of 1940, as amended (the “1940 Act”), as an open-end series management investment company consisting of twenty-four separate portfolios, (each constituting a “Fund”). The assets, liabilities and operations of each portfolio are accounted for separately. Information presented in these consolidated financial statements pertains only to the Fund. Matters affecting each Fund or class will be voted on exclusively by the shareholders of such Fund or class. Current Securities and Exchange Commission (“SEC”) guidance, however, requires participating insurance companies offering separate accounts to vote shares proportionally in accordance with the instructions of the contract owners whose investments are funded by shares of each Fund or class.
The Fund will seek to gain exposure to the commodity markets primarily through investments in the Invesco Cayman Commodity Fund IV Ltd. (the “Subsidiary”), a wholly-owned subsidiary of the Fund organized under the laws of the Cayman Islands. The Subsidiary was organized by the Fund to invest in commodity-linked derivatives and other securities that may provide leveraged and non-leveraged exposure to commodities. The Fund may invest up to 25% of its total assets in the Subsidiary.
The Fund’s investment objective is total return with a low to moderate correlation to traditional financial market indices.
The Fund currently offers two classes of shares, Series I and Series II, both of which are offered to insurance company separate accounts funding variable annuity contracts and variable life insurance policies (“variable products”).
The following is a summary of the significant accounting policies followed by the Fund in the preparation of its consolidated financial statements.
| A. | Security Valuations — Securities, including restricted securities, are valued according to the following policy. |
Debt obligations (including convertible securities) and unlisted equities are fair valued using an evaluated quote provided by an independent pricing service. Evaluated quotes provided by the pricing service may be determined without exclusive reliance on quoted prices, and may reflect appropriate factors such as institution-size trading in similar groups of securities, developments related to specific securities, dividend rate (for unlisted equities), yield (for debt obligations), quality, type of issue, coupon rate (for debt obligations), maturity (for debt obligations), individual trading characteristics and other market data. Debt obligations are subject to interest rate and credit risks. In addition, all debt obligations involve some risk of default with respect to interest and/or principal payments.
A security listed or traded on an exchange (except convertible securities) is valued at its last sales price or official closing price as of the close of the customary trading session on the exchange where the security is principally traded, or lacking any sales or official closing price on a particular day, the security may be valued at the closing bid price on that day. Securities traded in the over-the-counter market are valued based on prices furnished by independent pricing services or market makers. When such securities are valued by an independent pricing service they
Invesco V.I. Balanced-Risk Allocation Fund
may be considered fair valued. Futures contracts are valued at the final settlement price set by an exchange on which they are principally traded. Listed options are valued at the mean between the last bid and asked prices from the exchange on which they are principally traded. Options not listed on an exchange are valued by an independent source at the mean between the last bid and asked prices. For purposes of determining net asset value (“NAV”) per share, futures and option contracts generally are valued 15 minutes after the close of the customary trading session of the New York Stock Exchange (“NYSE”).
Investments in open-end and closed-end registered investment companies that do not trade on an exchange are valued at the end-of-day net asset value per share. Investments in open-end and closed-end registered investment companies that trade on an exchange are valued at the last sales price or official closing price as of the close of the customary trading session on the exchange where the security is principally traded.
Swap agreements are fair valued using an evaluated quote, if available, provided by an independent pricing service. Evaluated quotes provided by the pricing service are valued based on a model which may include end-of-day net present values, spreads, ratings, industry, company performance and returns of referenced assets.
Foreign securities’ (including foreign exchange contracts) prices are converted into U.S. dollar amounts using the applicable exchange rates as of the close of the NYSE. If market quotations are available and reliable for foreign exchange-traded equity securities, the securities will be valued at the market quotations. Because trading hours for certain foreign securities end before the close of the NYSE, closing market quotations may become unreliable. If between the time trading ends on a particular security and the close of the customary trading session on the NYSE, events occur that the Adviser determines are significant and make the closing price unreliable, the Fund may fair value the security. If the event is likely to have affected the closing price of the security, the security will be valued at fair value in good faith using procedures approved by the Board of Trustees. Adjustments to closing prices to reflect fair value may also be based on a screening process of an independent pricing service to indicate the degree of certainty, based on historical data, that the closing price in the principal market where a foreign security trades is not the current value as of the close of the NYSE. Foreign securities’ prices meeting the approved degree of certainty that the price is not reflective of current value will be priced at the indication of fair value from the independent pricing service. Multiple factors may be considered by the independent pricing service in determining adjustments to reflect fair value and may include information relating to sector indices, American Depositary Receipts and domestic and foreign index futures. Foreign securities may have additional risks including exchange rate changes, potential for sharply devalued currencies and high inflation, political and economic upheaval, the relative lack of issuer information, relatively low market liquidity and the potential lack of strict financial and accounting controls and standards.
Securities for which market prices are not provided by any of the above methods may be valued based upon quotes furnished by independent sources. The last bid price may be used to value equity securities. The mean between the last bid and asked prices is used to value debt obligations, including corporate loans.
Securities for which market quotations are not readily available or became unreliable are valued at fair value as determined in good faith by or under the supervision of the Trust’s officers following procedures approved by the Board of Trustees. Issuer specific events, market trends, bid/asked quotes of brokers and information providers and other market data may be reviewed in the course of making a good faith determination of a security’s fair value.
The Fund may invest in securities that are subject to interest rate risk, meaning the risk that the prices will generally fall as interest rates rise and, conversely, the prices will generally rise as interest rates fall. Specific securities differ in their sensitivity to changes in interest rates depending on their individual characteristics. Changes in interest rates may result in increased market volatility, which may affect the value and/or liquidity of certain Fund investments.
Valuations change in response to many factors including the historical and prospective earnings of the issuer, the value of the issuer’s assets, general economic conditions, interest rates, investor perceptions and market liquidity. Because of the inherent uncertainties of valuation, the values reflected in the consolidated financial statements may materially differ from the value received upon actual sale of those investments.
| B. | Securities Transactions and Investment Income — Securities transactions are accounted for on a trade date basis. Realized gains or losses on sales are computed on the basis of specific identification of the securities sold. Interest income (net of withholding tax, if any) is recorded on the accrual basis from settlement date. Dividend income (net of withholding tax, if any) is recorded on the ex-dividend date. Bond premiums and discounts are amortized and/or accreted for financial reporting purposes. |
The Fund may periodically participate in litigation related to Fund investments. As such, the Fund may receive proceeds from litigation settlements. Any proceeds received are included in the Consolidated Statement of Operations as realized gain (loss) for investments no longer held and as unrealized gain (loss) for investments still held.
Brokerage commissions and mark ups are considered transaction costs and are recorded as an increase to the cost basis of securities purchased and/or a reduction of proceeds on a sale of securities. Such transaction costs are included in the determination of net realized and unrealized gain (loss) from investment securities reported in the Consolidated Statement of Operations and the Consolidated Statement of Changes in Net Assets and the net realized and unrealized gains (losses) on securities per share in the Financial Highlights. Transaction costs are included in the calculation of the Fund’s net asset value and, accordingly, they reduce the Fund’s total returns. These transaction costs are not considered operating expenses and are not reflected in net investment income reported in the Consolidated Statement of Operations and the Consolidated Statement of Changes in Net Assets, or the net investment income per share and the ratios of expenses and net investment income reported in the Financial Highlights, nor are they limited by any expense limitation arrangements between the Fund and the investment adviser.
The Fund allocates income and realized and unrealized capital gains and losses to a class based on the relative net assets of each class.
| C. | Country Determination — For the purposes of making investment selection decisions and presentation in the Consolidated Schedule of Investments, the investment adviser may determine the country in which an issuer is located and/or credit risk exposure based on various factors. These factors include the laws of the country under which the issuer is organized, where the issuer maintains a principal office, the country in which the issuer derives 50% or more of its total revenues and the country that has the primary market for the issuer’s securities, as well as other criteria. Among the other criteria that may be evaluated for making this determination are the country in which the issuer maintains 50% or more of its assets, the type of security, financial guarantees and enhancements, the nature of the collateral and the sponsor organization. Country of issuer and/or credit risk exposure has been determined to be the United States of America, unless otherwise noted. |
| D. | Distributions — Distributions from net investment income and net realized capital gain, if any, are generally declared and paid to separate accounts of participating insurance companies annually and recorded on the ex-dividend date. |
Invesco V.I. Balanced-Risk Allocation Fund
| E. | Federal Income Taxes — The Fund intends to comply with the requirements of Subchapter M of the Internal Revenue Code of 1986, as amended (the “Internal Revenue Code”), necessary to qualify as a regulated investment company and to distribute substantially all of the Fund’s taxable earnings to shareholders. As such, the Fund will not be subject to federal income taxes on otherwise taxable income (including net realized capital gain) that is distributed to shareholders. Therefore, no provision for federal income taxes is recorded in the consolidated financial statements. |
The Fund recognizes the tax benefits of uncertain tax positions only when the position is more likely than not to be sustained. Management has analyzed the Fund’s uncertain tax positions and concluded that no liability for unrecognized tax benefits should be recorded related to uncertain tax positions. Management is not aware of any tax positions for which it is reasonably possible that the total amounts of unrecognized tax benefits will change materially in the next 12 months.
The Subsidiary is classified as a controlled foreign corporation under Subchapter N of the Internal Revenue Code. Therefore, the Fund is required to increase its taxable income by its share of the Subsidiary’s income. Net investment losses of the Subsidiary cannot be deducted by the Fund in the current period nor carried forward to offset taxable income in future periods.
The Fund files tax returns in the U.S. Federal jurisdiction and certain other jurisdictions. Generally the Fund is subject to examinations by such taxing authorities for up to three years after the filing of the return for the tax period.
| F. | Expenses — Fees provided for under the Rule 12b-1 plan of a particular class of the Fund and which are directly attributable to that class are charged to the operations of such class. All other expenses are allocated among the classes based on relative net assets. |
| G. | Accounting Estimates — The financial statements are prepared on a consolidated basis in conformity with accounting principles generally accepted in the United States of America (“GAAP”), which requires management to make estimates and assumptions that affect the reported amounts of assets and liabilities at the date of the financial statements and the reported amounts of revenues and expenses during the reporting period including estimates and assumptions related to taxation. Actual results could differ from those estimates by a significant amount. The accompanying financial statements reflect the financial position of the Fund and its Subsidiary and the results of operations on a consolidated basis. All inter-company accounts and transactions have been eliminated in consolidation. |
In addition, the Fund monitors for material events or transactions that may occur or become known after the period-end date and before the date the consolidated financial statements are released to print.
| H. | Indemnifications — Under the Trust’s organizational documents, each Trustee, officer, employee or other agent of the Trust, and under the Subsidiary’s organizational documents, the directors and officers of the Subsidiary, are indemnified against certain liabilities that may arise out of the performance of their duties to the Fund and/or the Subsidiary, respectively. Additionally, in the normal course of business, the Fund enters into contracts, including the Fund’s servicing agreements, that contain a variety of indemnification clauses. The Fund’s maximum exposure under these arrangements is unknown as this would involve future claims that may be made against the Fund that have not yet occurred. The risk of material loss as a result of such indemnification claims is considered remote. |
| I. | Foreign Currency Translations — Foreign currency is valued at the close of the NYSE based on quotations posted by banks and major currency dealers. Portfolio securities and other assets and liabilities denominated in foreign currencies are translated into U.S. dollar amounts at date of valuation. Purchases and sales of portfolio securities (net of foreign taxes withheld on disposition) and income items denominated in foreign currencies are translated into U.S. dollar amounts on the respective dates of such transactions. The Fund does not separately account for the portion of the results of operations resulting from changes in foreign exchange rates on investments and the fluctuations arising from changes in market prices of securities held. The combined results of changes in foreign exchange rates and the fluctuation of market prices on investments (net of estimated foreign tax withholding) are included with the net realized and unrealized gain or loss from investments in the Consolidated Statement of Operations. Reported net realized foreign currency gains or losses arise from (1) sales of foreign currencies, (2) currency gains or losses realized between the trade and settlement dates on securities transactions, and (3) the difference between the amounts of dividends, interest, and foreign withholding taxes recorded on the Fund’s books and the U.S. dollar equivalent of the amounts actually received or paid. Net unrealized foreign currency gains and losses arise from changes in the fair values of assets and liabilities, other than investments in securities at fiscal period end, resulting from changes in exchange rates. |
The Fund may invest in foreign securities, which may be subject to foreign taxes on income, gains on investments or currency repatriation, a portion of which may be recoverable. Foreign taxes, if any, are recorded based on the tax regulations and rates that exist in the foreign markets in which the Fund invests and are shown in the Consolidated Statement of Operations.
| J. | Forward Foreign Currency Contracts — The Fund may engage in foreign currency transactions either on a spot (i.e. for prompt delivery and settlement) basis, or through forward foreign currency contracts, to manage or minimize currency or exchange rate risk. |
The Fund may also enter into forward foreign currency contracts for the purchase or sale of a security denominated in a foreign currency in order to “lock in” the U.S. dollar price of that security, or the Fund may also enter into forward foreign currency contracts that do not provide for physical settlement of the two currencies, but instead are settled by a single cash payment calculated as the difference between the agreed upon exchange rate and the spot rate at settlement based upon an agreed upon notional amount (non-deliverable forwards). The Fund will set aside liquid assets in an amount equal to daily mark-to-market obligation for forward foreign currency contracts.
A forward foreign currency contract is an obligation between two parties (“Counterparties”) to purchase or sell a specific currency for an agreed-upon price at a future date. The use of forward foreign currency contracts does not eliminate fluctuations in the price of the underlying securities the Fund owns or intends to acquire but establishes a rate of exchange in advance. Fluctuations in the value of these contracts are measured by the difference in the contract date and reporting date exchange rates and are recorded as unrealized appreciation (depreciation) until the contracts are closed. When the contracts are closed, realized gains (losses) are recorded. Realized and unrealized gains (losses) on the contracts are included in the Consolidated Statement of Operations. The primary risks associated with forward foreign currency contracts include failure of the Counterparty to meet the terms of the contract and the value of the foreign currency changing unfavorably. These risks may be in excess of the amounts reflected in the Consolidated Statement of Assets and Liabilities.
| K. | Structured Securities — The Fund may invest in structured securities. Structured securities are a type of derivative security whose value is determined by reference to changes in the value of underlying securities, currencies, interest rates, commodities, indices or other financial indicators (“reference instruments”). Most structured securities are fixed-income securities that have maturities of three years or less. Structured securities may be positively or negatively indexed (i.e., their principal value or interest rates may increase or decrease if the underlying reference instrument appreciates) and may have return characteristics similar to direct investments in the underlying reference instrument. |
Invesco V.I. Balanced-Risk Allocation Fund
Structured securities may entail a greater degree of market risk than other types of debt securities because the investor bears the risk of the reference instruments. In addition to the credit risk of structured securities and the normal risks of price changes in response to changes in interest rates, the principal amount of structured notes or indexed securities may decrease as a result of changes in the value of the underlying reference instruments. Changes in the daily value of structured securities are recorded as unrealized gains (losses) in the Consolidated Statement of Operations. When the structured securities mature or are sold, the Fund recognizes a realized gain (loss) on the Consolidated Statement of Operations.
| L. | Futures Contracts — The Fund may enter into futures contracts to manage exposure to interest rate, equity and market price movements and/or currency risks. A futures contract is an agreement between Counterparties to purchase or sell a specified underlying security, currency or commodity (or delivery of a cash settlement price, in the case of an index future) for a fixed price at a future date. The Fund currently invests only in exchange-traded futures and they are standardized as to maturity date and underlying financial instrument. Initial margin deposits required upon entering into futures contracts are satisfied by the segregation of specific securities or cash as collateral at the futures commission merchant (broker). During the period the futures contracts are open, changes in the value of the contracts are recognized as unrealized gains or losses by recalculating the value of the contracts on a daily basis. Subsequent or variation margin payments are received or made depending upon whether unrealized gains or losses are incurred. These amounts are reflected as receivables or payables on the Consolidated Statement of Assets and Liabilities. When the contracts are closed or expire, the Fund recognizes a realized gain or loss equal to the difference between the proceeds from, or cost of, the closing transaction and the Fund’s basis in the contract. The net realized gain (loss) and the change in unrealized gain (loss) on futures contracts held during the period is included on the Consolidated Statement of Operations. The primary risks associated with futures contracts are market risk and the absence of a liquid secondary market. If the Fund were unable to liquidate a futures contract and/or enter into an offsetting closing transaction, the Fund would continue to be subject to market risk with respect to the value of the contracts and continue to be required to maintain the margin deposits on the futures contracts. Futures contracts have minimal Counterparty risk since the exchange’s clearinghouse, as Counterparty to all exchange-traded futures, guarantees the futures against default. Risks may exceed amounts recognized in the Consolidated Statement of Assets and Liabilities. |
| M. | Swap Agreements — The Fund may enter into various swap transactions, including interest rate, total return, index, currency and credit default swap contracts (“CDS”) for investment purposes or to manage interest rate, currency or credit risk. Such transactions are agreements between Counterparties. These agreements may contain among other conditions, events of default and termination events, and various covenants and representations such as provisions that require the Fund to maintain a pre-determined level of net assets, and/or provide limits regarding the decline of the Fund’s NAV over specific periods of time. If the Fund were to trigger such provisions and have open derivative positions at that time, the Counterparty may be able to terminate such agreement and request immediate payment in an amount equal to the net liability positions, if any. |
Interest rate, total return, index, and currency swap agreements are two-party contracts (traded over-the-counter (“OTC”)) entered into primarily to exchange the returns (or differentials in rates of returns) earned or realized on particular predetermined investments or instruments. The gross returns to be exchanged or “swapped” between the parties are calculated with respect to a notional amount, i.e., the return on or increase in value of a particular dollar amount invested at a particular interest rate or return of an underlying asset, in a particular foreign currency, or in a “basket” of securities representing a particular index. At the maturity date, a net cash flow is exchanged where the total return is equivalent to the return of the underlying reference less a financing rate, if any. As a receiver, the Fund would receive payments based on any positive total return and would owe payments in the event of a negative total return. As the payer, the Fund would owe payments on any net positive total return, and would receive payment in the event of a negative total return.
Changes in the value of swap agreements are recognized as unrealized gains (losses) in the Consolidated Statement of Operations by “marking to market” on a daily basis to reflect the value of the swap agreement at the end of each trading day. Payments received or paid at the beginning of the agreement are reflected as such on the Consolidated Statement of Assets and Liabilities and may be referred to as upfront payments. The Fund accrues for the fixed payment stream and amortizes upfront payments, if any, on swap agreements on a daily basis with the net amount, recorded as a component of realized gain (loss) on the Consolidated Statement of Operations. A liquidation payment received or made at the termination of a swap agreement is recorded as realized gain (loss) on the Consolidated Statement of Operations. The Fund segregates liquid securities having a value at least equal to the amount of the potential obligation of a Fund under any swap transaction. Entering into these agreements involves, to varying degrees, lack of liquidity and elements of credit, market, and Counterparty risk in excess of amounts recognized on the Consolidated Statement of Assets and Liabilities. Such risks involve the possibility that a swap is difficult to sell or liquidate; the Counterparty does not honor its obligations under the agreement and unfavorable interest rates and market fluctuations. It is possible that developments in the swaps market, including potential government regulation, could adversely affect the Fund’s ability to terminate existing swap agreements or to realize amounts to be received under such agreements. A short position in a security poses more risk than holding the same security long. As there is no limit on how much the price of the security can increase, the Fund’s exposure is unlimited.
| N. | Leverage Risk — Leverage exists when the Fund can lose more than it originally invests because it purchases or sells an instrument or enters into a transaction without investing an amount equal to the full economic exposure of the instrument or transaction. |
| O. | Other Risks — The Fund will seek to gain exposure to commodity markets primarily through an investment in the Subsidiary and through investments in exchange traded funds and commodity-linked derivatives. The Subsidiary, unlike the Fund, may invest without limitation in commodities, commodity-linked derivatives and other securities, such as exchange traded notes, that may provide leveraged and non-leveraged exposure to commodity markets. The Fund is indirectly exposed to the risks associated with the Subsidiary’s investments. |
The Fund is non-diversified and may invest in securities of fewer issuers than if it were diversified. Thus, the value of the Fund’s shares may vary more widely and the Fund may be subject to greater market and credit risk than if the Fund invested more broadly.
| P. | Collateral — To the extent the Fund has designated or segregated a security as collateral and that security is subsequently sold, it is the Fund’s practice to replace such collateral no later than the next business day. |
Invesco V.I. Balanced-Risk Allocation Fund
NOTE 2—Advisory Fees and Other Fees Paid to Affiliates
The Trust has entered into a master investment advisory agreement with Invesco Advisers, Inc. (the “Adviser” or “Invesco”). Under the terms of the investment advisory agreement, the Fund pays an advisory fee to the Adviser less the amount paid by the Subsidiary to the Adviser based on the annual rate of the Fund’s average daily net assets as follows:
| | | | | | |
| Average Daily Net Assets | | Rate |
First $250 million | | | 0 | .95% | | |
Next $250 million | | | 0 | .925% | | |
Next $500 million | | | 0 | .90% | | |
Next $1.5 billion | | | 0 | .875% | | |
Next $2.5 billion | | | 0 | .85% | | |
Next $2.5 billion | | | 0 | .825% | | |
Next $2.5 billion | | | 0 | .80% | | |
Over $10 billion | | | 0 | .775% | | |
For the year ended December 31, 2015, the effective advisory fees incurred by the Fund was 0.92%.
The Subsidiary has entered into a separate contract with the Adviser whereby the Adviser provides investment advisory and other services to the Subsidiary. In consideration of these services, the Subsidiary pays an advisory fee to the Adviser based on the annual rate of the Subsidiary’s average daily net assets as set forth in the table above.
Under the terms of a master sub-advisory agreement between the Adviser and each of Invesco Asset Management Deutschland GmbH, Invesco Asset Management Limited, Invesco Asset Management (Japan) Limited, Invesco Hong Kong Limited, Invesco Senior Secured Management, Inc. and Invesco Canada Ltd. (collectively, the “Affiliated Sub-Advisers”) the Adviser, not the Fund, may pay 40% of the fees paid to the Adviser to any such Affiliated Sub-Adviser(s) that provide(s) discretionary investment management services to the Fund based on the percentage of assets allocated to such Affiliated Sub-Adviser(s).
The Adviser has contractually agreed, through at least April 30, 2016, to waive advisory fees and/or reimburse expenses of shares to the extent necessary to limit total annual fund operating expenses after fee waiver and/or expense reimbursement (excluding certain items discussed below) of Series I shares to 0.78% less net Acquired Fund Fees and Expenses and Series II shares to 1.03% less net Acquired Fund Fees and Expenses of average daily net assets. Prior to May 1, 2015, the Adviser had contractually agreed to waive advisory fees and/or reimburse expenses of shares to the extent necessary to limit total annual fund operating expenses after fee waiver and/or expense reimbursement to 0.76% and 1.01%, for Series I and Series II shares, less net Acquired Fund Fees and Expenses, respectively. In determining the Adviser’s obligation to waive advisory fees and/or reimburse expenses, the following expenses are not taken into account, and could cause the total annual fund operating expenses after fee waiver and/or expense reimbursement to exceed the numbers reflected above: (1) interest; (2) taxes; (3) dividend expense on short sales; (4) extraordinary or non-routine items, including litigation expenses; and (5) expenses that the Fund has incurred but did not actually pay because of an expense offset arrangement. Acquired Fund Fees and Expenses are not operating expenses of the Fund directly, but are fees and expenses, including management fees, of the investment companies in which the Fund invests. As a result, the total annual fund operating expenses after expense reimbursement may exceed the expense limits above. Unless Invesco continues the fee waiver agreement, it will terminate on April 30, 2016. The fee waiver agreement cannot be terminated during its term.
Further, the Adviser has contractually agreed, through at least June 30, 2017, to waive the advisory fee payable by the Fund in an amount equal to 100% of the net advisory fees the Adviser receives from the affiliated money market funds on investments by the Fund of uninvested cash in such affiliated money market funds.
For the year ended December 31, 2015, the Adviser waived advisory fees of $4,732,868.
The Trust has entered into a master administrative services agreement with Invesco pursuant to which the Fund has agreed to pay Invesco a fee for costs incurred in providing accounting services and fund administrative services to the Fund and to reimburse Invesco for administrative services fees paid to insurance companies that have agreed to provide services to the participants of separate accounts. These administrative services provided by the insurance companies may include, among other things: the printing of prospectuses, financial reports and proxy statements and the delivery of the same to existing participants; the maintenance of master accounts; the facilitation of purchases and redemptions requested by the participants; and the servicing of participants’ accounts. Pursuant to such agreement, for the year ended December 31, 2015, Invesco was paid $241,780 for accounting and fund administrative services and reimbursed $1,982,495 for services provided by insurance companies.
The Trust has entered into a transfer agency and service agreement with Invesco Investment Services, Inc. (“IIS”) pursuant to which the Fund has agreed to pay IIS a fee for providing transfer agency and shareholder services to the Fund and reimburse IIS for certain expenses incurred by IIS in the course of providing such services. For the year ended December 31, 2015, expenses incurred under the agreement are shown in the Consolidated Statement of Operations as Transfer agent fees.
The Trust has entered into a master distribution agreement with Invesco Distributors, Inc. (“IDI”) to serve as the distributor for the Fund. The Trust has adopted a plan pursuant to Rule 12b-1 under the 1940 Act with respect to the Fund’s Series II shares (the “Plan”). The Fund, pursuant to the Plan, pays IDI compensation at the annual rate of 0.25% of the Fund’s average daily net assets of Series II shares. Of the Plan payments, up to 0.25% of the average daily net assets of the Series II shares may be paid to insurance companies who furnish continuing personal shareholder services to customers who purchase and own Series II shares of the Fund. For the year ended December 31, 2015, expenses incurred under the Plan are detailed in the Consolidated Statement of Operations as Distribution fees.
Certain officers and trustees of the Trust are officers and directors of the Adviser, IIS and/or IDI.
Invesco V.I. Balanced-Risk Allocation Fund
NOTE 3—Additional Valuation Information
GAAP defines fair value as the price that would be received to sell an asset or paid to transfer a liability in an orderly transaction between market participants at the measurement date, under current market conditions. GAAP establishes a hierarchy that prioritizes the inputs to valuation methods, giving the highest priority to readily available unadjusted quoted prices in an active market for identical assets (Level 1) and the lowest priority to significant unobservable inputs (Level 3), generally when market prices are not readily available or are unreliable. Based on the valuation inputs, the securities or other investments are tiered into one of three levels. Changes in valuation methods may result in transfers in or out of an investment’s assigned level:
| | Level 1 — | Prices are determined using quoted prices in an active market for identical assets. |
| | Level 2 — | Prices are determined using other significant observable inputs. Observable inputs are inputs that other market participants may use in pricing a security. These may include quoted prices for similar securities, interest rates, prepayment speeds, credit risk, yield curves, loss severities, default rates, discount rates, volatilities and others. |
| | Level 3 — | Prices are determined using significant unobservable inputs. In situations where quoted prices or observable inputs are unavailable (for example, when there is little or no market activity for an investment at the end of the period), unobservable inputs may be used. Unobservable inputs reflect the Fund’s own assumptions about the factors market participants would use in determining fair value of the securities or instruments and would be based on the best available information. |
The following is a summary of the tiered valuation input levels, as of December 31, 2015. The level assigned to the securities valuations may not be an indication of the risk or liquidity associated with investing in those securities. Because of the inherent uncertainties of valuation, the values reflected in the consolidated financial statements may materially differ from the value received upon actual sale of those investments.
| | | | | | | | | | | | | | | | |
| | | Level 1 | | | Level 2 | | | Level 3 | | | Total | |
Money Market Funds | | $ | 810,487,248 | | | $ | — | | | $ | — | | | $ | 810,487,248 | |
U.S. Treasury Securities | | | — | | | | 129,228,108 | | | | — | | | | 129,228,108 | |
Commodity-Linked Securities | | | — | | | | 21,911,470 | | | | — | | | | 21,911,470 | |
| | | | 810,487,248 | | | | 151,139,578 | | | | — | | | | 961,626,826 | |
Futures Contracts* | | | 1,648,296 | | | | — | | | | — | | | | 1,648,296 | |
Swap Agreements* | | | — | | | | 390,124 | | | | — | | | | 390,124 | |
Total Investments | | $ | 812,135,544 | | | $ | 151,529,702 | | | $ | — | | | $ | 963,665,246 | |
| * | Unrealized appreciation. |
NOTE 4—Derivative Investments
Value of Derivative Investments at Period-End
The table below summarizes the value of the Fund’s derivative investments, detailed by primary risk exposure, held as of December 31, 2015:
| | | | | | | | |
| | | Value | |
| Risk Exposure/Derivative Type | | Assets | | | Liabilities | |
Commodity risk: | | | | | | | | |
Futures contracts(a) | | $ | 221,714 | | | $ | (3,937,060 | ) |
Swap agreements(b) | | | 568,901 | | | | (180,551 | ) |
Equity risk: | | | | | | | | |
Futures contracts(a) | | | 4,979,792 | | | | (1,389,695 | ) |
Swap agreements(b) | | | 1,774 | | | | — | |
Interest rate risk: | | | | | | | | |
Futures contracts(a) | | | 4,373,702 | | | | (2,600,157 | ) |
Total | | $ | 10,145,883 | | | $ | (8,107,463 | ) |
| (a) | Includes cumulative appreciation (depreciation) of futures contracts. Only current day’s variation margin receivable (payable) is reported within the Consolidated Statement of Assets and Liabilities. |
| (b) | Values are disclosed on the Consolidated Statement of Assets and Liabilities under the caption Unrealized appreciation on swap agreements — OTC and Unrealized depreciation on swap agreements — OTC. |
Invesco V.I. Balanced-Risk Allocation Fund
Effect of Derivative Investments for the year ended December 31, 2015
The table below summarizes the gains (losses) on derivative investments, detailed by primary risk exposure, recognized in earnings during the period:
| | | | | | | | |
| | | Location of Gain (Loss) on
Consolidated Statement of Operations | |
| | | Futures
Contracts | | | Swap
Agreements | |
Realized Gain (Loss): | | | | | | | | |
Commodity risk | | $ | (18,033,129 | ) | | $ | (22,352,346 | ) |
Interest rate risk | | | 22,733,394 | | | | 359,167 | |
Equity risk | | | (382,875 | ) | | | (508,827 | ) |
Change in Net Unrealized Appreciation (Depreciation): | | | | | | | | |
Commodity risk | | | 4,166,185 | | | | 1,438,335 | |
Interest rate risk | | | (13,607,243 | ) | | | (523,560 | ) |
Equity risk | | | (2,391,378 | ) | | | (211,954 | ) |
Total | | $ | (7,515,046 | ) | | $ | (21,799,185 | ) |
The table below summarizes the average notional value of futures contracts and swap agreements outstanding during the period.
| | | | | | | | |
| | | Futures
Contracts | | | Swap
Agreements | |
Average notional value | | $ | 1,290,135,802 | | | $ | 136,739,524 | |
Offsetting Assets and Liabilities
Accounting Standards Update (“ASU”) No. 2011-11, Disclosures about Offsetting Assets and Liabilities, which was subsequently clarified in Financial Accounting Standards Board ASU 2013-01 “Clarifying the Scope of Disclosures about Offsetting Assets and Liabilities” is intended to enhance disclosures about financial instruments and derivative instruments that are subject to offsetting arrangements on the Consolidated Statement of Assets and Liabilities and to enable investors to better understand the effect of those arrangements on the Fund’s financial position. In order for an arrangement to be eligible for netting, the Fund must have a basis to conclude that such netting arrangements are legally enforceable. The Fund enters into netting agreements and collateral agreements in an attempt to reduce the Fund’s Counterparty credit risk by providing for a single net settlement with a Counterparty of all financial transactions covered by the agreement in an event of default as defined under such agreement.
The following tables present derivative instruments that are either subject to an enforceable netting agreement or offset by collateral arrangements as of December 31, 2015.
| | | | | | | | | | | | | | | | | | | | |
| Counterparty | | Gross amounts
of Recognized
Assets | | | Gross Amounts Not Offset in the
Consolidated Statement of Assets and Liabilities | | | Net
Amount | |
| | | Financial
Instruments | | | Collateral Received | | |
| | | | Non-Cash | | | Cash | | |
Fund | | | | | | | | | | | | | | | | | | | | |
Goldman Sachs International | | $ | 1,774 | | | $ | — | | | $ | (1,774 | ) | | $ | — | | | $ | — | |
| | | | | |
Subsidiary | | | | | | | | | | | | | | | | | | | | |
Barclays Bank PLC | | | 250,584 | | | | (2,657 | ) | | | — | | | | — | | | | 247,927 | |
Canadian Imperial Bank of Commerce | | | 20,887 | | | | (3,404 | ) | | | — | | | | — | | | | 17,483 | |
J.P. Morgan Chase Bank, N.A. | | | 97 | | | | (97 | ) | | | — | | | | — | | | | — | |
Merrill Lynch International | | | 13,634 | | | | (13,634 | ) | | | — | | | | — | | | | — | |
Morgan Stanley Capital Services LLC | | | 297,430 | | | | (3,270 | ) | | | — | | | | (294,160 | ) | | | — | |
Subtotal — Subsidiary | | $ | 582,632 | | | $ | (23,062 | ) | | $ | — | | | $ | (294,160 | ) | | $ | 265,410 | |
Total | | $ | 584,406 | | | $ | (23,062 | ) | | $ | (1,774 | ) | | $ | (294,160 | ) | | $ | 265,410 | |
| | | | | |
| | | | | | | | | | | | | | | | | | | | |
| Counterparty | | Gross amounts
of Recognized
Liabilities | | | Gross Amounts Not Offset in the
Consolidated Statement of Assets and Liabilities | | | Net
Amount | |
| | | Financial
Instruments | | | Collateral Pledged | | |
| | | | Non-Cash | | | Cash | | |
Subsidiary | | | | | | | | | | | | | | | | | | | | |
Barclays Bank PLC | | $ | 2,657 | | | $ | (2,657 | ) | | $ | — | | | $ | — | | | $ | — | |
Cargill, Inc. | | | 212,171 | | | | — | | | | (212,171 | ) | | | — | | | | — | |
Canadian Imperial Bank of Commerce | | | 3,404 | | | | (3,404 | ) | | | — | | | | — | | | | — | |
Goldman Sachs International | | | 155,753 | | | | — | | | | (155,753 | ) | | | — | | | | — | |
J.P. Morgan Chase Bank, N.A. | | | 180,895 | | | | (97 | ) | | | (180,798 | ) | | | — | | | | — | |
Merrill Lynch International | | | 88,554 | | | | (13,634 | ) | | | (74,920 | ) | | | — | | | | — | |
Morgan Stanley Capital Services LLC | | | 3,270 | | | | (3,270 | ) | | | — | | | | — | | | | — | |
Total | | $ | 646,704 | | | $ | (23,062 | ) | | $ | (623,642 | ) | | $ | — | | | $ | — | |
Invesco V.I. Balanced-Risk Allocation Fund
NOTE 5—Subsidiary Information
The Fund’s Consolidated Schedule of Investments includes the holdings, including any investments in derivatives, of both the Fund and the Subsidiary. The Fund’s Consolidated Statement of Assets and Liabilities, Consolidated Statement of Operations and Consolidated Statement of Changes in Net Assets include the account balances of both the Fund and the Subsidiary and all interfund transactions have been eliminated.
The table below summarizes the financial information of the Subsidiary recognized in the consolidated financial statements referred to above.
| | | | |
| Selected Financial Information | | Invesco Cayman
Commodity Fund IV Ltd.
(the “Subsidiary”) | |
Total assets | | $ | 227,991,136 | |
Total liabilities | | | 203,726 | |
Net assets | | | 227,787,410 | |
Total investment income | | | 193,312 | |
Net investment income (loss) | | | (2,095,408 | ) |
Net realized gain (loss) from: | | | | |
Futures contracts | | | (18,033,129 | ) |
Swap agreements | | | (22,352,346 | ) |
Change in net unrealized appreciation of: | | | | |
Investment securities | | | 2,014,266 | |
Futures contracts | | | 4,166,185 | |
Swap agreements | | | 1,438,335 | |
Increase (decrease) in net assets resulting from operations | | $ | (34,862,097 | ) |
NOTE 6—Trustees’ and Officers’ Fees and Benefits
Trustees’ and Officers’ Fees and Benefits include amounts accrued by the Fund to pay remuneration to certain Trustees and Officers of the Fund. Trustees have the option to defer compensation payable by the Fund, and Trustees’ and Officers’ Fees and Benefits also include amounts accrued by the Fund to fund such deferred compensation amounts. Those Trustees who defer compensation have the option to select various Invesco Funds in which their deferral accounts shall be deemed to be invested. Finally, certain current Trustees were eligible to participate in a retirement plan that provided for benefits to be paid upon retirement to Trustees over a period of time based on the number of years of service. The Fund may have certain former Trustees who also participate in a retirement plan and receive benefits under such plan. Trustees’ and Officers’ Fees and Benefits include amounts accrued by the Fund to fund such retirement benefits. Obligations under the deferred compensation and retirement plans represent unsecured claims against the general assets of the Fund.
NOTE 7—Cash Balances
The Fund is permitted to temporarily carry a negative or overdrawn balance in its account with State Street Bank and Trust Company, the custodian bank. Such balances, if any at period end, are shown in the Consolidated Statement of Assets and Liabilities under the payable caption Amount due custodian. To compensate the custodian bank for such overdrafts, the overdrawn Fund may either (1) leave funds as a compensating balance in the account so the custodian bank can be compensated by earning the additional interest; or (2) compensate by paying the custodian bank at a rate agreed upon by the custodian bank and Invesco, not to exceed the contractually agreed upon rate.
NOTE 8—Distributions to Shareholders and Tax Components of Net Assets
Tax Character of Distributions to Shareholders Paid During the Fiscal Years Ended December 31, 2015 and 2014:
| | | | | | | | |
| | | 2015 | | | 2014 | |
Ordinary income | | $ | 82,398,323 | | | $ | 43,655,744 | |
Long-term capital gain | | | 47,612,493 | | | | 35,600,484 | |
Total distributions | | $ | 130,010,816 | | | $ | 79,256,228 | |
Tax Components of Net Assets at Period-End:
| | | | |
| | | 2015 | |
Undistributed ordinary income | | $ | 2,064,446 | |
Net unrealized appreciation (depreciation) — investments | | | (1,887,816 | ) |
Net unrealized appreciation — other investments | | | 2,984,077 | |
Temporary book/tax differences | | | (106,550 | ) |
Capital loss carryforward | | | (1,608,455 | ) |
Shares of beneficial interest | | | 964,762,663 | |
Total net assets | | $ | 966,208,365 | |
Invesco V.I. Balanced-Risk Allocation Fund
The difference between book-basis and tax-basis unrealized appreciation (depreciation) is due to differences in the timing of recognition of gains and losses on investments for tax and book purposes. The Fund’s net unrealized appreciation (depreciation) difference is attributable primarily to futures contracts.
The temporary book/tax differences are a result of timing differences between book and tax recognition of income and/or expenses. The Fund’s temporary book/tax differences are the result of the trustee deferral of compensation and retirement plan benefits.
Capital loss carryforward is calculated and reported as of a specific date. Results of transactions and other activity after that date may affect the amount of capital loss carryforward actually available for the Fund to utilize. Capital losses generated in years beginning after December 22, 2010 can be carried forward for an unlimited period, whereas previous losses expire in eight tax years. Capital losses with an expiration period may not be used to offset capital gains until all net capital losses without an expiration date have been utilized. Capital loss carryforwards with no expiration date will retain their character as either short-term or long-term capital losses instead of as short-term capital losses as under prior law. The ability to utilize capital loss carryforwards in the future may be limited under the Internal Revenue Code and related regulations based on the results of future transactions.
The Fund has a capital loss carryforward as of December 31, 2015, which expires as follows:
| | | | | | | | | | | | |
| Capital Loss Carryforward* | |
| Expiration | | Short-Term | | | Long-Term | | | Total | |
Not subject to expiration | | $ | — | | | $ | 1,608,455 | | | $ | 1,608,455 | |
| * | Capital loss carryforward as of the date listed above is reduced for limitations, if any, to the extent required by the Internal Revenue Code and may be further limited depending upon a variety of factors, including the realization of net unrealized gains or losses as of the date of any reorganization. |
NOTE 9—Investment Securities
The aggregate amount of investment securities (other than short-term securities, U.S. Treasury obligations and money market funds, if any) purchased and sold by the Fund during the year ended December 31, 2015 was $23,812,003 and $23,515,182, respectively. During the same period, purchases and sales of U.S. Treasury obligations were $37,513,662 and $19,708,986, respectively. Cost of investments on a tax basis includes the adjustments for financial reporting purposes as of the most recently completed federal income tax reporting period-end.
| | | | |
| Unrealized Appreciation (Depreciation) of Investment Securities on a Tax Basis | |
Aggregate unrealized appreciation of investment securities | | $ | 15,515 | |
Aggregate unrealized (depreciation) of investment securities | | | (1,903,331 | ) |
Net unrealized appreciation (depreciation) of investment securities | | $ | (1,887,816 | ) |
Cost of investments for tax purposes is $963,514,642.
NOTE 10—Reclassification of Permanent Differences
Primarily as a result of differing book/tax treatment of net operating losses, swap agreements and foreign currency transactions, on December 31, 2015, undistributed net investment income was increased by $9,616,916, undistributed net realized gain (loss) was increased by $36,595,674 and shares of beneficial interest was decreased by $46,212,590. This reclassification had no effect on the net assets of the Fund.
NOTE 11—Share Information
| | | | | | | | | | | | | | | | |
| | | Summary of Share Activity | |
| | | Years ended December 31, | |
| | | 2015(a) | | | 2014 | |
| | | Shares | | | Amount | | | Shares | | | Amount | |
Sold: | | | | | | | | | | | | | | | | |
Series I | | | 1,757,785 | | | $ | 21,010,182 | | | | 316,598 | | | $ | 4,028,214 | |
Series II | | | 14,484,245 | | | | 168,905,179 | | | | 14,185,151 | | | | 177,408,617 | |
| | | | |
Issued as reinvestment of dividends: | | | | | | | | | | | | | | | | |
Series I | | | 325,942 | | | | 3,318,085 | | | | 48,615 | | | | 588,237 | |
Series II | | | 12,581,205 | | | | 126,692,731 | | | | 6,566,610 | | | | 78,667,991 | |
| | | | |
Reacquired: | | | | | | | | | | | | | | | | |
Series I | | | (377,523 | ) | | | (4,221,254 | ) | | | (155,787 | ) | | | (1,970,745 | ) |
Series II | | | (16,310,112 | ) | | | (188,015,599 | ) | | | (50,545,455 | ) | | | (611,641,295 | ) |
Net increase (decrease) in share activity | | | 12,461,542 | | | $ | 127,689,324 | | | | (29,584,268 | ) | | $ | (352,918,981 | ) |
| (a) | There are entities that are record owners of more than 5% of the outstanding shares of the Fund and in the aggregate own 85% of the outstanding shares of the Fund. The Fund and the Fund’s principal underwriter or adviser, are parties to participation agreements with these entities whereby these entities sell units of interest in separate accounts funding variable products that are invested in the Fund. The Fund, Invesco and/or Invesco affiliates may make payments to these entities, which are considered to be related to the Fund, for providing services to the Fund, Invesco and/or Invesco affiliates including but not limited to services such as, securities brokerage, third party record keeping and account servicing and administrative services. The Fund has no knowledge as to whether all or any portion of the shares owned of record by these entities are also owned beneficially. |
Invesco V.I. Balanced-Risk Allocation Fund
NOTE 12—Financial Highlights
The following schedule presents financial highlights for a share of the Fund outstanding throughout the periods indicated.
| | | | | | | | | | | | | | | | | | | | | | | | | | | | | | | | | | | | | | | | | | | | | | | | | | | | | | | | | | | | | | | | | | | | | | |
| | | Net asset
value,
beginning
of period | | Net
investment
income
(loss)(a) | | Net gains
(losses)
on securities
(both
realized and
unrealized) | | Total from
investment
operations | | Dividends
from net
investment
income | | Distributions
from net
realized
gains | | Total
distributions | | Net asset
value, end
of period | | Total
return(b) | | Net assets,
end of period
(000’s omitted) | | Ratio of
expenses
to average
net assets
with fee waivers
and/or expenses
absorbed | | Ratio of
expenses
to average net
assets without
fee waivers
and/or expenses
absorbed | | Ratio of net
investment
income (loss)
to average
net assets | | Portfolio
turnover(c) |
Series I | | | | | | | | | | | | | | | | | | | | | | | | | | | | | | | | | | | | | | | | | | | | | | | | | | | | | | | | | | | | | | | | | | | | | | |
Year ended 12/31/15 | | | $ | 12.30 | | | | $ | (0.07 | ) | | | $ | (0.44 | ) | | | $ | (0.51 | ) | | | $ | (0.52 | ) | | | $ | (1.07 | ) | | | $ | (1.59 | ) | | | $ | 10.20 | | | | | (4.10 | )% | | | $ | 26,854 | | | | | 0.69 | %(d) | | | | 1.15 | %(d) | | | | (0.61 | )%(d) | | | | 44 | % |
Year ended 12/31/14 | | | | 12.30 | | | | | (0.08 | ) | | | | 0.80 | | | | | 0.72 | | | | | — | | | | | (0.72 | ) | | | | (0.72 | ) | | | | 12.30 | | | | | 5.91 | | | | | 11,397 | | | | | 0.69 | (e) | | | | 1.11 | | | | | (0.65 | ) | | | | 60 | |
Year ended 12/31/13 | | | | 12.65 | | | | | (0.08 | ) | | | | 0.30 | | | | | 0.22 | | | | | (0.21 | ) | | | | (0.36 | ) | | | | (0.57 | ) | | | | 12.30 | | | | | 1.70 | | | | | 8,821 | | | | | 0.70 | | | | | 1.11 | | | | | (0.65 | ) | | | | 76 | |
Year ended 12/31/12 | | | | 11.53 | | | | | (0.07 | ) | | | | 1.34 | | | | | 1.27 | | | | | (0.11 | ) | | | | (0.04 | ) | | | | (0.15 | ) | | | | 12.65 | | | | | 10.98 | | | | | 10,354 | | | | | 0.70 | (e) | | | | 1.15 | | | | | (0.59 | ) | | | | 188 | |
Year ended 12/31/11(f) | | | | 13.09 | | | | | (0.04 | ) | | | | 1.28 | | | | | 1.24 | | | | | (0.10 | ) | | | | (2.70 | ) | | | | (2.80 | ) | | | | 11.53 | | | | | 11.00 | | | | | 4,472 | | | | | 0.71 | (e) | | | | 1.22 | | | | | (0.32 | ) | | | | 142 | |
Series II | | | | | | | | | | | | | | | | | | | | | | | | | | | | | | | | | | | | | | | | | | | | | | | | | | | | | | | | | | | | | | | | | | | | | | |
Year ended 12/31/15 | | | | 12.17 | | | | | (0.10 | ) | | | | (0.44 | ) | | | | (0.54 | ) | | | | (0.48 | ) | | | | (1.07 | ) | | | | (1.55 | ) | | | | 10.08 | | | | | (4.40 | ) | | | | 939,354 | | | | | 0.94 | (d) | | | | 1.40 | (d) | | | | (0.86 | )(d) | | | | 44 | |
Year ended 12/31/14 | | | | 12.21 | | | | | (0.12 | ) | | | | 0.80 | | | | | 0.68 | | | | | — | | | | | (0.72 | ) | | | | (0.72 | ) | | | | 12.17 | | | | | 5.62 | | | | | 1,002,835 | | | | | 0.94 | (e) | | | | 1.36 | | | | | (0.90 | ) | | | | 60 | |
Year ended 12/31/13 | | | | 12.57 | | | | | (0.11 | ) | | | | 0.30 | | | | | 0.19 | | | | | (0.19 | ) | | | | (0.36 | ) | | | | (0.55 | ) | | | | 12.21 | | | | | 1.50 | | | | | 1,369,485 | | | | | 0.95 | | | | | 1.36 | | | | | (0.90 | ) | | | | 76 | |
Year ended 12/31/12 | | | | 11.49 | | | | | (0.10 | ) | | | | 1.32 | | | | | 1.22 | | | | | (0.10 | ) | | | | (0.04 | ) | | | | (0.14 | ) | | | | 12.57 | | | | | 10.64 | | | | | 1,343,806 | | | | | 0.95 | (e) | | | | 1.40 | | | | | (0.84 | ) | | | | 188 | |
Year ended 12/31/11(f) | | | | 13.05 | | | | | (0.07 | ) | | | | 1.27 | | | | | 1.20 | | | | | (0.06 | ) | | | | (2.70 | ) | | | | (2.76 | ) | | | | 11.49 | | | | | 10.61 | | | | | 257,898 | | | | | 0.96 | (e) | | | | 1.47 | | | | | (0.57 | ) | | | | 142 | |
| (a) | Calculated using average shares outstanding. |
| (b) | Includes adjustments in accordance with accounting principles generally accepted in the United States of America and as such, the net asset value for financial reporting purposes and the returns based upon those net asset values may differ from the net asset value and returns for shareholder transactions. Total returns are not annualized for periods less than one year, if applicable and do not reflect charges assessed in connection with a variable product, which if included would reduce total returns. |
| (c) | Portfolio turnover is calculated at the fund level and is not annualized for periods less than one year, if applicable. |
| (d) | Ratios are based on average daily net assets (000’s omitted) of $22,789 and $1,006,690 for Series I and Series II shares, respectively. |
| (e) | In addition to the fees and expenses which the Fund bears directly; the Fund indirectly bears a pro rata share of the fees and expenses of the underlying funds in which the Fund invests. Because the underlying funds have varied expenses and fee levels and the Fund may own different proportions at different times, the amount of fees and expenses incurred indirectly by the Fund will vary. Estimated underlying fund expenses are not expenses that are incurred directly by your Fund. They are expenses that are incurred directly by the underlying funds and are deducted from the value of the funds your Fund invests in. The effect of the estimated underlying fund expenses that you bear indirectly is included in your Fund’s total return. Estimated acquired fund fees from underlying funds were 0.09%, 0.02% and 0.04% for the years ended December 31, 2014, 2012 and 2011, respectively. |
| (f) | Prior to May 2, 2011, the Fund operated as Invesco Van Kampen V.I. Global Tactical Asset Allocation Fund (the “Predecessor Fund”). On such date, holders of the Predecessor Fund’s Series I and Series II shares received Series I and Series II shares, respectively, of the Fund. |
Invesco V.I. Balanced-Risk Allocation Fund
Report of Independent Registered Public Accounting Firm
To the Board of Trustees of AIM Variable Insurance Funds (Invesco Variable Insurance Funds)
and Shareholders of Invesco V.I. Balanced-Risk Allocation Fund:
In our opinion, the accompanying consolidated statement of assets and liabilities, including the consolidated schedule of investments, and the related consolidated statements of operations and of changes in net assets and the financial highlights present fairly, in all material respects, the financial position of Invesco V.I. Balanced-Risk Allocation Fund (one of the funds constituting AIM Variable Insurance Funds (Invesco Variable Insurance Funds), hereafter referred to as the “Fund”) at December 31, 2015, the results of its operations for the year then ended, the changes in its net assets for each of the two years in the period then ended and the financial highlights for each of the five years in the period then ended, in conformity with accounting principles generally accepted in the United States of America. These consolidated financial statements and financial highlights (hereafter referred to as “financial statements”) are the responsibility of the Fund’s management. Our responsibility is to express an opinion on these financial statements based on our audits. We conducted our audits of these financial statements in accordance with the standards of the Public Company Accounting Oversight Board (United States). Those standards require that we plan and perform the audit to obtain reasonable assurance about whether the financial statements are free of material misstatement. An audit includes examining, on a test basis, evidence supporting the amounts and disclosures in the financial statements, assessing the accounting principles used and significant estimates made by management, and evaluating the overall financial statement presentation. We believe that our audits, which included confirmation of securities at December 31, 2015 by correspondence with the custodian and brokers, provide a reasonable basis for our opinion.
PRICEWATERHOUSECOOPERS LLP
Houston, Texas
February 15, 2016
Invesco V.I. Balanced-Risk Allocation Fund
Calculating your ongoing Fund expenses
Example
As a shareholder of the Fund, you incur ongoing costs, including management fees; distribution and/or service fees (12b-1); and other Fund expenses. This example is intended to help you understand your ongoing costs (in dollars) of investing in the Fund and to compare these costs with ongoing costs of investing in other mutual funds. The example is based on an investment of $1,000 invested at the beginning of the period and held for the entire period July 1, 2015 through December 31, 2015.
The actual and hypothetical expenses in the examples below do not represent the effect of any fees or other expenses assessed in connection with a variable product; if they did, the expenses shown would be higher while the ending account values shown would be lower.
Actual expenses
The table below provides information about actual account values and actual expenses. You may use the information in this table, together with the amount you invested, to estimate the expenses that you paid over the period. Simply divide your account value by $1,000 (for example, an $8,600 account value divided by $1,000 = 8.6), then multiply the result by the number in the table under the heading entitled “Actual Expenses Paid During Period” to estimate the expenses you paid on your account during this period.
Hypothetical example for comparison purposes
The table below also provides information about hypothetical account values and hypothetical expenses based on the Fund’s actual expense ratio and an assumed rate of return of 5% per year before expenses, which is not the Fund’s actual return.
The hypothetical account values and expenses may not be used to estimate the actual ending account balance or expenses you paid for the period. You may use this information to compare the ongoing costs of investing in the Fund and other funds. To do so, compare this 5% hypothetical example with the 5% hypothetical examples that appear in the shareholder reports of the other funds.
Please note that the expenses shown in the table are meant to highlight your ongoing costs. Therefore, the hypothetical information is useful in comparing ongoing costs, and will not help you determine the relative total costs of owning different funds.
| | | | | | | | | | | | | | | | | | | | | | | | |
| Class | | Beginning
Account Value
(07/01/15) | | | ACTUAL | | | HYPOTHETICAL (5% annual return before expenses) | | | Annualized
Expense Ratio | |
| | | Ending
Account Value
(12/31/15)1 | | | Expenses Paid During Period2 | | | Ending
Account Value
(12/31/15) | | | Expenses Paid During
Period2 | | |
| Series I | | $ | 1,000.00 | | | $ | 953.60 | | | $ | 3.45 | | | $ | 1,021.68 | | | $ | 3.57 | | | | 0.70 | % |
| Series II | | | 1,000.00 | | | | 952.10 | | | | 4.67 | | | | 1,020.42 | | | | 4.84 | | | | 0.95 | |
| 1 | The actual ending account value is based on the actual total return of the Fund for the period July 1, 2015 through December 31, 2015, after actual expenses and will differ from the hypothetical ending account value which is based on the Fund’s expense ratio and a hypothetical annual return of 5% before expenses. |
| 2 | Expenses are equal to the Fund’s annualized expense ratio as indicated above multiplied by the average account value over the period, multiplied by 184/365 to reflect the most recent fiscal half year. |
Invesco V.I. Balanced-Risk Allocation Fund
Tax Information
Form 1099-DIV, Form 1042-S and other year–end tax information provide shareholders with actual calendar year amounts that should be included in their tax returns. Shareholders should consult their tax advisors.
The following distribution information is being provided as required by the Internal Revenue Code or to meet a specific state’s requirement.
The Fund designates the following amounts or, if subsequently determined to be different, the maximum amount allowable for its fiscal year ended December 31, 2015:
| | | | |
Federal and State Income Tax | |
Long-Term Capital Gain Distributions | | $ | 47,612,493 | |
Corporate Dividends Received Deduction* | | | 0.00 | % |
U.S. Treasury Obligations* | | | 0.08 | % |
| | * | The above percentages are based on ordinary income dividends paid to shareholders during the Fund’s fiscal year. |
Invesco V.I. Balanced-Risk Allocation Fund
Trustees and Officers
The address of each trustee and officer is AIM Variable Insurance Funds (Invesco Variable Insurance Funds) (the “Trust”), 11 Greenway Plaza, Suite 1000, Houston, Texas 77046-1173. The trustees serve for the life of the Trust, subject to their earlier death, incapacitation, resignation, retirement or removal as more specifically provided in the Trust’s organizational documents. Each officer serves for a one year term or until their successors are elected and qualified. Column two below includes length of time served with predecessor entities, if any.
| | | | | | | | |
Name, Year of Birth and
Position(s) Held with the Trust | | Trustee and/
or Officer Since | | Principal Occupation(s)
During Past 5 Years | | Number of Funds in Fund Complex Overseen by Trustee | | Other Directorship(s) Held by Trustee During Past 5 Years |
| Interested Persons | | | | | | | | |
| Martin L. Flanagan1 — 1960 Trustee | | 2007 | | Executive Director, Chief Executive Officer and President, Invesco Ltd. (ultimate parent of Invesco and a global investment management firm); Advisor to the Board, Invesco Advisers, Inc. (formerly known as Invesco Institutional (N.A.), Inc.); Trustee, The Invesco Funds; Vice Chair, Investment Company Institute; and Member of Executive Board, SMU Cox School of Business Formerly: Chairman and Chief Executive Officer, Invesco Advisers, Inc. (registered investment adviser); Director, Chairman, Chief Executive Officer and President, IVZ Inc. (holding company), INVESCO Group Services, Inc. (service provider) and Invesco North American Holdings, Inc. (holding company); Director, Chief Executive Officer and President, Invesco Holding Company Limited (parent of Invesco and a global investment management firm); Director, Invesco Ltd.; Chairman, Investment Company Institute and President, Co-Chief Executive Officer, Co-President, Chief Operating Officer and Chief Financial Officer, Franklin Resources, Inc. (global investment management organization) | | 146 | | None |
Philip A. Taylor2 — 1954 Trustee, President and Principal Executive Officer | | 2006 | | Head of North American Retail and Senior Managing Director, Invesco Ltd.; Director, Co-Chairman, Co-President and Co-Chief Executive Officer, Invesco Advisers, Inc. (formerly known as Invesco Institutional (N.A.), Inc.) (registered investment adviser); Director, Chairman, Chief Executive Officer and President, Invesco Management Group, Inc. (formerly known as Invesco Aim Management Group, Inc.) (financial services holding company); Director and Chairman, Invesco Investment Services, Inc. (formerly known as Invesco Aim Investment Services, Inc.) (registered transfer agent) Chief Executive Officer, Invesco Corporate Class Inc. (corporate mutual fund company) Director, Chairman and Chief Executive Officer, Invesco Canada Ltd. (formerly known as Invesco Trimark Ltd./Invesco Trimark Ltèe) (registered investment adviser and registered transfer agent); Trustee, President and Principal Executive Officer, The Invesco Funds (other than AIM Treasurer’s Series Trust (Invesco Treasurer’s Series Trust), Short-Term Investments Trust and Invesco Management Trust); Trustee and Executive Vice President, The Invesco Funds (AIM Treasurer’s Series Trust (Invesco Treasurer’s Series Trust), Short-Term Investments Trust and Invesco Management Trust only); Director, Invesco Investment Advisers LLC (formerly known as Van Kampen Asset Management); Director, Chief Executive Officer and President, Van Kampen Exchange Corp. Formerly: Director and President, INVESCO Funds Group, Inc. (registered investment adviser and registered transfer agent); Director and Chairman, IVZ Distributors, Inc. (formerly known as INVESCO Distributors, Inc.) (registered broker dealer); Director, President and Chairman, Invesco Inc. (holding company), Invesco Canada Holdings Inc. (holding company), Trimark Investments Ltd./Placements Trimark Ltèe and Invesco Financial Services Ltd/Services Financiers Invesco Ltèe; Chief Executive Officer, Invesco Canada Fund Inc (corporate mutual fund company); Director and Chairman, Van Kampen Investor Services Inc.; Director, Chief Executive Officer and President, 1371 Preferred Inc. (holding company) and Van Kampen Investments Inc.; Director and President, AIM GP Canada Inc. (general partner for limited partnerships) and Van Kampen Advisors, Inc.; Director and Chief Executive Officer, Invesco Trimark Dealer Inc. (registered broker dealer); Director, Invesco Distributors, Inc. (formerly known as Invesco Aim Distributors, Inc.) (registered broker dealer); Manager, Invesco PowerShares Capital Management LLC; Director, Chief Executive Officer and President, Invesco Advisers, Inc.; Director, Chairman, Chief Executive Officer and President, Invesco Aim Capital Management, Inc.; President, Invesco Trimark Dealer Inc. and Invesco Trimark Ltd./Invesco Trimark Ltèe; Director and President, AIM Trimark Corporate Class Inc. and AIM Trimark Canada Fund Inc.; Senior Managing Director, Invesco Holding Company Limited; Director and Chairman, Fund Management Company (former registered broker dealer); President and Principal Executive Officer, The Invesco Funds (AIM Treasurer’s Series Trust (Invesco Treasurer’s Series Trust), and Short-Term Investments Trust only); President, AIM Trimark Global Fund Inc. and AIM Trimark Canada Fund Inc | | 146 | | None |
| 1 | Mr. Flanagan is considered an interested person (within the meaning of Section 2(a)(19) of the 1940 Act) of the Trust because he is an officer of the Adviser to the Trust, and an officer and a director of Invesco Ltd., ultimate parent of the Adviser. |
| 2 | Mr. Taylor is considered an interested person (within the meaning of Section 2(a)(19) of the 1940 Act) of the Trust because he is an officer and a director of the Adviser. |
Invesco V.I. Balanced Risk Allocation Fund
Trustees and Officers—(continued)
| | | | | | | | |
Name, Year of Birth and
Position(s) Held with the Trust | | Trustee and/
or Officer Since | | Principal Occupation(s)
During Past 5 Years | | Number of Funds in Fund Complex Overseen by Trustee | | Other Directorship(s)
Held by Trustee During Past 5 Years |
| Independent Trustees | | | | | | | | |
Bruce L. Crockett — 1944 Trustee and Chair | | 2003 | | Chairman, Crockett Technologies Associates (technology consulting company) Formerly: Director, Captaris (unified messaging provider); Director, President and Chief Executive Officer, COMSAT Corporation; Chairman, Board of Governors of INTELSAT (international communications company); ACE Limited (insurance company); Independent Directors Council and Investment Company Institute | | 146 | | ALPS (Attorneys Liability Protection Society) (insurance company) and Globe Specialty Metals, Inc. (metallurgical company) |
David C. Arch — 1945 Trustee | | 2010 | | Chairman of Blistex Inc., a consumer health care products manufacturer | | 146 | | Board member of the Illinois Manufacturers’ Association; Member of the Board of Visitors, Institute for the Humanities, University of Michigan |
James T. Bunch — 1942 Trustee | | 2000 | | Managing Member, Grumman Hill Group LLC (family office/private equity investments) Formerly: Chairman of the Board of Trustees, Evans Scholars Foundation and Chairman, Board of Governors, Western Golf Association | | 146 | | Trustee, Evans Scholars Foundation; and Chairman of the Board, Denver Film Society |
Albert R. Dowden — 1941 Trustee | | 2003 | | Director of a number of public and private business corporations, including the Boss Group, Ltd. (private investment and management); Nature’s Sunshine Products, Inc. and Reich & Tang Funds (5 portfolios) (registered investment company) Formerly: Director, Homeowners of America Holding Corporation/Homeowners of America Insurance Company (property casualty company); Director, Continental Energy Services, LLC (oil and gas pipeline service); Director, CompuDyne Corporation (provider of product and services to the public security market) and Director, Annuity and Life Re (Holdings), Ltd. (reinsurance company); Director, President and Chief Executive Officer, Volvo Group North America, Inc.; Senior Vice President, AB Volvo; Director of various public and private corporations; Chairman, DHJ Media, Inc.; Director, Magellan Insurance Company; and Director, The Hertz Corporation, Genmar Corporation (boat manufacturer), National Media Corporation; Advisory Board of Rotary Power International (designer, manufacturer, and seller of rotary power engines); and Chairman, Cortland Trust, Inc. (registered investment company) | | 146 | | Director of: Nature’s Sunshine Products, Inc., Reich & Tang Funds, Homeowners of America Holding Corporation/ Homeowners of America Insurance Company, the Boss Group |
Jack M. Fields — 1952 Trustee | | 2003 | | Chief Executive Officer, Twenty First Century Group, Inc. (government affairs company); Owner and Chief Executive Officer, Dos Angeles Ranch, L.P. (cattle, hunting, corporate entertainment); and Discovery Global Education Fund (non-profit) Formerly: Chief Executive Officer, Texana Timber LP (sustainable forestry company); Director of Cross Timbers Quail Research Ranch (non-profit); and member of the U.S. House of Representatives | | 146 | | Insperity, Inc. (formerly known as Administaff) |
Eli Jones — Trustee | | 2016 | | Professor and Dean, Mays Business School, Texas A&M University Formerly: Professor and Dean, Walton College of Business, University of Arkansas, and E.J. Ourso College of Business, Louisiana State University | | 146 | | Director, Insperity, Inc., (2011-present) and ARVEST Bank (2012-2015) |
Prema Mathai-Davis — 1950 Trustee | | 2003 | | Retired. Formerly: Chief Executive Officer, YWCA of the U.S.A. | | 146 | | None |
Larry Soll —��1942 Trustee | | 1997 | | Retired. Formerly: Chairman, Chief Executive Officer and President, Synergen Corp. (a biotechnology company) | | 146 | | None |
Robert C. Troccoli — Trustee | | 2016 | | Retired. Formerly: Senior Partner, KPMG LLP | | 146 | | None |
Raymond Stickel, Jr. — 1944 Trustee | | 2005 | | Retired. Formerly: Director, Mainstay VP Series Funds, Inc. (25 portfolios) and Partner, Deloitte & Touche | | 146 | | None |
Suzanne H. Woolsey — 1941 Trustee | | 2014 | | Chief Executive Officer of Woolsey Partners LLC | | 146 | | Emeritus Chair of the Board of Trustees of the Institute for Defense Analyses; Trustee of Colorado College; Trustee of California Institute of Technology; Prior to 2014, Director of Fluor Corp.; Prior to 2010, Trustee of the German Marshall Fund of the United States; Prior to 2010 Trustee of the Rocky Mountain Institute |
Invesco V.I. Balanced Risk Allocation Fund
Trustees and Officers—(continued)
| | | | | | | | |
Name, Year of Birth and
Position(s) Held with the Trust | | Trustee and/
or Officer Since | | Principal Occupation(s)
During Past 5 Years | | Number of Funds in Fund Complex Overseen by Trustee | | Other Directorship(s)
Held by Trustee During Past 5 Years |
| Other Officers | | | | | | | | |
Russell C. Burk — 1958 Senior Vice President and Senior Officer | | 2005 | | Senior Vice President and Senior Officer, The Invesco Funds | | N/A | | N/A |
John M. Zerr — 1962 Senior Vice President, Chief Legal Officer and Secretary | | 2006 | | Director, Senior Vice President, Secretary and General Counsel, Invesco Management Group, Inc. (formerly known as Invesco Aim Management Group, Inc.) and Van Kampen Exchange Corp.; Senior Vice President, Invesco Advisers, Inc. (formerly known as Invesco Institutional (N.A.), Inc.) (registered investment adviser); Senior Vice President and Secretary, Invesco Distributors, Inc. (formerly known as Invesco Aim Distributors, Inc.); Director, Vice President and Secretary, Invesco Investment Services, Inc. (formerly known as Invesco Aim Investment Services, Inc.); Senior Vice President, Chief Legal Officer and Secretary, The Invesco Funds; Managing Director, Invesco PowerShares Capital Management LLC; Director, Secretary and General Counsel, Invesco Investment Advisers LLC (formerly known as Van Kampen Asset Management); Secretary and General Counsel, Invesco Capital Markets, Inc. (formerly known as Van Kampen Funds Inc.) and Chief Legal Officer, PowerShares Exchange-Traded Fund Trust, PowerShares Exchange-Traded Fund Trust II, PowerShares India Exchange-Traded Fund Trust, PowerShares Actively Managed Exchange-Traded Fund Trust, and PowerShares Actively Managed Exchange-Traded Commodity Fund Trust Formerly: Director, Vice President and Secretary, IVZ Distributors, Inc. (formerly known as INVESCO distributors, Inc.); Director and Vice President, INVESCO Funds Group, Inc.; Director and Vice President, Van Kampen Advisors Inc.; Director, Vice President, Secretary and General Counsel, Van Kampen Investor Services Inc.; Director, Invesco Distributors, Inc. (formerly known as Invesco Aim Distributors, Inc.); Director, Senior Vice President, General Counsel and Secretary, Invesco Aim Advisers, Inc. and Van Kampen Investments Inc.; Director, Vice President and Secretary, Fund Management Company; Director, Senior Vice President, Secretary, General Counsel and Vice President, Invesco Aim Capital Management, Inc.; Chief Operating Officer and General Counsel, Liberty Ridge Capital, Inc. (an investment adviser); Vice President and Secretary, PBHG Funds (an investment company) and PBHG Insurance Series Fund (an investment company); Chief Operating Officer, General Counsel and Secretary, Old Mutual Investment Partners (a broker-dealer); General Counsel and Secretary, Old Mutual Fund Services (an administrator) and Old Mutual Shareholder Services (a shareholder servicing center); Executive Vice President, General Counsel and Secretary, Old Mutual Capital, Inc. (an investment adviser); and Vice President and Secretary, Old Mutual Advisors Funds (an investment company) | | N/A | | N/A |
Sheri Morris — 1964 Vice President, Treasurer and Principal Financial Officer | | 2003 | | Vice President, Treasurer and Principal Financial Officer, The Invesco Funds; Vice President, Invesco Advisers, Inc. (formerly known as Invesco Institutional (N.A.), Inc.) (registered investment adviser); and Vice President, PowerShares Exchange-Traded Fund Trust, PowerShares Exchange-Traded Fund Trust II, PowerShares India Exchange-Traded Fund Trust, PowerShares Actively Managed Exchange-Traded Fund Trust, and PowerShares Actively Managed Exchange-Traded Commodity Fund Trust Formerly: Vice President, Invesco Aim Advisers, Inc., Invesco Aim Capital Management, Inc. and Invesco Aim Private Asset Management, Inc.; Assistant Vice President and Assistant Treasurer, The Invesco Funds and Assistant Vice President, Invesco Advisers, Inc., Invesco Aim Capital Management, Inc. and Invesco Aim Private Asset Management, Inc.; and Treasurer, PowerShares Exchange-Traded Fund Trust, PowerShares Exchange-Traded Fund Trust II, PowerShares India Exchange-Traded Fund Trust and PowerShares Actively Managed Exchange-Traded Fund Trust | | N/A | | N/A |
Invesco V.I. Balanced Risk Allocation Fund
Trustees and Officers—(continued)
| | | | | | | | |
Name, Year of Birth and
Position(s) Held with the Trust | | Trustee and/
or Officer Since | | Principal Occupation(s)
During Past 5 Years | | Number of Funds in Fund Complex Overseen by Trustee | | Other Directorship(s)
Held by Trustee During Past 5 Years |
| Other Officers—(continued) | | | | | | | | |
Karen Dunn Kelley — 1960 Vice President | | 2003 | | Senior Managing Director, Investments, Invesco Ltd.; Director, Co-President, Co-Chief Executive Officer, and Co-Chairman, Invesco Advisers, Inc. (formerly known as Invesco Institutional (N.A.), Inc.) (registered investment adviser); Chairman, Invesco Senior Secured Management, Inc.; Senior Vice President, Invesco Management Group, Inc. (formerly known as Invesco Aim Management Group, Inc.); Executive Vice President, Invesco Distributors, Inc. (formerly known as Invesco Aim Distributors, Inc.); Director, Invesco Mortgage Capital Inc. and Invesco Management Company Limited; Vice President, The Invesco Funds (other than AIM Treasurer’s Series Trust (Invesco Treasurer’s Series Trust), Short-Term Investments Trust and Invesco Management Trust); and President and Principal Executive Officer, The Invesco Funds (AIM Treasurer’s Series Trust (Invesco Treasurer’s Series Trust), Short-Term Investments Trust and Invesco Management Trust only) Formerly: Director and President, INVESCO Asset Management (Bermuda) Ltd., Director, INVESCO Global Asset Management Limited and INVESCO Management S.A.; Senior Vice President, Van Kampen Investments Inc. and Invesco Advisers, Inc. (formerly known as Invesco Institutional (N.A.), Inc.) (registered investment adviser); Vice President, Invesco Advisers, Inc. (formerly known as Invesco Institutional (N.A.), Inc.); Director of Cash Management and Senior Vice President, Invesco Advisers, Inc. and Invesco Aim Capital Management, Inc.; Director and President, Fund Management Company; Chief Cash Management Officer, Director of Cash Management, Senior Vice President, and Managing Director, Invesco Aim Capital Management, Inc.; Director of Cash Management, Senior Vice President, and Vice President, Invesco Advisers, Inc. and The Invesco Funds (AIM Treasurer’s Series Trust (Invesco Treasurer’s Series Trust), and Short-Term Investments Trust only) | | N/A | | N/A |
Crissie M. Wisdom — 1969 Anti-Money Laundering Compliance Officer | | 2013 | | Anti-Money Laundering Compliance Officer, Invesco Advisers, Inc. (formerly known as Invesco Institutional (N.A.), Inc.) (registered investment adviser), Invesco Capital Markets, Inc. (formerly known as Van Kampen Funds Inc.), Invesco Distributors, Inc., Invesco Investment Services, Inc., Invesco Management Group, Inc., Van Kampen Exchange Corp., The Invesco Funds, and PowerShares Exchange-Traded Fund Trust, PowerShares Exchange-Traded Fund Trust II, PowerShares India Exchange-Traded Fund Trust, PowerShares Actively Managed Exchange-Traded Fund Trust and PowerShares Actively Managed Exchange-Traded Commodity Fund Trust; Anti-Money Laundering Compliance Officer and Bank Secrecy Act Officer, INVESCO National Trust Company and Invesco Trust Company; and Fraud Prevention Manager and Controls and Risk Analysis Manager for Invesco Investment Services, Inc. | | N/A | | N/A |
Lisa O. Brinkley — 1959 Chief Compliance Officer | | 2015 | | Senior Vice President and Chief Compliance Officer, Invesco Advisers, Inc. (registered investment adviser) (formerly known as Invesco Institutional (N.A., Inc.); and Chief Compliance Officer, The Invesco Funds Formerly: Global Assurance Officer, Invesco Ltd. and Vice President, The Invesco Funds; Chief Compliance Officer, Invesco Distributors, Inc. (formerly known as Invesco Aim Distributors, Inc.), Invesco Investment Services, Inc.(formerly known as Invesco Aim Investment Services, Inc.) and Van Kampen Investor Services Inc.; Senior Vice President, Invesco Management Group, Inc.; Senior Vice President and Chief Compliance Officer, Invesco Advisers, Inc. and The Invesco Funds; Vice President and Chief Compliance Officer, Invesco Aim Capital Management, Inc. and Invesco Distributors, Inc.; Vice President, Invesco Investment Services, Inc. and Fund Management Company | | N/A | | N/A |
The Statement of Additional Information of the Trust includes additional information about the Fund’s Trustees and is available upon request, without charge, by calling 1.800.959.4246. Please refer to the Fund’s prospectus for information on the Fund’s sub-advisers.
| | | | | | |
Office of the Fund 11 Greenway Plaza, Suite 1000 Houston, TX 77046-1173 | | Investment Adviser Invesco Advisers, Inc. 1555 Peachtree Street, N.E. Atlanta, GA 30309 | | Distributor Invesco Distributors, Inc. 11 Greenway Plaza, Suite 1000 Houston, TX 77046-1173 | | Auditors PricewaterhouseCoopers LLP 1000 Louisiana Street, Suite 5800 Houston, TX 77002-5678 |
| | | |
| �� | | | | | |
Counsel to the Fund Stradley Ronon Stevens & Young, LLP 2005 Market Street, Suite 2600 Philadelphia, PA 19103-7018 | | Counsel to the Independent Trustees Goodwin Procter LLP 901 New York Avenue, N.W. Washington, D.C. 20001 | | Transfer Agent Invesco Investment Services, Inc. 11 Greenway Plaza, Suite 1000 Houston, TX 77046-1173 | | Custodian State Street Bank and Trust Company 225 Franklin Street Boston, MA 02110-2801 |
Invesco V.I. Balanced Risk Allocation Fund
| | | | |
| | |

| | Annual Report to Shareholders | | December 31, 2015 |
| | |
| | Invesco V.I. Comstock Fund |

| | |
| | The Fund provides a complete list of its holdings four times in each fiscal year, at the quarter-ends. For the second and fourth quarters, the lists appear in the Fund’s semiannual and annual reports to shareholders. For the first and third quarters, the Fund files the lists with the Securities and Exchange Commission (SEC) on Form N-Q. The Fund’s Form N-Q filings are available on the SEC website, sec.gov. Copies of the Fund’s Forms N-Q may be reviewed and copied at the SEC Public Reference Room in Washington, D.C. You can obtain information on the operation of the Public Reference Room, including information about duplicating fee charges, by calling 202 551 8090 or 800 732 0330, or by electronic request at the following email address: publicinfo@sec.gov. The SEC file numbers for the Fund are 811-07452 and 033-57340. The Fund’s most recent portfolio holdings, as filed on Form N-Q, have also been made available to insurance companies issuing variable annuity contracts and variable life insurance policies (“variable products”) that invest in the Fund. A description of the policies and procedures that the Fund uses to determine how to vote proxies relating to portfolio securities is available without charge, upon request, from our Client Services department at 800 959 4246 or at invesco.com/proxyguidelines. The information is also available on the SEC website, sec.gov. Information regarding how the Fund voted proxies related to its portfolio securities during the most recent 12-month period ended June 30 is available at invesco.com/ proxysearch. The information is also available on the SEC website, sec.gov. Invesco Advisers, Inc. is an investment adviser; it provides investment advisory services to individual and institutional clients and does not sell securities. Invesco Distributors, Inc. is the US distributor for Invesco Ltd.’s retail mutual funds, exchange-traded funds and institutional money market funds. Both are wholly owned, indirect subsidiaries of Invesco Ltd. This report must be accompanied or preceded by a currently effective Fund prospectus and variable product prospectus, which contain more complete information, including sales charges and expenses. Investors should read each carefully before investing. Invesco Distributors, Inc. VK-VICOM-AR-1 NOT FDIC INSURED | MAY LOSE VALUE | NO BANK GUARANTEE |
| |
| |
| |
| |
Management’s Discussion of Fund Performance
Performance summary
For the year ended December 31, 2015, Series I shares of Invesco V.I. Comstock Fund (the Fund) underperformed the Russell 1000 Value Index, the Fund’s style- specific benchmark.
Your Fund’s long-term performance appears later in this report.
Fund vs. Indexes
Total returns, 12/31/14 to 12/31/15, excluding variable product issuer charges.
If variable product issuer charges were included, returns would be lower.
| | | | | |
| Series I Shares | | | | -5.98 | % |
| Series II Shares | | | | -6.19 | |
| S&P 500 Index▼ (Broad Market Index) | | | | 1.38 | |
| Russell 1000 Value Index▼ (Style-Specific Index) | | | | -3.83 | |
| Lipper VUF Large-Cap Value Funds Indexn (Peer Group Index) | | | | -3.86 | |
Source(s): ▼FactSet Research Systems Inc.; nLipper Inc.
Market conditions and your Fund
The US economy continued its modest, but steady growth, during the year ended December 31, 2015 – although the health of individual economic sectors varied dramatically. The headline economic story was a steady decline in already-battered energy markets, as oil prices plummeted when increased supply overwhelmed demand. This decline particularly affected companies with US-based offshore or shale-based resources – companies whose cost to recover oil is higher than many traditional producers. On the other end of the spectrum, the improved position of the US consumer was the more subtle story which drove the US economy forward during the year.
As the year began, economic growth appeared to be stronger in the US than in the rest of the world. US equity markets were recovering from the crash of oil prices initiated by OPEC’s decision to maintain high production despite low prices and slowing global growth. The view that the US Federal Reserve (the Fed) would begin raising rates while other central banks were loosening monetary policy led the US dollar to strengthen
against many currencies. This hurt commodity- and materials-based economies – and companies in related sectors. Additionally, US-based multinational companies faced foreign exchange headwinds. Low interest rates, the increasing availability of credit and an improving employment picture all contributed to higher consumer confidence and consumer spending, which drove US equity markets higher, particularly through the spring, and helped overcome fears that Greece and the eurozone would fail to reach an agreement on a financial bailout plan.
In the summer of 2015, US equity markets moved sharply lower. A significant downturn in China’s financial markets and weak global economic growth led the Fed to delay raising interest rates; this, in turn, increased investor uncertainty and market volatility. A continued decline in oil prices also contributed to market volatility. In the fall, however, US markets rallied, the Fed saw enough economic stabilization to finally raise interest rates, and most major US market indexes ended the year barely in positive territory.
For the reporting period, most US equity market indexes delivered muted gains, at best, with value stocks, as a group,
underperforming growth stocks by a large margin, regardless of market capitalization. Sector performance in the Russell 1000 Value Index was mainly negative, with health care, telecommunication services and industrials being the only sectors with positive performance.
Stock selection in the consumer staples sector contributed to Fund performance relative to the style-specific index. In the food, beverage and tobacco industry, ConAgra Foods was a notable contributor, performing strongly after an activist investor took a large stake in the company and sought seats on the company’s board of directors. The company also reported earnings that exceeded analysts’ estimates, causing the stock to post a double-digit return for the year. Also, not owning Proctor & Gamble, a large style-specific benchmark holding, helped the Fund’s relative performance since the company’s stock price declined during the year.
Strong stock selection in the industrials sector also helped the Fund’s performance relative to the style-specific index. Most of the Fund’s relative performance contribution came from not owning certain poorly-performing companies, such as United Technologies and CSX, which were held in the index.
A material underweight exposure to the utilities sector also helped the Fund’s relative performance, as utilities stocks posted negative returns for the reporting period. We continue to believe utilities remain overvalued, as a sector, so we’ve been underweight this sector for some time.
We used currency forward contracts during the reporting period for the purpose of hedging currency exposure of non-US-based companies held in the portfolio. Derivatives were used for the purpose of hedging and not for speculative purposes or leverage. The use of currency
| | | | | | | |
| Portfolio Composition | | |
By sector | | % of total net assets | | | |
| | | | | |
| |
Financials | | | | 28.9 | % |
Consumer Discretionary | | | | 14.9 | |
Energy | | | | 12.9 | |
Information Technology | | | | 12.8 | |
Health Care | | | | 11.0 | |
Industrials | | | | 6.9 | |
Consumer Staples | | | | 4.7 | |
Materials | | | | 1.7 | |
Utilities | | | | 1.1 | |
Telecommunication Services | | | | 0.8 | |
Money Market Funds | | | | | |
Plus Other Assets Less Liabilities | | | | 4.3 | |
| | | | | | | | | | |
| Top 10 Equity Holdings* | | |
% of total net assets |
| | | | | | | |
| | |
| 1. | | Citigroup Inc. | | | | 5.0 | % |
| 2. | | JPMorgan Chase & Co. | | | | 3.9 | |
| 3. | | Bank of America Corp. | | | | 3.0 | |
| 4. | | Carnival Corp. | | | | 3.0 | |
| 5. | | Cisco Systems, Inc. | | | | 2.4 | |
| 6. | | General Electric Co. | | | | 2.3 | |
| 7. | | Wells Fargo & Co. | | | | 2.1 | |
| 8. | | Suncor Energy, Inc. | | | | 2.1 | |
| 9. | | General Motors Co. | | | | 2.0 | |
| 10. | | Merck & Co., Inc. | | | | 2.0 | |
| | | | | |
| Total Net Assets | | | $ | 1.9 billion | |
| |
| Total Number of Holdings* | | | | 78 | |
The Fund’s holdings are subject to change, and there is no assurance that the Fund will continue to hold any particular security.
*Excluding money market fund holdings.
Data presented here are as of December 31, 2015.
Invesco V.I. Comstock Fund
forward contracts had a large positive impact on the Fund’s performance relative to the Russell 1000 Value Index for the reporting period. This was mainly due to the strength of the US dollar compared to the foreign currencies in which the Fund’s non-US holdings were denominated.
Weak stock selection in and underweight exposure to the health care sector were large detractors from Fund performance relative to the Fund’s style-specific index. Specifically, being underweight the health care equipment and services industry hurt Fund performance. Also, not owning select pharmaceutical stocks, such as Eli Lilly, hurt the Fund’s relative performance, as that stock rose more than 20% for the reporting period.
Stock selection in and underweight exposure to the financials sector also acted as a large detractor from Fund performance. In diversified financials, Fund holdings Morgan Stanley and State Street underperformed the sector and style-specific benchmark, posting double-digit negative returns. Although Morgan Stanley reported profits and revenues that beat analysts’ estimates, financial stocks in general declined in the latter part of the reporting period due to concerns about a prolonged low interest rate environment. Not owning real estate stocks also hurt Fund performance.
Stock selection in and overweight exposure to the energy sector also hurt Fund performance, mainly due to the declining price of oil. Royal Dutch Shell and Murphy Oil were two of the largest relative detractors in the sector. Despite having a strong balance sheet and maintaining an attractive dividend, Royal Dutch Shell – not a constituent of the style-specific benchmark, but a top Fund holding – underperformed the sector and benchmark for the year.
Although the Fund was underweight the financials sector and overweight the energy sector compared to our style-specific benchmark at the close of the year, we have a favorable view of large diversified financial companies, and we have been adding to our positions in the energy sector, based on weakness. The Fund’s exposure to each sector has a higher beta than the style-specific benchmark.1 Therefore, the Fund may be more sensitive to broad moves in these sectors for the foreseeable future.
Thank you for your investment in Invesco V.I. Comstock Fund and for sharing our long-term investment horizon.
| 1 | Beta is a measure of risk representing how a security is expected to respond to general market movements. |
The views and opinions expressed in management’s discussion of Fund performance are those of Invesco Advisers, Inc. These views and opinions are subject to change at any time based on factors such as market and economic conditions. These views and opinions may not be relied upon as investment advice or recommendations, or as an offer for a particular security. The information is not a complete analysis of every aspect of any market, country, industry, security or the Fund. Statements of fact are from sources considered reliable, but Invesco Advisers, Inc. makes no representation or warranty as to their completeness or accuracy. Although historical performance is no guarantee of future results, these insights may help you understand our investment management philosophy.
See important Fund and, if applicable, index disclosures later in this report.
| | |
 | | Kevin Holt Chartered Financial Analyst, Portfolio Manager, is lead manager of Invesco V.I. Comstock Fund. He joined Invesco in |
| 2010. Mr. Holt earned a bachelor’s degree from the University of Iowa and an MBA from the University of Chicago Booth School of Business. |
| |
 | | Devin Armstrong Chartered Financial Analyst, Portfolio Manager, is manager of Invesco V.I. Comstock Fund. He joined Invesco in |
| 2010. Mr. Armstrong earned a BS in psychology and finance from the University of Illinois and an MBA in finance from Columbia University. |
| |
 | | Charles DyReyes Chartered Financial Analyst, Portfolio Manager, is manager of Invesco V.I. Comstock Fund. He joined Invesco in |
| 2015. Mr. DyReyes earned a BS in finance from Lehigh University. |
| |
 | | James Warwick Portfolio Manager, is manager of Invesco V.I. Comstock Fund. He joined Invesco in 2010. Mr. Warwick |
| earned a BBA from Stephen F. Austin State University and an MBA from the University of Houston. |
Invesco V.I. Comstock Fund
Your Fund’s Long-Term Performance
Results of a $10,000 Investment – Oldest Share Class(es)
Fund and index data from 12/31/05
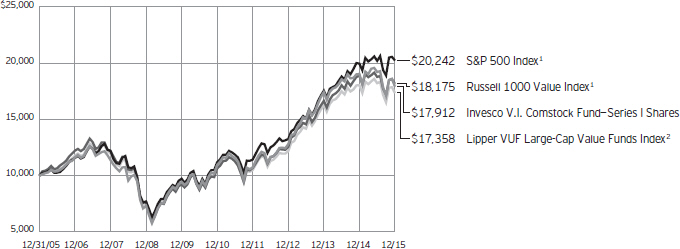
| 1 | Source: FactSet Research Systems Inc. |
Past performance cannot guarantee
comparable future results.
| | | | | |
| Average Annual Total Returns |
As of 12/31/15 | | | | | |
| |
| Series I Shares | | | | | |
| Inception (4/30/99) | | | | 6.34 | % |
| 10 Years | | | | 6.00 | |
| 5 Years | | | | 10.35 | |
| 1 Year | | | | -5.98 | |
| |
| Series II Shares | | | | | |
| Inception (9/18/00) | | | | 6.34 | % |
| 10 Years | | | | 5.74 | |
| 5 Years | | | | 10.08 | |
| 1 Year | | | | -6.19 | |
Effective June 1, 2010, Class I and Class II shares of the predecessor fund, Van Kampen Life Investment Trust Comstock Portfolio, advised by Van Kampen Asset Management were reorganized into Series I and Series II shares, respectively, of Invesco Van Kampen V.I. Comstock Fund (renamed Invesco V.I. Comstock Fund on April 29, 2013). Returns shown above for Series I and Series II shares are blended returns of the predecessor fund and Invesco V.I. Comstock Fund. Share class returns will differ from the predecessor fund because of different expenses.
The performance data quoted represent past performance and cannot guarantee comparable future
results; current performance may be lower or higher. Please contact your variable product issuer or financial adviser for the most recent month-end variable product performance. Performance figures reflect Fund expenses, reinvested distributions and changes in net asset value. Investment return and principal value will fluctuate so that you may have a gain or loss when you sell shares.
The net annual Fund operating expense ratio set forth in the most recent Fund prospectus as of the date of this report for Series I and Series II shares was 0.78% and 1.03%, respectively.1 The total annual Fund operating expense ratio set forth in the most recent Fund prospectus as of the date of this report for Series I and Series II shares was 0.83% and 1.08%, respectively. The expense ratios presented above may vary from the expense ratios presented in other sections of this report that are based on expenses incurred during the period covered by this report.
Invesco V.I. Comstock Fund, a series portfolio of AIM Variable Insurance Funds (Invesco Variable Insurance Funds), is currently offered through insurance companies issuing variable products. You cannot purchase shares
of the Fund directly. Performance figures given represent the Fund and are not intended to reflect actual variable product values. They do not reflect sales charges, expenses and fees assessed in connection with a variable product. Sales charges, expenses and fees, which are determined by the variable product issuers, will vary and will lower the total return.
The most recent month-end performance at the Fund level, excluding variable product charges, is available at 800 451 4246. As mentioned above, for the most recent month-end performance including variable product charges, please contact your variable product issuer or financial adviser.
Fund performance reflects any applicable fee waivers and/or expense reimbursements. Had the adviser not waived fees and/or reimbursed expenses currently or in the past, returns would have been lower. See current prospectus for more information.
| 1 | Total annual Fund operating expenses after any contractual fee waivers and/or expense reimbursements by the adviser in effect through at least April 30, 2017. See current prospectus for more information. |
Invesco V.I. Comstock Fund
Invesco V.I. Comstock Fund’s investment objective is to seek capital growth and income through investments in equity securities, including common stocks, preferred stocks and securities convertible into common and preferred stocks.
| n | | Unless otherwise stated, information presented in this report is as of December 31, 2015, and is based on total net assets. |
| n | | Unless otherwise noted, all data provided by Invesco. |
| n | | To access your Fund’s reports/prospectus, visit invesco.com/fundreports. |
Principal risks of investing in the Fund
Depositary receipts risk. Depositary receipts involve many of the same risks as those associated with direct investment in foreign securities. In addition, the underlying issuers of certain depositary receipts, particularly unsponsored or unregistered depositary receipts, are under no obligation to distribute shareholder communications to the holders of such receipts or to pass through to them any voting rights with respect to the deposited securities.
Derivatives risk. The value of a derivative instrument depends largely on (and is derived from) the value of an underlying security, currency, commodity, interest rate, index or other asset (each referred to as an underlying asset). In addition to risks relating to the underlying assets, the use of derivatives may include other, possibly greater, risks, including counterparty, leverage and liquidity risks. Counterparty risk is the risk that the counterparty to the derivative contract will default on its obligation to pay the Fund the amount owed or otherwise perform under the derivative contract. Derivatives create leverage risk because they do not require payment up front equal to the economic exposure created by owning the derivative. As a result, an adverse change in the value of the underlying asset could result in the Fund sustaining a loss that is substantially greater than the amount invested in the derivative, which may make the Fund’s returns more volatile and increase the risk of loss. Derivative instruments may also be less liquid than more traditional investments and the Fund may be unable to sell or close out its derivative positions at a desirable time or price. This risk may be more acute under adverse market conditions, during which the Fund may be most in need of liquidating its derivative positions. Derivatives may also be harder to value, less tax efficient and subject to changing government regulation that could impact the Fund’s ability to use certain derivatives or their cost. Also, derivatives used for hedging or to gain or limit exposure to a particular market segment may not provide the expected benefits, particularly during adverse market conditions.
Developing/emerging markets securities risk. The prices of securities issued by foreign companies and governments located in developing/emerging markets countries may be affected more negatively by inflation, devaluation of their currencies, higher
transaction costs, delays in settlement, adverse political developments, the introduction of capital controls, withholding taxes, nationalization of private assets, expropriation, social unrest, war or lack of timely information than those in developed countries.
Foreign securities risk. The Fund’s foreign investments may be affected by changes in a foreign country’s exchange rates, political and social instability, changes in economic or taxation policies, difficulties when enforcing obligations, decreased liquidity, and increased volatility. Foreign companies may be subject to less regulation resulting in less publicly available information about the companies.
Management risk. The investment techniques and risk analysis used by the Fund’s portfolio managers may not produce the desired results.
Market risk. The prices of and the income generated by the Fund’s securities may decline in response to, among other things, investor sentiment, general economic and market conditions, regional or global instability, and currency and interest rate fluctuations.
Real estate investment trust (REIT)/real estate risk. Investments in real estate related instruments may be affected by economic, legal, cultural, environmental or technological factors that affect property values, rents or occupancies of real estate related to the Fund’s holdings. Shares of real estate related companies, which tend to be small- and mid-cap companies, may be more volatile and less liquid.
Small- and mid-capitalization risks. Stocks of small- and mid-sized companies tend to be more vulnerable to adverse developments and may have little or no operating history or track record of success, and limited product lines, markets, management and financial resources. The securities of small- and mid-sized companies may be more volatile due to less market interest and less publicly available information about the issuer. They also may be illiquid or restricted as to resale, or may trade less frequently and in smaller volumes, all of which may cause difficulty when establishing or closing a position at a desirable price.
Value investing style risk. The Fund emphasizes a value style of investing, which focuses on undervalued companies with characteristics for improved valuations. This style of investing is subject to the risk that the valuations never improve or that the returns on value equity securities are
less than returns on other styles of investing or the overall stock market. Value stocks also may decline in price, even though in theory they are already underpriced.
About indexes used in this report
The S&P 500® Index is an unmanaged index considered representative of the US stock market.
The Russell 1000® Value Index is an unmanaged index considered representative of large-cap value stocks. The Russell 1000 Value Index is a trademark/service mark of the Frank Russell Co. Russell® is a trademark of the Frank Russell Co.
The Lipper VUF Large-Cap Value
Funds Index is an unmanaged index considered representative of large-cap value variable insurance underlying funds tracked by Lipper.
The Fund is not managed to track the performance of any particular index, including the index(es) described here, and consequently, the performance of the Fund may deviate significantly from the performance of the index(es).
A direct investment cannot be made in an index. Unless otherwise indicated, index results include reinvested dividends, and they do not reflect sales charges. Performance of the peer group, if applicable, reflects fund expenses; performance of a market index does not.
Other information
The returns shown in management’s discussion of Fund performance are based on net asset values calculated for shareholder transactions. Generally accepted accounting principles require adjustments to be made to the net assets of the Fund at period end for financial reporting purposes, and as such, the net asset values for shareholder transactions and the returns based on those net asset values may differ from the net asset values and returns reported in the Financial Highlights. Additionally, the returns and net asset values shown throughout this report are at the Fund level only and do not include variable product issuer charges. If such charges were included, the total returns would be lower.
Industry classifications used in this report are generally according to the Global Industry Classification Standard, which was developed by and is the exclusive property and a service mark of MSCI Inc. and Standard & Poor’s.
Invesco V.I. Comstock Fund
Schedule of Investments(a)
December 31, 2015
| | | | | | | | |
| | | Shares | | | Value | |
Common Stocks & Other Equity Interests–95.75% | |
| Aerospace & Defense–1.18% | |
Textron Inc. | | | 529,252 | | | $ | 22,233,876 | |
|
| Aluminum–0.81% | |
Alcoa Inc. | | | 1,550,725 | | | | 15,305,656 | |
|
| Application Software–0.75% | |
Citrix Systems, Inc.(b) | | | 185,559 | | | | 14,037,538 | |
|
| Asset Management & Custody Banks–2.73% | |
Bank of New York Mellon Corp. (The) | | | 516,634 | | | | 21,295,654 | |
State Street Corp. | | | 452,545 | | | | 30,030,886 | |
| | | | | | | | 51,326,540 | |
|
| Auto Parts & Equipment–1.66% | |
Johnson Controls, Inc. | | | 789,428 | | | | 31,174,512 | |
|
| Automobile Manufacturers–1.97% | |
General Motors Co. | | | 1,089,987 | | | | 37,070,458 | |
|
| Biotechnology–0.87% | |
AbbVie Inc. | | | 276,210 | | | | 16,362,680 | |
|
| Broadcasting–0.43% | |
CBS Corp.–Class B | | | 170,847 | | | | 8,052,019 | |
|
| Cable & Satellite–2.59% | |
Comcast Corp.–Class A | | | 520,572 | | | | 29,375,878 | |
Time Warner Cable Inc. | | | 104,081 | | | | 19,316,393 | |
| | | | | | | | 48,692,271 | |
|
| Communications Equipment–2.37% | |
Cisco Systems, Inc. | | | 1,642,508 | | | | 44,602,305 | |
|
| Construction Machinery & Heavy Trucks–1.38% | |
Caterpillar Inc. | | | 383,116 | | | | 26,036,563 | |
|
| Consumer Finance–0.99% | |
Ally Financial Inc.(b) | | | 997,290 | | | | 18,589,486 | |
|
| Data Processing & Outsourced Services–0.94% | |
PayPal Holdings, Inc.(b) | | | 489,804 | | | | 17,730,905 | |
|
| Department Stores–1.24% | |
Kohl’s Corp. | | | 490,716 | | | | 23,372,803 | |
|
| Diversified Banks–14.44% | |
Bank of America Corp. | | | 3,372,908 | | | | 56,766,042 | |
Citigroup Inc. | | | 1,827,694 | | | | 94,583,164 | |
JPMorgan Chase & Co. | | | 1,114,833 | | | | 73,612,423 | |
U.S. Bancorp | | | 184,454 | | | | 7,870,652 | |
Wells Fargo & Co. | | | 716,550 | | | | 38,951,658 | |
| | | | 271,783,939 | |
|
| Drug Retail–0.47% | |
CVS Health Corp. | | | 90,192 | | | | 8,818,072 | |
| | | | | | | | |
| | | Shares | | | Value | |
| Electric Utilities–0.46% | |
FirstEnergy Corp. | | | 275,998 | | | $ | 8,757,417 | |
|
| Electrical Components & Equipment–1.43% | |
Emerson Electric Co. | | | 560,979 | | | | 26,831,626 | |
|
| Electronic Components–0.63% | |
Corning Inc. | | | 645,097 | | | | 11,792,373 | |
|
| General Merchandise Stores–1.10% | |
Target Corp. | | | 284,286 | | | | 20,642,006 | |
|
| Health Care Equipment–0.77% | |
Medtronic PLC | | | 187,614 | | | | 14,431,269 | |
|
| Health Care Services–0.90% | |
Express Scripts Holding Co.(b) | | | 194,110 | | | | 16,967,155 | |
|
| Hotels, Resorts & Cruise Lines–2.97% | |
Carnival Corp. | | | 1,027,771 | | | | 55,992,964 | |
|
| Hypermarkets & Super Centers–0.92% | |
Wal-Mart Stores, Inc. | | | 284,168 | | | | 17,419,498 | |
|
| Industrial Conglomerates–2.33% | |
General Electric Co. | | | 1,407,078 | | | | 43,830,480 | |
|
| Industrial Machinery–0.57% | |
Ingersoll-Rand PLC | | | 193,560 | | | | 10,701,932 | |
|
| Integrated Oil & Gas–7.75% | |
BP PLC–ADR (United Kingdom) | | | 938,363 | | | | 29,333,227 | |
Chevron Corp. | | | 312,531 | | | | 28,115,289 | |
Occidental Petroleum Corp. | | | 244,723 | | | | 16,545,722 | |
Royal Dutch Shell PLC–Class A–ADR (United Kingdom) | | | 717,818 | | | | 32,868,886 | |
Suncor Energy, Inc. (Canada) | | | 1,508,470 | | | | 38,918,526 | |
| | | | 145,781,650 | |
|
| Integrated Telecommunication Services–0.76% | |
Frontier Communications Corp. | | | 3,077,951 | | | | 14,374,031 | |
|
| Internet Software & Services–1.88% | |
eBay Inc.(b) | | | 910,166 | | | | 25,011,362 | |
Yahoo! Inc.(b) | | | 311,704 | | | | 10,367,275 | |
| | | | 35,378,637 | |
|
| Investment Banking & Brokerage–2.64% | |
Goldman Sachs Group, Inc. (The) | | | 113,953 | | | | 20,537,749 | |
Morgan Stanley | | | 919,283 | | | | 29,242,392 | |
| | | | 49,780,141 | |
|
| Leisure Products–0.37% | |
Mattel, Inc. | | | 254,861 | | | | 6,924,573 | |
|
| Life & Health Insurance–2.64% | |
Aflac, Inc. | | | 378,481 | | | | 22,671,012 | |
MetLife, Inc. | | | 560,496 | | | | 27,021,512 | |
| | | | 49,692,524 | |
See accompanying Notes to Financial Statements which are an integral part of the financial statements.
Invesco V.I. Comstock Fund
| | | | | | | | |
| | | Shares | | | Value | |
| Managed Health Care–0.95% | |
Anthem, Inc. | | | 128,758 | | | $ | 17,954,016 | |
|
| Movies & Entertainment–2.62% | |
Time Warner Inc. | | | 118,743 | | | | 7,679,110 | |
Twenty-First Century Fox, Inc.–Class B | | | 765,372 | | | | 20,841,080 | |
Viacom Inc.–Class B | | | 505,990 | | | | 20,826,548 | |
| | | | 49,346,738 | |
|
| Multi-Utilities–0.65% | |
PG&E Corp. | | | 231,001 | | | | 12,286,943 | |
|
| Oil & Gas Drilling–0.45% | |
Noble Corp. PLC | | | 803,205 | | | | 8,473,813 | |
|
| Oil & Gas Equipment & Services–2.32% | |
Halliburton Co. | | | 452,120 | | | | 15,390,165 | |
Weatherford International PLC(b) | | | 3,367,238 | | | | 28,251,127 | |
| | | | 43,641,292 | |
|
| Oil & Gas Exploration & Production–2.40% | |
Devon Energy Corp. | | | 474,136 | | | | 15,172,352 | |
Hess Corp. | | | 335,243 | | | | 16,252,580 | |
Murphy Oil Corp. | | | 100,766 | | | | 2,262,197 | |
QEP Resources Inc. | | | 858,380 | | | | 11,502,292 | |
| | | | 45,189,421 | |
|
| Packaged Foods & Meats–1.21% | |
ConAgra Foods, Inc. | | | 339,938 | | | | 14,331,786 | |
Mondelez International, Inc.–Class A | | | 189,504 | | | | 8,497,359 | |
| | | | 22,829,145 | |
|
| Paper Products–0.90% | |
International Paper Co. | | | 448,174 | | | | 16,896,160 | |
|
| Personal Products–0.47% | |
Unilever N.V.–New York Shares (United Kingdom) | | | 204,543 | | | | 8,860,803 | |
|
| Pharmaceuticals–7.54% | |
GlaxoSmithKline PLC–ADR (United Kingdom) | | | 177,563 | | | | 7,164,667 | |
Merck & Co., Inc. | | | 696,087 | | | | 36,767,315 | |
Novartis AG (Switzerland) | | | 298,190 | | | | 25,486,994 | |
Pfizer Inc. | | | 995,812 | | | | 32,144,811 | |
| | | | | | | | |
| | | Shares | | | Value | |
| Pharmaceuticals–(continued) | |
Roche Holding AG–ADR (Switzerland) | | | 480,254 | | | $ | 16,576,207 | |
Sanofi–ADR (France) | | | 557,643 | | | | 23,783,474 | |
| | | | 141,923,468 | |
|
| Property & Casualty Insurance–1.29% | |
Allstate Corp. (The) | | | 391,318 | | | | 24,296,935 | |
|
| Regional Banks–4.12% | |
Citizens Financial Group Inc. | | | 576,139 | | | | 15,089,081 | |
Fifth Third Bancorp | | | 1,385,814 | | | | 27,854,861 | |
PNC Financial Services Group, Inc. (The) | | | 362,696 | | | | 34,568,556 | |
| | | | | | | | 77,512,498 | |
|
| Semiconductors–1.00% | |
Intel Corp. | | | 546,445 | | | | 18,825,030 | |
|
| Soft Drinks–1.65% | |
Coca-Cola Co. (The) | | | 722,026 | | | | 31,018,237 | |
|
| Systems Software–3.13% | |
Microsoft Corp. | | | 569,678 | | | | 31,605,735 | |
Symantec Corp. | | | 1,303,743 | | | | 27,378,603 | |
| | | | | | | | 58,984,338 | |
|
| Technology Hardware, Storage & Peripherals–2.11% | |
Hewlett Packard Enterprise Co. | | | 240,458 | | | | 3,654,962 | |
HP Inc. | | | 788,815 | | | | 9,339,569 | |
NetApp, Inc. | | | 1,004,213 | | | | 26,641,771 | |
| | | | | | | | 39,636,302 | |
Total Common Stocks & Other Equity Interests
(Cost $1,716,273,667) | | | | 1,802,163,038 | |
|
Money Market Funds–4.19% | |
Liquid Assets Portfolio–Institutional Class, 0.29%(c) | | | 39,435,624 | | | | 39,435,624 | |
Premier Portfolio–Institutional Class, 0.24%(c) | | | 39,435,624 | | | | 39,435,624 | |
Total Money Market Funds
(Cost $78,871,248) | | | | 78,871,248 | |
TOTAL INVESTMENTS–99.94%
(Cost $1,795,144,915) | | | | 1,881,034,286 | |
OTHER ASSETS LESS LIABILITIES–0.06% | | | | | | | 1,055,292 | |
NET ASSETS–100.00% | | | | | | $ | 1,882,089,578 | |
Investment Abbreviations:
| | |
| ADR | | – American Depositary Receipt |
Notes to Schedule of Investments:
| (a) | Industry and/or sector classifications used in this report are generally according to the Global Industry Classification Standard, which was developed by and is the exclusive property and a service mark of MSCI Inc. and Standard & Poor’s. |
| (b) | Non-income producing security. |
| (c) | The money market fund and the Fund are affiliated by having the same investment adviser. The rate shown is the 7-day SEC standardized yield as of December 31, 2015. |
See accompanying Notes to Financial Statements which are an integral part of the financial statements.
Invesco V.I. Comstock Fund
Statement of Assets and Liabilities
December 31, 2015
Statement of Operations
For the year ended December 31, 2015
| | | | |
Assets: | |
Investments, at value (Cost $1,716,273,667) | | $ | 1,802,163,038 | |
Investments in affiliated money market funds, at value and cost | | | 78,871,248 | |
Total investments, at value (Cost $1,795,144,915) | | | 1,881,034,286 | |
Cash | | | 139,943 | |
Foreign currencies, at value (Cost $296) | | | 295 | |
Receivable for: | | | | |
Investments sold | | | 2,432,493 | |
Fund shares sold | | | 208,494 | |
Dividends | | | 2,910,209 | |
Investment for trustee deferred compensation and retirement plans | | | 175,846 | |
Unrealized appreciation on forward foreign currency contracts outstanding | | | 2,279,898 | |
Total assets | | | 1,889,181,464 | |
|
Liabilities: | |
Payable for: | | | | |
Investments purchased | | | 940,403 | |
Fund shares reacquired | | | 3,761,249 | |
Accrued fees to affiliates | | | 2,142,441 | |
Accrued trustees’ and officers’ fees and benefits | | | 295 | |
Accrued other operating expenses | | | 40,443 | |
Trustee deferred compensation and retirement plans | | | 207,055 | |
Total liabilities | | | 7,091,886 | |
Net assets applicable to shares outstanding | | $ | 1,882,089,578 | |
|
Net assets consist of: | |
Shares of beneficial interest | | $ | 1,627,319,734 | |
Undistributed net investment income | | | 24,761,927 | |
Undistributed net realized gain | | | 141,871,942 | |
Net unrealized appreciation | | | 88,135,975 | |
| | | $ | 1,882,089,578 | |
|
Net Assets: | |
Series I | | $ | 332,410,569 | |
Series II | | $ | 1,549,679,009 | |
|
Shares outstanding, $0.001 par value per share,
with an unlimited number of shares authorized: | |
Series I | | | 18,918,205 | |
Series II | | | 88,517,933 | |
Series I: | | | | |
Net asset value per share | | $ | 17.57 | |
Series II: | | | | |
Net asset value per share | | $ | 17.51 | |
| | | | |
Investment income: | |
Dividends (net of foreign withholding taxes of $1,026,650) | | $ | 47,446,388 | |
Dividends from affiliated money market funds | | | 55,616 | |
Interest | | | 11,436 | |
Total investment income | | | 47,513,440 | |
| |
Expenses: | | | | |
Advisory fees | | | 11,638,224 | |
Administrative services fees | | | 5,172,017 | |
Custodian fees | | | 84,156 | |
Distribution fees — Series II | | | 4,315,108 | |
Transfer agent fees | | | 43,085 | |
Trustees’ and officers’ fees and benefits | | | 55,444 | |
Other | | | 98,376 | |
Total expenses | | | 21,406,410 | |
Less: Fees waived | | | (1,037,578 | ) |
Net expenses | | | 20,368,832 | |
Net investment income | | | 27,144,608 | |
| |
Realized and unrealized gain (loss) from: | | | | |
Net realized gain (loss) from: | | | | |
Investment securities | | | 129,321,694 | |
Foreign currencies | | | (69,705 | ) |
Forward foreign currency contracts | | | 17,416,839 | |
| | | | 146,668,828 | |
Change in net unrealized appreciation (depreciation) of: | | | | |
Investment securities | | | (298,060,820 | ) |
Foreign currencies | | | (859 | ) |
Forward foreign currency contracts | | | (1,420,202 | ) |
| | | | (299,481,881 | ) |
Net realized and unrealized gain (loss) | | | (152,813,053 | ) |
Net increase (decrease) in net assets resulting from operations | | $ | (125,668,445 | ) |
See accompanying Notes to Financial Statements which are an integral part of the financial statements.
Invesco V.I. Comstock Fund
Statement of Changes in Net Assets
For the years ended December 31, 2015 and 2014
| | | | | | | | |
| | | 2015 | | | 2014 | |
Operations: | | | | | |
Net investment income | | $ | 27,144,608 | | | $ | 33,347,426 | |
Net realized gain | | | 146,668,828 | | | | 260,573,406 | |
Change in net unrealized appreciation (depreciation) | | | (299,481,881 | ) | | | (101,857,544 | ) |
Net increase (decrease) in net assets resulting from operations | | | (125,668,445 | ) | | | 192,063,288 | |
| | |
Distributions to shareholders from net investment income: | | | | | | | | |
Series I | | | (6,885,163 | ) | | | (4,492,631 | ) |
Series ll | | | (28,122,100 | ) | | | (20,122,085 | ) |
Total distributions from net investment income | | | (35,007,263 | ) | | | (24,614,716 | ) |
| | |
Distributions to shareholders from net realized gains: | | | | | | | | |
Series l | | | (974,858 | ) | | | — | |
Series ll | | | (4,644,340 | ) | | | — | |
Total distributions from net realized gains | | | (5,619,198 | ) | | | — | |
| | |
Share transactions–net: | | | | | | | | |
Series l | | | 22,959,786 | | | | 1,255,194 | |
Series ll | | | (153,528,318 | ) | | | (217,613,521 | ) |
Net increase (decrease) in net assets resulting from share transactions | | | (130,568,532 | ) | | | (216,358,327 | ) |
Net increase (decrease) in net assets | | | (296,863,438 | ) | | | (48,909,755 | ) |
| | |
Net assets: | | | | | | | | |
Beginning of year | | | 2,178,953,016 | | | | 2,227,862,771 | |
End of year (includes undistributed net investment income of $24,761,927 and $32,694,287, respectively) | | $ | 1,882,089,578 | | | $ | 2,178,953,016 | |
Notes to Financial Statements
December 31, 2015
NOTE 1—Significant Accounting Policies
Invesco V.I. Comstock Fund (the “Fund”) is a series portfolio of AIM Variable Insurance Funds (Invesco Variable Insurance Funds) (the “Trust”). The Trust is a Delaware statutory trust registered under the Investment Company Act of 1940, as amended (the “1940 Act”), as an open-end series management investment company consisting of twenty-four separate portfolios, (each constituting a “Fund”). The assets, liabilities and operations of each portfolio are accounted for separately. Information presented in these financial statements pertains only to the Fund. Matters affecting each Fund or class will be voted on exclusively by the shareholders of such Fund or class. Current Securities and Exchange Commission (“SEC”) guidance, however, requires participating insurance companies offering separate accounts to vote shares proportionally in accordance with the instructions of the contract owners whose investments are funded by shares of each Fund or class.
The Fund’s investment objective is to seek capital growth and income through investments in equity securities, including common stocks, preferred stocks and securities convertible into common and preferred stocks.
The Fund currently offers two classes of shares, Series I and Series II, both of which are offered to insurance company separate accounts funding variable annuity contracts and variable life insurance policies (“variable products”).
The following is a summary of the significant accounting policies followed by the Fund in the preparation of its financial statements.
A. Security Valuations — Securities, including restricted securities, are valued according to the following policy.
A security listed or traded on an exchange (except convertible securities) is valued at its last sales price or official closing price as of the close of the customary trading session on the exchange where the security is principally traded, or lacking any sales or official closing price on a particular day, the security may be valued at the closing bid price on that day. Securities traded in the over-the-counter market are valued based on prices furnished by independent pricing services or market makers. When such securities are valued by an independent pricing service they may be considered fair valued. Futures contracts are valued at the final settlement price set by an exchange on which they are principally traded. Listed options are valued at the mean between the last bid and asked prices from the exchange on which they are principally traded. Options not listed on an exchange are valued by an independent source at the mean between the last bid and asked prices. For purposes of determining net asset value (“NAV”) per share, futures and option contracts generally are valued 15 minutes after the close of the customary trading session of the New York Stock Exchange (“NYSE”).
Investments in open-end and closed-end registered investment companies that do not trade on an exchange are valued at the end-of-day net asset value per share. Investments in open-end and closed-end registered investment companies that trade on an exchange are valued at the last sales price or official closing price as of the close of the customary trading session on the exchange where the security is principally traded.
Invesco V.I. Comstock Fund
Debt obligations (including convertible securities) and unlisted equities are fair valued using an evaluated quote provided by an independent pricing service. Evaluated quotes provided by the pricing service may be determined without exclusive reliance on quoted prices, and may reflect appropriate factors such as institution-size trading in similar groups of securities, developments related to specific securities, dividend rate (for unlisted equities), yield (for debt obligations), quality, type of issue, coupon rate (for debt obligations), maturity (for debt obligations), individual trading characteristics and other market data. Debt obligations are subject to interest rate and credit risks. In addition, all debt obligations involve some risk of default with respect to interest and/or principal payments.
Foreign securities’ (including foreign exchange contracts) prices are converted into U.S. dollar amounts using the applicable exchange rates as of the close of the NYSE. If market quotations are available and reliable for foreign exchange-traded equity securities, the securities will be valued at the market quotations. Because trading hours for certain foreign securities end before the close of the NYSE, closing market quotations may become unreliable. If between the time trading ends on a particular security and the close of the customary trading session on the NYSE, events occur that the Adviser determines are significant and make the closing price unreliable, the Fund may fair value the security. If the event is likely to have affected the closing price of the security, the security will be valued at fair value in good faith using procedures approved by the Board of Trustees. Adjustments to closing prices to reflect fair value may also be based on a screening process of an independent pricing service to indicate the degree of certainty, based on historical data, that the closing price in the principal market where a foreign security trades is not the current value as of the close of the NYSE. Foreign securities’ prices meeting the approved degree of certainty that the price is not reflective of current value will be priced at the indication of fair value from the independent pricing service. Multiple factors may be considered by the independent pricing service in determining adjustments to reflect fair value and may include information relating to sector indices, American Depositary Receipts and domestic and foreign index futures. Foreign securities may have additional risks including exchange rate changes, potential for sharply devalued currencies and high inflation, political and economic upheaval, the relative lack of issuer information, relatively low market liquidity and the potential lack of strict financial and accounting controls and standards.
Securities for which market prices are not provided by any of the above methods may be valued based upon quotes furnished by independent sources. The last bid price may be used to value equity securities. The mean between the last bid and asked prices is used to value debt obligations, including corporate loans.
Securities for which market quotations are not readily available or became unreliable are valued at fair value as determined in good faith by or under the supervision of the Trust’s officers following procedures approved by the Board of Trustees. Issuer specific events, market trends, bid/asked quotes of brokers and information providers and other market data may be reviewed in the course of making a good faith determination of a security’s fair value.
The Fund may invest in securities that are subject to interest rate risk, meaning the risk that the prices will generally fall as interest rates rise and, conversely, the prices will generally rise as interest rates fall. Specific securities differ in their sensitivity to changes in interest rates depending on their individual characteristics. Changes in interest rates may result in increased market volatility, which may affect the value and/or liquidity of certain Fund investments.
Valuations change in response to many factors including the historical and prospective earnings of the issuer, the value of the issuer’s assets, general economic conditions, interest rates, investor perceptions and market liquidity. Because of the inherent uncertainties of valuation, the values reflected in the financial statements may materially differ from the value received upon actual sale of those investments.
| B. | Securities Transactions and Investment Income — Securities transactions are accounted for on a trade date basis. Realized gains or losses on sales are computed on the basis of specific identification of the securities sold. Interest income (net of withholding tax, if any) is recorded on the accrual basis from settlement date. Dividend income (net of withholding tax, if any) is recorded on the ex-dividend date. |
The Fund may periodically participate in litigation related to Fund investments. As such, the Fund may receive proceeds from litigation settlements. Any proceeds received are included in the Statement of Operations as realized gain (loss) for investments no longer held and as unrealized gain (loss) for investments still held.
Brokerage commissions and mark ups are considered transaction costs and are recorded as an increase to the cost basis of securities purchased and/or a reduction of proceeds on a sale of securities. Such transaction costs are included in the determination of net realized and unrealized gain (loss) from investment securities reported in the Statement of Operations and the Statement of Changes in Net Assets and the net realized and unrealized gains (losses) on securities per share in the Financial Highlights. Transaction costs are included in the calculation of the Fund’s net asset value and, accordingly, they reduce the Fund’s total returns. These transaction costs are not considered operating expenses and are not reflected in net investment income reported in the Statement of Operations and the Statement of Changes in Net Assets, or the net investment income per share and the ratios of expenses and net investment income reported in the Financial Highlights, nor are they limited by any expense limitation arrangements between the Fund and the investment adviser.
The Fund allocates income and realized and unrealized capital gains and losses to a class based on the relative net assets of each class.
| C. | Country Determination — For the purposes of making investment selection decisions and presentation in the Schedule of Investments, the investment adviser may determine the country in which an issuer is located and/or credit risk exposure based on various factors. These factors include the laws of the country under which the issuer is organized, where the issuer maintains a principal office, the country in which the issuer derives 50% or more of its total revenues and the country that has the primary market for the issuer’s securities, as well as other criteria. Among the other criteria that may be evaluated for making this determination are the country in which the issuer maintains 50% or more of its assets, the type of security, financial guarantees and enhancements, the nature of the collateral and the sponsor organization. Country of issuer and/or credit risk exposure has been determined to be the United States of America, unless otherwise noted. |
| D. | Distributions — Distributions from net investment income and net realized capital gain, if any, are generally declared and paid to separate accounts of participating insurance companies annually and recorded on the ex-dividend date. |
| E. | Federal Income Taxes — The Fund intends to comply with the requirements of Subchapter M of the Internal Revenue Code of 1986, as amended (the “Internal Revenue Code”), necessary to qualify as a regulated investment company and to distribute substantially all of the Fund’s taxable earnings to shareholders. As such, the Fund will not be subject to federal income taxes on otherwise taxable income (including net realized capital gain) that is distributed to shareholders. Therefore, no provision for federal income taxes is recorded in the financial statements. |
The Fund recognizes the tax benefits of uncertain tax positions only when the position is more likely than not to be sustained. Management has analyzed the Fund’s uncertain tax positions and concluded that no liability for unrecognized tax benefits should be recorded related to uncertain
Invesco V.I. Comstock Fund
tax positions. Management is not aware of any tax positions for which it is reasonably possible that the total amounts of unrecognized tax benefits will change materially in the next 12 months.
The Fund files tax returns in the U.S. Federal jurisdiction and certain other jurisdictions. Generally, the Fund is subject to examinations by such taxing authorities for up to three years after the filing of the return for the tax period.
| F. | Expenses — Fees provided for under the Rule 12b-1 plan of a particular class of the Fund and which are directly attributable to that class are charged to the operations of such class. All other expenses are allocated among the classes based on relative net assets. |
| G. | Accounting Estimates — The preparation of financial statements in conformity with accounting principles generally accepted in the United States of America (“GAAP”) requires management to make estimates and assumptions that affect the reported amounts of assets and liabilities at the date of the financial statements and the reported amounts of revenues and expenses during the reporting period including estimates and assumptions related to taxation. Actual results could differ from those estimates by a significant amount. In addition, the Fund monitors for material events or transactions that may occur or become known after the period-end date and before the date the financial statements are released to print. |
| H. | Indemnifications — Under the Trust’s organizational documents, each Trustee, officer, employee or other agent of the Trust is indemnified against certain liabilities that may arise out of the performance of their duties to the Fund. Additionally, in the normal course of business, the Fund enters into contracts, including the Fund’s servicing agreements, that contain a variety of indemnification clauses. The Fund’s maximum exposure under these arrangements is unknown as this would involve future claims that may be made against the Fund that have not yet occurred. The risk of material loss as a result of such indemnification claims is considered remote. |
| I. | Foreign Currency Translations — Foreign currency is valued at the close of the NYSE based on quotations posted by banks and major currency dealers. Portfolio securities and other assets and liabilities denominated in foreign currencies are translated into U.S. dollar amounts at date of valuation. Purchases and sales of portfolio securities (net of foreign taxes withheld on disposition) and income items denominated in foreign currencies are translated into U.S. dollar amounts on the respective dates of such transactions. The Fund does not separately account for the portion of the results of operations resulting from changes in foreign exchange rates on investments and the fluctuations arising from changes in market prices of securities held. The combined results of changes in foreign exchange rates and the fluctuation of market prices on investments (net of estimated foreign tax withholding) are included with the net realized and unrealized gain or loss from investments in the Statement of Operations. Reported net realized foreign currency gains or losses arise from (1) sales of foreign currencies, (2) currency gains or losses realized between the trade and settlement dates on securities transactions, and (3) the difference between the amounts of dividends, interest, and foreign withholding taxes recorded on the Fund’s books and the U.S. dollar equivalent of the amounts actually received or paid. Net unrealized foreign currency gains and losses arise from changes in the fair values of assets and liabilities, other than investments in securities at fiscal period end, resulting from changes in exchange rates. |
The Fund may invest in foreign securities, which may be subject to foreign taxes on income, gains on investments or currency repatriation, a portion of which may be recoverable. Foreign taxes, if any, are recorded based on the tax regulations and rates that exist in the foreign markets in which the Fund invests and are shown in the Statement of Operations.
| J. | Forward Foreign Currency Contracts — The Fund may engage in foreign currency transactions either on a spot (i.e. for prompt delivery and settlement) basis, or through forward foreign currency contracts, to manage or minimize currency or exchange rate risk. |
The Fund may also enter into forward foreign currency contracts for the purchase or sale of a security denominated in a foreign currency in order to “lock in” the U.S. dollar price of that security, or the Fund may also enter into forward foreign currency contracts that do not provide for physical settlement of the two currencies, but instead are settled by a single cash payment calculated as the difference between the agreed upon exchange rate and the spot rate at settlement based upon an agreed upon notional amount (non-deliverable forwards). The Fund will set aside liquid assets in an amount equal to daily mark-to-market obligation for forward foreign currency contracts.
A forward foreign currency contract is an obligation between two parties (“Counterparties”) to purchase or sell a specific currency for an agreed-upon price at a future date. The use of forward foreign currency contracts does not eliminate fluctuations in the price of the underlying securities the Fund owns or intends to acquire but establishes a rate of exchange in advance. Fluctuations in the value of these contracts are measured by the difference in the contract date and reporting date exchange rates and are recorded as unrealized appreciation (depreciation) until the contracts are closed. When the contracts are closed, realized gains (losses) are recorded. Realized and unrealized gains (losses) on the contracts are included in the Statement of Operations. The primary risks associated with forward foreign currency contracts include failure of the Counterparty to meet the terms of the contract and the value of the foreign currency changing unfavorably. These risks may be in excess of the amounts reflected in the Statement of Assets and Liabilities.
NOTE 2—Advisory Fees and Other Fees Paid to Affiliates
The Trust has entered into a master investment advisory agreement with Invesco Advisers, Inc. (the “Adviser” or “Invesco”). Under the terms of the investment advisory agreement, the Fund pays an advisory fee to the Adviser based on the annual rate of the Fund’s average daily net assets as follows:
| | | | | | |
| Average Daily Net Assets | | Rate |
First $500 million | | | 0 | .60% | | |
Over $500 million | | | 0 | .55% | | |
For the year ended December 31, 2015, the effective advisory fees incurred by the Fund was 0.56%.
Under the terms of a master sub-advisory agreement between the Adviser and each of Invesco Asset Management Deutschland GmbH, Invesco Asset Management Limited, Invesco Asset Management (Japan) Limited, Invesco Hong Kong Limited, Invesco Senior Secured Management, Inc. and Invesco Canada Ltd. (collectively, the “Affiliated Sub-Advisers”) the Adviser, not the Fund, may pay 40% of the fees paid to the Adviser to any such Affiliated Sub-Adviser(s) that provide(s) discretionary investment management services to the Fund based on the percentage of assets allocated to such Affiliated Sub-Adviser(s).
The Adviser has contractually agreed, through at least April 30, 2017, to waive advisory fees and/or reimburse expenses to the extent necessary to limit total annual operating expenses after fee waiver and/or expense reimbursement (excluding certain items discussed below) of Series I shares to
Invesco V.I. Comstock Fund
0.78% and Series II shares to 1.03% of average daily net assets. In determining the Adviser’s obligation to waive advisory fees and/or reimburse expenses, the following expenses are not taken into account, and could cause total annual operating expenses after fee waiver and/or expense reimbursement to exceed the numbers reflected above: (1) interest; (2) taxes; (3) dividend expense on short sales; (4) extraordinary or non-routine items, including litigation expenses; and (5) expenses that the Fund has incurred but did not actually pay because of an expense offset arrangement. Unless Invesco continues the fee waiver agreement, it will terminate on April 30, 2017. The fee waiver agreement cannot be terminated during its term.
Further, the Adviser has contractually agreed, through at least June 30, 2017, to waive the advisory fee payable by the Fund in an amount equal to 100% of the net advisory fees the Adviser receives from the affiliated money market funds on investments by the Fund of uninvested cash in such affiliated money market funds.
For the year ended December 31, 2015, the Adviser waived advisory fees of $1,037,578.
The Trust has entered into a master administrative services agreement with Invesco pursuant to which the Fund has agreed to pay Invesco a fee for costs incurred in providing accounting services and fund administrative services to the Fund and to reimburse Invesco for administrative services fees paid to insurance companies that have agreed to provide services to the participants of separate accounts. These administrative services provided by the insurance companies may include, among other things: the printing of prospectuses, financial reports and proxy statements and the delivery of the same to existing participants; the maintenance of master accounts; the facilitation of purchases and redemptions requested by the participants; and the servicing of participants’ accounts. Pursuant to such agreement, for the year ended December 31, 2015, Invesco was paid $424,176 for accounting and fund administrative services and reimbursed $4,747,841 for services provided by insurance companies.
The Trust has entered into a transfer agency and service agreement with Invesco Investment Services, Inc. (“IIS”) pursuant to which the Fund has agreed to pay IIS a fee for providing transfer agency and shareholder services to the Fund and reimburse IIS for certain expenses incurred by IIS in the course of providing such services. For the year ended December 31, 2015, expenses incurred under the agreement are shown in the Statement of Operations as Transfer agent fees.
The Trust has entered into a master distribution agreement with Invesco Distributors, Inc. (“IDI”) to serve as the distributor for the Fund. The Trust has adopted a plan pursuant to Rule 12b-1 under the 1940 Act with respect to the Fund’s Series II shares (the “Plan”). The Fund, pursuant to the Plan, pays IDI compensation at the annual rate of 0.25% of the Fund’s average daily net assets of Series II shares. Of the Plan payments, up to 0.25% of the average daily net assets of the Series II shares may be paid to insurance companies who furnish continuing personal shareholder services to customers who purchase and own Series II shares of the Fund. For the year ended December 31, 2015, expenses incurred under the Plan are detailed in the Statement of Operations as Distribution fees.
For the year ended December 31, 2015, the Fund incurred $3,201 in brokerage commissions with Invesco Capital Markets, Inc., an affiliate of the Adviser and IDI, for portfolio transactions executed on behalf of the Fund.
Certain officers and trustees of the Trust are officers and directors of the Adviser, IIS and/or IDI.
NOTE 3—Additional Valuation Information
GAAP defines fair value as the price that would be received to sell an asset or paid to transfer a liability in an orderly transaction between market participants at the measurement date, under current market conditions. GAAP establishes a hierarchy that prioritizes the inputs to valuation methods, giving the highest priority to readily available unadjusted quoted prices in an active market for identical assets (Level 1) and the lowest priority to significant unobservable inputs (Level 3), generally when market prices are not readily available or are unreliable. Based on the valuation inputs, the securities or other investments are tiered into one of three levels. Changes in valuation methods may result in transfers in or out of an investment’s assigned level:
| | Level 1 — | Prices are determined using quoted prices in an active market for identical assets. |
| | Level 2 — | Prices are determined using other significant observable inputs. Observable inputs are inputs that other market participants may use in pricing a security. These may include quoted prices for similar securities, interest rates, prepayment speeds, credit risk, yield curves, loss severities, default rates, discount rates, volatilities and others. |
| | Level 3 — | Prices are determined using significant unobservable inputs. In situations where quoted prices or observable inputs are unavailable (for example, when there is little or no market activity for an investment at the end of the period), unobservable inputs may be used. Unobservable inputs reflect the Fund’s own assumptions about the factors market participants would use in determining fair value of the securities or instruments and would be based on the best available information. |
The following is a summary of the tiered valuation input levels, as of December 31, 2015. The level assigned to the securities valuations may not be an indication of the risk or liquidity associated with investing in those securities. Because of the inherent uncertainties of valuation, the values reflected in the financial statements may materially differ from the value received upon actual sale of those investments.
| | | | | | | | | | | | | | | | |
| | | Level 1 | | | Level 2 | | | Level 3 | | | Total | |
Equity Securities | | $ | 1,855,547,292 | | | $ | 25,486,994 | | | $ | — | | | $ | 1,881,034,286 | |
Forward Foreign Currency Contracts* | | | — | | | | 2,279,898 | | | | — | | | | 2,279,898 | |
Total Investments | | $ | 1,855,547,292 | | | $ | 27,766,892 | | | $ | — | | | $ | 1,883,314,184 | |
| * | Unrealized appreciation. |
Invesco V.I. Comstock Fund
NOTE 4—Derivative Investments
Value of Derivative Investments at Period-End
The table below summarizes the value of the Fund’s derivative investments, detailed by primary risk exposure, held as of December 31, 2015:
| | | | | | | | |
| | | Value | |
| Risk Exposure/Derivative Type | | Assets | | | Liabilities | |
Currency risk: | | | | | | | | |
Forward foreign currency contracts(a) | | $ | 2,279,898 | | | $ | — | |
| (a) | Values are disclosed on the Statement of Assets and Liabilities under the caption Forward foreign currency contracts outstanding. |
Effect of Derivative Investments for the year ended December 31, 2015
The table below summarizes the gains (losses) on derivative investments, detailed by primary risk exposure, recognized in earnings during the period:
| | | | |
| | | Location of Gain on
Statement of Operations | |
| | | Forward Foreign
Currency Contracts | |
Realized Gain: | | | | |
Currency risk | | $ | 17,416,839 | |
Change in Unrealized Appreciation (Depreciation): | | | | |
Currency risk | | | (1,420,202 | ) |
Total | | $ | 15,996,637 | |
The table below summarizes the average notional value of forward foreign currency contracts outstanding during the period.
| | | | |
| | | Forward Foreign
Currency Contracts | |
Average notional value | | $ | 191,605,374 | |
| | | | | | | | | | | | | | | | | | | | | | | | | | |
| Open Forward Foreign Currency Contracts | |
Settlement
Date | | Counterparty | | Contract to | | | Notional
Value | | | Unrealized
Appreciation | |
| | | Deliver | | | Receive | | | |
01/22/16 | | Barclays Bank PLC | | | EUR | | | | 9,862,079 | | | | USD | | | | 10,858,060 | | | $ | 10,723,566 | | | $ | 134,494 | |
01/22/16 | | Canadian Imperial Bank Commerce | | | CAD | | | | 11,338,116 | | | | USD | | | | 8,253,105 | | | | 8,191,783 | | | | 61,322 | |
01/22/16 | | Canadian Imperial Bank Commerce | | | CHF | | | | 8,417,573 | | | | USD | | | | 8,557,053 | | | | 8,411,849 | | | | 145,204 | |
01/22/16 | | Canadian Imperial Bank Commerce | | | EUR | | | | 9,862,079 | | | | USD | | | | 10,854,204 | | | | 10,723,566 | | | | 130,638 | |
01/22/16 | | Canadian Imperial Bank Commerce | | | GBP | | | | 5,037,153 | | | | USD | | | | 7,622,220 | | | | 7,425,966 | | | | 196,254 | |
01/22/16 | | Deutsche Bank Securities Inc. | | | CAD | | | | 11,257,145 | | | | USD | | | | 8,193,629 | | | | 8,133,282 | | | | 60,347 | |
01/22/16 | | Deutsche Bank Securities Inc. | | | CHF | | | | 8,417,071 | | | | USD | | | | 8,554,195 | | | | 8,411,347 | | | | 142,848 | |
01/22/16 | | Deutsche Bank Securities Inc. | | | EUR | | | | 9,862,079 | | | | USD | | | | 10,856,867 | | | | 10,723,566 | | | | 133,301 | |
01/22/16 | | Deutsche Bank Securities Inc. | | | GBP | | | | 5,038,797 | | | | USD | | | | 7,627,600 | | | | 7,428,390 | | | | 199,210 | |
01/22/16 | | Goldman Sachs International | | | CAD | | | | 11,257,146 | | | | USD | | | | 8,194,166 | | | | 8,133,282 | | | | 60,884 | |
01/22/16 | | Goldman Sachs International | | | CHF | | | | 8,417,573 | | | | USD | | | | 8,561,840 | | | | 8,411,848 | | | | 149,992 | |
01/22/16 | | Goldman Sachs International | | | EUR | | | | 9,863,327 | | | | USD | | | | 10,857,728 | | | | 10,724,924 | | | | 132,804 | |
01/22/16 | | Goldman Sachs International | | | GBP | | | | 5,037,154 | | | | USD | | | | 7,623,581 | | | | 7,425,967 | | | | 197,614 | |
01/22/16 | | RBC Capital Markets Corp. | | | CAD | | | | 11,257,146 | | | | USD | | | | 8,195,986 | | | | 8,133,282 | | | | 62,704 | |
01/22/16 | | RBC Capital Markets Corp. | | | CHF | | | | 8,417,573 | | | | USD | | | | 8,561,013 | | | | 8,411,849 | | | | 149,164 | |
01/22/16 | | RBC Capital Markets Corp. | | | EUR | | | | 9,862,079 | | | | USD | | | | 10,850,960 | | | | 10,723,567 | | | | 127,393 | |
01/22/16 | | RBC Capital Markets Corp. | | | GBP | | | | 5,037,153 | | | | USD | | | | 7,621,691 | | | | 7,425,966 | | | | 195,725 | |
Total open forward foreign currency contracts — Currency Risk | | | | | | | | | | | | | | | | | | | | | | $ | 2,279,898 | |
Currency Abbreviations:
| | |
| CAD | | – Canadian Dollar |
| CHF | | – Swiss Franc |
| | |
| EUR | | – Euro |
| GBP | | – British Pound Sterling |
Invesco V.I. Comstock Fund
Offsetting Assets and Liabilities
Accounting Standards Update (“ASU”) No. 2011-11, Disclosures about Offsetting Assets and Liabilities, which was subsequently clarified in Financial Accounting Standards Board ASU 2013-01 “Clarifying the Scope of Disclosures about Offsetting Assets and Liabilities” is intended to enhance disclosures about financial instruments and derivative instruments that are subject to offsetting arrangements on the Statement of Assets and Liabilities and to enable investors to better understand the effect of those arrangements on the Fund’s financial position. In order for an arrangement to be eligible for netting, the Fund must have a basis to conclude that such netting arrangements are legally enforceable. The Fund enters into netting agreements and collateral agreements in an attempt to reduce the Fund’s Counterparty credit risk by providing for a single net settlement with a Counterparty of all financial transactions covered by the agreement in an event of default as defined under such agreement.
The following tables present derivative instruments that are either subject to an enforceable netting agreement or offset by collateral arrangements as of December 31, 2015.
| | | | | | | | | | | | | | | | | | | | |
| | | Gross amounts
of Recognized
Assets | | | Gross Amounts Not Offset in the
Statement of Assets and Liabilities | | | Net
Amount | |
| | | Financial
Instruments | | | Collateral Received | | |
| Counterparty | | | | Non-Cash | | | Cash | | |
Barclays Bank PLC | | $ | 134,494 | | | $ | — | | | $ | — | | | $ | — | | | $ | 134,494 | |
Canadian Imperial Bank Commerce | | | 533,418 | | | | — | | | | — | | | | — | | | | 533,418 | |
Deutsche Bank Securities Inc. | | | 535,706 | | | | — | | | | | | | | | | | | 535,706 | |
Goldman Sachs International | | | 541,294 | | | | — | | | | — | | | | — | | | | 541,294 | |
RBC Capital Markets Corp. | | | 534,986 | | | | — | | | | — | | | | — | | | | 534,986 | |
Total | | $ | 2,279,898 | | | $ | — | | | $ | — | | | $ | — | | | $ | 2,279,898 | |
NOTE 5—Trustees’ and Officers’ Fees and Benefits
Trustees’ and Officers’ Fees and Benefits include amounts accrued by the Fund to pay remuneration to certain Trustees and Officers of the Fund. Trustees have the option to defer compensation payable by the Fund, and Trustees’ and Officers’ Fees and Benefits also include amounts accrued by the Fund to fund such deferred compensation amounts. Those Trustees who defer compensation have the option to select various Invesco Funds in which their deferral accounts shall be deemed to be invested. Finally, certain current Trustees were eligible to participate in a retirement plan that provided for benefits to be paid upon retirement to Trustees over a period of time based on the number of years of service. The Fund may have certain former Trustees who also participate in a retirement plan and receive benefits under such plan. Trustees’ and Officers’ Fees and Benefits include amounts accrued by the Fund to fund such retirement benefits. Obligations under the deferred compensation and retirement plans represent unsecured claims against the general assets of the Fund.
NOTE 6—Cash Balances
The Fund is permitted to temporarily carry a negative or overdrawn balance in its account with State Street Bank and Trust Company, the custodian bank. Such balances, if any at period end, are shown in the Statement of Assets and Liabilities under the payable caption Amount due custodian. To compensate the custodian bank for such overdrafts, the overdrawn Fund may either (1) leave funds as a compensating balance in the account so the custodian bank can be compensated by earning the additional interest; or (2) compensate by paying the custodian bank at a rate agreed upon by the custodian bank and Invesco, not to exceed the contractually agreed upon rate.
NOTE 7—Distributions to Shareholders and Tax Components of Net Assets
Tax Character of Distributions to Shareholders Paid During the Fiscal Years Ended December 31, 2015 and 2014:
| | | | | | | | |
| | | 2015 | | | 2014 | |
Ordinary income | | $ | 35,007,263 | | | $ | 24,614,716 | |
Long-term capital gain | | | 5,619,198 | | | | — | |
Total distributions | | $ | 40,626,461 | | | $ | 24,614,716 | |
Tax Components of Net Assets at Period-End:
| | | | |
| | | 2015 | |
Undistributed ordinary income | | $ | 38,206,979 | |
Undistributed long-term gain | | | 131,790,325 | |
Net unrealized appreciation — investments | | | 85,025,736 | |
Net unrealized appreciation (depreciation) — other investments | | | (33,294 | ) |
Temporary book/tax differences | | | (219,902 | ) |
Shares of beneficial interest | | | 1,627,319,734 | |
Total net assets | | $ | 1,882,089,578 | |
The difference between book-basis and tax-basis unrealized appreciation (depreciation) is due to differences in the timing of recognition of gains and losses on investments for tax and book purposes. The Fund’s net unrealized appreciation difference is attributable primarily to wash sales.
Invesco V.I. Comstock Fund
The temporary book/tax differences are a result of timing differences between book and tax recognition of income and/or expenses. The Fund’s temporary book/tax differences are the result of the trustee deferral of compensation and retirement plan benefits.
Capital loss carryforward is calculated and reported as of a specific date. Results of transactions and other activity after that date may affect the amount of capital loss carryforward actually available for the Fund to utilize. Capital losses generated in years beginning after December 22, 2010 can be carried forward for an unlimited period, whereas previous losses expire in eight tax years. Capital losses with an expiration period may not be used to offset capital gains until all net capital losses without an expiration date have been utilized. Capital loss carryforwards with no expiration date will retain their character as either short-term or long-term capital losses instead of as short-term capital losses as under prior law. The ability to utilize capital loss carryforwards in the future may be limited under the Internal Revenue Code and related regulations based on the results of future transactions.
The Fund does not have a capital loss carryforward as of December 31, 2015.
NOTE 8—Investment Securities
The aggregate amount of investment securities (other than short-term securities, U.S. Treasury obligations and money market funds, if any) purchased and sold by the Fund during the year ended December 31, 2015 was $327,514,421 and $436,459,924, respectively. Cost of investments on a tax basis includes the adjustments for financial reporting purposes as of the most recently completed federal income tax reporting period-end.
| | | | |
| Unrealized Appreciation (Depreciation) of Investment Securities on a Tax Basis | |
Aggregate unrealized appreciation of investment securities | | $ | 298,106,354 | |
Aggregate unrealized (depreciation) of investment securities | | | (213,080,618 | ) |
Net unrealized appreciation of investment securities | | $ | 85,025,736 | |
Cost of investments for tax purposes is $1,796,008,550.
NOTE 9—Reclassification of Permanent Differences
Primarily as a result of differing book/tax treatment of foreign currency transactions, on December 31, 2015, undistributed net investment income was decreased by $69,705 and undistributed net realized gain was increased by $69,705. This reclassification had no effect on the net assets of the Fund.
NOTE 10—Share Information
| | | | | | | | | | | | | | | | |
| | | Summary of Share Activity | |
| | | Years ended December 31, | |
| | | 2015(a) | | | 2014 | |
| | | Shares | | | Amount | | | Shares | | | Amount | |
Sold: | | | | | | | | | | | | | | | | |
Series I | | | 3,760,569 | | | $ | 70,725,463 | | | | 4,721,043 | | | $ | 87,225,388 | |
Series II | | | 5,016,751 | | | | 92,293,330 | | | | 5,163,219 | | | | 94,533,512 | |
| | | | |
Issued as reinvestment of dividends: | | | | | | | | | | | | | | | | |
Series I | | | 468,137 | | | | 7,860,021 | | | | 239,991 | | | | 4,492,632 | |
Series II | | | 1,957,374 | | | | 32,766,440 | | | | 1,078,354 | | | | 20,122,085 | |
| | | | |
Reacquired: | | | | | | | | | | | | | | | | |
Series I | | | (2,957,578 | ) | | | (55,625,698 | ) | | | (4,881,994 | ) | | | (90,462,826 | ) |
Series II | | | (14,920,435 | ) | | | (278,588,088 | ) | | | (18,159,674 | ) | | | (332,269,118 | ) |
Net increase in share activity | | | (6,675,182 | ) | | $ | (130,568,532 | ) | | | (11,839,061 | ) | | $ | (216,358,327 | ) |
| (a) | There are entities that are record owners of more than 5% of the outstanding shares of the Fund and in the aggregate own 62% of the outstanding shares of the Fund. The Fund and the Fund’s principal underwriter or adviser, are parties to participation agreements with these entities whereby these entities sell units of interest in separate accounts funding variable products that are invested in the Fund. The Fund, Invesco and/or Invesco affiliates may make payments to these entities, which are considered to be related to the Fund, for providing services to the Fund, Invesco and/or Invesco affiliates including but not limited to services such as, securities brokerage, third party record keeping and account servicing and administrative services. The Fund has no knowledge as to whether all or any portion of the shares owned of record by these entities are also owned beneficially. |
Invesco V.I. Comstock Fund
NOTE 11—Financial Highlights
The following schedule presents financial highlights for a share of the Fund outstanding throughout the periods indicated.
| | | | | | | | | | | | | | | | | | | | | | | | | | | | | | | | | | | | | | | | | | | | | | | | | | | | | | | | | | | | | | | | | | | | | | |
| | | Net asset
value,
beginning
of period | | Net
investment
income(a) | | Net gains
(losses)
on securities
(both
realized and
unrealized) | | Total from
investment
operations | | Dividends
from net
investment
income | | Distributions
from net
realized
gains | | Total
Distributions | | Net asset
value, end
of period | | Total
return(b) | | Net assets,
end of period
(000’s omitted) | | Ratio of
expenses
to average
net assets
with fee waivers
and/or expenses
absorbed | | Ratio of
expenses
to average net
assets without
fee waivers
and/or expenses
absorbed | | Ratio of net
investment
income
to average
net assets | | Portfolio
turnover(c) |
Series I | | | | | | | | | | | | | | | | | | | | | | | | | | | | | | | | | | | | | | | | | | | | | | | | | | | | | | | | | | | | | | | | | | | | | | |
Year ended 12/31/15 | | | $ | 19.16 | | | | $ | 0.28 | | | | $ | (1.45 | ) | | | $ | (1.17 | ) | | | $ | (0.37 | ) | | | $ | (0.05 | ) | | | $ | (0.42 | ) | | | $ | 17.57 | | | | | (5.98 | )% | | | $ | 332,411 | | | | | 0.78 | %(d) | | | | 0.83 | %(d) | | | | 1.52 | %(d) | | | | 16 | % |
Year ended 12/31/14 | | | | 17.75 | | | | | 0.32 | | | | | 1.34 | | | | | 1.66 | | | | | (0.25 | ) | | | | — | | | | | (0.25 | ) | | | | 19.16 | | | | | 9.39 | | | | | 338,159 | | | | | 0.78 | | | | | 0.83 | | | | | 1.73 | | | | | 19 | |
Year ended 12/31/13 | | | | 13.27 | | | | | 0.22 | | | | | 4.53 | | | | | 4.75 | | | | | (0.27 | ) | | | | — | | | | | (0.27 | ) | | | | 17.75 | | | | | 35.97 | | | | | 311,837 | | | | | 0.76 | | | | | 0.84 | | | | | 1.36 | | | | | 11 | |
Year ended 12/31/12 | | | | 11.32 | | | | | 0.23 | | | | | 1.94 | | | | | 2.17 | | | | | (0.22 | ) | | | | — | | | | | (0.22 | ) | | | | 13.27 | | | | | 19.23 | | | | | 250,995 | | | | | 0.67 | | | | | 0.85 | | | | | 1.81 | | | | | 14 | |
Year ended 12/31/11 | | | | 11.71 | | | | | 0.20 | | | | | (0.40 | ) | | | | (0.20 | ) | | | | (0.19 | ) | | | | — | | | | | (0.19 | ) | | | | 11.32 | | | | | (1.84 | ) | | | | 262,319 | | | | | 0.62 | | | | | 0.80 | | | | | 1.75 | | | | | 24 | |
Series II | | | | | | | | | | | | | | | | | | | | | | | | | | | | | | | | | | | | | | | | | | | | | | | | | | | | | | | | | | | | | | | | | | | | | | |
Year ended 12/31/15 | | | | 19.08 | | | | | 0.24 | | | | | (1.44 | ) | | | | (1.20 | ) | | | | (0.32 | ) | | | | (0.05 | ) | | | | (0.37 | ) | | | | 17.51 | | | | | (6.19 | ) | | | | 1,549,679 | | | | | 1.03 | (d) | | | | 1.08 | (d) | | | | 1.27 | (d) | | | | 16 | |
Year ended 12/31/14 | | | | 17.68 | | | | | 0.27 | | | | | 1.33 | | | | | 1.60 | | | | | (0.20 | ) | | | | — | | | | | (0.20 | ) | | | | 19.08 | | | | | 9.10 | | | | | 1,840,794 | | | | | 1.03 | | | | | 1.08 | | | | | 1.48 | | | | | 19 | |
Year ended 12/31/13 | | | | 13.22 | | | | | 0.17 | | | | | 4.52 | | | | | 4.69 | | | | | (0.23 | ) | | | | — | | | | | (0.23 | ) | | | | 17.68 | | | | | 35.65 | | | | | 1,916,026 | | | | | 1.01 | | | | | 1.09 | | | | | 1.11 | | | | | 11 | |
Year ended 12/31/12 | | | | 11.28 | | | | | 0.19 | | | | | 1.94 | | | | | 2.13 | | | | | (0.19 | ) | | | | — | | | | | (0.19 | ) | | | | 13.22 | | | | | 18.92 | | | | | 1,640,627 | | | | | 0.92 | | | | | 1.10 | | | | | 1.56 | | | | | 14 | |
Year ended 12/31/11 | | | | 11.67 | | | | | 0.17 | | | | | (0.40 | ) | | | | (0.23 | ) | | | | (0.16 | ) | | | | — | | | | | (0.16 | ) | | | | 11.28 | | | | | (2.11 | ) | | | | 1,528,067 | | | | | 0.87 | | | | | 1.05 | | | | | 1.50 | | | | | 24 | |
| (a) | Calculated using average shares outstanding. |
| (b) | Includes adjustments in accordance with accounting principles generally accepted in the United States of America and as such, the net asset value for financial reporting purposes and the returns based upon those net asset values may differ from the net asset value and returns for shareholder transactions. Total returns are not annualized for periods less than one year, if applicable, and do not reflect charges assessed in connection with a variable product, which if included would reduce total returns. |
| (c) | Portfolio turnover is calculated at the fund level and is not annualized for periods less than one year, if applicable. For the year ended December 31, 2011, the portfolio turnover calculation excludes the value of securities purchased of $21,084,025 and sold of $6,434,519 in the effort to realign the Fund’s portfolio holdings after the reorganization of Invesco Van Kampen V.I. Value Fund into the Fund. |
| (d) | Ratios are based on average daily net assets (000’s omitted) of $344,543 and $1,726,043 for Series I and Series II shares, respectively. |
Invesco V.I. Comstock Fund
Report of Independent Registered Public Accounting Firm
To the Board of Trustees of AIM Variable Insurance Funds (Invesco Variable Insurance Funds)
and Shareholders of Invesco V.I. Comstock Fund:
In our opinion, the accompanying statement of assets and liabilities, including the schedule of investments, and the related statements of operations and of changes in net assets and the financial highlights present fairly, in all material respects, the financial position of Invesco V.I. Comstock Fund (one of the funds constituting AIM Variable Insurance Funds (Invesco Variable Insurance Funds), hereafter referred to as the “Fund”) at December 31, 2015, the results of its operations for the year then ended, the changes in its net assets for each of the two years in the period then ended and the financial highlights for each of the five years in the period then ended, in conformity with accounting principles generally accepted in the United States of America. These financial statements and financial highlights (hereafter referred to as “financial statements”) are the responsibility of the Fund’s management. Our responsibility is to express an opinion on these financial statements based on our audits. We conducted our audits of these financial statements in accordance with the standards of the Public Company Accounting Oversight Board (United States). Those standards require that we plan and perform the audit to obtain reasonable assurance about whether the financial statements are free of material misstatement. An audit includes examining, on a test basis, evidence supporting the amounts and disclosures in the financial statements, assessing the accounting principles used and significant estimates made by management, and evaluating the overall financial statement presentation. We believe that our audits, which included confirmation of securities at December 31, 2015 by correspondence with the custodian and brokers, and the application of alternative auditing procedures where confirmations of security purchases have not been received, provide a reasonable basis for our opinion.
PRICEWATERHOUSECOOPERS LLP
Houston, Texas
February 15, 2016
Invesco V.I. Comstock Fund
Calculating your ongoing Fund expenses
Example
As a shareholder of the Fund, you incur ongoing costs, including management fees; distribution and/or service fees (12b-1); and other Fund expenses. This example is intended to help you understand your ongoing costs (in dollars) of investing in the Fund and to compare these costs with ongoing costs of investing in other mutual funds. The example is based on an investment of $1,000 invested at the beginning of the period and held for the entire period July 1, 2015 through December 31, 2015.
The actual and hypothetical expenses in the examples below do not represent the effect of any fees or other expenses assessed in connection with a variable product; if they did, the expenses shown would be higher while the ending account values shown would be lower.
Actual expenses
The table below provides information about actual account values and actual expenses. You may use the information in this table, together with the amount you invested, to estimate the expenses that you paid over the period. Simply divide your account value by $1,000 (for example, an $8,600 account value divided by $1,000 = 8.6), then multiply the result by the number in the table under the heading entitled “Actual Expenses Paid During Period” to estimate the expenses you paid on your account during this period.
Hypothetical example for comparison purposes
The table below also provides information about hypothetical account values and hypothetical expenses based on the Fund’s actual expense ratio and an assumed rate of return of 5% per year before expenses, which is not the Fund’s actual return.
The hypothetical account values and expenses may not be used to estimate the actual ending account balance or expenses you paid for the period. You may use this information to compare the ongoing costs of investing in the Fund and other funds. To do so, compare this 5% hypothetical example with the 5% hypothetical examples that appear in the shareholder reports of the other funds.
Please note that the expenses shown in the table are meant to highlight your ongoing costs. Therefore, the hypothetical information is useful in comparing ongoing costs, and will not help you determine the relative total costs of owning different funds.
| | | | | | | | | | | | | | | | | | | | | | | | |
| Class | | Beginning
Account Value
(07/01/15) | | | ACTUAL | | | HYPOTHETICAL (5% annual return before
expenses) | | | Annualized
Expense
Ratio | |
| | | Ending
Account Value
(12/31/15)1 | | | Expenses
Paid During
Period2 | | | Ending
Account Value
(12/31/15) | | | Expenses
Paid During
Period2 | | |
Series I | | $ | 1,000.00 | | | $ | 931.40 | | | $ | 3.75 | | | $ | 1,021.32 | | | $ | 3.92 | | | | 0.77 | % |
Series II | | | 1,000.00 | | | | 930.70 | | | | 4.96 | | | | 1,020.06 | | | | 5.19 | | | | 1.02 | |
| 1 | The actual ending account value is based on the actual total return of the Fund for the period July 1, 2015 through December 31, 2015, after actual expenses and will differ from the hypothetical ending account value which is based on the Fund’s expense ratio and a hypothetical annual return of 5% before expenses. |
| 2 | Expenses are equal to the Fund’s annualized expense ratio as indicated above multiplied by the average account value over the period, multiplied by 184/365 to reflect the most recent fiscal half year. |
Invesco V.I. Comstock Fund
Tax Information
Form 1099-DIV, Form 1042-S and other year–end tax information provide shareholders with actual calendar year amounts that should be included in their tax returns. Shareholders should consult their tax advisors.
The following distribution information is being provided as required by the Internal Revenue Code or to meet a specific state’s requirement.
The Fund designates the following amounts or, if subsequently determined to be different, the maximum amount allowable for its fiscal year ended December 31, 2015:
| | | | |
Federal and State Income Tax | |
Long-Term Capital Gain Distributions | | $ | 5,619,198 | |
Corporate Dividends Received Deduction* | | | 99.54 | % |
U.S. Treasury Obligations* | | | 0.00 | % |
| | * | The above percentages are based on ordinary income dividends paid to shareholders during the Fund’s fiscal year. |
Invesco V.I. Comstock Fund
Trustees and Officers
The address of each trustee and officer is AIM Variable Insurance Funds (Invesco Variable Insurance Funds) (the “Trust”), 11 Greenway Plaza, Suite 1000, Houston, Texas 77046-1173. The trustees serve for the life of the Trust, subject to their earlier death, incapacitation, resignation, retirement or removal as more specifically provided in the Trust’s organizational documents. Each officer serves for a one year term or until their successors are elected and qualified. Column two below includes length of time served with predecessor entities, if any.
| | | | | | | | |
Name, Year of Birth and
Position(s) Held with the Trust | | Trustee and/
or Officer Since | | Principal Occupation(s)
During Past 5 Years | | Number of Funds in Fund Complex Overseen by Trustee | | Other Directorship(s) Held by Trustee During Past 5 Years |
| Interested Persons | | | | | | | | |
| Martin L. Flanagan1 — 1960 Trustee | | 2007 | | Executive Director, Chief Executive Officer and President, Invesco Ltd. (ultimate parent of Invesco and a global investment management firm); Advisor to the Board, Invesco Advisers, Inc. (formerly known as Invesco Institutional (N.A.), Inc.); Trustee, The Invesco Funds; Vice Chair, Investment Company Institute; and Member of Executive Board, SMU Cox School of Business Formerly: Chairman and Chief Executive Officer, Invesco Advisers, Inc. (registered investment adviser); Director, Chairman, Chief Executive Officer and President, IVZ Inc. (holding company), INVESCO Group Services, Inc. (service provider) and Invesco North American Holdings, Inc. (holding company); Director, Chief Executive Officer and President, Invesco Holding Company Limited (parent of Invesco and a global investment management firm); Director, Invesco Ltd.; Chairman, Investment Company Institute and President, Co-Chief Executive Officer, Co-President, Chief Operating Officer and Chief Financial Officer, Franklin Resources, Inc. (global investment management organization) | | 146 | | None |
Philip A. Taylor2 — 1954 Trustee, President and Principal Executive Officer | | 2006 | | Head of North American Retail and Senior Managing Director, Invesco Ltd.; Director, Co-Chairman, Co-President and Co-Chief Executive Officer, Invesco Advisers, Inc. (formerly known as Invesco Institutional (N.A.), Inc.) (registered investment adviser); Director, Chairman, Chief Executive Officer and President, Invesco Management Group, Inc. (formerly known as Invesco Aim Management Group, Inc.) (financial services holding company); Director and Chairman, Invesco Investment Services, Inc. (formerly known as Invesco Aim Investment Services, Inc.) (registered transfer agent) Chief Executive Officer, Invesco Corporate Class Inc. (corporate mutual fund company) Director, Chairman and Chief Executive Officer, Invesco Canada Ltd. (formerly known as Invesco Trimark Ltd./Invesco Trimark Ltèe) (registered investment adviser and registered transfer agent); Trustee, President and Principal Executive Officer, The Invesco Funds (other than AIM Treasurer’s Series Trust (Invesco Treasurer’s Series Trust), Short-Term Investments Trust and Invesco Management Trust); Trustee and Executive Vice President, The Invesco Funds (AIM Treasurer’s Series Trust (Invesco Treasurer’s Series Trust), Short-Term Investments Trust and Invesco Management Trust only); Director, Invesco Investment Advisers LLC (formerly known as Van Kampen Asset Management); Director, Chief Executive Officer and President, Van Kampen Exchange Corp. Formerly: Director and President, INVESCO Funds Group, Inc. (registered investment adviser and registered transfer agent); Director and Chairman, IVZ Distributors, Inc. (formerly known as INVESCO Distributors, Inc.) (registered broker dealer); Director, President and Chairman, Invesco Inc. (holding company), Invesco Canada Holdings Inc. (holding company), Trimark Investments Ltd./Placements Trimark Ltèe and Invesco Financial Services Ltd/Services Financiers Invesco Ltèe; Chief Executive Officer, Invesco Canada Fund Inc (corporate mutual fund company); Director and Chairman, Van Kampen Investor Services Inc.; Director, Chief Executive Officer and President, 1371 Preferred Inc. (holding company) and Van Kampen Investments Inc.; Director and President, AIM GP Canada Inc. (general partner for limited partnerships) and Van Kampen Advisors, Inc.; Director and Chief Executive Officer, Invesco Trimark Dealer Inc. (registered broker dealer); Director, Invesco Distributors, Inc. (formerly known as Invesco Aim Distributors, Inc.) (registered broker dealer); Manager, Invesco PowerShares Capital Management LLC; Director, Chief Executive Officer and President, Invesco Advisers, Inc.; Director, Chairman, Chief Executive Officer and President, Invesco Aim Capital Management, Inc.; President, Invesco Trimark Dealer Inc. and Invesco Trimark Ltd./Invesco Trimark Ltèe; Director and President, AIM Trimark Corporate Class Inc. and AIM Trimark Canada Fund Inc.; Senior Managing Director, Invesco Holding Company Limited; Director and Chairman, Fund Management Company (former registered broker dealer); President and Principal Executive Officer, The Invesco Funds (AIM Treasurer’s Series Trust (Invesco Treasurer’s Series Trust), and Short-Term Investments Trust only); President, AIM Trimark Global Fund Inc. and AIM Trimark Canada Fund Inc | | 146 | | None |
| 1 | Mr. Flanagan is considered an interested person (within the meaning of Section 2(a)(19) of the 1940 Act) of the Trust because he is an officer of the Adviser to the Trust, and an officer and a director of Invesco Ltd., ultimate parent of the Adviser. |
| 2 | Mr. Taylor is considered an interested person (within the meaning of Section 2(a)(19) of the 1940 Act) of the Trust because he is an officer and a director of the Adviser. |
Invesco V.I. Comstock Fund
Trustees and Officers—(continued)
| | | | | | | | |
Name, Year of Birth and
Position(s) Held with the Trust | | Trustee and/
or Officer Since | | Principal Occupation(s)
During Past 5 Years | | Number of Funds in Fund Complex Overseen by Trustee | | Other Directorship(s)
Held by Trustee During Past 5 Years |
| Independent Trustees | | | | | | | | |
Bruce L. Crockett — 1944 Trustee and Chair | | 2003 | | Chairman, Crockett Technologies Associates (technology consulting company) Formerly: Director, Captaris (unified messaging provider); Director, President and Chief Executive Officer, COMSAT Corporation; Chairman, Board of Governors of INTELSAT (international communications company); ACE Limited (insurance company); Independent Directors Council and Investment Company Institute | | 146 | | ALPS (Attorneys Liability Protection Society) (insurance company) and Globe Specialty Metals, Inc. (metallurgical company) |
David C. Arch — 1945 Trustee | | 2010 | | Chairman of Blistex Inc., a consumer health care products manufacturer | | 146 | | Board member of the Illinois Manufacturers’ Association; Member of the Board of Visitors, Institute for the Humanities, University of Michigan |
James T. Bunch — 1942 Trustee | | 2000 | | Managing Member, Grumman Hill Group LLC (family office/private equity investments) Formerly: Chairman of the Board of Trustees, Evans Scholars Foundation and Chairman, Board of Governors, Western Golf Association | | 146 | | Trustee, Evans Scholars Foundation; and Chairman of the Board, Denver Film Society |
Albert R. Dowden — 1941 Trustee | | 2003 | | Director of a number of public and private business corporations, including the Boss Group, Ltd. (private investment and management); Nature’s Sunshine Products, Inc. and Reich & Tang Funds (5 portfolios) (registered investment company) Formerly: Director, Homeowners of America Holding Corporation/Homeowners of America Insurance Company (property casualty company); Director, Continental Energy Services, LLC (oil and gas pipeline service); Director, CompuDyne Corporation (provider of product and services to the public security market) and Director, Annuity and Life Re (Holdings), Ltd. (reinsurance company); Director, President and Chief Executive Officer, Volvo Group North America, Inc.; Senior Vice President, AB Volvo; Director of various public and private corporations; Chairman, DHJ Media, Inc.; Director, Magellan Insurance Company; and Director, The Hertz Corporation, Genmar Corporation (boat manufacturer), National Media Corporation; Advisory Board of Rotary Power International (designer, manufacturer, and seller of rotary power engines); and Chairman, Cortland Trust, Inc. (registered investment company) | | 146 | | Director of: Nature’s Sunshine Products, Inc., Reich & Tang Funds, Homeowners of America Holding Corporation/ Homeowners of America Insurance Company, the Boss Group |
Jack M. Fields — 1952 Trustee | | 2003 | | Chief Executive Officer, Twenty First Century Group, Inc. (government affairs company); Owner and Chief Executive Officer, Dos Angeles Ranch, L.P. (cattle, hunting, corporate entertainment); and Discovery Global Education Fund (non-profit) Formerly: Chief Executive Officer, Texana Timber LP (sustainable forestry company); Director of Cross Timbers Quail Research Ranch (non-profit); and member of the U.S. House of Representatives | | 146 | | Insperity, Inc. (formerly known as Administaff) |
Eli Jones — Trustee | | 2016 | | Professor and Dean, Mays Business School, Texas A&M University Formerly: Professor and Dean, Walton College of Business, University of Arkansas, and E.J. Ourso College of Business, Louisiana State University | | 146 | | Director, Insperity, Inc., (2011-present) and ARVEST Bank (2012-2015) |
Prema Mathai-Davis — 1950 Trustee | | 2003 | | Retired. Formerly: Chief Executive Officer, YWCA of the U.S.A. | | 146 | | None |
Larry Soll — 1942 Trustee | | 1997 | | Retired. Formerly: Chairman, Chief Executive Officer and President, Synergen Corp. (a biotechnology company) | | 146 | | None |
Robert C. Troccoli — Trustee | | 2016 | | Retired. Formerly: Senior Partner, KPMG LLP | | 146 | | None |
Raymond Stickel, Jr. — 1944 Trustee | | 2005 | | Retired. Formerly: Director, Mainstay VP Series Funds, Inc. (25 portfolios) and Partner, Deloitte & Touche | | 146 | | None |
Suzanne H. Woolsey — 1941 Trustee | | 2014 | | Chief Executive Officer of Woolsey Partners LLC | | 146 | | Emeritus Chair of the Board of Trustees of the Institute for Defense Analyses; Trustee of Colorado College; Trustee of California Institute of Technology; Prior to 2014, Director of Fluor Corp.; Prior to 2010, Trustee of the German Marshall Fund of the United States; Prior to 2010 Trustee of the Rocky Mountain Institute |
Invesco V.I. Comstock Fund
Trustees and Officers—(continued)
| | | | | | | | |
Name, Year of Birth and
Position(s) Held with the Trust | | Trustee and/
or Officer Since | | Principal Occupation(s)
During Past 5 Years | | Number of Funds in Fund Complex Overseen by Trustee | | Other Directorship(s)
Held by Trustee During Past 5 Years |
| Other Officers | | | | | | | | |
Russell C. Burk — 1958 Senior Vice President and Senior Officer | | 2005 | | Senior Vice President and Senior Officer, The Invesco Funds | | N/A | | N/A |
John M. Zerr — 1962 Senior Vice President, Chief Legal Officer and Secretary | | 2006 | | Director, Senior Vice President, Secretary and General Counsel, Invesco Management Group, Inc. (formerly known as Invesco Aim Management Group, Inc.) and Van Kampen Exchange Corp.; Senior Vice President, Invesco Advisers, Inc. (formerly known as Invesco Institutional (N.A.), Inc.) (registered investment adviser); Senior Vice President and Secretary, Invesco Distributors, Inc. (formerly known as Invesco Aim Distributors, Inc.); Director, Vice President and Secretary, Invesco Investment Services, Inc. (formerly known as Invesco Aim Investment Services, Inc.); Senior Vice President, Chief Legal Officer and Secretary, The Invesco Funds; Managing Director, Invesco PowerShares Capital Management LLC; Director, Secretary and General Counsel, Invesco Investment Advisers LLC (formerly known as Van Kampen Asset Management); Secretary and General Counsel, Invesco Capital Markets, Inc. (formerly known as Van Kampen Funds Inc.) and Chief Legal Officer, PowerShares Exchange-Traded Fund Trust, PowerShares Exchange-Traded Fund Trust II, PowerShares India Exchange-Traded Fund Trust, PowerShares Actively Managed Exchange-Traded Fund Trust, and PowerShares Actively Managed Exchange-Traded Commodity Fund Trust Formerly: Director, Vice President and Secretary, IVZ Distributors, Inc. (formerly known as INVESCO distributors, Inc.); Director and Vice President, INVESCO Funds Group, Inc.; Director and Vice President, Van Kampen Advisors Inc.; Director, Vice President, Secretary and General Counsel, Van Kampen Investor Services Inc.; Director, Invesco Distributors, Inc. (formerly known as Invesco Aim Distributors, Inc.); Director, Senior Vice President, General Counsel and Secretary, Invesco Aim Advisers, Inc. and Van Kampen Investments Inc.; Director, Vice President and Secretary, Fund Management Company; Director, Senior Vice President, Secretary, General Counsel and Vice President, Invesco Aim Capital Management, Inc.; Chief Operating Officer and General Counsel, Liberty Ridge Capital, Inc. (an investment adviser); Vice President and Secretary, PBHG Funds (an investment company) and PBHG Insurance Series Fund (an investment company); Chief Operating Officer, General Counsel and Secretary, Old Mutual Investment Partners (a broker-dealer); General Counsel and Secretary, Old Mutual Fund Services (an administrator) and Old Mutual Shareholder Services (a shareholder servicing center); Executive Vice President, General Counsel and Secretary, Old Mutual Capital, Inc. (an investment adviser); and Vice President and Secretary, Old Mutual Advisors Funds (an investment company) | | N/A | | N/A |
Sheri Morris — 1964 Vice President, Treasurer and Principal Financial Officer | | 2003 | | Vice President, Treasurer and Principal Financial Officer, The Invesco Funds; Vice President, Invesco Advisers, Inc. (formerly known as Invesco Institutional (N.A.), Inc.) (registered investment adviser); and Vice President, PowerShares Exchange-Traded Fund Trust, PowerShares Exchange-Traded Fund Trust II, PowerShares India Exchange-Traded Fund Trust, PowerShares Actively Managed Exchange-Traded Fund Trust, and PowerShares Actively Managed Exchange-Traded Commodity Fund Trust Formerly: Vice President, Invesco Aim Advisers, Inc., Invesco Aim Capital Management, Inc. and Invesco Aim Private Asset Management, Inc.; Assistant Vice President and Assistant Treasurer, The Invesco Funds and Assistant Vice President, Invesco Advisers, Inc., Invesco Aim Capital Management, Inc. and Invesco Aim Private Asset Management, Inc.; and Treasurer, PowerShares Exchange-Traded Fund Trust, PowerShares Exchange-Traded Fund Trust II, PowerShares India Exchange-Traded Fund Trust and PowerShares Actively Managed Exchange-Traded Fund Trust | | N/A | | N/A |
Invesco V.I. Comstock Fund
Trustees and Officers—(continued)
| | | | | | | | |
Name, Year of Birth and
Position(s) Held with the Trust | | Trustee and/
or Officer Since | | Principal Occupation(s)
During Past 5 Years | | Number of Funds in Fund Complex Overseen by Trustee | | Other Directorship(s)
Held by Trustee During Past 5 Years |
| Other Officers—(continued) | | | | | | | | |
Karen Dunn Kelley — 1960 Vice President | | 2003 | | Senior Managing Director, Investments, Invesco Ltd.; Director, Co-President, Co-Chief Executive Officer, and Co-Chairman, Invesco Advisers, Inc. (formerly known as Invesco Institutional (N.A.), Inc.) (registered investment adviser); Chairman, Invesco Senior Secured Management, Inc.; Senior Vice President, Invesco Management Group, Inc. (formerly known as Invesco Aim Management Group, Inc.); Executive Vice President, Invesco Distributors, Inc. (formerly known as Invesco Aim Distributors, Inc.); Director, Invesco Mortgage Capital Inc. and Invesco Management Company Limited; Vice President, The Invesco Funds (other than AIM Treasurer’s Series Trust (Invesco Treasurer’s Series Trust), Short-Term Investments Trust and Invesco Management Trust); and President and Principal Executive Officer, The Invesco Funds (AIM Treasurer’s Series Trust (Invesco Treasurer’s Series Trust), Short-Term Investments Trust and Invesco Management Trust only) Formerly: Director and President, INVESCO Asset Management (Bermuda) Ltd., Director, INVESCO Global Asset Management Limited and INVESCO Management S.A.; Senior Vice President, Van Kampen Investments Inc. and Invesco Advisers, Inc. (formerly known as Invesco Institutional (N.A.), Inc.) (registered investment adviser); Vice President, Invesco Advisers, Inc. (formerly known as Invesco Institutional (N.A.), Inc.); Director of Cash Management and Senior Vice President, Invesco Advisers, Inc. and Invesco Aim Capital Management, Inc.; Director and President, Fund Management Company; Chief Cash Management Officer, Director of Cash Management, Senior Vice President, and Managing Director, Invesco Aim Capital Management, Inc.; Director of Cash Management, Senior Vice President, and Vice President, Invesco Advisers, Inc. and The Invesco Funds (AIM Treasurer’s Series Trust (Invesco Treasurer’s Series Trust), and Short-Term Investments Trust only) | | N/A | | N/A |
Crissie M. Wisdom — 1969 Anti-Money Laundering Compliance Officer | | 2013 | | Anti-Money Laundering Compliance Officer, Invesco Advisers, Inc. (formerly known as Invesco Institutional (N.A.), Inc.) (registered investment adviser), Invesco Capital Markets, Inc. (formerly known as Van Kampen Funds Inc.), Invesco Distributors, Inc., Invesco Investment Services, Inc., Invesco Management Group, Inc., Van Kampen Exchange Corp., The Invesco Funds, and PowerShares Exchange-Traded Fund Trust, PowerShares Exchange-Traded Fund Trust II, PowerShares India Exchange-Traded Fund Trust, PowerShares Actively Managed Exchange-Traded Fund Trust and PowerShares Actively Managed Exchange-Traded Commodity Fund Trust; Anti-Money Laundering Compliance Officer and Bank Secrecy Act Officer, INVESCO National Trust Company and Invesco Trust Company; and Fraud Prevention Manager and Controls and Risk Analysis Manager for Invesco Investment Services, Inc. | | N/A | | N/A |
Lisa O. Brinkley — 1959 Chief Compliance Officer | | 2015 | | Senior Vice President and Chief Compliance Officer, Invesco Advisers, Inc. (registered investment adviser) (formerly known as Invesco Institutional (N.A., Inc.); and Chief Compliance Officer, The Invesco Funds Formerly: Global Assurance Officer, Invesco Ltd. and Vice President, The Invesco Funds; Chief Compliance Officer, Invesco Distributors, Inc. (formerly known as Invesco Aim Distributors, Inc.), Invesco Investment Services, Inc.(formerly known as Invesco Aim Investment Services, Inc.) and Van Kampen Investor Services Inc.; Senior Vice President, Invesco Management Group, Inc.; Senior Vice President and Chief Compliance Officer, Invesco Advisers, Inc. and The Invesco Funds; Vice President and Chief Compliance Officer, Invesco Aim Capital Management, Inc. and Invesco Distributors, Inc.; Vice President, Invesco Investment Services, Inc. and Fund Management Company | | N/A | | N/A |
The Statement of Additional Information of the Trust includes additional information about the Fund’s Trustees and is available upon request, without charge, by calling 1.800.959.4246. Please refer to the Fund’s prospectus for information on the Fund’s sub-advisers.
| | | | | | |
Office of the Fund 11 Greenway Plaza, Suite 1000 Houston, TX 77046-1173 | | Investment Adviser Invesco Advisers, Inc. 1555 Peachtree Street, N.E. Atlanta, GA 30309 | | Distributor Invesco Distributors, Inc. 11 Greenway Plaza, Suite 1000 Houston, TX 77046-1173 | | Auditors PricewaterhouseCoopers LLP 1000 Louisiana Street, Suite 5800 Houston, TX 77002-5678 |
| | | |
| | | | | | |
Counsel to the Fund Stradley Ronon Stevens & Young, LLP 2005 Market Street, Suite 2600 Philadelphia, PA 19103-7018 | | Counsel to the Independent Trustees Goodwin Procter LLP 901 New York Avenue, N.W. Washington, D.C. 20001 | | Transfer Agent Invesco Investment Services, Inc. 11 Greenway Plaza, Suite 1000 Houston, TX 77046-1173 | | Custodian State Street Bank and Trust Company 225 Franklin Street Boston, MA 02110-2801 |
Invesco V.I. Comstock Fund
| | | | |
| | |
 | | Annual Report to Shareholders | | December 31, 2015 |
| | |
| | Invesco V.I. Core Equity Fund |

| | |
| | The Fund provides a complete list of its holdings four times in each fiscal year, at the quarter-ends. For the second and fourth quarters, the lists appear in the Fund’s semiannual and annual reports to shareholders. For the first and third quarters, the Fund files the lists with the Securities and Exchange Commission (SEC) on Form N-Q. The Fund’s Form N-Q filings are available on the SEC website, sec.gov. Copies of the Fund’s Forms N-Q may be reviewed and copied at the SEC Public Reference Room in Washington, D.C. You can obtain information on the operation of the Public Reference Room, including information about duplicating fee charges, by calling 202 551 8090 or 800 732 0330, or by electronic request at the following email address: publicinfo@sec.gov. The SEC file numbers for the Fund are 811-07452 and 033-57340. The Fund’s most recent portfolio holdings, as filed on Form N-Q, have also been made available to insurance companies issuing variable annuity contracts and variable life insurance policies (“variable products”) that invest in the Fund. A description of the policies and procedures that the Fund uses to determine how to vote proxies relating to portfolio securities is available without charge, upon request, from our Client Services department at 800 959 4246 or at invesco.com/proxyguidelines. The information is also available on the SEC website, sec.gov. Information regarding how the Fund voted proxies related to its portfolio securities during the most recent 12-month period ended June 30 is available at invesco.com/proxysearch. The information is also available on the SEC website, sec.gov. Invesco Advisers, Inc. is an investment adviser; it provides investment advisory services to individual and institutional clients and does not sell securities. Invesco Distributors, Inc. is the US distributor for Invesco Ltd.’s retail mutual funds, exchange-traded funds and institutional money market funds. Both are wholly owned, indirect subsidiaries of Invesco Ltd. This report must be accompanied or preceded by a currently effective Fund prospectus and variable product prospectus, which contain more complete information, including sales charges and expenses. Investors should read each carefully before investing. Invesco Distributors, Inc. VICEQ-AR-1 NOT FDIC INSURED | MAY LOSE VALUE | NO BANK GUARANTEE |
Management’s Discussion of Fund Performance
Performance summary
For the year ended December 31, 2015, Series I shares of Invesco V.I. Core Equity Fund (the Fund), underperformed the Russell 1000 Index, the Fund’s style-specific benchmark.
Your Fund’s long-term performance appears later in this report.
Fund vs. Indexes
Total returns, 12/31/14 to 12/31/15, excluding variable product issuer charges. If variable product issuer charges were included, returns would be lower.
| | | | | |
| Series I Shares | | | | -5.77 | % |
| Series II Shares | | | | -6.00 | |
| S&P 500 Index▼ (Broad Market Index) | | | | 1.38 | |
| Russell 1000 Index▼ (Style-Specific Index) | | | | 0.92 | |
| Lipper VUF Large-Cap Core Funds Indexn (Peer Group Index) | | | | 0.53 | |
Source(s): ▼FactSet Research Systems Inc.; nLipper Inc.
Market conditions and your Fund
The US economy continued its modest, but steady growth, during the year ended December 31, 2015 – although the health of individual economic sectors varied dramatically. The headline economic story was a steady decline in already-battered energy markets, as oil prices plummeted when increased supply overwhelmed demand. This decline particularly affected companies with US-based offshore or shale-based resources – companies whose cost to recover oil is higher than many traditional producers. On the other end of the spectrum, the improved position of the US consumer was the more subtle story which drove the US economy forward during the year.
As the year began, economic growth appeared to be stronger in the US than in the rest of the world. US equity markets were recovering from the crash of oil prices initiated by OPEC’s decision to maintain high production despite low prices and slowing global growth. The view that the US Federal Reserve (the Fed) would begin raising rates while other central banks were loosening monetary policy led the US dollar to strengthen against many currencies. This hurt com-
modity – and materials-based economies – and companies in related sectors. Additionally, US-based multinational companies faced foreign exchange headwinds. Low interest rates, the increasing availability of credit and an improving employment picture all contributed to higher consumer confidence and consumer spending, which drove US equity markets higher, particularly through the spring, and helped overcome fears that Greece and the eurozone would fail to reach an agreement on a financial bailout plan.
In the summer of 2015, US equity markets moved sharply lower. A significant downturn in China’s financial markets and weak global economic growth led the Fed to delay raising interest rates; this, in turn, increased investor uncertainty and market volatility. A continued decline in oil prices also contributed to market volatility. In the fall of 2015, however, US markets rallied, the Fed saw enough economic stabilization to finally raise interest rates, and most major US market indexes ended the year barely in positive territory.
During the year, stock selection in the consumer staples, health care and materials sectors delivered positive performance for the Fund. In addition, under-
weight exposure to the energy and materials sectors benefited the Fund. The largest detractors from Fund performance relative to the Fund’s style-specific benchmark included stock selection in the consumer discretionary, financials, and information technology (IT) sectors.
The largest contributor to Fund performance was insurance company, Progressive. During the year, the company released a strong earnings report with better-than-expected top-line growth supported by the company’s continued gains in market share. This positive outlook boosted the company’s stock price.
Molson Coors Brewing benefited from marginally improving sales trends for the beer category, as well as expectations for consolidation within the industry in the future.
American Express detracted from the Fund’s relative performance versus the Fund’s style-specific benchmark after the company announced it would end its partnership program with Costco (not a Fund holding).
Cabot Oil & Gas detracted as its share price reflected the challenging environment for energy, the style-specific benchmark’s worst-performing sector.
Finally, the Fund’s conservative positioning and allocation to cash hampered performance during the year. We have been quite active in deploying cash during periods of market volatility. Though the Fund’s allocation to cash decreased, our high single-digit position detracted from Fund performance.
During the reporting period, our largest overweight position relative to the Russell 1000 Index was in the health care sector. The Fund also had a slight overweight position in the IT sector. The Fund’s largest underweight positions were in the consumer discretionary, consumer staples, materials and utilities sectors.
| | |
| Portfolio Composition |
By sector | | % of total net assets |
| |
| Information Technology | | 21.9% |
| Health Care | | 18.5 |
| Financials | | 17.6 |
| Consumer Discretionary | | 10.5 |
| Consumer Staples | | 8.8 |
| Industrials | | 7.6 |
| Energy | | 5.7 |
| Utilities | | 2.9 |
| Telecommunication Services | | 1.5 |
Money Market Funds Plus Other Assets Less Liabilities | | 5.0 |
| | |
| Top 10 Equity Holdings* | | |
% of total net assets |
| |
1. Taiwan Semiconductor Manufacturing Co. Ltd. | | 3.1% |
2. Progressive Corp. (The) | | 2.8 |
3. American Express Co. | | 2.6 |
4. Marsh & McLennan Cos., Inc. | | 2.5 |
5. Analog Devices, Inc. | | 2.3 |
6. AbbVie Inc. | �� | 2.3 |
7. Berkshire Hathaway Inc.
-Class A | | 2.2 |
8. Comcast Corp.-Class A | | 2.1 |
9. QUALCOMM, Inc. | | 2.1 |
10. TE Connectivity Ltd. | | 2.0 |
| | | | | |
| Total Net Assets | | | | $1.1 billion | |
| |
| Total Number of Holdings* | | | | 63 | |
The Fund’s holdings are subject to change, and there is no assurance that the Fund will continue to hold any particular security.
*Excluding money market fund holdings.
Data presented here are as of December 31, 2015.
Invesco V.I. Core Equity Fund
As always, the Fund focuses on companies that provide an attractive return on invested capital, trade at attractive valuations and have management teams with a long-term perspective. In short, we seek to take advantage of the market’s volatile behavior and short-term focus. We believe our conservative approach should position the Fund to navigate the evolving economic backdrop.
We thank you for your continued investment in Invesco V.I. Core Equity Fund.
The views and opinions expressed in management’s discussion of Fund performance are those of Invesco Advisers, Inc. These views and opinions are subject to change at any time based on factors such as market and economic conditions. These views and opinions may not be relied upon as investment advice or recommendations, or as an offer for a particular security. The information is not a complete analysis of every aspect of any market, country, industry, security or the Fund. Statements of fact are from sources considered reliable, but Invesco Advisers, Inc. makes no representation or warranty as to their completeness or accuracy. Although historical performance is no guarantee of future results, these insights may help you understand our investment management philosophy.
See important Fund and, if applicable, index disclosures later in this report.
| | |
 | | Ronald Sloan Chartered Financial Analyst, Portfolio Manager and Chief Investment Officer of Invesco’s global core |
| equity team, is lead manager of Invesco V.I. Core Equity Fund. He joined Invesco in 1998. Mr. Sloan earned a BS in business administration and an MBA from the University of Missouri. |
| |
 | | Brian Nelson Chartered Financial Analyst, Portfolio Manager, is manager of Invesco V.I. Core Equity Fund. He joined |
Invesco in 2004. Mr. Nelson earned a BA from the University of California, Santa Barbara. Assisted by Invesco’s Global Core Equity Team |
Invesco V.I. Core Equity Fund
Your Fund’s Long-Term Performance
Results of a $10,000 Investment – Oldest Share Class(es)
Fund and index data from 12/31/05
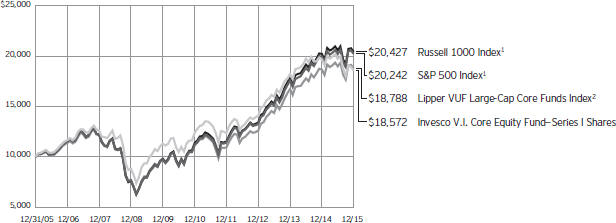
| 1 | Source: FactSet Research Systems Inc. |
Past performance cannot guarantee
comparable future results.
| | | | | |
| Average Annual Total Returns | | |
As of 12/31/15 | | | | | |
| |
| Series I Shares | | | | | |
| Inception (5/2/94) | | | | 7.82 | % |
| 10 Years | | | | 6.39 | |
| 5 Years | | | | 8.43 | |
| 1 Year | | | | -5.77 | |
| |
| Series II Shares | | | | | |
| Inception (10/24/01) | | | | 6.06 | % |
| 10 Years | | | | 6.12 | |
| 5 Years | | | | 8.17 | |
| 1 Year | | | | -6.00 | |
The performance of the Fund’s Series I and Series II share classes will differ primarily due to different class expenses.
The performance data quoted represent past performance and cannot guarantee comparable future results; current performance may be lower or higher. Please contact your variable product issuer or financial adviser for the most recent month-end variable product performance. Performance figures reflect Fund expenses, reinvested distributions and changes in
net asset value. Investment return and principal value will fluctuate so that you may have a gain or loss when you sell shares.
The net annual Fund operating expense ratio set forth in the most recent Fund prospectus as of the date of this report for Series I and Series II shares was 0.90% and 1.15%, respectively.1 The total annual Fund operating expense ratio set forth in the most recent Fund prospectus as of the date of this report for Series I and Series II shares was 0.92% and 1.17%, respectively. The expense ratios presented above may vary from the expense ratios presented in other sections of this report that are based on expenses incurred during the period covered by this report.
Invesco V.I. Core Equity Fund, a series portfolio of AIM Variable Insurance Funds (Invesco Variable Insurance Funds), is currently offered through insurance companies issuing variable products. You cannot purchase shares of the Fund directly. Performance figures given represent
the Fund and are not intended to reflect actual variable product values. They do not reflect sales charges, expenses and fees assessed in connection with a variable product. Sales charges, expenses and fees, which are determined by the variable product issuers, will vary and will lower the total return.
The most recent month-end performance at the Fund level, excluding variable product charges, is available at 800 451 4246. As mentioned above, for the most recent month-end performance including variable product charges, please contact your variable product issuer or financial adviser.
Fund performance reflects any applicable fee waivers and/or expense reimbursements. Had the adviser not waived fees and/or reimbursed expenses currently or in the past, returns would have been lower. See current prospectus for more information.
| 1 | Total annual Fund operating expenses after any contractual fee waivers and/or expense reimbursements by the adviser in effect through at least June 30, 2017. See current prospectus for more information. |
Invesco V.I. Core Equity Fund
Invesco V.I. Core Equity Fund’s investment objective is long-term growth of capital.
| n | | Unless otherwise stated, information presented in this report is as of December 31, 2015, and is based on total net assets. |
| n | | Unless otherwise noted, all data provided by Invesco. |
| n | | To access your Fund’s reports/prospectus, visit invesco.com/fundreports. |
Principal risks of investing in the Fund
Cash/cash equivalents risk. Holding cash or cash equivalents may negatively affect performance.
Debt securities risk. The Fund may invest in debt securities that are affected by changing interest rates and changes in their effective maturities and credit quality.
Derivatives risk. The value of a derivative instrument depends largely on (and is derived from) the value of an underlying security, currency, commodity, interest rate, index or other asset (each referred to as an underlying asset). In addition to risks relating to the underlying assets, the use of derivatives may include other, possibly greater, risks, including counterparty, leverage and liquidity risks. Counterparty risk is the risk that the counterparty to the derivative contract will default on its obligation to pay the Fund the amount owed or otherwise perform under the derivative contract. Derivatives create leverage risk because they do not require payment up front equal to the economic exposure created by owning the derivative. As a result, an adverse change in the value of the underlying asset could result in the Fund sustaining a loss that is substantially greater than the amount invested in the derivative, which may make the Fund’s returns more volatile and increase the risk of loss. Derivative instruments may also be less liquid than more traditional investments and the Fund may be unable to sell or close out its derivative positions at a desirable time or price. This risk may be more acute under adverse market conditions, during which the Fund may be most in need of liquidating its derivative positions. Derivatives may also be harder to value, less tax efficient and subject to changing government regulation that could impact the Fund’s ability to use certain derivatives or their cost. Also, derivatives used for hedging or to gain or limit exposure to a particular market segment may not provide the expected benefits, particularly during adverse market conditions.
Foreign government debt risk. Investments in foreign government debt obligations involve certain risks in addition to those relating to foreign securities or debt securities generally. The issuer of the debt or the governmental authorities
that control the repayment of the debt may be unable or unwilling to repay principal or interest when due in accordance with the terms of such debt, and the Fund may have limited recourse in the event of a default against the defaulting government. Without the approval of debt holders, some governmental debtors have in the past been able to reschedule or restructure their debt payments or declare moratoria on payments.
Foreign securities risk. The Fund’s foreign investments may be affected by changes in a foreign country’s exchange rates, political and social instability, changes in economic or taxation policies, difficulties when enforcing obligations, decreased liquidity, and increased volatility. Foreign companies may be subject to less regulation resulting in less publicly available information about the companies.
Management risk. The investment techniques and risk analysis used by the Fund’s portfolio managers may not produce the desired results.
Market risk. The prices of and the income generated by the Fund’s securities may decline in response to, among other things, investor sentiment, general economic and market conditions, regional or global instability, and currency and interest rate fluctuations.
Small- and mid-capitalization risks. Stocks of small- and mid-sized companies tend to be more vulnerable to adverse developments and may have little or no operating history or track record of success, and limited product lines, markets, management and financial resources. The securities of small- and mid-sized companies may be more volatile due to less market interest and less publicly available information about the issuer. They also may be illiquid or restricted as to resale, or may trade less frequently and in smaller volumes, all of which may cause difficulty when establishing or closing a position at a desirable price.
About indexes used in this report
The S&P 500® Index is an unmanaged index considered representative of the US stock market.
The Russell 1000® Index is an unmanaged index considered representative of large-cap stocks. The Russell 1000 Index is a trademark/service mark of the Frank Russell Co. Russell® is a trademark of the Frank Russell Co.
The Lipper VUF Large-Cap Core Funds Index is an unmanaged index considered representative of large-cap core variable insurance underlying funds tracked by Lipper.
The Fund is not managed to track the performance of any particular index, including the index(es) described here, and consequently, the performance of the Fund may deviate significantly from the performance of the index(es).
A direct investment cannot be made in an index. Unless otherwise indicated, index results include reinvested dividends, and they do not reflect sales charges. Performance of the peer group, if applicable, reflects fund expenses; performance of a market index does not.
Other information
The returns shown in management’s discussion of Fund performance are based on net asset values calculated for shareholder transactions. Generally accepted accounting principles require adjustments to be made to the net assets of the Fund at period end for financial reporting purposes, and as such, the net asset values for shareholder transactions and the returns based on those net asset values may differ from the net asset values and returns reported in the Financial Highlights. Additionally, the returns and net asset values shown throughout this report are at the Fund level only and do not include variable product issuer charges. If such charges were included, the total returns would be lower.
Industry classifications used in this report are generally according to the Global Industry Classification Standard, which was developed by and is the exclusive property and a service mark of MSCI Inc. and Standard & Poor’s.
Invesco V.I. Core Equity Fund
Schedule of Investments(a)
December 31, 2015
| | | | | | | | |
| | | Shares | | | Value | |
Common Stocks & Other Equity Interests–94.96% | |
| Advertising–1.38% | |
Publicis Groupe S.A. (France) | | | 229,525 | | | $ | 15,223,115 | |
|
| Aerospace & Defense–1.04% | |
United Technologies Corp. | | | 118,493 | | | | 11,383,623 | |
|
| Air Freight & Logistics–1.20% | |
United Parcel Service, Inc.–Class B | | | 137,496 | | | | 13,231,240 | |
|
| Apparel, Accessories & Luxury Goods–1.80% | |
LVMH Moet Hennessy Louis Vuitton S.E. (France) | | | 63,202 | | | | 9,880,159 | |
PVH Corp. | | | 135,102 | | | | 9,950,262 | |
| | | | | | | | 19,830,421 | |
|
| Asset Management & Custody Banks–1.73% | |
Northern Trust Corp. | | | 264,316 | | | | 19,054,540 | |
|
| Auto Parts & Equipment–1.06% | |
Johnson Controls, Inc. | | | 293,862 | | | | 11,604,610 | |
|
| Biotechnology–4.31% | |
AbbVie Inc. | | | 427,454 | | | | 25,322,375 | |
Celgene Corp.(b) | | | 184,672 | | | | 22,116,319 | |
| | | | | | | | 47,438,694 | |
|
| Brewers–1.44% | |
Molson Coors Brewing Co.–Class B | | | 168,718 | | | | 15,845,995 | |
|
| Cable & Satellite–2.08% | |
Comcast Corp.–Class A | | | 405,950 | | | | 22,907,759 | |
|
| Communications Equipment–4.46% | |
Cisco Systems, Inc. | | | 532,218 | | | | 14,452,380 | |
F5 Networks, Inc.(b) | | | 121,056 | | | | 11,737,590 | |
QUALCOMM, Inc. | | | 456,440 | | | | 22,815,153 | |
| | | | | | | | 49,005,123 | |
|
| Consumer Finance–2.64% | |
American Express Co. | | | 416,866 | | | | 28,993,030 | |
|
| Department Stores–0.79% | |
Macy’s, Inc. | | | 246,934 | | | | 8,637,751 | |
|
| Distillers & Vintners–1.28% | |
Diageo PLC (United Kingdom) | | | 517,521 | | | | 14,112,572 | |
|
| Diversified Banks–2.95% | |
Svenska Handelsbanken AB–Class A (Sweden) | | | 988,524 | | | | 13,045,383 | |
U.S. Bancorp | | | 454,011 | | | | 19,372,649 | |
| | | | | | | | 32,418,032 | |
|
| Electric Utilities–1.27% | |
Duke Energy Corp. | | | 195,444 | | | | 13,952,747 | |
| | | | | | | | |
| | | Shares | | | Value | |
| Electrical Components & Equipment–1.41% | |
Eaton Corp. PLC(b) | | | 296,855 | | | $ | 15,448,334 | |
|
| Electronic Manufacturing Services–2.03% | |
TE Connectivity Ltd. (Switzerland) | | | 345,720 | | | | 22,336,969 | |
|
| Health Care Facilities–1.30% | |
HCA Holdings, Inc.(b) | | | 212,080 | | | | 14,342,970 | |
|
| Health Care Services–1.84% | |
Express Scripts Holding Co.(b) | | | 231,277 | | | | 20,215,923 | |
|
| Home Improvement Retail–1.28% | |
Home Depot, Inc. (The) | | | 106,236 | | | | 14,049,711 | |
|
| Household Appliances–0.73% | |
Whirlpool Corp. | | | 54,617 | | | | 8,021,599 | |
|
| Household Products–1.46% | |
Procter & Gamble Co. (The) | | | 201,606 | | | | 16,009,533 | |
|
| Hypermarkets & Super Centers–1.38% | |
Wal-Mart Stores, Inc. | | | 246,821 | | | | 15,130,127 | |
|
| Industrial Conglomerates–1.31% | |
General Electric Co. | | | 463,701 | | | | 14,444,286 | |
|
| Industrial Machinery–2.67% | |
Illinois Tool Works Inc. | | | 115,769 | | | | 10,729,471 | |
Stanley Black & Decker Inc. | | | 174,115 | | | | 18,583,294 | |
| | | | | | | | 29,312,765 | |
|
| Insurance Brokers–2.49% | |
Marsh & McLennan Cos., Inc. | | | 493,879 | | | | 27,385,591 | |
|
| Integrated Oil & Gas–1.35% | |
Exxon Mobil Corp. | | | 190,999 | | | | 14,888,372 | |
|
| Internet Software & Services–1.02% | |
Alphabet Inc.–Class C(b) | | | 14,728 | | | | 11,176,785 | |
|
| Investment Banking & Brokerage–1.28% | |
Charles Schwab Corp. (The) | | | 426,481 | | | | 14,044,019 | |
|
| IT Consulting & Other Services–3.14% | |
Cognizant Technology Solutions Corp.–Class A(b) | | | 219,038 | | | | 13,146,661 | |
International Business Machines Corp. | | | 155,082 | | | | 21,342,385 | |
| | | | | | | | 34,489,046 | |
|
| Life & Health Insurance–1.48% | |
AIA Group Ltd. (Hong Kong) | | | 2,725,400 | | | | 16,236,624 | |
|
| Life Sciences Tools & Services–1.59% | |
Thermo Fisher Scientific, Inc. | | | 122,914 | | | | 17,435,351 | |
|
| Movies & Entertainment–1.36% | |
Twenty-First Century Fox, Inc.–Class A | | | 552,031 | | | | 14,993,162 | |
See accompanying Notes to Financial Statements which are an integral part of the financial statements.
Invesco V.I. Core Equity Fund
| | | | | | | | |
| | | Shares | | | Value | |
| Multi-Sector Holdings–2.23% | |
Berkshire Hathaway Inc.–Class A(b) | | | 124 | | | $ | 24,527,200 | |
|
| Multi-Utilities–1.62% | |
WEC Energy Group, Inc. | | | 348,185 | | | | 17,865,372 | |
|
| Oil & Gas Equipment & Services–0.98% | |
Halliburton Co. | | | 318,040 | | | | 10,826,082 | |
|
| Oil & Gas Exploration & Production–3.33% | |
Cabot Oil & Gas Corp. | | | 647,222 | | | | 11,449,357 | |
Concho Resources Inc.(b) | | | 129,658 | | | | 12,040,042 | |
EOG Resources, Inc. | | | 185,701 | | | | 13,145,774 | |
| | | | | | | | 36,635,173 | |
|
| Packaged Foods & Meats–2.24% | |
Danone (France) | | | 202,978 | | | | 13,698,455 | |
Mead Johnson Nutrition Co. | | | 138,980 | | | | 10,972,471 | |
| | | | | | | | 24,670,926 | |
|
| Pharmaceuticals–9.44% | |
Allergan PLC(b) | | | 67,254 | | | | 21,016,875 | |
Eli Lilly and Co. | | | 160,128 | | | | 13,492,385 | |
Merck & Co., Inc. | | | 328,981 | | | | 17,376,777 | |
Roche Holding AG (Switzerland) | | | 54,637 | | | | 15,056,557 | |
Shire PLC–ADR (Ireland) | | | 79,057 | | | | 16,206,685 | |
Teva Pharmaceutical Industries Ltd.–ADR (Israel) | | | 313,924 | | | | 20,605,971 | |
| | | | | | | | 103,755,250 | |
|
| Property & Casualty Insurance–2.84% | |
Progressive Corp. (The) | | | 983,459 | | | | 31,273,996 | |
|
| Semiconductor Equipment–1.30% | |
Applied Materials, Inc. | | | 766,873 | | | | 14,317,519 | |
| | | | | | | | |
| | | Shares | | | Value | |
| Semiconductors–5.38% | |
Analog Devices, Inc. | | | 462,704 | | | $ | 25,596,785 | |
Taiwan Semiconductor Manufacturing Co. Ltd. (Taiwan) | | | 7,792,823 | | | | 33,611,277 | |
| | | | | | | | 59,208,062 | |
|
| Soft Drinks–1.04% | |
Coca-Cola Co. (The) | | | 266,379 | | | | 11,443,642 | |
|
| Systems Software–2.74% | |
Microsoft Corp. | | | 343,026 | | | | 19,031,082 | |
Oracle Corp. | | | 303,203 | | | | 11,076,006 | |
| | | | | | | | 30,107,088 | |
|
| Technology Hardware, Storage & Peripherals–1.83% | |
EMC Corp. | | | 782,840 | | | | 20,103,331 | |
|
| Wireless Telecommunication Services–1.44% | |
Vodafone Group PLC–ADR (United Kingdom) | | | 491,761 | | | | 15,864,210 | |
Total Common Stocks & Other Equity Interests
(Cost $855,168,492) | | | | 1,044,198,270 | |
|
Money Market Funds–4.99% | |
Liquid Assets Portfolio–Institutional Class, 0.29%(c) | | | 27,424,258 | | | | 27,424,258 | |
Premier Portfolio–Institutional Class, 0.24%(c) | | | 27,424,259 | | | | 27,424,259 | |
Total Money Market Funds
(Cost $54,848,517) | | | | 54,848,517 | |
TOTAL INVESTMENTS–99.95%
(Cost $910,017,009) | | | | 1,099,046,787 | |
OTHER ASSETS LESS LIABILITIES–0.05% | | | | 595,466 | |
NET ASSETS–100.00% | | | $ | 1,099,642,253 | |
Investment Abbreviations:
| | |
| ADR | | – American Depositary Receipt |
Notes to Schedule of Investments:
| (a) | Industry and/or sector classifications used in this report are generally according to the Global Industry Classification Standard, which was developed by and is the exclusive property and a service mark of MSCI Inc. and Standard & Poor’s. |
| (b) | Non-income producing security. |
| (c) | The money market fund and the Fund are affiliated by having the same investment adviser. The rate shown is the 7-day SEC standardized yield as of December 31, 2015. |
See accompanying Notes to Financial Statements which are an integral part of the financial statements.
Invesco V.I. Core Equity Fund
Statement of Assets and Liabilities
December 31, 2015
Statement of Operations
For the year ended December 31, 2015
| | | | |
Assets: | |
Investments, at value (Cost $855,168,492) | | $ | 1,044,198,270 | |
Investments in affiliated money market funds, at value and cost | | | 54,848,517 | |
Total investments, at value (Cost $910,017,009) | | | 1,099,046,787 | |
Foreign currencies, at value (Cost $667,048) | | | 664,572 | |
Receivable for: | | | | |
Fund shares sold | | | 99,234 | |
Dividends | | | 1,533,713 | |
Investment for trustee deferred compensation and retirement plans | | | 399,927 | |
Other assets | | | 191 | |
Total assets | | | 1,101,744,424 | |
| |
Liabilities: | | | | |
Payable for: | | | | |
Fund shares reacquired | | | 801,735 | |
Accrued fees to affiliates | | | 797,487 | |
Accrued trustees’ and officers’ fees and benefits | | | 224 | |
Accrued other operating expenses | | | 42,849 | |
Trustee deferred compensation and retirement plans | | | 459,876 | |
Total liabilities | | | 2,102,171 | |
Net assets applicable to shares outstanding | | $ | 1,099,642,253 | |
| |
Net assets consist of: | | | | |
Shares of beneficial interest | | $ | 824,620,744 | |
Undistributed net investment income | | | 8,131,523 | |
Undistributed net realized gain | | | 77,882,290 | |
Net unrealized appreciation | | | 189,007,696 | |
| | | $ | 1,099,642,253 | |
|
Net Assets: | |
Series I | | $ | 921,516,086 | |
Series II | | $ | 178,126,167 | |
|
Shares outstanding, $0.001 par value per share,
with an unlimited number of shares authorized: | |
Series I | | | 27,235,091 | |
Series II | | | 5,333,466 | |
Series I: | | | | |
Net asset value per share | | $ | 33.84 | |
Series II: | | | | |
Net asset value per share | | $ | 33.40 | |
| | | | |
Investment income: | |
Dividends (net of foreign withholding taxes of $737,518) | | $ | 20,391,366 | |
Dividends from affiliated money market funds | | | 81,784 | |
Total investment income | | | 20,473,150 | |
| |
Expenses: | | | | |
Advisory fees | | | 7,364,189 | |
Administrative services fees | | | 3,165,379 | |
Custodian fees | | | 115,553 | |
Distribution fees — Series II | | | 469,931 | |
Transfer agent fees | | | 71,365 | |
Trustees’ and officers’ fees and benefits | | | 53,842 | |
Other | | | 79,611 | |
Total expenses | | | 11,319,870 | |
Less: Fees waived | | | (159,262 | ) |
Net expenses | | | 11,160,608 | |
Net investment income | | | 9,312,542 | |
| |
Realized and unrealized gain (loss) from: | | | | |
Net realized gain (loss) from: | | | | |
Investment securities (includes net gains from securities sold to affiliates of $613,257) | | | 81,866,996 | |
Foreign currencies | | | (314,970 | ) |
| | | | 81,552,026 | |
Change in net unrealized appreciation (depreciation) of: | | | | |
Investment securities | | | (159,391,379 | ) |
Foreign currencies | | | 184,140 | |
| | | | (159,207,239 | ) |
Net realized and unrealized gain (loss) | | | (77,655,213 | ) |
Net increase (decrease) in net assets resulting from operations | | $ | (68,342,671 | ) |
See accompanying Notes to Financial Statements which are an integral part of the financial statements.
Invesco V.I. Core Equity Fund
Statement of Changes in Net Assets
For the years ended December 31, 2015 and 2014
| | | | | | | | |
| | | 2015 | | | 2014 | |
Operations: | | | | | |
Net investment income | | $ | 9,312,542 | | | $ | 12,706,538 | |
Net realized gain | | | 81,552,026 | | | | 122,820,866 | |
Change in net unrealized appreciation (depreciation) | | | (159,207,239 | ) | | | (33,694,337 | ) |
Net increase (decrease) in net assets resulting from operations | | | (68,342,671 | ) | | | 101,833,067 | |
| |
Distributions to shareholders from net investment income: | | | | | |
Series I | | | (11,263,836 | ) | | | (9,589,714 | ) |
Series ll | | | (1,739,714 | ) | | | (1,212,906 | ) |
Total distributions from net investment income | | | (13,003,550 | ) | | | (10,802,620 | ) |
| |
Distributions to shareholders from net realized gains: | | | | | |
Series l | | | (103,008,374 | ) | | | (5,354,120 | ) |
Series ll | | | (19,872,167 | ) | | | (863,267 | ) |
Total distributions from net realized gains | | | (122,880,541 | ) | | | (6,217,387 | ) |
| |
Share transactions-net: | | | | | |
Series l | | | (3,612,941 | ) | | | (144,895,006 | ) |
Series ll | | | 25,857,596 | | | | 15,983,835 | |
Net increase (decrease) in net assets resulting from share transactions | | | 22,244,655 | | | | (128,911,171 | ) |
Net increase (decrease) in net assets | | | (181,982,107 | ) | | | (44,098,111 | ) |
| | |
Net assets: | | | | | | | | |
Beginning of year | | | 1,281,624,360 | | | | 1,325,722,471 | |
End of year (includes undistributed net investment income of $8,131,523 and $12,093,366, respectively) | | $ | 1,099,642,253 | | | $ | 1,281,624,360 | |
Notes to Financial Statements
December 31, 2015
NOTE 1—Significant Accounting Policies
Invesco V.I. Core Equity Fund (the “Fund”) is a series portfolio of AIM Variable Insurance Funds (Invesco Variable Insurance Funds) (the “Trust”). The Trust is a Delaware statutory trust registered under the Investment Company Act of 1940, as amended (the “1940 Act”), as an open-end series management investment company consisting of twenty-four separate portfolios, (each constituting a “Fund”). The assets, liabilities and operations of each portfolio are accounted for separately. Information presented in these financial statements pertains only to the Fund. Matters affecting each Fund or class will be voted on exclusively by the shareholders of such Fund or class. Current Securities and Exchange Commission (“SEC”) guidance, however, requires participating insurance companies offering separate accounts to vote shares proportionally in accordance with the instructions of the contract owners whose investments are funded by shares of each Fund or class.
The Fund’s investment objective is long-term growth of capital.
The Fund currently offers two classes of shares, Series I and Series II, both of which are offered to insurance company separate accounts funding variable annuity contracts and variable life insurance policies (“variable products”).
The following is a summary of the significant accounting policies followed by the Fund in the preparation of its financial statements.
| A. | Security Valuations — Securities, including restricted securities, are valued according to the following policy. |
A security listed or traded on an exchange (except convertible securities) is valued at its last sales price or official closing price as of the close of the customary trading session on the exchange where the security is principally traded, or lacking any sales or official closing price on a particular day, the security may be valued at the closing bid price on that day. Securities traded in the over-the-counter market are valued based on prices furnished by independent pricing services or market makers. When such securities are valued by an independent pricing service they may be considered fair valued. Futures contracts are valued at the final settlement price set by an exchange on which they are principally traded. Listed options are valued at the mean between the last bid and asked prices from the exchange on which they are principally traded. Options not listed on an exchange are valued by an independent source at the mean between the last bid and asked prices. For purposes of determining net asset value (“NAV”) per share, futures and option contracts generally are valued 15 minutes after the close of the customary trading session of the New York Stock Exchange (“NYSE”).
Investments in open-end and closed-end registered investment companies that do not trade on an exchange are valued at the end-of-day net asset value per share. Investments in open-end and closed-end registered investment companies that trade on an exchange are valued at the last sales price or official closing price as of the close of the customary trading session on the exchange where the security is principally traded.
Debt obligations (including convertible securities) and unlisted equities are fair valued using an evaluated quote provided by an independent pricing service. Evaluated quotes provided by the pricing service may be determined without exclusive reliance on quoted prices, and may reflect
Invesco V.I. Core Equity Fund
appropriate factors such as institution-size trading in similar groups of securities, developments related to specific securities, dividend rate (for unlisted equities), yield (for debt obligations), quality, type of issue, coupon rate (for debt obligations), maturity (for debt obligations), individual trading characteristics and other market data. Debt obligations are subject to interest rate and credit risks. In addition, all debt obligations involve some risk of default with respect to interest and/or principal payments.
Foreign securities’ (including foreign exchange contracts) prices are converted into U.S. dollar amounts using the applicable exchange rates as of the close of the NYSE. If market quotations are available and reliable for foreign exchange-traded equity securities, the securities will be valued at the market quotations. Because trading hours for certain foreign securities end before the close of the NYSE, closing market quotations may become unreliable. If between the time trading ends on a particular security and the close of the customary trading session on the NYSE, events occur that the Adviser determines are significant and make the closing price unreliable, the Fund may fair value the security. If the event is likely to have affected the closing price of the security, the security will be valued at fair value in good faith using procedures approved by the Board of Trustees. Adjustments to closing prices to reflect fair value may also be based on a screening process of an independent pricing service to indicate the degree of certainty, based on historical data, that the closing price in the principal market where a foreign security trades is not the current value as of the close of the NYSE. Foreign securities’ prices meeting the approved degree of certainty that the price is not reflective of current value will be priced at the indication of fair value from the independent pricing service. Multiple factors may be considered by the independent pricing service in determining adjustments to reflect fair value and may include information relating to sector indices, American Depositary Receipts and domestic and foreign index futures. Foreign securities may have additional risks including exchange rate changes, potential for sharply devalued currencies and high inflation, political and economic upheaval, the relative lack of issuer information, relatively low market liquidity and the potential lack of strict financial and accounting controls and standards.
Securities for which market prices are not provided by any of the above methods may be valued based upon quotes furnished by independent sources. The last bid price may be used to value equity securities. The mean between the last bid and asked prices is used to value debt obligations, including corporate loans.
Securities for which market quotations are not readily available or became unreliable are valued at fair value as determined in good faith by or under the supervision of the Trust’s officers following procedures approved by the Board of Trustees. Issuer specific events, market trends, bid/asked quotes of brokers and information providers and other market data may be reviewed in the course of making a good faith determination of a security’s fair value.
The Fund may invest in securities that are subject to interest rate risk, meaning the risk that the prices will generally fall as interest rates rise and, conversely, the prices will generally rise as interest rates fall. Specific securities differ in their sensitivity to changes in interest rates depending on their individual characteristics. Changes in interest rates may result in increased market volatility, which may affect the value and/or liquidity of certain Fund investments.
Valuations change in response to many factors including the historical and prospective earnings of the issuer, the value of the issuer’s assets, general economic conditions, interest rates, investor perceptions and market liquidity. Because of the inherent uncertainties of valuation, the values reflected in the financial statements may materially differ from the value received upon actual sale of those investments.
| B. | Securities Transactions and Investment Income — Securities transactions are accounted for on a trade date basis. Realized gains or losses on sales are computed on the basis of specific identification of the securities sold. Interest income (net of withholding tax, if any) is recorded on the accrual basis from settlement date. Dividend income (net of withholding tax, if any) is recorded on the ex-dividend date. |
The Fund may periodically participate in litigation related to Fund investments. As such, the Fund may receive proceeds from litigation settlements. Any proceeds received are included in the Statement of Operations as realized gain (loss) for investments no longer held and as unrealized gain (loss) for investments still held.
Brokerage commissions and mark ups are considered transaction costs and are recorded as an increase to the cost basis of securities purchased and/or a reduction of proceeds on a sale of securities. Such transaction costs are included in the determination of net realized and unrealized gain (loss) from investment securities reported in the Statement of Operations and the Statement of Changes in Net Assets and the net realized and unrealized gains (losses) on securities per share in the Financial Highlights. Transaction costs are included in the calculation of the Fund’s net asset value and, accordingly, they reduce the Fund’s total returns. These transaction costs are not considered operating expenses and are not reflected in net investment income reported in the Statement of Operations and the Statement of Changes in Net Assets, or the net investment income per share and the ratios of expenses and net investment income reported in the Financial Highlights, nor are they limited by any expense limitation arrangements between the Fund and the investment adviser.
The Fund allocates income and realized and unrealized capital gains and losses to a class based on the relative net assets of each class.
| C. | Country Determination — For the purposes of making investment selection decisions and presentation in the Schedule of Investments, the investment adviser may determine the country in which an issuer is located and/or credit risk exposure based on various factors. These factors include the laws of the country under which the issuer is organized, where the issuer maintains a principal office, the country in which the issuer derives 50% or more of its total revenues and the country that has the primary market for the issuer’s securities, as well as other criteria. Among the other criteria that may be evaluated for making this determination are the country in which the issuer maintains 50% or more of its assets, the type of security, financial guarantees and enhancements, the nature of the collateral and the sponsor organization. Country of issuer and/or credit risk exposure has been determined to be the United States of America, unless otherwise noted. |
| D. | Distributions — Distributions from net investment income and net realized capital gain, if any, are generally declared and paid to separate accounts of participating insurance companies annually and recorded on the ex-dividend date. |
| E. | Federal Income Taxes — The Fund intends to comply with the requirements of Subchapter M of the Internal Revenue Code of 1986, as amended (the “Internal Revenue Code”), necessary to qualify as a regulated investment company and to distribute substantially all of the Fund’s taxable earnings to shareholders. As such, the Fund will not be subject to federal income taxes on otherwise taxable income (including net realized capital gain) that is distributed to shareholders. Therefore, no provision for federal income taxes is recorded in the financial statements. |
The Fund recognizes the tax benefits of uncertain tax positions only when the position is more likely than not to be sustained. Management has analyzed the Fund’s uncertain tax positions and concluded that no liability for unrecognized tax benefits should be recorded related to uncertain tax positions. Management is not aware of any tax positions for which it is reasonably possible that the total amounts of unrecognized tax benefits will change materially in the next 12 months.
Invesco V.I. Core Equity Fund
The Fund files tax returns in the U.S. Federal jurisdiction and certain other jurisdictions. Generally, the Fund is subject to examinations by such taxing authorities for up to three years after the filing of the return for the tax period.
| F. | Expenses — Fees provided for under the Rule 12b-1 plan of a particular class of the Fund and which are directly attributable to that class are charged to the operations of such class. All other expenses are allocated among the classes based on relative net assets. |
| G. | Accounting Estimates — The preparation of financial statements in conformity with accounting principles generally accepted in the United States of America (“GAAP”) requires management to make estimates and assumptions that affect the reported amounts of assets and liabilities at the date of the financial statements and the reported amounts of revenues and expenses during the reporting period including estimates and assumptions related to taxation. Actual results could differ from those estimates by a significant amount. In addition, the Fund monitors for material events or transactions that may occur or become known after the period-end date and before the date the financial statements are released to print. |
| H. | Indemnifications — Under the Trust’s organizational documents, each Trustee, officer, employee or other agent of the Trust is indemnified against certain liabilities that may arise out of the performance of their duties to the Fund. Additionally, in the normal course of business, the Fund enters into contracts, including the Fund’s servicing agreements, that contain a variety of indemnification clauses. The Fund’s maximum exposure under these arrangements is unknown as this would involve future claims that may be made against the Fund that have not yet occurred. The risk of material loss as a result of such indemnification claims is considered remote. |
| I. | Foreign Currency Translations — Foreign currency is valued at the close of the NYSE based on quotations posted by banks and major currency dealers. Portfolio securities and other assets and liabilities denominated in foreign currencies are translated into U.S. dollar amounts at date of valuation. Purchases and sales of portfolio securities (net of foreign taxes withheld on disposition) and income items denominated in foreign currencies are translated into U.S. dollar amounts on the respective dates of such transactions. The Fund does not separately account for the portion of the results of operations resulting from changes in foreign exchange rates on investments and the fluctuations arising from changes in market prices of securities held. The combined results of changes in foreign exchange rates and the fluctuation of market prices on investments (net of estimated foreign tax withholding) are included with the net realized and unrealized gain or loss from investments in the Statement of Operations. Reported net realized foreign currency gains or losses arise from (1) sales of foreign currencies, (2) currency gains or losses realized between the trade and settlement dates on securities transactions, and (3) the difference between the amounts of dividends, interest, and foreign withholding taxes recorded on the Fund’s books and the U.S. dollar equivalent of the amounts actually received or paid. Net unrealized foreign currency gains and losses arise from changes in the fair values of assets and liabilities, other than investments in securities at fiscal period end, resulting from changes in exchange rates. |
The Fund may invest in foreign securities, which may be subject to foreign taxes on income, gains on investments or currency repatriation, a portion of which may be recoverable. Foreign taxes, if any, are recorded based on the tax regulations and rates that exist in the foreign markets in which the Fund invests and are shown in the Statement of Operations.
| J. | Forward Foreign Currency Contracts — The Fund may engage in foreign currency transactions either on a spot (i.e. for prompt delivery and settlement) basis, or through forward foreign currency contracts, to manage or minimize currency or exchange rate risk. |
The Fund may also enter into forward foreign currency contracts for the purchase or sale of a security denominated in a foreign currency in order to “lock in” the U.S. dollar price of that security, or the Fund may also enter into forward foreign currency contracts that do not provide for physical settlement of the two currencies, but instead are settled by a single cash payment calculated as the difference between the agreed upon exchange rate and the spot rate at settlement based upon an agreed upon notional amount (non-deliverable forwards). The Fund will set aside liquid assets in an amount equal to daily mark-to-market obligation for forward foreign currency contracts.
A forward foreign currency contract is an obligation between two parties (“Counterparties”) to purchase or sell a specific currency for an agreed-upon price at a future date. The use of forward foreign currency contracts does not eliminate fluctuations in the price of the underlying securities the Fund owns or intends to acquire but establishes a rate of exchange in advance. Fluctuations in the value of these contracts are measured by the difference in the contract date and reporting date exchange rates and are recorded as unrealized appreciation (depreciation) until the contracts are closed. When the contracts are closed, realized gains (losses) are recorded. Realized and unrealized gains (losses) on the contracts are included in the Statement of Operations. The primary risks associated with forward foreign currency contracts include failure of the Counterparty to meet the terms of the contract and the value of the foreign currency changing unfavorably. These risks may be in excess of the amounts reflected in the Statement of Assets and Liabilities.
NOTE 2—Advisory Fees and Other Fees Paid to Affiliates
The Trust has entered into a master investment advisory agreement with Invesco Advisers, Inc. (the “Adviser” or “Invesco”). Under the terms of the investment advisory agreement, the Fund pays an advisory fee to the Adviser based on the annual rate of the Fund’s average daily net assets as follows:
| | | | |
| Average Daily Net Assets | | Rate | |
First $250 million | | | 0.65% | |
Over $250 million | | | 0.60% | |
For the year ended December 31, 2015, the effective advisory fees incurred by the Fund was 0.61%.
Under the terms of a master sub-advisory agreement between the Adviser and each of Invesco Asset Management Deutschland GmbH, Invesco Asset Management Limited, Invesco Asset Management (Japan) Limited, Invesco Hong Kong Limited, Invesco Senior Secured Management, Inc. and Invesco Canada Ltd. (collectively, the “Affiliated Sub-Advisers”) the Adviser, not the Fund, may pay 40% of the fees paid to the Adviser to any such Affiliated Sub-Adviser(s) that provide(s) discretionary investment management services to the Fund based on the percentage of assets allocated to such Affiliated Sub-Adviser(s).
The Adviser has contractually agreed, through at least June 30, 2016, to waive advisory fees and/or reimburse expenses of all shares to the extent necessary to limit total annual fund operating expenses after fee waiver and/or expense reimbursement (excluding certain items discussed below) of Series I shares to 2.00% and Series II shares to 2.25% of average daily net assets. In determining the Adviser’s obligation to waive
Invesco V.I. Core Equity Fund
advisory fees and/or reimburse expenses, the following expenses are not taken into account, and could cause the total annual fund operating expenses after fee waiver and/or expense reimbursement to exceed the numbers reflected above: (1) interest; (2) taxes; (3) dividend expense on short sales; (4) extraordinary or non-routine items, including litigation expenses; and (5) expenses that the Fund has incurred but did not actually pay because of an expense offset arrangement. Unless Invesco continues the fee waiver agreement, it will terminate on June 30, 2016. The fee waiver agreement cannot be terminated during its term. The Adviser did not waive fees and/or reimburse expenses during the period under this expense limitation.
Further, the Adviser has contractually agreed, through at least June 30, 2017, to waive the advisory fee payable by the Fund in an amount equal to 100% of the net advisory fees the Adviser receives from the affiliated money market funds on investments by the Fund of uninvested cash in such affiliated money market funds.
For the year ended December 31, 2015, the Adviser waived advisory fees of $159,262.
The Trust has entered into a master administrative services agreement with Invesco pursuant to which the Fund has agreed to pay Invesco a fee for costs incurred in providing accounting services and fund administrative services to the Fund and to reimburse Invesco for administrative services fees paid to insurance companies that have agreed to provide services to the participants of separate accounts. These administrative services provided by the insurance companies may include, among other things: the printing of prospectuses, financial reports and proxy statements and the delivery of the same to existing participants; the maintenance of master accounts; the facilitation of purchases and redemptions requested by the participants; and the servicing of participants’ accounts. Pursuant to such agreement, for the year ended December 31, 2015, Invesco was paid $282,502 for accounting and fund administrative services and reimbursed $2,882,877 for services provided by insurance companies.
The Trust has entered into a transfer agency and service agreement with Invesco Investment Services, Inc. (“IIS”) pursuant to which the Fund has agreed to pay IIS a fee for providing transfer agency and shareholder services to the Fund and reimburse IIS for certain expenses incurred by IIS in the course of providing such services. For the year ended December 31, 2015, expenses incurred under the agreement are shown in the Statement of Operations as Transfer agent fees.
The Trust has entered into a master distribution agreement with Invesco Distributors, Inc. (“IDI”) to serve as the distributor for the Fund. The Trust has adopted a plan pursuant to Rule 12b-1 under the 1940 Act with respect to the Fund’s Series II shares (the “Plan”). The Fund, pursuant to the Plan, pays IDI compensation at the annual rate of 0.25% of the Fund’s average daily net assets of Series II shares. Of the Plan payments, up to 0.25% of the average daily net assets of the Series II shares may be paid to insurance companies who furnish continuing personal shareholder services to customers who purchase and own Series II shares of the Fund. For the year ended December 31, 2015, expenses incurred under the Plan are detailed in the Statement of Operations as Distribution fees.
For the year ended December 31, 2015, the Fund incurred $1,277 in brokerage commissions with Invesco Capital Markets, Inc., an affiliate of the Adviser and IDI, for portfolio transactions executed on behalf of the Fund.
Certain officers and trustees of the Trust are officers and directors of the Adviser, IIS and/or IDI.
NOTE 3—Additional Valuation Information
GAAP defines fair value as the price that would be received to sell an asset or paid to transfer a liability in an orderly transaction between market participants at the measurement date, under current market conditions. GAAP establishes a hierarchy that prioritizes the inputs to valuation methods, giving the highest priority to readily available unadjusted quoted prices in an active market for identical assets (Level 1) and the lowest priority to significant unobservable inputs (Level 3), generally when market prices are not readily available or are unreliable. Based on the valuation inputs, the securities or other investments are tiered into one of three levels. Changes in valuation methods may result in transfers in or out of an investment’s assigned level:
| | Level 1 — | Prices are determined using quoted prices in an active market for identical assets. |
| | Level 2 — | Prices are determined using other significant observable inputs. Observable inputs are inputs that other market participants may use in pricing a security. These may include quoted prices for similar securities, interest rates, prepayment speeds, credit risk, yield curves, loss severities, default rates, discount rates, volatilities and others. |
| | Level 3 — | Prices are determined using significant unobservable inputs. In situations where quoted prices or observable inputs are unavailable (for example, when there is little or no market activity for an investment at the end of the period), unobservable inputs may be used. Unobservable inputs reflect the Fund’s own assumptions about the factors market participants would use in determining fair value of the securities or instruments and would be based on the best available information. |
The following is a summary of the tiered valuation input levels, as of December 31, 2015. The level assigned to the securities valuations may not be an indication of the risk or liquidity associated with investing in those securities. Because of the inherent uncertainties of valuation, the values reflected in the financial statements may materially differ from the value received upon actual sale of those investments.
| | | | | | | | | | | | | | | | |
| | | Level 1 | | | Level 2 | | | Level 3 | | | Total | |
Equity Securities | | $ | 968,182,645 | | | $ | 130,864,142 | | | $ | — | | | $ | 1,099,046,787 | |
NOTE 4—Security Transactions with Affiliated Funds
The Fund is permitted to purchase or sell securities from or to certain other Invesco Funds under specified conditions outlined in procedures adopted by the Board of Trustees of the Trust. The procedures have been designed to ensure that any purchase or sale of securities by the Fund from or to another fund or portfolio that is or could be considered an affiliate by virtue of having a common investment adviser (or affiliated investment advisers), common Trustees and/or common officers complies with Rule 17a-7 of the 1940 Act. Further, as defined under the procedures, each transaction is effected at the current market price. Pursuant to these procedures, for the year ended December 31, 2015, the Fund engaged in securities purchases of $270,833 and securities sales of $906,764, which resulted in net realized gains of $613,257.
Invesco V.I. Core Equity Fund
NOTE 5—Trustees’ and Officers’ Fees and Benefits
Trustees’ and Officers’ Fees and Benefits include amounts accrued by the Fund to pay remuneration to certain Trustees and Officers of the Fund. Trustees have the option to defer compensation payable by the Fund, and Trustees’ and Officers’ Fees and Benefits also include amounts accrued by the Fund to fund such deferred compensation amounts. Those Trustees who defer compensation have the option to select various Invesco Funds in which their deferral accounts shall be deemed to be invested. Finally, certain current Trustees were eligible to participate in a retirement plan that provided for benefits to be paid upon retirement to Trustees over a period of time based on the number of years of service. The Fund may have certain former Trustees who also participate in a retirement plan and receive benefits under such plan. Trustees’ and Officers’ Fees and Benefits include amounts accrued by the Fund to fund such retirement benefits. Obligations under the deferred compensation and retirement plans represent unsecured claims against the general assets of the Fund.
NOTE 6—Cash Balances
The Fund is permitted to temporarily carry a negative or overdrawn balance in its account with State Street Bank and Trust Company, the custodian bank. Such balances, if any at period end, are shown in the Statement of Assets and Liabilities under the payable caption Amount due custodian. To compensate the custodian bank for such overdrafts, the overdrawn Fund may either (1) leave funds as a compensating balance in the account so the custodian bank can be compensated by earning the additional interest; or (2) compensate by paying the custodian bank at a rate agreed upon by the custodian bank and Invesco, not to exceed the contractually agreed upon rate.
NOTE 7—Distributions to Shareholders and Tax Components of Net Assets
Tax Character of Distributions to Shareholders Paid During the Fiscal Years Ended December 31, 2015 and 2014:
| | | | | | | | |
| | | 2015 | | | 2014 | |
Ordinary income | | $ | 18,551,080 | | | $ | 10,802,620 | |
Long-term capital gain | | | 117,333,011 | | | | 6,217,387 | |
Total distributions | | $ | 135,884,091 | | | $ | 17,020,007 | |
Tax Components of Net Assets at Period-End:
| | | | |
| | | 2015 | |
Undistributed ordinary income | | $ | 8,618,045 | |
Undistributed long-term gain | | | 81,220,782 | |
Net unrealized appreciation — investments | | | 185,691,286 | |
Net unrealized appreciation (depreciation) — other investments | | | (22,083 | ) |
Temporary book/tax differences | | | (486,521 | ) |
Shares of beneficial interest | | | 824,620,744 | |
Total net assets | | $ | 1,099,642,253 | |
The difference between book-basis and tax-basis unrealized appreciation (depreciation) is due to differences in the timing of recognition of gains and losses on investments for tax and book purposes. The Fund’s net unrealized appreciation difference is attributable primarily to wash sales.
The temporary book/tax differences are a result of timing differences between book and tax recognition of income and/or expenses. The Fund’s temporary book/tax differences are the result of the trustee deferral of compensation and retirement plan benefits.
Capital loss carryforward is calculated and reported as of a specific date. Results of transactions and other activity after that date may affect the amount of capital loss carryforward actually available for the Fund to utilize. Capital losses generated in years beginning after December 22, 2010 can be carried forward for an unlimited period, whereas previous losses expire in eight tax years. Capital losses with an expiration period may not be used to offset capital gains until all net capital losses without an expiration date have been utilized. Capital loss carryforwards with no expiration date will retain their character as either short-term or long-term capital losses instead of as short-term capital losses as under prior law. The ability to utilize capital loss carryforwards in the future may be limited under the Internal Revenue Code and related regulations based on the results of future transactions.
The Fund does not have a capital loss carryforward as of December 31, 2015.
NOTE 8—Investment Securities
The aggregate amount of investment securities (other than short-term securities, U.S. Treasury obligations and money market funds, if any) purchased and sold by the Fund during the year ended December 31, 2015 was $496,414,260 and $527,772,300, respectively. Cost of investments on a tax basis includes the adjustments for financial reporting purposes as of the most recently completed federal income tax reporting period-end.
| | | | |
| Unrealized Appreciation (Depreciation) of Investment Securities on a Tax Basis | |
Aggregate unrealized appreciation of investment securities | | $ | 230,677,835 | |
Aggregate unrealized (depreciation) of investment securities | | | (44,986,549 | ) |
Net unrealized appreciation of investment securities | | $ | 185,691,286 | |
Cost of investments for tax purposes is $913,355,501.
Invesco V.I. Core Equity Fund
NOTE 9—Reclassification of Permanent Differences
Primarily as a result of differing book/tax treatment of foreign currency transactions and fair fund settlements, on December 31, 2015, undistributed net investment income was decreased by $270,835 and undistributed net realized gain was increased by $270,835. This reclassification had no effect on the net assets of the Fund.
NOTE 10—Share Information
| | | | | | | | | | | | | | | | |
| | | Summary of Share Activity | |
| | | Years ended December 31, | |
| | | 2015(a) | | | 2014 | |
| | | Shares | | | Amount | | | Shares | | | Amount | |
Sold: | | | | | | | | | | | | | | | | |
Series I | | | 1,187,179 | | | $ | 45,584,411 | | | | 867,189 | | | $ | 35,223,181 | |
Series II | | | 510,959 | | | | 20,186,238 | | | | 844,518 | | | | 33,538,747 | |
| | | | |
Issued as reinvestment of dividends: | | | | | | | | | | | | | | | | |
Series I | | | 3,461,745 | | | | 114,272,210 | | | | 367,532 | | | | 14,921,814 | |
Series II | | | 662,941 | | | | 21,611,881 | | | | 51,685 | | | | 2,076,173 | |
| | | | |
Reacquired: | | | | | | | | | | | | | | | | |
Series I | | | (4,152,164 | ) | | | (163,469,562 | ) | | | (4,860,851 | ) | | | (195,040,001 | ) |
Series II | | | (414,744 | ) | | | (15,940,523 | ) | | | (495,254 | ) | | | (19,631,085 | ) |
Net increase (decrease) in share activity | | | 1,255,916 | | | $ | 22,244,655 | | | | (3,225,181 | ) | | $ | (128,911,171 | ) |
| (a) | There are entities that are record owners of more than 5% of the outstanding shares of the Fund and in the aggregate own 47% of the outstanding shares of the Fund. The Fund and the Fund’s principal underwriter or adviser, are parties to participation agreements with these entities whereby these entities sell units of interest in separate accounts funding variable products that are invested in the Fund. The Fund, Invesco and/or Invesco affiliates may make payments to these entities, which are considered to be related to the Fund, for providing services to the Fund, Invesco and/or Invesco affiliates including but not limited to services such as, securities brokerage, third party record keeping and account servicing and administrative services. The Fund has no knowledge as to whether all or any portion of the shares owned of record by these entities are also owned beneficially. |
NOTE 11—Financial Highlights
The following schedule presents financial highlights for a share of the Fund outstanding throughout the periods indicated.
| | | | | | | | | | | | | | | | | | | | | | | | | | | | | | | | | | | | | | | | | | | | | | | | | | | | | | | | |
| | | Net asset
value,
beginning
of period | | | Net
investment
income(a) | | | Net gains
(losses)
on securities
(both
realized and
unrealized) | | | Total from
investment
operations | | | Dividends
from net
investment
income | | | Distributions
from net
realized
gains | | | Total
distributions | | | Net asset
value, end
of period | | | Total
return(b) | | | Net assets,
end of period
(000’s omitted) | | | Ratio of
expenses
to average
net assets
with fee waivers
and/or expenses
absorbed | | | Ratio of
expenses
to average net
assets without
fee waivers
and/or expenses
absorbed | | | Ratio of net
investment
income to
average
net assets | | | Portfolio
turnover(c) | |
Series I | | | | | | | | | | | | | | | | | | | | | |
Year ended 12/31/15 | | $ | 41.00 | | | $ | 0.32 | | | $ | (2.79 | ) | | $ | (2.47 | ) | | $ | (0.46 | ) | | $ | (4.23 | ) | | $ | (4.69 | ) | | $ | 33.84 | | | | (5.75 | )% | | $ | 921,516 | | | | 0.89 | %(d) | | | 0.90 | %(d) | | | 0.81 | %(d) | | | 45 | % |
Year ended 12/31/14 | | | 38.43 | | | | 0.40 | | | | 2.72 | | | | 3.12 | | | | (0.35 | ) | | | (0.20 | ) | | | (0.55 | ) | | | 41.00 | | | | 8.12 | | | | 1,096,219 | | | | 0.88 | | | | 0.90 | | | | 1.01 | | | | 35 | |
Year ended 12/31/13 | | | 30.14 | | | | 0.31 | | | | 8.47 | | | | 8.78 | | | | (0.49 | ) | | | — | | | | (0.49 | ) | | | 38.43 | | | | 29.25 | | | | 1,167,023 | | | | 0.88 | | | | 0.90 | | | | 0.89 | | | | 25 | |
Year ended 12/31/12 | | | 26.72 | | | | 0.37 | | | | 3.34 | | | | 3.71 | | | | (0.29 | ) | | | — | | | | (0.29 | ) | | | 30.14 | | | | 13.88 | | | | 1,033,655 | | | | 0.88 | | | | 0.90 | | | | 1.29 | | | | 44 | |
Year ended 12/31/11 | | | 27.03 | | | | 0.24 | | | | (0.28 | ) | | | (0.04 | ) | | | (0.27 | ) | | | — | | | | (0.27 | ) | | | 26.72 | | | | (0.06 | ) | | | 1,091,171 | | | | 0.87 | | | | 0.89 | | | | 0.86 | | | | 35 | |
Series II | | | | | | | | | | | | | | | | | | | | | | | | | | | | | | | | | | | | | | | | | | | | | | | | | | | | | | | | |
Year ended 12/31/15 | | | 40.53 | | | | 0.22 | | | | (2.75 | ) | | | (2.53 | ) | | | (0.37 | ) | | | (4.23 | ) | | | (4.60 | ) | | | 33.40 | | | | (5.98 | ) | | | 178,126 | | | | 1.14 | (d) | | | 1.15 | (d) | | | 0.56 | (d) | | | 45 | |
Year ended 12/31/14 | | | 38.03 | | | | 0.30 | | | | 2.67 | | | | 2.97 | | | | (0.27 | ) | | | (0.20 | ) | | | (0.47 | ) | | | 40.53 | | | | 7.82 | | | | 185,406 | | | | 1.13 | | | | 1.15 | | | | 0.76 | | | | 35 | |
Year ended 12/31/13 | | | 29.86 | | | | 0.22 | | | | 8.39 | | | | 8.61 | | | | (0.44 | ) | | | — | | | | (0.44 | ) | | | 38.03 | | | | 28.94 | | | | 158,700 | | | | 1.13 | | | | 1.15 | | | | 0.64 | | | | 25 | |
Year ended 12/31/12 | | | 26.51 | | | | 0.30 | | | | 3.31 | | | | 3.61 | | | | (0.26 | ) | | | — | | | | (0.26 | ) | | | 29.86 | | | | 13.61 | | | | 109,213 | | | | 1.13 | | | | 1.15 | | | | 1.04 | | | | 44 | |
Year ended 12/31/11 | | | 26.82 | | | | 0.17 | | | | (0.27 | ) | | | (0.10 | ) | | | (0.21 | ) | | | — | | | | (0.21 | ) | | | 26.51 | | | | (0.29 | ) | | | 51,132 | | | | 1.12 | | | | 1.14 | | | | 0.61 | | | | 35 | |
| (a) | Calculated using average shares outstanding. |
| (b) | Includes adjustments in accordance with accounting principles generally accepted in the United States of America and as such, the net asset value for financial reporting purposes and the returns based upon those net asset values may differ from the net asset value and returns for shareholder transactions. Total returns are not annualized for periods less than one year, if applicable and do not reflect charges assessed in connection with a variable product, which if included would reduce total returns. |
| (c) | Portfolio turnover is calculated at the fund level and is not annualized for periods less than one year, if applicable. |
| (d) | Ratios are based on average daily net assets (000’s omitted) of $1,018,559 and $187,973 for Series I and Series II shares, respectively. |
Invesco V.I. Core Equity Fund
Report of Independent Registered Public Accounting Firm
To the Board of Trustees of AIM Variable Insurance Funds (Invesco Variable Insurance Funds)
and Shareholders of Invesco V.I. Core Equity Fund:
In our opinion, the accompanying statement of assets and liabilities, including the schedule of investments, and the related statements of operations and of changes in net assets and the financial highlights present fairly, in all material respects, the financial position of Invesco V.I. Core Equity Fund (one of the funds constituting AIM Variable Insurance Funds (Invesco Variable Insurance Funds), hereafter referred to as the “Fund”) at December 31, 2015, the results of its operations for the year then ended, the changes in its net assets for each of the two years in the period then ended and the financial highlights for each of the five years in the period then ended, in conformity with accounting principles generally accepted in the United States of America. These financial statements and financial highlights (hereafter referred to as “financial statements”) are the responsibility of the Fund’s management. Our responsibility is to express an opinion on these financial statements based on our audits. We conducted our audits of these financial statements in accordance with the standards of the Public Company Accounting Oversight Board (United States). Those standards require that we plan and perform the audit to obtain reasonable assurance about whether the financial statements are free of material misstatement. An audit includes examining, on a test basis, evidence supporting the amounts and disclosures in the financial statements, assessing the accounting principles used and significant estimates made by management, and evaluating the overall financial statement presentation. We believe that our audits, which included confirmation of securities at December 31, 2015 by correspondence with the custodian and brokers, provide a reasonable basis for our opinion.
PRICEWATERHOUSECOOPERS LLP
Houston, Texas
February 15, 2016
Invesco V.I. Core Equity Fund
Calculating your ongoing Fund expenses
Example
As a shareholder of the Fund, you incur ongoing costs, including management fees; distribution and/or service fees (12b-1); and other Fund expenses. This example is intended to help you understand your ongoing costs (in dollars) of investing in the Fund and to compare these costs with ongoing costs of investing in other mutual funds. The example is based on an investment of $1,000 invested at the beginning of the period and held for the entire period July 1, 2015 through December 31, 2015.
The actual and hypothetical expenses in the examples below do not represent the effect of any fees or other expenses assessed in connection with a variable product; if they did, the expenses shown would be higher while the ending account values shown would be lower.
Actual expenses
The table below provides information about actual account values and actual expenses. You may use the information in this table, together with the amount you invested, to estimate the expenses that you paid over the period. Simply divide your account value by $1,000 (for example, an $8,600 account value divided by $1,000 = 8.6), then multiply the result by the number in the table under the heading entitled “Actual Expenses Paid During Period” to estimate the expenses you paid on your account during this period.
Hypothetical example for comparison purposes
The table below also provides information about hypothetical account values and hypothetical expenses based on the Fund’s actual expense ratio and an assumed rate of return of 5% per year before expenses, which is not the Fund’s actual return.
The hypothetical account values and expenses may not be used to estimate the actual ending account balance or expenses you paid for the period. You may use this information to compare the ongoing costs of investing in the Fund and other funds. To do so, compare this 5% hypothetical example with the 5% hypothetical examples that appear in the shareholder reports of the other funds.
Please note that the expenses shown in the table are meant to highlight your ongoing costs. Therefore, the hypothetical information is useful in comparing ongoing costs, and will not help you determine the relative total costs of owning different funds.
| | | | | | | | | | | | | | | | | | | | | | | | |
| Class | | Beginning
Account Value
(07/01/15) | | | ACTUAL | | | HYPOTHETICAL (5% annual return before expenses) | | | Annualized
Expense
Ratio | |
| | | Ending
Account Value
(12/31/15)1 | | | Expenses
Paid During
Period2 | | | Ending
Account Value
(12/31/15) | | | Expenses
Paid During
Period2 | | |
Series I | | $ | 1,000.00 | | | $ | 940.20 | | | $ | 4.40 | | | $ | 1,020.67 | | | $ | 4.58 | | | | 0.90 | % |
Series II | | | 1,000.00 | | | | 939.10 | | | | 5.62 | | | | 1,019.41 | | | | 5.85 | | | | 1.15 | |
| 1 | The actual ending account value is based on the actual total return of the Fund for the period July 1, 2015 through December 31, 2015, after actual expenses and will differ from the hypothetical ending account value which is based on the Fund’s expense ratio and a hypothetical annual return of 5% before expenses. |
| 2 | Expenses are equal to the Fund’s annualized expense ratio as indicated above multiplied by the average account value over the period, multiplied by 184/365 to reflect the most recent fiscal half year. |
Invesco V.I. Core Equity Fund
Tax Information
Form 1099-DIV, Form 1042-S and other year–end tax information provide shareholders with actual calendar year amounts that should be included in their tax returns. Shareholders should consult their tax advisors.
The following distribution information is being provided as required by the Internal Revenue Code or to meet a specific state’s requirement.
The Fund designates the following amounts or, if subsequently determined to be different, the maximum amount allowable for its fiscal year ended December 31, 2015:
| | | | |
Federal and State Income Tax | |
Long-Term Capital Gain Distributions | | $ | 117,333,011 | |
Corporate Dividends Received Deduction* | | | 92.20 | % |
U.S. Treasury Obligations* | | | 0.00 | % |
| | * | The above percentages are based on ordinary income dividends paid to shareholders during the Fund’s fiscal year. |
Invesco V.I. Core Equity Fund
Trustees and Officers
The address of each trustee and officer is AIM Variable Insurance Funds (Invesco Variable Insurance Funds) (the “Trust”), 11 Greenway Plaza, Suite 1000, Houston, Texas 77046-1173. The trustees serve for the life of the Trust, subject to their earlier death, incapacitation, resignation, retirement or removal as more specifically provided in the Trust’s organizational documents. Each officer serves for a one year term or until their successors are elected and qualified. Column two below includes length of time served with predecessor entities, if any.
| | | | | | | | |
Name, Year of Birth and
Position(s) Held with the Trust | | Trustee and/
or Officer Since | | Principal Occupation(s)
During Past 5 Years | | Number of Funds in Fund Complex Overseen by Trustee | | Other Directorship(s) Held by Trustee During Past 5 Years |
| Interested Persons | | | | | | | | |
| Martin L. Flanagan1 — 1960 Trustee | | 2007 | | Executive Director, Chief Executive Officer and President, Invesco Ltd. (ultimate parent of Invesco and a global investment management firm); Advisor to the Board, Invesco Advisers, Inc. (formerly known as Invesco Institutional (N.A.), Inc.); Trustee, The Invesco Funds; Vice Chair, Investment Company Institute; and Member of Executive Board, SMU Cox School of Business Formerly: Chairman and Chief Executive Officer, Invesco Advisers, Inc. (registered investment adviser); Director, Chairman, Chief Executive Officer and President, IVZ Inc. (holding company), INVESCO Group Services, Inc. (service provider) and Invesco North American Holdings, Inc. (holding company); Director, Chief Executive Officer and President, Invesco Holding Company Limited (parent of Invesco and a global investment management firm); Director, Invesco Ltd.; Chairman, Investment Company Institute and President, Co-Chief Executive Officer, Co-President, Chief Operating Officer and Chief Financial Officer, Franklin Resources, Inc. (global investment management organization) | | 146 | | None |
Philip A. Taylor2 — 1954 Trustee, President and Principal Executive Officer | | 2006 | | Head of North American Retail and Senior Managing Director, Invesco Ltd.; Director, Co-Chairman, Co-President and Co-Chief Executive Officer, Invesco Advisers, Inc. (formerly known as Invesco Institutional (N.A.), Inc.) (registered investment adviser); Director, Chairman, Chief Executive Officer and President, Invesco Management Group, Inc. (formerly known as Invesco Aim Management Group, Inc.) (financial services holding company); Director and Chairman, Invesco Investment Services, Inc. (formerly known as Invesco Aim Investment Services, Inc.) (registered transfer agent) Chief Executive Officer, Invesco Corporate Class Inc. (corporate mutual fund company) Director, Chairman and Chief Executive Officer, Invesco Canada Ltd. (formerly known as Invesco Trimark Ltd./Invesco Trimark Ltèe) (registered investment adviser and registered transfer agent); Trustee, President and Principal Executive Officer, The Invesco Funds (other than AIM Treasurer’s Series Trust (Invesco Treasurer’s Series Trust), Short-Term Investments Trust and Invesco Management Trust); Trustee and Executive Vice President, The Invesco Funds (AIM Treasurer’s Series Trust (Invesco Treasurer’s Series Trust), Short-Term Investments Trust and Invesco Management Trust only); Director, Invesco Investment Advisers LLC (formerly known as Van Kampen Asset Management); Director, Chief Executive Officer and President, Van Kampen Exchange Corp. Formerly: Director and President, INVESCO Funds Group, Inc. (registered investment adviser and registered transfer agent); Director and Chairman, IVZ Distributors, Inc. (formerly known as INVESCO Distributors, Inc.) (registered broker dealer); Director, President and Chairman, Invesco Inc. (holding company), Invesco Canada Holdings Inc. (holding company), Trimark Investments Ltd./Placements Trimark Ltèe and Invesco Financial Services Ltd/Services Financiers Invesco Ltèe; Chief Executive Officer, Invesco Canada Fund Inc (corporate mutual fund company); Director and Chairman, Van Kampen Investor Services Inc.; Director, Chief Executive Officer and President, 1371 Preferred Inc. (holding company) and Van Kampen Investments Inc.; Director and President, AIM GP Canada Inc. (general partner for limited partnerships) and Van Kampen Advisors, Inc.; Director and Chief Executive Officer, Invesco Trimark Dealer Inc. (registered broker dealer); Director, Invesco Distributors, Inc. (formerly known as Invesco Aim Distributors, Inc.) (registered broker dealer); Manager, Invesco PowerShares Capital Management LLC; Director, Chief Executive Officer and President, Invesco Advisers, Inc.; Director, Chairman, Chief Executive Officer and President, Invesco Aim Capital Management, Inc.; President, Invesco Trimark Dealer Inc. and Invesco Trimark Ltd./Invesco Trimark Ltèe; Director and President, AIM Trimark Corporate Class Inc. and AIM Trimark Canada Fund Inc.; Senior Managing Director, Invesco Holding Company Limited; Director and Chairman, Fund Management Company (former registered broker dealer); President and Principal Executive Officer, The Invesco Funds (AIM Treasurer’s Series Trust (Invesco Treasurer’s Series Trust), and Short-Term Investments Trust only); President, AIM Trimark Global Fund Inc. and AIM Trimark Canada Fund Inc | | 146 | | None |
| 1 | Mr. Flanagan is considered an interested person (within the meaning of Section 2(a)(19) of the 1940 Act) of the Trust because he is an officer of the Adviser to the Trust, and an officer and a director of Invesco Ltd., ultimate parent of the Adviser. |
| 2 | Mr. Taylor is considered an interested person (within the meaning of Section 2(a)(19) of the 1940 Act) of the Trust because he is an officer and a director of the Adviser. |
Invesco V.I. Core Equity Fund
Trustees and Officers—(continued)
| | | | | | | | |
Name, Year of Birth and
Position(s) Held with the Trust | | Trustee and/
or Officer Since | | Principal Occupation(s)
During Past 5 Years | | Number of Funds in Fund Complex Overseen by Trustee | | Other Directorship(s)
Held by Trustee During Past 5 Years |
| Independent Trustees | | | | | | | | |
Bruce L. Crockett — 1944 Trustee and Chair | | 2003 | | Chairman, Crockett Technologies Associates (technology consulting company) Formerly: Director, Captaris (unified messaging provider); Director, President and Chief Executive Officer, COMSAT Corporation; Chairman, Board of Governors of INTELSAT (international communications company); ACE Limited (insurance company); Independent Directors Council and Investment Company Institute | | 146 | | ALPS (Attorneys Liability Protection Society) (insurance company) and Globe Specialty Metals, Inc. (metallurgical company) |
David C. Arch — 1945 Trustee | | 2010 | | Chairman of Blistex Inc., a consumer health care products manufacturer | | 146 | | Board member of the Illinois Manufacturers’ Association; Member of the Board of Visitors, Institute for the Humanities, University of Michigan |
James T. Bunch — 1942 Trustee | | 2000 | | Managing Member, Grumman Hill Group LLC (family office/private equity investments) Formerly: Chairman of the Board of Trustees, Evans Scholars Foundation and Chairman, Board of Governors, Western Golf Association | | 146 | | Trustee, Evans Scholars Foundation; and Chairman of the Board, Denver Film Society |
Albert R. Dowden — 1941 Trustee | | 2003 | | Director of a number of public and private business corporations, including the Boss Group, Ltd. (private investment and management); Nature’s Sunshine Products, Inc. and Reich & Tang Funds (5 portfolios) (registered investment company) Formerly: Director, Homeowners of America Holding Corporation/Homeowners of America Insurance Company (property casualty company); Director, Continental Energy Services, LLC (oil and gas pipeline service); Director, CompuDyne Corporation (provider of product and services to the public security market) and Director, Annuity and Life Re (Holdings), Ltd. (reinsurance company); Director, President and Chief Executive Officer, Volvo Group North America, Inc.; Senior Vice President, AB Volvo; Director of various public and private corporations; Chairman, DHJ Media, Inc.; Director, Magellan Insurance Company; and Director, The Hertz Corporation, Genmar Corporation (boat manufacturer), National Media Corporation; Advisory Board of Rotary Power International (designer, manufacturer, and seller of rotary power engines); and Chairman, Cortland Trust, Inc. (registered investment company) | | 146 | | Director of: Nature’s Sunshine Products, Inc., Reich & Tang Funds, Homeowners of America Holding Corporation/ Homeowners of America Insurance Company, the Boss Group |
Jack M. Fields — 1952 Trustee | | 2003 | | Chief Executive Officer, Twenty First Century Group, Inc. (government affairs company); Owner and Chief Executive Officer, Dos Angeles Ranch, L.P. (cattle, hunting, corporate entertainment); and Discovery Global Education Fund (non-profit) Formerly: Chief Executive Officer, Texana Timber LP (sustainable forestry company); Director of Cross Timbers Quail Research Ranch (non-profit); and member of the U.S. House of Representatives | | 146 | | Insperity, Inc. (formerly known as Administaff) |
Eli Jones — Trustee | | 2016 | | Professor and Dean, Mays Business School, Texas A&M University Formerly: Professor and Dean, Walton College of Business, University of Arkansas, and E.J. Ourso College of Business, Louisiana State University | | 146 | | Director, Insperity, Inc., (2011-present) and ARVEST Bank (2012-2015) |
Prema Mathai-Davis — 1950 Trustee | | 2003 | | Retired. Formerly: Chief Executive Officer, YWCA of the U.S.A. | | 146 | | None |
Larry Soll — 1942 Trustee | | 1997 | | Retired. Formerly: Chairman, Chief Executive Officer and President, Synergen Corp. (a biotechnology company) | | 146 | | None |
Robert C. Troccoli — Trustee | | 2016 | | Retired. Formerly: Senior Partner, KPMG LLP | | 146 | | None |
Raymond Stickel, Jr. — 1944 Trustee | | 2005 | | Retired. Formerly: Director, Mainstay VP Series Funds, Inc. (25 portfolios) and Partner, Deloitte & Touche | | 146 | | None |
Suzanne H. Woolsey — 1941 Trustee | | 2014 | | Chief Executive Officer of Woolsey Partners LLC | | 146 | | Emeritus Chair of the Board of Trustees of the Institute for Defense Analyses; Trustee of Colorado College; Trustee of California Institute of Technology; Prior to 2014, Director of Fluor Corp.; Prior to 2010, Trustee of the German Marshall Fund of the United States; Prior to 2010 Trustee of the Rocky Mountain Institute |
Invesco V.I. Core Equity Fund
Trustees and Officers—(continued)
| | | | | | | | |
Name, Year of Birth and
Position(s) Held with the Trust | | Trustee and/
or Officer Since | | Principal Occupation(s)
During Past 5 Years | | Number of Funds in Fund Complex Overseen by Trustee | | Other Directorship(s)
Held by Trustee During Past 5 Years |
| Other Officers | | | | | | | | |
Russell C. Burk — 1958 Senior Vice President and Senior Officer | | 2005 | | Senior Vice President and Senior Officer, The Invesco Funds | | N/A | | N/A |
John M. Zerr — 1962 Senior Vice President, Chief Legal Officer and Secretary | | 2006 | | Director, Senior Vice President, Secretary and General Counsel, Invesco Management Group, Inc. (formerly known as Invesco Aim Management Group, Inc.) and Van Kampen Exchange Corp.; Senior Vice President, Invesco Advisers, Inc. (formerly known as Invesco Institutional (N.A.), Inc.) (registered investment adviser); Senior Vice President and Secretary, Invesco Distributors, Inc. (formerly known as Invesco Aim Distributors, Inc.); Director, Vice President and Secretary, Invesco Investment Services, Inc. (formerly known as Invesco Aim Investment Services, Inc.); Senior Vice President, Chief Legal Officer and Secretary, The Invesco Funds; Managing Director, Invesco PowerShares Capital Management LLC; Director, Secretary and General Counsel, Invesco Investment Advisers LLC (formerly known as Van Kampen Asset Management); Secretary and General Counsel, Invesco Capital Markets, Inc. (formerly known as Van Kampen Funds Inc.) and Chief Legal Officer, PowerShares Exchange-Traded Fund Trust, PowerShares Exchange-Traded Fund Trust II, PowerShares India Exchange-Traded Fund Trust, PowerShares Actively Managed Exchange-Traded Fund Trust, and PowerShares Actively Managed Exchange-Traded Commodity Fund Trust Formerly: Director, Vice President and Secretary, IVZ Distributors, Inc. (formerly known as INVESCO distributors, Inc.); Director and Vice President, INVESCO Funds Group, Inc.; Director and Vice President, Van Kampen Advisors Inc.; Director, Vice President, Secretary and General Counsel, Van Kampen Investor Services Inc.; Director, Invesco Distributors, Inc. (formerly known as Invesco Aim Distributors, Inc.); Director, Senior Vice President, General Counsel and Secretary, Invesco Aim Advisers, Inc. and Van Kampen Investments Inc.; Director, Vice President and Secretary, Fund Management Company; Director, Senior Vice President, Secretary, General Counsel and Vice President, Invesco Aim Capital Management, Inc.; Chief Operating Officer and General Counsel, Liberty Ridge Capital, Inc. (an investment adviser); Vice President and Secretary, PBHG Funds (an investment company) and PBHG Insurance Series Fund (an investment company); Chief Operating Officer, General Counsel and Secretary, Old Mutual Investment Partners (a broker-dealer); General Counsel and Secretary, Old Mutual Fund Services (an administrator) and Old Mutual Shareholder Services (a shareholder servicing center); Executive Vice President, General Counsel and Secretary, Old Mutual Capital, Inc. (an investment adviser); and Vice President and Secretary, Old Mutual Advisors Funds (an investment company) | | N/A | | N/A |
Sheri Morris — 1964 Vice President, Treasurer and Principal Financial Officer | | 2003 | | Vice President, Treasurer and Principal Financial Officer, The Invesco Funds; Vice President, Invesco Advisers, Inc. (formerly known as Invesco Institutional (N.A.), Inc.) (registered investment adviser); and Vice President, PowerShares Exchange-Traded Fund Trust, PowerShares Exchange-Traded Fund Trust II, PowerShares India Exchange-Traded Fund Trust, PowerShares Actively Managed Exchange-Traded Fund Trust, and PowerShares Actively Managed Exchange-Traded Commodity Fund Trust Formerly: Vice President, Invesco Aim Advisers, Inc., Invesco Aim Capital Management, Inc. and Invesco Aim Private Asset Management, Inc.; Assistant Vice President and Assistant Treasurer, The Invesco Funds and Assistant Vice President, Invesco Advisers, Inc., Invesco Aim Capital Management, Inc. and Invesco Aim Private Asset Management, Inc.; and Treasurer, PowerShares Exchange-Traded Fund Trust, PowerShares Exchange-Traded Fund Trust II, PowerShares India Exchange-Traded Fund Trust and PowerShares Actively Managed Exchange-Traded Fund Trust | | N/A | | N/A |
Invesco V.I. Core Equity Fund
Trustees and Officers—(continued)
| | | | | | | | |
Name, Year of Birth and
Position(s) Held with the Trust | | Trustee and/
or Officer Since | | Principal Occupation(s)
During Past 5 Years | | Number of Funds in Fund Complex Overseen by Trustee | | Other Directorship(s)
Held by Trustee During Past 5 Years |
| Other Officers—(continued) | | | | | | | | |
Karen Dunn Kelley — 1960 Vice President | | 2003 | | Senior Managing Director, Investments, Invesco Ltd.; Director, Co-President, Co-Chief Executive Officer, and Co-Chairman, Invesco Advisers, Inc. (formerly known as Invesco Institutional (N.A.), Inc.) (registered investment adviser); Chairman, Invesco Senior Secured Management, Inc.; Senior Vice President, Invesco Management Group, Inc. (formerly known as Invesco Aim Management Group, Inc.); Executive Vice President, Invesco Distributors, Inc. (formerly known as Invesco Aim Distributors, Inc.); Director, Invesco Mortgage Capital Inc. and Invesco Management Company Limited; Vice President, The Invesco Funds (other than AIM Treasurer’s Series Trust (Invesco Treasurer’s Series Trust), Short-Term Investments Trust and Invesco Management Trust); and President and Principal Executive Officer, The Invesco Funds (AIM Treasurer’s Series Trust (Invesco Treasurer’s Series Trust), Short-Term Investments Trust and Invesco Management Trust only) Formerly: Director and President, INVESCO Asset Management (Bermuda) Ltd., Director, INVESCO Global Asset Management Limited and INVESCO Management S.A.; Senior Vice President, Van Kampen Investments Inc. and Invesco Advisers, Inc. (formerly known as Invesco Institutional (N.A.), Inc.) (registered investment adviser); Vice President, Invesco Advisers, Inc. (formerly known as Invesco Institutional (N.A.), Inc.); Director of Cash Management and Senior Vice President, Invesco Advisers, Inc. and Invesco Aim Capital Management, Inc.; Director and President, Fund Management Company; Chief Cash Management Officer, Director of Cash Management, Senior Vice President, and Managing Director, Invesco Aim Capital Management, Inc.; Director of Cash Management, Senior Vice President, and Vice President, Invesco Advisers, Inc. and The Invesco Funds (AIM Treasurer’s Series Trust (Invesco Treasurer’s Series Trust), and Short-Term Investments Trust only) | | N/A | | N/A |
Crissie M. Wisdom — 1969 Anti-Money Laundering Compliance Officer | | 2013 | | Anti-Money Laundering Compliance Officer, Invesco Advisers, Inc. (formerly known as Invesco Institutional (N.A.), Inc.) (registered investment adviser), Invesco Capital Markets, Inc. (formerly known as Van Kampen Funds Inc.), Invesco Distributors, Inc., Invesco Investment Services, Inc., Invesco Management Group, Inc., Van Kampen Exchange Corp., The Invesco Funds, and PowerShares Exchange-Traded Fund Trust, PowerShares Exchange-Traded Fund Trust II, PowerShares India Exchange-Traded Fund Trust, PowerShares Actively Managed Exchange-Traded Fund Trust and PowerShares Actively Managed Exchange-Traded Commodity Fund Trust; Anti-Money Laundering Compliance Officer and Bank Secrecy Act Officer, INVESCO National Trust Company and Invesco Trust Company; and Fraud Prevention Manager and Controls and Risk Analysis Manager for Invesco Investment Services, Inc. | | N/A | | N/A |
Lisa O. Brinkley — 1959 Chief Compliance Officer | | 2015 | | Senior Vice President and Chief Compliance Officer, Invesco Advisers, Inc. (registered investment adviser) (formerly known as Invesco Institutional (N.A., Inc.); and Chief Compliance Officer, The Invesco Funds Formerly: Global Assurance Officer, Invesco Ltd. and Vice President, The Invesco Funds; Chief Compliance Officer, Invesco Distributors, Inc. (formerly known as Invesco Aim Distributors, Inc.), Invesco Investment Services, Inc.(formerly known as Invesco Aim Investment Services, Inc.) and Van Kampen Investor Services Inc.; Senior Vice President, Invesco Management Group, Inc.; Senior Vice President and Chief Compliance Officer, Invesco Advisers, Inc. and The Invesco Funds; Vice President and Chief Compliance Officer, Invesco Aim Capital Management, Inc. and Invesco Distributors, Inc.; Vice President, Invesco Investment Services, Inc. and Fund Management Company | | N/A | | N/A |
The Statement of Additional Information of the Trust includes additional information about the Fund’s Trustees and is available upon request, without charge, by calling 1.800.959.4246. Please refer to the Fund’s prospectus for information on the Fund’s sub-advisers.
| | | | | | |
Office of the Fund 11 Greenway Plaza, Suite 1000 Houston, TX 77046-1173 | | Investment Adviser Invesco Advisers, Inc. 1555 Peachtree Street, N.E. Atlanta, GA 30309 | | Distributor Invesco Distributors, Inc. 11 Greenway Plaza, Suite 1000 Houston, TX 77046-1173 | | Auditors PricewaterhouseCoopers LLP 1000 Louisiana Street, Suite 5800 Houston, TX 77002-5678 |
| | | |
| | | | | | |
Counsel to the Fund Stradley Ronon Stevens & Young, LLP 2005 Market Street, Suite 2600 Philadelphia, PA 19103-7018 | | Counsel to the Independent Trustees Goodwin Procter LLP 901 New York Avenue, N.W. Washington, D.C. 20001 | | Transfer Agent Invesco Investment Services, Inc. 11 Greenway Plaza, Suite 1000 Houston, TX 77046-1173 | | Custodian State Street Bank and Trust Company 225 Franklin Street Boston, MA 02110-2801 |
Invesco V.I. Core Equity Fund
| | | | |
| | |

| | Annual Report to Shareholders | | December 31, 2015 |
| | |
| | Invesco V.I. Core Plus Bond Fund |

| | |
| | The Fund provides a complete list of its holdings four times in each fiscal year, at the quarter-ends. For the second and fourth quarters, the lists appear in the Fund’s semiannual and annual reports to shareholders. For the first and third quarters, the Fund files the lists with the Securities and Exchange Commission (SEC) on Form N-Q. The Fund’s Form N-Q filings are available on the SEC website, sec.gov. Copies of the Fund’s Forms N-Q may be reviewed and copied at the SEC Public Reference Room in Washington, D.C. You can obtain information on the operation of the Public Reference Room, including information about duplicating fee charges, by calling 202 551 8090 or 800 732 0330, or by electronic request at the following email address: publicinfo@sec.gov. The SEC file numbers for the Fund are 811-07452 and 033-57340. The Fund’s most recent portfolio holdings, as filed on Form N-Q, have also been made available to insurance companies issuing variable annuity contracts and variable life insurance policies (“variable products”) that invest in the Fund. A description of the policies and procedures that the Fund uses to determine how to vote proxies relating to portfolio securities is available without charge, upon request, from our Client Services department at 800 959 4246 or at invesco.com/proxyguidelines. The information is also available on the SEC website, sec.gov. Information regarding how the Fund voted proxies related to its portfolio securities during the most recent 12-month period ended June 30 is available at invesco.com/ proxysearch. The information is also available on the SEC website, sec.gov. Invesco Advisers, Inc. is an investment adviser; it provides investment advisory services to individual and institutional clients and does not sell securities. Invesco Distributors, Inc. is the US distributor for Invesco Ltd.’s retail mutual funds, exchange-traded funds and institutional money market funds. Both are wholly owned, indirect subsidiaries of Invesco Ltd. This report must be accompanied or preceded by a currently effective Fund prospectus and variable product prospectus, which contain more complete information, including sales charges and expenses. Investors should read each carefully before investing. Invesco Distributors, Inc. VICPB-AR-1 NOT FDIC INSURED | MAY LOSE VALUE | NO BANK GUARANTEE |
Management’s Discussion of Fund Performance
Performance summary
For the year ended December 31, 2015, Series I shares of Invesco V.I. Core Bond Plus Fund (the Fund) underperformed the Fund’s broad market/style-specific benchmark, the Barclays U.S. Aggregate Index.
Your Fund’s long-term performance appears later in this report.
Fund vs. Indexes
Total returns, 12/31/14 to 12/31/15, excluding variable product issuer charges.
If variable product issuer charges were included, returns would be lower.
| | | | | |
| Series I Shares | | | | -0.37 | % |
| Series II Shares | | | | -0.64 | |
| Barclays U.S. Aggregate Index▼ (Broad Market/Style-Specific Index)* | | | | 0.55 | |
| Barclays U.S. Credit Index▼ (Former Style-Specific Index)* | | | | -0.77 | |
| Lipper VUF Core Plus Bond Funds Indexn (Peer Group Index)* | | | | -0.15 | |
| Lipper VUF Corporate Debt BBB-Rated Funds Indexn (Former Peer Group Index)* | | | | -0.11 | |
Source(s): ▼FactSet Research Systems Inc.; nLipper Inc.
| * | The Fund has elected to use the Barclays U.S. Aggregate Index rather than the Barclays U.S. Credit Index as its style-specific index because the Barclays U.S. Aggregate Index more closely represents the performance of the types of securities in which the Fund invests. Also, the Fund has elected to use the Lipper VUF Core Plus Bond Funds Index rather than the Lipper VUF Corporate Debt BBB-Rated Funds Index as its peer group index because the Lipper VUF Core Plus Bond Funds Index more closely represents the performance of the types of securities in which the Fund invests. |
Market conditions and your Fund
US Treasury yields rose during the first half of 2015. Stronger-than-expected economic data helped to drive global interest rates higher following the European Central Bank’s (ECB) version of quantitative easing whereby the ECB committed to purchasing longer-dated eurozone fixed income instruments in an effort to push longer-term interest rates lower and spur economic growth.
Also supporting higher US interest rates was the end of the US Federal Reserve’s (the Fed) quantitative easing program of purchasing long-dated Treasury bonds, coupled with supportive US economic data in the form of stronger economic growth and employment. In December, the Fed hiked interest rates as expected and the yield on the 10-year US Treasury stood at 2.27% as of December 31, 2015, 10 basis points higher than at the
beginning of 2015.1 (A basis point is one one-hundredth of a percentage point.)
During this reporting period of interest rate volatility, investment-grade bonds, as represented by the Barclays U.S. Aggregate Index, returned 0.55%. Investment-grade corporate credit posted losses despite continued strong US credit fundamentals mainly due to an abundance of new supply. Out-of-index exposures, such as the high yield sector, finished the reporting period in negative territory as falling energy and commodity prices, amid slowing global growth, weighed on returns. However, the US-dollar denominated emerging markets sector performed well, driven by strong performance in countries such as Argentina, Belarus, Russia and Ukraine.
The Fund posted negative returns for the reporting period and underperformed its broad market/style-specific benchmark,
the Barclays U.S. Aggregate Index. Security selection within mortgage-backed securities (MBS) and investment grade corporate bonds was one of the most notable contributors to relative Fund performance. Overweight positions within the commercial MBS and asset-backed securities sectors also added value relative to the Fund’s broad market/style-specific index. An overweight position in investment-grade corporate credit was the most notable detractor from Fund performance but was tempered by positive security selection within the sector. Out-of-index exposure to sectors such as high yield and emerging markets, in addition to underweight Treasury exposure, weighed on relative Fund performance.
The Fund benefited from incremental income earned from transactions in the highly liquid to-be-announced (TBA) market for agency MBS. Such transactions involve the Fund selling an MBS to a financial institution, with an agreement to repurchase a substantially similar security at an agreed upon price and date. Cash received by the Fund as a result of this repurchase transaction may be invested in short-term instruments, and the income from these investments, together with any additional fee income received from this activity, can generate income for the Fund.
The Fund also may use active duration and yield curve positioning for risk management and for generating excess return versus its broad market/style-specific benchmark. Duration measures a portfolio’s price sensitivity to interest rate changes. Yield curve positioning refers to actively emphasizing particular points (maturities) along the yield curve with favorable risk/return expectations. Duration of the portfolio was maintained above the benchmark, on average, and the timing of changes and the degree of
| | | | | |
| Portfolio Composition |
| By security type, based on total investments |
| | | | | |
| |
| Bonds and Notes | | | | 53.0 | % |
| U.S. Government Sponsored Agency Mortgage-Backed Securities | | | | 21.3 | |
| U.S. Treasury Securities | | | | 10.2 | |
| Asset-Backed Securities | | | | 7.2 | |
Security Types Each Less Than 1% of Portfolio | | | | 1.8 | |
| Money Market Funds | | | | 6.5 | |
| | | | | | | |
| | |
| 1. | | Federal National Mortgage Association | | | | 15.8 | % |
| 2. | | U.S. Treasury | | | | 12.1 | |
| 3. | | Federal Home Loan Mortgage Corp. | | | | 8.2 | |
| 4. | | Moody’s Corp. | | | | 2.4 | |
| 5. | | EPR Properties | | | | 2.3 | |
| 6. | | Government National Mortgage Association | | | | 2.1 | |
| 7. | | MAPS CLO Fund II Ltd. | | | | 1.5 | |
| 8. | | Barclays Bank Commercial Mortgage Securities Trust | | | | 1.4 | |
| 9. | | American Financial Group, Inc. | | | | 1.4 | |
| 10. | | NXP B.V./NXP Funding LLC | | | | 1.3 | |
| | | | | |
| Total Net Assets | | | $ | 15.7 million | |
| |
| Total Number of Holdings* | | | | 312 | |
The Fund’s holdings are subject to change, and there is no assurance that the Fund will continue to hold any particular security.
| * | Excluding money market fund holdings and US Treasury bills. |
Data presented here are as of December 31, 2015.
Invesco V.I. Core Plus Bond Fund
variance from the Fund’s broad market/ style-specific benchmark during the reporting period provided a boost to relative returns. Buying and selling US Treasury futures and interest rate swaptions were important tools used for the management of interest rate risk and to maintain our targeted portfolio duration.
Part of the Fund’s strategy to manage credit and currency risk in the portfolio during the reporting period entailed purchasing and selling credit and currency derivatives. Credit market risk was managed by purchasing and selling protection through credit default swaps at various points throughout the year. The currency management was carried out via currency forwards and options on an as-needed basis and was effective in managing the currency positioning within the Fund.
We wish to remind you that the Fund is subject to interest rate risk, meaning when interest rates rise, the value of fixed income securities tends to fall. The risk may be greater in the current market environment because interest rates are at or near historic lows. The degree to which the value of fixed income securities may decline due to rising interest rates may vary depending on the speed and magnitude of the increase in interest rates, as well as individual security characteristics such as price, maturity, duration and coupon and market forces such as supply and demand for similar securities. We are monitoring interest rates, and the market, economic and geopolitical factors that may impact the direction, speed and magnitude of changes to interest rates across the maturity spectrum, including the potential impact of monetary policy changes by the Fed and certain foreign central banks. If interest rates rise, markets may experience increased volatility, which may affect the value and/ or liquidity of certain of the Fund’s investments.
Thank you for investing in Invesco V.I. Core Plus Bond Fund and for sharing our long-term investment horizon.
The views and opinions expressed in management’s discussion of Fund performance are those of Invesco Advisers, Inc. These views and opinions are subject to change at any time based on factors such as market and economic conditions. These views and opinions may not be relied upon as investment advice or recommendations, or as an offer for a particular security. The information is not a complete analysis of every aspect of any market, country, industry, security or the Fund. Statements of fact are from sources considered reliable, but Invesco Advisers, Inc. makes no representation or warranty as to their completeness or accuracy. Although historical performance is no guarantee of future results, these insights may help you understand our investment management philosophy.
See important Fund and, if applicable, index disclosures later in this report.
| | |
 | | Matthew Brill Chartered Financial Analyst, Portfolio Manager, is manager of Invesco V.I. Core Plus Bond Fund. He joined |
Invesco in 2013. Mr. Brill earned a BA in economics from Washington and Lee University. |
| |

| | Chuck Burge Portfolio Manager, is manager of Invesco V.I. Core Plus Bond Fund. He joined Invesco in 2002. Mr. Burge earned |
a BS in economics from Texas A&M University and an MBA in finance and accounting from Rice University. |
| | |
| |

| | Darren Hughes Chartered Financial Analyst, Portfolio Manager, is manager of Invesco V.I. Core Plus Bond Fund. He joined |
Invesco in 1992. Mr. Hughes earned a BBA in finance and economics from Baylor University. |
| |

| | Michael Hyman Portfolio Manager, is manager of Invesco V.I. Core Plus Bond Fund. He joined Invesco in 2013. Mr. Hyman |
earned a BSE in finance from Pennsylvania State University and an MBA from the Stern School of Business at New York University. |
| |

| | Joseph Portera Portfolio Manager, is manager of Invesco V.I. Core Plus Bond Fund. He joined Invesco in 2012. Mr. Portera |
earned BA and MA degrees in Soviet studies and an MA in international political economy and development from Fordham University. |
| |

| | Rashique Rahman Portfolio Manager, is manager of Invesco V.I. Core Plus Bond Fund. Mr. Rahman is the Head of Emerging |
Markets for Invesco Fixed Income. He joined Invesco in 2014. Mr. Rahman earned a BA in economics and political science from the University of California, Los Angeles, and an MA in international affairs, as well as an MBA, from Columbia University. |
| |

| | Scott Roberts Chartered Financial Analyst, Portfolio Manager, is manager of Invesco V.I. Core Plus Bond Fund. He joined |
Invesco in 2000. Mr. Roberts earned a BBA in finance from the University of Houston. |
| |

| | Robert Waldner Chartered Financial Analyst, Portfolio Manager, is manager of Invesco V.I. Core Plus Bond Fund. He joined |
Invesco in 2013. Mr. Waldner earned a BSE degree in civil engineering from Princeton University. |
Invesco V.I. Core Plus Bond Fund
Your Fund’s Long-Term Performance
Results of a $10,000 Investment – Oldest Share Class(es)
Fund and index data from 12/31/05
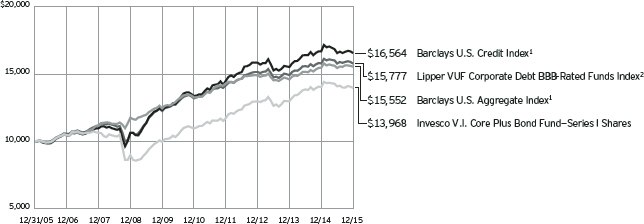
| 1 | Source: FactSet Research Systems Inc. |
Past performance cannot guarantee comparable future results.
During the reporting period, the Fund elected to use the Barclays U.S. Aggregate Index as its style-specific index rather than the Barclays U.S. Credit Index because the Barclays U.S. Aggregate Index more closely represents the performance of
the types of securities in which the Fund invests. Also, the Fund elected to use the Lipper VUF Core Plus Bond Funds Index as its peer group index rather than the Lipper VUF Corporate Debt BBB-Rated Funds Index because the Lipper VUF Core Plus Bond Funds Index more closely represents the performance of the types of securities
in which the Fund invests. Because this is the first reporting period since we have adopted the new indexes, SEC guidelines require that we compare performance to both the old and new indexes. The Lipper VUF Core Plus Bond Funds Index is not shown on the chart as the index does not have 10 years of performance history.
| | | | | |
| Average Annual Total Returns |
As of 12/31/15 | | | | | |
| |
| Series I Shares | | | | | |
| Inception (5/5/93) | | | | 4.28 | % |
| 10 Years | | | | 3.40 | |
| 5 Years | | | | 4.99 | |
| 1 Year | | | | -0.37 | |
| |
| Series II Shares | | | | | |
| Inception (3/14/02) | | | | 3.73 | % |
| 10 Years | | | | 3.14 | |
| 5 Years | | | | 4.72 | |
| 1 Year | | | | -0.64 | |
The performance of the Fund’s Series I and Series II share classes will differ primarily due to different class expenses.
The performance data quoted represent past performance and cannot guarantee comparable future results; current performance may be lower or higher. Please contact your variable product issuer or financial adviser for the most recent month-end variable product performance. Performance figures reflect Fund expenses, reinvested distributions and changes in
net asset value. Investment return and principal value will fluctuate so that you may have a gain or loss when you sell shares.
The net annual Fund operating expense ratio set forth in the most recent Fund prospectus as of the date of this report for Series I and Series II shares was 0.61% and 0.86%, respectively.1 The total annual Fund operating expense ratio set forth in the most recent Fund prospectus as of the date of this report for Series I and Series II shares was 1.62% and 1.87%, respectively. The expense ratios presented above may vary from the expense ratios presented in other sections of this report that are based on expenses incurred during the period covered by this report.
Invesco V.I. Core Plus Bond Fund, a series portfolio of AIM Variable Insurance Funds (Invesco Variable Insurance Funds), is currently offered through insurance companies issuing variable products. You cannot purchase shares of the Fund directly. Performance figures given represent
the Fund and are not intended to reflect actual variable product values. They do not reflect sales charges, expenses and fees assessed in connection with a variable product. Sales charges, expenses and fees, which are determined by the variable product issuers, will vary and will lower the total return.
The most recent month-end performance at the Fund level, excluding variable product charges, is available at 800 451 4246. As mentioned above, for the most recent month-end performance including variable product charges, please contact your variable product issuer or financial adviser.
Fund performance reflects any applicable fee waivers and/or expense reimbursements. Had the adviser not waived fees and/or reimbursed expenses currently or in the past, returns would have been lower. See current prospectus for more information.
| 1 | Total annual Fund operating expenses after any contractual fee waivers and/or expense reimbursements by the adviser in effect through at least April 30, 2017. See current prospectus for more information. |
Invesco V.I. Core Plus Bond Fund
Invesco V.I. Core Plus Bond Fund’s investment objective is total return, comprised of current income and capital appreciation.
| n | | Unless otherwise stated, information presented in this report is as of December 31, 2015, and is based on total net assets. |
| n | | Unless otherwise noted, all data provided by Invesco. |
| n | | To access your Fund’s reports/prospectus, visit invesco.com/fundreports. |
Principal risks of investing in the Fund
Active trading risk. The Fund engages in frequent trading of portfolio securities. Active trading results in added expenses and may result in a lower return and increased tax liability.
Changing fixed income market conditions risk. The current low interest rate environment was created in part by the Federal Reserve Board (FRB) and certain foreign central banks keeping the federal funds and equivalent foreign rates at or near zero. There is a risk that interest rates will rise when the FRB and central banks raise these rates. This risk is heightened due to the FRB’s quantitative easing program and the “tapering” of other similar foreign central bank actions. This eventual increase in the federal funds and equivalent foreign rates may expose fixed income markets to heightened volatility and reduced liquidity for certain fixed income investments, particularly those with longer maturities. In addition, decreases in fixed income dealer market-making capacity may also potentially lead to heightened volatility and reduced liquidity in the fixed income markets. As a result, the value of the Fund’s investments and share price may decline. Changes in central bank policies could also result in higher than normal shareholder redemptions, which could potentially increase portfolio turnover and the Fund’s transaction costs.
Collateralized loan obligations risk. In addition to the normal interest rate, default and other risks of fixed income securities, collateralized loan obligations carry additional risks, including the possibility that distributions from collateral securities will not be adequate to make interest or other payments, the quality of the collateral may decline in value or default, the Fund may invest in collateralized loan obligations that are subordinate to other classes, values may be volatile, and disputes with the issuer may produce unexpected investment results.
Credit risk. The issuer of instruments in which the Fund invests may be unable to meet interest and/or principal payments, thereby causing its instruments to decrease in value and lowering the issuer’s credit rating.
Currency/exchange rate risk. The dollar value of the Fund’s foreign investments will be affected by changes in the exchange rates between the dollar and the currencies in which those investments are traded.
Derivatives risk. The value of a derivative instrument depends largely on (and is derived from) the value of an underlying security, currency, commodity, interest rate, index or other asset (each referred to as an underlying asset). In addition to risks relating to the underlying assets, the use of derivatives may include other, possibly greater, risks, including counterparty, leverage and liquidity risks. Counterparty risk is the risk that the counterparty to the derivative contract will default on its obligation to pay the Fund the amount owed or otherwise perform under the derivative contract. Derivatives create leverage risk because they do not require payment up front equal to the economic exposure created by owning the derivative. As a result, an adverse change in the value of the underlying asset could result in the Fund sustaining a loss that is substantially greater than the amount invested in the derivative, which may make the Fund’s returns more volatile and increase the risk of loss. Derivative instruments may also be less liquid than more traditional investments and the Fund may be unable to sell or close out its derivative positions at a desirable time or price. This risk may be more acute under adverse market conditions, during which the Fund may be most in need of liquidating its derivative positions. Derivatives may also be harder to value, less tax efficient and subject to changing government regulation that could impact the Fund’s ability to use certain derivatives or their cost. Also, derivatives used for hedging or to gain or limit exposure to a particular market segment may not provide the expected benefits, particularly during adverse market conditions.
Developing/emerging markets securities risk. The prices of securities issued by foreign companies and governments located in developing/emerging markets countries may be affected more negatively by inflation, devaluation of their currencies, higher transaction costs, delays in settlement, adverse political developments, the introduction of capital controls,
withholding taxes, nationalization of private assets, expropriation, social unrest, war or lack of timely information than those in developed countries.
Foreign securities risk. The Fund’s foreign investments may be affected by changes in a foreign country’s exchange rates, political and social instability, changes in economic or taxation policies, difficulties when enforcing obligations, decreased liquidity, and increased volatility. Foreign companies may be subject to less regulation resulting in less publicly available information about the companies.
High yield bond (junk bond) risk. Junk bonds involve a greater risk of default or price changes due to changes in the credit quality of the issuer. The values of junk bonds fluctuate more than those of high- quality bonds in response to company, political, regulatory or economic developments. Values of junk bonds can decline significantly over short periods of time.
Interest rate risk. Interest rate risk refers to the risk that bond prices generally fall as interest rates rise; conversely, bond prices generally rise as interest rates fall. Specific bonds differ in their sensitivity to changes in interest rates depending on their individual characteristics, including duration.
Liquidity risk. The Fund may hold illiquid securities that it is unable to sell at the preferred time or price and could lose its entire investment in such securities.
Management risk. The investment techniques and risk analysis used by the Fund’s portfolio managers may not produce the desired results.
Market risk. The prices of and the income generated by the Fund’s securities may decline in response to, among other things, investor sentiment, general economic and market conditions, regional or global instability, and currency and interest rate fluctuations.
Mortgage- and asset-backed securities risk. The Fund may invest in mortgage- and asset-backed securities that are subject to prepayment or call risk, which is the risk that the borrower’s payments may be received earlier or later than expected due to changes in prepayment rates on underlying loans. Faster prepayments often happen when interest rates are falling. As a result, the Fund may reinvest these early payments at lower interest
Invesco V.I. Core Plus Bond Fund
rates, thereby reducing the Fund’s income. Conversely, when interest rates rise, prepayments may happen more slowly, causing the security to lengthen in duration. Longer duration securities tend to be more volatile. Securities may be prepaid at a price less than the original purchase value. An unexpectedly high rate of defaults on the mortgages held by a mortgage pool may adversely affect the value of mortgage-backed securities and could result in losses to the Fund. The risk of such defaults is generally higher in the case of mortgage pools that include subprime mortgages. Subprime mortgages refer to loans made to borrowers with weakened credit histories or with lower capacity to make timely payments on their mortgages.
Municipal securities risk. The Fund may invest in municipal securities. Constitutional amendments, legislative enactments, executive orders, administrative regulations, voter initiatives, and the issuer’s regional economic conditions may affect the municipal security’s value, interest payments, repayment of principal and the Fund’s ability to sell it. Failure of a municipal security issuer to comply with applicable tax requirements may make income paid thereon taxable, resulting in a decline in the security’s value. In addition, there could be changes in applicable tax laws or tax treatments that reduce or eliminate the current federal income tax exemption on municipal securities or otherwise adversely affect the current federal or state tax status of municipal securities.
Reinvestment risk. Reinvestment risk is the risk that a bond’s cash flows (coupon income and principal repayment) will be reinvested at an interest rate below that on the original bond.
TBA transactions risk. TBA transactions involve the risk that the securities received may be less favorable than what was anticipated by the Fund when entering into the TBA transaction. TBA transactions also involve the risk that a counterparty will fail to deliver the securities, exposing the Fund to further losses. Whether or not the Fund takes delivery of the securities at the termination date of a TBA transaction, the Fund will nonetheless be exposed to changes in the value of the underlying investments during the term of the agreement. When the Fund enters into a short sale of a TBA mortgage it does not own, the Fund may have to purchase deliverable mortgages to settle the short sale at a higher price than anticipated, thereby causing a loss. A short position in a TBA mortgage poses
more risk than holding the same TBA mortgage long. As there is no limit on how much the price of mortgage securities can increase, the Fund’s exposure is unlimited. The Fund may not always be able to purchase mortgage securities to close out the short position at a particular time or at an acceptable price. A Fund will earmark or segregate liquid assets in an amount at least equal to its exposure for the duration of the contract. The Fund will incur increased transaction costs associated with selling TBA mortgages short. In addition, taking short positions in TBA mortgages results in a form of leverage which could increase the volatility of the Fund’s share price.
US government obligations risk. The Fund may invest in obligations issued by US government agencies and instrumentalities that may receive varying levels of support from the government, which could affect the Fund’s ability to recover should they default.
When-issued and delayed delivery risks. When-issued and delayed delivery transactions are subject to market risk as the value or yield of a security at delivery may be more or less than the purchase price or the yield generally available on securities when delivery occurs. In addition, the Fund is subject to counterparty risk because it relies on the buyer or seller, as the case may be, to consummate the transaction, and failure by the other party to complete the transaction may result in the Fund missing the opportunity of obtaining a price or yield considered to be advantageous.
Zero coupon or pay-in-kind securities risk. The value, interest rates, and liquidity of non-cash paying instruments, such as zero coupon and pay-in-kind securities, are subject to greater fluctuation than other types of securities. The higher yields and interest rates on pay-in-kind securities reflect the payment deferral and increased credit risk associated with such instruments and that such investments may represent a higher credit risk than coupon loans. Pay-in-kind securities may have a potential variability in valuations because their continuing accruals require continuing judgments about the collectability of the deferred payments and the value of any associated collateral.
About indexes used in this report
The Barclays U.S. Aggregate Index is an unmanaged index considered representative of the US investment-grade, fixed-rate bond market.
The Barclays U.S. Credit Index is an unmanaged index considered representative of publicly issued, SEC-registered US corporate and specified foreign debentures and secured notes.
The Lipper VUF Core Plus Bond Funds Index is an unmanaged index considered representative of core plus bond variable insurance underlying funds tracked by Lipper.
The Lipper VUF Corporate Debt BBB-Rated Funds Index is an unmanaged index considered representative of corporate debt BBB-rated variable insurance underlying funds tracked by Lipper.
The Fund is not managed to track the performance of any particular index, including the index(es) described here, and consequently, the performance of the Fund may deviate significantly from the performance of the index(es).
A direct investment cannot be made in an index. Unless otherwise indicated, index results include reinvested dividends, and they do not reflect sales charges. Performance of the peer group, if applicable, reflects fund expenses; performance of a market index does not.
Other information
The returns shown in management’s discussion of Fund performance are based on net asset values calculated for shareholder transactions. Generally accepted accounting principles require adjustments to be made to the net assets of the Fund at period end for financial reporting purposes, and as such, the net asset values for shareholder transactions and the returns based on those net asset values may differ from the net asset values and returns reported in the Financial Highlights. Additionally, the returns and net asset values shown throughout this report are at the Fund level only and do not include variable product issuer charges. If such charges were included, the total returns would be lower.
Invesco V.I. Core Plus Bond Fund
Schedule of Investments(a)
December 31, 2015
| | | | | | | | |
| | | Principal
Amount | | | Value | |
Bonds and Notes–66.27% | | | | | | | | |
| Aerospace & Defense–0.70% | | | | | | | | |
BAE Systems Holdings Inc. (United Kingdom), Sr. Unsec. Gtd. Notes, | | | | | | | | |
3.85%, 12/15/2025(b) | | $ | 41,000 | | | $ | 40,881 | |
4.75%, 10/07/2044(b) | | | 17,000 | | | | 16,588 | |
DigitalGlobe Inc., Sr. Unsec. Gtd. Notes, 5.25%, 02/01/2021(b) | | | 3,000 | | | | 2,513 | |
L-3 Communications Corp., Sr. Unsec. Gtd. Global Notes, 3.95%, 05/28/2024 | | | 36,000 | | | | 34,252 | |
Moog Inc., Sr. Unsec. Gtd. Notes, 5.25%, 12/01/2022(b) | | | 6,000 | | | | 6,135 | |
TransDigm Inc., Sr. Unsec. Gtd. Sub. Notes, 6.50%, 05/15/2025(b) | | | 10,000 | | | | 9,750 | |
| | | | | | | | 110,119 | |
| |
| Agricultural & Farm Machinery–0.38% | | | | | |
John Deere Capital Corp., Sr. Unsec. Medium Term Notes, 3.90%, 07/12/2021 | | | 51,000 | | | | 54,108 | |
Titan International Inc., Sr. Sec. Gtd. First Lien Global Notes, 6.88%, 10/01/2020 | | | 7,000 | | | | 5,250 | |
| | | | | | | | 59,358 | |
| | |
| Agricultural Products–0.21% | | | | | | | | |
Bunge Ltd. Finance Corp., Sr. Unsec. Gtd. Global Notes, 3.50%, 11/24/2020 | | | 33,000 | | | | 32,862 | |
| | |
| Airlines–1.99% | | | | | | | | |
Air Canada (Canada), Sr. Unsec. Gtd. Notes, 7.75%, 04/15/2021(b) | | | 10,000 | | | | 10,475 | |
American Airlines Pass Through Trust, Series 2015-2, Class B, Sec. Third Lien Pass Through Ctfs., 4.40%, 09/22/2023 | | | 35,000 | | | | 34,781 | |
Continental Airlines Pass Through Trust, Series 2009-1, Sr. Sec. First Lien Pass Through Ctfs., 9.00%, 07/08/2016 | | | 81,941 | | | | 84,696 | |
Delta Air Lines Pass Through Trust, Series 2010-2, Class A, Sr. Sec. First Lien Pass Through Ctfs., 4.95%, 05/23/2019 | | | 34,940 | | | | 36,841 | |
LATAM Airlines Group S.A. Pass Through Trust (Chile), Series 2015-1, Class A, Sec. Pass Through Ctfs., 4.20%, 11/15/2027(b) | | | 104,000 | | | | 96,120 | |
United Airlines Pass Through Trust, Series 2014-2, Class B, Sec. Second Lien Pass Through Ctfs., 4.63%, 09/03/2022 | | | 50,000 | | | | 49,969 | |
US Airways Pass Through Trust, Series 2012-1, Class B, Sec. Second Lien Pass Through Ctfs., 8.00%, 10/01/2019 | | | 835 | | | | 907 | |
| | | | | | | | 313,789 | |
| | |
| Alternative Carriers–0.09% | | | | | | | | |
Level 3 Communications, Inc., Sr. Unsec. Global Notes, 5.75%, 12/01/2022 | | | 12,000 | | | | 12,300 | |
Level 3 Financing, Inc., Sr. Unsec. Gtd. Notes, 5.13%, 05/01/2023(b) | | | 2,000 | | | | 2,010 | |
| | | | | | | | 14,310 | |
| | | | | | | | |
| | | Principal
Amount | | | Value | |
| Apparel Retail–0.07% | | | | | | | | |
L Brands, Inc., Sr. Unsec. Gtd. Notes, 6.88%, 11/01/2035(b) | | $ | 10,000 | | | $ | 10,313 | |
| |
| Asset Management & Custody Banks–1.09% | | | | | |
Blackstone Holdings Finance Co. LLC, Sr. Unsec. Gtd. Notes, 5.00%, 06/15/2044(b) | | | 90,000 | | | | 92,270 | |
Carlyle Holdings II Finance LLC, Sr. Sec. Gtd. Notes, 5.63%, 03/30/2043(b) | | | 75,000 | | | | 79,831 | |
| | | | | | | | 172,101 | |
| | |
| Auto Parts & Equipment–0.17% | | | | | | | | |
CTP Transportation Products LLC/CTP Finance Inc., Sr. Sec. Notes, 8.25%, 12/15/2019(b) | | | 12,000 | | | | 12,570 | |
Dana Holding Corp., Sr. Unsec. Notes, 5.50%, 12/15/2024 | | | 5,000 | | | | 4,881 | |
Tenneco Inc., Sr. Unsec. Gtd. Global Notes, 5.38%, 12/15/2024 | | | 9,000 | | | | 9,192 | |
| | | | | | | | 26,643 | |
| | |
| Automobile Manufacturers–0.24% | | | | | | | | |
General Motors Financial Co., Inc., Sr. Unsec. Gtd. Notes, 3.15%, 01/15/2020 | | | 39,000 | | | | 38,500 | |
| | |
| Automotive Retail–0.10% | | | | | | | | |
Advance Auto Parts, Inc., Sr. Unsec. Gtd. Notes, 5.75%, 05/01/2020 | | | 12,000 | | | | 13,096 | |
CST Brands, Inc., Sr. Unsec. Gtd. Global Notes, 5.00%, 05/01/2023 | | | 3,000 | | | | 2,993 | |
| | | | | | | | 16,089 | |
| | |
| Biotechnology–0.12% | | | | | | | | |
Gilead Sciences, Inc., Sr. Unsec. Global Notes, 3.25%, 09/01/2022 | | | 19,000 | | | | 19,141 | |
| | |
| Broadcasting–0.08% | | | | | | | | |
Clear Channel Worldwide Holdings, Inc., Series B, Sr. Unsec. Gtd. Global Notes, 6.50%, 11/15/2022 | | | 2,000 | | | | 1,965 | |
Sinclair Television Group Inc., Sr. Unsec. Gtd. Notes, 5.63%, 08/01/2024(b) | | | 6,000 | | | | 5,850 | |
TEGNA, Inc., Sr. Unsec. Gtd. Global Notes, 6.38%, 10/15/2023 | | | 4,000 | | | | 4,210 | |
| | | | | | | | 12,025 | |
| | |
| Building Products–0.41% | | | | | | | | |
Allegion PLC, Sr. Unsec. Gtd. Notes, 5.88%, 09/15/2023 | | | 2,000 | | | | 2,048 | |
BMC Stock Holdings, Inc., Sr. Sec. Gtd. First Lien Notes, 9.00%, 09/15/2018(b) | | | 14,000 | | | | 14,612 | |
Builders FirstSource, Inc., Sr. Sec. First Lien Notes, 7.63%, 06/01/2021(b) | | | 15,000 | | | | 15,844 | |
Building Materials Corp. of America, Sr. Unsec. Notes, 5.38%, 11/15/2024(b) | | | 15,000 | | | | 15,037 | |
Gibraltar Industries Inc., Sr. Unsec. Gtd. Sub. Global Notes, 6.25%, 02/01/2021 | | | 11,000 | | | | 11,234 | |
See accompanying Notes to Financial Statements which are an integral part of the financial statements.
Invesco V.I. Core Plus Bond Fund
| | | | | | | | |
| | | Principal
Amount | | | Value | |
| Building Products–(continued) | | | | | | | | |
Hardwoods Acquisition, Inc., Sr. Sec. Gtd. First Lien Notes, 7.50%, 08/01/2021(b) | | $ | 4,000 | | | $ | 3,340 | |
NCI Building Systems, Inc., Sr. Unsec. Gtd. Notes, 8.25%, 01/15/2023(b) | | | 2,000 | | | | 2,108 | |
| | | | | | | | 64,223 | |
| | |
| Cable & Satellite–2.69% | | | | | | | | |
CCO Holdings LLC/CCO Holdings Capital Corp., | | | | | | | | |
Sr. Unsec. Gtd. Global Notes, | | | | | | | | |
5.25%, 09/30/2022 | | | 20,000 | | | | 20,275 | |
Sr. Unsec. Gtd. Notes, | | | | | | | | |
5.13%, 05/01/2023(b) | | | 2,000 | | | | 2,010 | |
5.38%, 05/01/2025(b) | | | 2,000 | | | | 2,005 | |
CCO Safari II, LLC, | | | | | | | | |
Sr. Sec. First Lien Notes, | | | | | | | | |
6.83%, 10/23/2055(b) | | | 41,000 | | | | 40,379 | |
Sr. Sec. Gtd. First Lien Notes, | | | | | | | | |
4.91%, 07/23/2025(b) | | | 114,000 | | | | 113,850 | |
Cox Communications, Inc., Sr. Unsec. Notes, 9.38%, 01/15/2019(b) | | | 140,000 | | | | 163,529 | |
DISH DBS Corp., Sr. Unsec. Gtd. Global Notes, 5.88%, 11/15/2024 | | | 15,000 | | | | 13,350 | |
Intelsat Jackson Holdings S.A. (Luxembourg), Sr. Unsec. Gtd. Global Bonds, 5.50%, 08/01/2023 | | | 10,000 | | | | 7,900 | |
Time Warner Cable, Inc., Sr. Unsec. Gtd. Global Notes, 6.75%, 07/01/2018 | | | 55,000 | | | | 60,258 | |
| | | | | | | | 423,556 | |
| | |
| Casinos & Gaming–0.10% | | | | | | | | |
Boyd Gaming Corp., Sr. Unsec. Gtd. Global Notes, 6.88%, 05/15/2023 | | | 6,000 | | | | 6,195 | |
MGM Resorts International, Sr. Unsec. Gtd. Notes, | | | | | | | | |
6.00%, 03/15/2023 | | | 3,000 | | | | 2,985 | |
7.75%, 03/15/2022 | | | 5,000 | | | | 5,325 | |
Mohegan Tribal Gaming Authority, Sr. Unsec. Gtd. Notes,
9.75%, 09/01/2021(b) | | | 2,000 | | | | 2,005 | |
| | | | | | | | 16,510 | |
| | |
| Catalog Retail–1.30% | | | | | | | | |
QVC, Inc., Sr. Sec. Gtd. First Lien Global Notes, | | | | | | | | |
4.45%, 02/15/2025 | | | 80,000 | | | | 74,339 | |
5.45%, 08/15/2034 | | | 150,000 | | | | 130,132 | |
| | | | | | | | 204,471 | |
| | |
| Commercial Printing–0.04% | | | | | | | | |
Multi-Color Corp., Sr. Unsec. Gtd. Notes, 6.13%, 12/01/2022(b) | | | 6,000 | | | | 5,978 | |
|
| Communications Equipment–0.03% | |
Hughes Satellite Systems Corp., Sr. Unsec. Gtd. Global Notes, 7.63%, 06/15/2021 | | | 5,000 | | | | 5,325 | |
|
| Computer & Electronics Retail–0.04% | |
Rent-A-Center, Inc., Sr. Unsec. Gtd. Global Notes, 4.75%, 05/01/2021 | | | 8,000 | | | | 5,980 | |
| | | | | | | | |
| | | Principal
Amount | | | Value | |
| Construction & Engineering–0.07% | |
AECOM, Sr. Unsec. Gtd. Global Notes, 5.75%, 10/15/2022 | | $ | 11,000 | | | $ | 11,315 | |
|
| Construction Machinery & Heavy Trucks–0.23% | |
Allied Specialty Vehicles, Inc., Sr. Sec. Notes, 8.50%, 11/01/2019(b) | | | 18,000 | | | | 18,382 | |
Meritor Inc., Sr. Unsec. Gtd. Notes, | | | | | | | | |
6.25%, 02/15/2024 | | | 3,000 | | | | 2,584 | |
6.75%, 06/15/2021 | | | 5,000 | | | | 4,625 | |
Navistar International Corp., Sr. Unsec. Gtd. Notes, 8.25%, 11/01/2021 | | | 16,000 | | | | 10,720 | |
| | | | | | | | 36,311 | |
| | |
| Construction Materials–0.06% | | | | | | | | |
CPG Merger Sub LLC, Sr. Unsec. Gtd. Notes, 8.00%, 10/01/2021(b) | | | 3,000 | | | | 2,959 | |
Unifrax I LLC/Unifrax Holding Co., Sr. Unsec. Gtd. Notes, 7.50%, 02/15/2019 (Acquired 03/27/2013-07/28/2014; Cost $7,190) (b) | | | 7,000 | | | | 6,230 | |
| | | | | | | | 9,189 | |
| | |
| Consumer Finance–1.11% | | | | | | | | |
Ally Financial Inc., | | | | | | | | |
Sr. Unsec. Global Notes, | | | | | | | | |
5.13%, 09/30/2024 | | | 3,000 | | | | 3,086 | |
Unsec. Sub. Global Notes, | | | | | | | | |
5.75%, 11/20/2025 | | | 2,000 | | | | 2,030 | |
Navient Corp., Sr. Unsec. Medium-Term Global Notes, 6.25%, 01/25/2016 | | | 75,000 | | | | 75,000 | |
Synchrony Financial, Sr. Unsec. Global Notes, 4.50%, 07/23/2025 | | | 95,000 | | | | 95,145 | |
| | | | | | | | 175,261 | |
|
| Data Processing & Outsourced Services–0.74% | |
Visa Inc., Sr. Unsec. Global Notes, | | | | | | | | |
3.15%, 12/14/2025 | | | 80,000 | | | | 80,304 | |
4.30%, 12/14/2045 | | | 35,000 | | | | 35,619 | |
| | | | | | | | 115,923 | |
| | |
| Department Stores–0.59% | | | | | | | | |
Kohl’s Corp., Sr. Unsec. Global Notes, 5.55%, 07/17/2045 | | | 100,000 | | | | 93,082 | |
| | |
| Diversified Banks–4.81% | | | | | | | | |
Bank of America Corp., Series Z, Jr. Unsec. Sub. Notes, 6.50%(c) | | | 85,000 | | | | 90,100 | |
BBVA Bancomer S.A. (Mexico), Unsec. Sub. Notes, 6.75%, 09/30/2022(b) | | | 150,000 | | | | 164,971 | |
Citigroup Inc., | | | | | | | | |
Series Q, Jr. Unsec. Sub. Global Notes, 5.95%(c) | | | 40,000 | | | | 40,100 | |
Series R, Jr. Unsec. Sub. Global Notes, 6.13%(c) | | | 65,000 | | | | 66,462 | |
Corp. Andina de Fomento (Supranational), Sr. Unsec. Global Notes,
4.38%, 06/15/2022 | | | 50,000 | | | | 53,257 | |
See accompanying Notes to Financial Statements which are an integral part of the financial statements.
Invesco V.I. Core Plus Bond Fund
| | | | | | | | |
| | | Principal
Amount | | | Value | |
| Diversified Banks–(continued) | | | | | | | | |
Crédit Agricole S.A. (France), Unsec. Sub. Notes, 4.38%, 03/17/2025(b) | | $ | 200,000 | | | $ | 193,654 | |
HSBC Holdings PLC (United Kingdom), Sr. Unsec. Global Notes,
4.00%, 03/30/2022 | | | 45,000 | | | | 47,356 | |
JPMorgan Chase & Co., Series V, Jr. Unsec. Sub. Global Notes, 5.00%(c) | | | 40,000 | | | | 38,200 | |
Wells Fargo & Co., Series U, Jr. Unsec. Sub. Global Notes, 5.88%(c) | | | 60,000 | | | | 63,000 | |
| | | | | | | | 757,100 | |
| | |
| Diversified Chemicals–1.27% | | | | | | | | |
Chemours Co. (The), Sr. Unsec. Notes, 6.63%, 05/15/2023(b) | | | 3,000 | | | | 2,145 | |
Solvay Finance America LLC (Belgium), Sr. Unsec. Gtd. Notes,
3.40%, 12/03/2020(b) | | | 200,000 | | | | 198,180 | |
| | | | | | | | 200,325 | |
| | |
| Diversified Metals & Mining–0.72% | | | | | | | | |
Lundin Mining Corp. (Canada), Sr. Sec. Gtd. First Lien Notes, 7.88%, 11/01/2022(b) | | | 33,000 | | | | 30,525 | |
Rio Tinto Finance USA Ltd. (United Kingdom), Sr. Unsec. Gtd. Global Notes, 7.13%, 07/15/2028 | | | 20,000 | | | | 24,034 | |
Teck Resources Ltd. (Canada), | | | | | | | | |
Sr. Unsec. Gtd. Global Notes, | | | | | | | | |
5.20%, 03/01/2042 | | | 35,000 | | | | 14,875 | |
Sr. Unsec. Gtd. Notes, | | | | | | | | |
4.50%, 01/15/2021 | | | 84,000 | | | | 43,470 | |
| | | | | | | | 112,904 | |
| | |
| Diversified REIT’s–1.25% | | | | | | | | |
Trust F/1401 (Mexico), Sr. Unsec. Notes, 5.25%, 01/30/2026(b) | | | 200,000 | | | | 196,058 | |
| | |
| Drug Retail–1.04% | | | | | | | | |
CVS Pass Through Trust, Sr. Sec. First Lien Mortgage Pass Through Ctfs., 5.77%, 01/10/2033(b) | | | 152,303 | | | | 164,239 | |
| | |
| Electric Utilities–1.24% | | | | | | | | |
Duke Energy Carolinas, LLC, Sr. Sec. First Mortgage Bonds, 3.90%, 06/15/2021 | | | 70,000 | | | | 74,394 | |
Electricite de France S.A. (France), Jr. Unsec. Sub. Notes, 5.63%(b)(c) | | | 100,000 | | | | 95,120 | |
Southern Power Co., Sr. Unsec. Global Notes, 4.15%, 12/01/2025 | | | 25,000 | | | | 25,008 | |
| | | | | | | | 194,522 | |
| |
| Electrical Components & Equipment–0.04% | | | | | |
Sensata Technologies B.V., Sr. Unsec. Gtd. Notes, 4.88%, 10/15/2023(b) | | | 7,000 | | | | 6,843 | |
|
| Environmental & Facilities Services–0.05% | |
ADS Waste Holdings, Inc., Sr. Unsec. Gtd. Global Notes, 8.25%, 10/01/2020 | | | 8,000 | | | | 8,100 | |
| | | | | | | | |
| | | Principal
Amount | | | Value | |
| Forest Products–0.06% | | | | | | | | |
Norbord Inc. (Canada), | | | | | | | | |
Sr. Sec. First Lien Notes, | | | | | | | | |
5.38%, 12/01/2020(b) | | $ | 8,000 | | | $ | 8,080 | |
Sr. Sec. Gtd. First Lien Notes, | | | | | | | | |
6.25%, 04/15/2023(b) | | | 2,000 | | | | 1,980 | |
| | | | | | | | 10,060 | |
| | |
| Gas Utilities–0.03% | | | | | | | | |
Ferrellgas L.P./Ferrellgas Finance Corp., | | | | | | | | |
Sr. Unsec. Global Notes, | | | | | | | | |
6.75%, 01/15/2022 | | | 3,000 | | | | 2,535 | |
Sr. Unsec. Gtd. Notes, | | | | | | | | |
6.75%, 06/15/2023(b) | | | 3,000 | | | | 2,490 | |
| | | | | | | | 5,025 | |
| | |
| Gold–0.33% | | | | | | | | |
Kinross Gold Corp. (Canada), Sr. Unsec. Gtd. Global Notes, 5.95%, 03/15/2024 | | | 75,000 | | | | 52,078 | |
| | |
| Health Care Equipment–0.29% | | | | | | | | |
Becton, Dickinson and Co., Sr. Unsec. Global Bonds, 4.88%, 05/15/2044 | | | 45,000 | | | | 45,618 | |
| | |
| Health Care Facilities–0.30% | | | | | | | | |
Acadia Healthcare Co., Inc., Sr. Unsec. Gtd. Global Notes, 5.63%, 02/15/2023 | | | 9,000 | | | | 8,550 | |
Community Health Systems, Inc., Sr. Unsec. Gtd. Global Notes, 6.88%, 02/01/2022 | | | 2,917 | | | | 2,775 | |
HCA, Inc., | | | | | | | | |
Sr. Sec. Gtd. First Lien Global Notes, | | | | | | | | |
5.88%, 03/15/2022 | | | 9,000 | | | | 9,537 | |
6.50%, 02/15/2020 | | | 19,000 | | | | 20,746 | |
Sr. Sec. Gtd. First Lien Notes, | | | | | | | | |
5.25%, 04/15/2025 | | | 4,000 | | | | 4,045 | |
HealthSouth Corp., Sr. Unsec. Gtd. Notes, 5.75%, 09/15/2025(b) | | | 2,000 | | | | 1,880 | |
| | | | | | | | 47,533 | |
| | |
| Health Care REIT’s–0.58% | | | | | | | | |
HCP, Inc., Sr. Unsec. Global Notes, 4.00%, 12/01/2022 | | | 46,000 | | | | 45,765 | |
Senior Housing Properties Trust, Sr. Unsec. Notes, 6.75%, 12/15/2021 | | | 40,000 | | | | 45,126 | |
| | | | | | | | 90,891 | |
| | |
| Health Care Services–0.27% | | | | | | | | |
MPH Acquisition Holdings LLC, Sr. Unsec. Gtd. Notes, 6.63%, 04/01/2022(b) | | | 7,000 | | | | 7,052 | |
Orlando Lutheran Towers Inc., Unsec. Bonds, 8.00%, 07/01/2017 | | | 35,000 | | | | 35,279 | |
| | | | | | | | 42,331 | |
| | |
| Homebuilding–1.33% | | | | | | | | |
AV Homes, Inc., Sr. Unsec. Gtd. Global Notes, 8.50%, 07/01/2019 | | | 5,000 | | | | 5,000 | |
Beazer Homes USA Inc., Sr. Unsec. Gtd. Global Notes, 7.50%, 09/15/2021 | | | 20,000 | | | | 18,425 | |
CalAtlantic Group Inc., Sr. Unsec. Gtd. Notes, 5.38%, 10/01/2022 | | | 10,000 | | | | 10,087 | |
See accompanying Notes to Financial Statements which are an integral part of the financial statements.
Invesco V.I. Core Plus Bond Fund
| | | | | | | | |
| | | Principal
Amount | | | Value | |
| Homebuilding–(continued) | | | | | | | | |
K. Hovnanian Enterprises Inc., | | | | | | | | |
Sr. Sec. Gtd. First Lien Notes, | | | | | | | | |
7.25%, 10/15/2020(b) | | $ | 6,000 | | | $ | 5,138 | |
Sr. Unsec. Gtd. Notes, | | | | | | | | |
7.00%, 01/15/2019(b) | | | 10,000 | | | | 6,500 | |
8.00%, 11/01/2019(b) | | | 4,000 | | | | 2,515 | |
KB Home, Sr. Unsec. Gtd. Notes, 7.00%, 12/15/2021 | | | 4,000 | | | | 3,960 | |
Lennar Corp., Sr. Unsec. Gtd. Notes, 4.88%, 12/15/2023 | | | 8,000 | | | | 7,990 | |
MDC Holdings, Inc., Sr. Unsec. Gtd. Notes, 6.00%, 01/15/2043 | | | 165,000 | | | | 130,724 | |
Meritage Homes Corp., Sr. Unsec. Gtd. Global Notes, | | | | | | | | |
6.00%, 06/01/2025 | | | 3,000 | | | | 3,004 | |
7.15%, 04/15/2020 | | | 2,000 | | | | 2,118 | |
Shea Homes L.P./Shea Homes Funding Corp., Sr. Unsec. Gtd. Notes,
5.88%, 04/01/2023(b) | | | 2,000 | | | | 2,060 | |
Toll Brothers Finance Corp., Sr. Unsec. Gtd. Notes, 4.88%, 11/15/2025 | | | 12,000 | | | | 11,850 | |
| | | | | | | | 209,371 | |
| | |
| Hotel and Resort REIT’s–0.22% | | | | | | | | |
Host Hotels & Resorts L.P., Series F, Sr. Unsec. Global Notes, 4.50%, 02/01/2026 | | | 35,000 | | | | 34,623 | |
| |
| Hotels, Resorts & Cruise Lines–0.70% | | | | | |
Carnival Corp., Sr. Unsec. Gtd. Global Notes, 3.95%, 10/15/2020 | | | 60,000 | | | | 63,315 | |
Choice Hotels International, Inc., Sr. Unsec. Gtd. Notes, 5.75%, 07/01/2022 | | | 4,000 | | | | 4,294 | |
Marriott International, Inc., Sr. Unsec. Global Notes, 3.75%, 10/01/2025 | | | 21,000 | | | | 20,653 | |
Wyndham Worldwide Corp., Sr. Unsec. Notes, 5.10%, 10/01/2025 | | | 21,000 | | | | 21,247 | |
| | | | | | | | 109,509 | |
| | |
| Household Products–0.05% | | | | | | | | |
Springs Industries, Inc., Sr. Sec. Global Notes, 6.25%, 06/01/2021 | | | 8,000 | | | | 7,970 | |
|
| Independent Power Producers & Energy Traders–0.05% | |
Calpine Corp., | | | | | | | | |
Sr. Sec. Gtd. First Lien Notes, | | | | | | | | |
5.88%, 01/15/2024(b) | | | 2,000 | | | | 2,060 | |
Sr. Unsec. Global Notes, | | | | | | | | |
5.50%, 02/01/2024 | | | 6,000 | | | | 5,325 | |
| | | | | | | | 7,385 | |
| | |
| Industrial Machinery–0.43% | | | | | | | | |
Optimas OE Solutions Holding, LLC/Optimas OE Solutions, Inc., Sr. Sec. Notes, 8.63%, 06/01/2021(b) | | | 5,000 | | | | 4,275 | |
Valmont Industries, Inc., Sr. Unsec. Gtd. Global Notes, 5.25%, 10/01/2054 | | | 75,000 | | | | 64,141 | |
| | | | | | | | 68,416 | |
| | | | | | | | |
| | | Principal
Amount | | | Value | |
| Industrial REIT’s–1.24% | | | | | | | | |
PLA Administradora Industrial, S. de R.L. de C.V. (Mexico), Sr. Unsec. Notes, 5.25%, 11/10/2022(b) | | $ | 200,000 | | | $ | 194,437 | |
| | |
| Integrated Oil & Gas–0.06% | | | | | | | | |
Ecopetrol S.A. (Colombia), Sr. Unsec. Global Notes, 4.13%, 01/16/2025 | | | 6,000 | | | | 4,815 | |
YPF S.A. (Argentina), REGS, Sr. Unsec. Euro Notes, 8.50%, 07/28/2025(b) | | | 5,000 | | | | 4,788 | |
| | | | | | | | 9,603 | |
|
| Integrated Telecommunication Services–1.76% | |
AT&T Inc., Sr. Unsec. Global Notes, 4.75%, 05/15/2046 | | | 44,000 | | | | 40,453 | |
DIRECTV Holdings LLC/DIRECTV Financing Co., Inc., Sr. Unsec. Gtd. Notes, 4.45%, 04/01/2024 | | | 30,000 | | | | 30,800 | |
Frontier Communications Corp., Sr. Unsec. Notes, 8.88%, 09/15/2020(b) | | | 2,000 | | | | 2,033 | |
T-Mobile USA, Inc., | | | | | | | | |
Sr. Unsec. Gtd. Global Bonds, | | | | | | | | |
6.84%, 04/28/2023 | | | 2,000 | | | | 2,077 | |
Sr. Unsec. Gtd. Global Notes, | | | | | | | | |
6.38%, 03/01/2025 | | | 20,000 | | | | 20,275 | |
Telefonica Emisiones S.A.U. (Spain), Sr. Unsec. Gtd. Global Notes, 5.46%, 02/16/2021 | | | 90,000 | | | | 100,628 | |
Verizon Communications Inc., Sr. Unsec. Global Notes, | | | | | | | | |
5.01%, 08/21/2054 | | | 58,000 | | | | 53,348 | |
5.15%, 09/15/2023 | | | 25,000 | | | | 27,467 | |
| | | | | | | | 277,081 | |
| | |
| Internet Retail–0.41% | | | | | | | | |
Expedia, Inc., Sr. Unsec. Gtd. Notes, 5.00%, 02/15/2026(b) | | | 65,000 | | | | 63,849 | |
|
| Internet Software & Services–1.24% | |
Alibaba Group Holding Ltd. (China), Sr. Unsec. Gtd. Global Notes, 3.13%, 11/28/2021 | | | 200,000 | | | | 194,906 | |
|
| Investment Banking & Brokerage–1.42% | |
Cantor Fitzgerald, L.P., Unsec. Notes, 6.50%, 06/17/2022(b) | | | 34,000 | | | | 35,320 | |
Charles Schwab Corp. (The), Series A, Jr. Unsec. Sub. Notes, 7.00%(c) | | | 45,000 | | | | 51,356 | |
Goldman Sachs Group, Inc. (The), Series L, Jr. Unsec. Sub. Notes, 5.70%(c) | | | 55,000 | | | | 54,725 | |
Stifel Financial Corp., Sr. Unsec. Notes, 3.50%, 12/01/2020 | | | 83,000 | | | | 81,918 | |
| | | | | 223,319 | |
| |
| IT Consulting & Other Services–0.20% | | | | | |
Computer Sciences Corp., Sr. Unsec. Global Notes, 4.45%, 09/15/2022 | | | 30,000 | | | | 30,846 | |
| | |
| Leisure Products–0.02% | | | | | | | | |
Party City Holdings Inc., Sr. Unsec. Gtd. Notes, 6.13%, 08/15/2023(b) | | | 4,000 | | | | 3,895 | |
See accompanying Notes to Financial Statements which are an integral part of the financial statements.
Invesco V.I. Core Plus Bond Fund
| | | | | | | | |
| | | Principal
Amount | | | Value | |
| Life & Health Insurance–2.85% | | | | | | | | |
MetLife, Inc., Series C, Jr. Unsec. Sub. Global Notes, 5.25%(c) | | $ | 65,000 | | | $ | 65,650 | |
Nationwide Financial Services, Inc., Sr. Unsec. Notes, 5.38%, 03/25/2021(b) | | | 165,000 | | | | 180,677 | |
Prudential Financial, Inc., Jr. Unsec. Sub. Global Notes, 8.88%, 06/15/2038 | | | 130,000 | | | | 146,900 | |
TIAA Asset Management Finance Co. LLC, Sr. Unsec. Notes, 4.13%, 11/01/2024(b) | | | 55,000 | | | | 55,362 | |
| | | | | 448,589 | |
| |
| Life Sciences Tools & Services–0.01% | | | | | |
Quintiles Transnational Corp., Sr. Unsec. Gtd. Notes, 4.88%, 05/15/2023(b) | | | 2,000 | | | | 2,020 | |
| | |
| Managed Health Care–0.96% | | | | | | | | |
Cigna Corp., Sr. Unsec. Notes, 4.50%, 03/15/2021 | | | 45,000 | | | | 47,790 | |
UnitedHealth Group Inc., Sr. Unsec. Global Notes, 3.75%, 07/15/2025 | | | 100,000 | | | | 103,197 | |
| | | | | 150,987 | |
| | |
| Marine–0.08% | | | | | | | | |
Navios Maritime Acquisition Corp./Navios Acquisition Finance U.S. Inc., Sr. Sec. Gtd. First Lien Mortgage Notes, 8.13%, 11/15/2021 (Acquired 10/29/2013-07/16/2015; Cost $14,255)(b) | | | 14,000 | | | | 12,285 | |
|
| Metal & Glass Containers–0.24% | |
Ball Corp., Sr. Unsec. Gtd. Global Notes, 4.38%, 12/15/2020 | | | 24,000 | | | | 24,480 | |
Berry Plastics Corp., Sec. Gtd. Second Lien Notes, | | | | | | | | |
5.50%, 05/15/2022 | | | 10,000 | | | | 9,975 | |
6.00%, 10/15/2022(b) | | | 3,000 | | | | 3,068 | |
| | | | | | | | 37,523 | |
|
| Movies & Entertainment–0.03% | |
Mediacom Broadband LLC/Corp., Sr. Unsec. Gtd. Global Notes, 5.50%, 04/15/2021 | | | 5,000 | | | | 4,838 | |
|
| Multi-Line Insurance–3.17% | |
American Financial Group, Inc., Sr. Unsec. Notes, 9.88%, 06/15/2019 | | | 180,000 | | | | 218,505 | |
CNA Financial Corp., Sr. Unsec. Notes, 7.35%, 11/15/2019 | | | 160,000 | | | | 185,024 | |
Nationwide Mutual Insurance Co., Unsec. Sub. Notes, 4.95%, 04/22/2044(b) | | | 100,000 | | | | 96,229 | |
| | | | | | | | 499,758 | |
|
| Multi-Sector Holdings–0.45% | |
BNSF Railway Co. Pass Through Trust, Series 2015-1, Sr. Sec. First Lien Pass-Through Ctfs., 3.44%, 06/16/2028(b) | | | 72,608 | | | | 70,155 | |
|
| Multi-Utilities–0.37% | |
Enable Midstream Partners L.P., Sr. Unsec. Gtd. Global Notes, 3.90%, 05/15/2024 | | | 75,000 | | | | 58,827 | |
| | | | | | | | |
| | | Principal
Amount | | | Value | |
| Office REIT’s–0.29% | |
Piedmont Operating Partnership L.P., Sr. Unsec. Gtd. Global Notes, 4.45%, 03/15/2024 | | $ | 45,000 | | | $ | 45,135 | |
|
| Office Services & Supplies–0.66% | |
Pitney Bowes Inc., Sr. Unsec. Global Notes, 4.63%, 03/15/2024 | | | 35,000 | | | | 34,482 | |
Steelcase, Inc., Sr. Unsec. Global Bonds, 6.38%, 02/15/2021 | | | 63,000 | | | | 69,015 | |
| | | | | | | | 103,497 | |
|
| Oil & Gas Drilling–0.23% | |
Rowan Cos., Inc., Sr. Unsec. Gtd. Notes, 5.85%, 01/15/2044 | | | 61,000 | | | | 36,857 | |
|
| Oil & Gas Equipment & Services–0.25% | |
Petrofac Ltd. (United Kingdom), Sr. Unsec. Gtd. Notes, 3.40%, 10/10/2018(b) | | | 41,000 | | | | 39,042 | |
|
| Oil & Gas Exploration & Production–0.27% | |
Antero Resources Corp., Sr. Unsec. Gtd. Global Notes, 6.00%, 12/01/2020 | | | 3,000 | | | | 2,535 | |
Chaparral Energy, Inc., Sr. Unsec. Gtd. Global Notes, 9.88%, 10/01/2020 | | | 10,000 | | | | 2,525 | |
Concho Resources Inc., Sr. Unsec. Gtd. Global Notes, 5.50%, 10/01/2022 | | | 4,000 | | | | 3,700 | |
Denbury Resources Inc., Sr. Unsec. Gtd. Sub. Notes, 5.50%, 05/01/2022 | | | 5,000 | | | | 1,675 | |
Gulfport Energy Corp., Sr. Unsec. Gtd. Global Notes, 6.63%, 05/01/2023 | | | 4,000 | | | | 3,360 | |
Laredo Petroleum, Inc., Sr. Unsec. Gtd. Global Notes, 7.38%, 05/01/2022 | | | 5,000 | | | | 4,625 | |
Parsley Energy LLC/Parsley Finance Corp., Sr. Unsec. Notes, 7.50%, 02/15/2022(b) | | | 8,000 | | | | 7,720 | |
Range Resources Corp., Sr. Unsec. Gtd. Sub. Notes, 5.00%, 08/15/2022 | | | 10,000 | | | | 7,525 | |
SM Energy Co., Sr. Unsec. Global Notes, 6.50%, 11/15/2021 | | | 11,000 | | | | 8,360 | |
| | | | | | | | 42,025 | |
|
| Oil & Gas Storage & Transportation–2.38% | |
Energy Transfer Partners, L.P.,
Sr. Unsec. Global Notes, 4.65%, 06/01/2021 | | | 26,000 | | | | 24,430 | |
Sr. Unsec. Notes, 5.15%, 03/15/2045 | | | 51,000 | | | | 36,391 | |
Enterprise Products Operating LLC, Sr. Unsec. Gtd. Notes, 3.75%, 02/15/2025 | | | 74,000 | | | | 67,524 | |
EQT Midstream Partners L.P., Sr. Unsec. Gtd. Notes, 4.00%, 08/01/2024 | | | 65,000 | | | | 53,676 | |
Kinder Morgan Energy Partners, L.P., Sr. Unsec. Gtd. Notes, 5.40%, 09/01/2044 | | | 74,000 | | | | 56,164 | |
Spectra Energy Partners, L.P.,
Sr. Unsec. Global Notes, 3.50%, 03/15/2025 | | | 59,000 | | | | 51,919 | |
4.50%, 03/15/2045 | | | 48,000 | | | | 37,019 | |
Targa Resources Partners L.P./Targa Resources Partners Finance Corp., Sr. Unsec. Gtd. Global Notes, 6.88%, 02/01/2021 | | | 4,000 | | | | 3,580 | |
See accompanying Notes to Financial Statements which are an integral part of the financial statements.
Invesco V.I. Core Plus Bond Fund
| | | | | | | | |
| | | Principal
Amount | | | Value | |
| Oil & Gas Storage & Transportation–(continued) | |
Teekay Offshore Partners L.P./Teekay Offshore Finance Corp. (Bermuda), Sr. Unsec. Global Notes, 6.00%, 07/30/2019 | | $ | 3,000 | | | $ | 1,995 | |
Williams Partners L.P., Sr. Unsec. Global Notes, 5.10%, 09/15/2045 | | | 37,000 | | | | 24,424 | |
Williams Partners L.P./ACMP Finance Corp., Sr. Unsec. Global Notes, 4.88%, 05/15/2023 | | | 21,000 | | | | 16,958 | |
| | | | | | | | 374,080 | |
|
| Other Diversified Financial Services–1.22% | |
ERAC USA Finance LLC, Sr. Unsec. Gtd. Notes, 3.80%, 11/01/2025(b) | | | 29,000 | | | | 28,659 | |
Football Trust V, Sec. Pass Through Ctfs., 5.35%, 10/05/2020(b) | | | 100,000 | | | | 109,231 | |
Voya Financial, Inc., Jr. Unsec. Gtd. Sub. Global Notes, 5.65%, 05/15/2053 | | | 55,000 | | | | 54,175 | |
| | | | | | | | 192,065 | |
|
| Packaged Foods & Meats–0.63% | |
Diamond Foods Inc., Sr. Unsec. Gtd. Notes, 7.00%, 03/15/2019(b) | | | 92,000 | | | | 95,105 | |
Smithfield Foods Inc., Sr. Unsec. Notes, 6.63%, 08/15/2022 | | | 4,000 | | | | 4,210 | |
| | | | | | | | 99,315 | |
|
| Paper Packaging–1.15% | |
Graphic Packaging International Inc., Sr. Unsec. Gtd. Notes, 4.88%, 11/15/2022 | | | 2,000 | | | | 2,037 | |
Klabin Finance S.A. (Brazil), Sr. Unsec. Gtd. Notes, 5.25%, 07/16/2024(b) | | | 200,000 | | | | 178,625 | |
| | | | | | | | 180,662 | |
|
| Paper Products–0.12% | |
Clearwater Paper Corp.,
Sr. Unsec. Gtd. Global Notes, 4.50%, 02/01/2023 | | | 12,000 | | | | 11,340 | |
Sr. Unsec. Gtd. Notes, 5.38%, 02/01/2025(b) | | | 3,000 | | | | 2,895 | |
Mercer International Inc. (Canada), Sr. Unsec. Gtd. Global Notes, 7.00%, 12/01/2019 | | | 5,000 | | | | 5,025 | |
| | | | | | | | 19,260 | |
|
| Pharmaceuticals–1.07% | |
Bristol-Myers Squibb Co., Sr. Unsec. Deb., 6.88%, 08/01/2097 | | | 74,000 | | | | 103,134 | |
Valeant Pharmaceuticals International, Inc., Sr. Unsec. Gtd. Notes, 5.50%, 03/01/2023(b) | | | 10,000 | | | | 8,900 | |
5.63%, 12/01/2021(b) | | | 9,000 | | | | 8,370 | |
5.88%, 05/15/2023(b) | | | 3,000 | | | | 2,700 | |
6.13%, 04/15/2025(b) | | | 5,000 | | | | 4,500 | |
Zoetis, Inc., Sr. Unsec. Global Notes, 4.50%, 11/13/2025 | | | 40,000 | | | | 40,651 | |
| | | | | | | | 168,255 | |
|
| Property & Casualty Insurance–1.11% | |
Allstate Corp. (The), Unsec. Sub. Global Deb., 5.75%, 08/15/2053 | | | 75,000 | | | | 77,250 | |
| | | | | | | | |
| | | Principal
Amount | | | Value | |
| Property & Casualty Insurance–(continued) | |
Liberty Mutual Group Inc., Jr. Unsec. Gtd. Sub. Bonds, 7.80%, 03/15/2037(b) | | $ | 45,000 | | | $ | 51,525 | |
W.R. Berkley Corp., Sr. Unsec. Notes, 7.38%, 09/15/2019 | | | 40,000 | | | | 46,430 | |
| | | | | | | | 175,205 | |
|
| Regional Banks–0.95% | |
CIT Group Inc., Sr. Unsec. Global Notes, 5.00%, 08/15/2022 | | | 8,000 | | | | 8,180 | |
5.00%, 08/01/2023 | | | 2,000 | | | | 2,040 | |
Fifth Third Bancorp,
Unsec. Sub. Notes, 4.30%, 01/16/2024 | | | 55,000 | | | | 56,542 | |
Series J, Jr. Unsec. Sub. Bonds,
4.90%(c) | | | 45,000 | | | | 41,400 | |
First Niagara Financial Group Inc., Unsec. Sub. Notes, 7.25%, 12/15/2021 | | | 35,000 | | | | 41,106 | |
| | | | | | | | 149,268 | |
|
| Reinsurance–0.40% | |
Reinsurance Group of America, Inc., Sr. Unsec. Medium-Term Notes, 4.70%, 09/15/2023 | | | 60,000 | | | | 63,446 | |
|
| Renewable Electricity–0.22% | |
Oglethorpe Power Corp., Sr. Sec. First Mortgage Bonds, 4.55%, 06/01/2044 | | | 36,000 | | | | 34,259 | |
|
| Residential REIT’s–0.73% | |
Essex Portfolio L.P., Sr. Unsec. Gtd. Global Notes, 3.63%, 08/15/2022 | | | 115,000 | | | | 114,929 | |
|
| Restaurants–0.68% | |
1011778 BC ULC/ New Red Finance, Inc. (Canada), Sec. Gtd. Second Lien Notes, 6.00%, 04/01/2022(b) | | | 104,000 | | | | 107,510 | |
|
| Security & Alarm Services–0.19% | |
ADT Corp. (The), Sr. Unsec. Global Notes, 6.25%, 10/15/2021 | | | 7,000 | | | | 7,385 | |
Tyco International Finance S.A., Sr. Unsec. Gtd. Global Notes, 3.90%, 02/14/2026 | | | 23,000 | | | | 22,990 | |
| | | | | | | | 30,375 | |
|
| Semiconductors–1.32% | |
NXP B.V./NXP Funding LLC (Netherlands), Sr. Unsec. Gtd. Notes, 5.75%, 03/15/2023(b) | | | 200,000 | | | | 207,500 | |
|
| Soft Drinks–0.85% | |
Coca-Cola Co. (The), Sr. Unsec. Global Notes, 3.30%, 09/01/2021 | | | 59,000 | | | | 61,684 | |
PepsiCo Inc., Sr. Unsec. Global Notes, 3.00%, 08/25/2021 | | | 70,000 | | | | 71,778 | |
| | | | | | | | 133,462 | |
|
| Sovereign Debt–0.41% | |
Argentina Bonar Bonds (Argentina), Series X, Sr. Unsec. Bonds, 7.00%, 04/17/2017 | | | 5,000 | | | | 5,143 | |
Peruvian Government International Bond (Peru), Sr. Unsec. Global Bonds, 4.13%, 08/25/2027 | | | 8,000 | | | | 7,912 | |
See accompanying Notes to Financial Statements which are an integral part of the financial statements.
Invesco V.I. Core Plus Bond Fund
| | | | | | | | |
| | | Principal
Amount | | | Value | |
| Sovereign Debt–(continued) | |
Uruguay Government International Bond (Uruguay), Sr. Unsec. Global Bonds, 5.10%, 06/18/2050 | | $ | 60,000 | | | $ | 51,900 | |
| | | | | | | | 64,955 | |
|
| Specialized Finance–3.06% | |
Air Lease Corp., Sr. Unsec. Global Notes, 3.88%, 04/01/2021 | | | 85,000 | | | | 85,584 | |
Aircastle Ltd., Sr. Unsec. Notes, 5.13%, 03/15/2021 | | | 6,000 | | | | 6,217 | |
5.50%, 02/15/2022 | | | 7,000 | | | | 7,210 | |
International Lease Finance Corp., Sr. Unsec. Global Notes, 5.88%, 08/15/2022 | | | 10,000 | | | | 10,775 | |
Moody’s Corp.,
Sr. Unsec. Global Bonds, 5.50%, 09/01/2020 | | | 110,000 | | | | 121,335 | |
Sr. Unsec. Global Notes, 2.75%, 07/15/2019 | | | 45,000 | | | | 45,494 | |
4.88%, 02/15/2024 | | | 158,000 | | | | 168,784 | |
5.25%, 07/15/2044 | | | 35,000 | | | | 36,183 | |
| | | | | | | | 481,582 | |
|
| Specialized REIT’s–2.47% | |
Crown Castle International Corp.,
Sr. Unsec. Global Notes, 5.25%, 01/15/2023 | | | 9,000 | | | | 9,506 | |
Sr. Unsec. Notes, 4.88%, 04/15/2022 | | | 9,000 | | | | 9,371 | |
CyrusOne L.P./CyrusOne Finance Corp., Sr. Unsec. Gtd. Global Notes, 6.38%, 11/15/2022 | | | 6,000 | | | | 6,210 | |
EPR Properties,
Sr. Unsec. Gtd. Global Notes, 4.50%, 04/01/2025 | | | 43,000 | | | | 41,039 | |
7.75%, 07/15/2020 | | | 253,000 | | | | 294,603 | |
Sr. Unsec. Gtd. Notes, 5.75%, 08/15/2022 | | | 20,000 | | | | 21,024 | |
Equinix Inc., Sr. Unsec. Notes, 5.38%, 01/01/2022 | | | 5,000 | | | | 5,175 | |
5.38%, 04/01/2023 | | | 2,000 | | | | 2,050 | |
| | | | | | | | 388,978 | |
|
| Specialty Stores–0.18% | |
Tiffany & Co., Sr. Unsec. Global Notes, 3.80%, 10/01/2024 | | | 29,000 | | | | 28,585 | |
|
| Steel–0.08% | |
FMG Resources (August 2006) Pty. Ltd. (Australia), Sr. Unsec. Gtd. Notes, 8.25%, 11/01/2019(b) | | | 4,000 | | | | 3,220 | |
Steel Dynamics, Inc., Sr. Unsec. Gtd. Global Notes,
5.13%, 10/01/2021 | | | 2,000 | | | | 1,863 | |
5.50%, 10/01/2024 | | | 9,000 | | | | 8,257 | |
| | | | | | | | 13,340 | |
| | | | | | | | |
| | | Principal
Amount | | | Value | |
| Technology Hardware, Storage & Peripherals–0.41% | |
Seagate HDD Cayman,
Sr. Unsec. Gtd. Global Bonds, 4.75%, 01/01/2025 | | $ | 45,000 | | | $ | 37,687 | |
Sr. Unsec. Gtd. Notes, 5.75%, 12/01/2034(b) | | | 38,000 | | | | 27,170 | |
| | | | | | | | 64,857 | |
|
| Tobacco–0.91% | |
Altria Group, Inc., Sr. Unsec. Gtd. Global Notes, 4.75%, 05/05/2021 | | | 55,000 | | | | 59,810 | |
Philip Morris International Inc., Sr. Unsec. Global Notes, 2.90%, 11/15/2021 | | | 82,000 | | | | 82,911 | |
| | | | | | | | 142,721 | |
|
| Trading Companies & Distributors–0.03% | |
United Rentals North America Inc., Sr. Unsec. Gtd. Notes, 6.13%, 06/15/2023 | | | 5,000 | | | | 5,131 | |
|
| Trucking–0.28% | |
OPE KAG Finance Sub Inc., Sr. Unsec. Notes, 7.88%, 07/31/2023(b) | | | 5,000 | | | | 4,994 | |
Penske Truck Leasing Co., L.P./PTL Finance Corp., Sr. Unsec. Notes, 3.20%, 07/15/2020(b) | | | 39,000 | | | | 38,815 | |
| | | | | | | | 43,809 | |
|
| Wireless Telecommunication Services–1.50% | |
Crown Castle Towers LLC, Sr. Sec. Gtd. First Lien Notes,
4.88%, 08/15/2020(b) | | | 120,000 | | | | 128,407 | |
Rogers Communications Inc. (Canada),
Sr. Unsec. Gtd. Global Notes, 3.00%, 03/15/2023 | | | 50,000 | | | | 48,810 | |
4.50%, 03/15/2043 | | | 30,000 | | | | 28,129 | |
Sprint Communications Inc.,
Sr. Unsec. Global Notes,
11.50%, 11/15/2021 | | | 4,000 | | | | 3,710 | |
Sr. Unsec. Gtd. Notes, 7.00%, 03/01/2020(b) | | | 27,000 | | | | 27,270 | |
| | | | | | | | 236,326 | |
Total Bonds and Notes (Cost $10,552,084) | | | | | | | 10,432,624 | |
|
U.S. Government Sponsored Agency Mortgage-Backed Securities–26.63% | |
| Collateralized Mortgage Obligations–0.57% | |
Ginnie Mae REMICs, IO, 1.59%, 09/20/2064(d) | | | 326,081 | | | | 31,386 | |
1.68%, 12/20/2064(d) | | | 549,653 | | | | 58,208 | |
| | | | | | | | 89,594 | |
|
| Federal Home Loan Mortgage Corp. (FHLMC)–8.18% | |
Pass Through Ctfs.,
6.50%, 05/01/2016 to 08/01/2032 | | | 2,479 | | | | 2,821 | |
6.00%, 05/01/2017 to 12/01/2031 | | | 28,441 | | | | 31,846 | |
5.50%, 09/01/2017 | | | 2,352 | | | | 2,405 | |
Pass Through Ctfs., TBA, 3.50%, 01/01/2046(e) | | | 240,000 | | | | 247,071 | |
4.00%, 01/01/2046(e) | | | 950,000 | | | | 1,003,641 | |
| | | | | | | | 1,287,784 | |
See accompanying Notes to Financial Statements which are an integral part of the financial statements.
Invesco V.I. Core Plus Bond Fund
| | | | | | | | |
| | | Principal
Amount | | | Value | |
| Federal National Mortgage Association (FNMA)–15.82% | |
Pass Through Ctfs.,
7.00%, 02/01/2016 to 09/01/2032 | | $ | 11,270 | | | $ | 11,910 | |
6.50%, 05/01/2016 to 09/01/2031 | | | 1,454 | | | | 1,669 | |
5.00%, 11/01/2018 | | | 5,804 | | | | 6,039 | |
7.50%, 04/01/2029 | | | 3,605 | | | | 4,041 | |
8.00%, 04/01/2032 | | | 1,208 | | | | 1,214 | |
Pass Through Ctfs., TBA, 2.50%, 01/01/2031(e) | | | 206,000 | | | | 207,644 | |
3.00%, 01/01/2031 to 01/01/2046(e) | | | 874,000 | | | | 879,500 | |
3.50%, 01/01/2046(e) | | | 709,000 | | | | 731,547 | |
4.50%, 01/01/2046(e) | | | 600,000 | | | | 648,019 | |
| | | | | | | | 2,491,583 | |
|
Government National Mortgage Association
(GNMA)–2.06% | |
Pass Through Ctfs.,
7.50%, 06/15/2023 | | | 3,279 | | | | 3,566 | |
8.50%, 11/15/2024 | | | 1,196 | | | | 1,201 | |
7.00%, 07/15/2031 to 08/15/2031 | | | 1,342 | | | | 1,557 | |
6.50%, 11/15/2031 to 03/15/2032 | | | 2,797 | | | | 3,202 | |
6.00%, 11/15/2032 | | | 1,303 | | | | 1,504 | |
Pass Through Ctfs., TBA, 3.50%, 01/01/2046(e) | | | 300,000 | | | | 312,762 | |
| | | | | | | | 323,792 | |
Total U.S. Government Sponsored Agency Mortgage-Backed Securities (Cost $4,207,206) | | | | | | | 4,192,753 | |
|
U.S. Treasury Securities–12.73% | |
| U.S. Treasury Bills–0.63%(f) | |
0.25%, 05/26/2016(g) | | | 15,000 | | | | 14,977 | |
0.29%, 05/26/2016(g) | | | 85,000 | | | | 84,868 | |
| | | | | | | | 99,845 | |
|
| U.S. Treasury Notes–7.72% | |
1.63%, 11/30/2020 | | | 255,000 | | | | 253,556 | |
2.00%, 11/30/2022 | | | 265,000 | | | | 263,510 | |
2.25%, 11/15/2025 | | | 699,700 | | | | 697,995 | |
| | | | | | | | 1,215,061 | |
|
| U.S. Treasury Bonds–4.38% | |
2.88%, 08/15/2045 | | | 710,600 | | | | 689,229 | |
Total U.S. Treasury Securities (Cost $2,005,879) | | | | | | | 2,004,135 | |
|
Asset-Backed Securities–9.04% | |
Adjustable Rate Mortgage Trust, Series 2004-2, Class 6A1, Floating Rate Pass Through Ctfs., 2.65%, 02/25/2035(d) | | | 22,972 | | | | 22,971 | |
Banc of America Commercial Mortgage Trust, Series 2015-UBS7, Class AS, Pass Through Ctfs., 3.99%, 09/15/2048 | | | 70,000 | | | | 71,679 | |
Barclays Bank Commercial Mortgage Securities Trust, Series 2015-RRI, Class D, Floating Rate Pass Through Ctfs., 3.23%, 05/15/2032(b)(d) | | | 230,000 | | | | 226,587 | |
| | | | | | | | |
| | | Principal
Amount | | | Value | |
Bear Stearns Adjustable Rate Mortgage Trust, Series 2005-2, Class A1, Floating Rate Pass Through Ctfs., 2.68%, 03/25/2035(d) | | $ | 119,700 | | | $ | 120,237 | |
Commercial Mortgage Trust, Series 2015-CR23, Class CMB, Variable Rate Pass Through Ctfs., 3.81%, 04/10/2030(b)(d) | | | 150,000 | | | | 152,204 | |
Series 2015-CR25, Class B, Variable Rate Pass Through Ctfs., 4.70%, 08/10/2048(d) | | | 72,000 | | | | 74,627 | |
Credit Suisse Mortgage Trust, Series 2009-2R, Class 1A11, Floating Rate Pass Through Ctfs., 2.74%, 09/26/2034(b)(d) | | | 9,345 | | | | 9,368 | |
GMACM Mortgage Loan Trust, Series 2006-AR1, Class 1A1, Floating Rate Pass Through Ctfs., 3.10%, 04/19/2036(d) | | | 135,596 | | | | 123,452 | |
MAPS CLO Fund II Ltd. (Cayman Islands),
Series 2007-2A, Class A2, Floating Rate Pass Through Ctfs.,
0.71%, 07/20/2022(b)(d) | | | 250,000 | | | | 242,152 | |
Merrill Lynch Mortgage Investors Trust,
Series 2005-3, Class 3A, Floating Rate Pass Through Ctfs.,
2.33%, 11/25/2035(d) | | | 36,291 | | | | 35,275 | |
Structured Adjustable Rate Mortgage Loan Trust,
Series 2004-12, Class 3A2, Floating Rate Pass Through Ctfs.,
2.54%, 09/25/2034(d) | | | 42,487 | | | | 42,297 | |
Series 2004-16, Class 2A, Floating Rate Pass Through Ctfs.,
2.59%, 11/25/2034(d) | | | 56,292 | | | | 55,548 | |
Thornburg Mortgage Securities Trust, Series 2005-1, Class A3, Floating Rate Pass Through Ctfs.,
2.27%, 04/25/2045(d) | | | 123,733 | | | | 123,921 | |
Series 2005-2, Class A1, Floating Rate Pass Through Ctfs.,
2.35%, 07/25/2045(d) | | | 54,957 | | | | 53,424 | |
Wells Fargo Mortgage Backed Securities Trust, Series 2004-Z, Class 2A1, Floating Rate Pass Through Ctfs.,
2.85%, 12/25/2034(d) | | | 68,330 | | | | 68,438 | |
Total Asset-Backed Securities (Cost $1,413,019) | | | | | | | 1,422,180 | |
| | |
| | | Shares | | | | |
Preferred Stocks–1.25% | |
| Investment Banking & Brokerage–0.88% | |
Morgan Stanley, Series F, 6.88% Pfd. | | | 5,000 | | | | 138,751 | |
|
| Reinsurance–0.37% | |
Reinsurance Group of America, Inc., 6.20% Unsec. Sub. Pfd. | | | 2,000 | | | | 58,080 | |
Total Preferred Stocks
(Cost $175,000) | | | | | | | 196,831 | |
See accompanying Notes to Financial Statements which are an integral part of the financial statements.
Invesco V.I. Core Plus Bond Fund
| | | | | | | | |
| | | Principal
Amount | | | Value | |
Municipal Obligations–1.02% | |
Florida Development Finance Corp. (Palm Bay Academy Inc.); Series 2006 B, Taxable RB, 7.50%, 05/15/2017(h) | | $ | 65,000 | | | $ | 45,505 | |
Florida Hurricane Catastrophe Fund Finance Corp., Series 2013 A, RB, 3.00%, 07/01/2020 | | | 55,000 | | | | 55,823 | |
Georgia (State of) Municipal Electric Authority (Plant Vogtle Units 3 & 4 Project J); Series 2010 A, Taxable Build America RB, 6.64%, 04/01/2057 | | | 50,000 | | | | 59,725 | |
Total Municipal Obligations (Cost $169,523) | | | | | | | 161,053 | |
| | |
| | | Shares | | | | |
Common Stocks & Other Equity Interests–0.00% | |
| Broadcasting–0.00% | |
Adelphia Communications Corp.(i) | | | 900 | | | | 337 | |
Adelphia Recovery Trust–Series ACC-1(i) | | | 87,412 | | | | 1 | |
| | | | | | | | 338 | |
| | | | | | | | |
| | |
Shares | | | Value | |
| Paper Products–0.00% | |
Verso Corp.(j) | | | 53 | | | $ | 1 | |
Total Common Stocks & Other Equity Interests
(Cost $22,352) | | | | | | | 339 | |
|
Money Market Funds–8.12% | |
Liquid Assets Portfolio–Institutional Class, 0.29%(k) | | | 639,200 | | | | 639,200 | |
Premier Portfolio–Institutional Class, 0.24%(k) | | | 639,201 | | | | 639,201 | |
Total Money Market Funds (Cost $1,278,401) | | | | | | | 1,278,401 | |
TOTAL INVESTMENTS–125.06% (Cost $19,823,464) | | | | | | | 19,688,316 | |
OTHER ASSETS LESS
LIABILITIES–(25.06)% | | | | | | | (3,945,115 | ) |
NET ASSETS–100.00% | | | | | | $ | 15,743,201 | |
Investment Abbreviations:
| | |
| Ctfs. | | – Certificates |
| Deb. | | – Debentures |
| Gtd. | | – Guaranteed |
| IO | | – Interest Only |
| Jr. | | – Junior |
| Pfd. | | – Preferred |
| RB | | – Revenue Bonds |
| REGS | | – Regulation S |
| REIT | | – Real Estate Investment Trust |
| REMICS | | – Real Estate Mortgage Investment Conduits |
| Sec. | | – Secured |
| Sr. | | – Senior |
| Sub. | | – Subordinated |
| TBA | | – To Be Announced |
| Unsec. | | – Unsecured |
Notes to Schedule of Investments:
| (a) | Industry and/or sector classifications used in this report are generally according to the Global Industry Classification Standard, which was developed by and is the exclusive property and a service mark of MSCI Inc. and Standard & Poor’s. |
| (b) | Security purchased or received in a transaction exempt from registration under the Securities Act of 1933, as amended (the “1933 Act”). The security may be resold pursuant to an exemption from registration under the 1933 Act, typically to qualified institutional buyers. The aggregate value of these securities at December 31, 2015 was $4,325,926, which represented 27.48% of the Fund’s Net Assets. |
| (c) | Perpetual bond with no specified maturity date. |
| (d) | Interest or dividend rate is redetermined periodically. Rate shown is the rate in effect on December 31, 2015. |
| (e) | Security purchased on a forward commitment basis. This security is subject to dollar roll transactions. See Note 1K. |
| (f) | Security traded on a discount basis. The interest rate shown represents the discount rate at the time of purchase by the Fund. |
| (g) | All or a portion of the value was pledged as collateral to cover margin requirements for open futures contracts. See Note 1J and Note 4. |
| (h) | Defaulted security. Currently, the issuer is partially or fully in default with respect to interest payments. The value of this security at December 31, 2015 represented less than 1% of the Fund’s Net Assets. |
| (i) | Non-income producing security acquired as part of the Adelphia Communications bankruptcy reorganization. |
| (j) | Non-income producing security. |
| (k) | The money market fund and the Fund are affiliated by having the same investment adviser. The rate shown is the 7-day SEC standardized yield as of December 31, 2015. |
See accompanying Notes to Financial Statements which are an integral part of the financial statements.
Invesco V.I. Core Plus Bond Fund
Statement of Assets and Liabilities
December 31, 2015
Statement of Operations
For the year ended December 31, 2015
| | | | |
Assets: | |
Investments, at value (Cost $18,545,063) | | $ | 18,409,915 | |
Investments in affiliated money market funds, at value and cost | | | 1,278,401 | |
Total investments, at value (Cost $19,823,464) | | | 19,688,316 | |
Receivable for: | | | | |
Fund shares sold | | | 750 | |
Dividends and interest | | | 170,932 | |
Premiums paid on swap agreements | | | 5,964 | |
Investment for trustee deferred compensation and retirement plans | | | 57,374 | |
Other assets | | | 369 | |
Total assets | | | 19,923,705 | |
| |
Liabilities: | | | | |
Payable for: | | | | |
Investments purchased | | | 4,042,247 | |
Fund shares reacquired | | | 2,730 | |
Swaps payable | | | 76 | |
Variation margin — futures | | | 11,382 | |
Accrued fees to affiliates | | | 17,648 | |
Accrued trustees’ and officers’ fees and benefits | | | 174 | |
Accrued other operating expenses | | | 38,453 | |
Trustee deferred compensation and retirement plans | | | 59,488 | |
Unrealized depreciation on swap agreements | | | 8,306 | |
Total liabilities | | | 4,180,504 | |
Net assets applicable to shares outstanding | | $ | 15,743,201 | |
| |
Net assets consist of: | | | | |
Shares of beneficial interest | | $ | 23,227,965 | |
Undistributed net investment income | | | 575,778 | |
Undistributed net realized gain (loss) | | | (7,917,967 | ) |
Net unrealized appreciation (depreciation) | | | (142,575 | ) |
| | | $ | 15,743,201 | |
|
Net Assets: | |
Series I | | $ | 15,587,293 | |
Series II | | $ | 155,908 | |
|
Shares outstanding, $0.001 par value per share,
with an unlimited number of shares authorized: | |
Series I | | | 2,567,729 | |
Series II | | | 25,806 | |
Series I: | | | | |
Net asset value per share | | $ | 6.07 | |
Series II: | | | | |
Net asset value per share | | $ | 6.04 | |
| | | | |
Investment income: | |
Interest | | $ | 742,527 | |
Dividends | | | 11,848 | |
Dividends from affiliated money market funds | | | 1,387 | |
Total investment income | | | 755,762 | |
| |
Expenses: | | | | |
Advisory fees | | | 85,070 | |
Administrative services fees | | | 84,605 | |
Custodian fees | | | 19,854 | |
Distribution fees — Series II | | | 400 | |
Transfer agent fees | | | 8,672 | |
Trustees’ and officers’ fees and benefits | | | 18,951 | |
Professional services fees | | | 47,445 | |
Other | | | 29,220 | |
Total expenses | | | 294,217 | |
Less: Fees waived and expenses reimbursed | | | (183,736 | ) |
Net expenses | | | 110,481 | |
Net investment income | | | 645,281 | |
| |
Realized and unrealized gain (loss) from: | | | | |
Net realized gain from: | | | | |
Investment securities (includes net gains from securities sold to affiliates of $443) | | | 144,099 | |
Futures contracts | | | 2,023 | |
Swap agreements | | | 11,139 | |
| | | | 157,261 | |
Change in net unrealized appreciation (depreciation) of: | | | | |
Investment securities | | | (872,150 | ) |
Futures contracts | | | 19,350 | |
Swap agreements | | | 5,246 | |
| | | | (847,554 | ) |
Net realized and unrealized gain (loss) | | | (690,293 | ) |
Net increase (decrease) in net assets resulting from operations | | $ | (45,012 | ) |
See accompanying Notes to Financial Statements which are an integral part of the financial statements.
Invesco V.I. Core Plus Bond Fund
Statement of Changes in Net Assets
For the years ended December 31, 2015 and 2014
| | | | | | | | |
| | | 2015 | | | 2014 | |
Operations: | | | | | | | | |
Net investment income | | $ | 645,281 | | | $ | 774,721 | |
Net realized gain | | | 157,261 | | | | 520,545 | |
Change in net unrealized appreciation (depreciation) | | | (847,554 | ) | | | 231,954 | |
Net increase (decrease) in net assets resulting from operations | | | (45,012 | ) | | | 1,527,220 | |
| | |
Distributions to shareholders from net investment income: | | | | | | | | |
Series I | | | (743,970 | ) | | | (933,648 | ) |
Series ll | | | (6,999 | ) | | | (7,576 | ) |
Total distributions from net investment income | | | (750,969 | ) | | | (941,224 | ) |
| | |
Share transactions–net: | | | | | | | | |
Series l | | | (1,446,156 | ) | | | (2,430,969 | ) |
Series ll | | | 3,318 | | | | (16,001 | ) |
Net increase (decrease) in net assets resulting from share transactions | | | (1,442,838 | ) | | | (2,446,970 | ) |
Net increase (decrease) in net assets | | | (2,238,819 | ) | | | (1,860,974 | ) |
| | |
Net assets: | | | | | | | | |
Beginning of year | | | 17,982,020 | | | | 19,842,994 | |
End of year (includes undistributed net investment income of $575,778 and $636,306, respectively) | | $ | 15,743,201 | | | $ | 17,982,020 | |
Notes to Financial Statements
December 31, 2015
NOTE 1—Significant Accounting Policies
Invesco V.I. Core Plus Bond Fund, formerly Invesco V.I. Diversified Income Fund, (the “Fund”) is a series portfolio of AIM Variable Insurance Funds (Invesco Variable Insurance Funds) (the “Trust”). The Trust is a Delaware statutory trust registered under the Investment Company Act of 1940, as amended (the “1940 Act”), as an open-end series management investment company consisting of twenty-four separate portfolios, (each constituting a “Fund”). The assets, liabilities and operations of each portfolio are accounted for separately. Information presented in these financial statements pertains only to the Fund. Matters affecting each Fund or class will be voted on exclusively by the shareholders of such Fund or class. Current Securities and Exchange Commission (“SEC”) guidance, however, requires participating insurance companies offering separate accounts to vote shares proportionally in accordance with the instructions of the contract owners whose investments are funded by shares of each Fund or class.
The Fund’s investment objective is total return, comprised of current income and capital appreciation.
The Fund currently offers two classes of shares, Series I and Series II, both of which are offered to insurance company separate accounts funding variable annuity contracts and variable life insurance policies (“variable products”).
The following is a summary of the significant accounting policies followed by the Fund in the preparation of its financial statements.
| A. | Security Valuations — Securities, including restricted securities, are valued according to the following policy. |
Debt obligations (including convertible securities) and unlisted equities are fair valued using an evaluated quote provided by an independent pricing service. Evaluated quotes provided by the pricing service may be determined without exclusive reliance on quoted prices, and may reflect appropriate factors such as institution-size trading in similar groups of securities, developments related to specific securities, dividend rate (for unlisted equities), yield (for debt obligations), quality, type of issue, coupon rate (for debt obligations), maturity (for debt obligations), individual trading characteristics and other market data. Debt obligations are subject to interest rate and credit risks. In addition, all debt obligations involve some risk of default with respect to interest and/or principal payments.
A security listed or traded on an exchange (except convertible securities) is valued at its last sales price or official closing price as of the close of the customary trading session on the exchange where the security is principally traded, or lacking any sales or official closing price on a particular day, the security may be valued at the closing bid price on that day. Securities traded in the over-the-counter market are valued based on prices furnished by independent pricing services or market makers. When such securities are valued by an independent pricing service they may be considered fair valued. Futures contracts are valued at the final settlement price set by an exchange on which they are principally traded. Listed options are valued at the mean between the last bid and asked prices from the exchange on which they are principally traded. Options not listed on an exchange are valued by an independent source at the mean between the last bid and asked prices. For purposes of determining net asset value (“NAV”) per share, futures and option contracts generally are valued 15 minutes after the close of the customary trading session of the New York Stock Exchange (“NYSE”).
Investments in open-end and closed-end registered investment companies that do not trade on an exchange are valued at the end-of-day net asset value per share. Investments in open-end and closed-end registered investment companies that trade on an exchange are valued at the last sales price or official closing price as of the close of the customary trading session on the exchange where the security is principally traded.
Invesco V.I. Core Plus Bond Fund
Swap agreements are fair valued using an evaluated quote, if available, provided by an independent pricing service. Evaluated quotes provided by the pricing service are valued based on a model which may include end-of-day net present values, spreads, ratings, industry, company performance and returns of referenced assets.
Foreign securities’ (including foreign exchange contracts) prices are converted into U.S. dollar amounts using the applicable exchange rates as of the close of the NYSE. If market quotations are available and reliable for foreign exchange-traded equity securities, the securities will be valued at the market quotations. Because trading hours for certain foreign securities end before the close of the NYSE, closing market quotations may become unreliable. If between the time trading ends on a particular security and the close of the customary trading session on the NYSE, events occur that the Adviser determines are significant and make the closing price unreliable, the Fund may fair value the security. If the event is likely to have affected the closing price of the security, the security will be valued at fair value in good faith using procedures approved by the Board of Trustees. Adjustments to closing prices to reflect fair value may also be based on a screening process of an independent pricing service to indicate the degree of certainty, based on historical data, that the closing price in the principal market where a foreign security trades is not the current value as of the close of the NYSE. Foreign securities’ prices meeting the approved degree of certainty that the price is not reflective of current value will be priced at the indication of fair value from the independent pricing service. Multiple factors may be considered by the independent pricing service in determining adjustments to reflect fair value and may include information relating to sector indices, American Depositary Receipts and domestic and foreign index futures. Foreign securities may have additional risks including exchange rate changes, potential for sharply devalued currencies and high inflation, political and economic upheaval, the relative lack of issuer information, relatively low market liquidity and the potential lack of strict financial and accounting controls and standards.
Securities for which market prices are not provided by any of the above methods may be valued based upon quotes furnished by independent sources. The last bid price may be used to value equity securities. The mean between the last bid and asked prices is used to value debt obligations, including corporate loans.
Securities for which market quotations are not readily available or became unreliable are valued at fair value as determined in good faith by or under the supervision of the Trust’s officers following procedures approved by the Board of Trustees. Issuer specific events, market trends, bid/asked quotes of brokers and information providers and other market data may be reviewed in the course of making a good faith determination of a security’s fair value.
The Fund may invest in securities that are subject to interest rate risk, meaning the risk that the prices will generally fall as interest rates rise and, conversely, the prices will generally rise as interest rates fall. Specific securities differ in their sensitivity to changes in interest rates depending on their individual characteristics. Changes in interest rates may result in increased market volatility, which may affect the value and/or liquidity of certain Fund investments.
Valuations change in response to many factors including the historical and prospective earnings of the issuer, the value of the issuer’s assets, general economic conditions, interest rates, investor perceptions and market liquidity. Because of the inherent uncertainties of valuation, the values reflected in the financial statements may materially differ from the value received upon actual sale of those investments.
| B. | Securities Transactions and Investment Income — Securities transactions are accounted for on a trade date basis. Realized gains or losses on sales are computed on the basis of specific identification of the securities sold. Interest income (net of withholding tax, if any) is recorded on the accrual basis from settlement date. Paydown gains and losses on mortgage and asset-backed securities are recorded as adjustments to interest income. Dividend income (net of withholding tax, if any) is recorded on the ex-dividend date. Bond premiums and discounts are amortized and/or accreted for financial reporting purposes. |
The Fund may periodically participate in litigation related to Fund investments. As such, the Fund may receive proceeds from litigation settlements. Any proceeds received are included in the Statement of Operations as realized gain (loss) for investments no longer held and as unrealized gain (loss) for investments still held.
Brokerage commissions and mark ups are considered transaction costs and are recorded as an increase to the cost basis of securities purchased and/or a reduction of proceeds on a sale of securities. Such transaction costs are included in the determination of net realized and unrealized gain (loss) from investment securities reported in the Statement of Operations and the Statement of Changes in Net Assets and the net realized and unrealized gains (losses) on securities per share in the Financial Highlights. Transaction costs are included in the calculation of the Fund’s net asset value and, accordingly, they reduce the Fund’s total returns. These transaction costs are not considered operating expenses and are not reflected in net investment income reported in the Statement of Operations and the Statement of Changes in Net Assets, or the net investment income per share and the ratios of expenses and net investment income reported in the Financial Highlights, nor are they limited by any expense limitation arrangements between the Fund and the investment adviser.
The Fund allocates income and realized and unrealized capital gains and losses to a class based on the relative net assets of each class.
| C. | Country Determination — For the purposes of making investment selection decisions and presentation in the Schedule of Investments, the investment adviser may determine the country in which an issuer is located and/or credit risk exposure based on various factors. These factors include the laws of the country under which the issuer is organized, where the issuer maintains a principal office, the country in which the issuer derives 50% or more of its total revenues and the country that has the primary market for the issuer’s securities, as well as other criteria. Among the other criteria that may be evaluated for making this determination are the country in which the issuer maintains 50% or more of its assets, the type of security, financial guarantees and enhancements, the nature of the collateral and the sponsor organization. Country of issuer and/or credit risk exposure has been determined to be the United States of America, unless otherwise noted. |
| D. | Distributions — Distributions from net investment income and net realized capital gain, if any, are generally declared and paid to separate accounts of participating insurance companies annually and recorded on the ex-dividend date. |
| E. | Federal Income Taxes — The Fund intends to comply with the requirements of Subchapter M of the Internal Revenue Code of 1986, as amended (the “Internal Revenue Code”), necessary to qualify as a regulated investment company and to distribute substantially all of the Fund’s taxable earnings to shareholders. As such, the Fund will not be subject to federal income taxes on otherwise taxable income (including net realized capital gain) that is distributed to shareholders. Therefore, no provision for federal income taxes is recorded in the financial statements. |
The Fund recognizes the tax benefits of uncertain tax positions only when the position is more likely than not to be sustained. Management has analyzed the Fund’s uncertain tax positions and concluded that no liability for unrecognized tax benefits should be recorded related to uncertain tax positions. Management is not aware of any tax positions for which it is reasonably possible that the total amounts of unrecognized tax benefits will change materially in the next 12 months.
Invesco V.I. Core Plus Bond Fund
The Fund files tax returns in the U.S. Federal jurisdiction and certain other jurisdictions. Generally, the Fund is subject to examinations by such taxing authorities for up to three years after the filing of the return for the tax period.
| F. | Expenses — Fees provided for under the Rule 12b-1 plan of a particular class of the Fund and which are directly attributable to that class are charged to the operations of such class. All other expenses are allocated among the classes based on relative net assets. |
| G. | Accounting Estimates — The preparation of financial statements in conformity with accounting principles generally accepted in the United States of America (“GAAP”) requires management to make estimates and assumptions that affect the reported amounts of assets and liabilities at the date of the financial statements and the reported amounts of revenues and expenses during the reporting period including estimates and assumptions related to taxation. Actual results could differ from those estimates by a significant amount. In addition, the Fund monitors for material events or transactions that may occur or become known after the period-end date and before the date the financial statements are released to print. |
| H. | Indemnifications — Under the Trust’s organizational documents, each Trustee, officer, employee or other agent of the Trust is indemnified against certain liabilities that may arise out of the performance of their duties to the Fund. Additionally, in the normal course of business, the Fund enters into contracts, including the Fund’s servicing agreements, that contain a variety of indemnification clauses. The Fund’s maximum exposure under these arrangements is unknown as this would involve future claims that may be made against the Fund that have not yet occurred. The risk of material loss as a result of such indemnification claims is considered remote. |
| I. | Lower-Rated Securities — The Fund may invest in lower-quality debt securities, i.e., “junk bonds”. Investments in lower-rated securities or unrated securities of comparable quality tend to be more sensitive to economic conditions than higher rated securities. Junk bonds involve a greater risk of default by the issuer because such securities are generally unsecured and are often subordinated to other creditors’ claims. |
| J. | Futures Contracts — The Fund may enter into futures contracts to manage exposure to interest rate, equity and market price movements and/or currency risks. A futures contract is an agreement between two parties (“Counterparties”) to purchase or sell a specified underlying security, currency or commodity (or delivery of a cash settlement price, in the case of an index future) for a fixed price at a future date. The Fund currently invests only in exchange-traded futures and they are standardized as to maturity date and underlying financial instrument. Initial margin deposits required upon entering into futures contracts are satisfied by the segregation of specific securities or cash as collateral at the futures commission merchant (broker). During the period the futures contracts are open, changes in the value of the contracts are recognized as unrealized gains or losses by recalculating the value of the contracts on a daily basis. Subsequent or variation margin payments are received or made depending upon whether unrealized gains or losses are incurred. These amounts are reflected as receivables or payables on the Statement of Assets and Liabilities. When the contracts are closed or expire, the Fund recognizes a realized gain or loss equal to the difference between the proceeds from, or cost of, the closing transaction and the Fund’s basis in the contract. The net realized gain (loss) and the change in unrealized gain (loss) on futures contracts held during the period is included on the Statement of Operations. The primary risks associated with futures contracts are market risk and the absence of a liquid secondary market. If the Fund were unable to liquidate a futures contract and/or enter into an offsetting closing transaction, the Fund would continue to be subject to market risk with respect to the value of the contracts and continue to be required to maintain the margin deposits on the futures contracts. Futures contracts have minimal Counterparty risk since the exchange’s clearinghouse, as Counterparty to all exchange-traded futures, guarantees the futures against default. Risks may exceed amounts recognized in the Statement of Assets and Liabilities. |
| K. | Dollar Rolls and Forward Commitment Transactions — The Fund may enter into dollar roll transactions to enhance the Fund’s performance. The Fund executes its dollar roll transactions in the to be announced (“TBA”) market whereby the Fund makes a forward commitment to purchase a security and, instead of accepting delivery, the position is offset by the sale of the security with a simultaneous agreement to repurchase at a future date. |
The Fund accounts for dollar roll transactions as purchases and sales and realizes gains and losses on these transactions. These transactions increase the Fund’s portfolio turnover rate. The Fund will segregate liquid assets in an amount equal to its dollar roll commitments. Dollar roll transactions are considered borrowings under the 1940 Act.
Dollar roll transactions involve the risk that a Counterparty to the transaction may fail to complete the transaction. If this occurs, the Fund may lose the opportunity to purchase or sell the security at the agreed upon price. Dollar roll transactions also involve the risk that the value of the securities retained by the Fund may decline below the price of the securities that the Fund has sold but is obligated to purchase under the agreement.
| L. | Swap Agreements — The Fund may enter into various swap transactions, including interest rate, total return, index, currency and credit default swap contracts (“CDS”) for investment purposes or to manage interest rate, currency or credit risk. Such transactions are agreements between Counterparties. A swap agreement may be negotiated bilaterally and traded over-the-counter (“OTC”) between two parties (“uncleared/OTC”) or, in some instances, must be transacted through a future commission merchant (“FCM”) and cleared through a clearinghouse that serves as a central Counterparty (“centrally cleared swap”). These agreements may contain among other conditions, events of default and termination events, and various covenants and representations such as provisions that require the Fund to maintain a pre-determined level of net assets, and/or provide limits regarding the decline of the Fund’s NAV over specific periods of time. If the Fund were to trigger such provisions and have open derivative positions at that time, the Counterparty may be able to terminate such agreement and request immediate payment in an amount equal to the net liability positions, if any. |
Interest rate, total return, index, and currency swap agreements are two-party contracts entered into primarily to exchange the returns (or differentials in rates of returns) earned or realized on particular predetermined investments or instruments. The gross returns to be exchanged or “swapped” between the parties are calculated with respect to a notional amount, i.e., the return on or increase in value of a particular dollar amount invested at a particular interest rate or return of an underlying asset, in a particular foreign currency, or in a “basket” of securities representing a particular index.
In a centrally cleared swap, the Fund’s ultimate Counterparty is a central clearinghouse. The Fund initially will enter into centrally cleared swaps through an executing broker. When a fund enters into a centrally cleared swap, it must deliver to the central Counterparty (via the FCM) an amount referred to as “initial margin.” Initial margin requirements are determined by the central Counterparty, but an FCM may require additional initial margin above the amount required by the central Counterparty. Initial margin deposits required upon entering into centrally cleared swaps are satisfied by cash or securities as collateral at the FCM. Securities deposited as initial margin are designated on the Schedule of Investments and cash deposited is recorded on the Statement of Assets and Liabilities. During the term of a cleared swap agreement, a “variation margin”
Invesco V.I. Core Plus Bond Fund
amount may be required to be paid by the Fund or may be received by the Fund, based on the daily change in price of the underlying reference instrument subject to the swap agreement and is recorded as a receivable or payable for variation margin in the Statement of Assets and Liabilities until the centrally cleared swap is terminated at which time a realized gain or loss is recorded.
A CDS is an agreement between Counterparties to exchange the credit risk of an issuer. A buyer of a CDS is said to buy protection by paying a fixed payment over the life of the agreement and in some situations an upfront payment to the seller of the CDS. If a defined credit event occurs (such as payment default or bankruptcy), the Fund as a protection buyer would cease paying its fixed payment, the Fund would deliver eligible bonds issued by the reference entity to the seller, and the seller would pay the full notional value, or the “par value”, of the referenced obligation to the Fund. A seller of a CDS is said to sell protection and thus would receive a fixed payment over the life of the agreement and an upfront payment, if applicable. If a credit event occurs, the Fund as a protection seller would cease to receive the fixed payment stream, the Fund would pay the buyer “par value” or the full notional value of the referenced obligation, and the Fund would receive the eligible bonds issued by the reference entity. In turn, these bonds may be sold in order to realize a recovery value. Alternatively, the seller of the CDS and its Counterparty may agree to net the notional amount and the market value of the bonds and make a cash payment equal to the difference to the buyer of protection. If no credit event occurs, the Fund receives the fixed payment over the life of the agreement. As the seller, the Fund would effectively add leverage to its portfolio because, in addition to its total net assets, the Fund would be subject to investment exposure on the notional amount of the CDS. In connection with these agreements, cash and securities may be identified as collateral in accordance with the terms of the respective swap agreements to provide assets of value and recourse in the event of default under the swap agreement or bankruptcy/insolvency of a party to the swap agreement. If a Counterparty becomes bankrupt or otherwise fails to perform its obligations due to financial difficulties, the Fund may experience significant delays in obtaining any recovery in a bankruptcy or other reorganization proceeding. The Fund may obtain only limited recovery or may obtain no recovery in such circumstances. The Fund’s maximum risk of loss from Counterparty risk, either as the protection seller or as the protection buyer, is the value of the contract. The risk may be mitigated by having a master netting arrangement between the Fund and the Counterparty and by the designation of collateral by the Counterparty to cover the Fund’s exposure to the Counterparty.
Implied credit spreads represent the current level at which protection could be bought or sold given the terms of the existing CDS contract and serve as an indicator of the current status of the payment/performance risk of the CDS. An implied spread that has widened or increased since entry into the initial contract may indicate a deteriorating credit profile and increased risk of default for the reference entity. A declining or narrowing spread may indicate an improving credit profile or decreased risk of default for the reference entity. Alternatively, credit spreads may increase or decrease reflecting the general tolerance for risk in the credit markets.
An interest rate swap is an agreement between Counterparties pursuant to which the parties exchange a floating rate payment for a fixed rate payment based on a specified notional amount.
Changes in the value of centrally cleared and OTC swap agreements are recognized as unrealized gains (losses) in the Statement of Operations by “marking to market” on a daily basis to reflect the value of the swap agreement at the end of each trading day. Payments received or paid at the beginning of the agreement are reflected as such on the Statement of Assets and Liabilities and may be referred to as upfront payments. The Fund accrues for the fixed payment stream and amortizes upfront payments, if any, on swap agreements on a daily basis with the net amount, recorded as a component of realized gain (loss) on the Statement of Operations. A liquidation payment received or made at the termination of a swap agreement is recorded as realized gain (loss) on the Statement of Operations. The Fund segregates liquid securities having a value at least equal to the amount of the potential obligation of a Fund under any swap transaction. Entering into these agreements involves, to varying degrees, lack of liquidity and elements of credit, market, and Counterparty risk in excess of amounts recognized on the Statement of Assets and Liabilities. Such risks involve the possibility that a swap is difficult to sell or liquidate; the Counterparty does not honor its obligations under the agreement and unfavorable interest rates and market fluctuations. It is possible that developments in the swaps market, including potential government regulation, could adversely affect the Fund’s ability to terminate existing swap agreements or to realize amounts to be received under such agreements. A short position in a security poses more risk than holding the same security long. As there is no limit on how much the price of the security can increase, the Fund’s exposure is unlimited.
Notional amounts of each individual credit default swap agreement outstanding as of December 31, 2015 for which the Fund is the seller of protection are disclosed in the open swap agreements table. These potential amounts would be partially offset by any recovery values of the respective referenced obligations, upfront payments received upon entering into the agreement, or net amounts received from the settlement of buy protection credit default swap agreements entered into by the Fund for the same referenced entity or entities.
| M. | Leverage Risk — Leverage exists when the Fund can lose more than it originally invests because it purchases or sells an instrument or enters into a transaction without investing an amount equal to the full economic exposure of the instrument or transaction. |
| N. | Collateral — To the extent the Fund has designated or segregated a security as collateral and that security is subsequently sold, it is the Fund’s practice to replace such collateral no later than the next business day. |
NOTE 2—Advisory Fees and Other Fees Paid to Affiliates
Effective April 30, 2015, the Trust has entered into a master investment advisory agreement with Invesco Advisers, Inc. (the “Adviser” or “Invesco”). Under the terms of the investment advisory agreement, the Fund pays an advisory fee to the Adviser based on the annual rate of the Fund’s average daily net assets as follows:
| | | | | | |
| Average Daily Net Assets | | Rate |
First $500 million | | | 0 | .45% | | |
Next $500 million | | | 0 | .425% | | |
Next $1.5 billion | | | 0 | .40% | | |
Next $2.5 billion | | | 0 | .375% | | |
Over $5 billion | | | 0 | .35% | | |
Invesco V.I. Core Plus Bond Fund
Prior to April 30, 2015, the Fund paid an advisory fee to the Adviser based on the annual rate of the Fund’s average daily net assets as follows:
| | | | |
| Average Daily Net Assets | | Rate | |
First $250 million | | | 0.60% | |
Over $250 million | | | 0.55% | |
For the year ended December 31, 2015, the effective advisory fees incurred by the Fund was 0.50%.
Under the terms of a master sub-advisory agreement between the Adviser and each of Invesco Asset Management Deutschland GmbH, Invesco Asset Management Limited, Invesco Asset Management (Japan) Limited, Invesco Hong Kong Limited, Invesco Senior Secured Management, Inc. and Invesco Canada Ltd. (collectively, the “Affiliated Sub-Advisers”) the Adviser, not the Fund, may pay 40% of the fees paid to the Adviser to any such Affiliated Sub-Adviser(s) that provide(s) discretionary investment management services to the Fund based on the percentage of assets allocated to such Affiliated Sub-Adviser(s).
Effective April 30, 2015, the Adviser has contractually agreed, through at least April 30, 2017, to waive advisory fees and/or reimburse expenses of all shares to the extent necessary to limit total annual fund operating expenses after fee waiver and/or expense reimbursement (excluding certain items discussed below) of Series I shares to 0.61% and Series II shares to 0.86% of average daily net assets. Prior to April 30, 2015, the Adviser had contractually agreed to waive advisory fees and/or reimburse expenses to the extent necessary to limit total annual fund operating expenses after fee waiver and/or expense reimbursement (excluding certain items listed below) of Series I shares to 0.75% and Series II shares to 1.00% of average daily net assets. In determining the Adviser’s obligation to waive advisory fees and/or reimburse expenses, the following expenses are not taken into account, and could cause the total annual fund operating expenses after fee waiver and/or expense reimbursement to exceed the numbers reflected above: (1) interest; (2) taxes; (3) dividend expense on short sales; (4) extraordinary or non-routine items, including litigation expenses; and (5) expenses that the Fund has incurred but did not actually pay because of an expense offset arrangement. Unless Invesco continues the fee waiver agreement, it will terminate on April 30, 2017. The fee waiver agreement cannot be terminated during its term.
Further, the Adviser has contractually agreed, through at least June 30, 2017, to waive the advisory fee payable by the Fund in an amount equal to 100% of the net advisory fees the Adviser receives from the affiliated money market funds on investments by the Fund of uninvested cash in such affiliated money market funds.
For the year ended December 31, 2015, the Adviser waived advisory fees of $85,070 and reimbursed fund level expenses of $98,666.
The Trust has entered into a master administrative services agreement with Invesco pursuant to which the Fund has agreed to pay Invesco a fee for costs incurred in providing accounting services and fund administrative services to the Fund and to reimburse Invesco for administrative services fees paid to insurance companies that have agreed to provide services to the participants of separate accounts. These administrative services provided by the insurance companies may include, among other things: the printing of prospectuses, financial reports and proxy statements and the delivery of the same to existing participants; the maintenance of master accounts; the facilitation of purchases and redemptions requested by the participants; and the servicing of participants’ accounts. Pursuant to such agreement, for the year ended December 31, 2015, Invesco was paid $50,000 for accounting and fund administrative services and reimbursed $34,605 for services provided by insurance companies.
The Trust has entered into a transfer agency and service agreement with Invesco Investment Services, Inc. (“IIS”) pursuant to which the Fund has agreed to pay IIS a fee for providing transfer agency and shareholder services to the Fund and reimburse IIS for certain expenses incurred by IIS in the course of providing such services. For the year ended December 31, 2015, expenses incurred under the agreement are shown in the Statement of Operations as Transfer agent fees.
The Trust has entered into a master distribution agreement with Invesco Distributors, Inc. (“IDI”) to serve as the distributor for the Fund. The Trust has adopted a plan pursuant to Rule 12b-1 under the 1940 Act with respect to the Fund’s Series II shares (the “Plan”). The Fund, pursuant to the Plan, pays IDI compensation at the annual rate of 0.25% of the Fund’s average daily net assets of Series II shares. Of the Plan payments, up to 0.25% of the average daily net assets of the Series II shares may be paid to insurance companies who furnish continuing personal shareholder services to customers who purchase and own Series II shares of the Fund. For the year ended December 31, 2015, expenses incurred under the Plan are detailed in the Statement of Operations as Distribution fees.
Certain officers and trustees of the Trust are officers and directors of the Adviser, IIS and/or IDI.
NOTE 3—Additional Valuation Information
GAAP defines fair value as the price that would be received to sell an asset or paid to transfer a liability in an orderly transaction between market participants at the measurement date, under current market conditions. GAAP establishes a hierarchy that prioritizes the inputs to valuation methods, giving the highest priority to readily available unadjusted quoted prices in an active market for identical assets (Level 1) and the lowest priority to significant unobservable inputs (Level 3), generally when market prices are not readily available or are unreliable. Based on the valuation inputs, the securities or other investments are tiered into one of three levels. Changes in valuation methods may result in transfers in or out of an investment’s assigned level:
| | Level 1 — | Prices are determined using quoted prices in an active market for identical assets. |
| | Level 2 — | Prices are determined using other significant observable inputs. Observable inputs are inputs that other market participants may use in pricing a security. These may include quoted prices for similar securities, interest rates, prepayment speeds, credit risk, yield curves, loss severities, default rates, discount rates, volatilities and others. |
| | Level 3 — | Prices are determined using significant unobservable inputs. In situations where quoted prices or observable inputs are unavailable (for example, when there is little or no market activity for an investment at the end of the period), unobservable inputs may be used. Unobservable inputs reflect the Fund’s own assumptions about the factors market participants would use in determining fair value of the securities or instruments and would be based on the best available information. |
Invesco V.I. Core Plus Bond Fund
The following is a summary of the tiered valuation input levels, as of December 31, 2015. The level assigned to the securities valuations may not be an indication of the risk or liquidity associated with investing in those securities. Because of the inherent uncertainties of valuation, the values reflected in the financial statements may materially differ from the value received upon actual sale of those investments.
| | | | | | | | | | | | | | | | |
| | | Level 1 | | | Level 2 | | | Level 3 | | | Total | |
Equity Securities | | $ | 1,475,233 | | | $ | 338 | | | $ | — | | | $ | 1,475,571 | |
U.S. Treasury Securities | | | — | | | | 2,004,135 | | | | — | | | | 2,004,135 | |
Corporate Debt Securities | | | — | | | | 10,367,669 | | | | — | | | | 10,367,669 | |
U.S. Government Sponsored Agency Securities | | | — | | | | 4,192,753 | | | | — | | | | 4,192,753 | |
Asset-Backed Securities | | | — | | | | 1,422,180 | | | | — | | | | 1,422,180 | |
Municipal Obligations | | | — | | | | 161,053 | | | | — | | | | 161,053 | |
Foreign Sovereign Debt Securities | | | — | | | | 64,955 | | | | — | | | | 64,955 | |
| | | | 1,475,233 | | | | 18,213,083 | | | | — | | | | 19,688,316 | |
Futures Contracts* | | | 879 | | | | — | | | | — | | | | 879 | |
Swap Agreements* | | | — | | | | (8,306 | ) | | | — | | | | (8,306 | ) |
Total Investments | | $ | 1,476,112 | | | $ | 18,204,777 | | | $ | — | | | $ | 19,680,889 | |
| * | Unrealized appreciation (depreciation). |
NOTE 4—Derivative Investments
Value of Derivative Investments at Period-End
The table below summarizes the value of the Fund’s derivative investments, detailed by primary risk exposure, held as of December 31, 2015:
| | | | | | | | |
| | | Value | |
| Risk Exposure/Derivative Type | | Assets | | | Liabilities | |
Credit risk: | | | | | | | | |
Swap agreements(a) | | $ | — | | | $ | (8,306 | ) |
Interest rate risk: | | | | | | | | |
Futures contracts(b) | | | 10,412 | | | | (9,533 | ) |
Total | | $ | 10,412 | | | $ | (17,839 | ) |
| (a) | Values are disclosed on the Statement of Assets and Liabilities under the caption Unrealized depreciation on swap agreements — OTC. |
| (b) | Includes cumulative appreciation (depreciation) of futures contracts. Only current day’s variation margin receivable is reported within the Statement of Assets and Liabilities. |
Effect of Derivative Investments for the year ended December 31, 2015
The table below summarizes the gains on derivative investments, detailed by primary risk exposure, recognized in earnings during the period:
| | | | | | | | |
| | | Location of Gain on
Statement of Operations | |
| | | Futures Contracts | | | Swap Agreements | |
Realized Gain: | | | | | | | | |
Credit risk | | $ | — | | | $ | 11,139 | |
Interest rate risk | | | 2,023 | | | | — | |
Change in Net Unrealized Appreciation: | | | | | | | | |
Credit risk | | | — | | | $ | 5,246 | |
Interest rate risk | | | 19,350 | | | | — | |
Total | | $ | 21,373 | | | $ | 16,385 | |
The table below summarizes the average notional value of futures contracts, and swap agreements outstanding during the period.
| | | | | | | | |
| | | Futures Contracts | | | Swap Agreements | |
Average notional value | | $ | 7,177,819 | | | $ | 324,250 | |
Invesco V.I. Core Plus Bond Fund
| | | | | | | | | | | | | | | | | | | | |
| Open Futures Contracts | |
| Futures Contracts | | Type of Contract | | | Number of Contracts | | | Expiration Month | | | Notional Value | | | Unrealized Appreciation (Depreciation) | |
U.S. Treasury 2 Year Notes | | | Long | | | | 4 | | | | March-2016 | | | $ | 868,938 | | | $ | (1,446 | ) |
U.S. Treasury 5 Year Notes | | | Long | | | | 15 | | | | March-2016 | | | | 1,774,805 | | | | (4,431 | ) |
U.S. Ultra Bond | | | Short | | | | 7 | | | | March-2016 | | | | (1,110,813 | ) | | | (3,656 | ) |
U.S. 10 Year Notes | | | Short | | | | 22 | | | | March-2016 | | | | (2,769,938 | ) | | | 10,412 | |
Total Futures Contracts — Interest Rate Risk | | | | | | | | | | | | | | $ | 879 | |
| | | | | | | | | | | | | | | | | | | | | | | | | | | | | | |
| Open Over-The-Counter Credit Default Swap Agreements — Credit Risk | |
| Counterparty | | Reference Entity | | Buy/Sell Protection | | | (Pay)/Receive Fixed Rate | | | Expiration Date | | | Implied Credit Spread(a) | | | Notional Value | | | Upfront Payments | | | Unrealized Appreciation (Depreciation) | |
Bank of America Merrill Lynch | | Citigroup Inc. | | | Buy | | | | (1.00 | )% | | | 06/20/17 | | | | 0.36 | % | | $ | 250,000 | | | $ | 5,964 | | | $ | (8,306 | ) |
| (a) | Implied credit spreads represent the current level as of December 31, 2015 at which protection could be bought or sold given the terms of the existing credit default swap contract and serve as an indicator of the current status of the payment/performance risk of the credit default swap contract. An implied credit spread that has widened or increased since entry into the initial contract may indicate a deteriorating credit profile and increased risk of default for the reference entity. A declining or narrowing spread may indicate an improving credit profile or decreased risk of default for the reference entity. Alternatively, credit spreads may increase or decrease reflecting the general tolerance for risk in the credit markets generally. |
Offsetting Assets and Liabilities
Accounting Standards Update (“ASU”) No. 2011-11, Disclosures about Offsetting Assets and Liabilities, which was subsequently clarified in Financial Accounting Standards Board ASU 2013-01 “Clarifying the Scope of Disclosures about Offsetting Assets and Liabilities” is intended to enhance disclosures about financial instruments and derivative instruments that are subject to offsetting arrangements on the Statement of Assets and Liabilities and to enable investors to better understand the effect of those arrangements on the Fund’s financial position. In order for an arrangement to be eligible for netting, the Fund must have a basis to conclude that such netting arrangements are legally enforceable. The Fund enters into netting agreements and collateral agreements in an attempt to reduce the Fund’s Counterparty credit risk by providing for a single net settlement with a Counterparty of all financial transactions covered by the agreement in an event of default as defined under such agreement.
The following tables present derivative instruments that are either subject to an enforceable netting agreement or offset by collateral arrangements as of December 31, 2015.
| | | | | | | | | | | | | | | | | | | | |
| | | Gross amounts
of Recognized Assets | | | Gross Amounts Not Offset in the
Statement of Assets and Liabilities | | | | |
| | | Financial Instruments | | | Collateral Received | | | Net
Amount | |
| Counterparty | | | | Non-Cash | | | Cash | | |
Bank of America Merrill Lynch | | $ | 5,964 | | | $ | (5,964 | ) | | $ | — | | | $ | — | | | $ | — | |
| | | | | |
| | | | | | | | | | | | | | | | | | | | |
| | | Gross amounts
of Recognized Liabilities | | | Gross Amounts Not Offset in the
Statement of Assets and Liabilities | | | | |
| | | Financial Instruments | | | Collateral Pledged | | | Net
Amount | |
| Counterparty | | | | Non-Cash | | | Cash | | |
Bank of America Merrill Lynch | | $ | 8,382 | | | $ | (5,964 | ) | | $ | — | | | $ | — | | | $ | 2,418 | |
NOTE 5—Security Transactions with Affiliated Funds
The Fund is permitted to purchase or sell securities from or to certain other Invesco Funds under specified conditions outlined in procedures adopted by the Board of Trustees of the Trust. The procedures have been designed to ensure that any purchase or sale of securities by the Fund from or to another fund or portfolio that is or could be considered an affiliate by virtue of having a common investment adviser (or affiliated investment advisers), common Trustees and/or common officers complies with Rule 17a-7 of the 1940 Act. Further, as defined under the procedures, each transaction is effected at the current market price. Pursuant to these procedures, for the year ended December 31, 2015, the Fund engaged in securities securities sales of $22,188, which resulted in net realized gains of $443.
NOTE 6—Trustees’ and Officers’ Fees and Benefits
Trustees’ and Officers’ Fees and Benefits include amounts accrued by the Fund to pay remuneration to certain Trustees and Officers of the Fund. Trustees have the option to defer compensation payable by the Fund, and Trustees’ and Officers’ Fees and Benefits also include amounts accrued by the Fund to fund such deferred compensation amounts. Those Trustees who defer compensation have the option to select various Invesco Funds in which their deferral accounts shall be deemed to be invested. Finally, certain current Trustees were eligible to participate in a retirement plan that provided for benefits to be paid upon retirement to Trustees over a period of time based on the number of years of service. The Fund may have certain former Trustees who also participate in a retirement plan and receive benefits under such plan. Trustees’ and Officers’ Fees and Benefits include amounts accrued by the Fund to fund such retirement benefits. Obligations under the deferred compensation and retirement plans represent unsecured claims against the general assets of the Fund.
Invesco V.I. Core Plus Bond Fund
NOTE 7—Cash Balances
The Fund may borrow for leveraging in an amount up to 5% of the Fund’s total assets (excluding the amount borrowed) at the time the borrowing is made. In doing so, the Fund is permitted to temporarily carry a negative or overdrawn balance in its account with State Street Bank and Trust Company, the custodian bank. Such balances, if any at period end, are shown in the Statement of Assets and Liabilities under the payable caption Amount due custodian. To compensate the custodian bank for such overdrafts, the overdrawn Fund may either (1) leave funds as a compensating balance in the account so the custodian bank can be compensated by earning the additional interest; or (2) compensate by paying the custodian bank at a rate agreed upon by the custodian bank and Invesco, not to exceed the contractually agreed upon rate. The Fund may not purchase additional securities when any borrowings from banks exceed 5% of the Fund’s total assets.
NOTE 8—Distributions to Shareholders and Tax Components of Net Assets
Tax Character of Distributions to Shareholders Paid During the Fiscal Years Ended December 31, 2015 and 2014:
| | | | | | | | |
| | | 2015 | | | 2014 | |
Ordinary income | | $ | 750,969 | | | $ | 941,224 | |
Tax Components of Net Assets at Period–End:
| | | | |
| | | 2015 | |
Undistributed ordinary income | | $ | 635,533 | |
Net unrealized appreciation (depreciation) — investments | | | (135,538 | ) |
Net unrealized appreciation (depreciation) — other investments | | | (8,306 | ) |
Temporary book/tax differences | | | (59,753 | ) |
Capital loss carryforward | | | (7,916,700 | ) |
Shares of beneficial interest | | | 23,227,965 | |
Total net assets | | $ | 15,743,201 | |
The difference between book-basis and tax-basis unrealized appreciation (depreciation) is due to differences in the timing of recognition of gains and losses on investments for tax and book purposes. The Fund’s net unrealized appreciation (depreciation) difference is attributable primarily to wash sales.
The temporary book/tax differences are a result of timing differences between book and tax recognition of income and/or expenses. The Fund’s temporary book/tax differences are the result of the trustee deferral of compensation and retirement plan benefits.
Capital loss carryforward is calculated and reported as of a specific date. Results of transactions and other activity after that date may affect the amount of capital loss carryforward actually available for the Fund to utilize. Capital losses generated in years beginning after December 22, 2010 can be carried forward for an unlimited period, whereas previous losses expire in eight tax years. Capital losses with an expiration period may not be used to offset capital gains until all net capital losses without an expiration date have been utilized. Capital loss carryforwards with no expiration date will retain their character as either short-term or long-term capital losses instead of as short-term capital losses as under prior law. The ability to utilize capital loss carryforwards in the future may be limited under the Internal Revenue Code and related regulations based on the results of future transactions.
The Fund has a capital loss carryforward as of December 31, 2015, which expires as follows:
| | | | | | | | | | | | |
| Capital Loss Carryforward* | |
| Expiration | | Short-Term | | | Long-Term | | | Total | |
December 31, 2016 | | $ | 557,608 | | | $ | — | | | $ | 557,608 | |
December 31, 2017 | | | 7,359,092 | | | | — | | | | 7,359,092 | |
| | | $ | 7,916,700 | | | $ | — | | | $ | 7,916,700 | |
| * | Capital loss carryforward as of the date listed above is reduced for limitations, if any, to the extent required by the Internal Revenue Code and may be further limited depending upon a variety of factors, including the realization of net unrealized gains or losses as of the date of any reorganization. |
NOTE 9—Investment Securities
The aggregate amount of investment securities (other than short-term securities, U.S. Treasury obligations and money market funds, if any) purchased and sold by the Fund during the year ended December 31, 2015 was $58,735,670 and $59,203,427, respectively. During the same period, purchases and sales of U.S. Treasury obligations were $17,821,698 and $16,403,222, respectively. Cost of investments on a tax basis includes the adjustments for financial reporting purposes as of the most recently completed federal income tax reporting period-end.
| | | | |
| Unrealized Appreciation (Depreciation) of Investment Securities on a Tax Basis | |
Aggregate unrealized appreciation of investment securities | | $ | 385,090 | |
Aggregate unrealized (depreciation) of investment securities | | | (520,628 | ) |
Net unrealized appreciation (depreciation) of investment securities | | $ | (135,538 | ) |
Cost of investments for tax purposes is $19,823,854.
Invesco V.I. Core Plus Bond Fund
NOTE 10—Reclassification of Permanent Differences
Primarily as a result of differing book/tax treatment of dollar rolls and swap transactions, on December 31, 2015, undistributed net investment income was increased by $45,160 and undistributed net realized gain (loss) was decreased by $45,160. This reclassification had no effect on the net assets of the Fund.
NOTE 11—Share Information
| | | | | | | | | | | | | | | | |
| | | Summary of Share Activity | |
| | | Years ended December 31, | |
| | | 2015(a) | | | 2014 | |
| | | Shares | | | Amount | | | Shares | | | Amount | |
Sold: | | | | | | | | | | | | | | | | |
Series I | | | 109,942 | | | $ | 689,898 | | | | 102,838 | | | $ | 668,280 | |
Series II | | | 1 | | | | 8 | | | | 1,535 | | | | 10,010 | |
| | | | |
Issued as reinvestment of dividends: | | | | | | | | | | | | | | | | |
Series I | | | 121,962 | | | | 743,970 | | | | 147,963 | | | | 933,648 | |
Series II | | | 1,080 | | | | 6,568 | | | | 1,128 | | | | 7,097 | |
| | | | |
Reacquired: | | | | | | | | | | | | | | | | |
Series I | | | (451,515 | ) | | | (2,880,024 | ) | | | (622,528 | ) | | | (4,032,897 | ) |
Series II | | | (515 | ) | | | (3,258 | ) | | | (5,168 | ) | | | (33,108 | ) |
Net increase (decrease) in share activity | | | (219,045 | ) | | $ | (1,442,838 | ) | | | (374,232 | ) | | $ | (2,446,970 | ) |
| (a) | There are entities that are a record owner of more than 5% of the outstanding shares of the Fund and in the aggregate own 79% of the outstanding shares of the Fund. The Fund and the Fund’s principal underwriter or adviser, are parties to participation agreements with these entities whereby these entities sell units of interest in separate accounts funding variable products that are invested in the Fund. The Fund, Invesco and/or Invesco affiliates may make payments to these entities, which are considered to be related to the Fund, for providing services to the Fund, Invesco and/or Invesco affiliates including but not limited to services such as, securities brokerage, third party record keeping and account servicing and administrative services. The Fund has no knowledge as to whether all or any portion of the shares owned of record by these entities are also owned beneficially. |
NOTE 12—Financial Highlights
The following schedule presents financial highlights for a share of the Fund outstanding throughout the periods indicated.
| | | | | | | | | | | | | | | | | | | | | | | | | | | | | | | | | | | | | | | | | | | | | | | | |
| | | Net asset
value,
beginning
of period | | | Net
investment
income(a) | | | Net gains
(losses) on securities (both
realized and
unrealized) | | | Total from
investment operations | | | Dividends
from net
investment income | | | Net asset value, end of period | | | Total
return(b) | | | Net assets, end of period (000’s omitted) | | | Ratio of
expenses to average net assets
with fee waivers
and/or expenses
absorbed | | | Ratio of
expenses
to average net
assets without fee waivers
and/or expenses
absorbed | | | Ratio of net
investment
income to average
net assets | | | Portfolio
turnover(c) | |
Series I | | | | | | | | | | | | | | | | | | | | | | | | | | | | | | | | | | | | | | | | | | | | | | | | |
Year ended 12/31/15 | | $ | 6.39 | | | $ | 0.24 | | | $ | (0.26 | ) | | $ | (0.02 | ) | | $ | (0.30 | ) | | $ | 6.07 | | | | (0.37 | )% | | $ | 15,587 | | | | 0.65 | %(d) | | | 1.73 | %(d) | | | 3.81 | %(d) | | | 416 | % |
Year ended 12/31/14 | | | 6.23 | | | | 0.26 | | | | 0.24 | | | | 0.50 | | | | (0.34 | ) | | | 6.39 | | | | 8.03 | | | | 17,821 | | | | 0.75 | | | | 1.77 | | | | 4.04 | | | | 255 | |
Year ended 12/31/13 | | | 6.54 | | | | 0.27 | | | | (0.27 | ) | | | 0.00 | | | | (0.31 | ) | | | 6.23 | | | | 0.05 | | | | 19,671 | | | | 0.75 | | | | 1.76 | | | | 4.18 | | | | 150 | |
Year ended 12/31/12 | | | 6.19 | | | | 0.27 | | | | 0.39 | | | | 0.66 | | | | (0.31 | ) | | | 6.54 | | | | 10.71 | | | | 22,741 | | | | 0.75 | | | | 1.49 | | | | 4.19 | | | | 66 | |
Year ended 12/31/11 | | | 6.10 | | | | 0.29 | | | | 0.13 | | | | 0.42 | | | | (0.33 | ) | | | 6.19 | | | | 7.02 | | | | 22,333 | | | | 0.75 | | | | 1.46 | | | | 4.71 | | | | 59 | |
Series II | | | | | | | | | | | | | | | | | | | | | | | | | | | | | | | | | | | | | | | | | | | | | | | | |
Year ended 12/31/15 | | | 6.36 | | | | 0.22 | | | | (0.26 | ) | | | (0.04 | ) | | | (0.28 | ) | | | 6.04 | | | | (0.64 | ) | | | 156 | | | | 0.90 | (d) | | | 1.98 | (d) | | | 3.56 | (d) | | | 416 | |
Year ended 12/31/14 | | | 6.19 | | | | 0.24 | | | | 0.24 | | | | 0.48 | | | | (0.31 | ) | | | 6.36 | | | | 7.85 | | | | 161 | | | | 1.00 | | | | 2.02 | | | | 3.79 | | | | 255 | |
Year ended 12/31/13 | | | 6.50 | | | | 0.25 | | | | (0.27 | ) | | | (0.02 | ) | | | (0.29 | ) | | | 6.19 | | | | (0.26 | ) | | | 172 | | | | 1.00 | | | | 2.01 | | | | 3.93 | | | | 150 | |
Year ended 12/31/12 | | | 6.16 | | | | 0.25 | | | | 0.38 | | | | 0.63 | | | | (0.29 | ) | | | 6.50 | | | | 10.38 | | | | 277 | | | | 1.00 | | | | 1.74 | | | | 3.94 | | | | 66 | |
Year ended 12/31/11 | | | 6.07 | | | | 0.28 | | | | 0.13 | | | | 0.41 | | | | (0.32 | ) | | | 6.16 | | | | 6.72 | | | | 227 | | | | 1.00 | | | | 1.71 | | | | 4.46 | | | | 59 | |
| (a) | Calculated using average shares outstanding. |
| (b) | Includes adjustments in accordance with accounting principles generally accepted in the United States of America and as such, the net asset value for financial reporting purposes and the returns based upon those net asset values may differ from the net asset value and returns for shareholder transactions. Total returns are not annualized for periods less than one year, if applicable, and do not reflect charges assessed in connection with a variable product, which if included would reduce total returns. |
| (c) | Portfolio turnover is calculated at the fund level and is not annualized for periods less than one year, if applicable. |
| (d) | Ratios are based on average daily net assets (000’s omitted) of $16,800 and $160 for Series I and Series II shares, respectively. |
Invesco V.I. Core Plus Bond Fund
Report of Independent Registered Public Accounting Firm
To the Board of Trustees of AIM Variable Insurance Funds (Invesco Variable Insurance Funds)
and Shareholders of Invesco V.I. Core Plus Bond Fund:
In our opinion, the accompanying statement of assets and liabilities, including the schedule of investments, and the related statements of operations and of changes in net assets and the financial highlights present fairly, in all material respects, the financial position of Invesco V.I. Core Plus Bond Fund (formerly known as Invesco V.I. Diversified Income Fund; one of the funds constituting AIM Variable Insurance Funds (Invesco Variable Insurance Funds), hereafter referred to as the “Fund”) at December 31, 2015, the results of its operations for the year then ended, the changes in its net assets for each of the two years in the period then ended and the financial highlights for each of the five years in the period then ended, in conformity with accounting principles generally accepted in the United States of America. These financial statements and financial highlights (hereafter referred to as “financial statements”) are the responsibility of the Fund’s management. Our responsibility is to express an opinion on these financial statements based on our audits. We conducted our audits of these financial statements in accordance with the standards of the Public Company Accounting Oversight Board (United States). Those standards require that we plan and perform the audit to obtain reasonable assurance about whether the financial statements are free of material misstatement. An audit includes examining, on a test basis, evidence supporting the amounts and disclosures in the financial statements, assessing the accounting principles used and significant estimates made by management, and evaluating the overall financial statement presentation. We believe that our audits, which included confirmation of securities at December 31, 2015 by correspondence with the custodian and brokers, and the application of alternative auditing procedures where confirmations of security purchases have not been received, provide a reasonable basis for our opinion.
PRICEWATERHOUSECOOPERS LLP
Houston, Texas
February 15, 2016
Invesco V.I. Core Plus Bond Fund
Calculating your ongoing Fund expenses
Example
As a shareholder of the Fund, you incur ongoing costs, including management fees; distribution and/or service fees (12b-1); and other Fund expenses. This example is intended to help you understand your ongoing costs (in dollars) of investing in the Fund and to compare these costs with ongoing costs of investing in other mutual funds. The example is based on an investment of $1,000 invested at the beginning of the period and held for the entire period July 1, 2015 through December 31, 2015.
The actual and hypothetical expenses in the examples below do not represent the effect of any fees or other expenses assessed in connection with a variable product; if they did, the expenses shown would be higher while the ending account values shown would be lower.
Actual expenses
The table below provides information about actual account values and actual expenses. You may use the information in this table, together with the amount you invested, to estimate the expenses that you paid over the period. Simply divide your account value by $1,000 (for example, an $8,600 account value divided by $1,000 = 8.6), then multiply the result by the number in the table under the heading entitled “Actual Expenses Paid During Period” to estimate the expenses you paid on your account during this period.
Hypothetical example for comparison purposes
The table below also provides information about hypothetical account values and hypothetical expenses based on the Fund’s actual expense ratio and an assumed rate of return of 5% per year before expenses, which is not the Fund’s actual return.
The hypothetical account values and expenses may not be used to estimate the actual ending account balance or expenses you paid for the period. You may use this information to compare the ongoing costs of investing in the Fund and other funds. To do so, compare this 5% hypothetical example with the 5% hypothetical examples that appear in the shareholder reports of the other funds.
Please note that the expenses shown in the table are meant to highlight your ongoing costs. Therefore, the hypothetical information is useful in comparing ongoing costs, and will not help you determine the relative total costs of owning different funds.
| | | | | | | | | | | | | | | | | | | | | | | | |
| Class | | Beginning Account Value (07/01/15) | | | ACTUAL | | | HYPOTHETICAL (5% annual return before
expenses) | | | Annualized Expense Ratio | |
| | | Ending Account Value (12/31/15)1 | | | Expenses Paid During Period2 | | | Ending Account Value (12/31/15) | | | Expenses Paid During Period2 | | |
| Series I | | $ | 1,000.00 | | | $ | 991.70 | | | $ | 3.01 | | | $ | 1,022.18 | | | $ | 3.06 | | | | 0.60 | % |
| Series II | | | 1,000.00 | | | | 990.50 | | | | 4.26 | | | | 1,020.92 | | | | 4.33 | | | | 0.85 | |
| 1 | The actual ending account value is based on the actual total return of the Fund for the period July 1, 2015 through December 31, 2015, after actual expenses and will differ from the hypothetical ending account value which is based on the Fund’s expense ratio and a hypothetical annual return of 5% before expenses. |
| 2 | Expenses are equal to the Fund’s annualized expense ratio as indicated above multiplied by the average account value over the period, multiplied by 184/365 to reflect the most recent fiscal half year. |
Invesco V.I. Core Plus Bond Fund
Tax Information
Form 1099-DIV, Form 1042-S and other year–end tax information provide shareholders with actual calendar year amounts that should be included in their tax returns. Shareholders should consult their tax advisors.
The following distribution information is being provided as required by the Internal Revenue Code or to meet a specific state’s requirement.
The Fund designates the following amounts or, if subsequently determined to be different, the maximum amount allowable for its fiscal year ended December 31, 2015:
| | | | |
Federal and State Income Tax | |
Corporate Dividends Received Deduction* | | | 2.53 | % |
U.S. Treasury Obligations* | | | 3.19 | % |
| | * | The above percentages are based on ordinary income dividends paid to shareholders during the Fund’s fiscal year. |
Invesco V.I. Core Plus Bond Fund
Trustees and Officers
The address of each trustee and officer is AIM Variable Insurance Funds (Invesco Variable Insurance Funds) (the “Trust”), 11 Greenway Plaza, Suite 1000, Houston, Texas 77046-1173. The trustees serve for the life of the Trust, subject to their earlier death, incapacitation, resignation, retirement or removal as more specifically provided in the Trust’s organizational documents. Each officer serves for a one year term or until their successors are elected and qualified. Column two below includes length of time served with predecessor entities, if any.
| | | | | | | | |
Name, Year of Birth and
Position(s) Held with the Trust | | Trustee and/
or Officer Since | | Principal Occupation(s)
During Past 5 Years | | Number of Funds in Fund Complex Overseen by Trustee | | Other Directorship(s) Held by Trustee During Past 5 Years |
| Interested Persons | | | | | | | | |
| Martin L. Flanagan1 — 1960 Trustee | | 2007 | | Executive Director, Chief Executive Officer and President, Invesco Ltd. (ultimate parent of Invesco and a global investment management firm); Advisor to the Board, Invesco Advisers, Inc. (formerly known as Invesco Institutional (N.A.), Inc.); Trustee, The Invesco Funds; Vice Chair, Investment Company Institute; and Member of Executive Board, SMU Cox School of Business Formerly: Chairman and Chief Executive Officer, Invesco Advisers, Inc. (registered investment adviser); Director, Chairman, Chief Executive Officer and President, IVZ Inc. (holding company), INVESCO Group Services, Inc. (service provider) and Invesco North American Holdings, Inc. (holding company); Director, Chief Executive Officer and President, Invesco Holding Company Limited (parent of Invesco and a global investment management firm); Director, Invesco Ltd.; Chairman, Investment Company Institute and President, Co-Chief Executive Officer, Co-President, Chief Operating Officer and Chief Financial Officer, Franklin Resources, Inc. (global investment management organization) | | 146 | | None |
Philip A. Taylor2 — 1954 Trustee, President and Principal Executive Officer | | 2006 | | Head of North American Retail and Senior Managing Director, Invesco Ltd.; Director, Co-Chairman, Co-President and Co-Chief Executive Officer, Invesco Advisers, Inc. (formerly known as Invesco Institutional (N.A.), Inc.) (registered investment adviser); Director, Chairman, Chief Executive Officer and President, Invesco Management Group, Inc. (formerly known as Invesco Aim Management Group, Inc.) (financial services holding company); Director and Chairman, Invesco Investment Services, Inc. (formerly known as Invesco Aim Investment Services, Inc.) (registered transfer agent) Chief Executive Officer, Invesco Corporate Class Inc. (corporate mutual fund company) Director, Chairman and Chief Executive Officer, Invesco Canada Ltd. (formerly known as Invesco Trimark Ltd./Invesco Trimark Ltèe) (registered investment adviser and registered transfer agent); Trustee, President and Principal Executive Officer, The Invesco Funds (other than AIM Treasurer’s Series Trust (Invesco Treasurer’s Series Trust), Short-Term Investments Trust and Invesco Management Trust); Trustee and Executive Vice President, The Invesco Funds (AIM Treasurer’s Series Trust (Invesco Treasurer’s Series Trust), Short-Term Investments Trust and Invesco Management Trust only); Director, Invesco Investment Advisers LLC (formerly known as Van Kampen Asset Management); Director, Chief Executive Officer and President, Van Kampen Exchange Corp. Formerly: Director and President, INVESCO Funds Group, Inc. (registered investment adviser and registered transfer agent); Director and Chairman, IVZ Distributors, Inc. (formerly known as INVESCO Distributors, Inc.) (registered broker dealer); Director, President and Chairman, Invesco Inc. (holding company), Invesco Canada Holdings Inc. (holding company), Trimark Investments Ltd./Placements Trimark Ltèe and Invesco Financial Services Ltd/Services Financiers Invesco Ltèe; Chief Executive Officer, Invesco Canada Fund Inc (corporate mutual fund company); Director and Chairman, Van Kampen Investor Services Inc.; Director, Chief Executive Officer and President, 1371 Preferred Inc. (holding company) and Van Kampen Investments Inc.; Director and President, AIM GP Canada Inc. (general partner for limited partnerships) and Van Kampen Advisors, Inc.; Director and Chief Executive Officer, Invesco Trimark Dealer Inc. (registered broker dealer); Director, Invesco Distributors, Inc. (formerly known as Invesco Aim Distributors, Inc.) (registered broker dealer); Manager, Invesco PowerShares Capital Management LLC; Director, Chief Executive Officer and President, Invesco Advisers, Inc.; Director, Chairman, Chief Executive Officer and President, Invesco Aim Capital Management, Inc.; President, Invesco Trimark Dealer Inc. and Invesco Trimark Ltd./Invesco Trimark Ltèe; Director and President, AIM Trimark Corporate Class Inc. and AIM Trimark Canada Fund Inc.; Senior Managing Director, Invesco Holding Company Limited; Director and Chairman, Fund Management Company (former registered broker dealer); President and Principal Executive Officer, The Invesco Funds (AIM Treasurer’s Series Trust (Invesco Treasurer’s Series Trust), and Short-Term Investments Trust only); President, AIM Trimark Global Fund Inc. and AIM Trimark Canada Fund Inc | | 146 | | None |
| 1 | Mr. Flanagan is considered an interested person (within the meaning of Section 2(a)(19) of the 1940 Act) of the Trust because he is an officer of the Adviser to the Trust, and an officer and a director of Invesco Ltd., ultimate parent of the Adviser. |
| 2 | Mr. Taylor is considered an interested person (within the meaning of Section 2(a)(19) of the 1940 Act) of the Trust because he is an officer and a director of the Adviser. |
Invesco V.I. Core Plus Bond Fund
Trustees and Officers—(continued)
| | | | | | | | |
Name, Year of Birth and
Position(s) Held with the Trust | | Trustee and/
or Officer Since | | Principal Occupation(s)
During Past 5 Years | | Number of Funds in Fund Complex Overseen by Trustee | | Other Directorship(s)
Held by Trustee During Past 5 Years |
| Independent Trustees | | | | | | | | |
Bruce L. Crockett — 1944 Trustee and Chair | | 2003 | | Chairman, Crockett Technologies Associates (technology consulting company) Formerly: Director, Captaris (unified messaging provider); Director, President and Chief Executive Officer, COMSAT Corporation; Chairman, Board of Governors of INTELSAT (international communications company); ACE Limited (insurance company); Independent Directors Council and Investment Company Institute | | 146 | | ALPS (Attorneys Liability Protection Society) (insurance company) and Globe Specialty Metals, Inc. (metallurgical company) |
David C. Arch — 1945 Trustee | | 2010 | | Chairman of Blistex Inc., a consumer health care products manufacturer | | 146 | | Board member of the Illinois Manufacturers’ Association; Member of the Board of Visitors, Institute for the Humanities, University of Michigan |
James T. Bunch — 1942 Trustee | | 2000 | | Managing Member, Grumman Hill Group LLC (family office/private equity investments) Formerly: Chairman of the Board of Trustees, Evans Scholars Foundation and Chairman, Board of Governors, Western Golf Association | | 146 | | Trustee, Evans Scholars Foundation; and Chairman of the Board, Denver Film Society |
Albert R. Dowden — 1941 Trustee | | 2003 | | Director of a number of public and private business corporations, including the Boss Group, Ltd. (private investment and management); Nature’s Sunshine Products, Inc. and Reich & Tang Funds (5 portfolios) (registered investment company) Formerly: Director, Homeowners of America Holding Corporation/Homeowners of America Insurance Company (property casualty company); Director, Continental Energy Services, LLC (oil and gas pipeline service); Director, CompuDyne Corporation (provider of product and services to the public security market) and Director, Annuity and Life Re (Holdings), Ltd. (reinsurance company); Director, President and Chief Executive Officer, Volvo Group North America, Inc.; Senior Vice President, AB Volvo; Director of various public and private corporations; Chairman, DHJ Media, Inc.; Director, Magellan Insurance Company; and Director, The Hertz Corporation, Genmar Corporation (boat manufacturer), National Media Corporation; Advisory Board of Rotary Power International (designer, manufacturer, and seller of rotary power engines); and Chairman, Cortland Trust, Inc. (registered investment company) | | 146 | | Director of: Nature’s Sunshine Products, Inc., Reich & Tang Funds, Homeowners of America Holding Corporation/ Homeowners of America Insurance Company, the Boss Group |
Jack M. Fields — 1952 Trustee | | 2003 | | Chief Executive Officer, Twenty First Century Group, Inc. (government affairs company); Owner and Chief Executive Officer, Dos Angeles Ranch, L.P. (cattle, hunting, corporate entertainment); and Discovery Global Education Fund (non-profit) Formerly: Chief Executive Officer, Texana Timber LP (sustainable forestry company); Director of Cross Timbers Quail Research Ranch (non-profit); and member of the U.S. House of Representatives | | 146 | | Insperity, Inc. (formerly known as Administaff) |
Eli Jones — Trustee | | 2016 | | Professor and Dean, Mays Business School, Texas A&M University Formerly: Professor and Dean, Walton College of Business, University of Arkansas, and E.J. Ourso College of Business, Louisiana State University | | 146 | | Director, Insperity, Inc., (2011-present) and ARVEST Bank (2012-2015) |
Prema Mathai-Davis — 1950 Trustee | | 2003 | | Retired. Formerly: Chief Executive Officer, YWCA of the U.S.A. | | 146 | | None |
Larry Soll — 1942 Trustee | | 1997 | | Retired. Formerly: Chairman, Chief Executive Officer and President, Synergen Corp. (a biotechnology company) | | 146 | | None |
Robert C. Troccoli — Trustee | | 2016 | | Retired. Formerly: Senior Partner, KPMG LLP | | 146 | | None |
Raymond Stickel, Jr. — 1944 Trustee | | 2005 | | Retired. Formerly: Director, Mainstay VP Series Funds, Inc. (25 portfolios) and Partner, Deloitte & Touche | | 146 | | None |
Suzanne H. Woolsey — 1941 Trustee | | 2014 | | Chief Executive Officer of Woolsey Partners LLC | | 146 | | Emeritus Chair of the Board of Trustees of the Institute for Defense Analyses; Trustee of Colorado College; Trustee of California Institute of Technology; Prior to 2014, Director of Fluor Corp.; Prior to 2010, Trustee of the German Marshall Fund of the United States; Prior to 2010 Trustee of the Rocky Mountain Institute |
Invesco V.I. Core Plus Bond Fund
Trustees and Officers—(continued)
| | | | | | | | |
Name, Year of Birth and
Position(s) Held with the Trust | | Trustee and/
or Officer Since | | Principal Occupation(s)
During Past 5 Years | | Number of Funds in Fund Complex Overseen by Trustee | | Other Directorship(s)
Held by Trustee During Past 5 Years |
| Other Officers | | | | | | | | |
Russell C. Burk — 1958 Senior Vice President and Senior Officer | | 2005 | | Senior Vice President and Senior Officer, The Invesco Funds | | N/A | | N/A |
John M. Zerr — 1962 Senior Vice President, Chief Legal Officer and Secretary | | 2006 | | Director, Senior Vice President, Secretary and General Counsel, Invesco Management Group, Inc. (formerly known as Invesco Aim Management Group, Inc.) and Van Kampen Exchange Corp.; Senior Vice President, Invesco Advisers, Inc. (formerly known as Invesco Institutional (N.A.), Inc.) (registered investment adviser); Senior Vice President and Secretary, Invesco Distributors, Inc. (formerly known as Invesco Aim Distributors, Inc.); Director, Vice President and Secretary, Invesco Investment Services, Inc. (formerly known as Invesco Aim Investment Services, Inc.); Senior Vice President, Chief Legal Officer and Secretary, The Invesco Funds; Managing Director, Invesco PowerShares Capital Management LLC; Director, Secretary and General Counsel, Invesco Investment Advisers LLC (formerly known as Van Kampen Asset Management); Secretary and General Counsel, Invesco Capital Markets, Inc. (formerly known as Van Kampen Funds Inc.) and Chief Legal Officer, PowerShares Exchange-Traded Fund Trust, PowerShares Exchange-Traded Fund Trust II, PowerShares India Exchange-Traded Fund Trust, PowerShares Actively Managed Exchange-Traded Fund Trust, and PowerShares Actively Managed Exchange-Traded Commodity Fund Trust Formerly: Director, Vice President and Secretary, IVZ Distributors, Inc. (formerly known as INVESCO distributors, Inc.); Director and Vice President, INVESCO Funds Group, Inc.; Director and Vice President, Van Kampen Advisors Inc.; Director, Vice President, Secretary and General Counsel, Van Kampen Investor Services Inc.; Director, Invesco Distributors, Inc. (formerly known as Invesco Aim Distributors, Inc.); Director, Senior Vice President, General Counsel and Secretary, Invesco Aim Advisers, Inc. and Van Kampen Investments Inc.; Director, Vice President and Secretary, Fund Management Company; Director, Senior Vice President, Secretary, General Counsel and Vice President, Invesco Aim Capital Management, Inc.; Chief Operating Officer and General Counsel, Liberty Ridge Capital, Inc. (an investment adviser); Vice President and Secretary, PBHG Funds (an investment company) and PBHG Insurance Series Fund (an investment company); Chief Operating Officer, General Counsel and Secretary, Old Mutual Investment Partners (a broker-dealer); General Counsel and Secretary, Old Mutual Fund Services (an administrator) and Old Mutual Shareholder Services (a shareholder servicing center); Executive Vice President, General Counsel and Secretary, Old Mutual Capital, Inc. (an investment adviser); and Vice President and Secretary, Old Mutual Advisors Funds (an investment company) | | N/A | | N/A |
Sheri Morris — 1964 Vice President, Treasurer and Principal Financial Officer | | 2003 | | Vice President, Treasurer and Principal Financial Officer, The Invesco Funds; Vice President, Invesco Advisers, Inc. (formerly known as Invesco Institutional (N.A.), Inc.) (registered investment adviser); and Vice President, PowerShares Exchange-Traded Fund Trust, PowerShares Exchange-Traded Fund Trust II, PowerShares India Exchange-Traded Fund Trust, PowerShares Actively Managed Exchange-Traded Fund Trust, and PowerShares Actively Managed Exchange-Traded Commodity Fund Trust Formerly: Vice President, Invesco Aim Advisers, Inc., Invesco Aim Capital Management, Inc. and Invesco Aim Private Asset Management, Inc.; Assistant Vice President and Assistant Treasurer, The Invesco Funds and Assistant Vice President, Invesco Advisers, Inc., Invesco Aim Capital Management, Inc. and Invesco Aim Private Asset Management, Inc.; and Treasurer, PowerShares Exchange-Traded Fund Trust, PowerShares Exchange-Traded Fund Trust II, PowerShares India Exchange-Traded Fund Trust and PowerShares Actively Managed Exchange-Traded Fund Trust | | N/A | | N/A |
Invesco V.I. Core Plus Bond Fund
Trustees and Officers—(continued)
| | | | | | | | |
Name, Year of Birth and
Position(s) Held with the Trust | | Trustee and/
or Officer Since | | Principal Occupation(s)
During Past 5 Years | | Number of Funds in Fund Complex Overseen by Trustee | | Other Directorship(s)
Held by Trustee During Past 5 Years |
| Other Officers—(continued) | | | | | | | | |
Karen Dunn Kelley — 1960 Vice President | | 2003 | | Senior Managing Director, Investments, Invesco Ltd.; Director, Co-President, Co-Chief Executive Officer, and Co-Chairman, Invesco Advisers, Inc. (formerly known as Invesco Institutional (N.A.), Inc.) (registered investment adviser); Chairman, Invesco Senior Secured Management, Inc.; Senior Vice President, Invesco Management Group, Inc. (formerly known as Invesco Aim Management Group, Inc.); Executive Vice President, Invesco Distributors, Inc. (formerly known as Invesco Aim Distributors, Inc.); Director, Invesco Mortgage Capital Inc. and Invesco Management Company Limited; Vice President, The Invesco Funds (other than AIM Treasurer’s Series Trust (Invesco Treasurer’s Series Trust), Short-Term Investments Trust and Invesco Management Trust); and President and Principal Executive Officer, The Invesco Funds (AIM Treasurer’s Series Trust (Invesco Treasurer’s Series Trust), Short-Term Investments Trust and Invesco Management Trust only) Formerly: Director and President, INVESCO Asset Management (Bermuda) Ltd., Director, INVESCO Global Asset Management Limited and INVESCO Management S.A.; Senior Vice President, Van Kampen Investments Inc. and Invesco Advisers, Inc. (formerly known as Invesco Institutional (N.A.), Inc.) (registered investment adviser); Vice President, Invesco Advisers, Inc. (formerly known as Invesco Institutional (N.A.), Inc.); Director of Cash Management and Senior Vice President, Invesco Advisers, Inc. and Invesco Aim Capital Management, Inc.; Director and President, Fund Management Company; Chief Cash Management Officer, Director of Cash Management, Senior Vice President, and Managing Director, Invesco Aim Capital Management, Inc.; Director of Cash Management, Senior Vice President, and Vice President, Invesco Advisers, Inc. and The Invesco Funds (AIM Treasurer’s Series Trust (Invesco Treasurer’s Series Trust), and Short-Term Investments Trust only) | | N/A | | N/A |
Crissie M. Wisdom — 1969 Anti-Money Laundering Compliance Officer | | 2013 | | Anti-Money Laundering Compliance Officer, Invesco Advisers, Inc. (formerly known as Invesco Institutional (N.A.), Inc.) (registered investment adviser), Invesco Capital Markets, Inc. (formerly known as Van Kampen Funds Inc.), Invesco Distributors, Inc., Invesco Investment Services, Inc., Invesco Management Group, Inc., Van Kampen Exchange Corp., The Invesco Funds, and PowerShares Exchange-Traded Fund Trust, PowerShares Exchange-Traded Fund Trust II, PowerShares India Exchange-Traded Fund Trust, PowerShares Actively Managed Exchange-Traded Fund Trust and PowerShares Actively Managed Exchange-Traded Commodity Fund Trust; Anti-Money Laundering Compliance Officer and Bank Secrecy Act Officer, INVESCO National Trust Company and Invesco Trust Company; and Fraud Prevention Manager and Controls and Risk Analysis Manager for Invesco Investment Services, Inc. | | N/A | | N/A |
Lisa O. Brinkley — 1959 Chief Compliance Officer | | 2015 | | Senior Vice President and Chief Compliance Officer, Invesco Advisers, Inc. (registered investment adviser) (formerly known as Invesco Institutional (N.A., Inc.); and Chief Compliance Officer, The Invesco Funds Formerly: Global Assurance Officer, Invesco Ltd. and Vice President, The Invesco Funds; Chief Compliance Officer, Invesco Distributors, Inc. (formerly known as Invesco Aim Distributors, Inc.), Invesco Investment Services, Inc.(formerly known as Invesco Aim Investment Services, Inc.) and Van Kampen Investor Services Inc.; Senior Vice President, Invesco Management Group, Inc.; Senior Vice President and Chief Compliance Officer, Invesco Advisers, Inc. and The Invesco Funds; Vice President and Chief Compliance Officer, Invesco Aim Capital Management, Inc. and Invesco Distributors, Inc.; Vice President, Invesco Investment Services, Inc. and Fund Management Company | | N/A | | N/A |
The Statement of Additional Information of the Trust includes additional information about the Fund’s Trustees and is available upon request, without charge, by calling 1.800.959.4246. Please refer to the Fund’s prospectus for information on the Fund’s sub-advisers.
| | | | | | |
Office of the Fund 11 Greenway Plaza, Suite 1000 Houston, TX 77046-1173 | | Investment Adviser Invesco Advisers, Inc. 1555 Peachtree Street, N.E. Atlanta, GA 30309 | | Distributor Invesco Distributors, Inc. 11 Greenway Plaza, Suite 1000 Houston, TX 77046-1173 | | Auditors PricewaterhouseCoopers LLP 1000 Louisiana Street, Suite 5800 Houston, TX 77002-5678 |
| | | |
| | | | | | |
Counsel to the Fund Stradley Ronon Stevens & Young, LLP 2005 Market Street, Suite 2600 Philadelphia, PA 19103-7018 | | Counsel to the Independent Trustees Goodwin Procter LLP 901 New York Avenue, N.W. Washington, D.C. 20001 | | Transfer Agent Invesco Investment Services, Inc. 11 Greenway Plaza, Suite 1000 Houston, TX 77046-1173 | | Custodian State Street Bank and Trust Company 225 Franklin Street Boston, MA 02110-2801 |
Invesco V.I. Core Plus Bond Fund
| | | | |
| | |
 | | Annual Report to Shareholders | | December 31, 2015 |
| | |
| | Invesco V.I. Diversified Dividend Fund |

| | |
| | The Fund provides a complete list of its holdings four times in each fiscal year, at the quarter-ends. For the second and fourth quarters, the lists appear in the Fund’s semiannual and annual reports to shareholders. For the first and third quarters, the Fund files the lists with the Securities and Exchange Commission (SEC) on Form N-Q. The Fund’s Form N-Q filings are available on the SEC website, sec.gov. Copies of the Fund’s Forms N-Q may be reviewed and copied at the SEC Public Reference Room in Washington, D.C. You can obtain information on the operation of the Public Reference Room, including information about duplicating fee charges, by calling 202 551 8090 or 800 732 0330, or by electronic request at the following email address: publicinfo@sec.gov. The SEC file numbers for the Fund are 811-07452 and 033-57340. The Fund’s most recent portfolio holdings, as filed on Form N-Q, have also been made available to insurance companies issuing variable annuity contracts and variable life insurance policies (“variable products”) that invest in the Fund. A description of the policies and procedures that the Fund uses to determine how to vote proxies relating to portfolio securities is available without charge, upon request, from our Client Services department at 800 959 4246 or at invesco.com/proxyguidelines. The information is also available on the SEC website, sec.gov. Information regarding how the Fund voted proxies related to its portfolio securities during the most recent 12-month period ended June 30 is available at invesco.com/ proxysearch. The information is also available on the SEC website, sec.gov. Invesco Advisers, Inc. is an investment adviser; it provides investment advisory services to individual and institutional clients and does not sell securities. Invesco Distributors, Inc. is the US distributor for Invesco Ltd.’s retail mutual funds, exchange-traded funds and institutional money market funds. Both are wholly owned, indirect subsidiaries of Invesco Ltd. This report must be accompanied or preceded by a currently effective Fund prospectus and variable product prospectus, which contain more complete information, including sales charges and expenses. Investors should read each carefully before investing. Invesco Distributors, Inc. VIDDI-AR-1 NOT FDIC INSURED | MAY LOSE VALUE | NO BANK GUARANTEE |
Management’s Discussion of Fund Performance
Performance summary
For the year ended December 31, 2015, Series I shares of Invesco V.I. Diversified Dividend Fund (the Fund) outperformed the Russell 1000 Value Index, the Fund’s style-specific benchmark.
Your Fund’s long-term performance appears later in this report.
Fund vs. Indexes
Total returns, 12/31/14 to 12/31/15, excluding variable product issuer charges.
If variable product issuer charges were included, returns would be lower.
| | | | | |
| Series I Shares | | | | 2.07 | % |
| Series II Shares | | | | 1.82 | |
| S&P 500 Index▼ (Broad Market Index) | | | | 1.38 | |
| Russell 1000 Value Index▼ (Style-Specific Index) | | | | -3.83 | |
| Lipper VUF Large-Cap Value Funds Indexn (Peer Group Index) | | | | -3.86 | |
Source(s): ▼FactSet Research Systems Inc.; nLipper Inc.
Market conditions and your Fund
During the year ended December 31, 2015, the US economy improved slowly, though the health of individual economic sectors varied dramatically. The energy sector saw a continued slowdown as oil prices fell in response to increasing supply and slowing global demand. In contrast, continued low interest rates, increased availability of credit and a better employment picture all contributed to an improved consumer outlook. However, US equity markets moved lower in the summer of 2015 as a significant downturn in China’s financial markets and weak global economic growth led to increased investor uncertainty and market volatility. In the fall of 2015, US markets rallied, the Federal Reserve saw enough economic stabilization to finally raise interest rates, and most major US market indexes ended the year barely in positive territory.
During the reporting period, our total return approach continued to emphasize long-term capital appreciation, current income and capital preservation. We believe the Fund may serve as an equity foundation within a well-diversified asset
allocation strategy, complementing more aggressive and cyclical investments. As always, we look for dividend-paying companies with strong profitability, solid balance sheets and capital allocation policies that support sustained or increasing dividends and share repurchases. We perform extensive fundamental research, incorporating both financial statement analysis and an assessment of the potential reward relative to the downside risk, to determine a fair valuation over our two- to three-year investment horizon for each stock. We believe this process may provide a valuable combination of dividend income, price appreciation and capital preservation. We also maintain a rigorous sell discipline and consider selling or reducing shares in stocks that no longer meet our investment criteria.
The Fund’s investments in the consumer staples sector performed well during the year and provided the largest contribution to Fund returns. Kraft Heinz (formerly Kraft Foods Group), Campbell Soup and Heineken were among the largest contributors to Fund performance. Kraft Foods Group accepted an attractive offer to merge with H.J. Heinz.
We believed the new combined company had the opportunity to improve profitability through cost savings and to grow revenues through better leverage of its international distribution network. After the merger closed in July 2015, the combined company improved total operating margins and returned to organic top-line growth in Europe. Campbell Soup’s margins improved as it restructured divisions and adopted new budgeting practices, both aimed at reducing costs. The company also gained shelf space in stores with product innovation and expanded offerings in packaged fresh categories.
Select financials sector holdings also performed well relative to the style-spe-cific benchmark during the reporting period, including Stancorp Financial Group. Shares of the company rose after it received an offer to be acquired in an all-cash transaction at a price well above its stock price at the time of the announcement.
The energy sector was the worst-performing sector of the market during the year. Although the Fund’s underweight position in this sector helped mitigate the negative impact, several of the Fund’s energy holdings declined. Nabors Industries faced declining pricing and utilization for its rig fleet in North America as producers sharply pulled back on expenditures. This challenging environment was partially offset by earnings growth in the company’s international business. Royal Dutch Shell also underperformed during the reporting period following its announced acquisition of BG Group (not a Fund holding). The market’s negative reaction to this news was driven by concerns surrounding execution risk and potential dilution from the deal.
Within the industrials sector, the stock price of Joy Global was negatively affected by concerns about a downturn in mining
| | |
| Portfolio Composition | | |
| By sector | | % of total net assets |
| |
| Consumer Staples | | 24.8% |
| Financials | | 14.1 |
| Utilities | | 12.7 |
| Consumer Discretionary | | 10.7 |
| Industrials | | 9.4 |
| Energy | | 5.8 |
| Health Care | | 5.3 |
| Telecommunication Services | | 3.6 |
| Information Technology | | 2.2 |
| Materials | | 1.8 |
| Money Market Funds | | |
| Plus Other Assets Less Liabilities | | 9.6 |
| | | | | | | |
Top 10 Equity Holdings* |
| | % of total net assets | |
| | |
| 1. | | General Mills, Inc. | | | | 3.4 | % |
| 2. | | Campbell Soup Co. | | | | 2.7 | |
| 3. | | Coca-Cola Co. (The) | | | | 2.7 | |
| 4. | | AT&T Inc. | | | | 2.5 | |
| 5. | | Heineken N.V. | | | | 2.5 | |
| 6. | | Kraft Heinz Co. (The) | | | | 2.0 | |
| 7. | | Eli Lilly and Co. | | | | 1.9 | |
| 8. | | Exelon Corp. | | | | 1.9 | |
| 9. | | Walgreens Boots Alliance, Inc. | | | | 1.9 | |
| 10. | | PPL Corp. | | | | 1.8 | |
| | |
| Total Net Assets | | $466.0 million |
| |
| Total Number of Holdings* | | 78 |
The Fund’s holdings are subject to change, and there is no assurance that the Fund will continue to hold any particular security.
*Excluding money market fund holdings.
Data presented here are as of December 31, 2015.
Invesco V.I. Diversified Dividend Fund
and energy capital expenditures and fears of industry overcapacity. This was a new investment for the Fund during the year. We see the company as attractively valued based on our estimate of its normalized earnings power. In our view, its large installed asset base provides for stable, high margin aftermarket revenues that may support profitability and cash flows across the cycle.
In addition to Joy Global, we made several other new investments in the energy and industrials sectors as valuations were attractive in areas impacted by the global downturn in commodities. This is an area we approached cautiously, scrutinizing and stress-testing balance sheets and cash flows to measure the ability to withstand likely impairments to asset values.
This profit cycle has seen the largest profit margin expansion in 50 years, despite a weaker than normal economic expansion versus previous cycles, as measured by gross domestic product growth from recession lows.1 A key question for us is how much of the expansion is structural, due to factors like better supply chain management, and how much is cyclical, due to factors such as corporations benefiting from lower funding costs due to historically low interest rates. We are conservative with our expectations for continued profit growth as other elements gain prominence in the market. For example, share buybacks during the reporting period were near peaks seen in the prior profit cycle2, and merger and acquisition activity surpassed the prior peaks of 1999 and 20073. Further, we have witnessed an unprecedented period of global, coordinated easing by central banks that had driven market valuations higher. The ability to sustain current valuations is uncertain, particularly as central banks’ policies globally begin to diverge. In this environment, we remain diligent in our assessment of each investment’s risk-reward profile.
The Fund weathered a turbulent year well, consistent with our long-term mandate to emphasize capital appreciation, current income and capital preservation over a full market cycle.
It has been our privilege to oversee Invesco V.I. Diversified Dividend Fund, and we thank you for your continued investment.
| 1 | Source: Sanford C. Bernstein & Co., LLC |
| 2 | Source: FactSet Research Systems Inc. |
| 3 | Source: The Wall Street Journal |
The views and opinions expressed in management’s discussion of Fund performance are those of Invesco Advisers, Inc. These views and opinions are subject to change at any time based on factors such as market and economic conditions. These views and opinions may not be relied upon as investment advice or recommendations, or as an offer for a particular security. The information is not a complete analysis of every aspect of any market, country, industry, security or the Fund. Statements of fact are from sources considered reliable, but Invesco Advisers, Inc. makes no representation or warranty as to their completeness or accuracy. Although historical performance is no guarantee of future results, these insights may help you understand our investment management philosophy.
See important Fund and, if applicable, index disclosures later in this report.
| | |
 | | Meggan Walsh Chartered Financial Analyst, Portfolio Manager, is lead manager of Invesco V.I. Diversified |
Dividend Fund. She joined Invesco in 1991. Ms. Walsh earned a BS in finance from the University of Maryland and an MBA from Loyola University Maryland. |
| |

| | Robert Botard Chartered Financial Analyst, Portfolio Manager, is manager of Invesco V.I. Diversified Dividend |
Fund. He joined Invesco in 1993. Mr. Botard earned a BBA in finance and a BBA in international business from The University of Texas at Austin. He also earned a Master of International Management degree from the Thunderbird School of Global Management. |
| |

| | Kristina Bradshaw Chartered Financial Analyst, Portfolio Manager, is manager of Invesco V.I. Diversified Dividend |
Fund. She joined Invesco in 2006. Ms. Bradshaw earned a BBA with honors from The University of Texas at Austin and an MBA from Stanford University’s Graduate School of Business. |
|
Assisted by Invesco’s Dividend Value Team |
Invesco V.I. Diversified Dividend Fund
Your Fund’s Long-Term Performance
Results of a $10,000 Investment – Oldest Share Class(es)
Fund and index data from 12/31/05
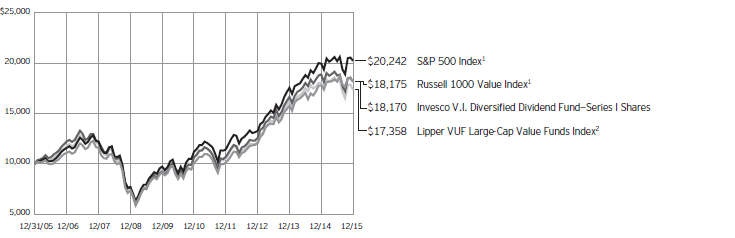
| 1 | Source: FactSet Research Systems Inc. |
Past performance cannot guarantee
comparable future results.
| | | | | |
| Average Annual Total Returns |
As of 12/31/15 | | | | | |
| |
| Series I Shares | | | | | |
| Inception (3/1/90) | | | | 7.98 | % |
| 10 Years | | | | 6.15 | |
| 5 Years | | | | 12.41 | |
| 1 Year | | | | 2.07 | |
| |
| Series II Shares | | | | | |
| Inception (6/5/00) | | | | 5.02 | % |
| 10 Years | | | | 5.88 | |
| 5 Years | | | | 12.13 | |
| 1 Year | | | | 1.82 | |
Effective June 1, 2010, Class X and Class Y shares of the predecessor fund, Morgan Stanley Variable Investment Dividend Growth Portfolio, advised by Morgan Stanley Investment Advisors Inc. were reorganized into Series I and Series II shares, respectively, of Invesco V.I. Dividend Growth Fund (renamed Invesco V.I. Diversified Dividend Fund on April 30, 2012). Returns shown above for Series I and Series II shares are blended returns of the predecessor fund and Invesco V.I. Dividend Growth Fund. Share class returns will differ from the predecessor fund because of different expenses.
The performance data quoted represent past performance and cannot guarantee comparable future
results; current performance may be lower or higher. Please contact your variable product issuer or financial adviser for the most recent month-end variable product performance. Performance figures reflect Fund expenses, reinvested distributions and changes in net asset value. Investment return and principal value will fluctuate so that you may have a gain or loss when you sell shares.
The net annual Fund operating expense ratio set forth in the most recent Fund prospectus as of the date of this report for Series I and Series II shares was 0.73% and 0.98%, respectively.1 The total annual Fund operating expense ratio set forth in the most recent Fund prospectus as of the date of this report for Series I and Series II shares was 0.74% and 0.99%, respectively. The expense ratios presented above may vary from the expense ratios presented in other sections of this report that are based on expenses incurred during the period covered by this report.
Invesco V.I. Diversified Dividend Fund, a series portfolio of AIM Variable Insurance Funds (Invesco Variable Insurance Funds), is currently offered through insurance companies issuing
variable products. You cannot purchase shares of the Fund directly. Performance figures given represent the Fund and are not intended to reflect actual variable product values. They do not reflect sales charges, expenses and fees assessed in connection with a variable product. Sales charges, expenses and fees, which are determined by the variable product issuers, will vary and will lower the total return.
The most recent month-end performance at the Fund level, excluding variable product charges, is available at 800 451 4246. As mentioned above, for the most recent month-end performance including variable product charges, please contact your variable product issuer or financial adviser.
Fund performance reflects any applicable fee waivers and/or expense reimbursements. Had the adviser not waived fees and/or reimbursed expenses currently or in the past, returns would have been lower. See current prospectus for more information.
| 1 | Total annual Fund operating expenses after any contractual fee waivers and/or expense reimbursements by the adviser in effect through at least June 30, 2017. See current prospectus for more information. |
Invesco V.I. Diversified Dividend Fund
Invesco V.I. Diversified Dividend Fund’s investment objective is to provide reasonable current income and long-term growth of income and capital.
| n | | Unless otherwise stated, information presented in this report is as of December 31, 2015, and is based on total net assets. |
| n | | Unless otherwise noted, all data provided by Invesco. |
| n | | To access your Fund’s reports/prospectus, visit invesco.com/fundreports. |
Principal risks of investing in the Fund
Foreign securities risk. The Fund’s foreign investments may be affected by changes in a foreign country’s exchange rates, political and social instability, changes in economic or taxation policies, difficulties when enforcing obligations, decreased liquidity, and increased volatility. Foreign companies may be subject to less regulation resulting in less publicly available information about the companies.
Management risk. The investment techniques and risk analysis used by the Fund’s portfolio managers may not produce the desired results.
Market risk. The prices of and the income generated by the Fund’s securities may decline in response to, among other things, investor sentiment, general economic and market conditions, regional or global instability, and currency and interest rate fluctuations.
Value investing style risk. The Fund emphasizes a value style of investing, which focuses on undervalued companies with characteristics for improved valuations. This style of investing is subject to the risk that the valuations never improve or that the returns on value equity securities are less than returns on other styles of investing or the overall stock market. Value stocks also may decline in price, even though in theory they are already underpriced.
About indexes used in this report
The S&P 500® Index is an unmanaged index considered representative of the US stock market.
The Russell 1000® Value Index is an unmanaged index considered representative of large-cap value stocks. The Russell 1000 Value Index is a trademark/service mark of the Frank Russell Co. Russell® is a trademark of the Frank Russell Co.
The Lipper VUF Large-Cap Value Funds Index is an unmanaged index considered representative of large-cap value variable insurance underlying funds tracked by Lipper.
The Fund is not managed to track the performance of any particular index, including the index(es) described here, and consequently, the performance of the Fund may deviate significantly from the performance of the index(es).
A direct investment cannot be made in an index. Unless otherwise indicated, index results include reinvested dividends, and they do not reflect sales charges. Performance of the peer group, if applicable, reflects fund expenses; performance of a market index does not.
Other information
The returns shown in management’s discussion of Fund performance are based on net asset values calculated for shareholder transactions. Generally accepted accounting principles require adjustments to be made to the net assets of the Fund at period end for financial reporting purposes, and as such, the net asset values for shareholder transactions and the returns based on those net asset values may differ from the net asset values and returns reported in the Financial Highlights. Additionally, the returns and net asset values shown throughout this report are at the Fund level only and do not include variable product issuer charges. If such charges were included, the total returns would be lower.
Industry classifications used in this report are generally according to the Global Industry Classification Standard, which was developed by and is the exclusive property and a service mark of MSCI Inc. and Standard & Poor’s.
Invesco V.I. Diversified Dividend Fund
Schedule of Investments(a)
December 31, 2015
| | | | | | | | |
| | | Shares | | | Value | |
Common Stocks & Other Equity Interests–90.42% | |
| Aerospace & Defense–3.12% | | | | | | | | |
General Dynamics Corp. | | | 50,583 | | | $ | 6,948,081 | |
Raytheon Co. | | | 60,834 | | | | 7,575,658 | |
| | | | | | | | 14,523,739 | |
|
| Air Freight & Logistics–0.69% | |
United Parcel Service, Inc.–Class B | | | 33,387 | | | | 3,212,831 | |
|
| Apparel Retail–0.72% | |
TJX Cos., Inc. (The) | | | 47,086 | | | | 3,338,868 | |
|
| Apparel, Accessories & Luxury Goods–1.36% | |
Coach, Inc. | | | 111,317 | | | | 3,643,405 | |
Columbia Sportswear Co. | | | 55,248 | | | | 2,693,893 | |
| | | | | | | | 6,337,298 | |
|
| Asset Management & Custody Banks–1.73% | |
Federated Investors, Inc.–Class B | | | 159,129 | | | | 4,559,046 | |
Legg Mason, Inc. | | | 89,714 | | | | 3,519,480 | |
| | | | | | | | 8,078,526 | |
|
| Auto Parts & Equipment–0.67% | |
Johnson Controls, Inc. | | | 78,957 | | | | 3,118,012 | |
|
| Brewers–2.49% | |
Heineken N.V. (Netherlands) | | | 135,812 | | | | 11,591,345 | |
|
| Building Products–0.98% | |
Masco Corp. | | | 162,092 | | | | 4,587,204 | |
|
| Construction Machinery & Heavy Trucks–0.60% | |
Joy Global Inc. | | | 222,039 | | | | 2,799,912 | |
|
| Data Processing & Outsourced Services–0.96% | |
Automatic Data Processing, Inc. | | | 52,544 | | | | 4,451,528 | |
|
| Department Stores–0.81% | |
Marks & Spencer Group PLC (United Kingdom) | | | 568,647 | | | | 3,778,723 | |
|
| Drug Retail–1.88% | |
Walgreens Boots Alliance, Inc. | | | 102,755 | | | | 8,750,102 | |
|
| Electric Utilities–8.24% | |
American Electric Power Co., Inc. | | | 95,069 | | | | 5,539,671 | |
Duke Energy Corp. | | | 100,606 | | | | 7,182,262 | |
Entergy Corp. | | | 42,643 | | | | 2,915,075 | |
Exelon Corp. | | | 317,050 | | | | 8,804,479 | |
Pepco Holdings, Inc. | | | 206,776 | | | | 5,378,244 | |
PPL Corp. | | | 251,361 | | | | 8,578,951 | |
| | | | | | | | 38,398,682 | |
|
| Electrical Components & Equipment–2.46% | |
ABB Ltd. (Switzerland) | | | 329,496 | | | | 5,848,276 | |
Emerson Electric Co. | | | 117,781 | | | | 5,633,465 | |
| | | | | | | | 11,481,741 | |
| | | | | | | | |
| | | Shares | | | Value | |
| Food Distributors–1.66% | |
Sysco Corp. | | | 188,522 | | | $ | 7,729,402 | |
|
| Gas Utilities–1.10% | |
AGL Resources Inc. | | | 80,704 | | | | 5,149,722 | |
|
| General Merchandise Stores–1.57% | |
Target Corp. | | | 100,517 | | | | 7,298,539 | |
|
| Health Care Equipment–1.05% | |
Stryker Corp. | | | 52,875 | | | | 4,914,203 | |
|
| Homebuilding–0.00% | |
TopBuild Corp.(b) | | | 1 | | | | 24 | |
|
| Hotels, Resorts & Cruise Lines–0.89% | |
Accor S.A. (France) | | | 96,375 | | | | 4,157,133 | |
|
| Household Products–3.11% | |
Kimberly-Clark Corp. | | | 56,807 | | | | 7,231,531 | |
Procter & Gamble Co. (The) | | | 91,665 | | | | 7,279,118 | |
| | | | | | | | 14,510,649 | |
| | |
| Housewares & Specialties–1.57% | | | | | | | | |
Newell Rubbermaid Inc. | | | 165,501 | | | | 7,295,284 | |
| | |
| Industrial Machinery–1.51% | | | | | | | | |
Flowserve Corp. | | | 102,753 | | | | 4,323,846 | |
Pentair PLC (United Kingdom) | | | 55,119 | | | | 2,730,044 | |
| | | | | | | | 7,053,890 | |
| | |
| Integrated Oil & Gas–4.20% | | | | | | | | |
Royal Dutch Shell PLC–Class B (United Kingdom) | | | 183,336 | | | | 4,186,203 | |
Suncor Energy, Inc. (Canada) | | | 280,999 | | | | 7,251,587 | |
TOTAL S.A. (France) | | | 183,020 | | | | 8,150,951 | |
| | | | | | | | 19,588,741 | |
|
| Integrated Telecommunication Services–3.63% | |
AT&T Inc. | | | 339,095 | | | | 11,668,259 | |
Deutsche Telekom AG (Germany) | | | 289,172 | | | | 5,232,220 | |
| | | | | | | | 16,900,479 | |
|
| Investment Banking & Brokerage–1.16% | |
Charles Schwab Corp. (The) | | | 164,005 | | | | 5,400,685 | |
| | |
| Life & Health Insurance–2.00% | | | | | | | | |
Lincoln National Corp. | | | 56,756 | | | | 2,852,557 | |
StanCorp Financial Group, Inc. | | | 56,812 | | | | 6,469,750 | |
| | | | | | | | 9,322,307 | |
| | |
| Motorcycle Manufacturers–0.90% | | | | | | | | |
Harley-Davidson, Inc. | | | 92,634 | | | | 4,204,657 | |
| | |
| Movies & Entertainment–0.79% | | | | | | | | |
Time Warner Inc. | | | 57,285 | | | | 3,704,621 | |
See accompanying Notes to Financial Statements which are an integral part of the financial statements.
Invesco V.I. Diversified Dividend Fund
| | | | | | | | |
| | | Shares | | | Value | |
| Multi-Line Insurance–1.53% | | | | | | | | |
Hartford Financial Services Group, Inc. (The) | | | 163,544 | | | $ | 7,107,622 | |
| | |
| Multi-Utilities–3.31% | | | | | | | | |
Consolidated Edison, Inc. | | | 101,088 | | | | 6,496,926 | |
Dominion Resources, Inc. | | | 83,455 | | | | 5,644,896 | |
Sempra Energy | | | 34,952 | | | | 3,285,837 | |
| | | | | | | | 15,427,659 | |
| | |
| Oil & Gas Drilling–0.65% | | | | | | | | |
Nabors Industries Ltd. | | | 357,634 | | | | 3,043,465 | |
|
| Oil & Gas Equipment & Services–0.97% | |
Baker Hughes Inc. | | | 98,012 | | | | 4,523,254 | |
| | |
| Packaged Foods & Meats–9.98% | | | | | | | | |
Campbell Soup Co. | | | 240,011 | | | | 12,612,578 | |
General Mills, Inc. | | | 276,694 | | | | 15,954,176 | |
Kraft Heinz Co. (The) | | | 128,758 | | | | 9,368,432 | |
Mead Johnson Nutrition Co. | | | 37,153 | | | | 2,933,229 | |
Mondelez International, Inc.–Class A | | | 125,826 | | | | 5,642,038 | |
| | | | | | | | 46,510,453 | |
| | |
| Paper Packaging–1.28% | | | | | | | | |
Avery Dennison Corp. | | | 45,244 | | | | 2,834,989 | |
Sonoco Products Co. | | | 76,458 | | | | 3,124,839 | |
| | | | | | | | 5,959,828 | |
| | |
| Paper Products–0.52% | | | | | | | | |
International Paper Co. | | | 63,790 | | | | 2,404,883 | |
| | |
| Personal Products–0.65% | | | | | | | | |
L’Oreal S.A. (France) | | | 17,974 | | | | 3,023,957 | |
| | |
| Pharmaceuticals–4.23% | | | | | | | | |
Bristol-Myers Squibb Co. | | | 56,484 | | | | 3,885,534 | |
Eli Lilly and Co. | | | 105,758 | | | | 8,911,169 | |
Johnson & Johnson | | | 51,538 | | | | 5,293,984 | |
Novartis AG (Switzerland) | | | 19,209 | | | | 1,641,838 | |
| | | | | | | | 19,732,525 | |
|
| Property & Casualty Insurance–0.85% | |
Travelers Cos., Inc. (The) | | | 34,998 | | | | 3,949,874 | |
| | | | | | | | |
| | | Shares | | | Value | |
| Regional Banks–6.18% | | | | | | | | |
Cullen/Frost Bankers, Inc. | | | 38,082 | | | $ | 2,284,920 | |
Fifth Third Bancorp | | | 197,110 | | | | 3,961,911 | |
KeyCorp | | | 571,233 | | | | 7,534,563 | |
M&T Bank Corp. | | | 36,652 | | | | 4,441,489 | |
SunTrust Banks, Inc. | | | 65,116 | | | | 2,789,570 | |
Zions Bancorp. | | | 285,576 | | | | 7,796,225 | |
| | | | | | | | 28,808,678 | |
| | |
| Restaurants–1.46% | | | | | | | | |
Darden Restaurants, Inc. | | | 106,690 | | | | 6,789,752 | |
| | |
| Semiconductors–0.81% | | | | | | | | |
Linear Technology Corp. | | | 89,175 | | | | 3,787,262 | |
| | |
| Soft Drinks–2.68% | | | | | | | | |
Coca-Cola Co. (The) | | | 290,989 | | | | 12,500,887 | |
| | |
| Specialized REIT’s–0.66% | | | | | | | | |
Four Corners Property Trust, Inc.(b) | | | 36,311 | | | | 877,274 | |
Weyerhaeuser Co. | | | 72,800 | | | | 2,182,544 | |
| | | | | | | | 3,059,818 | |
| | |
| Systems Software–0.40% | | | | | | | | |
Microsoft Corp. | | | 33,533 | | | | 1,860,411 | |
| | |
| Tobacco–2.41% | | | | | | | | |
Altria Group, Inc. | | | 90,788 | | | | 5,284,770 | |
Philip Morris International Inc. | | | 67,421 | | | | 5,926,980 | |
| | | | | | | | 11,211,750 | |
Total Common Stocks & Other Equity Interests
(Cost $326,872,111) | | | | 421,380,925 | |
|
Money Market Funds–9.47% | |
Liquid Assets Portfolio–Institutional Class, 0.29%(c) | | | 22,069,706 | | | | 22,069,706 | |
Premier Portfolio–Institutional Class, 0.24%(c) | | | 22,069,706 | | | | 22,069,706 | |
Total Money Market Funds
(Cost $44,139,412) | | | | 44,139,412 | |
TOTAL INVESTMENTS–99.89%
(Cost $371,011,523) | | | | 465,520,337 | |
OTHER ASSETS LESS LIABILITIES–0.11% | | | | 529,195 | |
NET ASSETS–100.00% | | | $ | 466,049,532 | |
Investment Abbreviations:
| | |
| REIT | | – Real Estate Investment Trust |
Notes to Schedule of Investments:
| (a) | Industry and/or sector classifications used in this report are generally according to the Global Industry Classification Standard, which was developed by and is the exclusive property and a service mark of MSCI Inc. and Standard & Poor’s. |
| (b) | Non-income producing security. |
| (c) | The money market fund and the Fund are affiliated by having the same investment adviser. The rate shown is the 7-day SEC standardized yield as of December 31, 2015. |
See accompanying Notes to Financial Statements which are an integral part of the financial statements.
Invesco V.I. Diversified Dividend Fund
Statement of Assets and Liabilities
December 31, 2015
Statement of Operations
For the year ended December 31, 2015
| | | | |
Assets: | |
Investments, at value (Cost $326,872,111) | | $ | 421,380,925 | |
Investments in affiliated money market funds, at value and cost | | | 44,139,412 | |
Total investments, at value (Cost $371,011,523) | | | 465,520,337 | |
Foreign currencies, at value (Cost $142,152) | | | 141,075 | |
Receivable for: | | | | |
Investments sold | | | 289,310 | |
Fund shares sold | | | 446,533 | |
Dividends | | | 796,387 | |
Investment for trustee deferred compensation and retirement plans | | | 75,151 | |
Unrealized appreciation on forward foreign currency contracts outstanding | | | 149,851 | |
Total assets | | | 467,418,644 | |
|
Liabilities: | |
Payable for: | | | | |
Investments purchased | | | 424,968 | |
Fund shares reacquired | | | 196,795 | |
Accrued fees to affiliates | | | 278,297 | |
Accrued trustees’ and officers’ fees and benefits | | | 222 | |
Accrued other operating expenses | | | 38,059 | |
Trustee deferred compensation and retirement plans | | | 111,708 | |
Unrealized depreciation on forward foreign currency contracts outstanding | | | 319,063 | |
Total liabilities | | | 1,369,112 | |
Net assets applicable to shares outstanding | | $ | 466,049,532 | |
|
Net assets consist of: | |
Shares of beneficial interest | | $ | 371,587,136 | |
Undistributed net investment income | | | 7,240,781 | |
Undistributed net realized gain (loss) | | | (7,112,217 | ) |
Net unrealized appreciation | | | 94,333,832 | |
| | | $ | 466,049,532 | |
|
Net Assets: | |
Series I | | $ | 333,572,515 | |
Series II | | $ | 132,477,017 | |
|
Shares outstanding, $0.001 par value per share,
with an unlimited number of shares authorized: | |
Series I | | | 14,336,280 | |
Series II | | | 5,719,926 | |
Series I: | | | | |
Net asset value per share | | $ | 23.27 | |
Series II: | | | | |
Net asset value per share | | $ | 23.16 | |
| | | | |
Investment income: | |
Dividends (net of foreign withholding taxes of $136,767) | | $ | 11,402,339 | |
Dividends from affiliated money market funds | | | 37,350 | |
Total investment income | | | 11,439,689 | |
| |
Expenses: | | | | |
Advisory fees | | | 2,203,662 | |
Administrative services fees | | | 854,246 | |
Custodian fees | | | 34,419 | |
Distribution fees — Series II | | | 293,626 | |
Transfer agent fees | | | 28,196 | |
Trustees’ and officers’ fees and benefits | | | 33,468 | |
Other | | | 65,010 | |
Total expenses | | | 3,512,627 | |
Less: Fees waived | | | (49,324 | ) |
Net expenses | | | 3,463,303 | |
Net investment income | | | 7,976,386 | |
| |
Realized and unrealized gain (loss) from: | | | | |
Net realized gain (loss) from: | | | | |
Investment securities | | | 20,241,634 | |
Foreign currencies | | | (2,908 | ) |
Forward foreign currency contracts | | | 2,283,795 | |
| | | | 22,522,521 | |
Change in net unrealized appreciation (depreciation) of: | | | | |
Investment securities | | | (21,662,250 | ) |
Foreign currencies | | | (1,893 | ) |
Forward foreign currency contracts | | | (584,460 | ) |
| | | | (22,248,603 | ) |
Net realized and unrealized gain | | | 273,918 | |
Net increase in net assets resulting from operations | | $ | 8,250,304 | |
See accompanying Notes to Financial Statements which are an integral part of the financial statements.
Invesco V.I. Diversified Dividend Fund
Statement of Changes in Net Assets
For the years ended December 31, 2015 and 2014
| | | | | | | | |
| | | 2015 | | | 2014 | |
Operations: | | | | | |
Net investment income | | $ | 7,976,386 | | | $ | 7,354,416 | |
Net realized gain | | | 22,522,521 | | | | 27,832,198 | |
Change in net unrealized appreciation (depreciation) | | | (22,248,603 | ) | | | 15,137,416 | |
Net increase in net assets resulting from operations | | | 8,250,304 | | | | 50,324,030 | |
| | |
Distributions to shareholders from net investment income: | | | | | | | | |
Series I | | | (5,638,058 | ) | | | (5,512,687 | ) |
Series ll | | | (1,865,729 | ) | | | (1,491,240 | ) |
Total distributions from net investment income | | | (7,503,787 | ) | | | (7,003,927 | ) |
| | |
Share transactions–net: | | | | | | | | |
Series l | | | 2,294,083 | | | | (24,086,977 | ) |
Series ll | | | 26,825,841 | | | | (2,258,538 | ) |
Net increase (decrease) in net assets resulting from share transactions | | | 29,119,924 | | | | (26,345,515 | ) |
Net increase in net assets | | | 29,866,441 | | | | 16,974,588 | |
| | |
Net assets: | | | | | | | | |
Beginning of year | | | 436,183,091 | | | | 419,208,503 | |
End of year (includes undistributed net investment income of $7,240,781 and $6,919,424, respectively) | | $ | 466,049,532 | | | $ | 436,183,091 | |
Notes to Financial Statements
December 31, 2015
NOTE 1—Significant Accounting Policies
Invesco V.I. Diversified Dividend Fund (the “Fund”) is a series portfolio of AIM Variable Insurance Funds (Invesco Variable Insurance Funds) (the “Trust”). The Trust is a Delaware statutory trust registered under the Investment Company Act of 1940, as amended (the “1940 Act”), as an open-end series management investment company consisting of twenty-four separate portfolios, (each constituting a “Fund”). The assets, liabilities and operations of each portfolio are accounted for separately. Information presented in these financial statements pertains only to the Fund. Matters affecting each Fund or class will be voted on exclusively by the shareholders of such Fund or class. Current Securities and Exchange Commission (“SEC”) guidance, however, requires participating insurance companies offering separate accounts to vote shares proportionally in accordance with the instructions of the contract owners whose investments are funded by shares of each Fund or class.
The Fund’s investment objective is to provide reasonable current income and long-term growth of income and capital.
The Fund currently offers two classes of shares, Series I and Series II, both of which are offered to insurance company separate accounts funding variable annuity contracts and variable life insurance policies (“variable products”).
The following is a summary of the significant accounting policies followed by the Fund in the preparation of its financial statements.
| A. | Security Valuations — Securities, including restricted securities, are valued according to the following policy. |
A security listed or traded on an exchange (except convertible securities) is valued at its last sales price or official closing price as of the close of the customary trading session on the exchange where the security is principally traded, or lacking any sales or official closing price on a particular day, the security may be valued at the closing bid price on that day. Securities traded in the over-the-counter market are valued based on prices furnished by independent pricing services or market makers. When such securities are valued by an independent pricing service they may be considered fair valued. Futures contracts are valued at the final settlement price set by an exchange on which they are principally traded. Listed options are valued at the mean between the last bid and asked prices from the exchange on which they are principally traded. Options not listed on an exchange are valued by an independent source at the mean between the last bid and asked prices. For purposes of determining net asset value (“NAV”) per share, futures and option contracts generally are valued 15 minutes after the close of the customary trading session of the New York Stock Exchange (“NYSE”).
Investments in open-end and closed-end registered investment companies that do not trade on an exchange are valued at the end-of-day net asset value per share. Investments in open-end and closed-end registered investment companies that trade on an exchange are valued at the last sales price or official closing price as of the close of the customary trading session on the exchange where the security is principally traded.
Debt obligations (including convertible securities) and unlisted equities are fair valued using an evaluated quote provided by an independent pricing service. Evaluated quotes provided by the pricing service may be determined without exclusive reliance on quoted prices, and may reflect appropriate factors such as institution-size trading in similar groups of securities, developments related to specific securities, dividend rate (for unlisted equities), yield (for debt obligations), quality, type of issue, coupon rate (for debt obligations), maturity (for debt obligations), individual trading characteristics and other market data. Debt obligations are subject to interest rate and credit risks. In addition, all debt obligations involve some risk of default with respect to interest and/or principal payments.
Invesco V.I. Diversified Dividend Fund
Foreign securities’ (including foreign exchange contracts) prices are converted into U.S. dollar amounts using the applicable exchange rates as of the close of the NYSE. If market quotations are available and reliable for foreign exchange-traded equity securities, the securities will be valued at the market quotations. Because trading hours for certain foreign securities end before the close of the NYSE, closing market quotations may become unreliable. If between the time trading ends on a particular security and the close of the customary trading session on the NYSE, events occur that the Adviser determines are significant and make the closing price unreliable, the Fund may fair value the security. If the event is likely to have affected the closing price of the security, the security will be valued at fair value in good faith using procedures approved by the Board of Trustees. Adjustments to closing prices to reflect fair value may also be based on a screening process of an independent pricing service to indicate the degree of certainty, based on historical data, that the closing price in the principal market where a foreign security trades is not the current value as of the close of the NYSE. Foreign securities’ prices meeting the approved degree of certainty that the price is not reflective of current value will be priced at the indication of fair value from the independent pricing service. Multiple factors may be considered by the independent pricing service in determining adjustments to reflect fair value and may include information relating to sector indices, American Depositary Receipts and domestic and foreign index futures. Foreign securities may have additional risks including exchange rate changes, potential for sharply devalued currencies and high inflation, political and economic upheaval, the relative lack of issuer information, relatively low market liquidity and the potential lack of strict financial and accounting controls and standards.
Securities for which market prices are not provided by any of the above methods may be valued based upon quotes furnished by independent sources. The last bid price may be used to value equity securities. The mean between the last bid and asked prices is used to value debt obligations, including corporate loans.
Securities for which market quotations are not readily available or became unreliable are valued at fair value as determined in good faith by or under the supervision of the Trust’s officers following procedures approved by the Board of Trustees. Issuer specific events, market trends, bid/asked quotes of brokers and information providers and other market data may be reviewed in the course of making a good faith determination of a security’s fair value.
The Fund may invest in securities that are subject to interest rate risk, meaning the risk that the prices will generally fall as interest rates rise and, conversely, the prices will generally rise as interest rates fall. Specific securities differ in their sensitivity to changes in interest rates depending on their individual characteristics. Changes in interest rates may result in increased market volatility, which may affect the value and/or liquidity of certain Fund investments.
Valuations change in response to many factors including the historical and prospective earnings of the issuer, the value of the issuer’s assets, general economic conditions, interest rates, investor perceptions and market liquidity. Because of the inherent uncertainties of valuation, the values reflected in the financial statements may materially differ from the value received upon actual sale of those investments.
| B. | Securities Transactions and Investment Income — Securities transactions are accounted for on a trade date basis. Realized gains or losses on sales are computed on the basis of specific identification of the securities sold. Interest income (net of withholding tax, if any) is recorded on the accrual basis from settlement date. Dividend income (net of withholding tax, if any) is recorded on the ex-dividend date. |
The Fund may periodically participate in litigation related to Fund investments. As such, the Fund may receive proceeds from litigation settlements. Any proceeds received are included in the Statement of Operations as realized gain (loss) for investments no longer held and as unrealized gain (loss) for investments still held.
Brokerage commissions and mark ups are considered transaction costs and are recorded as an increase to the cost basis of securities purchased and/or a reduction of proceeds on a sale of securities. Such transaction costs are included in the determination of net realized and unrealized gain (loss) from investment securities reported in the Statement of Operations and the Statement of Changes in Net Assets and the net realized and unrealized gains (losses) on securities per share in the Financial Highlights. Transaction costs are included in the calculation of the Fund’s net asset value and, accordingly, they reduce the Fund’s total returns. These transaction costs are not considered operating expenses and are not reflected in net investment income reported in the Statement of Operations and the Statement of Changes in Net Assets, or the net investment income per share and the ratios of expenses and net investment income reported in the Financial Highlights, nor are they limited by any expense limitation arrangements between the Fund and the investment adviser.
The Fund allocates income and realized and unrealized capital gains and losses to a class based on the relative net assets of each class.
| C. | Country Determination — For the purposes of making investment selection decisions and presentation in the Schedule of Investments, the investment adviser may determine the country in which an issuer is located and/or credit risk exposure based on various factors. These factors include the laws of the country under which the issuer is organized, where the issuer maintains a principal office, the country in which the issuer derives 50% or more of its total revenues and the country that has the primary market for the issuer’s securities, as well as other criteria. Among the other criteria that may be evaluated for making this determination are the country in which the issuer maintains 50% or more of its assets, the type of security, financial guarantees and enhancements, the nature of the collateral and the sponsor organization. Country of issuer and/or credit risk exposure has been determined to be the United States of America, unless otherwise noted. |
| D. | Distributions — Distributions from net investment income and net realized capital gain, if any, are generally declared and paid to separate accounts of participating insurance companies annually and recorded on the ex-dividend date. |
| E. | Federal Income Taxes — The Fund intends to comply with the requirements of Subchapter M of the Internal Revenue Code of 1986, as amended (the “Internal Revenue Code”), necessary to qualify as a regulated investment company and to distribute substantially all of the Fund’s taxable earnings to shareholders. As such, the Fund will not be subject to federal income taxes on otherwise taxable income (including net realized capital gain) that is distributed to shareholders. Therefore, no provision for federal income taxes is recorded in the financial statements. |
The Fund recognizes the tax benefits of uncertain tax positions only when the position is more likely than not to be sustained. Management has analyzed the Fund’s uncertain tax positions and concluded that no liability for unrecognized tax benefits should be recorded related to uncertain tax positions. Management is not aware of any tax positions for which it is reasonably possible that the total amounts of unrecognized tax benefits will change materially in the next 12 months.
The Fund files tax returns in the U.S. Federal jurisdiction and certain other jurisdictions. Generally, the Fund is subject to examinations by such taxing authorities for up to three years after the filing of the return for the tax period.
| F. | Expenses — Fees provided for under the Rule 12b-1 plan of a particular class of the Fund and which are directly attributable to that class are charged to the operations of such class. All other expenses are allocated among the classes based on relative net assets. |
Invesco V.I. Diversified Dividend Fund
| G. | Accounting Estimates — The preparation of financial statements in conformity with accounting principles generally accepted in the United States of America (“GAAP”) requires management to make estimates and assumptions that affect the reported amounts of assets and liabilities at the date of the financial statements and the reported amounts of revenues and expenses during the reporting period including estimates and assumptions related to taxation. Actual results could differ from those estimates by a significant amount. In addition, the Fund monitors for material events or transactions that may occur or become known after the period-end date and before the date the financial statements are released to print. |
| H. | Indemnifications — Under the Trust’s organizational documents, each Trustee, officer, employee or other agent of the Trust is indemnified against certain liabilities that may arise out of the performance of their duties to the Fund. Additionally, in the normal course of business, the Fund enters into contracts, including the Fund’s servicing agreements, that contain a variety of indemnification clauses. The Fund’s maximum exposure under these arrangements is unknown as this would involve future claims that may be made against the Fund that have not yet occurred. The risk of material loss as a result of such indemnification claims is considered remote. |
| I. | Foreign Currency Translations — Foreign currency is valued at the close of the NYSE based on quotations posted by banks and major currency dealers. Portfolio securities and other assets and liabilities denominated in foreign currencies are translated into U.S. dollar amounts at date of valuation. Purchases and sales of portfolio securities (net of foreign taxes withheld on disposition) and income items denominated in foreign currencies are translated into U.S. dollar amounts on the respective dates of such transactions. The Fund does not separately account for the portion of the results of operations resulting from changes in foreign exchange rates on investments and the fluctuations arising from changes in market prices of securities held. The combined results of changes in foreign exchange rates and the fluctuation of market prices on investments (net of estimated foreign tax withholding) are included with the net realized and unrealized gain or loss from investments in the Statement of Operations. Reported net realized foreign currency gains or losses arise from (1) sales of foreign currencies, (2) currency gains or losses realized between the trade and settlement dates on securities transactions, and (3) the difference between the amounts of dividends, interest, and foreign withholding taxes recorded on the Fund’s books and the U.S. dollar equivalent of the amounts actually received or paid. Net unrealized foreign currency gains and losses arise from changes in the fair values of assets and liabilities, other than investments in securities at fiscal period end, resulting from changes in exchange rates. |
The Fund may invest in foreign securities, which may be subject to foreign taxes on income, gains on investments or currency repatriation, a portion of which may be recoverable. Foreign taxes, if any, are recorded based on the tax regulations and rates that exist in the foreign markets in which the Fund invests and are shown in the Statement of Operations.
| J. | Forward Foreign Currency Contracts — The Fund may engage in foreign currency transactions either on a spot (i.e. for prompt delivery and settlement) basis, or through forward foreign currency contracts, to manage or minimize currency or exchange rate risk. |
The Fund may also enter into forward foreign currency contracts for the purchase or sale of a security denominated in a foreign currency in order to “lock in” the U.S. dollar price of that security, or the Fund may also enter into forward foreign currency contracts that do not provide for physical settlement of the two currencies, but instead are settled by a single cash payment calculated as the difference between the agreed upon exchange rate and the spot rate at settlement based upon an agreed upon notional amount (non-deliverable forwards). The Fund will set aside liquid assets in an amount equal to daily mark-to-market obligation for forward foreign currency contracts.
A forward foreign currency contract is an obligation between two parties (“Counterparties”) to purchase or sell a specific currency for an agreed-upon price at a future date. The use of forward foreign currency contracts does not eliminate fluctuations in the price of the underlying securities the Fund owns or intends to acquire but establishes a rate of exchange in advance. Fluctuations in the value of these contracts are measured by the difference in the contract date and reporting date exchange rates and are recorded as unrealized appreciation (depreciation) until the contracts are closed. When the contracts are closed, realized gains (losses) are recorded. Realized and unrealized gains (losses) on the contracts are included in the Statement of Operations. The primary risks associated with forward foreign currency contracts include failure of the Counterparty to meet the terms of the contract and the value of the foreign currency changing unfavorably. These risks may be in excess of the amounts reflected in the Statement of Assets and Liabilities.
NOTE 2—Advisory Fees and Other Fees Paid to Affiliates
The Trust has entered into a master investment advisory agreement with Invesco Advisers, Inc. (the “Adviser” or “Invesco”). Under the terms of the investment advisory agreement, the Fund pays an advisory fee to the Adviser based on the annual rate of the Fund’s average daily net assets as follows:
| | | | | | |
| Average Daily Net Assets | | Rate |
First $250 million | | | 0 | .545% | | |
Next $750 million | | | 0 | .42% | | |
Next $1 billion | | | 0 | .395% | | |
Over $2 billion | | | 0 | .37% | | |
For the year ended December 31, 2015, the effective advisory fees incurred by the Fund was 0.49%.
Under the terms of a master sub-advisory agreement between the Adviser and each of Invesco Asset Management Deutschland GmbH, Invesco Asset Management Limited, Invesco Asset Management (Japan) Limited, Invesco Hong Kong Limited, Invesco Senior Secured Management, Inc. and Invesco Canada Ltd. (collectively, the “Affiliated Sub-Advisers”) the Adviser, not the Fund, may pay 40% of the fees paid to the Adviser to any such Affiliated Sub-Adviser(s) that provide(s) discretionary investment management services to the Fund based on the percentage of assets allocated to such Affiliated Sub-Adviser(s).
The Adviser has contractually agreed, through at least June 30, 2016, to waive advisory fees and/or reimburse expenses of all shares to the extent necessary to limit total annual fund operating expenses after fee waiver and/or expense reimbursement (excluding certain items discussed below) of Series I shares to 2.00% and Series II shares to 2.25% of average daily net assets. In determining the Adviser’s obligation to waive advisory fees and/or reimburse expenses, the following expenses are not taken into account, and could cause the total annual fund operating expenses after fee waiver and/or expense reimbursement to exceed the numbers reflected above: (1) interest; (2) taxes; (3) dividend expense on
Invesco V.I. Diversified Dividend Fund
short sales; (4) extraordinary or non-routine items, including litigation expenses; and (5) expenses that the Fund has incurred but did not actually pay because of an expense offset arrangement. Unless Invesco continues the fee waiver agreement, it will terminate on June 30, 2016. The fee waiver agreement cannot be terminated during its term. The Adviser did not waive fees and/or reimburse expenses during the period under this expense limitation.
Further, the Adviser has contractually agreed, through at least June 30, 2017, to waive the advisory fee payable by the Fund in an amount equal to 100% of the net advisory fees the Adviser receives from the affiliated money market funds on investments by the Fund of uninvested cash in such affiliated money market funds.
For the year ended December 31, 2015, the Adviser waived advisory fees of $49,324.
The Trust has entered into a master administrative services agreement with Invesco pursuant to which the Fund has agreed to pay Invesco a fee for costs incurred in providing accounting services and fund administrative services to the Fund and to reimburse Invesco for administrative services fees paid to insurance companies that have agreed to provide services to the participants of separate accounts. These administrative services provided by the insurance companies may include, among other things: the printing of prospectuses, financial reports and proxy statements and the delivery of the same to existing participants; the maintenance of master accounts; the facilitation of purchases and redemptions requested by the participants; and the servicing of participants’ accounts. Pursuant to such agreement, for the year ended December 31, 2015, Invesco was paid $108,564 for accounting and fund administrative services and reimbursed $745,682 for services provided by insurance companies.
The Trust has entered into a transfer agency and service agreement with Invesco Investment Services, Inc. (“IIS”) pursuant to which the Fund has agreed to pay IIS a fee for providing transfer agency and shareholder services to the Fund and reimburse IIS for certain expenses incurred by IIS in the course of providing such services. For the year ended December 31, 2015, expenses incurred under the agreement are shown in the Statement of Operations as Transfer agent fees.
The Trust has entered into a master distribution agreement with Invesco Distributors, Inc. (“IDI”) to serve as the distributor for the Fund. The Trust has adopted a plan pursuant to Rule 12b-1 under the 1940 Act with respect to the Fund’s Series II shares (the “Plan”). The Fund, pursuant to the Plan, pays IDI compensation at the annual rate of 0.25% of the Fund’s average daily net assets of Series II shares. Of the Plan payments, up to 0.25% of the average daily net assets of the Series II shares may be paid to insurance companies who furnish continuing personal shareholder services to customers who purchase and own Series II shares of the Fund. For the year ended December 31, 2015, expenses incurred under the Plan are detailed in the Statement of Operations as Distribution fees.
For the year ended December 31, 2015, the Fund incurred $129 in brokerage commissions with Invesco Capital Markets, Inc., an affiliate of the Adviser and IDI, for portfolio transactions executed on behalf of the Fund.
Certain officers and trustees of the Trust are officers and directors of the Adviser, IIS and/or IDI.
NOTE 3—Additional Valuation Information
GAAP defines fair value as the price that would be received to sell an asset or paid to transfer a liability in an orderly transaction between market participants at the measurement date, under current market conditions. GAAP establishes a hierarchy that prioritizes the inputs to valuation methods, giving the highest priority to readily available unadjusted quoted prices in an active market for identical assets (Level 1) and the lowest priority to significant unobservable inputs (Level 3), generally when market prices are not readily available or are unreliable. Based on the valuation inputs, the securities or other investments are tiered into one of three levels. Changes in valuation methods may result in transfers in or out of an investment’s assigned level:
| | Level 1 — | Prices are determined using quoted prices in an active market for identical assets. |
| | Level 2 — | Prices are determined using other significant observable inputs. Observable inputs are inputs that other market participants may use in pricing a security. These may include quoted prices for similar securities, interest rates, prepayment speeds, credit risk, yield curves, loss severities, default rates, discount rates, volatilities and others. |
| | Level 3 — | Prices are determined using significant unobservable inputs. In situations where quoted prices or observable inputs are unavailable (for example, when there is little or no market activity for an investment at the end of the period), unobservable inputs may be used. Unobservable inputs reflect the Fund’s own assumptions about the factors market participants would use in determining fair value of the securities or instruments and would be based on the best available information. |
The following is a summary of the tiered valuation input levels, as of December 31, 2015. The level assigned to the securities valuations may not be an indication of the risk or liquidity associated with investing in those securities. Because of the inherent uncertainties of valuation, the values reflected in the financial statements may materially differ from the value received upon actual sale of those investments.
| | | | | | | | | | | | | | | | |
| | | Level 1 | | | Level 2 | | | Level 3 | | | Total | |
Equity Securities | | $ | 417,909,691 | | | $ | 47,610,646 | | | $ | — | | | $ | 465,520,337 | |
Forward Foreign Currency Contracts* | | | — | | | | (169,212 | ) | | | — | | | | (169,212 | ) |
Total Investments | | $ | 417,909,691 | | | $ | 47,441,434 | | | $ | — | | | $ | 465,351,125 | |
| * | Unrealized appreciation (depreciation). |
Invesco V.I. Diversified Dividend Fund
NOTE 4—Derivative Investments
Value of Derivative Investments at Period-End
The table below summarizes the value of the Fund’s derivative investments, detailed by primary risk exposure, held as of December 31, 2015:
| | | | | | | | |
| | | Value | |
| Risk Exposure/Derivative Type | | Assets | | | Liabilities | |
Currency risk: | | | | | | | | |
Forward foreign currency contracts(a) | | $ | 149,851 | | | $ | (319,063 | ) |
| (a) | Values are disclosed on the Statement of Assets and Liabilities under the captions Unrealized appreciation on forward foreign currency contracts outstanding and Unrealized depreciation on forward foreign currency contracts outstanding. |
Effect of Derivative Investments for the year ended December 31, 2015
The table below summarizes the gains (losses) on derivative investments, detailed by primary risk exposure, recognized in earnings during the period:
| | | | |
| | | Location of Gain (Loss) on
Statement of Operations | |
| | | Forward Foreign
Currency Contracts | |
Realized Gain: | | | | |
Currency risk | | $ | 2,283,795 | |
Change in Net Unrealized Appreciation (Depreciation): | | | | |
Currency risk | | | (584,460 | ) |
Total | | $ | 1,699,335 | |
The table below summarizes the average notional value of forward foreign currency contracts outstanding during the period.
| | | | |
| | | Forward Foreign
Currency Contracts | |
Average notional value | | $ | 15,712,902 | |
| | | | | | | | | | | | | | | | | | | | | | | | | | |
| Open Forward Foreign Currency Contracts | |
Settlement
Date | | Counterparty | | Contract to | | | Notional
Value | | | Unrealized
Appreciation
(Depreciation) | |
| | | Deliver | | | Receive | | | |
01/22/16 | | Citigroup Global Markets Inc. | | | CAD | | | | 92,492 | | | | USD | | | | 69,480 | | | $ | 66,826 | | | $ | 2,654 | |
01/22/16 | | Citigroup Global Markets Inc. | | | CAD | | | | 1,716,549 | | | | USD | | | | 1,288,793 | | | | 1,240,206 | | | | 48,587 | |
01/22/16 | | Citigroup Global Markets Inc. | | | CAD | | | | 92,293 | | | | USD | | | | 66,200 | | | | 66,682 | | | | (482 | ) |
01/22/16 | | Citigroup Global Markets Inc. | | | EUR | | | | 5,066,699 | | | | USD | | | | 5,405,357 | | | | 5,509,293 | | | | (103,936 | ) |
01/22/16 | | Citigroup Global Markets Inc. | | | EUR | | | | 72,227 | | | | USD | | | | 76,549 | | | | 78,536 | | | | (1,987 | ) |
01/22/16 | | Citigroup Global Markets Inc. | | | EUR | | | | 169,737 | | | | USD | | | | 179,573 | | | | 184,564 | | | | (4,991 | ) |
01/22/16 | | Deutsche Bank Securities Inc. | | | CAD | | | | 1,716,548 | | | | USD | | | | 1,288,874 | | | | 1,240,205 | | | | 48,669 | |
01/22/16 | | Deutsche Bank Securities Inc. | | | EUR | | | | 5,066,682 | | | | USD | | | | 5,405,390 | | | | 5,509,275 | | | | (103,885 | ) |
01/22/16 | | Deutsche Bank Securities Inc. | | | EUR | | | | 22,187 | | | | USD | | | | 24,315 | | | | 24,125 | | | | 190 | |
01/22/16 | | Deutsche Bank Securities Inc. | | | EUR | | | | 38,740 | | | | USD | | | | 42,287 | | | | 42,124 | | | | 163 | |
01/22/16 | | Goldman Sachs International | | | CAD | | | | 1,716,612 | | | | USD | | | | 1,288,733 | | | | 1,240,251 | | | | 48,482 | |
01/22/16 | | Goldman Sachs International | | | CAD | | | | 42,311 | | | | USD | | | | 31,676 | | | | 30,570 | | | | 1,106 | |
01/22/16 | | Goldman Sachs International | | | EUR | | | | 5,066,699 | | | | USD | | | | 5,405,945 | | | | 5,509,293 | | | | (103,348 | ) |
01/22/16 | | Goldman Sachs International | | | EUR | | | | 22,149 | | | | USD | | | | 23,650 | | | | 24,084 | | | | (434 | ) |
Total Forward Foreign Currency Contracts — Currency Risk | | | | | | | | | | | | | | | | | | | | | | $ | (169,212 | ) |
Currency Abbreviations:
| | |
| CAD | | – Canadian Dollar |
| EUR | | – Euro |
| USD | | – U.S. Dollar |
Offsetting Assets and Liabilities
Accounting Standards Update (“ASU”) No. 2011-11, Disclosures about Offsetting Assets and Liabilities, which was subsequently clarified in Financial Accounting Standards Board ASU 2013-01 “Clarifying the Scope of Disclosures about Offsetting Assets and Liabilities” is intended to enhance disclosures about financial instruments and derivative instruments that are subject to offsetting arrangements on the Statement of Assets and Liabilities and to enable investors to better understand the effect of those arrangements on the Fund’s financial position. In order for an arrangement to be eligible for netting, the Fund must have a basis to conclude that such netting arrangements are legally enforceable. The Fund enters into netting agreements and collateral agreements in an attempt to reduce the Fund’s Counterparty credit risk by providing for a single net settlement with a Counterparty of all financial transactions covered by the agreement in an event of default as defined under such agreement.
Invesco V.I. Diversified Dividend Fund
The following tables present derivative instruments that are either subject to an enforceable netting agreement or offset by collateral arrangements as of December 31, 2015.
| | | | | | | | | | | | | | | | | | | | |
| | | Gross amounts
of Recognized
Assets | | | Gross Amounts Not Offset in the
Statement of Assets and Liabilities | | | | |
| | | | Financial
Instruments | | | Collateral Received | | | Net
Amount | |
| Counterparty | | | | Non-Cash | | | Cash | | |
Citigroup Global Markets Inc. | | $ | 51,241 | | | $ | (51,241 | ) | | $ | — | | | $ | — | | | $ | — | |
Deutsche Bank Securities Inc. | | | 49,022 | | | | (49,022 | ) | | | — | | | | — | | | | — | |
Goldman Sachs International | | | 49,588 | | | | (49,588 | ) | | | — | | | | — | | | | — | |
Total | | $ | 149,851 | | | $ | (149,851 | ) | | $ | — | | | $ | — | | | $ | — | |
| | | | | |
| | | | | | | | | | | | | | | | | | | | |
| | | Gross amounts
of Recognized
Liabilities | | | Gross Amounts Not Offset in the
Statement of Assets and Liabilities | | | | |
| | | | Financial
Instruments | | | Collateral Pledged | | | Net
Amount | |
| Counterparty | | | | Non-Cash | | | Cash | | |
Citigroup Global Markets Inc. | | $ | 111,396 | | | $ | (51,241 | ) | | $ | — | | | $ | — | | | $ | 60,155 | |
Deutsche Bank Securities Inc. | | | 103,885 | | | | (49,022 | ) | | | — | | | | — | | | | 54,863 | |
Goldman Sachs International | | | 103,782 | | | | (49,588 | ) | | | — | | | | — | | | | 54,194 | |
Total | | $ | 319,063 | | | $ | (149,851 | ) | | $ | — | | | $ | — | | | $ | 169,212 | |
NOTE 5—Trustees’ and Officers’ Fees and Benefits
Trustees’ and Officers’ Fees and Benefits include amounts accrued by the Fund to pay remuneration to certain Trustees and Officers of the Fund. Trustees have the option to defer compensation payable by the Fund, and Trustees’ and Officers’ Fees and Benefits also include amounts accrued by the Fund to fund such deferred compensation amounts. Those Trustees who defer compensation have the option to select various Invesco Funds in which their deferral accounts shall be deemed to be invested. Finally, certain current Trustees were eligible to participate in a retirement plan that provided for benefits to be paid upon retirement to Trustees over a period of time based on the number of years of service. The Fund may have certain former Trustees who also participate in a retirement plan and receive benefits under such plan. Trustees’ and Officers’ Fees and Benefits include amounts accrued by the Fund to fund such retirement benefits. Obligations under the deferred compensation and retirement plans represent unsecured claims against the general assets of the Fund.
NOTE 6—Cash Balances
The Fund is permitted to temporarily carry a negative or overdrawn balance in its account with State Street Bank and Trust Company, the custodian bank. Such balances, if any at period end, are shown in the Statement of Assets and Liabilities under the payable caption Amount due custodian. To compensate the custodian bank for such overdrafts, the overdrawn Fund may either (1) leave funds as a compensating balance in the account so the custodian bank can be compensated by earning the additional interest; or (2) compensate by paying the custodian bank at a rate agreed upon by the custodian bank and Invesco, not to exceed the contractually agreed upon rate.
NOTE 7—Distributions to Shareholders and Tax Components of Net Assets
Tax Character of Distributions to Shareholders Paid During the Fiscal Years Ended December 31, 2015 and 2014:
| | | | | | | | |
| | | 2015 | | | 2014 | |
Ordinary income | | $ | 7,503,787 | | | $ | 7,003,927 | |
Tax Components of Net Assets at Period-End:
| | | | |
| | | 2015 | |
Undistributed ordinary income | | $ | 7,355,589 | |
Net unrealized appreciation — investments | | | 93,906,798 | |
Net unrealized appreciation (depreciation) — other investments | | | (5,770 | ) |
Temporary book/tax differences | | | (114,808 | ) |
Capital loss carryforward | | | (6,679,413 | ) |
Shares of beneficial interest | | | 371,587,136 | |
Total net assets | | $ | 466,049,532 | |
The difference between book-basis and tax-basis unrealized appreciation (depreciation) is due to differences in the timing of recognition of gains and losses on investments for tax and book purposes. The Fund’s net unrealized appreciation difference is attributable primarily to wash sales.
The temporary book/tax differences are a result of timing differences between book and tax recognition of income and/or expenses. The Fund’s temporary book/tax differences are the result of the trustee deferral of compensation and retirement plan benefits.
Capital loss carryforward is calculated and reported as of a specific date. Results of transactions and other activity after that date may affect the amount of capital loss carryforward actually available for the Fund to utilize. Capital losses generated in years beginning after December 22, 2010
Invesco V.I. Diversified Dividend Fund
can be carried forward for an unlimited period, whereas previous losses expire in eight tax years. Capital losses with an expiration period may not be used to offset capital gains until all net capital losses without an expiration date have been utilized. Capital loss carryforwards with no expiration date will retain their character as either short-term or long-term capital losses instead of as short-term capital losses as under prior law. The ability to utilize capital loss carryforwards in the future may be limited under the Internal Revenue Code and related regulations based on the results of future transactions.
The Fund has a capital loss carryforward as of December 31, 2015, which expires as follows:
| | | | | | | | | | | | |
| Capital Loss Carryforward* | |
| Expiration | | Short-Term | | | Long-Term | | | Total | |
December 31, 2017 | | $ | 6,679,413 | | | $ | — | | | $ | 6,679,413 | |
| * | Capital loss carryforward as of the date listed above is reduced for limitations, if any, to the extent required by the Internal Revenue Code and may be further limited depending upon a variety of factors, including the realization of net unrealized gains or losses as of the date of any reorganization. |
NOTE 8—Investment Securities
The aggregate amount of investment securities (other than short-term securities, U.S. Treasury obligations and money market funds, if any) purchased and sold by the Fund during the year ended December 31, 2015 was $73,077,006 and $61,412,520, respectively. Cost of investments on a tax basis includes the adjustments for financial reporting purposes as of the most recently completed federal income tax reporting period-end.
| | | | |
| Unrealized Appreciation (Depreciation) of Investment Securities on a Tax Basis | |
Aggregate unrealized appreciation of investment securities | | $ | 112,471,932 | |
Aggregate unrealized (depreciation) of investment securities | | | (18,565,134 | ) |
Net unrealized appreciation of investment securities | | $ | 93,906,798 | |
Cost of investments for tax purposes is $371,613,539.
NOTE 9—Reclassification of Permanent Differences
Primarily as a result of differing book/tax treatment of real estate investment trust distributions and foreign currency transactions, on December 31, 2015, undistributed net investment income was decreased by $151,242 and undistributed net realized gain (loss) was increased by $151,242. This reclassification had no effect on the net assets of the Fund.
NOTE 10—Share Information
| | | | | | | | | | | | | | | | |
| | | Summary of Share Activity | |
| | | Years ended December 31, | |
| | | 2015(a) | | | 2014 | |
| | | Shares | | | Amount | | | Shares | | | Amount | |
Sold: | | | | | | | | | | | | | | | | |
Series I | | | 3,012,818 | | | $ | 71,097,855 | | | | 2,417,493 | | | $ | 53,705,907 | |
Series II | | | 1,837,158 | | | | 43,228,055 | | | | 860,331 | | | | 18,781,741 | |
| | | | |
Issued as reinvestment of dividends: | | | | | | | | | | | | | | | | |
Series I | | | 249,693 | | | | 5,638,058 | | | | 252,066 | | | | 5,512,687 | |
Series II | | | 82,958 | | | | 1,865,729 | | | | 68,405 | | | | 1,491,240 | |
| | | | |
Reacquired: | | | | | | | | | | | | | | | | |
Series I | | | (3,160,909 | ) | | | (74,441,830 | ) | | | (3,800,793 | ) | | | (83,305,571 | ) |
Series II | | | (778,296 | ) | | | (18,267,943 | ) | | | (1,033,108 | ) | | | (22,531,519 | ) |
Net increase (decrease) in share activity | | | 1,243,422 | | | $ | 29,119,924 | | | | (1,235,606 | ) | | $ | (26,345,515 | ) |
| (a) | There are entities that are record owners of more than 5% of the outstanding shares of the Fund and in the aggregate own 75% of the outstanding shares of the Fund. The Fund and the Fund’s principal underwriter or adviser, are parties to participation agreements with these entities whereby these entities sell units of interest in separate accounts funding variable products that are invested in the Fund. The Fund, Invesco and/or Invesco affiliates may make payments to these entities, which are considered to be related to the Fund, for providing services to the Fund, Invesco and/or Invesco affiliates including but not limited to services such as, securities brokerage, third party record keeping and account servicing and administrative services. The Fund has no knowledge as to whether all or any portion of the shares owned of record by these entities are also owned beneficially. |
Invesco V.I. Diversified Dividend Fund
NOTE 11—Financial Highlights
The following schedule presents financial highlights for a share of the Fund outstanding throughout the periods indicated.
| | | | | | | | | | | | | | | | | | | | | | | | | | | | | | | | | | | | | | | | | | | | | | | | |
| | | Net asset
value,
beginning
of period | | | Net
investment
income(a) | | | Net gains
(losses)
on securities
(both
realized and
unrealized) | | | Total from
investment
operations | | | Dividends
from net
investment
income | | | Net asset
value, end
of period | | | Total
return(b) | | | Net assets,
end of period
(000’s omitted) | | | Ratio of
expenses
to average
net assets
with fee waivers
and/or expenses
absorbed | | | Ratio of
expenses
to average net
assets without
fee waivers
and/or expenses
absorbed | | | Ratio of net
investment
income to
average
net assets | | | Portfolio
turnover(c) | |
Series I | | | | | | | | | | | | | | | | | | | | | | | | | | | | | | | | | | | | | | | | | | | | | | | | |
Year ended 12/31/15 | | $ | 23.21 | | | $ | 0.43 | | | $ | 0.04 | | | $ | 0.47 | | | $ | (0.41 | ) | | $ | 23.27 | | | | 2.07 | % | | $ | 333,573 | | | | 0.70 | %(d) | | | 0.71 | %(d) | | | 1.84 | %(d) | | | 15 | % |
Year ended 12/31/14 | | | 20.93 | | | | 0.40 | | | | 2.26 | | | | 2.66 | | | | (0.38 | ) | | | 23.21 | | | | 12.83 | | | | 330,370 | | | | 0.72 | | | | 0.73 | | | | 1.80 | | | | 6 | |
Year ended 12/31/13 | | | 16.34 | | | | 0.33 | | | | 4.70 | | | | 5.03 | | | | (0.44 | ) | | | 20.93 | | | | 31.04 | | | | 321,581 | | | | 0.71 | | | | 0.72 | | | | 1.76 | | | | 20 | |
Year ended 12/31/12 | | | 14.04 | | | | 0.35 | | | | 2.27 | | | | 2.62 | | | | (0.32 | ) | | | 16.34 | | | | 18.72 | | | | 271,407 | | | | 0.67 | | | | 0.68 | | | | 2.29 | | | | 11 | |
Year ended 12/31/11 | | | 14.24 | | | | 0.31 | | | | (0.27 | ) | | | 0.04 | | | | (0.24 | ) | | | 14.04 | | | | 0.20 | | | | 253,850 | | | | 0.66 | | | | 0.67 | | | | 2.24 | | | | 38 | |
Series II | | | | | | | | | | | | | | | | | | | | | | | | | | | | | | | | | | | | | | | | | | | | | | | | |
Year ended 12/31/15 | | | 23.11 | | | | 0.37 | | | | 0.04 | | | | 0.41 | | | | (0.36 | ) | | | 23.16 | | | | 1.82 | | | | 132,477 | | | | 0.95 | (d) | | | 0.96 | (d) | | | 1.59 | (d) | | | 15 | |
Year ended 12/31/14 | | | 20.85 | | | | 0.34 | | | | 2.25 | | | | 2.59 | | | | (0.33 | ) | | | 23.11 | | | | 12.54 | | | | 105,813 | | | | 0.97 | | | | 0.98 | | | | 1.55 | | | | 6 | |
Year ended 12/31/13 | | | 16.28 | | | | 0.29 | | | | 4.69 | | | | 4.98 | | | | (0.41 | ) | | | 20.85 | | | | 30.76 | | | | 97,628 | | | | 0.96 | | | | 0.97 | | | | 1.51 | | | | 20 | |
Year ended 12/31/12 | | | 14.00 | | | | 0.31 | | | | 2.26 | | | | 2.57 | | | | (0.29 | ) | | | 16.28 | | | | 18.37 | | | | 72,641 | | | | 0.92 | | | | 0.93 | | | | 2.04 | | | | 11 | |
Year ended 12/31/11 | | | 14.20 | | | | 0.28 | | | | (0.28 | ) | | | 0.00 | | | | (0.20 | ) | | | 14.00 | | | | (0.06 | ) | | | 68,424 | | | | 0.91 | | | | 0.92 | | | | 1.99 | | | | 38 | |
| (a) | Calculated using average shares outstanding. |
| (b) | Includes adjustments in accordance with accounting principles generally accepted in the United States of America and as such, the net asset value for financial reporting purposes and the returns based upon those net asset values may differ from the net asset value and returns for shareholder transactions. Total returns are not annualized for periods less than one year, if applicable, and do not reflect charges assessed in connection with a variable product, which if included would reduce total returns. |
| (c) | Portfolio turnover is calculated at the fund level and is not annualized for periods less than one year, if applicable. For the period ended December 31, 2011, the portfolio turnover calculation excludes the value of securities purchased of $134,975,378 and sold of $57,441,776 in the effort to realign the Fund’s portfolio holdings after the reorganization of Invesco V.I. Select Dimensions Dividend Growth Fund and Invesco V.I. Financial Services Fund into the Fund. |
| (d) | Ratios are based on average daily net assets (000’s omitted) of $332,826 and $117,450 for Series I and Series II shares, respectively. |
Invesco V.I. Diversified Dividend Fund
Report of Independent Registered Public Accounting Firm
To the Board of Trustees of AIM Variable Insurance Funds (Invesco Variable Insurance Funds)
and Shareholders of Invesco V.I. Diversified Dividend Fund:
In our opinion, the accompanying statement of assets and liabilities, including the schedule of investments, and the related statements of operations and of changes in net assets and the financial highlights present fairly, in all material respects, the financial position of Invesco V.I. Diversified Dividend Fund (one of the funds constituting AIM Variable Insurance Funds (Invesco Variable Insurance Funds), hereafter referred to as the “Fund”) at December 31, 2015, the results of its operations for the year then ended, the changes in its net assets for each of the two years in the period then ended and the financial highlights for each of the five years in the period then ended, in conformity with accounting principles generally accepted in the United States of America. These financial statements and financial highlights (hereafter referred to as “financial statements”) are the responsibility of the Fund’s management. Our responsibility is to express an opinion on these financial statements based on our audits. We conducted our audits of these financial statements in accordance with the standards of the Public Company Accounting Oversight Board (United States). Those standards require that we plan and perform the audit to obtain reasonable assurance about whether the financial statements are free of material misstatement. An audit includes examining, on a test basis, evidence supporting the amounts and disclosures in the financial statements, assessing the accounting principles used and significant estimates made by management, and evaluating the overall financial statement presentation. We believe that our audits, which included confirmation of securities at December 31, 2015 by correspondence with the custodian and brokers, and the application of alternative auditing procedures where confirmations of security purchases have not been received, provide a reasonable basis for our opinion.
PRICEWATERHOUSECOOPERS LLP
Houston, Texas
February 15, 2016
Invesco V.I. Diversified Dividend Fund
Calculating your ongoing Fund expenses
Example
As a shareholder of the Fund, you incur ongoing costs, including management fees; distribution and/or service fees (12b-1); and other Fund expenses. This example is intended to help you understand your ongoing costs (in dollars) of investing in the Fund and to compare these costs with ongoing costs of investing in other mutual funds. The example is based on an investment of $1,000 invested at the beginning of the period and held for the entire period July 1, 2015 through December 31, 2015.
The actual and hypothetical expenses in the examples below do not represent the effect of any fees or other expenses assessed in connection with a variable product; if they did, the expenses shown would be higher while the ending account values shown would be lower.
Actual expenses
The table below provides information about actual account values and actual expenses. You may use the information in this table, together with the amount you invested, to estimate the expenses that you paid over the period. Simply divide your account value by $1,000 (for example, an $8,600 account value divided by $1,000 = 8.6), then multiply the result by the number in the table under the heading entitled “Actual Expenses Paid During Period” to estimate the expenses you paid on your account during this period.
Hypothetical example for comparison purposes
The table below also provides information about hypothetical account values and hypothetical expenses based on the Fund’s actual expense ratio and an assumed rate of return of 5% per year before expenses, which is not the Fund’s actual return.
The hypothetical account values and expenses may not be used to estimate the actual ending account balance or expenses you paid for the period. You may use this information to compare the ongoing costs of investing in the Fund and other funds. To do so, compare this 5% hypothetical example with the 5% hypothetical examples that appear in the shareholder reports of the other funds.
Please note that the expenses shown in the table are meant to highlight your ongoing costs. Therefore, the hypothetical information is useful in comparing ongoing costs, and will not help you determine the relative total costs of owning different funds.
| | | | | | | | | | | | | | | | | | | | | | | | |
| Class | | Beginning
Account Value
(07/01/15) | | | ACTUAL | | | HYPOTHETICAL
(5% annual return before
expenses) | | | Annualized
Expense
Ratio | |
| | | Ending
Account Value
(12/31/15)1 | | | Expenses
Paid During
Period2 | | | Ending
Account Value
(12/31/15) | | | Expenses
Paid During
Period2 | | |
Series I | | $ | 1,000.00 | | | $ | 999.60 | | | $ | 3.53 | | | $ | 1,021.68 | | | $ | 3.57 | | | | 0.70 | % |
Series II | | | 1,000.00 | | | | 997.90 | | | | 4.78 | | | | 1,020.42 | | | | 4.84 | | | | 0.95 | |
| 1 | The actual ending account value is based on the actual total return of the Fund for the period July 1, 2015 through December 31, 2015, after actual expenses and will differ from the hypothetical ending account value which is based on the Fund’s expense ratio and a hypothetical annual return of 5% before expenses. |
| 2 | Expenses are equal to the Fund’s annualized expense ratio as indicated above multiplied by the average account value over the period, multiplied by 184/365 to reflect the most recent fiscal half year. |
Invesco V.I. Diversified Dividend Fund
Tax Information
Form 1099-DIV, Form 1042-S and other year–end tax information provide shareholders with actual calendar year amounts that should be included in their tax returns. Shareholders should consult their tax advisors.
The following distribution information is being provided as required by the Internal Revenue Code or to meet a specific state’s requirement.
The Fund designates the following amounts or, if subsequently determined to be different, the maximum amount allowable for its fiscal year ended December 31, 2015:
| | | | |
Federal and State Income Tax | |
Corporate Dividends Received Deduction* | | | 100 | % |
U.S. Treasury Obligations* | | | 0 | % |
| | * | The above percentages are based on ordinary income dividends paid to shareholders during the Fund’s fiscal year. |
Invesco V.I. Diversified Dividend Fund
Trustees and Officers
The address of each trustee and officer is AIM Variable Insurance Funds (Invesco Variable Insurance Funds) (the “Trust”), 11 Greenway Plaza, Suite 1000, Houston, Texas 77046-1173. The trustees serve for the life of the Trust, subject to their earlier death, incapacitation, resignation, retirement or removal as more specifically provided in the Trust’s organizational documents. Each officer serves for a one year term or until their successors are elected and qualified. Column two below includes length of time served with predecessor entities, if any.
| | | | | | | | |
Name, Year of Birth and
Position(s) Held with the Trust | | Trustee and/
or Officer Since | | Principal Occupation(s)
During Past 5 Years | | Number of Funds in Fund Complex Overseen by Trustee | | Other Directorship(s) Held by Trustee During Past 5 Years |
| Interested Persons | | | | | | | | |
| Martin L. Flanagan1 — 1960 Trustee | | 2007 | | Executive Director, Chief Executive Officer and President, Invesco Ltd. (ultimate parent of Invesco and a global investment management firm); Advisor to the Board, Invesco Advisers, Inc. (formerly known as Invesco Institutional (N.A.), Inc.); Trustee, The Invesco Funds; Vice Chair, Investment Company Institute; and Member of Executive Board, SMU Cox School of Business Formerly: Chairman and Chief Executive Officer, Invesco Advisers, Inc. (registered investment adviser); Director, Chairman, Chief Executive Officer and President, IVZ Inc. (holding company), INVESCO Group Services, Inc. (service provider) and Invesco North American Holdings, Inc. (holding company); Director, Chief Executive Officer and President, Invesco Holding Company Limited (parent of Invesco and a global investment management firm); Director, Invesco Ltd.; Chairman, Investment Company Institute and President, Co-Chief Executive Officer, Co-President, Chief Operating Officer and Chief Financial Officer, Franklin Resources, Inc. (global investment management organization) | | 146 | | None |
Philip A. Taylor2 — 1954 Trustee, President and Principal Executive Officer | | 2006 | | Head of North American Retail and Senior Managing Director, Invesco Ltd.; Director, Co-Chairman, Co-President and Co-Chief Executive Officer, Invesco Advisers, Inc. (formerly known as Invesco Institutional (N.A.), Inc.) (registered investment adviser); Director, Chairman, Chief Executive Officer and President, Invesco Management Group, Inc. (formerly known as Invesco Aim Management Group, Inc.) (financial services holding company); Director and Chairman, Invesco Investment Services, Inc. (formerly known as Invesco Aim Investment Services, Inc.) (registered transfer agent) Chief Executive Officer, Invesco Corporate Class Inc. (corporate mutual fund company) Director, Chairman and Chief Executive Officer, Invesco Canada Ltd. (formerly known as Invesco Trimark Ltd./Invesco Trimark Ltèe) (registered investment adviser and registered transfer agent); Trustee, President and Principal Executive Officer, The Invesco Funds (other than AIM Treasurer’s Series Trust (Invesco Treasurer’s Series Trust), Short-Term Investments Trust and Invesco Management Trust); Trustee and Executive Vice President, The Invesco Funds (AIM Treasurer’s Series Trust (Invesco Treasurer’s Series Trust), Short-Term Investments Trust and Invesco Management Trust only); Director, Invesco Investment Advisers LLC (formerly known as Van Kampen Asset Management); Director, Chief Executive Officer and President, Van Kampen Exchange Corp. Formerly: Director and President, INVESCO Funds Group, Inc. (registered investment adviser and registered transfer agent); Director and Chairman, IVZ Distributors, Inc. (formerly known as INVESCO Distributors, Inc.) (registered broker dealer); Director, President and Chairman, Invesco Inc. (holding company), Invesco Canada Holdings Inc. (holding company), Trimark Investments Ltd./Placements Trimark Ltèe and Invesco Financial Services Ltd/Services Financiers Invesco Ltèe; Chief Executive Officer, Invesco Canada Fund Inc (corporate mutual fund company); Director and Chairman, Van Kampen Investor Services Inc.; Director, Chief Executive Officer and President, 1371 Preferred Inc. (holding company) and Van Kampen Investments Inc.; Director and President, AIM GP Canada Inc. (general partner for limited partnerships) and Van Kampen Advisors, Inc.; Director and Chief Executive Officer, Invesco Trimark Dealer Inc. (registered broker dealer); Director, Invesco Distributors, Inc. (formerly known as Invesco Aim Distributors, Inc.) (registered broker dealer); Manager, Invesco PowerShares Capital Management LLC; Director, Chief Executive Officer and President, Invesco Advisers, Inc.; Director, Chairman, Chief Executive Officer and President, Invesco Aim Capital Management, Inc.; President, Invesco Trimark Dealer Inc. and Invesco Trimark Ltd./Invesco Trimark Ltèe; Director and President, AIM Trimark Corporate Class Inc. and AIM Trimark Canada Fund Inc.; Senior Managing Director, Invesco Holding Company Limited; Director and Chairman, Fund Management Company (former registered broker dealer); President and Principal Executive Officer, The Invesco Funds (AIM Treasurer’s Series Trust (Invesco Treasurer’s Series Trust), and Short-Term Investments Trust only); President, AIM Trimark Global Fund Inc. and AIM Trimark Canada Fund Inc | | 146 | | None |
| 1 | Mr. Flanagan is considered an interested person (within the meaning of Section 2(a)(19) of the 1940 Act) of the Trust because he is an officer of the Adviser to the Trust, and an officer and a director of Invesco Ltd., ultimate parent of the Adviser. |
| 2 | Mr. Taylor is considered an interested person (within the meaning of Section 2(a)(19) of the 1940 Act) of the Trust because he is an officer and a director of the Adviser. |
Invesco V.I. Diversified Dividend Fund
Trustees and Officers—(continued)
| | | | | | | | |
Name, Year of Birth and
Position(s) Held with the Trust | | Trustee and/
or Officer Since | | Principal Occupation(s)
During Past 5 Years | | Number of Funds in Fund Complex Overseen by Trustee | | Other Directorship(s)
Held by Trustee During Past 5 Years |
| Independent Trustees | | | | | | | | |
Bruce L. Crockett — 1944 Trustee and Chair | | 2003 | | Chairman, Crockett Technologies Associates (technology consulting company) Formerly: Director, Captaris (unified messaging provider); Director, President and Chief Executive Officer, COMSAT Corporation; Chairman, Board of Governors of INTELSAT (international communications company); ACE Limited (insurance company); Independent Directors Council and Investment Company Institute | | 146 | | ALPS (Attorneys Liability Protection Society) (insurance company) and Globe Specialty Metals, Inc. (metallurgical company) |
David C. Arch — 1945 Trustee | | 2010 | | Chairman of Blistex Inc., a consumer health care products manufacturer | | 146 | | Board member of the Illinois Manufacturers’ Association; Member of the Board of Visitors, Institute for the Humanities, University of Michigan |
James T. Bunch — 1942 Trustee | | 2000 | | Managing Member, Grumman Hill Group LLC (family office/private equity investments) Formerly: Chairman of the Board of Trustees, Evans Scholars Foundation and Chairman, Board of Governors, Western Golf Association | | 146 | | Trustee, Evans Scholars Foundation; and Chairman of the Board, Denver Film Society |
Albert R. Dowden — 1941 Trustee | | 2003 | | Director of a number of public and private business corporations, including the Boss Group, Ltd. (private investment and management); Nature’s Sunshine Products, Inc. and Reich & Tang Funds (5 portfolios) (registered investment company) Formerly: Director, Homeowners of America Holding Corporation/Homeowners of America Insurance Company (property casualty company); Director, Continental Energy Services, LLC (oil and gas pipeline service); Director, CompuDyne Corporation (provider of product and services to the public security market) and Director, Annuity and Life Re (Holdings), Ltd. (reinsurance company); Director, President and Chief Executive Officer, Volvo Group North America, Inc.; Senior Vice President, AB Volvo; Director of various public and private corporations; Chairman, DHJ Media, Inc.; Director, Magellan Insurance Company; and Director, The Hertz Corporation, Genmar Corporation (boat manufacturer), National Media Corporation; Advisory Board of Rotary Power International (designer, manufacturer, and seller of rotary power engines); and Chairman, Cortland Trust, Inc. (registered investment company) | | 146 | | Director of: Nature’s Sunshine Products, Inc., Reich & Tang Funds, Homeowners of America Holding Corporation/ Homeowners of America Insurance Company, the Boss Group |
Jack M. Fields — 1952 Trustee | | 2003 | | Chief Executive Officer, Twenty First Century Group, Inc. (government affairs company); Owner and Chief Executive Officer, Dos Angeles Ranch, L.P. (cattle, hunting, corporate entertainment); and Discovery Global Education Fund (non-profit) Formerly: Chief Executive Officer, Texana Timber LP (sustainable forestry company); Director of Cross Timbers Quail Research Ranch (non-profit); and member of the U.S. House of Representatives | | 146 | | Insperity, Inc. (formerly known as Administaff) |
Eli Jones — Trustee | | 2016 | | Professor and Dean, Mays Business School, Texas A&M University Formerly: Professor and Dean, Walton College of Business, University of Arkansas, and E.J. Ourso College of Business, Louisiana State University | | 146 | | Director, Insperity, Inc., (2011-present) and ARVEST Bank (2012-2015) |
Prema Mathai-Davis — 1950 Trustee | | 2003 | | Retired. Formerly: Chief Executive Officer, YWCA of the U.S.A. | | 146 | | None |
Larry Soll — 1942 Trustee | | 1997 | | Retired. Formerly: Chairman, Chief Executive Officer and President, Synergen Corp. (a biotechnology company) | | 146 | | None |
Robert C. Troccoli — Trustee | | 2016 | | Retired. Formerly: Senior Partner, KPMG LLP | | 146 | | None |
Raymond Stickel, Jr. — 1944 Trustee | | 2005 | | Retired. Formerly: Director, Mainstay VP Series Funds, Inc. (25 portfolios) and Partner, Deloitte & Touche | | 146 | | None |
Suzanne H. Woolsey — 1941 Trustee | | 2014 | | Chief Executive Officer of Woolsey Partners LLC | | 146 | | Emeritus Chair of the Board of Trustees of the Institute for Defense Analyses; Trustee of Colorado College; Trustee of California Institute of Technology; Prior to 2014, Director of Fluor Corp.; Prior to 2010, Trustee of the German Marshall Fund of the United States; Prior to 2010 Trustee of the Rocky Mountain Institute |
Invesco V.I. Diversified Dividend Fund
Trustees and Officers—(continued)
| | | | | | | | |
Name, Year of Birth and
Position(s) Held with the Trust | | Trustee and/
or Officer Since | | Principal Occupation(s)
During Past 5 Years | | Number of Funds in Fund Complex Overseen by Trustee | | Other Directorship(s)
Held by Trustee During Past 5 Years |
| Other Officers | | | | | | | | |
Russell C. Burk — 1958 Senior Vice President and Senior Officer | | 2005 | | Senior Vice President and Senior Officer, The Invesco Funds | | N/A | | N/A |
John M. Zerr — 1962 Senior Vice President, Chief Legal Officer and Secretary | | 2006 | | Director, Senior Vice President, Secretary and General Counsel, Invesco Management Group, Inc. (formerly known as Invesco Aim Management Group, Inc.) and Van Kampen Exchange Corp.; Senior Vice President, Invesco Advisers, Inc. (formerly known as Invesco Institutional (N.A.), Inc.) (registered investment adviser); Senior Vice President and Secretary, Invesco Distributors, Inc. (formerly known as Invesco Aim Distributors, Inc.); Director, Vice President and Secretary, Invesco Investment Services, Inc. (formerly known as Invesco Aim Investment Services, Inc.); Senior Vice President, Chief Legal Officer and Secretary, The Invesco Funds; Managing Director, Invesco PowerShares Capital Management LLC; Director, Secretary and General Counsel, Invesco Investment Advisers LLC (formerly known as Van Kampen Asset Management); Secretary and General Counsel, Invesco Capital Markets, Inc. (formerly known as Van Kampen Funds Inc.) and Chief Legal Officer, PowerShares Exchange-Traded Fund Trust, PowerShares Exchange-Traded Fund Trust II, PowerShares India Exchange-Traded Fund Trust, PowerShares Actively Managed Exchange-Traded Fund Trust, and PowerShares Actively Managed Exchange-Traded Commodity Fund Trust Formerly: Director, Vice President and Secretary, IVZ Distributors, Inc. (formerly known as INVESCO distributors, Inc.); Director and Vice President, INVESCO Funds Group, Inc.; Director and Vice President, Van Kampen Advisors Inc.; Director, Vice President, Secretary and General Counsel, Van Kampen Investor Services Inc.; Director, Invesco Distributors, Inc. (formerly known as Invesco Aim Distributors, Inc.); Director, Senior Vice President, General Counsel and Secretary, Invesco Aim Advisers, Inc. and Van Kampen Investments Inc.; Director, Vice President and Secretary, Fund Management Company; Director, Senior Vice President, Secretary, General Counsel and Vice President, Invesco Aim Capital Management, Inc.; Chief Operating Officer and General Counsel, Liberty Ridge Capital, Inc. (an investment adviser); Vice President and Secretary, PBHG Funds (an investment company) and PBHG Insurance Series Fund (an investment company); Chief Operating Officer, General Counsel and Secretary, Old Mutual Investment Partners (a broker-dealer); General Counsel and Secretary, Old Mutual Fund Services (an administrator) and Old Mutual Shareholder Services (a shareholder servicing center); Executive Vice President, General Counsel and Secretary, Old Mutual Capital, Inc. (an investment adviser); and Vice President and Secretary, Old Mutual Advisors Funds (an investment company) | | N/A | | N/A |
Sheri Morris — 1964 Vice President, Treasurer and Principal Financial Officer | | 2003 | | Vice President, Treasurer and Principal Financial Officer, The Invesco Funds; Vice President, Invesco Advisers, Inc. (formerly known as Invesco Institutional (N.A.), Inc.) (registered investment adviser); and Vice President, PowerShares Exchange-Traded Fund Trust, PowerShares Exchange-Traded Fund Trust II, PowerShares India Exchange-Traded Fund Trust, PowerShares Actively Managed Exchange-Traded Fund Trust, and PowerShares Actively Managed Exchange-Traded Commodity Fund Trust Formerly: Vice President, Invesco Aim Advisers, Inc., Invesco Aim Capital Management, Inc. and Invesco Aim Private Asset Management, Inc.; Assistant Vice President and Assistant Treasurer, The Invesco Funds and Assistant Vice President, Invesco Advisers, Inc., Invesco Aim Capital Management, Inc. and Invesco Aim Private Asset Management, Inc.; and Treasurer, PowerShares Exchange-Traded Fund Trust, PowerShares Exchange-Traded Fund Trust II, PowerShares India Exchange-Traded Fund Trust and PowerShares Actively Managed Exchange-Traded Fund Trust | | N/A | | N/A |
Invesco V.I. Diversified Dividend Fund
Trustees and Officers—(continued)
| | | | | | | | |
Name, Year of Birth and
Position(s) Held with the Trust | | Trustee and/
or Officer Since | | Principal Occupation(s)
During Past 5 Years | | Number of Funds in Fund Complex Overseen by Trustee | | Other Directorship(s)
Held by Trustee During Past 5 Years |
| Other Officers—(continued) | | | | | | | | |
Karen Dunn Kelley — 1960 Vice President | | 2003 | | Senior Managing Director, Investments, Invesco Ltd.; Director, Co-President, Co-Chief Executive Officer, and Co-Chairman, Invesco Advisers, Inc. (formerly known as Invesco Institutional (N.A.), Inc.) (registered investment adviser); Chairman, Invesco Senior Secured Management, Inc.; Senior Vice President, Invesco Management Group, Inc. (formerly known as Invesco Aim Management Group, Inc.); Executive Vice President, Invesco Distributors, Inc. (formerly known as Invesco Aim Distributors, Inc.); Director, Invesco Mortgage Capital Inc. and Invesco Management Company Limited; Vice President, The Invesco Funds (other than AIM Treasurer’s Series Trust (Invesco Treasurer’s Series Trust), Short-Term Investments Trust and Invesco Management Trust); and President and Principal Executive Officer, The Invesco Funds (AIM Treasurer’s Series Trust (Invesco Treasurer’s Series Trust), Short-Term Investments Trust and Invesco Management Trust only) Formerly: Director and President, INVESCO Asset Management (Bermuda) Ltd., Director, INVESCO Global Asset Management Limited and INVESCO Management S.A.; Senior Vice President, Van Kampen Investments Inc. and Invesco Advisers, Inc. (formerly known as Invesco Institutional (N.A.), Inc.) (registered investment adviser); Vice President, Invesco Advisers, Inc. (formerly known as Invesco Institutional (N.A.), Inc.); Director of Cash Management and Senior Vice President, Invesco Advisers, Inc. and Invesco Aim Capital Management, Inc.; Director and President, Fund Management Company; Chief Cash Management Officer, Director of Cash Management, Senior Vice President, and Managing Director, Invesco Aim Capital Management, Inc.; Director of Cash Management, Senior Vice President, and Vice President, Invesco Advisers, Inc. and The Invesco Funds (AIM Treasurer’s Series Trust (Invesco Treasurer’s Series Trust), and Short-Term Investments Trust only) | | N/A | | N/A |
Crissie M. Wisdom — 1969 Anti-Money Laundering Compliance Officer | | 2013 | | Anti-Money Laundering Compliance Officer, Invesco Advisers, Inc. (formerly known as Invesco Institutional (N.A.), Inc.) (registered investment adviser), Invesco Capital Markets, Inc. (formerly known as Van Kampen Funds Inc.), Invesco Distributors, Inc., Invesco Investment Services, Inc., Invesco Management Group, Inc., Van Kampen Exchange Corp., The Invesco Funds, and PowerShares Exchange-Traded Fund Trust, PowerShares Exchange-Traded Fund Trust II, PowerShares India Exchange-Traded Fund Trust, PowerShares Actively Managed Exchange-Traded Fund Trust and PowerShares Actively Managed Exchange-Traded Commodity Fund Trust; Anti-Money Laundering Compliance Officer and Bank Secrecy Act Officer, INVESCO National Trust Company and Invesco Trust Company; and Fraud Prevention Manager and Controls and Risk Analysis Manager for Invesco Investment Services, Inc. | | N/A | | N/A |
Lisa O. Brinkley — 1959 Chief Compliance Officer | | 2015 | | Senior Vice President and Chief Compliance Officer, Invesco Advisers, Inc. (registered investment adviser) (formerly known as Invesco Institutional (N.A., Inc.); and Chief Compliance Officer, The Invesco Funds Formerly: Global Assurance Officer, Invesco Ltd. and Vice President, The Invesco Funds; Chief Compliance Officer, Invesco Distributors, Inc. (formerly known as Invesco Aim Distributors, Inc.), Invesco Investment Services, Inc.(formerly known as Invesco Aim Investment Services, Inc.) and Van Kampen Investor Services Inc.; Senior Vice President, Invesco Management Group, Inc.; Senior Vice President and Chief Compliance Officer, Invesco Advisers, Inc. and The Invesco Funds; Vice President and Chief Compliance Officer, Invesco Aim Capital Management, Inc. and Invesco Distributors, Inc.; Vice President, Invesco Investment Services, Inc. and Fund Management Company | | N/A | | N/A |
The Statement of Additional Information of the Trust includes additional information about the Fund’s Trustees and is available upon request, without charge, by calling 1.800.959.4246. Please refer to the Fund’s prospectus for information on the Fund’s sub-advisers.
| | | | | | |
Office of the Fund 11 Greenway Plaza, Suite 1000 Houston, TX 77046-1173 | | Investment Adviser Invesco Advisers, Inc. 1555 Peachtree Street, N.E. Atlanta, GA 30309 | | Distributor Invesco Distributors, Inc. 11 Greenway Plaza, Suite 1000 Houston, TX 77046-1173 | | Auditors PricewaterhouseCoopers LLP 1000 Louisiana Street, Suite 5800 Houston, TX 77002-5678 |
| | | |
| | | | | | |
Counsel to the Fund Stradley Ronon Stevens & Young, LLP 2005 Market Street, Suite 2600 Philadelphia, PA 19103-7018 | | Counsel to the Independent Trustees Goodwin Procter LLP 901 New York Avenue, N.W. Washington, D.C. 20001 | | Transfer Agent Invesco Investment Services, Inc. 11 Greenway Plaza, Suite 1000 Houston, TX 77046-1173 | | Custodian State Street Bank and Trust Company 225 Franklin Street Boston, MA 02110-2801 |
Invesco V.I. Diversified Dividend Fund
| | | | |
| | |

| | Annual Report to Shareholders | | December 31, 2015 |
| | |
| | Invesco V.I. Equally-Weighted S&P 500 Fund |

| | |
| | The Fund provides a complete list of its holdings four times in each fiscal year, at the quarter-ends. For the second and fourth quarters, the lists appear in the Fund’s semiannual and annual reports to shareholders. For the first and third quarters, the Fund files the lists with the Securities and Exchange Commission (SEC) on Form N-Q. The Fund’s Form N-Q filings are available on the SEC website, sec.gov. Copies of the Fund’s Forms N-Q may be reviewed and copied at the SEC Public Reference Room in Washington, D.C. You can obtain information on the operation of the Public Reference Room, including information about duplicating fee charges, by calling 202 551 8090 or 800 732 0330, or by electronic request at the following email address: publicinfo@sec.gov. The SEC file numbers for the Fund are 811-07452 and 033-57340. The Fund’s most recent portfolio holdings, as filed on Form N-Q, have also been made available to insurance companies issuing variable annuity contracts and variable life insurance policies (“variable products”) that invest in the Fund. A description of the policies and procedures that the Fund uses to determine how to vote proxies relating to portfolio securities is available without charge, upon request, from our Client Services department at 800 959 4246 or at invesco.com/proxyguidelines. The information is also available on the SEC website, sec.gov. Information regarding how the Fund voted proxies related to its portfolio securities during the most recent 12-month period ended June 30 is available at invesco.com/ proxysearch. The information is also available on the SEC website, sec.gov. Invesco Advisers, Inc. is an investment adviser; it provides investment advisory services to individual and institutional clients and does not sell securities. Invesco Distributors, Inc. is the US distributor for Invesco Ltd.’s retail mutual funds, exchange-traded funds and institutional money market funds. Both are wholly owned, indirect subsidiaries of Invesco Ltd. This report must be accompanied or preceded by a currently effective Fund prospectus and variable product prospectus, which contain more complete information, including sales charges and expenses. Investors should read each carefully before investing. Invesco Distributors, Inc. MS-VIEWSP-AR-1 NOT FDIC INSURED | MAY LOSE VALUE | NO BANK GUARANTEE |
Management’s Discussion of Fund Performance
Performance summary
For the year ended December 31, 2015, Series I shares of Invesco V.I. Equally-Weighted S&P 500 Fund (the Fund), underperformed the Fund’s broad market and style-specific indexes, the S&P 500 Index and the S&P 500 Equal Weight Index, respectively.
Your Fund’s long-term performance appears later in this report.
Fund vs. Indexes
Total returns, 12/31/14 to 12/31/15, excluding variable product issuer charges. If variable product issuer charges were included, returns would be lower.
| | | | | |
| Series I Shares | | | | -2.68 | % |
| Series II Shares | | | | -2.92 | |
| S&P 500 Index▼ (Broad Market Index) | | | | 1.38 | |
| S&P 500 Equal Weight Index▼ (Style-Specific Index) | | | | -2.20 | |
| Lipper VUF Multi-Cap Core Funds Indexn (Peer Group Index) | | | | -2.17 | |
Source(s): ▼FactSet Research Systems Inc., nLipper Inc.
Market conditions and your Fund
The US economy continued its modest, but steady growth, during the year ended December 31, 2015 – although the health of individual economic sectors varied dramatically. The headline economic story was a steady decline in already-battered energy markets, as oil prices plummeted when increased supply overwhelmed demand. This decline particularly affected companies with US-based offshore or shale-based resources – companies whose cost to recover oil is higher than many traditional producers. On the other end of the spectrum, the improved position of the US consumer was the more subtle story which drove the US economy forward during the year.
As the year began, economic growth appeared to be stronger in the US than in the rest of the world. US equity markets were recovering from the crash of oil prices initiated by OPEC’s decision to maintain high production despite low prices and slowing global growth. The view that the US Federal Reserve (the
Fed) would begin raising rates while other central banks were loosening monetary policy led the US dollar to strengthen against many currencies. This hurt commodity- and materials-based economies – and companies in related sectors. Additionally, US-based multinational companies faced foreign exchange headwinds. Low interest rates, the increasing availability of credit and an improving employment picture all contributed to higher consumer confidence and consumer spending, which drove US equity markets higher, particularly through the spring, and helped overcome fears that Greece and the eurozone would fail to reach an agreement on a financial bailout plan.
In the summer of 2015, US equity markets moved sharply lower. A significant downturn in China’s financial markets and weak global economic growth led the Fed to delay raising interest rates; this, in turn, increased investor uncertainty and market volatility. A continued decline in oil prices also contributed to market volatility. In the fall, however, US markets rallied,
the Fed saw enough economic stabilization to finally raise interest rates, and most major US market indexes ended the year barely in positive territory.
Invesco V.I. Equally-Weighted S&P 500 Fund seeks total return through growth of capital and current income. The Fund invests in a diversified portfolio of common stocks represented in the S&P 500 Index. The Fund generally invests in each common stock included in the S&P 500 Index in approximately equal proportions, which differs from the S&P 500 Index because stocks in the S&P 500 Index are represented in proportion to their market value or market capitalization. Due to the equally-weighted nature of the Fund and the capitalization-weighted nature of the S&P 500 Index, the Fund will lag when large-cap stocks outperform mid-cap stocks.
During the reporting period, sectors that contributed the most to Fund performance were the consumer staples, health care and information technology (IT) sectors. The energy, industrials and consumer discretionary sectors were the top detractors from the Fund’s overall performance. Relative to the S&P 500 Index, an underweight allocation in the consumer staples sector and an overweight allocation in the financials sector contributed to Fund results. Overweight allocations in the consumer discretionary, energy, industrials, materials and utilities sectors and underweight allocations in the IT and telecommunication services sectors detracted from Fund results.
The Fund’s top-performing stock during the year was the Internet television network, Netflix. The firm reported strong earnings and increasing service subscriber growth in the middle of the year. Also contributing to the Fund’s
| | | | | |
| Portfolio Composition |
| By sector | | | | % of total net assets | |
| | | | | |
| |
| Financials | | | | 17.6 | % |
| Consumer Discretionary | | | | 16.5 | |
| Information Technology | | | | 13.4 | |
| Industrials | | | | 12.8 | |
| Health Care | | | | 11.3 | |
| Energy | | | | 7.9 | |
| Consumer Staples | | | | 7.6 | |
| Utilities | | | | 5.9 | |
| Materials | | | | 5.3 | |
| Telecommunication Services | | | | 1.0 | |
| Money Market Funds | | | | | |
| Plus Other Assets Less Liabilities | | | | 0.7 | |
| | | | | |
| Top 10 Equity Holdings* |
| | | | % of total net assets | |
| | | | | | | |
| | |
| 1. | | ONEOK, Inc. | | | | 0.2 | % |
| 2. | | Southwestern Energy Co. | | | | 0.2 | |
| 3. | | First Solar, Inc. | | | | 0.2 | |
| 4. | | NRG Energy, Inc. | | | | 0.2 | |
| 5. | | CONSOL Energy Inc. | | | | 0.2 | |
| 6. | | Alcoa Inc. | | | | 0.2 | |
| 7. | | Celgene Corp. | | | | 0.2 | |
| 8. | | Darden Restaurants, Inc. | | | | 0.2 | |
| 9. | | CenterPoint Energy, Inc. | | | | 0.2 | |
10. | | Royal Caribbean Cruises Ltd. | | | | 0.2 | |
| | | | | |
Total Net Assets | | | $ | 66.6 million | |
| |
Total Number of Holdings* | | | | 504 | |
The Fund’s holdings are subject to change, and there is no assurance that the Fund will continue to hold any particular security.
*Excluding money market fund holdings.
Data presented here are as of December 31, 2015.
Invesco V.I. Equally-Weighted S&P 500 Fund
performance was Amazon.com. The company announced strong earnings high above analyst estimates due to the company’s growing streaming business. A third contributor to Fund performance was Cablevision Systems, a cable company serving the New York City region. The company’s stock price rose 15% in the third quarter of 2015 after management announced it agreed to be acquired by European telecommunications giant Altice NV (not a Fund holding).
During the reporting period, the energy sector struggled the most with Chesapeake Energy, CONSOL Energy and Freeport-McMoRan as the top detractors from Fund performance in this sector. Chesapeake Energy, primarily a natural gas company, was hurt by a decrease in natural gas prices. CONSOL Energy was also affected by falling natural gas prices. Freeport-McMoRan, a major metals miner with oil holdings, suffered from a commodities sell-off, with copper and crude oil down during the reporting period.
Please note, the Fund’s strategy is principally implemented through equity investments, but may also use S&P 500 futures contracts, a derivative instrument, to gain exposure to the equity market. During the reporting period, the Fund invested in S&P 500 futures contracts, which generated a positive return and contributed to Fund performance. Derivatives can be a cost-effective way to gain exposure to asset classes. However, derivatives may amplify traditional investment risks through the creation of leverage and may be less liquid than traditional securities.
We welcome new investors who joined the Fund during the year and thank all our shareholders for your investment in Invesco V.I. Equally-Weighted S&P 500 Fund.
The views and opinions expressed in management’s discussion of Fund performance are those of Invesco Advisers, Inc. These views and opinions are subject to change at any time based on factors such as market and economic conditions. These views and opinions may not be relied upon as investment advice or recommendations, or as an offer for a particular security. The information is not a complete analysis of every aspect of any market, country, industry, security or the Fund. Statements of fact are from sources considered reliable, but Invesco Advisers, Inc. makes no representation or warranty as to their completeness or accuracy. Although historical performance is no guarantee of future results, these insights may help you understand our investment management philosophy.
See important Fund and, if applicable, index disclosures later in this report.
| | |
 | | Anthony Munchak Chartered Financial Analyst, Portfolio Manager, is manager of Invesco V.I. Equally-Weighted S&P 500 |
| Fund. He joined Invesco in 2000. Mr. Munchak earned a BS and an MS in finance from Boston College and an MBA from Bentley College. |
| | |
 | | Glen Murphy Chartered Financial Analyst, Portfolio Manager, is manager of Invesco V.I. Equally-Weighted S&P 500 |
| Fund. He joined Invesco in 1995. Mr. Murphy earned a BA in business administration from the University of Massachusetts Amherst and an MS in finance from Boston College. |
| | |
 | | Francis Orlando Chartered Financial Analyst, Portfolio Manager, is manager of Invesco V.I. Equally-Weighted S&P 500 |
| Fund. He joined Invesco in 1987. Mr. Orlando earned a BA in business administration from Merrimack College and an MBA from Boston University. |
| | |
 | | Daniel Tsai Chartered Financial Analyst, Portfolio Manager, is manager of Invesco V.I. Equally-Weighted S&P 500 |
| Fund. He joined Invesco in 2000. Mr. Tsai earned a BS in mechanical engineering from National Taiwan University, an MS in mechanical engineering from the University of Michigan and an MS in computer science from Wayne State University. |
| | |
 | | Anne Unflat Portfolio Manager, is manager of Invesco V.I. Equally-Weighted S&P 500 Fund. She joined |
| Invesco in 1988. Ms. Unflat earned a BA in economics from Queens College and an MBA in finance from St. John’s University. |
Invesco V.I. Equally-Weighted S&P 500 Fund
Your Fund’s Long-Term Performance
Results of a $10,000 Investment – Oldest Share Class(es)
Fund and index data from 12/31/05
| 1 | Source: FactSet Research Systems Inc. |
Past performance cannot guarantee comparable future results.
| | | | | |
| Average Annual Total Returns |
As of 12/31/15 | | | | | |
| |
| Series I Shares | | | | | |
| Inception (11/9/94) | | | | 10.44 | % |
| 10 Years | | | | 8.07 | |
| 5 Years | | | | 11.86 | |
| 1 Year | | | | -2.68 | |
| |
| Series II Shares | | | | | |
| Inception (7/24/00) | | | | 8.03 | % |
| 10 Years | | | | 7.80 | |
| 5 Years | | | | 11.58 | |
| 1 Year | | | | -2.92 | |
Effective June 1, 2010, Class X and Class Y shares of the predecessor fund, Morgan Stanley V.I. Select Dimensions Equally-Weighted S&P 500 Fund, advised by Morgan Stanley Investment Advisors Inc. were reorganized into Series I and Series II shares, respectively, of Invesco V.I. Select Dimensions Equally-Weighted S&P 500 Fund (renamed Invesco V.I. Equally-Weighted S&P 500 Fund on April 30, 2012). Returns shown above for Series I and Series II shares are blended returns of the predecessor fund and Invesco V.I. Equally-Weighted S&P 500 Fund.
Share class returns will differ from the predecessor fund because of different expenses.
The performance data quoted represent past performance and cannot guarantee comparable future results; current performance may be lower or higher. Please contact your variable product issuer or financial adviser for the most recent month-end variable product performance. Performance figures reflect Fund expenses, reinvested distributions and changes in net asset value. Investment return and principal value will fluctuate so that you may have a gain or loss when you sell shares.
The total annual Fund operating expense ratio set forth in the most recent Fund prospectus as of the date of this report for Series I and Series II shares was 0.59% and 0.84%, respectively. The expense ratios presented above may vary from the expense ratios presented in other sections of this report that are based on expenses incurred during the period covered by this report.
Invesco V.I. Equally-Weighted S&P 500 Fund, a series portfolio of AIM
Variable Insurance Funds (Invesco Variable Insurance Funds), is currently offered through insurance companies issuing variable products. You cannot purchase shares of the Fund directly. Performance figures given represent the Fund and are not intended to reflect actual variable product values. They do not reflect sales charges, expenses and fees assessed in connection with a variable product. Sales charges, expenses and fees, which are determined by the variable product issuers, will vary and will lower the total return.
The most recent month-end performance at the Fund level, excluding variable product charges, is available at 800 451 4246. As mentioned above, for the most recent month-end performance including variable product charges, please contact your variable product issuer or financial adviser.
Fund performance reflects any applicable fee waivers and/or expense reimbursements. Had the adviser not waived fees and/or reimbursed expenses currently or in the past, returns would have been lower. See current prospectus for more information.
Invesco V.I. Equally-Weighted S&P 500 Fund
Invesco V.I. Equally-Weighted S&P 500 Fund’s investment objective is to achieve a high level of total return on its assets through a combination of capital appreciation and current income.
| n | | Unless otherwise stated, information presented in this report is as of December 31, 2015, and is based on total net assets. |
| n | | Unless otherwise noted, all data provided by Invesco. |
| n | | To access your Fund’s reports/prospectus, visit invesco.com/fundreports. |
Principal risks of investing in the Fund
Depositary receipts risk. Depositary receipts involve many of the same risks as those associated with direct investment in foreign securities. In addition, the underlying issuers of certain depositary receipts, particularly unsponsored or unregistered depositary receipts, are under no obligation to distribute shareholder communications to the holders of such receipts or to pass through to them any voting rights with respect to the deposited securities.
Derivatives risk. The value of a derivative instrument depends largely on (and is derived from) the value of an underlying security, currency, commodity, interest rate, index or other asset (each referred to as an underlying asset). In addition to risks relating to the underlying assets, the use of derivatives may include other, possibly greater, risks, including counterparty, leverage and liquidity risks. Counterparty risk is the risk that the counterparty to the derivative contract will default on its obligation to pay the Fund the amount owed or otherwise perform under the derivative contract. Derivatives create leverage risk because they do not require payment up front equal to the economic exposure created by owning the derivative. As a result, an adverse change in the value of the underlying asset could result in the Fund sustaining a loss that is substantially greater than the amount invested in the derivative, which may make the Fund’s returns more volatile and increase the risk of loss. Derivative instruments may also be less liquid than more traditional investments and the Fund may be unable to sell or close out its derivative positions at a desirable time or price. This risk may be more acute under adverse market conditions, during which the Fund may be most in need of liquidating its derivative positions. Derivatives may also be harder to value, less tax efficient and subject to changing government regulation that could impact the Fund’s ability to use certain derivatives or their cost. Also, derivatives used for hedging or to gain or limit exposure to a particular market segment may not provide the expected benefits, particularly during adverse market conditions.
Developing/emerging markets securities risk. The prices of securities issued by foreign companies and governments located in developing/emerging markets countries may be affected more negatively by inflation, devaluation of their currencies, higher transaction costs, delays in settlement, adverse political developments, the introduction of capital controls, withholding taxes, nationalization of private assets, expropriation, social unrest, war or lack of timely information than those in developed countries.
Foreign securities risk. The Fund’s foreign investments may be affected by changes in a foreign country’s exchange rates, political and social instability, changes in economic or taxation policies, difficulties when enforcing obligations, decreased liquidity, and increased volatility. Foreign companies may be subject to less regulation resulting in less publicly available information about the companies.
Indexing risk. The Fund is operated as a passively managed index fund. As such, the adverse performance of a particular stock ordinarily will not result in the elimination of the stock from the Fund’s portfolio. The Fund will remain invested in common stocks even when stock prices are generally falling. Ordinarily, the Adviser will not sell the Fund’s portfolio securities except to reflect additions or deletions of the stocks that comprise the S&P 500 Index, or as may be necessary to raise cash to pay Fund shareholders who sell Fund shares. The Fund’s ability to correlate its performance, before expenses, with the S&P 500 Index may be affected by, among other things, changes in securities markets, the manner in which the S&P 500 Index is calculated and the timing of purchases and sales, and also depends to some extent on the size of the Fund’s portfolio, the size of cash flows into and out of the Fund and differences between how and when the Fund and the index are valued.
Management risk. The investment techniques and risk analysis used by the Fund’s portfolio managers may not produce the desired results.
Market risk. The prices of and the income generated by the Fund’s securities may decline in response to, among other things, investor sentiment, general economic and market conditions, regional or global instability, and currency and interest rate fluctuations.
About indexes used in this report
The S&P 500® Index is an unmanaged index considered representative of the US stock market.
The S&P 500® Equal Weight Index is the equally weighted version of the S&P 500 Index.
The Lipper VUF Multi-Cap Core Funds Index is an unmanaged index considered representative of multicap core variable insurance underlying funds tracked by Lipper.
A direct investment cannot be made in an index. Unless otherwise indicated, index results include reinvested dividends, and they do not reflect sales charges. Performance of the peer group, if applicable, reflects fund expenses; performance of a market index does not.
Other information
The returns shown in management’s discussion of Fund performance are based on net asset values calculated for shareholder transactions. Generally accepted accounting principles require adjustments to be made to the net assets of the Fund at period end for financial reporting purposes, and as such, the net asset values for shareholder transactions and the returns based on those net asset values may differ from the net asset values and returns reported in the Financial Highlights. Additionally, the returns and net asset values shown throughout this report are at the Fund level only and do not include variable product issuer charges. If such charges were included, the total returns would be lower.
Industry classifications used in this report are generally according to the Global Industry Classification Standard, which was developed by and is the exclusive property and a service mark of MSCI Inc. and Standard & Poor’s.
Invesco V.I. Equally-Weighted S&P 500 Fund
Schedule of Investments(a)
December 31, 2015
| | | | | | | | |
| | | Shares | | | Value | |
Common Stocks & Other Equity Interests–99.30% | |
| Advertising–0.40% | |
Interpublic Group of Cos., Inc. (The) | | | 5,815 | | | $ | 135,373 | |
Omnicom Group Inc. | | | 1,753 | | | | 132,632 | |
| | | | | | | | 268,005 | |
|
| Aerospace & Defense–2.18% | |
Boeing Co. (The) | | | 899 | | | | 129,986 | |
General Dynamics Corp. | | | 944 | | | | 129,668 | |
Honeywell International Inc. | | | 1,324 | | | | 137,127 | |
L-3 Communications Holdings, Inc. | | | 1,091 | | | | 130,385 | |
Lockheed Martin Corp. | | | 599 | | | | 130,073 | |
Northrop Grumman Corp. | | | 699 | | | | 131,978 | |
Precision Castparts Corp. | | | 561 | | | | 130,158 | |
Raytheon Co. | | | 1,031 | | | | 128,390 | |
Rockwell Collins, Inc. | | | 1,457 | | | | 134,481 | |
Textron Inc. | | | 3,186 | | | | 133,844 | |
United Technologies Corp. | | | 1,394 | | | | 133,922 | |
| | | | | | | | 1,450,012 | |
|
| Agricultural & Farm Machinery–0.19% | |
Deere & Co. | | | 1,686 | | | | 128,591 | |
|
| Agricultural Products–0.21% | |
Archer-Daniels-Midland Co. | | | 3,805 | | | | 139,567 | |
|
| Air Freight & Logistics–0.78% | |
C.H. Robinson Worldwide, Inc. | | | 2,100 | | | | 130,242 | |
Expeditors International of Washington, Inc. | | | 2,793 | | | | 125,964 | |
FedEx Corp. | | | 902 | | | | 134,389 | |
United Parcel Service, Inc.–Class B | | | 1,342 | | | | 129,141 | |
| | | | | | | | 519,736 | |
|
| Airlines–0.79% | |
American Airlines Group Inc. | | | 3,094 | | | | 131,031 | |
Delta Air Lines, Inc. | | | 2,641 | | | | 133,872 | |
Southwest Airlines Co. | | | 2,998 | | | | 129,094 | |
United Continental Holdings Inc.(b) | | | 2,282 | | | | 130,759 | |
| | | | | | | | 524,756 | |
|
| Alternative Carriers–0.21% | |
Level 3 Communications, Inc.(b) | | | 2,527 | | | | 137,368 | |
|
| Aluminum–0.22% | |
Alcoa Inc. | | | 14,696 | | | | 145,050 | |
|
| Apparel Retail–0.97% | |
Gap, Inc. (The) | | | 4,995 | | | | 123,377 | |
L Brands, Inc. | | | 1,347 | | | | 129,070 | |
Ross Stores, Inc. | | | 2,430 | | | | 130,758 | |
TJX Cos., Inc. (The) | | | 1,845 | | | | 130,829 | |
Urban Outfitters, Inc.(b) | | | 5,738 | | | | 130,539 | |
| | | | | | | | 644,573 | |
| | | | | | | | |
| | | Shares | | | Value | |
| Apparel, Accessories & Luxury Goods–1.56% | |
Coach, Inc. | | | 4,285 | | | $ | 140,248 | |
Fossil Group, Inc.(b) | | | 3,520 | | | | 128,691 | |
Hanesbrands, Inc. | | | 4,413 | | | | 129,875 | |
Michael Kors Holdings Ltd.(b) | | | 3,223 | | | | 129,113 | |
PVH Corp. | | | 1,708 | | | | 125,794 | |
Ralph Lauren Corp. | | | 1,151 | | | | 128,314 | |
Under Armour, Inc.–Class A(b) | | | 1,576 | | | | 127,041 | |
VF Corp. | | | 2,106 | | | | 131,099 | |
| | | | | | | | 1,040,175 | |
|
| Application Software–0.99% | |
Adobe Systems Inc.(b) | | | 1,423 | | | | 133,677 | |
Autodesk, Inc.(b) | | | 2,130 | | | | 129,781 | |
Citrix Systems, Inc.(b) | | | 1,733 | | | | 131,101 | |
Intuit Inc. | | | 1,353 | | | | 130,564 | |
salesforce.com, inc.(b) | | | 1,692 | | | | 132,653 | |
| | | | | | | | 657,776 | |
|
| Asset Management & Custody Banks–2.00% | |
Affiliated Managers Group, Inc.(b) | | | 851 | | | | 135,956 | |
Ameriprise Financial, Inc. | | | 1,237 | | | | 131,641 | |
Bank of New York Mellon Corp. (The) | | | 3,193 | | | | 131,615 | |
BlackRock, Inc. | | | 403 | | | | 137,230 | |
Franklin Resources, Inc. | | | 3,599 | | | | 132,515 | |
Invesco Ltd.(c) | | | 4,143 | | | | 138,708 | |
Legg Mason, Inc. | | | 3,282 | | | | 128,753 | |
Northern Trust Corp. | | | 1,862 | | | | 134,232 | |
State Street Corp. | | | 1,969 | | | | 130,663 | |
T. Rowe Price Group Inc. | | | 1,837 | | | | 131,327 | |
| | | | | | | | 1,332,640 | |
|
| Auto Parts & Equipment–0.61% | |
BorgWarner, Inc. | | | 3,269 | | | | 141,319 | |
Delphi Automotive PLC (United Kingdom) | | | 1,587 | | | | 136,053 | |
Johnson Controls, Inc. | | | 3,238 | | | | 127,869 | |
| | | | | | | | 405,241 | |
|
| Automobile Manufacturers–0.39% | |
Ford Motor Co. | | | 9,515 | | | | 134,066 | |
General Motors Co. | | | 3,768 | | | | 128,150 | |
| | | | | | | | 262,216 | |
|
| Automotive Retail–0.96% | |
Advance Auto Parts, Inc. | | | 874 | | | | 131,546 | |
AutoNation, Inc.(b) | | | 2,121 | | | | 126,539 | |
AutoZone, Inc.(b) | | | 172 | | | | 127,608 | |
CarMax, Inc.(b) | | | 2,267 | | | | 122,350 | |
O’Reilly Automotive, Inc.(b) | | | 522 | | | | 132,285 | |
| | | | | | | | 640,328 | |
See accompanying Notes to Financial Statements which are an integral part of the financial statements.
Invesco V.I. Equally-Weighted S&P 500 Fund
| | | | | | | | |
| | | Shares | | | Value | |
| Biotechnology–1.85% | |
AbbVie Inc. | | | 2,409 | | | $ | 142,709 | |
Alexion Pharmaceuticals, Inc.(b) | | | 692 | | | | 131,999 | |
Amgen Inc. | | | 838 | | | | 136,033 | |
Baxalta Inc. | | | 3,514 | | | | 137,151 | |
Biogen Inc.(b) | | | 459 | | | | 140,615 | |
Celgene Corp.(b) | | | 1,201 | | | | 143,832 | |
Gilead Sciences, Inc. | | | 1,301 | | | | 131,648 | |
Regeneron Pharmaceuticals, Inc.(b) | | | 244 | | | | 132,460 | |
Vertex Pharmaceuticals Inc.(b) | | | 1,106 | | | | 139,168 | |
| | | | | | | | 1,235,615 | |
|
| Brewers–0.20% | |
Molson Coors Brewing Co.–Class B | | | 1,404 | | | | 131,864 | |
|
| Broadcasting–0.78% | |
CBS Corp.–Class B | | | 2,779 | | | | 130,974 | |
Discovery Communications, Inc.–Class A(b) | | | 1,791 | | | | 47,784 | |
Discovery Communications, Inc.–Class C(b) | | | 3,078 | | | | 77,627 | |
Scripps Networks Interactive Inc.–Class A | | | 2,383 | | | | 131,566 | |
TEGNA Inc. | | | 5,115 | | | | 130,535 | |
| | | | | | | | 518,486 | |
|
| Building Products–0.39% | |
Allegion PLC | | | 2,015 | | | | 132,829 | |
Masco Corp. | | | 4,495 | | | | 127,208 | |
| | | | | | | | 260,037 | |
|
| Cable & Satellite–0.60% | |
Cablevision Systems Corp.–Class A | | | 4,319 | | | | 137,776 | |
Comcast Corp.–Class A | | | 2,245 | | | | 126,685 | |
Time Warner Cable Inc. | | | 721 | | | | 133,811 | |
| | | | | | | | 398,272 | |
|
| Casinos & Gaming–0.21% | |
Wynn Resorts Ltd. | | | 2,062 | | | | 142,670 | |
|
| Coal & Consumable Fuels–0.22% | |
CONSOL Energy Inc. | | | 18,628 | | | | 147,161 | |
|
| Commodity Chemicals–0.20% | |
LyondellBasell Industries N.V.–Class A | | | 1,520 | | | | 132,088 | |
|
| Communications Equipment–1.19% | |
Cisco Systems, Inc. | | | 4,976 | | | | 135,123 | |
F5 Networks, Inc.(b) | | | 1,333 | | | | 129,248 | |
Harris Corp. | | | 1,579 | | | | 137,215 | |
Juniper Networks, Inc. | | | 4,549 | | | | 125,552 | |
Motorola Solutions, Inc. | | | 1,897 | | | | 129,850 | |
QUALCOMM, Inc. | | | 2,743 | | | | 137,109 | |
| | | | | | | | 794,097 | |
|
| Computer & Electronics Retail–0.38% | |
Best Buy Co., Inc. | | | 4,370 | | | | 133,066 | |
GameStop Corp.–Class A | | | 4,340 | | | | 121,694 | |
| | | | | | | | 254,760 | |
| | | | | | | | |
| | | Shares | | | Value | |
| Construction & Engineering–0.60% | |
Fluor Corp. | | | 2,883 | | | $ | 136,135 | |
Jacobs Engineering Group, Inc.(b) | | | 3,109 | | | | 130,423 | |
Quanta Services, Inc.(b) | | | 6,565 | | | | 132,941 | |
| | | | | | | | 399,499 | |
|
| Construction Machinery & Heavy Trucks–0.59% | |
Caterpillar Inc. | | | 1,990 | | | | 135,240 | |
Cummins Inc. | | | 1,485 | | | | 130,695 | |
PACCAR Inc. | | | 2,755 | | | | 130,587 | |
| | | | | | | | 396,522 | |
|
| Construction Materials–0.38% | |
Martin Marietta Materials, Inc. | | | 915 | | | | 124,971 | |
Vulcan Materials Co. | | | 1,380 | | | | 131,058 | |
| | | | | | | | 256,029 | |
|
| Consumer Electronics–0.41% | |
Garmin Ltd. | | | 3,673 | | | | 136,525 | |
Harman International Industries, Inc. | | | 1,432 | | | | 134,909 | |
| | | | | | | | 271,434 | |
|
| Consumer Finance–0.97% | |
American Express Co. | | | 1,890 | | | | 131,450 | |
Capital One Financial Corp. | | | 1,767 | | | | 127,542 | |
Discover Financial Services | | | 2,478 | | | | 132,870 | |
Navient Corp. | | | 10,585 | | | | 121,198 | |
Synchrony Financial(b) | | | 4,344 | | | | 132,101 | |
| | | | | | | | 645,161 | |
|
| Data Processing & Outsourced Services–2.17% | |
Alliance Data Systems Corp.(b) | | | 485 | | | | 134,136 | |
Automatic Data Processing, Inc. | | | 1,561 | | | | 132,248 | |
Fidelity National Information Services, Inc. | | | 2,127 | | | | 128,896 | |
Fiserv, Inc.(b) | | | 1,415 | | | | 129,416 | |
MasterCard, Inc.–Class A | | | 1,372 | | | | 133,578 | |
Paychex, Inc. | | | 2,491 | | | | 131,749 | |
PayPal Holdings, Inc.(b) | | | 3,753 | | | | 135,859 | |
Total System Services, Inc. | | | 2,422 | | | | 120,616 | |
Visa Inc.–Class A | | | 1,709 | | | | 132,533 | |
Western Union Co. (The) | | | 7,124 | | | | 127,591 | |
Xerox Corp. | | | 12,969 | | | | 137,860 | |
| | | | | | | | 1,444,482 | |
|
| Department Stores–0.56% | |
Kohl’s Corp. | | | 2,815 | | | | 134,078 | |
Macy’s, Inc. | | | 3,542 | | | | 123,899 | |
Nordstrom, Inc. | | | 2,348 | | | | 116,954 | |
| | | | | | | | 374,931 | |
|
| Distillers & Vintners–0.39% | |
Brown-Forman Corp.–Class B | | | 1,300 | | | | 129,064 | |
Constellation Brands, Inc.–Class A | | | 941 | | | | 134,036 | |
| | | | | | | | 263,100 | |
See accompanying Notes to Financial Statements which are an integral part of the financial statements.
Invesco V.I. Equally-Weighted S&P 500 Fund
| | | | | | | | |
| | | Shares | | | Value | |
| Distributors–0.20% | |
Genuine Parts Co. | | | 1,526 | | | $ | 131,068 | |
|
| Diversified Banks–1.19% | |
Bank of America Corp. | | | 7,782 | | | | 130,971 | |
Citigroup Inc. | | | 2,553 | | | | 132,118 | |
Comerica Inc. | | | 3,102 | | | | 129,756 | |
JPMorgan Chase & Co. | | | 2,032 | | | | 134,173 | |
U.S. Bancorp | | | 3,076 | | | | 131,253 | |
Wells Fargo & Co. | | | 2,442 | | | | 132,747 | |
| | | | | | | | 791,018 | |
|
| Diversified Chemicals–0.57% | |
Dow Chemical Co. (The) | | | 2,439 | | | | 125,559 | |
E. I. du Pont de Nemours and Co. | | | 1,848 | | | | 123,077 | |
Eastman Chemical Co. | | | 1,929 | | | | 130,227 | |
| | | | | | | | 378,863 | |
|
| Diversified Metals & Mining–0.19% | |
Freeport-McMoRan Inc. | | | 18,870 | | | | 127,750 | |
|
| Diversified Support Services–0.20% | |
Cintas Corp. | | | 1,447 | | | | 131,749 | |
|
| Drug Retail–0.41% | |
CVS Health Corp. | | | 1,395 | | | | 136,389 | |
Walgreens Boots Alliance, Inc. | | | 1,592 | | | | 135,567 | |
| | | | | | | | 271,956 | |
|
| Electric Utilities–2.64% | |
American Electric Power Co., Inc. | | | 2,386 | | | | 139,032 | |
Duke Energy Corp. | | | 1,919 | | | | 136,997 | |
Edison International | | | 2,198 | | | | 130,144 | |
Entergy Corp. | | | 1,980 | | | | 135,353 | |
Eversource Energy | | | 2,661 | | | | 135,897 | |
Exelon Corp. | | | 5,018 | | | | 139,350 | |
FirstEnergy Corp. | | | 4,138 | | | | 131,299 | |
NextEra Energy, Inc. | | | 1,336 | | | | 138,797 | |
Pepco Holdings, Inc. | | | 4,980 | | | | 129,530 | |
Pinnacle West Capital Corp. | | | 2,116 | | | | 136,440 | |
PPL Corp. | | | 3,980 | | | | 135,837 | |
Southern Co. (The) | | | 2,932 | | | | 137,188 | |
Xcel Energy, Inc. | | | 3,726 | | | | 133,801 | |
| | | �� | | | | | 1,759,665 | |
|
| Electrical Components & Equipment–0.80% | |
AMETEK, Inc. | | | 2,450 | | | | 131,296 | |
Eaton Corp. PLC(b) | | | 2,559 | | | | 133,170 | |
Emerson Electric Co. | | | 2,862 | | | | 136,890 | |
Rockwell Automation, Inc. | | | 1,281 | | | | 131,443 | |
| | | | | | | | 532,799 | |
|
| Electronic Components–0.39% | |
Amphenol Corp.–Class A | | | 2,474 | | | | 129,217 | |
Corning Inc. | | | 6,969 | | | | 127,393 | |
| | | | | | | | 256,610 | |
| | | | | | | | |
| | | Shares | | | Value | |
| Electronic Equipment & Instruments–0.19% | |
FLIR Systems, Inc. | | | 4,463 | | | $ | 125,276 | |
|
| Electronic Manufacturing Services–0.20% | |
TE Connectivity Ltd. (Switzerland) | | | 2,066 | | | | 133,484 | |
|
| Environmental & Facilities Services–0.60% | |
Republic Services, Inc. | | | 3,012 | | | | 132,498 | |
Stericycle, Inc.(b) | | | 1,119 | | | | 134,951 | |
Waste Management, Inc. | | | 2,535 | | | | 135,293 | |
| | | | | | | | 402,742 | |
|
| Fertilizers & Agricultural Chemicals–0.78% | |
CF Industries Holdings, Inc. | | | 3,166 | | | | 129,204 | |
FMC Corp. | | | 3,424 | | | | 133,981 | |
Monsanto Co. | | | 1,389 | | | | 136,844 | |
Mosaic Co. (The) | | | 4,433 | | | | 122,307 | |
| | | | | | | | 522,336 | |
|
| Food Distributors–0.20% | |
Sysco Corp. | | | 3,182 | | | | 130,462 | |
|
| Food Retail–0.39% | |
Kroger Co. (The) | | | 3,168 | | | | 132,517 | |
Whole Foods Market, Inc. | | | 3,827 | | | | 128,205 | |
| | | | | | | | 260,722 | |
|
| Footwear–0.19% | |
NIKE, Inc.–Class B | | | 2,060 | | | | 128,750 | |
|
| Gas Utilities–0.20% | |
AGL Resources Inc. | | | 2,075 | | | | 132,406 | |
|
| General Merchandise Stores–0.59% | |
Dollar General Corp. | | | 1,853 | | | | 133,175 | |
Dollar Tree, Inc.(b) | | | 1,702 | | | | 131,429 | |
Target Corp. | | | 1,812 | | | | 131,569 | |
| | | | | | | | 396,173 | |
|
| Gold–0.18% | |
Newmont Mining Corp. | | | 6,805 | | | | 122,422 | |
|
| Health Care Distributors–1.01% | |
AmerisourceBergen Corp. | | | 1,274 | | | | 132,127 | |
Cardinal Health, Inc. | | | 1,515 | | | | 135,244 | |
Henry Schein, Inc.(b) | | | 849 | | | | 134,303 | |
McKesson Corp. | | | 684 | | | | 134,905 | |
Patterson Cos. Inc. | | | 2,974 | | | | 134,455 | |
| | | | | | | | 671,034 | |
|
| Health Care Equipment–2.39% | |
Abbott Laboratories | | | 2,934 | | | | 131,766 | |
Baxter International Inc. | | | 3,521 | | | | 134,326 | |
Becton, Dickinson and Co. | | | 857 | | | | 132,055 | |
Boston Scientific Corp.(b) | | | 7,194 | | | | 132,657 | |
C.R. Bard, Inc. | | | 711 | | | | 134,692 | |
Edwards Lifesciences Corp.(b) | | | 1,629 | | | | 128,659 | |
Intuitive Surgical, Inc.(b) | | | 248 | | | | 135,448 | |
See accompanying Notes to Financial Statements which are an integral part of the financial statements.
Invesco V.I. Equally-Weighted S&P 500 Fund
| | | | | | | | |
| | | Shares | | | Value | |
| Health Care Equipment–(continued) | |
Medtronic PLC | | | 1,697 | | | $ | 130,533 | |
St. Jude Medical, Inc. | | | 2,147 | | | | 132,620 | |
Stryker Corp. | | | 1,411 | | | | 131,138 | |
Varian Medical Systems, Inc.(b) | | | 1,675 | | | | 135,340 | |
Zimmer Biomet Holdings, Inc. | | | 1,315 | | | | 134,906 | |
| | | | | | | | 1,594,140 | |
|
| Health Care Facilities–0.59% | |
HCA Holdings, Inc.(b) | | | 1,963 | | | | 132,758 | |
Tenet Healthcare Corp.(b) | | | 4,340 | | | | 131,502 | |
Universal Health Services, Inc.–Class B | | | 1,089 | | | | 130,124 | |
| | | | | | | | 394,384 | |
|
| Health Care REIT’s–0.62% | |
HCP, Inc. | | | 3,658 | | | | 139,882 | |
Ventas, Inc. | | | 2,394 | | | | 135,093 | |
Welltower Inc. | | | 2,059 | | | | 140,074 | |
| | | | | | | | 415,049 | |
|
| Health Care Services–0.80% | |
DaVita HealthCare Partners Inc.(b) | | | 1,867 | | | | 130,149 | |
Express Scripts Holding Co.(b) | | | 1,531 | | | | 133,825 | |
Laboratory Corp. of America Holdings(b) | | | 1,074 | | | | 132,789 | |
Quest Diagnostics Inc. | | | 1,929 | | | | 137,229 | |
| | | | | | | | 533,992 | |
|
| Health Care Supplies–0.20% | |
DENTSPLY International Inc. | | | 2,177 | | | | 132,470 | |
|
| Health Care Technology–0.20% | |
Cerner Corp.(b) | | | 2,170 | | | | 130,569 | |
|
| Home Entertainment Software–0.40% | |
Activision Blizzard, Inc. | | | 3,497 | | | | 135,369 | |
Electronic Arts Inc.(b) | | | 1,938 | | | | 133,179 | |
| | | | | | | | 268,548 | |
|
| Home Furnishings–0.38% | |
Leggett & Platt, Inc. | | | 3,007 | | | | 126,354 | |
Mohawk Industries, Inc.(b) | | | 683 | | | | 129,354 | |
| | | | | | | | 255,708 | |
|
| Home Improvement Retail–0.40% | |
Home Depot, Inc. (The) | | | 997 | | | | 131,853 | |
Lowe’s Cos., Inc. | | | 1,734 | | | | 131,854 | |
| | | | | | | | 263,707 | |
|
| Homebuilding–0.59% | |
D.R. Horton, Inc. | | | 4,062 | | | | 130,106 | |
Lennar Corp.–Class A | | | 2,661 | | | | 130,150 | |
PulteGroup Inc. | | | 7,381 | | | | 131,529 | |
| | | | | | | | 391,785 | |
|
| Homefurnishing Retail–0.18% | |
Bed Bath & Beyond Inc.(b) | | | 2,473 | | | | 119,322 | |
| | | | | | | | |
| | | Shares | | | Value | |
| Hotel and Resort REIT’s–0.19% | |
Host Hotels & Resorts Inc. | | | 8,235 | | | $ | 126,325 | |
|
| Hotels, Resorts & Cruise Lines–1.01% | |
Carnival Corp. | | | 2,568 | | | | 139,905 | |
Marriott International Inc.–Class A | | | 1,947 | | | | 130,527 | |
Royal Caribbean Cruises Ltd. | | | 1,415 | | | | 143,212 | |
Starwood Hotels & Resorts Worldwide, Inc. | | | 1,912 | | | | 132,463 | |
Wyndham Worldwide Corp. | | | 1,781 | | | | 129,390 | |
| | | | | | | | 675,497 | |
|
| Household Appliances–0.20% | |
Whirlpool Corp. | | | 890 | | | | 130,714 | |
|
| Household Products–1.00% | |
Church & Dwight Co., Inc. | | | 1,534 | | | | 130,206 | |
Clorox Co. (The) | | | 1,033 | | | | 131,015 | |
Colgate-Palmolive Co. | | | 1,996 | | | | 132,974 | |
Kimberly-Clark Corp. | | | 1,091 | | | | 138,884 | |
Procter & Gamble Co. (The) | | | 1,673 | | | | 132,853 | |
| | | | | | | | 665,932 | |
|
| Housewares & Specialties–0.19% | |
Newell Rubbermaid Inc. | | | 2,875 | | | | 126,730 | |
|
| Human Resource & Employment Services–0.20% | |
Robert Half International, Inc. | | | 2,796 | | | | 131,803 | |
|
| Hypermarkets & Super Centers–0.40% | |
Costco Wholesale Corp. | | | 813 | | | | 131,299 | |
Wal-Mart Stores, Inc. | | | 2,193 | | | | 134,431 | |
| | | | | | | | 265,730 | |
|
| Independent Power Producers & Energy Traders–0.44% | |
AES Corp. (The) | | | 14,516 | | | | 138,918 | |
NRG Energy, Inc. | | | 12,841 | | | | 151,139 | |
| | | | | | | | 290,057 | |
|
| Industrial Conglomerates–0.79% | |
3M Co. | | | 840 | | | | 126,538 | |
Danaher Corp. | | | 1,399 | | | | 129,939 | |
General Electric Co. | | | 4,302 | | | | 134,007 | |
Roper Technologies, Inc. | | | 710 | | | | 134,751 | |
| | | | | | | | 525,235 | |
|
| Industrial Gases–0.58% | |
Air Products and Chemicals, Inc. | | | 997 | | | | 129,720 | |
Airgas, Inc. | | | 953 | | | | 131,819 | |
Praxair, Inc. | | | 1,235 | | | | 126,464 | |
| | | | | | | | 388,003 | |
|
| Industrial Machinery–1.77% | |
Dover Corp. | | | 2,108 | | | | 129,241 | |
Flowserve Corp. | | | 3,156 | | | | 132,805 | |
Illinois Tool Works Inc. | | | 1,422 | | | | 131,791 | |
Ingersoll-Rand PLC | | | 2,386 | | | | 131,922 | |
Parker-Hannifin Corp. | | | 1,361 | | | | 131,990 | |
See accompanying Notes to Financial Statements which are an integral part of the financial statements.
Invesco V.I. Equally-Weighted S&P 500 Fund
| | | | | | | | |
| | | Shares | | | Value | |
| Industrial Machinery–(continued) | |
Pentair PLC (United Kingdom) | | | 2,516 | | | $ | 124,617 | |
Snap-on Inc. | | | 775 | | | | 132,858 | |
Stanley Black & Decker Inc. | | | 1,216 | | | | 129,784 | |
Xylem, Inc. | | | 3,595 | | | | 131,218 | |
| | | | | | | | 1,176,226 | |
|
| Industrial REIT’s–0.20% | |
Prologis, Inc. | | | 3,143 | | | | 134,898 | |
|
| Insurance Brokers–0.39% | |
Aon PLC | | | 1,394 | | | | 128,541 | |
Marsh & McLennan Cos., Inc. | | | 2,371 | | | | 131,472 | |
| | | | | | | | 260,013 | |
|
| Integrated Oil & Gas–0.61% | |
Chevron Corp. | | | 1,505 | | | | 135,390 | |
Exxon Mobil Corp. | | | 1,750 | | | | 136,413 | |
Occidental Petroleum Corp. | | | 1,971 | | | | 133,259 | |
| | | | | | | | 405,062 | |
|
| Integrated Telecommunication Services–0.80% | |
AT&T Inc.(d) | | | 3,925 | | | | 135,059 | |
CenturyLink Inc. | | | 5,226 | | | | 131,486 | |
Frontier Communications Corp. | | | 28,493 | | | | 133,063 | |
Verizon Communications Inc. | | | 2,904 | | | | 134,223 | |
| | | | | | | | 533,831 | |
|
| Internet Retail–0.99% | |
Amazon.com, Inc.(b) | | | 203 | | | | 137,205 | |
Expedia, Inc. | | | 1,056 | | | | 131,261 | |
Netflix Inc.(b) | | | 1,094 | | | | 125,132 | |
Priceline Group Inc. (The)(b) | | | 101 | | | | 128,770 | |
TripAdvisor Inc.(b) | | | 1,577 | | | | 134,439 | |
| | | | | | | | 656,807 | |
|
| Internet Software & Services–1.18% | |
Akamai Technologies, Inc.(b) | | | 2,512 | | | | 132,207 | |
Alphabet Inc.–Class A(b) | | | 86 | | | | 66,909 | |
Alphabet Inc.–Class C(b) | | | 88 | | | | 66,781 | |
eBay Inc.(b) | | | 4,655 | | | | 127,919 | |
Facebook Inc.–Class A(b) | | | 1,274 | | | | 133,337 | |
VeriSign, Inc.(b) | | | 1,461 | | | | 127,633 | |
Yahoo! Inc.(b) | | | 3,956 | | | | 131,577 | |
| | | | | | | | 786,363 | |
|
| Investment Banking & Brokerage–0.80% | |
Charles Schwab Corp. (The) | | | 4,098 | | | | 134,947 | |
E*TRADE Financial Corp.(b) | | | 4,509 | | | | 133,647 | |
Goldman Sachs Group, Inc. (The) | | | 737 | | | | 132,829 | |
Morgan Stanley | | | 4,058 | | | | 129,085 | |
| | | | | | | | 530,508 | |
|
| IT Consulting & Other Services–0.99% | |
Accenture PLC–Class A | | | 1,235 | | | | 129,057 | |
Cognizant Technology Solutions Corp.–
Class A(b) | | | 2,233 | | | | 134,025 | |
| | | | | | | | |
| | | Shares | | | Value | |
| IT Consulting & Other Services–(continued) | |
CSRA Inc. | | | 4,502 | | | $ | 135,060 | |
International Business Machines Corp. | | | 967 | | | | 133,078 | |
Teradata Corp.(b) | | | 4,809 | | | | 127,054 | |
| | | | | | | | 658,274 | |
|
| Leisure Products–0.39% | |
Hasbro, Inc. | | | 1,904 | | | | 128,253 | |
Mattel, Inc. | | | 4,959 | | | | 134,736 | |
| | | | | | | | 262,989 | |
|
| Life & Health Insurance–1.36% | |
Aflac, Inc. | | | 2,180 | | | | 130,582 | |
Lincoln National Corp. | | | 2,571 | | | | 129,219 | |
MetLife, Inc. | | | 2,762 | | | | 133,156 | |
Principal Financial Group, Inc. | | | 2,878 | | | | 129,452 | |
Prudential Financial, Inc. | | | 1,612 | | | | 131,233 | |
Torchmark Corp. | | | 2,226 | | | | 127,238 | |
Unum Group | | | 3,835 | | | | 127,667 | |
| | | | | | | | 908,547 | |
|
| Life Sciences Tools & Services–1.03% | |
Agilent Technologies, Inc. | | | 3,239 | | | | 135,422 | |
Illumina, Inc.(b) | | | 744 | | | | 142,807 | |
PerkinElmer, Inc. | | | 2,589 | | | | 138,693 | |
Thermo Fisher Scientific, Inc. | | | 969 | | | | 137,453 | |
Waters Corp.(b) | | | 1,005 | | | | 135,253 | |
| | | | | | | | 689,628 | |
|
| Managed Health Care–1.01% | |
Aetna Inc. | | | 1,240 | | | | 134,069 | |
Anthem, Inc. | | | 958 | | | | 133,583 | |
Cigna Corp. | | | 933 | | | | 136,526 | |
Humana Inc. | | | 753 | | | | 134,418 | |
UnitedHealth Group Inc. | | | 1,122 | | | | 131,992 | |
| | | | | | | | 670,588 | |
|
| Metal & Glass Containers–0.39% | |
Ball Corp. | | | 1,825 | | | | 132,732 | |
Owens-Illinois, Inc.(b) | | | 7,436 | | | | 129,535 | |
| | | | | | | | 262,267 | |
|
| Motorcycle Manufacturers–0.19% | |
Harley-Davidson, Inc. | | | 2,853 | | | | 129,498 | |
|
| Movies & Entertainment–0.77% | |
Time Warner Inc. | | | 1,988 | | | | 128,564 | |
Twenty-First Century Fox, Inc.–Class A | | | 3,480 | | | | 94,517 | |
Twenty-First Century Fox, Inc.–Class B | | | 1,228 | | | | 33,438 | |
Viacom Inc.–Class B | | | 3,130 | | | | 128,831 | |
Walt Disney Co. (The) | | | 1,204 | | | | 126,516 | |
| | | | | | | | 511,866 | |
|
| Multi-Line Insurance–0.79% | |
American International Group, Inc. | | | 2,189 | | | | 135,652 | |
Assurant, Inc. | | | 1,581 | | | | 127,334 | |
See accompanying Notes to Financial Statements which are an integral part of the financial statements.
Invesco V.I. Equally-Weighted S&P 500 Fund
| | | | | | | | |
| | | Shares | | | Value | |
| Multi-Line Insurance–(continued) | |
Hartford Financial Services Group, Inc. (The) | | | 2,967 | | | $ | 128,946 | |
Loews Corp. | | | 3,525 | | | | 135,360 | |
| | | | | | | | 527,292 | |
|
| Multi-Sector Holdings–0.40% | |
Berkshire Hathaway Inc.–Class B(b) | | | 998 | | | | 131,776 | |
Leucadia National Corp. | | | 7,829 | | | | 136,146 | |
| | | | | | | | 267,922 | |
|
| Multi-Utilities–2.65% | |
Ameren Corp. | | | 3,120 | | | | 134,878 | |
CenterPoint Energy, Inc. | | | 7,801 | | | | 143,226 | |
CMS Energy Corp. | | | 3,735 | | | | 134,759 | |
Consolidated Edison, Inc. | | | 2,141 | | | | 137,602 | |
Dominion Resources, Inc. | | | 2,006 | | | | 135,686 | |
DTE Energy Co. | | | 1,661 | | | | 133,196 | |
NiSource Inc. | | | 6,977 | | | | 136,121 | |
PG&E Corp. | | | 2,517 | | | | 133,879 | |
Public Service Enterprise Group Inc. | | | 3,516 | | | | 136,034 | |
SCANA Corp. | | | 2,266 | | | | 137,070 | |
Sempra Energy | | | 1,425 | | | | 133,964 | |
TECO Energy, Inc. | | | 4,885 | | | | 130,185 | |
WEC Energy Group, Inc. | | | 2,680 | | | | 137,511 | |
| | | | | | | | 1,764,111 | |
|
| Office REIT’s–0.60% | |
Boston Properties, Inc. | | | 1,055 | | | | 134,555 | |
SL Green Realty Corp. | | | 1,163 | | | | 131,396 | |
Vornado Realty Trust | | | 1,347 | | | | 134,646 | |
| | | | | | | | 400,597 | |
|
| Office Services & Supplies–0.21% | |
Pitney Bowes Inc. | | | 6,646 | | | | 137,240 | |
|
| Oil & Gas Drilling–0.80% | |
Diamond Offshore Drilling, Inc. | | | 6,461 | | | | 136,327 | |
Ensco PLC–Class A | | | 8,703 | | | | 133,939 | |
Helmerich & Payne, Inc. | | | 2,534 | | | | 135,696 | |
Transocean Ltd. | | | 10,260 | | | | 127,019 | |
| | | | | | | | 532,981 | |
|
| Oil & Gas Equipment & Services–1.15% | |
Baker Hughes Inc. | | | 2,723 | | | | 125,666 | |
Cameron International Corp.(b) | | | 2,064 | | | | 130,445 | |
FMC Technologies, Inc.(b) | | | 4,502 | | | | 130,603 | |
Halliburton Co. | | | 3,522 | | | | 119,889 | |
National Oilwell Varco Inc. | | | 3,911 | | | | 130,979 | |
Schlumberger Ltd. | | | 1,870 | | | | 130,433 | |
| | | | | | | | 768,015 | |
|
| Oil & Gas Exploration & Production–3.31% | |
Anadarko Petroleum Corp. | | | 2,627 | | | | 127,620 | |
Apache Corp. | | | 3,033 | | | | 134,877 | |
Cabot Oil & Gas Corp. | | | 8,087 | | | | 143,059 | |
Chesapeake Energy Corp. | | | 31,300 | | | | 140,850 | |
| | | | | | | | |
| | | Shares | | | Value | |
| Oil & Gas Exploration & Production–(continued) | |
Cimarex Energy Co. | | | 1,283 | | | $ | 114,675 | |
ConocoPhillips | | | 2,704 | | | | 126,250 | |
Devon Energy Corp. | | | 3,881 | | | | 124,192 | |
EOG Resources, Inc. | | | 1,737 | | | | 122,962 | |
EQT Corp. | | | 2,592 | | | | 135,121 | |
Hess Corp. | | | 2,586 | | | | 125,369 | |
Marathon Oil Corp. | | | 9,080 | | | | 114,317 | |
Murphy Oil Corp. | | | 5,766 | | | | 129,447 | |
Newfield Exploration Co.(b) | | | 3,692 | | | | 120,211 | |
Noble Energy, Inc. | | | 3,990 | | | | 131,391 | |
Pioneer Natural Resources Co. | | | 929 | | | | 116,478 | |
Range Resources Corp. | | | 5,723 | | | | 140,843 | |
Southwestern Energy Co.(b) | | | 22,069 | | | | 156,911 | |
| | | | | | | | 2,204,573 | |
|
| Oil & Gas Refining & Marketing–0.81% | |
Marathon Petroleum Corp. | | | 2,623 | | | | 135,976 | |
Phillips 66 | | | 1,572 | | | | 128,590 | |
Tesoro Corp. | | | 1,293 | | | | 136,243 | |
Valero Energy Corp. | | | 1,928 | | | | 136,329 | |
| | | | | | | | 537,138 | |
|
| Oil & Gas Storage & Transportation–1.02% | |
Columbia Pipeline Group, Inc. | | | 6,943 | | | | 138,860 | |
Kinder Morgan Inc. | | | 7,815 | | | | 116,600 | |
ONEOK, Inc. | | | 6,410 | | | | 158,070 | |
Spectra Energy Corp. | | | 5,733 | | | | 137,248 | |
Williams Cos., Inc. (The) | | | 4,927 | | | | 126,624 | |
| | | | | | | | 677,402 | |
|
| Packaged Foods & Meats–2.60% | |
Campbell Soup Co. | | | 2,456 | | | | 129,063 | |
ConAgra Foods, Inc. | | | 3,311 | | | | 139,592 | |
General Mills, Inc. | | | 2,240 | | | | 129,158 | |
Hershey Co. (The) | | | 1,488 | | | | 132,834 | |
Hormel Foods Corp. | | | 1,680 | | | | 132,854 | |
JM Smucker Co. (The) | | | 1,079 | | | | 133,084 | |
Kellogg Co. | | | 1,847 | | | | 133,483 | |
Keurig Green Mountain Inc. | | | 1,462 | | | | 131,551 | |
Kraft Heinz Co. (The) | | | 1,869 | | | | 135,988 | |
McCormick & Co., Inc. | | | 1,552 | | | | 132,789 | |
Mead Johnson Nutrition Co. | | | 1,679 | | | | 132,557 | |
Mondelez International, Inc.–Class A | | | 3,056 | | | | 137,031 | |
Tyson Foods, Inc.–Class A | | | 2,478 | | | | 132,152 | |
| | | | | | | | 1,732,136 | |
|
| Paper Packaging–0.59% | |
Avery Dennison Corp. | | | 2,068 | | | | 129,581 | |
Sealed Air Corp. | | | 3,040 | | | | 135,584 | |
WestRock Co. | | | 2,844 | | | | 129,743 | |
| | | | | | | | 394,908 | |
|
| Paper Products–0.19% | |
International Paper Co. | | | 3,414 | | | | 128,708 | |
See accompanying Notes to Financial Statements which are an integral part of the financial statements.
Invesco V.I. Equally-Weighted S&P 500 Fund
| | | | | | | | |
| | | Shares | | | Value | |
| Personal Products–0.20% | |
Estee Lauder Cos. Inc. (The)–Class A | | | 1,540 | | | $ | 135,612 | |
|
| Pharmaceuticals–2.21% | |
Allergan PLC(b) | | | 430 | | | | 134,375 | |
Bristol-Myers Squibb Co. | | | 1,925 | | | | 132,421 | |
Eli Lilly and Co. | | | 1,562 | | | | 131,614 | |
Endo International PLC(b) | | | 2,279 | | | | 139,520 | |
Johnson & Johnson | | | 1,279 | | | | 131,379 | |
Mallinckrodt PLC(b) | | | 1,877 | | | | 140,081 | |
Merck & Co., Inc. | | | 2,504 | | | | 132,261 | |
Mylan N.V.(b) | | | 2,477 | | | | 133,931 | |
Perrigo Co. PLC | | | 884 | | | | 127,915 | |
Pfizer Inc. | | | 4,061 | | | | 131,089 | |
Zoetis Inc. | | | 2,840 | | | | 136,093 | |
| | | | | | | | 1,470,679 | |
|
| Property & Casualty Insurance–1.41% | |
ACE Ltd. | | | 1,150 | | | | 134,377 | |
Allstate Corp. (The) | | | 2,118 | | | | 131,507 | |
Chubb Corp. (The) | | | 1,003 | | | | 133,038 | |
Cincinnati Financial Corp. | | | 2,201 | | | | 130,233 | |
Progressive Corp. (The) | | | 4,315 | | | | 137,217 | |
Travelers Cos., Inc. (The) | | | 1,185 | | | | 133,739 | |
XL Group PLC | | | 3,478 | | | | 136,268 | |
| | | | | | | | 936,379 | |
|
| Publishing–0.20% | |
News Corp.–Class A | | | 7,576 | | | | 101,216 | |
News Corp.–Class B | | | 2,143 | | | | 29,916 | |
| | | | | | | | 131,132 | |
|
| Railroads–0.77% | |
CSX Corp. | | | 5,061 | | | | 131,333 | |
Kansas City Southern | | | 1,743 | | | | 130,150 | |
Norfolk Southern Corp. | | | 1,455 | | | | 123,078 | |
Union Pacific Corp. | | | 1,684 | | | | 131,689 | |
| | | | | | | | 516,250 | |
|
| Real Estate Services–0.20% | |
CBRE Group, Inc.–Class A(b) | | | 3,766 | | | | 130,228 | |
|
| Regional Banks–1.99% | |
BB&T Corp. | | | 3,537 | | | | 133,734 | |
Fifth Third Bancorp | | | 6,599 | | | | 132,640 | |
Huntington Bancshares Inc. | | | 12,068 | | | | 133,472 | |
KeyCorp | | | 10,220 | | | | 134,802 | |
M&T Bank Corp. | | | 1,077 | | | | 130,511 | |
People’s United Financial Inc. | | | 8,142 | | | | 131,493 | |
PNC Financial Services Group, Inc. (The) | | | 1,408 | | | | 134,196 | |
Regions Financial Corp. | | | 13,896 | | | | 133,402 | |
SunTrust Banks, Inc. | | | 3,115 | | | | 133,447 | |
Zions Bancorp. | | | 4,758 | | | | 129,893 | |
| | | | | | | | 1,327,590 | |
| | | | | | | | |
| | | Shares | | | Value | |
| Research & Consulting Services–0.80% | |
Dun & Bradstreet Corp. (The) | | | 1,262 | | | $ | 131,160 | |
Equifax Inc. | | | 1,207 | | | | 134,423 | |
Nielsen Holdings PLC | | | 2,863 | | | | 133,416 | |
Verisk Analytics, Inc.(b) | | | 1,734 | | | | 133,310 | |
| | | | | | | | 532,309 | |
|
| Residential REIT’s–0.82% | |
Apartment Investment & Management Co.–Class A | | | 3,460 | | | | 138,504 | |
AvalonBay Communities, Inc. | | | 744 | | | | 136,992 | |
Equity Residential | | | 1,678 | | | | 136,908 | |
Essex Property Trust, Inc. | | | 563 | | | | 134,788 | |
| | | | | | | | 547,192 | |
|
| Restaurants–0.98% | |
Chipotle Mexican Grill, Inc.(b) | | | 230 | | | | 110,366 | |
Darden Restaurants, Inc. | | | 2,253 | | | | 143,381 | |
McDonald’s Corp. | | | 1,121 | | | | 132,435 | |
Starbucks Corp. | | | 2,176 | | | | 130,625 | |
Yum! Brands, Inc. | | | 1,826 | | | | 133,389 | |
| | | | | | | | 650,196 | |
|
| Retail REIT’s–1.03% | |
General Growth Properties, Inc. | | | 5,020 | | | | 136,594 | |
Kimco Realty Corp. | | | 5,180 | | | | 137,063 | |
Macerich Co. (The) | | | 1,687 | | | | 136,124 | |
Realty Income Corp. | | | 2,676 | | | | 138,162 | |
Simon Property Group, Inc. | | | 704 | | | | 136,886 | |
| | | | | | | | 684,829 | |
|
| Security & Alarm Services–0.39% | |
ADT Corp. (The)(d) | | | 3,950 | | | | 130,271 | |
Tyco International PLC | | | 4,011 | | | | 127,911 | |
| | | | | | | | 258,182 | |
|
| Semiconductor Equipment–0.60% | |
Applied Materials, Inc. | | | 7,107 | | | | 132,688 | |
KLA-Tencor Corp. | | | 1,918 | | | | 133,013 | |
Lam Research Corp. | | | 1,649 | | | | 130,964 | |
| | | | | | | | 396,665 | |
|
| Semiconductors–2.55% | |
Analog Devices, Inc. | | | 2,286 | | | | 126,462 | |
Avago Technologies Ltd. (Singapore) | | | 901 | | | | 130,780 | |
Broadcom Corp.–Class A | | | 2,270 | | | | 131,251 | |
First Solar, Inc.(b) | | | 2,356 | | | | 155,472 | |
Intel Corp. | | | 3,799 | | | | 130,876 | |
Linear Technology Corp. | | | 3,005 | | | | 127,622 | |
Microchip Technology Inc. | | | 2,916 | | | | 135,711 | |
Micron Technology, Inc.(b) | | | 9,274 | | | | 131,320 | |
NVIDIA Corp. | | | 4,007 | | | | 132,071 | |
Qorvo, Inc.(b) | | | 2,317 | | | | 117,935 | |
Skyworks Solutions, Inc. | | | 1,598 | | | | 122,774 | |
Texas Instruments Inc. | | | 2,316 | | | | 126,940 | |
See accompanying Notes to Financial Statements which are an integral part of the financial statements.
Invesco V.I. Equally-Weighted S&P 500 Fund
| | | | | | | | |
| | | Shares | | | Value | |
| Semiconductors–(continued) | |
Xilinx, Inc. | | | 2,749 | | | $ | 129,121 | |
| | | | | | | | 1,698,335 | |
|
| Soft Drinks–0.99% | |
Coca-Cola Co. (The) | | | 3,079 | | | | 132,274 | |
Coca-Cola Enterprises, Inc. | | | 2,660 | | | | 130,978 | |
Dr Pepper Snapple Group, Inc. | | | 1,438 | | | | 134,022 | |
Monster Beverage Corp.(b) | | | 869 | | | | 129,446 | |
PepsiCo, Inc. | | | 1,330 | | | | 132,894 | |
| | | | | | | | 659,614 | |
|
| Specialized Consumer Services–0.20% | |
H&R Block, Inc. | | | 4,037 | | | | 134,472 | |
|
| Specialized Finance–1.02% | |
CME Group Inc.–Class A | | | 1,412 | | | | 127,927 | |
Intercontinental Exchange, Inc. | | | 533 | | | | 136,587 | |
McGraw Hill Financial, Inc. | | | 1,404 | | | | 138,406 | |
Moody’s Corp. | | | 1,359 | | | | 136,362 | |
Nasdaq, Inc. | | | 2,373 | | | | 138,038 | |
| | | | | | | | 677,320 | |
|
| Specialized REIT’s–1.39% | |
American Tower Corp. | | | 1,389 | | | | 134,663 | |
Crown Castle International Corp. | | | 1,534 | | | | 132,614 | |
Equinix, Inc. | | | 450 | | | | 136,080 | |
Iron Mountain Inc. | | | 4,867 | | | | 131,458 | |
Plum Creek Timber Co., Inc. | | | 2,721 | | | | 129,846 | |
Public Storage | | | 537 | | | | 133,015 | |
Weyerhaeuser Co. | | | 4,271 | | | | 128,045 | |
| | | | | | | | 925,721 | |
|
| Specialty Chemicals–0.79% | |
Ecolab Inc. | | | 1,157 | | | | 132,338 | |
International Flavors & Fragrances Inc. | | | 1,116 | | | | 133,518 | |
PPG Industries, Inc. | | | 1,318 | | | | 130,245 | |
Sherwin-Williams Co. (The) | | | 496 | | | | 128,761 | |
| | | | | | | | 524,862 | |
|
| Specialty Stores–0.79% | |
Signet Jewelers Ltd. | | | 1,108 | | | | 137,049 | |
Staples, Inc. | | | 13,706 | | | | 129,796 | |
Tiffany & Co. | | | 1,730 | | | | 131,982 | |
Tractor Supply Co. | | | 1,483 | | | | 126,796 | |
| | | | | | | | 525,623 | |
|
| Steel–0.20% | |
Nucor Corp. | | | 3,255 | | | | 131,177 | |
| | | | | | | | |
| | | Shares | | | Value | |
| Systems Software–1.01% | |
CA, Inc. | | | 4,807 | | | $ | 137,288 | |
Microsoft Corp. | | | 2,408 | | | | 133,596 | |
Oracle Corp. | | | 3,498 | | | | 127,782 | |
Red Hat, Inc.(b) | | | 1,656 | | | | 137,133 | |
Symantec Corp. | | | 6,629 | | | | 139,209 | |
| | | | | | | | 675,008 | |
|
| Technology Hardware, Storage & Peripherals–1.54% | |
Apple Inc. | | | 1,149 | | | | 120,944 | |
EMC Corp. | | | 5,024 | | | | 129,016 | |
Hewlett Packard Enterprise Co. | | | 9,182 | | | | 139,566 | |
HP Inc. | | | 10,664 | | | | 126,262 | |
NetApp, Inc. | | | 4,480 | | | | 118,854 | |
SanDisk Corp. | | | 1,739 | | | | 132,147 | |
Seagate Technology PLC | | | 3,619 | | | | 132,673 | |
Western Digital Corp. | | | 2,097 | | | | 125,925 | |
| | | | | | | | 1,025,387 | |
|
| Tires & Rubber–0.20% | |
Goodyear Tire & Rubber Co. (The) | | | 4,048 | | | | 132,248 | |
|
| Tobacco–0.60% | |
Altria Group, Inc. | | | 2,306 | | | | 134,232 | |
Philip Morris International Inc. | | | 1,507 | | | | 132,481 | |
Reynolds American Inc. | | | 2,921 | | | | 134,804 | |
| | | | | | | | 401,517 | |
|
| Trading Companies & Distributors–0.62% | |
Fastenal Co. | | | 3,298 | | | | 134,624 | |
United Rentals, Inc.(b) | | | 1,927 | | | | 139,785 | |
W.W. Grainger, Inc. | | | 681 | | | | 137,964 | |
| | | | | | | | 412,373 | |
|
| Trucking–0.39% | |
J.B. Hunt Transport Services, Inc. | | | 1,779 | | | | 130,507 | |
Ryder System, Inc. | | | 2,315 | | | | 131,562 | |
| | | | | | | | 262,069 | |
Total Common Stocks & Other Equity Interests
(Cost $31,623,492) | | | | 66,148,584 | |
| | |
Money Market Funds–1.02% | | | | | | | | |
Liquid Assets Portfolio–Institutional
Class, 0.29%(e) | | | 340,103 | | | | 340,103 | |
Premier Portfolio–Institutional Class, 0.24%(e) | | | 340,104 | | | | 340,104 | |
Total Money Market Funds
(Cost $680,207) | | | | 680,207 | |
TOTAL INVESTMENTS–100.32%
(Cost $32,303,699) | | | | 66,828,791 | |
OTHER ASSETS LESS LIABILITIES–(0.32)% | | | | (212,280 | ) |
NET ASSETS–100.00% | | | $ | 66,616,511 | |
Investment Abbreviations:
| | |
| REIT | | – Real Estate Investment Trust |
Notes to Schedule of Investments:
| (a) | Industry and/or sector classifications used in this report are generally according to the Global Industry Classification Standard, which was developed by and is the exclusive property and a service mark of MSCI Inc. and Standard & Poor’s. |
| (b) | Non–income producing security. |
| (c) | The Fund’s Adviser is a subsidiary of Invesco Ltd. and therefore, Invesco Ltd. is considered to be affiliated with the Fund. See Note 4. |
| (d) | All or a portion of the value was pledged as collateral to cover margin requirements for open futures contracts. See Note 1I and Note 5. |
| (e) | The money market fund and the Fund are affiliated by having the same investment adviser. The rate shown is the 7–day SEC standardized yield as of December 31, 2015. |
See accompanying Notes to Financial Statements which are an integral part of the financial statements.
Invesco V.I. Equally-Weighted S&P 500 Fund
Statement of Assets and Liabilities
December 31, 2015
Statement of Operations
For the year ended December 31, 2015
| | | | |
Assets: | |
Investments, at value (Cost $31,547,932) | | $ | 66,009,876 | |
Investments in affiliates, at value (Cost $755,767) | | | 818,915 | |
Total investments, at value (Cost $32,303,699) | | | 66,828,791 | |
Cash | | | 134,636 | |
Receivable for: | | | | |
Dividends | | | 94,175 | |
Investment for trustee deferred compensation and retirement plans | | | 27,031 | |
Total assets | | | 67,084,633 | |
| |
Liabilities: | | | | |
Payable for: | | | | |
Fund shares reacquired | | | 342,477 | |
Variation margin — futures contracts | | | 7,680 | |
Accrued fees to affiliates | | | 60,442 | |
Accrued trustees’ and officers’ fees and benefits | | | 134 | |
Accrued other operating expenses | | | 28,570 | |
Trustee deferred compensation and retirement plans | | | 28,819 | |
Total liabilities | | | 468,122 | |
Net assets applicable to shares outstanding | | $ | 66,616,511 | |
| |
Net assets consist of: | | | | |
Shares of beneficial interest | | $ | 26,288,674 | |
Undistributed net investment income | | | 806,600 | |
Undistributed net realized gain | | | 4,996,739 | |
Net unrealized appreciation | | | 34,524,498 | |
| | | $ | 66,616,511 | |
|
Net Assets: | |
Series I | | $ | 27,973,835 | |
Series II | | $ | 38,642,676 | |
|
Shares outstanding, $0.001 par value per share,
with an unlimited number of shares authorized: | |
Series I | | | 1,769,367 | |
Series II | | | 2,502,937 | |
Series I: | | | | |
Net asset value per share | | $ | 15.81 | |
Series II: | | | | |
Net asset value per share | | $ | 15.44 | |
| | | | |
Investment income: | |
Dividends (net of foreign withholding taxes of $98) | | $ | 1,361,704 | |
Dividends from affiliates | | | 4,725 | |
Total investment income | | | 1,366,429 | |
| |
Expenses: | | | | |
Advisory fees | | | 84,802 | |
Administrative services fees | | | 191,164 | |
Custodian fees | | | 18,601 | |
Distribution fees — Series II | | | 98,592 | |
Transfer agent fees | | | 3,491 | |
Trustees’ and officers’ fees and benefits | | | 19,424 | |
Professional services fees | | | 37,424 | |
Other | | | 32,748 | |
Total expenses | | | 486,246 | |
Less: Fees waived | | | (1,324 | ) |
Net expenses | | | 484,922 | |
Net investment income | | | 881,507 | |
| |
Realized and unrealized gain (loss) from: | | | | |
Net realized gain from: | | | | |
Investment securities | | | 6,018,044 | |
Futures contracts | | | 28,567 | |
| | | | 6,046,611 | |
Change in net unrealized appreciation (depreciation) of: | | | | |
Investment securities | | | (8,891,018 | ) |
Futures contracts | | | 11,687 | |
| | | | (8,879,331 | ) |
Net realized and unrealized gain (loss) | | | (2,832,720 | ) |
Net increase (decrease) in net assets resulting from operations | | $ | (1,951,213 | ) |
See accompanying Notes to Financial Statements which are an integral part of the financial statements.
Invesco V.I. Equally-Weighted S&P 500 Fund
Statement of Changes in Net Assets
For the years ended December 31, 2015 and 2014
| | | | | | | | |
| | | 2015 | | | 2014 | |
Operations: | | | | | |
Net investment income | | $ | 881,507 | | | $ | 885,227 | |
Net realized gain | | | 6,046,611 | | | | 11,761,906 | |
Change in net unrealized appreciation (depreciation) | | | (8,879,331 | ) | | | (3,351,115 | ) |
Net increase (decrease) in net assets resulting from operations | | | (1,951,213 | ) | | | 9,296,018 | |
| | |
Distributions to shareholders from net investment income: | | | | | | | | |
Series I | | | (415,027 | ) | | | (495,550 | ) |
Series ll | | | (486,441 | ) | | | (445,613 | ) |
Total distributions from net investment income | | | (901,468 | ) | | | (941,163 | ) |
| | |
Distributions to shareholders from net realized gains: | | | | | | | | |
Series l | | | (4,799,257 | ) | | | (5,378,347 | ) |
Series ll | | | (6,706,618 | ) | | | (5,883,707 | ) |
Total distributions from net realized gains | | | (11,505,875 | ) | | | (11,262,054 | ) |
| | |
Share transactions–net: | | | | | | | | |
Series l | | | 44,787 | | | | (2,983,654 | ) |
Series ll | | | 9,847,549 | | | | (29,503 | ) |
Net increase (decrease) in net assets resulting from share transactions | | | 9,892,336 | | | | (3,013,157 | ) |
Net increase (decrease) in net assets | | | (4,466,220 | ) | | | (5,920,356 | ) |
| | |
Net assets: | | | | | | | | |
Beginning of year | | | 71,082,731 | | | | 77,003,087 | |
End of year (includes undistributed net investment income of $806,600 and $826,603, respectively) | | $ | 66,616,511 | | | $ | 71,082,731 | |
Notes to Financial Statements
December 31, 2015
NOTE 1—Significant Accounting Policies
Invesco V.I. Equally-Weighted S&P 500 Fund (the “Fund”) is a series portfolio of AIM Variable Insurance Funds (Invesco Variable Insurance Funds) (the “Trust”). The Trust is a Delaware statutory trust registered under the Investment Company Act of 1940, as amended (the “1940 Act”), as an open-end series management investment company consisting of twenty-four separate portfolios, (each constituting a “Fund”). The assets, liabilities and operations of each portfolio are accounted for separately. Information presented in these financial statements pertains only to the Fund. Matters affecting each Fund or class will be voted on exclusively by the shareholders of such Fund or class. Current Securities and Exchange Commission (“SEC”) guidance, however, requires participating insurance companies offering separate accounts to vote shares proportionally in accordance with the instructions of the contract owners whose investments are funded by shares of each Fund or class.
The Fund’s investment objective is to achieve a high level of total return on its assets through a combination of capital appreciation and current income.
The Fund currently offers two classes of shares, Series I and Series II, both of which are offered to insurance company separate accounts funding variable annuity contracts and variable life insurance policies (“variable products”).
The following is a summary of the significant accounting policies followed by the Fund in the preparation of its financial statements.
| A. | Security Valuations — Securities, including restricted securities, are valued according to the following policy. |
A security listed or traded on an exchange (except convertible securities) is valued at its last sales price or official closing price as of the close of the customary trading session on the exchange where the security is principally traded, or lacking any sales or official closing price on a particular day, the security may be valued at the closing bid price on that day. Securities traded in the over-the-counter market are valued based on prices furnished by independent pricing services or market makers. When such securities are valued by an independent pricing service they may be considered fair valued. Futures contracts are valued at the final settlement price set by an exchange on which they are principally traded. Listed options are valued at the mean between the last bid and asked prices from the exchange on which they are principally traded. Options not listed on an exchange are valued by an independent source at the mean between the last bid and asked prices. For purposes of determining net asset value (“NAV”) per share, futures and option contracts generally are valued 15 minutes after the close of the customary trading session of the New York Stock Exchange (“NYSE”).
Investments in open-end and closed-end registered investment companies that do not trade on an exchange are valued at the end-of-day net asset value per share. Investments in open-end and closed-end registered investment companies that trade on an exchange are valued at the last sales price or official closing price as of the close of the customary trading session on the exchange where the security is principally traded.
Invesco V.I. Equally-Weighted S&P 500 Fund
Debt obligations (including convertible securities) and unlisted equities are fair valued using an evaluated quote provided by an independent pricing service. Evaluated quotes provided by the pricing service may be determined without exclusive reliance on quoted prices, and may reflect appropriate factors such as institution-size trading in similar groups of securities, developments related to specific securities, dividend rate (for unlisted equities), yield (for debt obligations), quality, type of issue, coupon rate (for debt obligations), maturity (for debt obligations), individual trading characteristics and other market data. Debt obligations are subject to interest rate and credit risks. In addition, all debt obligations involve some risk of default with respect to interest and/or principal payments.
Foreign securities’ (including foreign exchange contracts) prices are converted into U.S. dollar amounts using the applicable exchange rates as of the close of the NYSE. If market quotations are available and reliable for foreign exchange-traded equity securities, the securities will be valued at the market quotations. Because trading hours for certain foreign securities end before the close of the NYSE, closing market quotations may become unreliable. If between the time trading ends on a particular security and the close of the customary trading session on the NYSE, events occur that the Adviser determines are significant and make the closing price unreliable, the Fund may fair value the security. If the event is likely to have affected the closing price of the security, the security will be valued at fair value in good faith using procedures approved by the Board of Trustees. Adjustments to closing prices to reflect fair value may also be based on a screening process of an independent pricing service to indicate the degree of certainty, based on historical data, that the closing price in the principal market where a foreign security trades is not the current value as of the close of the NYSE. Foreign securities’ prices meeting the approved degree of certainty that the price is not reflective of current value will be priced at the indication of fair value from the independent pricing service. Multiple factors may be considered by the independent pricing service in determining adjustments to reflect fair value and may include information relating to sector indices, American Depositary Receipts and domestic and foreign index futures. Foreign securities may have additional risks including exchange rate changes, potential for sharply devalued currencies and high inflation, political and economic upheaval, the relative lack of issuer information, relatively low market liquidity and the potential lack of strict financial and accounting controls and standards.
Securities for which market prices are not provided by any of the above methods may be valued based upon quotes furnished by independent sources. The last bid price may be used to value equity securities. The mean between the last bid and asked prices is used to value debt obligations, including corporate loans.
Securities for which market quotations are not readily available or became unreliable are valued at fair value as determined in good faith by or under the supervision of the Trust’s officers following procedures approved by the Board of Trustees. Issuer specific events, market trends, bid/asked quotes of brokers and information providers and other market data may be reviewed in the course of making a good faith determination of a security’s fair value.
The Fund may invest in securities that are subject to interest rate risk, meaning the risk that the prices will generally fall as interest rates rise and, conversely, the prices will generally rise as interest rates fall. Specific securities differ in their sensitivity to changes in interest rates depending on their individual characteristics. Changes in interest rates may result in increased market volatility, which may affect the value and/or liquidity of certain Fund investments.
Valuations change in response to many factors including the historical and prospective earnings of the issuer, the value of the issuer’s assets, general economic conditions, interest rates, investor perceptions and market liquidity. Because of the inherent uncertainties of valuation, the values reflected in the financial statements may materially differ from the value received upon actual sale of those investments.
| B. | Securities Transactions and Investment Income — Securities transactions are accounted for on a trade date basis. Realized gains or losses on sales are computed on the basis of specific identification of the securities sold. Interest income (net of withholding tax, if any) is recorded on the accrual basis from settlement date. Dividend income (net of withholding tax, if any) is recorded on the ex-dividend date. |
The Fund may periodically participate in litigation related to Fund investments. As such, the Fund may receive proceeds from litigation settlements. Any proceeds received are included in the Statement of Operations as realized gain (loss) for investments no longer held and as unrealized gain (loss) for investments still held.
Brokerage commissions and mark ups are considered transaction costs and are recorded as an increase to the cost basis of securities purchased and/or a reduction of proceeds on a sale of securities. Such transaction costs are included in the determination of net realized and unrealized gain (loss) from investment securities reported in the Statement of Operations and the Statement of Changes in Net Assets and the net realized and unrealized gains (losses) on securities per share in the Financial Highlights. Transaction costs are included in the calculation of the Fund’s net asset value and, accordingly, they reduce the Fund’s total returns. These transaction costs are not considered operating expenses and are not reflected in net investment income reported in the Statement of Operations and the Statement of Changes in Net Assets, or the net investment income per share and the ratios of expenses and net investment income reported in the Financial Highlights, nor are they limited by any expense limitation arrangements between the Fund and the investment adviser.
The Fund allocates income and realized and unrealized capital gains and losses to a class based on the relative net assets of each class.
| C. | Country Determination — For the purposes of making investment selection decisions and presentation in the Schedule of Investments, the investment adviser may determine the country in which an issuer is located and/or credit risk exposure based on various factors. These factors include the laws of the country under which the issuer is organized, where the issuer maintains a principal office, the country in which the issuer derives 50% or more of its total revenues and the country that has the primary market for the issuer’s securities, as well as other criteria. Among the other criteria that may be evaluated for making this determination are the country in which the issuer maintains 50% or more of its assets, the type of security, financial guarantees and enhancements, the nature of the collateral and the sponsor organization. Country of issuer and/or credit risk exposure has been determined to be the United States of America, unless otherwise noted. |
| D. | Distributions — Distributions from net investment income and net realized capital gain, if any, are generally declared and paid to separate accounts of participating insurance companies annually and recorded on the ex-dividend date. |
| E. | Federal Income Taxes — The Fund intends to comply with the requirements of Subchapter M of the Internal Revenue Code of 1986, as amended (the “Internal Revenue Code”), necessary to qualify as a regulated investment company and to distribute substantially all of the Fund’s taxable earnings to shareholders. As such, the Fund will not be subject to federal income taxes on otherwise taxable income (including net realized capital gain) that is distributed to shareholders. Therefore, no provision for federal income taxes is recorded in the financial statements. |
The Fund recognizes the tax benefits of uncertain tax positions only when the position is more likely than not to be sustained. Management has analyzed the Fund’s uncertain tax positions and concluded that no liability for unrecognized tax benefits should be recorded related to uncertain
Invesco V.I. Equally-Weighted S&P 500 Fund
tax positions. Management is not aware of any tax positions for which it is reasonably possible that the total amounts of unrecognized tax benefits will change materially in the next 12 months.
The Fund files tax returns in the U.S. Federal jurisdiction and certain other jurisdictions. Generally, the Fund is subject to examinations by such taxing authorities for up to three years after the filing of the return for the tax period.
| F. | Expenses — Fees provided for under the Rule 12b-1 plan of a particular class of the Fund and which are directly attributable to that class are charged to the operations of such class. All other expenses are allocated among the classes based on relative net assets. |
| G. | Accounting Estimates — The preparation of financial statements in conformity with accounting principles generally accepted in the United States of America (“GAAP”) requires management to make estimates and assumptions that affect the reported amounts of assets and liabilities at the date of the financial statements and the reported amounts of revenues and expenses during the reporting period including estimates and assumptions related to taxation. Actual results could differ from those estimates by a significant amount. In addition, the Fund monitors for material events or transactions that may occur or become known after the period-end date and before the date the financial statements are released to print. |
| H. | Indemnifications — Under the Trust’s organizational documents, each Trustee, officer, employee or other agent of the Trust is indemnified against certain liabilities that may arise out of the performance of their duties to the Fund. Additionally, in the normal course of business, the Fund enters into contracts, including the Fund’s servicing agreements, that contain a variety of indemnification clauses. The Fund’s maximum exposure under these arrangements is unknown as this would involve future claims that may be made against the Fund that have not yet occurred. The risk of material loss as a result of such indemnification claims is considered remote. |
| I. | Futures Contracts — The Fund may enter into futures contracts to manage exposure to interest rate, equity and market price movements and/or currency risks. A futures contract is an agreement between two parties (“Counterparties”) to purchase or sell a specified underlying security, currency or commodity (or delivery of a cash settlement price, in the case of an index future) for a fixed price at a future date. The Fund currently invests only in exchange-traded futures and they are standardized as to maturity date and underlying financial instrument. Initial margin deposits required upon entering into futures contracts are satisfied by the segregation of specific securities or cash as collateral at the futures commission merchant (broker). During the period the futures contracts are open, changes in the value of the contracts are recognized as unrealized gains or losses by recalculating the value of the contracts on a daily basis. Subsequent or variation margin payments are received or made depending upon whether unrealized gains or losses are incurred. These amounts are reflected as receivables or payables on the Statement of Assets and Liabilities. When the contracts are closed or expire, the Fund recognizes a realized gain or loss equal to the difference between the proceeds from, or cost of, the closing transaction and the Fund’s basis in the contract. The net realized gain (loss) and the change in unrealized gain (loss) on futures contracts held during the period is included on the Statement of Operations. The primary risks associated with futures contracts are market risk and the absence of a liquid secondary market. If the Fund were unable to liquidate a futures contract and/or enter into an offsetting closing transaction, the Fund would continue to be subject to market risk with respect to the value of the contracts and continue to be required to maintain the margin deposits on the futures contracts. Futures contracts have minimal Counterparty risk since the exchange’s clearinghouse, as Counterparty to all exchange-traded futures, guarantees the futures against default. Risks may exceed amounts recognized in the Statement of Assets and Liabilities. |
| J. | Collateral — To the extent the Fund has designated or segregated a security as collateral and that security is subsequently sold, it is the Fund’s practice to replace such collateral no later than the next business day. |
NOTE 2—Advisory Fees and Other Fees Paid to Affiliates
The Trust has entered into a master investment advisory agreement with Invesco Advisers, Inc. (the “Adviser” or “Invesco”). Under the terms of the investment advisory agreement, the Fund pays an advisory fee to the Adviser based on the annual rate of the Fund’s average daily net assets as follows:
| | | | |
| Average Daily Net Assets | | Rate | |
First $2 billion | | | 0.12% | |
Over $2 billion | | | 0.10% | |
For the year ended December 31, 2015, the effective advisory fees incurred by the Fund was 0.12%.
Under the terms of a master sub-advisory agreement between the Adviser and each of Invesco Asset Management Deutschland GmbH, Invesco Asset Management Limited, Invesco Asset Management (Japan) Limited, Invesco Hong Kong Limited, Invesco Senior Secured Management, Inc. and Invesco Canada Ltd. (collectively, the “Affiliated Sub-Advisers”) the Adviser, not the Fund, may pay 40% of the fees paid to the Adviser to any such Affiliated Sub-Adviser(s) that provide(s) discretionary investment management services to the Fund based on the percentage of assets allocated to such Affiliated Sub-Adviser(s).
The Adviser has contractually agreed, through at least June 30, 2016, to waive advisory fees and/or reimburse expenses of all shares to the extent necessary to limit total annual fund operating expenses after fee waiver and/or expense reimbursement (excluding certain items discussed below) of Series I shares to 2.00% and Series II shares to 2.25% of average daily net assets. In determining the Adviser’s obligation to waive advisory fees and/or reimburse expenses, the following expenses are not taken into account, and could cause the total annual fund operating expenses after fee waiver and/or expense reimbursement to exceed the numbers reflected above: (1) interest; (2) taxes; (3) dividend expense on short sales; (4) extraordinary or non-routine items, including litigation expenses; and (5) expenses that the Fund has incurred but did not actually pay because of an expense offset arrangement. Unless Invesco continues the fee waiver agreement, it will terminate on June 30, 2016. The fee waiver agreement cannot be terminated during its term. The Adviser did not waive fees and/or reimburse expenses during the period under this expense limitation.
Further, the Adviser has contractually agreed, through at least June 30, 2017, to waive the advisory fee payable by the Fund in an amount equal to 100% of the net advisory fees the Adviser receives from the affiliated money market funds on investments by the Fund of uninvested cash in such affiliated money market funds.
For the year ended December 31, 2015, the Adviser waived advisory fees of $1,324.
Invesco V.I. Equally-Weighted S&P 500 Fund
The Trust has entered into a master administrative services agreement with Invesco pursuant to which the Fund has agreed to pay Invesco a fee for costs incurred in providing accounting services and fund administrative services to the Fund and to reimburse Invesco for administrative services fees paid to insurance companies that have agreed to provide services to the participants of separate accounts. These administrative services provided by the insurance companies may include, among other things: the printing of prospectuses, financial reports and proxy statements and the delivery of the same to existing participants; the maintenance of master accounts; the facilitation of purchases and redemptions requested by the participants; and the servicing of participants’ accounts. Pursuant to such agreement, for the year ended December 31, 2015, Invesco was paid $50,000 for accounting and fund administrative services and reimbursed $141,164 for services provided by insurance companies.
The Trust has entered into a transfer agency and service agreement with Invesco Investment Services, Inc. (“IIS”) pursuant to which the Fund has agreed to pay IIS a fee for providing transfer agency and shareholder services to the Fund and reimburse IIS for certain expenses incurred by IIS in the course of providing such services. For the year ended December 31, 2015, expenses incurred under the agreement are shown in the Statement of Operations as Transfer agent fees.
The Trust has entered into a master distribution agreement with Invesco Distributors, Inc. (“IDI”) to serve as the distributor for the Fund. The Trust has adopted a plan pursuant to Rule 12b-1 under the 1940 Act with respect to the Fund’s Series II shares (the “Plan”). The Fund, pursuant to the Plan, pays IDI compensation at the annual rate of 0.25% of the Fund’s average daily net assets of Series II shares. Of the Plan payments, up to 0.25% of the average daily net assets of the Series II shares may be paid to insurance companies who furnish continuing personal shareholder services to customers who purchase and own Series II shares of the Fund. For the year ended December 31, 2015, expenses incurred under the Plan are detailed in the Statement of Operations as Distribution fees.
Certain officers and trustees of the Trust are officers and directors of the Adviser, IIS and/or IDI.
NOTE 3—Additional Valuation Information
GAAP defines fair value as the price that would be received to sell an asset or paid to transfer a liability in an orderly transaction between market participants at the measurement date, under current market conditions. GAAP establishes a hierarchy that prioritizes the inputs to valuation methods, giving the highest priority to readily available unadjusted quoted prices in an active market for identical assets (Level 1) and the lowest priority to significant unobservable inputs (Level 3), generally when market prices are not readily available or are unreliable. Based on the valuation inputs, the securities or other investments are tiered into one of three levels. Changes in valuation methods may result in transfers in or out of an investment’s assigned level:
| | Level 1 — | Prices are determined using quoted prices in an active market for identical assets. |
| | Level 2 — | Prices are determined using other significant observable inputs. Observable inputs are inputs that other market participants may use in pricing a security. These may include quoted prices for similar securities, interest rates, prepayment speeds, credit risk, yield curves, loss severities, default rates, discount rates, volatilities and others. |
| | Level 3 — | Prices are determined using significant unobservable inputs. In situations where quoted prices or observable inputs are unavailable (for example, when there is little or no market activity for an investment at the end of the period), unobservable inputs may be used. Unobservable inputs reflect the Fund’s own assumptions about the factors market participants would use in determining fair value of the securities or instruments and would be based on the best available information. |
The following is a summary of the tiered valuation input levels, as of December 31, 2015. The level assigned to the securities valuations may not be an indication of the risk or liquidity associated with investing in those securities. Because of the inherent uncertainties of valuation, the values reflected in the financial statements may materially differ from the value received upon actual sale of those investments.
| | | | | | | | | | | | | | | | |
| | | Level 1 | | | Level 2 | | | Level 3 | | | Total | |
Equity Securities | | $ | 66,828,791 | | | $ | — | | | $ | — | | | $ | 66,828,791 | |
Futures Contracts* | | | (594 | ) | | | — | | | | — | | | | (594 | ) |
Total Investments | | $ | 66,828,197 | | | $ | — | | | $ | — | | | $ | 66,828,197 | |
| * | Unrealized appreciation (depreciation). |
NOTE 4—Investments in Affiliates
The Fund’s Adviser is a subsidiary of Invesco Ltd. and therefore, Invesco Ltd. is considered to be affiliated with the Fund. The following is a summary of the transactions in, and earnings from, investments in Invesco Ltd. for the year ended December 31, 2015.
| | | | | | | | | | | | | | | | | | | | | | | | | | | | |
| | | Value 12/31/14 | | | Purchases
at Cost | | | Proceeds
from Sales | | | Change in
Unrealized
Appreciation
(Depreciation) | | | Realized
Gain (Loss) | | | Value 12/31/15 | | | Dividend
Income | |
Invesco Ltd. | | $ | 138,004 | | | $ | 29,334 | | | $ | (7,698 | ) | | $ | (19,794 | ) | | $ | (1,138 | ) | | $ | 138,708 | | | $ | 3,901 | |
Invesco V.I. Equally-Weighted S&P 500 Fund
NOTE 5—Derivative Investments
Value of Derivative Investments at Period-End
The table below summarizes the value of the Fund’s derivative investments, detailed by primary risk exposure, held as of December 31, 2015:
| | | | | | | | |
| | | Value | |
| Risk Exposure/Derivative Type | | Assets | | | Liabilities | |
Equity risk: | | | | | | | | |
Futures contracts(a) | | $ | — | | | $ | (594 | ) |
| (a) | Includes cumulative appreciation (depreciation) of futures contracts. Only current day’s variation margin receivable (payable) is reported within the Statement of Assets and Liabilities. |
Effect of Derivative Investments for the year ended December 31, 2015
The table below summarizes the gains on derivative investments, detailed by primary risk exposure, recognized in earnings during the period:
| | | | |
| | | Location of Gain on
Statement of Operations | |
| | Futures Contracts | |
Realized Gain: | | | | |
Equity risk | | $ | 28,567 | |
Change in Net Unrealized Appreciation: | | | | |
Equity risk | | | 11,687 | |
Total | | $ | 40,254 | |
The table below summarizes the average notional value of futures contracts outstanding during the period.
| | | | |
| | | Futures Contracts | |
Average notional value | | $ | 848,868 | |
| | | | | | | | | | | | | | | | | | | | |
| Open Futures Contracts — Equity Risk | |
| Futures Contracts | | Type of
Contract | | | Number of
Contracts | | | Expiration
Month | | | Notional
Value | | | Unrealized
Appreciation
(Depreciation) | |
E-Mini S&P 500 Index | | | Long | | | | 8 | | | | March–2016 | | | $ | 814,160 | | | $ | (594 | ) |
NOTE 6—Trustees’ and Officers’ Fees and Benefits
Trustees’ and Officers’ Fees and Benefits include amounts accrued by the Fund to pay remuneration to certain Trustees and Officers of the Fund. Trustees have the option to defer compensation payable by the Fund, and Trustees’ and Officers’ Fees and Benefits also include amounts accrued by the Fund to fund such deferred compensation amounts. Those Trustees who defer compensation have the option to select various Invesco Funds in which their deferral accounts shall be deemed to be invested. Finally, certain current Trustees were eligible to participate in a retirement plan that provided for benefits to be paid upon retirement to Trustees over a period of time based on the number of years of service. The Fund may have certain former Trustees who also participate in a retirement plan and receive benefits under such plan. Trustees’ and Officers’ Fees and Benefits include amounts accrued by the Fund to fund such retirement benefits. Obligations under the deferred compensation and retirement plans represent unsecured claims against the general assets of the Fund.
NOTE 7—Cash Balances
The Fund is permitted to temporarily carry a negative or overdrawn balance in its account with State Street Bank and Trust Company, the custodian bank. Such balances, if any at period end, are shown in the Statement of Assets and Liabilities under the payable caption Amount due custodian. To compensate the custodian bank for such overdrafts, the overdrawn Fund may either (1) leave funds as a compensating balance in the account so the custodian bank can be compensated by earning the additional interest; or (2) compensate by paying the custodian bank at a rate agreed upon by the custodian bank and Invesco, not to exceed the contractually agreed upon rate.
Invesco V.I. Equally-Weighted S&P 500 Fund
NOTE 8—Distributions to Shareholders and Tax Components of Net Assets
Tax Character of Distributions to Shareholders Paid During the Fiscal Years Ended December 31, 2015 and 2014:
| | | | | | | | |
| | | 2015 | | | 2014 | |
Ordinary income | | $ | 1,474,899 | | | $ | 1,974,729 | |
Long-term capital gain | | | 10,932,444 | | | | 10,228,488 | |
Total distributions | | $ | 12,407,343 | | | $ | 12,203,217 | |
Tax Components of Net Assets at Period-End:
| | | | |
| | | 2015 | |
Undistributed ordinary income | | $ | 981,434 | |
Undistributed long-term gain | | | 6,028,062 | |
Net unrealized appreciation — investments | | | 33,347,537 | |
Temporary book/tax differences | | | (29,196 | ) |
Shares of beneficial interest | | | 26,288,674 | |
Total net assets | | $ | 66,616,511 | |
The difference between book-basis and tax-basis unrealized appreciation (depreciation) is due to differences in the timing of recognition of gains and losses on investments for tax and book purposes. The Fund’s net unrealized appreciation difference is attributable primarily to wash sales.
The temporary book/tax differences are a result of timing differences between book and tax recognition of income and/or expenses. The Fund’s temporary book/tax differences are the result of the trustee deferral of compensation and retirement plan benefits.
Capital loss carryforward is calculated and reported as of a specific date. Results of transactions and other activity after that date may affect the amount of capital loss carryforward actually available for the Fund to utilize. Capital losses generated in years beginning after December 22, 2010 can be carried forward for an unlimited period, whereas previous losses expire in eight tax years. Capital losses with an expiration period may not be used to offset capital gains until all net capital losses without an expiration date have been utilized. Capital loss carryforwards with no expiration date will retain their character as either short-term or long-term capital losses instead of as short-term capital losses as under prior law. The ability to utilize capital loss carryforwards in the future may be limited under the Internal Revenue Code and related regulations based on the results of future transactions.
The Fund does not have a capital loss carryforward as of December 31, 2015.
NOTE 9—Investment Securities
The aggregate amount of investment securities (other than short-term securities, U.S. Treasury obligations and money market funds, if any) purchased and sold by the Fund during the year ended December 31, 2015 was $17,430,520 and $18,102,626, respectively. Cost of investments on a tax basis includes the adjustments for financial reporting purposes as of the most recently completed federal income tax reporting period-end.
| | | | |
| Unrealized Appreciation (Depreciation) of Investment Securities on a Tax Basis | |
Aggregate unrealized appreciation of investment securities | | $ | 35,103,115 | |
Aggregate unrealized (depreciation) of investment securities | | | (1,755,578 | ) |
Net unrealized appreciation of investment securities | | $ | 33,347,537 | |
Cost of investments for tax purposes is $33,481,254.
NOTE 10—Reclassification of Permanent Differences
Primarily as a result of differing book/tax treatment of real estate investment trust distributions, on December 31, 2015, undistributed net investment income was decreased by $41 and undistributed net realized gain was increased by $41. This reclassification had no effect on the net assets of the Fund.
Invesco V.I. Equally-Weighted S&P 500 Fund
NOTE 11—Share Information
| | | | | | | | | | | | | | | | |
| | | Summary of Share Activity | |
| | | Years ended December 31, | |
| | | 2015(a) | | | 2014 | |
| | | Shares | | | Amount | | | Shares | | | Amount | |
Sold: | | | | | | | | | | | | | | | | |
Series I | | | 22,265 | | | $ | 427,843 | | | | 34,739 | | | $ | 771,203 | |
Series II | | | 555,119 | | | | 10,442,759 | | | | 94,541 | | | | 1,914,075 | |
| | | | |
Issued as reinvestment of dividends: | | | | | | | | | | | | | | | | |
Series I | | | 343,497 | | | | 5,214,284 | | | | 311,944 | | | | 5,873,897 | |
Series II | | | 485,034 | | | | 7,193,059 | | | | 342,496 | | | | 6,329,320 | |
| | | | |
Reacquired: | | | | | | | | | | | | | | | | |
Series I | | | (291,860 | ) | | | (5,597,340 | ) | | | (452,140 | ) | | | (9,628,754 | ) |
Series II | | | (435,493 | ) | | | (7,788,269 | ) | | | (403,403 | ) | | | (8,272,898 | ) |
Net increase (decrease) in share activity | | | 678,562 | | | $ | 9,892,336 | | | | (71,823 | ) | | $ | (3,013,157 | ) |
| (a) | There are entities that are record owners of more than 5% of the outstanding shares of the Fund and in the aggregate own 97% of the outstanding shares of the Fund. The Fund and the Fund’s principal underwriter or adviser, are parties to participation agreements with these entities whereby these entities sell units of interest in separate accounts funding variable products that are invested in the Fund. The Fund, Invesco and/or Invesco affiliates may make payments to these entities, which are considered to be related to the Fund, for providing services to the Fund, Invesco and/or Invesco affiliates including but not limited to services such as, securities brokerage, third party record keeping and account servicing and administrative services. The Fund has no knowledge as to whether all or any portion of the shares owned of record by these entities are also owned beneficially. |
NOTE 12—Financial Highlights
The following schedule presents financial highlights for a share of the Fund outstanding throughout the periods indicated.
| | | | | | | | | | | | | | | | | | | | | | | | | | | | | | | | | | | | | | | | | | | | | | | | | | | | | | | | |
| | | Net asset
value,
beginning
of period | | | Net
investment
income(a) | | | Net gains
(losses)
on securities
(both
realized and
unrealized) | | | Total from
investment
operations | | | Dividends
from net
investment
income | | | Distributions
from net
realized
gains | | | Total
distributions | | | Net asset
value, end
of period | | | Total
return(b) | | | Net assets,
end of period
(000’s omitted) | | | Ratio of
expenses
to average
net assets
with fee waivers
and/or expenses
absorbed | | | Ratio of
expenses
to average net
assets without
fee waivers
and/or expenses
absorbed | | | Ratio of net
investment
income
to average
net assets | | | Portfolio
turnover(c) | |
Series I | | | | | | | | | | | | | | | | | | | | | |
Year ended 12/31/15 | | $ | 19.98 | | | $ | 0.26 | | | $ | (0.94 | ) | | $ | (0.68 | ) | | $ | (0.28 | ) | | $ | (3.21 | ) | | $ | (3.49 | ) | | $ | 15.81 | | | | (2.68 | )% | | $ | 27,974 | | | | 0.55 | %(d) | | | 0.55 | %(d) | | | 1.38 | %(d) | | | 25 | % |
Year ended 12/31/14 | | | 21.18 | | | | 0.29 | | | | 2.41 | | | | 2.70 | | | | (0.33 | ) | | | (3.57 | ) | | | (3.90 | ) | | | 19.98 | | | | 13.88 | | | | 33,878 | | | | 0.59 | | | | 0.59 | | | | 1.34 | | | | 18 | |
Year ended 12/31/13 | | | 18.23 | | | | 0.24 | | | | 5.94 | | | | 6.18 | | | | (0.38 | ) | | | (2.85 | ) | | | (3.23 | ) | | | 21.18 | | | | 35.42 | | | | 38,144 | | | | 0.59 | | | | 0.59 | | | | 1.16 | | | | 18 | |
Year ended 12/31/12 | | | 18.33 | | | | 0.33 | | | | 2.73 | | | | 3.06 | | | | (0.37 | ) | | | (2.79 | ) | | | (3.16 | ) | | | 18.23 | | | | 17.09 | | | | 34,914 | | | | 0.46 | | | | 0.59 | | | | 1.69 | | | | 23 | |
Year ended 12/31/11 | | | 18.78 | | | | 0.29 | | | | (0.40 | ) | | | (0.11 | ) | | | (0.34 | ) | | | — | | | | (0.34 | ) | | | 18.33 | | | | (0.36 | ) | | | 35,998 | | | | 0.37 | | | | 0.51 | | | | 1.50 | | | | 21 | |
Series II | | | | | | | | | | | | | | | | | | | | | |
Year ended 12/31/15 | | | 19.60 | | | | 0.21 | | | | (0.92 | ) | | | (0.71 | ) | | | (0.24 | ) | | | (3.21 | ) | | | (3.45 | ) | | | 15.44 | | | | (2.92 | ) | | | 38,643 | | | | 0.80 | (d) | | | 0.80 | (d) | | | 1.13 | (d) | | | 25 | |
Year ended 12/31/14 | | | 20.84 | | | | 0.23 | | | | 2.37 | | | | 2.60 | | | | (0.27 | ) | | | (3.57 | ) | | | (3.84 | ) | | | 19.60 | | | | 13.61 | | | | 37,205 | | | | 0.84 | | | | 0.84 | | | | 1.09 | | | | 18 | |
Year ended 12/31/13 | | | 17.98 | | | | 0.19 | | | | 5.84 | | | | 6.03 | | | | (0.32 | ) | | | (2.85 | ) | | | (3.17 | ) | | | 20.84 | | | | 35.04 | | | | 38,860 | | | | 0.84 | | | | 0.84 | | | | 0.91 | | | | 18 | |
Year ended 12/31/12 | | | 18.09 | | | | 0.27 | | | | 2.71 | | | | 2.98 | | | | (0.30 | ) | | | (2.79 | ) | | | (3.09 | ) | | | 17.98 | | | | 16.88 | | | | 36,362 | | | | 0.71 | | | | 0.84 | | | | 1.44 | | | | 23 | |
Year ended 12/31/11 | | | 18.53 | | | | 0.23 | | | | (0.38 | ) | | | (0.15 | ) | | | (0.29 | ) | | | — | | | | (0.29 | ) | | | 18.09 | | | | (0.66 | ) | | | 41,523 | | | | 0.62 | | | | 0.76 | | | | 1.25 | | | | 21 | |
| (a) | Calculated using average shares outstanding. |
| (b) | Includes adjustments in accordance with accounting principles generally accepted in the United States of America and as such, the net asset value for financial reporting purposes and the returns based upon those net asset values may differ from the net asset value and returns for shareholder transactions. Total returns are not annualized for periods less than one year, if applicable, and do not reflect charges assessed in connection with a variable product, which if included would reduce total returns. |
| (c) | Portfolio turnover is calculated at the fund level and is not annualized for periods less than one year, if applicable. |
| (d) | Ratios are based on average daily net assets (000’s omitted) of $31,231 and $39,437 for Series I and Series II shares, respectively. |
Invesco V.I. Equally-Weighted S&P 500 Fund
Report of Independent Registered Public Accounting Firm
To the Board of Trustees of AIM Variable Insurance Funds (Invesco Variable Insurance Funds)
and Shareholders of Invesco V.I. Equally-Weighted S&P 500 Fund:
In our opinion, the accompanying statement of assets and liabilities, including the schedule of investments, and the related statements of operations and of changes in net assets and the financial highlights present fairly, in all material respects, the financial position of Invesco V.I. Equally-Weighted S&P 500 Fund (one of the funds constituting AIM Variable Insurance Funds (Invesco Variable Insurance Funds), hereafter referred to as the “Fund”) at December 31, 2015, the results of its operations for the year then ended, the changes in its net assets for each of the two years in the period then ended and the financial highlights for each of the five years in the period then ended, in conformity with accounting principles generally accepted in the United States of America. These financial statements and financial highlights (hereafter referred to as “financial statements”) are the responsibility of the Fund’s management. Our responsibility is to express an opinion on these financial statements based on our audits. We conducted our audits of these financial statements in accordance with the standards of the Public Company Accounting Oversight Board (United States). Those standards require that we plan and perform the audit to obtain reasonable assurance about whether the financial statements are free of material misstatement. An audit includes examining, on a test basis, evidence supporting the amounts and disclosures in the financial statements, assessing the accounting principles used and significant estimates made by management, and evaluating the overall financial statement presentation. We believe that our audits, which included confirmation of securities at December 31, 2015 by correspondence with the custodian and brokers, provide a reasonable basis for our opinion.
PRICEWATERHOUSECOOPERS LLP
Houston, Texas
February 15, 2016
Invesco V.I. Equally-Weighted S&P 500 Fund
Calculating your ongoing Fund expenses
Example
As a shareholder of the Fund, you incur ongoing costs, including management fees; distribution and/or service fees (12b-1); and other Fund expenses. This example is intended to help you understand your ongoing costs (in dollars) of investing in the Fund and to compare these costs with ongoing costs of investing in other mutual funds. The example is based on an investment of $1,000 invested at the beginning of the period and held for the entire period July 1, 2015 through December 31, 2015.
The actual and hypothetical expenses in the examples below do not represent the effect of any fees or other expenses assessed in connection with a variable product; if they did, the expenses shown would be higher while the ending account values shown would be lower.
Actual expenses
The table below provides information about actual account values and actual expenses. You may use the information in this table, together with the amount you invested, to estimate the expenses that you paid over the period. Simply divide your account value by $1,000 (for example, an $8,600 account value divided by $1,000 = 8.6), then multiply the result by the number in the table under the heading entitled “Actual Expenses Paid During Period” to estimate the expenses you paid on your account during this period.
Hypothetical example for comparison purposes
The table below also provides information about hypothetical account values and hypothetical expenses based on the Fund’s actual expense ratio and an assumed rate of return of 5% per year before expenses, which is not the Fund’s actual return.
The hypothetical account values and expenses may not be used to estimate the actual ending account balance or expenses you paid for the period. You may use this information to compare the ongoing costs of investing in the Fund and other funds. To do so, compare this 5% hypothetical example with the 5% hypothetical examples that appear in the shareholder reports of the other funds.
Please note that the expenses shown in the table are meant to highlight your ongoing costs. Therefore, the hypothetical information is useful in comparing ongoing costs, and will not help you determine the relative total costs of owning different funds.
| | | | | | | | | | | | | | | | | | | | | | | | |
| Class | | Beginning
Account Value
(07/01/15) | | | ACTUAL | | | HYPOTHETICAL (5% annual return before
expenses) | | | Annualized
Expense
Ratio | |
| | | Ending
Account Value
(12/31/15)1 | | | Expenses
Paid During
Period2 | | | Ending
Account Value
(12/31/15) | | | Expenses
Paid During
Period2 | | |
| Series I | | $ | 1,000.00 | | | $ | 968.90 | | | $ | 2.63 | | | $ | 1,022.53 | | | $ | 2.70 | | | | 0.53 | % |
| Series II | | | 1,000.00 | | | | 967.80 | | | | 3.87 | | | | 1,021.27 | | | | 3.97 | | | | 0.78 | |
| 1 | The actual ending account value is based on the actual total return of the Fund for the period July 1, 2015 through December 31, 2015, after actual expenses and will differ from the hypothetical ending account value which is based on the Fund’s expense ratio and a hypothetical annual return of 5% before expenses. |
| 2 | Expenses are equal to the Fund’s annualized expense ratio as indicated above multiplied by the average account value over the period, multiplied by 184/365 to reflect the most recent fiscal half year. |
Invesco V.I. Equally-Weighted S&P 500 Fund
Tax Information
Form 1099-DIV, Form 1042-S and other year–end tax information provide shareholders with actual calendar year amounts that should be included in their tax returns. Shareholders should consult their tax advisors.
The following distribution information is being provided as required by the Internal Revenue Code or to meet a specific state’s requirement.
The Fund designates the following amounts or, if subsequently determined to be different, the maximum amount allowable for its fiscal year ended December 31, 2015:
| | | | |
Federal and State Income Tax | |
Long-Term Capital Gain Distributions | | $ | 10,932,444 | |
Corporate Dividends Received Deduction* | | | 82.81 | % |
U.S. Treasury Obligations* | | | 0.00 | % |
| | * | The above percentages are based on ordinary income dividends paid to shareholders during the Fund’s fiscal year. |
Invesco V.I. Equally-Weighted S&P 500 Fund
Trustees and Officers
The address of each trustee and officer is AIM Variable Insurance Funds (Invesco Variable Insurance Funds) (the “Trust”), 11 Greenway Plaza, Suite 1000, Houston, Texas 77046-1173. The trustees serve for the life of the Trust, subject to their earlier death, incapacitation, resignation, retirement or removal as more specifically provided in the Trust’s organizational documents. Each officer serves for a one year term or until their successors are elected and qualified. Column two below includes length of time served with predecessor entities, if any.
| | | | | | | | |
Name, Year of Birth and
Position(s) Held with the Trust | | Trustee and/
or Officer Since | | Principal Occupation(s)
During Past 5 Years | | Number of Funds in Fund Complex Overseen by Trustee | | Other Directorship(s) Held by Trustee During Past 5 Years |
| Interested Persons | | | | | | | | |
| Martin L. Flanagan1 — 1960 Trustee | | 2007 | | Executive Director, Chief Executive Officer and President, Invesco Ltd. (ultimate parent of Invesco and a global investment management firm); Advisor to the Board, Invesco Advisers, Inc. (formerly known as Invesco Institutional (N.A.), Inc.); Trustee, The Invesco Funds; Vice Chair, Investment Company Institute; and Member of Executive Board, SMU Cox School of Business Formerly: Chairman and Chief Executive Officer, Invesco Advisers, Inc. (registered investment adviser); Director, Chairman, Chief Executive Officer and President, IVZ Inc. (holding company), INVESCO Group Services, Inc. (service provider) and Invesco North American Holdings, Inc. (holding company); Director, Chief Executive Officer and President, Invesco Holding Company Limited (parent of Invesco and a global investment management firm); Director, Invesco Ltd.; Chairman, Investment Company Institute and President, Co-Chief Executive Officer, Co-President, Chief Operating Officer and Chief Financial Officer, Franklin Resources, Inc. (global investment management organization) | | 146 | | None |
Philip A. Taylor2 — 1954 Trustee, President and Principal Executive Officer | | 2006 | | Head of North American Retail and Senior Managing Director, Invesco Ltd.; Director, Co-Chairman, Co-President and Co-Chief Executive Officer, Invesco Advisers, Inc. (formerly known as Invesco Institutional (N.A.), Inc.) (registered investment adviser); Director, Chairman, Chief Executive Officer and President, Invesco Management Group, Inc. (formerly known as Invesco Aim Management Group, Inc.) (financial services holding company); Director and Chairman, Invesco Investment Services, Inc. (formerly known as Invesco Aim Investment Services, Inc.) (registered transfer agent) Chief Executive Officer, Invesco Corporate Class Inc. (corporate mutual fund company) Director, Chairman and Chief Executive Officer, Invesco Canada Ltd. (formerly known as Invesco Trimark Ltd./Invesco Trimark Ltèe) (registered investment adviser and registered transfer agent); Trustee, President and Principal Executive Officer, The Invesco Funds (other than AIM Treasurer’s Series Trust (Invesco Treasurer’s Series Trust), Short-Term Investments Trust and Invesco Management Trust); Trustee and Executive Vice President, The Invesco Funds (AIM Treasurer’s Series Trust (Invesco Treasurer’s Series Trust), Short-Term Investments Trust and Invesco Management Trust only); Director, Invesco Investment Advisers LLC (formerly known as Van Kampen Asset Management); Director, Chief Executive Officer and President, Van Kampen Exchange Corp. Formerly: Director and President, INVESCO Funds Group, Inc. (registered investment adviser and registered transfer agent); Director and Chairman, IVZ Distributors, Inc. (formerly known as INVESCO Distributors, Inc.) (registered broker dealer); Director, President and Chairman, Invesco Inc. (holding company), Invesco Canada Holdings Inc. (holding company), Trimark Investments Ltd./Placements Trimark Ltèe and Invesco Financial Services Ltd/Services Financiers Invesco Ltèe; Chief Executive Officer, Invesco Canada Fund Inc (corporate mutual fund company); Director and Chairman, Van Kampen Investor Services Inc.; Director, Chief Executive Officer and President, 1371 Preferred Inc. (holding company) and Van Kampen Investments Inc.; Director and President, AIM GP Canada Inc. (general partner for limited partnerships) and Van Kampen Advisors, Inc.; Director and Chief Executive Officer, Invesco Trimark Dealer Inc. (registered broker dealer); Director, Invesco Distributors, Inc. (formerly known as Invesco Aim Distributors, Inc.) (registered broker dealer); Manager, Invesco PowerShares Capital Management LLC; Director, Chief Executive Officer and President, Invesco Advisers, Inc.; Director, Chairman, Chief Executive Officer and President, Invesco Aim Capital Management, Inc.; President, Invesco Trimark Dealer Inc. and Invesco Trimark Ltd./Invesco Trimark Ltèe; Director and President, AIM Trimark Corporate Class Inc. and AIM Trimark Canada Fund Inc.; Senior Managing Director, Invesco Holding Company Limited; Director and Chairman, Fund Management Company (former registered broker dealer); President and Principal Executive Officer, The Invesco Funds (AIM Treasurer’s Series Trust (Invesco Treasurer’s Series Trust), and Short-Term Investments Trust only); President, AIM Trimark Global Fund Inc. and AIM Trimark Canada Fund Inc | | 146 | | None |
| 1 | Mr. Flanagan is considered an interested person (within the meaning of Section 2(a)(19) of the 1940 Act) of the Trust because he is an officer of the Adviser to the Trust, and an officer and a director of Invesco Ltd., ultimate parent of the Adviser. |
| 2 | Mr. Taylor is considered an interested person (within the meaning of Section 2(a)(19) of the 1940 Act) of the Trust because he is an officer and a director of the Adviser. |
Invesco V.I. Equally-Weighted S&P 500 Fund
Trustees and Officers—(continued)
| | | | | | | | |
Name, Year of Birth and
Position(s) Held with the Trust | | Trustee and/
or Officer Since | | Principal Occupation(s)
During Past 5 Years | | Number of Funds in Fund Complex Overseen by Trustee | | Other Directorship(s)
Held by Trustee During Past 5 Years |
| Independent Trustees | | | | | | | | |
Bruce L. Crockett — 1944 Trustee and Chair | | 2003 | | Chairman, Crockett Technologies Associates (technology consulting company) Formerly: Director, Captaris (unified messaging provider); Director, President and Chief Executive Officer, COMSAT Corporation; Chairman, Board of Governors of INTELSAT (international communications company); ACE Limited (insurance company); Independent Directors Council and Investment Company Institute | | 146 | | ALPS (Attorneys Liability Protection Society) (insurance company) and Globe Specialty Metals, Inc. (metallurgical company) |
David C. Arch — 1945 Trustee | | 2010 | | Chairman of Blistex Inc., a consumer health care products manufacturer | | 146 | | Board member of the Illinois Manufacturers’ Association; Member of the Board of Visitors, Institute for the Humanities, University of Michigan |
James T. Bunch — 1942 Trustee | | 2000 | | Managing Member, Grumman Hill Group LLC (family office/private equity investments) Formerly: Chairman of the Board of Trustees, Evans Scholars Foundation and Chairman, Board of Governors, Western Golf Association | | 146 | | Trustee, Evans Scholars Foundation; and Chairman of the Board, Denver Film Society |
Albert R. Dowden — 1941 Trustee | | 2003 | | Director of a number of public and private business corporations, including the Boss Group, Ltd. (private investment and management); Nature’s Sunshine Products, Inc. and Reich & Tang Funds (5 portfolios) (registered investment company) Formerly: Director, Homeowners of America Holding Corporation/Homeowners of America Insurance Company (property casualty company); Director, Continental Energy Services, LLC (oil and gas pipeline service); Director, CompuDyne Corporation (provider of product and services to the public security market) and Director, Annuity and Life Re (Holdings), Ltd. (reinsurance company); Director, President and Chief Executive Officer, Volvo Group North America, Inc.; Senior Vice President, AB Volvo; Director of various public and private corporations; Chairman, DHJ Media, Inc.; Director, Magellan Insurance Company; and Director, The Hertz Corporation, Genmar Corporation (boat manufacturer), National Media Corporation; Advisory Board of Rotary Power International (designer, manufacturer, and seller of rotary power engines); and Chairman, Cortland Trust, Inc. (registered investment company) | | 146 | | Director of: Nature’s Sunshine Products, Inc., Reich & Tang Funds, Homeowners of America Holding Corporation/ Homeowners of America Insurance Company, the Boss Group |
Jack M. Fields — 1952 Trustee | | 2003 | | Chief Executive Officer, Twenty First Century Group, Inc. (government affairs company); Owner and Chief Executive Officer, Dos Angeles Ranch, L.P. (cattle, hunting, corporate entertainment); and Discovery Global Education Fund (non-profit) Formerly: Chief Executive Officer, Texana Timber LP (sustainable forestry company); Director of Cross Timbers Quail Research Ranch (non-profit); and member of the U.S. House of Representatives | | 146 | | Insperity, Inc. (formerly known as Administaff) |
Eli Jones — Trustee | | 2016 | | Professor and Dean, Mays Business School, Texas A&M University Formerly: Professor and Dean, Walton College of Business, University of Arkansas, and E.J. Ourso College of Business, Louisiana State University | | 146 | | Director, Insperity, Inc., (2011-present) and ARVEST Bank (2012-2015) |
Prema Mathai-Davis — 1950 Trustee | | 2003 | | Retired. Formerly: Chief Executive Officer, YWCA of the U.S.A. | | 146 | | None |
Larry Soll — 1942 Trustee | | 1997 | | Retired. Formerly: Chairman, Chief Executive Officer and President, Synergen Corp. (a biotechnology company) | | 146 | | None |
Robert C. Troccoli — Trustee | | 2016 | | Retired. Formerly: Senior Partner, KPMG LLP | | 146 | | None |
Raymond Stickel, Jr. — 1944 Trustee | | 2005 | | Retired. Formerly: Director, Mainstay VP Series Funds, Inc. (25 portfolios) and Partner, Deloitte & Touche | | 146 | | None |
Suzanne H. Woolsey — 1941 Trustee | | 2014 | | Chief Executive Officer of Woolsey Partners LLC | | 146 | | Emeritus Chair of the Board of Trustees of the Institute for Defense Analyses; Trustee of Colorado College; Trustee of California Institute of Technology; Prior to 2014, Director of Fluor Corp.; Prior to 2010, Trustee of the German Marshall Fund of the United States; Prior to 2010 Trustee of the Rocky Mountain Institute |
Invesco V.I. Equally-Weighted S&P 500 Fund
Trustees and Officers—(continued)
| | | | | | | | |
Name, Year of Birth and
Position(s) Held with the Trust | | Trustee��and/
or Officer Since | | Principal Occupation(s)
During Past 5 Years | | Number of Funds in Fund Complex Overseen by Trustee | | Other Directorship(s)
Held by Trustee During Past 5 Years |
| Other Officers | | | | | | | | |
Russell C. Burk — 1958 Senior Vice President and Senior Officer | | 2005 | | Senior Vice President and Senior Officer, The Invesco Funds | | N/A | | N/A |
John M. Zerr — 1962 Senior Vice President, Chief Legal Officer and Secretary | | 2006 | | Director, Senior Vice President, Secretary and General Counsel, Invesco Management Group, Inc. (formerly known as Invesco Aim Management Group, Inc.) and Van Kampen Exchange Corp.; Senior Vice President, Invesco Advisers, Inc. (formerly known as Invesco Institutional (N.A.), Inc.) (registered investment adviser); Senior Vice President and Secretary, Invesco Distributors, Inc. (formerly known as Invesco Aim Distributors, Inc.); Director, Vice President and Secretary, Invesco Investment Services, Inc. (formerly known as Invesco Aim Investment Services, Inc.); Senior Vice President, Chief Legal Officer and Secretary, The Invesco Funds; Managing Director, Invesco PowerShares Capital Management LLC; Director, Secretary and General Counsel, Invesco Investment Advisers LLC (formerly known as Van Kampen Asset Management); Secretary and General Counsel, Invesco Capital Markets, Inc. (formerly known as Van Kampen Funds Inc.) and Chief Legal Officer, PowerShares Exchange-Traded Fund Trust, PowerShares Exchange-Traded Fund Trust II, PowerShares India Exchange-Traded Fund Trust, PowerShares Actively Managed Exchange-Traded Fund Trust, and PowerShares Actively Managed Exchange-Traded Commodity Fund Trust Formerly: Director, Vice President and Secretary, IVZ Distributors, Inc. (formerly known as INVESCO distributors, Inc.); Director and Vice President, INVESCO Funds Group, Inc.; Director and Vice President, Van Kampen Advisors Inc.; Director, Vice President, Secretary and General Counsel, Van Kampen Investor Services Inc.; Director, Invesco Distributors, Inc. (formerly known as Invesco Aim Distributors, Inc.); Director, Senior Vice President, General Counsel and Secretary, Invesco Aim Advisers, Inc. and Van Kampen Investments Inc.; Director, Vice President and Secretary, Fund Management Company; Director, Senior Vice President, Secretary, General Counsel and Vice President, Invesco Aim Capital Management, Inc.; Chief Operating Officer and General Counsel, Liberty Ridge Capital, Inc. (an investment adviser); Vice President and Secretary, PBHG Funds (an investment company) and PBHG Insurance Series Fund (an investment company); Chief Operating Officer, General Counsel and Secretary, Old Mutual Investment Partners (a broker-dealer); General Counsel and Secretary, Old Mutual Fund Services (an administrator) and Old Mutual Shareholder Services (a shareholder servicing center); Executive Vice President, General Counsel and Secretary, Old Mutual Capital, Inc. (an investment adviser); and Vice President and Secretary, Old Mutual Advisors Funds (an investment company) | | N/A | | N/A |
Sheri Morris — 1964 Vice President, Treasurer and Principal Financial Officer | | 2003 | | Vice President, Treasurer and Principal Financial Officer, The Invesco Funds; Vice President, Invesco Advisers, Inc. (formerly known as Invesco Institutional (N.A.), Inc.) (registered investment adviser); and Vice President, PowerShares Exchange-Traded Fund Trust, PowerShares Exchange-Traded Fund Trust II, PowerShares India Exchange-Traded Fund Trust, PowerShares Actively Managed Exchange-Traded Fund Trust, and PowerShares Actively Managed Exchange-Traded Commodity Fund Trust Formerly: Vice President, Invesco Aim Advisers, Inc., Invesco Aim Capital Management, Inc. and Invesco Aim Private Asset Management, Inc.; Assistant Vice President and Assistant Treasurer, The Invesco Funds and Assistant Vice President, Invesco Advisers, Inc., Invesco Aim Capital Management, Inc. and Invesco Aim Private Asset Management, Inc.; and Treasurer, PowerShares Exchange-Traded Fund Trust, PowerShares Exchange-Traded Fund Trust II, PowerShares India Exchange-Traded Fund Trust and PowerShares Actively Managed Exchange-Traded Fund Trust | | N/A | | N/A |
Invesco V.I. Equally-Weighted S&P 500 Fund
Trustees and Officers—(continued)
| | | | | | | | |
Name, Year of Birth and
Position(s) Held with the Trust | | Trustee and/
or Officer Since | | Principal Occupation(s)
During Past 5 Years | | Number of Funds in Fund Complex Overseen by Trustee | | Other Directorship(s)
Held by Trustee During Past 5 Years |
| Other Officers—(continued) | | | | | | | | |
Karen Dunn Kelley — 1960 Vice President | | 2003 | | Senior Managing Director, Investments, Invesco Ltd.; Director, Co-President, Co-Chief Executive Officer, and Co-Chairman, Invesco Advisers, Inc. (formerly known as Invesco Institutional (N.A.), Inc.) (registered investment adviser); Chairman, Invesco Senior Secured Management, Inc.; Senior Vice President, Invesco Management Group, Inc. (formerly known as Invesco Aim Management Group, Inc.); Executive Vice President, Invesco Distributors, Inc. (formerly known as Invesco Aim Distributors, Inc.); Director, Invesco Mortgage Capital Inc. and Invesco Management Company Limited; Vice President, The Invesco Funds (other than AIM Treasurer’s Series Trust (Invesco Treasurer’s Series Trust), Short-Term Investments Trust and Invesco Management Trust); and President and Principal Executive Officer, The Invesco Funds (AIM Treasurer’s Series Trust (Invesco Treasurer’s Series Trust), Short-Term Investments Trust and Invesco Management Trust only) Formerly: Director and President, INVESCO Asset Management (Bermuda) Ltd., Director, INVESCO Global Asset Management Limited and INVESCO Management S.A.; Senior Vice President, Van Kampen Investments Inc. and Invesco Advisers, Inc. (formerly known as Invesco Institutional (N.A.), Inc.) (registered investment adviser); Vice President, Invesco Advisers, Inc. (formerly known as Invesco Institutional (N.A.), Inc.); Director of Cash Management and Senior Vice President, Invesco Advisers, Inc. and Invesco Aim Capital Management, Inc.; Director and President, Fund Management Company; Chief Cash Management Officer, Director of Cash Management, Senior Vice President, and Managing Director, Invesco Aim Capital Management, Inc.; Director of Cash Management, Senior Vice President, and Vice President, Invesco Advisers, Inc. and The Invesco Funds (AIM Treasurer’s Series Trust (Invesco Treasurer’s Series Trust), and Short-Term Investments Trust only) | | N/A | | N/A |
Crissie M. Wisdom — 1969 Anti-Money Laundering Compliance Officer | | 2013 | | Anti-Money Laundering Compliance Officer, Invesco Advisers, Inc. (formerly known as Invesco Institutional (N.A.), Inc.) (registered investment adviser), Invesco Capital Markets, Inc. (formerly known as Van Kampen Funds Inc.), Invesco Distributors, Inc., Invesco Investment Services, Inc., Invesco Management Group, Inc., Van Kampen Exchange Corp., The Invesco Funds, and PowerShares Exchange-Traded Fund Trust, PowerShares Exchange-Traded Fund Trust II, PowerShares India Exchange-Traded Fund Trust, PowerShares Actively Managed Exchange-Traded Fund Trust and PowerShares Actively Managed Exchange-Traded Commodity Fund Trust; Anti-Money Laundering Compliance Officer and Bank Secrecy Act Officer, INVESCO National Trust Company and Invesco Trust Company; and Fraud Prevention Manager and Controls and Risk Analysis Manager for Invesco Investment Services, Inc. | | N/A | | N/A |
Lisa O. Brinkley — 1959 Chief Compliance Officer | | 2015 | | Senior Vice President and Chief Compliance Officer, Invesco Advisers, Inc. (registered investment adviser) (formerly known as Invesco Institutional (N.A., Inc.); and Chief Compliance Officer, The Invesco Funds Formerly: Global Assurance Officer, Invesco Ltd. and Vice President, The Invesco Funds; Chief Compliance Officer, Invesco Distributors, Inc. (formerly known as Invesco Aim Distributors, Inc.), Invesco Investment Services, Inc.(formerly known as Invesco Aim Investment Services, Inc.) and Van Kampen Investor Services Inc.; Senior Vice President, Invesco Management Group, Inc.; Senior Vice President and Chief Compliance Officer, Invesco Advisers, Inc. and The Invesco Funds; Vice President and Chief Compliance Officer, Invesco Aim Capital Management, Inc. and Invesco Distributors, Inc.; Vice President, Invesco Investment Services, Inc. and Fund Management Company | | N/A | | N/A |
The Statement of Additional Information of the Trust includes additional information about the Fund’s Trustees and is available upon request, without charge, by calling 1.800.959.4246. Please refer to the Fund’s prospectus for information on the Fund’s sub-advisers.
| | | | | | |
Office of the Fund 11 Greenway Plaza, Suite 1000 Houston, TX 77046-1173 | | Investment Adviser Invesco Advisers, Inc. 1555 Peachtree Street, N.E. Atlanta, GA 30309 | | Distributor Invesco Distributors, Inc. 11 Greenway Plaza, Suite 1000 Houston, TX 77046-1173 | | Auditors PricewaterhouseCoopers LLP 1000 Louisiana Street, Suite 5800 Houston, TX 77002-5678 |
| | | |
| | | | | | |
Counsel to the Fund Stradley Ronon Stevens & Young, LLP 2005 Market Street, Suite 2600 Philadelphia, PA 19103-7018 | | Counsel to the Independent Trustees Goodwin Procter LLP 901 New York Avenue, N.W. Washington, D.C. 20001 | | Transfer Agent Invesco Investment Services, Inc. 11 Greenway Plaza, Suite 1000 Houston, TX 77046-1173 | | Custodian State Street Bank and Trust Company 225 Franklin Street Boston, MA 02110-2801 |
Invesco V.I. Equally-Weighted S&P 500 Fund
| | | | |
| | |
 | | Annual Report to Shareholders | | December 31, 2015 |
| | |
| | Invesco V.I. Equity and Income Fund |

| | |
| | The Fund provides a complete list of its holdings four times in each fiscal year, at the quarter-ends. For the second and fourth quarters, the lists appear in the Fund’s semiannual and annual reports to shareholders. For the first and third quarters, the Fund files the lists with the Securities and Exchange Commission (SEC) on Form N-Q. The Fund’s Form N-Q filings are available on the SEC website, sec.gov. Copies of the Fund’s Forms N-Q may be reviewed and copied at the SEC Public Reference Room in Washington, D.C. You can obtain information on the operation of the Public Reference Room, including information about duplicating fee charges, by calling 202 551 8090 or 800 732 0330, or by electronic request at the following email address: publicinfo@sec.gov. The SEC file numbers for the Fund are 811-07452 and 033-57340. The Fund’s most recent portfolio holdings, as filed on Form N-Q, have also been made available to insurance companies issuing variable annuity contracts and variable life insurance policies (“variable products”) that invest in the Fund. A description of the policies and procedures that the Fund uses to determine how to vote proxies relating to portfolio securities is available without charge, upon request, from our Client Services department at 800 959 4246 or at invesco.com/proxyguidelines. The information is also available on the SEC website, sec.gov. Information regarding how the Fund voted proxies related to its portfolio securities during the most recent 12-month period ended June 30 is available at invesco.com/proxysearch. The information is also available on the SEC website, sec.gov. Invesco Advisers, Inc. is an investment adviser; it provides investment advisory services to individual and institutional clients and does not sell securities. Invesco Distributors, Inc. is the US distributor for Invesco Ltd.’s retail mutual funds, exchange-traded funds and institutional money market funds. Both are wholly owned, indirect subsidiaries of Invesco Ltd. This report must be accompanied or preceded by a currently effective Fund prospectus and variable product prospectus, which contain more complete information, including sales charges and expenses. Investors should read each carefully before investing. Invesco Distributors, Inc. VK-VIEQI-AR-1 NOT FDIC INSURED | MAY LOSE VALUE | NO BANK GUARANTEE |
Management’s Discussion of Fund Performance
Performance summary
For the year ended December 31, 2015, Series I shares of Invesco V.I. Equity and Income Fund (the Fund) outperformed the Russell 1000 Value Index but underperformed the Barclays U.S. Government/Credit Index – the Fund’s two style-specific benchmarks.
Your Fund’s long-term performance appears later in this report.
Fund vs. Indexes
Total returns, 12/31/14 to 12/31/15, excluding variable product issuer charges.
If variable product issuer charges were included, returns would be lower.
| | | | | |
| Series I Shares | | | | -2.29 | % |
| Series II Shares | | | | -2.58 | |
| Barclays U.S. Government/Credit Index▼ (Style-Specific Index) | | | | 0.15 | |
| Russell 1000 Value Index▼ (Style-Specific Index) | | | | -3.83 | |
| Lipper VUF Mixed-Asset Target Allocation Growth Indexn (Peer Group Index)* | | | | -0.82 | |
Source(s): ▼FactSet Research Systems Inc.; nLipper Inc.
*During the reporting period, the Lipper VUF Mixed-Asset Target Allocation Growth Index became the Fund’s peer group index.
Market conditions and your Fund
The US economy continued its modest, but steady growth, during the year ended December 31, 2015 – although the health of individual economic sectors varied dramatically. The headline economic story was a steady decline in already-battered energy markets, as oil prices plummeted when increased supply overwhelmed demand. This decline particularly affected companies with US-based offshore or shale-based resources – companies whose cost to recover oil is higher than many traditional producers. On the other end of the spectrum, the improved position of the US consumer was the more subtle story which drove the US economy forward during the year.
As the year began, economic growth appeared to be stronger in the US than in the rest of the world. US equity markets were recovering from the crash of oil prices initiated by OPEC’s decision to maintain high production despite low prices and slowing global growth. The view that the US Federal Reserve (the Fed) would begin raising rates while other central banks were loosening monetary
policy led the US dollar to strengthen against many currencies. This hurt commodity- and materials-based economies – and companies in related sectors. Additionally, US-based multinational companies faced foreign exchange headwinds. Low interest rates, the increasing availability of credit and an improving employment picture all contributed to higher consumer confidence and consumer spending, which drove US equity markets higher, particularly through the spring, and helped overcome fears that Greece and the eurozone would fail to reach an agreement on a financial bailout plan.
In the summer of 2015, US equity markets moved sharply lower. A significant downturn in China’s financial markets and weak global economic growth led the Fed to delay raising interest rates; this, in turn, increased investor uncertainty and market volatility. A continued decline in oil prices also contributed to market volatility. In the fall, however, US markets rallied, the Fed saw enough economic stabilization to finally raise interest rates, and most major US market indexes ended the year barely in positive territory.
For the reporting period, value stocks, as a group, underperformed growth stocks by a large margin, regardless of market capitalization. Sector performance within the Russell 1000 Value Index was mainly negative, with health care, telecommunication services and industrials being the only sectors with positive performance.
Strong stock selection in the information technology sector was a large contributor to the Fund’s performance relative to the Russell 1000 Value Index for the reporting period. Notably, Amdocs, in the software and services industry, was a large driver of Fund performance, posting a double-digit return for the year. Amdocs’ stock price rallied when the company reported record revenues in July 2015, after expanding its product suite and renewing major service contracts. Also, not owning HP, a component of the style-specific index, helped relative Fund performance, as the stock struggled during the reporting period.
The Fund’s underweight exposure to the energy sector was another positive contributor to Fund performance relative to the Russell 1000 Value Index. The sector was the worst-performing sector during the reporting period, as continued weakness in oil prices drove down stock prices.
Stock selection in the consumer discretionary sector also added to relative Fund returns. Within the sector, Carnival was a notable contributor to Fund performance. The stock rose more than 20% for the reporting period. The cruise line operator reported higher-than-expected earnings and raised its outlook for 2016.
Stock selection in and an underweight allocation to health care stocks detracted from Fund performance relative to the Russell 1000 Value Index. Specifically, underweight exposure to the health care services industry and not owning names like Cigna detracted significantly from the Fund’s relative performance, as those
| | | | | |
| Portfolio Composition |
By security type | | | | % of total net assets | |
| | | | | |
| |
| Common Stocks & Other Equity Interests | | | | 63.3 | % |
| Bonds & Notes | | | | 22.2 | |
| U.S. Treasury Securities | | | | 8.0 | |
| Security Types Each Less than 1% of Portfolio | | | | 1.2 | |
| Money Market Funds Plus Other Assets Less Liabilities | | | | 5.3 | |
| | | | | |
| Top 10 Equity Holdings* | | |
% of total net assets |
| | | | | |
| |
| 1. JPMorgan Chase & Co. | | | | 3.1 | % |
2. Citigroup Inc. | | | | 3.1 | |
| 3. General Electric Co. | | | | 2.4 | |
| 4. Bank of America Corp. | | | | 1.9 | |
| 5. Morgan Stanley | | | | 1.5 | |
| 6. Carnival Corp. | | | | 1.3 | |
7. PNC Financial Services Group, Inc. (The) | | | | 1.2 | |
8. Citizens Financial Group Inc. | | | | 1.2 | |
| 9. Merck & Co., Inc. | | | | 1.2 | |
10. Target Corp. | | | | 1.2 | |
| | | | | |
| Total Net Assets | | | | $1.2 billion | |
| |
| Total Number of Holdings* | | | | 424 | |
The Fund’s holdings are subject to change, and there is no assurance that the Fund will continue to hold any particular security.
*Excluding money market fund holdings.
Data presented here are as of December 31, 2015.
Invesco V.I. Equity and Income Fund
stocks performed well for the reporting period.
Stock selection in and underweight exposure to the industrials sector also detracted from the Fund’s performance relative to the Russell 1000 Value Index. In the commercial and professional services industry, Tyco International performed poorly for the reporting period, falling by double digits. In the fourth quarter, Tyco met analysts’ earnings expectations; however, revenue fell short due to the foreign exchange impact of the strong US dollar.
Stock selection in the consumer staples sector was a large detractor from the Fund’s performance, relative to the Russell 1000 Value Index, for the year. The stock of Archer-Daniels-Midland sold off during the fourth quarter after the company’s third-quarter profits missed analysts’ expectations. Also, the company admitted that it may continue to be challenged by the strong US dollar and depressed ethanol margins.
The Fund’s allocation to high grade bonds and convertible bonds contributed to relative Fund performance versus the Russell 1000 Value Index, as high grade bonds and convertible bonds outperformed large-cap value equities, which posted negative returns for the year.
During the reporting period, cash was utilized for investment opportunities, and we held fixed income securities because we believe they can potentially provide income and capital appreciation during equity market downturns. Cash contributed to Fund performance relative to the Russell 1000 Value Index; this is to be expected when a style-specific index posts a negative return.
We used currency forward contracts during the reporting period, and they had a large positive impact on the Fund’s performance relative to the Russell 1000 Value Index. This was mainly due to the strength of the US dollar compared to the foreign currencies in which the Fund’s non-US holdings were denominated. We used currency forward contracts for the purpose of hedging currency exposure of non-US-based companies held in the portfolio. Derivatives were used solely for the purpose of hedging and not for speculative purposes or leverage.
Equity markets experienced continued volatility during the reporting period based on political unrest in Eastern Europe, a sluggish Chinese economy and the effects on the global economy of falling oil prices. We believe that market volatility creates opportunities to invest in companies with attractive valuations and strong fundamentals. We believe that ultimately
those valuations and fundamentals will be reflected in those companies’ stock prices.
Thank you for your investment in Invesco V.I. Equity and Income Fund and for sharing our long-term investment horizon.
The views and opinions expressed in management’s discussion of Fund performance are those of Invesco Advisers, Inc. These views and opinions are subject to change at any time based on factors such as market and economic conditions. These views and opinions may not be relied upon as investment advice or recommendations, or as an offer for a particular security. The information is not a complete analysis of every aspect of any market, country, industry, security or the Fund. Statements of fact are from sources considered reliable, but Invesco Advisers, Inc. makes no representation or warranty as to their completeness or accuracy. Although historical performance is no guarantee of future results, these insights may help you understand our investment management philosophy.
See important Fund and, if applicable, index disclosures later in this report.
Thomas Bastian
Chartered Financial Analyst, Portfolio Manager, is lead manager of Invesco V.I. Equity and Income Fund. He joined Invesco in 2010. Mr. Bastian earned a BA in accounting from St. John’s University and an MBA in finance from University of Michigan.
Chuck Burge
Portfolio Manager, is manager of Invesco V.I. Equity and Income Fund. He joined Invesco in 2002. Mr. Burge earned a BS in economics from Texas A&M University and an MBA in finance and accounting from Rice University.
Brian Jurkash
Portfolio Manager, is manager of Invesco V.I. Equity and Income Fund. He joined Invesco in 2000. Mr. Jurkash earned a BBA degree in finance from Stephen F. Austin State University and an MBA in finance from the University of Houston.
Sergio Marcheli
Portfolio Manager, is manager of Invesco V.I. Equity and Income Fund. He joined Invesco in 2010. Mr. Marcheli earned a BBA from the University of Houston and an MBA from the University of St. Thomas.
James Roeder
Chartered Financial Analyst, Portfolio Manager, is manager of Invesco V.I. Equity and Income Fund. He joined Invesco in 2010. Mr. Roeder earned a BS in accounting from Clemson University and an MBA in economics and finance from the University of Chicago Booth School of Business.
Matthew Titus
Chartered Financial Analyst, Portfolio Manager, is manager of Invesco V.I. Equity and Income Fund. He joined the management team effective January 25, 2016, after the close of the reporting period. Mr. Titus joined Invesco in 2016. He earned a bachelor’s degree in accounting and economics from Luther College in Decorah, Iowa, and an MBA from Ohio State University.
Invesco V.I. Equity and Income Fund
Your Fund’s Long-Term Performance
Results of a $10,000 Investment – Oldest Share Class(es)
Fund and index data from 12/31/05
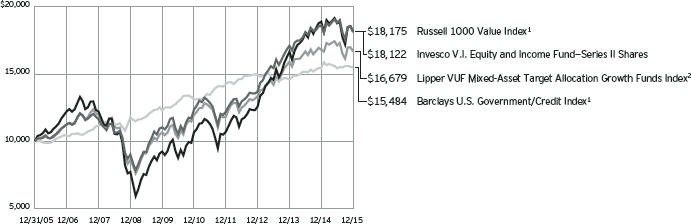
| 1 | Source: FactSet Research Systems Inc. |
Past performance cannot guarantee comparable future results.
During the reporting period, the the Lipper VUF Mixed-Asset Target Allocation
Growth Index became the Fund’s peer group index.
| | | | | |
| Average Annual Total Returns |
As of 12/31/15 | | | | | |
| |
| Series I Shares | | | | | |
| 10 Years | | | | 6.24 | % |
| 5 Years | | | | 8.19 | |
| 1 Year | | | | -2.29 | |
| |
| Series II Shares | | | | | |
| Inception (4/30/03) | | | | 7.65 | % |
| 10 Years | | | | 6.13 | |
| 5 Years | | | | 7.98 | |
| 1 Year | | | | -2.58 | |
Effective June 1, 2010, Class II shares of the predecessor fund, Universal Institutional Funds Equity and Income Portfolio, advised by Morgan Stanley Investment Management Inc. were reorganized into Series II shares of Invesco Van Kampen V.I. Equity and Income Fund (renamed Invesco V.I. Equity and Income Fund on April 29, 2013). Returns shown above for Series II shares are blended returns of the predecessor fund and Invesco V.I. Equity and Income Fund. Share class returns will differ from the predecessor fund because of different expenses.
Series I shares incepted on June 1, 2010. Series I shares performance shown prior to that date is that of the predecessor fund’s Class II shares and includes the 12b-1 fees applicable to the predecessor fund’s Class II shares.
The performance data quoted represent past performance and cannot guarantee comparable future results; current performance may be lower or higher. Please contact your variable product issuer or financial adviser for the most recent month-end variable product performance. Performance figures reflect Fund expenses, reinvested distributions and changes in net asset value. Investment return and principal value will fluctuate so that you may have a gain or loss when you sell shares.
The net annual Fund operating expense ratio set forth in the most recent Fund prospectus as of the date of this report for Series I and Series II shares was 0.67% and 0.92%, respectively.1 The total annual Fund operating expense ratio set forth in the most recent Fund prospectus as of the date of this report for Series I and Series II shares was 0.68% and 0.93%, respectively. The expense ratios presented above may vary from the expense ratios presented in other sections of this report that are based on expenses incurred during the period covered by this report.
Invesco V.I. Equity and Income Fund, a series portfolio of AIM Variable Insurance Funds (Invesco Variable Insurance Funds), is currently offered
through insurance companies issuing variable products. You cannot purchase shares of the Fund directly. Performance figures given represent the Fund and are not intended to reflect actual variable product values. They do not reflect sales charges, expenses and fees assessed in connection with a variable product. Sales charges, expenses and fees, which are determined by the variable product issuers, will vary and will lower the total return.
The most recent month-end performance at the Fund level, excluding variable product charges, is available at 800 451 4246. As mentioned above, for the most recent month-end performance including variable product charges, please contact your variable product issuer or financial adviser.
Fund performance reflects any applicable fee waivers and/or expense reimbursements. Had the adviser not waived fees and/or reimbursed expenses currently or in the past, returns would have been lower. See current prospectus for more information.
| 1 | Total annual Fund operating expenses after any contractual fee waivers and/or expense reimbursements by the adviser in effect through at least June 30, 2017. See current prospectus for more information. |
Invesco V.I. Equity and Income Fund
Invesco V.I. Equity and Income Fund’s investment objectives are both capital appreciation and current income.
| n | | Unless otherwise stated, information presented in this report is as of December 31, 2015, and is based on total net assets. |
| n | | Unless otherwise noted, all data provided by Invesco. |
| n | | To access your Fund’s reports/prospectus, visit invesco.com/fundreports. |
Principal risks of investing in the Fund
Call risk. If interest rates fall, it is possible that issuers of debt securities with high interest rates will prepay or call their securities before their maturity dates. In this event, the proceeds from the called securities would likely be reinvested by the Fund in securities bearing the new, lower interest rates, resulting in a possible decline in the Fund’s income and distributions to shareholders.
Changing fixed income market conditions risk. The current low interest rate environment was created in part by the Federal Reserve Board (FRB) and certain foreign central banks keeping the federal funds and equivalent foreign rates at or near zero. There is a risk that interest rates will rise when the FRB and central banks raise these rates. This risk is heightened due to the FRB’s quantitative easing program and the “tapering” of other similar foreign central bank actions. This eventual increase in the federal funds and equivalent foreign rates may expose fixed income markets to heightened volatility and reduced liquidity for certain fixed income investments, particularly those with longer maturities. In addition, decreases in fixed income dealer market-making capacity may also potentially lead to heightened volatility and reduced liquidity in the fixed income markets. As a result, the value of the Fund’s investments and share price may decline. Changes in central bank policies could also result in higher than normal shareholder redemptions, which could potentially increase portfolio turnover and the Fund’s transaction costs.
Convertible securities risk. The Fund may own convertible securities, the value of which may be affected by market interest rates, the risk that the issuer will default, the value of the underlying stock or the right of the issuer to buy back the convertible securities.
Credit risk. The issuer of instruments in which the Fund invests may be unable to meet interest and/or principal payments, thereby causing its instruments to decrease in value and lowering the issuer’s credit rating.
Depositary receipts risk. Depositary receipts involve many of the same risks as those associated with direct investment
in foreign securities. In addition, the underlying issuers of certain depositary receipts, particularly unsponsored or unregistered depositary receipts, are under no obligation to distribute shareholder communications to the holders of such receipts or to pass through to them any voting rights with respect to the deposited securities.
Derivatives risk. The value of a derivative instrument depends largely on (and is derived from) the value of an underlying security, currency, commodity, interest rate, index or other asset (each referred to as an underlying asset). In addition to risks relating to the underlying assets, the use of derivatives may include other, possibly greater, risks, including counterparty, leverage and liquidity risks. Counterparty risk is the risk that the counterparty to the derivative contract will default on its obligation to pay the Fund the amount owed or otherwise perform under the derivative contract. Derivatives create leverage risk because they do not require payment up front equal to the economic exposure created by owning the derivative. As a result, an adverse change in the value of the underlying asset could result in the Fund sustaining a loss that is substantially greater than the amount invested in the derivative, which may make the Fund’s returns more volatile and increase the risk of loss. Derivative instruments may also be less liquid than more traditional investments and the Fund may be unable to sell or close out its derivative positions at a desirable time or price. This risk may be more acute under adverse market conditions, during which the Fund may be most in need of liquidating its derivative positions. Derivatives may also be harder to value, less tax efficient and subject to changing government regulation that could impact the Fund’s ability to use certain derivatives or their cost. Also, derivatives used for hedging or to gain or limit exposure to a particular market segment may not provide the expected benefits, particularly during adverse market conditions.
Foreign securities risk. The Fund’s foreign investments may be affected by changes in a foreign country’s exchange rates, political and social instability, changes in economic or taxation policies, difficulties when enforcing obligations,
decreased liquidity, and increased volatility. Foreign companies may be subject to less regulation resulting in less publicly available information about the companies.
Income risk. The income you receive from the Fund is based primarily on prevailing interest rates, which can vary widely over the short- and long-term. If interest rates drop, your income from the Fund may drop as well.
Interest rate risk. Interest rate risk refers to the risk that bond prices generally fall as interest rates rise; conversely, bond prices generally rise as interest rates fall. Specific bonds differ in their sensitivity to changes in interest rates depending on their individual characteristics, including duration.
Management risk. The investment techniques and risk analysis used by the Fund’s portfolio managers may not produce the desired results.
Market risk. The prices of and the income generated by the Fund’s securities may decline in response to, among other things, investor sentiment, general economic and market conditions, regional or global instability, and currency and interest rate fluctuations.
Preferred securities risk. Preferred securities may include provisions that permit the issuer, in its discretion, to defer or omit distributions for a certain period of time. If the Fund owns a security that is deferring or omitting its distributions, the Fund may be required to report the distribution on its tax returns, even though it may not have received this income. Further, preferred securities may lose substantial value due to the omission or deferment of dividend payments.
Real estate investment trust (REIT)/real estate risk. Investments in real estate related instruments may be affected by economic, legal, cultural, environmental or technological factors that affect property values, rents or occupancies of real estate related to the Fund’s holdings. Shares of real estate related companies, which tend to be small- and mid-cap companies, may be more volatile and less liquid.
Small- and mid-capitalization risks. Stocks of small- and mid-sized companies tend to be more vulnerable to adverse developments and may have little or no operating history or track record of success,
Invesco V.I. Equity and Income Fund
and limited product lines, markets, management and financial resources. The securities of small- and mid-sized companies may be more volatile due to less market interest and less publicly available information about the issuer. They also may be illiquid or restricted as to resale, or may trade less frequently and in smaller volumes, all of which may cause difficulty when establishing or closing a position at a desirable price.
Value investing style risk. The Fund emphasizes a value style of investing, which focuses on undervalued companies with characteristics for improved valuations. This style of investing is subject to the risk that the valuations never improve or that the returns on value equity securities are less than returns on other styles of investing or the overall stock market. Value stocks also may decline in price, even though in theory they are already underpriced.
About indexes used in this report
The Barclays U.S. Government/Credit Index includes Treasuries and agencies that represent the government portion of the index, and includes publicly issued US corporate and foreign debentures and secured notes that meet specified maturity, liquidity and quality requirements.
The Russell 1000® Value Index is an unmanaged index considered representative of large-cap value stocks. The Russell 1000 Value Index is a trademark/service mark of the Frank Russell Co. Russell® is a trademark of the Frank Russell Co.
The Lipper VUF Mixed-Asset Target Allocation Growth Index is an unmanaged index considered representative of mixed-asset target allocation growth variable insurance underlying funds tracked by Lipper.
The Fund is not managed to track the performance of any particular index, including the index(es) described here, and consequently, the performance of the Fund may deviate significantly from the performance of the index(es).
A direct investment cannot be made in an index. Unless otherwise indicated, index results include reinvested dividends, and they do not reflect sales charges. Performance of the peer group, if applicable, reflects fund expenses; performance of a market index does not.
Other information
The returns shown in management’s discussion of Fund performance are based on net asset values calculated for shareholder transactions. Generally accepted accounting principles require adjustments to be made to the net assets of the Fund at period end for financial reporting purposes, and as such, the net asset values for shareholder transactions and the returns based on those net asset values may differ from the net asset values and returns reported in the Financial Highlights. Additionally, the returns and net asset values shown throughout this report are at the Fund level only and do not include variable product issuer charges. If such charges were included, the total returns would be lower.
Industry classifications used in this report are generally according to the Global Industry Classification Standard, which was developed by and is the exclusive property and a service mark of MSCI Inc. and Standard & Poor’s.
Invesco V.I. Equity and Income Fund
Schedule of Investments(a)
December 31, 2015
| | | | | | | | |
| | | Shares | | | Value | |
Common Stocks & Other Equity Interests–63.26% | |
| Aerospace & Defense–0.82% | |
General Dynamics Corp. | | | 73,358 | | | $ | 10,076,455 | |
|
| Agricultural Products–0.68% | |
Archer-Daniels-Midland Co. | | | 226,532 | | | | 8,309,194 | |
|
| Application Software–0.61% | |
Citrix Systems, Inc.(b) | | | 98,290 | | | | 7,435,638 | |
|
| Asset Management & Custody Banks–1.64% | |
Northern Trust Corp. | | | 120,524 | | | | 8,688,575 | |
State Street Corp. | | | 171,440 | | | | 11,376,758 | |
| | | | | | | | 20,065,333 | |
|
| Automobile Manufacturers–0.58% | |
General Motors Co. | | | 208,955 | | | | 7,106,559 | |
|
| Biotechnology–0.78% | |
Amgen Inc. | | | 47,420 | | | | 7,697,689 | |
Baxalta Inc. | | | 47,778 | | | | 1,864,775 | |
| | | | | | | | 9,562,464 | |
|
| Broadcasting–0.18% | |
CBS Corp.–Class B | | | 45,660 | | | | 2,151,956 | |
|
| Cable & Satellite–1.56% | |
Comcast Corp.–Class A | | | 197,231 | | | | 11,129,745 | |
Time Warner Cable Inc. | | | 43,062 | | | | 7,991,877 | |
| | | | | | | | 19,121,622 | |
|
| Communications Equipment–2.66% | |
Cisco Systems, Inc. | | | 469,720 | | | | 12,755,247 | |
Juniper Networks, Inc. | | | 357,487 | | | | 9,866,641 | |
QUALCOMM, Inc. | | | 199,595 | | | | 9,976,756 | |
| | | | | | | | 32,598,644 | |
|
| Construction Machinery & Heavy Trucks–0.46% | |
Caterpillar Inc. | | | 82,474 | | | | 5,604,933 | |
|
| Data Processing & Outsourced Services–0.70% | |
PayPal Holdings, Inc.(b) | | | 237,678 | | | | 8,603,944 | |
|
| Diversified Banks–8.65% | |
Bank of America Corp. | | | 1,385,286 | | | | 23,314,363 | |
Citigroup Inc. | | | 724,801 | | | | 37,508,452 | |
Comerica Inc. | | | 174,529 | | | | 7,300,548 | |
JPMorgan Chase & Co. | | | 574,457 | | | | 37,931,396 | |
| | | | | | | | 106,054,759 | |
|
| Electric Utilities–0.49% | |
FirstEnergy Corp. | | | 190,008 | | | | 6,028,954 | |
|
| Fertilizers & Agricultural Chemicals–0.41% | |
Mosaic Co. (The) | | | 183,082 | | | | 5,051,232 | |
| | | | | | | | |
| | | Shares | | | Value | |
| Food Distributors–0.53% | |
Sysco Corp. | | | 157,294 | | | $ | 6,449,054 | |
|
| General Merchandise Stores–1.15% | |
Target Corp. | | | 194,683 | | | | 14,135,933 | |
|
| Health Care Equipment–1.52% | |
Baxter International Inc. | | | 204,694 | | | | 7,809,076 | |
Medtronic PLC | | | 139,982 | | | | 10,767,415 | |
| | | | | | | | 18,576,491 | |
|
| Health Care Services–0.55% | |
Express Scripts Holding Co.(b) | | | 76,595 | | | | 6,695,169 | |
|
| Hotels, Resorts & Cruise Lines–1.28% | |
Carnival Corp. | | | 287,547 | | | | 15,665,561 | |
|
| Household Products–0.88% | |
Procter & Gamble Co. (The) | | | 135,594 | | | | 10,767,519 | |
|
| Hypermarkets & Super Centers–0.99% | |
Wal-Mart Stores, Inc. | | | 197,617 | | | | 12,113,922 | |
|
| Industrial Conglomerates–2.38% | |
General Electric Co. | | | 938,051 | | | | 29,220,289 | |
|
| Industrial Machinery–0.53% | |
Ingersoll-Rand PLC | | | 117,609 | | | | 6,502,602 | |
|
| Insurance Brokers–2.01% | |
Aon PLC | | | 89,341 | | | | 8,238,133 | |
Marsh & McLennan Cos., Inc. | | | 158,077 | | | | 8,765,370 | |
Willis Group Holdings PLC | | | 157,458 | | | | 7,647,735 | |
| | | | | | | | 24,651,238 | |
|
| Integrated Oil & Gas–3.00% | |
Exxon Mobil Corp. | | | 87,386 | | | | 6,811,738 | |
Occidental Petroleum Corp. | | | 113,002 | | | | 7,640,065 | |
Royal Dutch Shell PLC–Class A (United Kingdom) | | | 609,666 | | | | 13,696,601 | |
TOTAL S.A. (France) | | | 193,505 | | | | 8,617,910 | |
| | | | | | | | 36,766,314 | |
|
| Integrated Telecommunication Services–1.09% | |
Koninklijke KPN N.V. (Netherlands) | | | 584,219 | | | | 2,206,030 | |
Orange S.A. (France) | | | 130,599 | | | | 2,190,973 | |
Telecom Italia S.p.A. (Italy)(b) | | | 1,220,070 | | | | 1,537,798 | |
Telefónica, S.A. (Spain) | | | 95,993 | | | | 1,059,537 | |
Verizon Communications Inc. | | | 138,536 | | | | 6,403,134 | |
| | | | | | | | 13,397,472 | |
|
| Internet Software & Services–0.70% | |
eBay Inc.(b) | | | 312,667 | | | | 8,592,089 | |
|
| Investment Banking & Brokerage–2.96% | |
Charles Schwab Corp. (The) | | | 274,871 | | | | 9,051,502 | |
Goldman Sachs Group, Inc. (The) | | | 46,532 | | | | 8,386,462 | |
See accompanying Notes to Financial Statements which are an integral part of the financial statements.
Invesco V.I. Equity and Income Fund
| | | | | | | | |
| | | Shares | | | Value | |
| Investment Banking & Brokerage–(continued) | |
Morgan Stanley | | | 594,077 | | | $ | 18,897,590 | |
| | | | | | | | 36,335,554 | |
|
| IT Consulting & Other Services–0.37% | |
Amdocs Ltd. | | | 82,989 | | | | 4,528,710 | |
|
| Managed Health Care–0.95% | |
Anthem, Inc. | | | 43,700 | | | | 6,093,528 | |
UnitedHealth Group Inc. | | | 47,603 | | | | 5,600,017 | |
| | | | | | | | 11,693,545 | |
|
| Movies & Entertainment–0.47% | |
Time Warner Inc. | | | 89,689 | | | | 5,800,188 | |
|
| Multi-Utilities–0.50% | |
PG&E Corp. | | | 115,679 | | | | 6,152,966 | |
|
| Oil & Gas Equipment & Services–1.20% | |
Baker Hughes Inc. | | | 157,487 | | | | 7,268,025 | |
Weatherford International PLC(b) | | | 881,951 | | | | 7,399,569 | |
| | | | | | | | 14,667,594 | |
|
| Oil & Gas Exploration & Production–2.43% | |
Anadarko Petroleum Corp. | | | 69,939 | | | | 3,397,636 | |
Apache Corp. | | | 276,270 | | | | 12,285,727 | |
Canadian Natural Resources Ltd. (Canada) | | | 340,599 | | | | 7,436,262 | |
Devon Energy Corp. | | | 207,920 | | | | 6,653,440 | |
| | | | | | | | 29,773,065 | |
|
| Other Diversified Financial Services–0.82% | |
Voya Financial, Inc. | | | 272,268 | | | | 10,049,412 | |
|
| Packaged Foods & Meats–0.89% | |
Mondelez International, Inc.–Class A | | | 243,999 | | | | 10,940,915 | |
|
| Pharmaceuticals–4.90% | |
Eli Lilly and Co. | | | 111,412 | | | | 9,387,575 | |
Merck & Co., Inc. | | | 270,838 | | | | 14,305,663 | |
Novartis AG (Switzerland) | | | 116,646 | | | | 9,970,005 | |
Pfizer Inc. | | | 245,974 | | | | 7,940,041 | |
Sanofi (France) | | | 87,305 | | | | 7,457,467 | |
Teva Pharmaceutical Industries Ltd.–ADR (Israel) | | | 167,574 | | | | 10,999,557 | |
| | | | | | | | 60,060,308 | |
|
| Publishing–0.46% | |
Thomson Reuters Corp. | | | 148,004 | | | | 5,604,082 | |
|
| Railroads–0.59% | |
CSX Corp. | | | 277,380 | | | | 7,198,011 | |
|
| Regional Banks–4.17% | |
BB&T Corp. | | | 178,654 | | | | 6,754,908 | |
Citizens Financial Group Inc. | | | 567,806 | | | | 14,870,839 | |
Fifth Third Bancorp | | | 438,302 | | | | 8,809,870 | |
First Horizon National Corp. | | | 383,886 | | | | 5,574,025 | |
| | | | | | | | |
| | | Shares | | | Value | |
| Regional Banks–(continued) | |
PNC Financial Services Group, Inc. (The) | | | 158,222 | | | $ | 15,080,139 | |
| | | | | | | | 51,089,781 | |
|
| Security & Alarm Services–0.61% | |
Tyco International PLC | | | 234,685 | | | | 7,484,105 | |
|
| Semiconductor Equipment–0.71% | |
Applied Materials, Inc. | | | 463,411 | | | | 8,651,883 | |
|
| Semiconductors–0.87% | |
Intel Corp. | | | 308,030 | | | | 10,611,633 | |
|
| Specialized Finance–0.45% | |
CME Group Inc.–Class A | | | 60,647 | | | | 5,494,618 | |
|
| Systems Software–0.92% | |
Microsoft Corp. | | | 204,435 | | | | 11,342,054 | |
|
| Technology Hardware, Storage & Peripherals–0.60% | |
NetApp, Inc. | | | 279,352 | | | | 7,411,209 | |
|
| Tobacco–0.95% | |
Philip Morris International Inc. | | | 132,692 | | | | 11,664,954 | |
|
| Wireless Telecommunication Services–0.61% | |
Vodafone Group PLC–ADR (United Kingdom) | | | 232,193 | | | | 7,490,546 | |
Total Common Stocks & Other Equity Interests
(Cost $638,976,935) | | | | 775,350,473 | |
| | |
| | | Principal
Amount | | | | |
Bonds & Notes–22.23% | |
| Advertising–0.03% | |
Interpublic Group of Cos., Inc. (The), Sr. Unsec. Global Notes, 2.25%, 11/15/2017 | | $ | 370,000 | | | | 369,597 | |
|
| Aerospace & Defense–0.22% | |
BAE Systems Holdings Inc. (United Kingdom), Sr. Unsec. Gtd. Notes,
2.85%, 12/15/2020(c) | | | 288,000 | | | | 287,231 | |
Boeing Capital Corp., Sr. Unsec. Notes, 2.13%, 08/15/2016 | | | 670,000 | | | | 674,804 | |
L-3 Communications Corp., Sr. Unsec. Gtd. Global Notes, 3.95%, 05/28/2024 | | | 149,000 | | | | 141,763 | |
Lockheed Martin Corp., Sr. Unsec. Global Notes, 2.13%, 09/15/2016 | | | 1,005,000 | | | | 1,011,172 | |
Northrop Grumman Corp., Sr. Unsec. Global Notes, 3.85%, 04/15/2045 | | | 190,000 | | | | 169,278 | |
Precision Castparts Corp., Sr. Unsec. Global Notes, 2.50%, 01/15/2023 | | | 365,000 | | | | 352,726 | |
| | | | | | | | 2,636,974 | |
|
| Agricultural & Farm Machinery–0.10% | |
Deere & Co., Sr. Unsec. Notes, 2.60%, 06/08/2022 | | | 1,275,000 | | | | 1,257,501 | |
See accompanying Notes to Financial Statements which are an integral part of the financial statements.
Invesco V.I. Equity and Income Fund
| | | | | | | | |
| | | Principal
Amount | | | Value | |
| Agricultural Products–0.02% | |
Ingredion Inc., Sr. Unsec. Notes, 6.63%, 04/15/2037 | | $ | 255,000 | | | $ | 303,041 | |
|
| Air Freight & Logistics–0.11% | |
FedEx Corp.,
Sr. Unsec. Gtd. Bonds,
4.90%, 01/15/2034 | | | 440,000 | | | | 454,646 | |
Sr. Unsec. Gtd. Notes,
5.10%, 01/15/2044 | | | 910,000 | | | | 946,698 | |
| | | | | | | | 1,401,344 | |
|
| Airlines–0.21% | |
American Airlines Pass Through Trust, Series 2014-1, Class A, Sr. Sec. First Lien Pass Through Ctfs., 3.70%, 10/01/2026 | | | 423,821 | | | | 425,675 | |
Continental Airlines Pass Through Trust,
Series 2009-1, Sr. Sec.
First Lien Pass Through Ctfs., 9.00%, 07/08/2016 | | | 242,408 | | | | 250,559 | |
Series 2010-1, Class A, Sr. Sec. First Lien Pass Through Ctfs., 4.75%, 01/12/2021 | | | 241,942 | | | | 253,963 | |
Series 2012-1, Class A, Sr. Sec. First Lien Pass Through Ctfs., 4.15%, 04/11/2024 | | | 447,246 | | | | 461,223 | |
Delta Air Lines Pass Through Trust, Series 2010-1, Class A, Sr. Sec. First Lien Pass Through Ctfs., 6.20%, 07/02/2018 | | | 143,285 | | | | 153,226 | |
United Airlines Pass Through Trust, Series 2014-2, Class A, Sr. Sec. First Lien Pass Through Ctfs., 3.75%, 09/03/2026 | | | 545,000 | | | | 551,472 | |
Virgin Australia Pass Through Trust (Australia), Series 2013-1, Class A, Sec. Gtd. Pass Through Ctfs., 5.00%, 10/23/2023(c) | | | 510,689 | | | | 524,569 | |
| | | | | | | | 2,620,687 | |
|
| Apparel Retail–0.03% | |
Ross Stores, Inc., Sr. Unsec. Notes, 3.38%, 09/15/2024 | | | 358,000 | | | | 353,204 | |
|
| Apparel, Accessories & Luxury Goods–0.14% | |
Iconix Brand Group Inc.,
Sr. Unsec. Sub. Conv. Bonds,
1.50%, 03/15/2018 | | | 1,448,000 | | | | 716,760 | |
Sr. Unsec. Sub. Conv. Notes,
2.50%, 06/01/2016 | | | 1,086,000 | | | | 977,400 | |
| | | | | | | | 1,694,160 | |
|
| Application Software–0.50% | |
Citrix Systems, Inc., Sr. Unsec. Conv. Bonds, 0.50%, 04/15/2019 | | | 4,600,000 | | | | 5,025,500 | |
Nuance Communications, Inc., Sr. Unsec. Conv. Notes, 1.00%, 12/15/2022(c)(d) | | | 1,090,000 | | | | 1,053,894 | |
| | | | | | | | 6,079,394 | |
| | | | | | | | |
| | | Principal
Amount | | | Value | |
| Asset Management & Custody Banks–0.06% | |
Apollo Management Holdings L.P., Sr. Unsec. Gtd. Notes,
4.00%, 05/30/2024(c) | | $ | 425,000 | | | $ | 420,258 | |
KKR Group Finance Co. III LLC, Sr. Unsec. Gtd. Bonds,
5.13%, 06/01/2044(c) | | | 315,000 | | | | 309,861 | |
| | | | | | | | 730,119 | |
|
| Auto Parts & Equipment–0.15% | |
Johnson Controls, Inc., Sr. Unsec. Notes, 5.50%, 01/15/2016 | | | 1,885,000 | | | | 1,887,259 | |
|
| Automobile Manufacturers–0.27% | |
Daimler Finance North America LLC (Germany), Sr. Unsec. Gtd. Notes, 1.88%, 01/11/2018(c) | | | 555,000 | | | | 553,250 | |
Ford Motor Credit Co. LLC,
Sr. Unsec. Global Notes,
2.50%, 01/15/2016 | | | 2,030,000 | | | | 2,030,789 | |
4.13%, 08/04/2025 | | | 687,000 | | | | 686,121 | |
| | | | | | | | 3,270,160 | |
|
| Automotive Retail–0.09% | |
Advance Auto Parts, Inc., Sr. Unsec. Gtd. Notes,
4.50%, 12/01/2023 | | | 660,000 | | | | 675,179 | |
5.75%, 05/01/2020 | | | 399,000 | | | | 435,457 | |
| | | | | | | | 1,110,636 | |
|
| Biotechnology–0.59% | |
AbbVie Inc., Sr. Unsec. Global Notes,
4.50%, 05/14/2035 | | | 720,000 | | | | 707,571 | |
Amgen Inc., Sr. Unsec. Notes,
2.30%, 06/15/2016 | | | 735,000 | | | | 739,363 | |
BioMarin Pharmaceutical Inc., Sr. Unsec. Sub. Conv. Notes,
1.50%, 10/15/2020 | | | 2,182,000 | | | | 2,926,608 | |
Celgene Corp., Sr. Unsec. Global Notes, 4.00%, 08/15/2023 | | | 485,000 | | | | 499,261 | |
4.63%, 05/15/2044 | | | 1,390,000 | | | | 1,320,322 | |
5.00%, 08/15/2045 | | | 169,000 | | | | 170,411 | |
Gilead Sciences, Inc., Sr. Unsec. Global Notes,
3.05%, 12/01/2016 | | | 350,000 | | | | 356,018 | |
4.40%, 12/01/2021 | | | 492,000 | | | | 530,837 | |
| | | | | | | | 7,250,391 | |
|
| Brewers–0.07% | |
Anheuser-Busch InBev Worldwide Inc. (Belgium), Sr. Unsec. Gtd. Global Notes, 2.88%, 02/15/2016 | | | 870,000 | | | | 871,976 | |
|
| Broadcasting–0.49% | |
Liberty Media Corp., Sr. Unsec. Conv. Bonds, 1.38%, 10/15/2023 | | | 6,063,000 | | | | 5,968,266 | |
|
| Cable & Satellite–0.30% | |
CCO Safari II, LLC, Sr. Sec. Gtd. First Lien Notes, 4.46%, 07/23/2022(c) | | | 1,065,000 | | | | 1,064,905 | |
See accompanying Notes to Financial Statements which are an integral part of the financial statements.
Invesco V.I. Equity and Income Fund
| | | | | | | | |
| | | Principal
Amount | | | Value | |
| Cable & Satellite–(continued) | |
Comcast Corp.,
Sr. Unsec. Gtd. Global Notes,
4.25%, 01/15/2033 | | $ | 115,000 | | | $ | 114,921 | |
5.70%, 05/15/2018 | | | 445,000 | | | | 486,991 | |
Sr. Unsec. Gtd. Notes, 4.40%, 08/15/2035 | | | 720,000 | | | | 729,861 | |
6.45%, 03/15/2037 | | | 305,000 | | | | 379,147 | |
Cox Communications, Inc.,
Sr. Unsec. Notes,
4.70%, 12/15/2042(c) | | | 440,000 | | | | 337,798 | |
8.38%, 03/01/2039(c) | | | 80,000 | | | | 88,135 | |
NBCUniversal Media LLC, Sr. Unsec. Gtd. Global Notes, 5.15%, 04/30/2020 | | | 175,000 | | | | 195,658 | |
5.95%, 04/01/2041 | | | 215,000 | | | | 258,213 | |
| | | | | | | | 3,655,629 | |
|
| Catalog Retail–0.25% | |
Liberty Interactive LLC, Sr. Unsec. Conv. Global Deb., 0.75%, 03/30/2023(d) | | | 1,526,000 | | | | 2,302,352 | |
QVC, Inc., Sr. Sec. Gtd. First Lien Global Notes, 5.45%, 08/15/2034 | | | 880,000 | | | | 763,443 | |
| | | | | | | | 3,065,795 | |
|
| Commodity Chemicals–0.08% | |
Montell Finance Co. B.V. (Netherlands), Sr. Unsec. Gtd. Deb., 8.10%, 03/15/2027(c) | | | 745,000 | | | | 930,926 | |
|
| Communications Equipment–0.41% | |
Ciena Corp., Sr. Unsec. Conv. Notes,
4.00%, 12/15/2020(c) | | | 1,610,000 | | | | 2,099,037 | |
Viavi Solutions Inc., Sr. Unsec. Conv. Deb., 0.63%, 08/15/2018(d) | | | 3,098,000 | | | | 2,917,929 | |
| | | | | | | | 5,016,966 | |
|
| Consumer Finance–0.03% | |
American Express Co., Unsec. Sub. Global Notes, 3.63%, 12/05/2024 | | | 336,000 | | | | 333,338 | |
|
| Data Processing & Outsourced Services–0.21% | |
Visa Inc., Sr. Unsec. Global Notes,
3.15%, 12/14/2025 | | | 825,000 | | | | 828,140 | |
4.15%, 12/14/2035 | | | 670,000 | | | | 678,573 | |
4.30%, 12/14/2045 | | | 385,000 | | | | 391,805 | |
Xerox Corp., Sr. Unsec. Global Notes, 4.80%, 03/01/2035 | | | 714,000 | | | | 662,756 | |
| | | | | | | | 2,561,274 | |
|
| Diversified Banks–1.89% | |
Abbey National Treasury Services PLC (United Kingdom), Sr. Unsec. Gtd. Global Notes, 4.00%, 04/27/2016 | | | 2,180,000 | | | | 2,199,781 | |
ABN AMRO Bank N.V. (Netherlands), Sr. Unsec. Notes, 1.38%, 01/22/2016(c) | | | 1,955,000 | | | | 1,955,688 | |
| | | | | | | | |
| | | Principal
Amount | | | Value | |
| Diversified Banks–(continued) | |
Australia and New Zealand Banking Group Ltd. (Australia), Sr. Unsec. Global Notes, 0.90%, 02/12/2016 | | $ | 955,000 | | | $ | 954,898 | |
Bank of America Corp.,
Sr. Unsec. Global Notes,
5.75%, 12/01/2017 | | | 975,000 | | | | 1,044,056 | |
Sr. Unsec. Medium-Term Global Notes, 5.65%, 05/01/2018 | | | 350,000 | | | | 376,565 | |
Sr. Unsec. Medium-Term Notes, 1.25%, 01/11/2016 | | | 600,000 | | | | 600,049 | |
Barclays Bank PLC (United Kingdom), Series BKNT, Sr. Unsec. Global Notes, 6.75%, 05/22/2019 | | | 510,000 | | | | 582,831 | |
BBVA Bancomer S.A. (Mexico), Sr. Unsec. Notes, 4.38%, 04/10/2024(c) | | | 700,000 | | | | 695,165 | |
BNP Paribas S.A. (France), Unsec. Sub. Gtd. Medium-Term Notes, 4.25%, 10/15/2024 | | | 530,000 | | | | 525,945 | |
Citigroup Inc., Unsec. Sub. Global Notes,
5.30%, 05/06/2044 | | | 250,000 | | | | 260,673 | |
6.68%, 09/13/2043 | | | 815,000 | | | | 1,006,942 | |
Danske Bank A/S (Denmark), Sr. Unsec. Notes, 3.88%, 04/14/2016(c) | | | 565,000 | | | | 568,188 | |
HBOS PLC (United Kingdom), Unsec. Sub. Medium-Term Global Notes, 6.75%, 05/21/2018(c) | | | 325,000 | | | | 354,399 | |
HSBC Finance Corp., Sr. Unsec. Global Notes, 5.50%, 01/19/2016 | | | 1,655,000 | | | | 1,657,750 | |
JPMorgan Chase & Co.,
Sr. Unsec. Global Notes,
4.50%, 01/24/2022 | | | 80,000 | | | | 86,248 | |
Unsec. Sub. Global Notes, 4.25%, 10/01/2027 | | | 345,000 | | | | 343,557 | |
Series V, Jr. Unsec. Sub. Global Notes, 5.00%(e) | | | 640,000 | | | | 611,200 | |
Series X, Jr. Unsec. Sub. Global Notes, 6.10%(e) | | | 1,080,000 | | | | 1,093,500 | |
Series Z, Jr. Unsec. Sub. Global Notes, 5.30%(e) | | | 695,000 | | | | 695,869 | |
Lloyds Bank PLC (United Kingdom), Sr. Unsec. Gtd. Global Notes, 2.30%, 11/27/2018 | | | 550,000 | | | | 552,365 | |
Mizuho Financial Group Cayman 3 Ltd. (Japan), Unsec. Gtd. Sub. Notes, 4.60%, 03/27/2024(c) | | | 200,000 | | | | 205,854 | |
Societe Generale S.A. (France), Sr. Unsec. Bonds, 2.63%, 09/16/2020(c) | | | 890,000 | | | | 890,642 | |
Unsec. Sub. Notes, 5.00%, 01/17/2024(c) | | | 735,000 | | | | 742,977 | |
5.63%, 11/24/2045(c) | | | 680,000 | | | | 652,179 | |
Sumitomo Mitsui Banking Corp. (Japan), Sr. Unsec. Gtd. Medium-Term Global Notes, 2.65%, 07/23/2020 | | | 715,000 | | | | 716,882 | |
See accompanying Notes to Financial Statements which are an integral part of the financial statements.
Invesco V.I. Equity and Income Fund
| | | | | | | | |
| | | Principal
Amount | | | Value | |
| Diversified Banks–(continued) | |
Wells Fargo & Co.,
Sr. Unsec. Global Notes,
1.50%, 01/16/2018 | | $ | 180,000 | | | $ | 179,443 | |
Sr. Unsec. Medium-Term Notes, 3.55%, 09/29/2025 | | | 655,000 | | | | 661,158 | |
Sr. Unsec. Notes, 3.90%, 05/01/2045 | | | 1,415,000 | | | | 1,297,791 | |
Unsec. Sub. Medium-Term Notes, 4.10%, 06/03/2026 | | | 450,000 | | | | 456,088 | |
4.65%, 11/04/2044 | | | 1,200,000 | | | | 1,172,780 | |
| | | | | | | | 23,141,463 | |
|
| Diversified Capital Markets–0.06% | |
Credit Suisse AG (Switzerland), Unsec. Sub. Notes, 6.50%, 08/08/2023(c) | | | 686,000 | | | | 736,624 | |
|
| Diversified Chemicals–0.10% | |
Eastman Chemical Co., Sr. Unsec. Global Notes, 2.70%, 01/15/2020 | | | 795,000 | | | | 787,404 | |
Solvay Finance America LLC (Belgium), Sr. Unsec. Gtd. Notes, 4.45%, 12/03/2025(c) | | | 477,000 | | | | 471,898 | |
| | | | | | | | 1,259,302 | |
|
| Diversified Metals & Mining–0.05% | |
Rio Tinto Finance USA Ltd. (United Kingdom), Sr. Unsec. Gtd. Global Notes,
7.13%, 07/15/2028 | | | 200,000 | | | | 240,345 | |
9.00%, 05/01/2019 | | | 295,000 | | | | 345,451 | |
| | | | | | | | 585,796 | |
|
| Diversified Real Estate Activities–0.04% | |
Brookfield Asset Management Inc. (Canada), Sr. Unsec. Notes, 4.00%, 01/15/2025 | | | 460,000 | | | | 450,266 | |
|
| Diversified Support Services–0.03% | |
Cintas Corp. No. 2, Sr. Unsec. Gtd. Notes, 2.85%, 06/01/2016 | | | 380,000 | | | | 381,530 | |
|
| Drug Retail–0.19% | |
CVS Health Corp., Sr. Unsec. Global Bonds, 3.38%, 08/12/2024 | | | 375,000 | | | | 371,397 | |
CVS Pass Through Trust, Sr. Sec. First Lien Global Pass Through Ctfs., 6.04%, 12/10/2028 | | | 903,087 | | | | 996,265 | |
Walgreens Boots Alliance Inc., Sr. Unsec. Global Notes, 3.30%, 11/18/2021 | | | 602,000 | | | | 590,528 | |
4.50%, 11/18/2034 | | | 444,000 | | | | 406,614 | |
| | | | | | | | 2,364,804 | |
|
| Electric Utilities–0.26% | |
Electricite de France S.A. (France), Jr. Unsec. Sub. Notes, 5.63% (c)(e) | | | 965,000 | | | | 917,908 | |
Sr. Unsec. Notes, 4.60%, 01/27/2020(c) | | | 150,000 | | | | 161,854 | |
4.88%, 01/22/2044(c) | | | 930,000 | | | | 903,267 | |
| | | | | | | | |
| | | Principal
Amount | | | Value | |
| Electric Utilities–(continued) | |
Georgia Power Co., Sr. Unsec. Notes, 3.00%, 04/15/2016 | | $ | 875,000 | | | $ | 879,836 | |
Ohio Power Co., Series M, Sr. Unsec. Notes, 5.38%, 10/01/2021 | | | 200,000 | | | | 222,916 | |
PPL Electric Utilities Corp., Sr. Sec. First Mortgage Bonds, 6.25%, 05/15/2039 | | | 50,000 | | | | 63,708 | |
| | | | | | | | 3,149,489 | |
|
| Environmental & Facilities Services–0.04% | |
Waste Management, Inc., Sr. Unsec. Gtd. Global Notes, 3.90%, 03/01/2035 | | | 469,000 | | | | 440,249 | |
|
| Fertilizers & Agricultural Chemicals–0.02% | |
Monsanto Co., Sr. Unsec. Global Notes, 2.13%, 07/15/2019 | | | 305,000 | | | | 304,707 | |
|
| Food Retail–0.09% | |
Kraft Heinz Co. (The), Sr. Unsec. Gtd. Notes, 1.60%, 06/30/2017(c) | | | 1,080,000 | | | | 1,077,332 | |
|
| General Merchandise Stores–0.21% | |
Dollar General Corp., Sr. Unsec. Global Notes, 3.25%, 04/15/2023 | | | 365,000 | | | | 348,854 | |
Target Corp.,
Sr. Unsec. Global Notes, 2.90%, 01/15/2022 | | | 760,000 | | | | 772,420 | |
Sr. Unsec. Notes, 5.88%, 07/15/2016 | | | 1,440,000 | | | | 1,477,670 | |
| | | | | | | | 2,598,944 | |
|
| Gold–0.01% | |
Newmont Mining Corp., Sr. Unsec. Gtd. Global Notes, 3.50%, 03/15/2022 | | | 129,000 | | | | 115,200 | |
|
| Health Care Distributors–0.24% | |
McKesson Corp.,
Sr. Unsec. Global Notes, 2.28%, 03/15/2019 | | | 1,095,000 | | | | 1,092,994 | |
Sr. Unsec. Notes, 3.25%, 03/01/2016 | | | 1,820,000 | | | | 1,826,558 | |
| | | | | | | | 2,919,552 | |
|
| Health Care Equipment–0.74% | |
Becton, Dickinson and Co.,
Sr. Unsec. Global Bonds, 4.88%, 05/15/2044 | | | 750,000 | | | | 760,299 | |
Sr. Unsec. Global Notes, 1.75%, 11/08/2016 | | | 345,000 | | | | 346,896 | |
3.88%, 05/15/2024 | | | 685,000 | | | | 697,227 | |
Sr. Unsec. Notes, 2.68%, 12/15/2019 | | | 314,000 | | | | 316,126 | |
Edwards Lifesciences Corp.,
Sr. Unsec. Global Notes, 2.88%, 10/15/2018 | | | 731,000 | | | | 739,555 | |
See accompanying Notes to Financial Statements which are an integral part of the financial statements.
Invesco V.I. Equity and Income Fund
| | | | | | | | |
| | | Principal
Amount | | | Value | |
| Health Care Equipment–(continued) | |
Medtronic, Inc., Sr. Unsec. Gtd.
Global Notes, 3.15%, 03/15/2022 | | $ | 1,076,000 | | | $ | 1,089,114 | |
4.00%, 04/01/2043 | | | 525,000 | | | | 490,595 | |
4.38%, 03/15/2035 | | | 382,000 | | | | 386,915 | |
4.63%, 03/15/2044 | | | 525,000 | | | | 538,310 | |
NuVasive Inc., Sr. Unsec. Conv. Notes, 2.75%, 07/01/2017 | | | 1,104,000 | | | | 1,511,790 | |
Wright Medical Group, Inc., Sr. Unsec. Conv. Notes, 2.00%, 02/15/2020(c) | | | 2,063,000 | | | | 2,144,231 | |
| | | | | | | | 9,021,058 | |
|
| Health Care Facilities–0.49% | |
Brookdale Senior Living Inc.,
Sr. Unsec. Conv. Notes, 2.75%, 06/15/2018 | | | 2,241,000 | | | | 2,239,599 | |
HealthSouth Corp., Sr. Unsec. Sub. Conv. Notes, 2.00%, 12/01/2020(d) | | | 3,465,000 | | | | 3,750,863 | |
| | | | | | | | 5,990,462 | |
|
| Health Care REIT’s–0.12% | |
HCP, Inc., Sr. Unsec. Global Notes, 3.88%, 08/15/2024 | | | 505,000 | | | | 491,269 | |
4.20%, 03/01/2024 | | | 480,000 | | | | 478,500 | |
Ventas Realty L.P., Sr. Unsec. Gtd. Notes, 5.70%, 09/30/2043 | | | 215,000 | | | | 237,580 | |
Ventas Realty L.P./Ventas Capital Corp., Sr. Unsec. Gtd. Notes, 4.25%, 03/01/2022 | | | 200,000 | | | | 206,607 | |
| | | | | | | | 1,413,956 | |
|
| Health Care Services–0.25% | |
Express Scripts Holding Co.,
Sr. Unsec. Gtd. Global Notes, 2.25%, 06/15/2019 | | | 575,000 | | | | 571,347 | |
Sr. Unsec. Gtd. Notes, 3.13%, 05/15/2016 | | | 1,590,000 | | | | 1,600,842 | |
Laboratory Corp. of America Holdings, Sr. Unsec. Notes, 3.20%, 02/01/2022 | | | 602,000 | | | | 592,351 | |
4.70%, 02/01/2045 | | | 264,000 | | | | 242,258 | |
| | | | | | | | 3,006,798 | |
|
| Homebuilding–0.07% | |
MDC Holdings, Inc., Sr. Unsec. Gtd. Notes, 6.00%, 01/15/2043 | | | 1,050,000 | | | | 831,882 | |
|
| Hotels, Resorts & Cruise Lines–0.03% | |
Wyndham Worldwide Corp.,
Sr. Unsec. Notes, 2.95%, 03/01/2017 | | | 335,000 | | | | 337,231 | |
|
| Housewares & Specialties–0.10% | |
Tupperware Brands Corp., Sr. Unsec. Gtd. Global Notes, 4.75%, 06/01/2021 | | | 1,160,000 | | | | 1,185,254 | |
| | | | | | | | |
| | | Principal
Amount | | | Value | |
| Hypermarkets & Super Centers–0.04% | |
Wal-Mart Stores, Inc., Sr. Unsec.
Global Notes, 3.30%, 04/22/2024 | | $ | 360,000 | | | $ | 371,880 | |
6.50%, 08/15/2037 | | | 50,000 | | | | 64,537 | |
| | | | | | | | 436,417 | |
|
| Industrial Machinery–0.17% | |
Pentair Finance S.A. (United Kingdom), Sr. Unsec. Gtd. Global Notes, 5.00%, 05/15/2021 | | | 690,000 | | | | 719,969 | |
Valmont Industries, Inc., Sr. Unsec. Gtd. Global Notes, 5.00%, 10/01/2044 | | | 250,000 | | | | 217,291 | |
5.25%, 10/01/2054 | | | 1,321,000 | | | | 1,129,729 | |
| | | | | | | | 2,066,989 | |
|
| Insurance Brokers–0.03% | |
Marsh & McLennan Cos., Inc., Sr. Unsec. Global Notes, 4.05%, 10/15/2023 | | | 410,000 | | | | 426,066 | |
|
| Integrated Oil & Gas–0.30% | |
BP Capital Markets PLC (United Kingdom), Sr. Unsec. Gtd. Global Notes, 2.24%, 05/10/2019 | | | 552,000 | | | | 547,127 | |
Chevron Corp., Sr. Unsec. Global Notes,
1.37%, 03/02/2018 | | | 1,428,000 | | | | 1,416,697 | |
1.72%, 06/24/2018 | | | 520,000 | | | | 517,474 | |
Husky Energy Inc. (Canada), Sr. Unsec. Global Notes, 3.95%, 04/15/2022 | | | 300,000 | | | | 278,208 | |
Petroleos Mexicanos (Mexico), Sr. Unsec. Gtd. Global Notes, 4.88%, 01/24/2022 | | | 570,000 | | | | 551,021 | |
Suncor Energy Inc. (Canada), Sr. Unsec. Notes, 3.60%, 12/01/2024 | | | 334,000 | | | | 317,202 | |
| | | | | | | | 3,627,729 | |
|
| Integrated Telecommunication Services–0.52% | |
AT&T Inc., Sr. Unsec. Global Notes, 3.00%, 06/30/2022 | | | 520,000 | | | | 506,358 | |
3.40%, 05/15/2025 | | | 289,000 | | | | 278,300 | |
4.50%, 05/15/2035 | | | 463,000 | | | | 431,445 | |
5.35%, 09/01/2040 | | | 101,000 | | | | 100,232 | |
6.15%, 09/15/2034 | | | 140,000 | | | | 149,417 | |
British Telecommunications PLC (United Kingdom), Sr. Unsec. Global Notes, 1.25%, 02/14/2017 | | | 550,000 | | | | 547,492 | |
DIRECTV Holdings LLC/DIRECTV Financing Co., Inc., Sr. Unsec.
Gtd. Global Notes,
3.80%, 03/15/2022 | | | 330,000 | | | | 333,894 | |
5.15%, 03/15/2042 | | | 90,000 | | | | 84,162 | |
Telefonica Emisiones S.A.U. (Spain), Sr. Unsec. Gtd. Global Notes, 7.05%, 06/20/2036 | | | 360,000 | | | | 436,955 | |
See accompanying Notes to Financial Statements which are an integral part of the financial statements.
Invesco V.I. Equity and Income Fund
| | | | | | | | |
| | | Principal
Amount | | | Value | |
| Integrated Telecommunication Services–(continued) | |
Verizon Communications Inc., Sr. Unsec. Global Notes, 4.40%, 11/01/2034 | | $ | 325,000 | | | $ | 304,557 | |
4.52%, 09/15/2048 | | | 1,988,000 | | | | 1,786,921 | |
5.01%, 08/21/2054 | | | 694,000 | | | | 638,336 | |
5.15%, 09/15/2023 | | | 450,000 | | | | 494,412 | |
6.40%, 02/15/2038 | | | 300,000 | | | | 342,415 | |
| | | | | | | | 6,434,896 | |
|
| Investment Banking & Brokerage–1.51% | |
Goldman Sachs Group, Inc. (The), Sr. Unsec. Global Notes, 5.25%, 07/27/2021 | | | 400,000 | | | | 443,089 | |
Unsec. Sub. Notes, 4.25%, 10/21/2025 | | | 552,000 | | | | 549,127 | |
Series 0000, Sr. Unsec. Exchangeable Basket-Linked Conv. Medium-Term Notes, 1.00%, 03/15/2017(c)(f) | | | 3,328,000 | | | | 4,751,519 | |
1.00%, 09/28/2020(c)(g) | | | 6,230,000 | | | | 7,054,104 | |
Jefferies Group LLC, Sr. Unsec. Conv. Deb., 3.88%, 11/01/2017(d) | | | 3,060,000 | | | | 3,056,175 | |
Lazard Group LLC, Sr. Unsec. Global Notes, 3.75%, 02/13/2025 | | | 1,142,000 | | | | 1,055,556 | |
Morgan Stanley,
Sr. Unsec. Global Notes, 6.38%, 07/24/2042 | | | 705,000 | | | | 879,837 | |
Sr. Unsec. Medium-Term Global Notes,
4.00%, 07/23/2025 | | | 680,000 | | | | 702,077 | |
| | | | | | | | 18,491,484 | |
|
| IT Consulting & Other Services–0.04% | |
Computer Sciences Corp., Sr. Unsec. Global Notes, 4.45%, 09/15/2022 | | | 490,000 | | | | 503,821 | |
|
| Life & Health Insurance–0.08% | |
MetLife, Inc., Sr. Unsec. Global Notes, 4.60%, 05/13/2046 | | | 470,000 | | | | 475,714 | |
Prudential Financial, Inc.,
Sr. Unsec. Medium-Term Notes, 5.10%, 08/15/2043 | | | 410,000 | | | | 430,597 | |
Series D, Sr. Unsec. Medium-Term Notes, 6.63%, 12/01/2037 | | | 110,000 | | | | 135,549 | |
| | | | | | | | 1,041,860 | |
|
| Life Sciences Tools & Services–0.06% | |
Thermo Fisher Scientific Inc., Sr. Unsec. Global Notes, 2.25%, 08/15/2016 | | | 710,000 | | | | 714,029 | |
|
| Managed Health Care–0.05% | |
Aetna, Inc., Sr. Unsec. Global Notes, 3.95%, 09/01/2020 | | | 605,000 | | | | 637,479 | |
|
| Movies & Entertainment–0.12% | |
Live Nation Entertainment, Inc., Sr. Unsec. Conv. Bonds, 2.50%, 05/15/2019 | | | 1,130,000 | | | | 1,154,719 | |
| | | | | | | | |
| | | Principal
Amount | | | Value | |
| Movies & Entertainment–(continued) | |
Viacom Inc., Sr. Unsec. Global Deb., 4.85%, 12/15/2034 | | $ | 347,000 | | | $ | 284,286 | |
| | | | | | | | 1,439,005 | |
|
| Multi-Line Insurance–0.26% | |
American International Group, Inc., Sr. Unsec. Global Notes, 2.30%, 07/16/2019 | | | 385,000 | | | | 382,435 | |
4.38%, 01/15/2055 | | | 720,000 | | | | 623,267 | |
CNA Financial Corp.,
Sr. Unsec. Global Bonds, 5.88%, 08/15/2020 | | | 325,000 | | | | 362,725 | |
Sr. Unsec. Notes, 7.35%, 11/15/2019 | | | 25,000 | | | | 28,910 | |
Farmers Exchange Capital III, Unsec. Sub. Notes, 5.45%, 10/15/2054(c) | | | 930,000 | | | | 908,391 | |
Nationwide Financial Services Inc., Sr. Unsec. Notes, 5.30%, 11/18/2044(c) | | | 910,000 | | | | 914,554 | |
| | | | | | | | 3,220,282 | |
|
| Multi-Utilities–0.03% | |
Enable Midstream Partners, LP, Sr. Unsec. Gtd. Global Notes, 2.40%, 05/15/2019 | | | 440,000 | | | | 396,255 | |
Virginia Electric & Power Co., Sr. Unsec. Notes, 5.00%, 06/30/2019 | | | 15,000 | | | | 16,336 | |
| | | | | | | | 412,591 | |
|
| Office REIT’s–0.05% | |
Piedmont Operating Partnership L.P., Sr. Unsec. Gtd. Global Notes, 4.45%, 03/15/2024 | | | 605,000 | | | | 606,818 | |
|
| Office Services & Supplies–0.04% | |
Pitney Bowes Inc., Sr. Unsec. Global Notes, 4.63%, 03/15/2024 | | | 500,000 | | | | 492,600 | |
|
| Oil & Gas Drilling–0.05% | |
Noble Holding International Ltd., Sr. Unsec. Gtd. Global Notes, 2.50%, 03/15/2017 | | | 150,000 | | | | 142,252 | |
Rowan Cos., Inc., Sr. Unsec. Gtd. Notes,
5.40%, 12/01/2042 | | | 222,000 | | | | 133,269 | |
5.85%, 01/15/2044 | | | 467,000 | | | | 282,168 | |
| | | | | | | | 557,689 | |
|
| Oil & Gas Equipment & Services–0.07% | |
Helix Energy Solutions Group, Inc., Sr. Unsec. Conv. Notes, 3.25%, 03/15/2018(d) | | | 1,126,000 | | | | 893,059 | |
|
| Oil & Gas Exploration & Production–0.53% | |
Cobalt International Energy Inc., Sr. Unsec. Conv. Notes, 2.63%, 12/01/2019 | | | 1,902,000 | | | | 1,085,329 | |
ConocoPhillips Co., Sr. Unsec. Gtd. Global Notes,
2.88%, 11/15/2021 | | | 859,000 | | | | 835,420 | |
4.15%, 11/15/2034 | | | 921,000 | | | | 802,034 | |
See accompanying Notes to Financial Statements which are an integral part of the financial statements.
Invesco V.I. Equity and Income Fund
| | | | | | | | |
| | | Principal
Amount | | | Value | |
| Oil & Gas Exploration & Production–(continued) | |
Devon Energy Corp., Sr. Unsec. Global Notes,
2.25%, 12/15/2018 | | $ | 430,000 | | | $ | 396,404 | |
3.25%, 05/15/2022 | | | 167,000 | | | | 141,859 | |
Noble Energy, Inc., Sr. Unsec. Global Notes, 5.25%, 11/15/2043 | | | 830,000 | | | | 656,691 | |
Southwestern Energy Co., Sr. Unsec. Global Notes, 4.10%, 03/15/2022 | | | 555,000 | | | | 350,170 | |
Stone Energy Corp., Sr. Unsec. Gtd. Conv. Notes, 1.75%, 03/01/2017 | | | 3,053,000 | | | | 2,270,669 | |
| | | | | | | | 6,538,576 | |
|
| Oil & Gas Storage & Transportation–0.61% | |
Energy Transfer Partners, L.P., Sr. Unsec. Notes, 4.90%, 03/15/2035 | | | 357,000 | | | | 260,275 | |
Enterprise Products Operating LLC, Sr. Unsec. Gtd. Global Bonds, 6.45%, 09/01/2040 | | | 25,000 | | | | 23,827 | |
Sr. Unsec. Gtd. Global Notes, 5.25%, 01/31/2020 | | | 155,000 | | | | 162,935 | |
Sr. Unsec. Gtd. Notes, 2.55%, 10/15/2019 | | | 370,000 | | | | 354,831 | |
3.20%, 02/01/2016 | | | 2,150,000 | | | | 2,150,730 | |
Series N, Sr. Unsec. Gtd. Notes, 6.50%, 01/31/2019 | | | 245,000 | | | | 269,738 | |
Kinder Morgan Inc., Sr. Unsec. Gtd. Notes, 5.30%, 12/01/2034 | | | 422,000 | | | | 332,331 | |
Plains All American Pipeline L.P./ PAA Finance Corp., Sr. Unsec. Global Notes, 3.65%, 06/01/2022 | | | 355,000 | | | | 303,427 | |
Spectra Energy Capital LLC, Sr. Unsec. Gtd. Notes, 7.50%, 09/15/2038 | | | 120,000 | | | | 120,267 | |
Spectra Energy Partners, L.P., Sr. Unsec. Global Notes, 4.50%, 03/15/2045 | | | 536,000 | | | | 413,381 | |
Sr. Unsec. Notes, 2.95%, 06/15/2016 | | | 1,065,000 | | | | 1,069,750 | |
Sunoco Logistics Partners Operations L.P., Sr. Unsec. Gtd. Notes, 5.30%, 04/01/2044 | | | 645,000 | | | | 481,439 | |
5.50%, 02/15/2020 | | | 535,000 | | | | 555,377 | |
Texas Eastern Transmission L.P., Sr. Unsec. Notes, 7.00%, 07/15/2032 | | | 185,000 | | | | 203,694 | |
Western Gas Partners L.P., Sr. Unsec. Notes, 5.45%, 04/01/2044 | | | 600,000 | | | | 477,767 | |
Williams Partners L.P., Sr. Unsec. Global Notes,
5.10%, 09/15/2045 | | | 67,000 | | | | 44,228 | |
5.40%, 03/04/2044 | | | 447,000 | | | | 300,400 | |
| | | | | | | | 7,524,397 | |
|
| Other Diversified Financial Services–0.13% | |
Athene Global Funding, Sec. Notes, 2.88%, 10/23/2018(c) | | | 624,000 | | | | 614,155 | |
ERAC USA Finance LLC, Sr. Unsec. Gtd. Notes, 2.35%, 10/15/2019(c) | | | 935,000 | | | | 921,215 | |
| | | | | | | | 1,535,370 | |
| | | | | | | | |
| | | Principal
Amount | | | Value | |
| Packaged Foods & Meats–0.37% | |
ConAgra Foods, Inc., Sr. Unsec. Global Notes, 1.30%, 01/25/2016 | | $ | 600,000 | | | $ | 600,088 | |
General Mills Inc., Sr. Unsec. Global Notes,
0.88%, 01/29/2016 | | | 905,000 | | | | 904,921 | |
2.20%, 10/21/2019 | | | 850,000 | | | | 853,275 | |
Grupo Bimbo S.A.B. de C.V. (Mexico), Sr. Unsec. Gtd. Notes, 3.88%, 06/27/2024(c) | | | 765,000 | | | | 743,956 | |
Mead Johnson Nutrition Co., Sr. Unsec. Global Notes, 4.13%, 11/15/2025 | | | 64,000 | | | | 64,564 | |
Mondelez International, Inc., Sr. Unsec. Global Notes, 4.13%, 02/09/2016 | | | 1,200,000 | | | | 1,203,295 | |
Tyson Foods, Inc., Sr. Unsec. Gtd. Global Bonds, 4.88%, 08/15/2034 | | | 214,000 | | | | 218,985 | |
| | | | | | | | 4,589,084 | |
|
| Paper Packaging–0.10% | |
Packaging Corp. of America, Sr. Unsec. Global Notes, 4.50%, 11/01/2023 | | | 1,139,000 | | | | 1,192,833 | |
|
| Paper Products–0.02% | |
International Paper Co., Sr. Unsec. Global Notes, 6.00%, 11/15/2041 | | | 245,000 | | | | 257,056 | |
|
| Personal Products–0.10% | |
Unilever Capital Corp. (Netherlands), Sr. Unsec. Gtd. Global Notes, 2.75%, 02/10/2016 | | | 1,280,000 | | | | 1,282,693 | |
|
| Pharmaceuticals–1.09% | |
Actavis Funding SCS, Sr. Unsec. Gtd. Global Notes,
1.85%, 03/01/2017 | | | 909,000 | | | | 909,191 | |
4.85%, 06/15/2044 | | | 950,000 | | | | 943,018 | |
Allergan, Inc., Sr. Unsec. Gtd. Global Notes, 5.75%, 04/01/2016 | | | 905,000 | | | | 914,967 | |
Bayer US Finance LLC (Germany), Sr. Unsec. Gtd. Notes, 3.00%, 10/08/2021(c) | | | 590,000 | | | | 596,053 | |
GlaxoSmithKline Capital Inc. (United Kingdom), Sr. Unsec. Gtd. Global Bonds, 5.65%, 05/15/2018 | | | 75,000 | | | | 81,781 | |
6.38%, 05/15/2038 | | | 70,000 | | | | 89,475 | |
Jazz Investments I Ltd., Sr. Unsec. Gtd. Conv. Bonds, 1.88%, 08/15/2021 | | | 1,455,000 | | | | 1,529,569 | |
Merck & Co., Inc., Sr. Unsec. Global Notes, 0.70%, 05/18/2016 | | | 1,930,000 | | | | 1,930,249 | |
Merck Sharp & Dohme Corp., Sr. Unsec. Gtd. Global Notes, 5.00%, 06/30/2019 | | | 280,000 | | | | 308,939 | |
Perrigo Co. PLC, Sr. Unsec. Global Notes, 2.30%, 11/08/2018 | | | 405,000 | | | | 399,415 | |
Sanofi (France), Sr. Unsec. Global Notes, 2.63%, 03/29/2016 | | | 2,830,000 | | | | 2,841,890 | |
See accompanying Notes to Financial Statements which are an integral part of the financial statements.
Invesco V.I. Equity and Income Fund
| | | | | | | | |
| | | Principal
Amount | | | Value | |
| Pharmaceuticals–(continued) | |
Zoetis Inc., Sr. Unsec. Global Notes, 1.15%, 02/01/2016 | | $ | 2,545,000 | | | $ | 2,544,874 | |
4.70%, 02/01/2043 | | | 365,000 | | | | 321,062 | |
| | | | | | | | 13,410,483 | |
|
| Property & Casualty Insurance–0.27% | |
Liberty Mutual Group Inc., Sr. Unsec. Gtd. Bonds, 4.85%, 08/01/2044(c) | | | 730,000 | | | | 686,963 | |
Markel Corp., Sr. Unsec. Notes, 5.00%, 03/30/2043 | | | 385,000 | | | | 388,961 | |
Old Republic International Corp., Sr. Unsec. Conv. Notes, 3.75%, 03/15/2018 | | | 855,000 | | | | 1,086,919 | |
Travelers Cos., Inc. (The), Sr. Unsec. Global Notes, 4.60%, 08/01/2043 | | | 665,000 | | | | 701,406 | |
WR Berkley Corp., Sr. Unsec. Global Notes, 4.63%, 03/15/2022 | | | 420,000 | | | | 445,839 | |
| | | | | | | | 3,310,088 | |
|
| Railroads–0.33% | |
Burlington Northern Santa Fe, LLC, Sr. Unsec. Deb., 5.15%, 09/01/2043 | | | 1,990,000 | | | | 2,106,735 | |
Canadian National Railway Co. (Canada), Sr. Unsec. Notes, 5.80%, 06/01/2016 | | | 400,000 | | | | 408,055 | |
CSX Corp., Sr. Unsec. Notes, 5.50%, 04/15/2041 | | | 380,000 | | | | 420,123 | |
Union Pacific Corp.,
Sr. Unsec. Global Notes, 3.65%, 02/15/2024 | | | 101,000 | | | | 105,626 | |
Sr. Unsec. Notes, 4.15%, 01/15/2045 | | | 440,000 | | | | 435,187 | |
4.85%, 06/15/2044 | | | 570,000 | | | | 619,609 | |
| | | | | | | | 4,095,335 | |
|
| Regional Banks–0.61% | |
BB&T Corp., Series A, Sr. Unsec. Medium-Term Notes, 3.20%, 03/15/2016 | | | 815,000 | | | | 817,168 | |
Fifth Third Bancorp, Sr. Unsec. Notes, 3.63%, 01/25/2016 | | | 2,730,000 | | | | 2,734,308 | |
PNC Bank, N.A., Series BKNT, Sr. Unsec. Notes, 1.30%, 10/03/2016 | | | 1,610,000 | | | | 1,612,787 | |
SunTrust Banks, Inc., Sr. Unsec. Notes, 3.60%, 04/15/2016 | | | 2,310,000 | | | | 2,322,430 | |
| | | | | | | | 7,486,693 | |
|
| Reinsurance–0.07% | |
Reinsurance Group of America, Inc., Sr. Unsec. Medium-Term Notes, 4.70%, 09/15/2023 | | | 780,000 | | | | 824,802 | |
|
| Renewable Electricity–0.05% | |
Oglethorpe Power Corp., Sr. Sec. First Mortgage Bonds, 4.55%, 06/01/2044 | | | 581,000 | | | | 552,907 | |
| | | | | | | | |
| | | Principal
Amount | | | Value | |
| Research & Consulting Services–0.04% | |
Verisk Analytics, Inc., Sr. Unsec. Global Notes, 5.50%, 06/15/2045 | | $ | 505,000 | | | $ | 483,325 | |
|
| Semiconductor Equipment–0.40% | |
Lam Research Corp.,
Sr. Unsec. Global Notes, 3.80%, 03/15/2025 | | | 600,000 | | | | 569,285 | |
Series B, Sr. Unsec. Conv. Notes, 1.25%, 05/15/2018 | | | 3,026,000 | | | | 4,347,984 | |
| | | | | | | | 4,917,269 | |
|
| Semiconductors–1.26% | |
Microchip Technology Inc., Sr. Unsec. Sub. Conv. Notes, 1.63%, 02/15/2025(c) | | | 1,803,000 | | | | 1,800,746 | |
Micron Technology, Inc., Series G, Sr. Unsec. Conv. Global Bonds, 3.00%, 11/15/2028(d) | | | 3,601,000 | | | | 3,011,336 | |
NVIDIA Corp., Sr. Unsec. Conv. Bonds, 1.00%, 12/01/2018 | | | 4,339,000 | | | | 7,248,842 | |
ON Semiconductor Corp., Sr. Unsec. Gtd. Conv. Notes, 1.00%, 12/01/2020(c) | | | 3,620,000 | | | | 3,389,225 | |
| | | | | | | | 15,450,149 | |
|
| Soft Drinks–0.54% | |
Coca-Cola Co. (The), Sr. Unsec. Global Notes, 1.80%, 09/01/2016 | | | 1,735,000 | | | | 1,745,991 | |
Dr Pepper Snapple Group, Inc., Sr. Unsec. Gtd. Global Notes, 2.90%, 01/15/2016 | | | 1,585,000 | | | | 1,585,836 | |
PepsiCo, Inc.,
Sr. Unsec. Global Notes, 3.60%, 03/01/2024 | | | 659,000 | | | | 689,088 | |
Sr. Unsec. Notes, 2.50%, 05/10/2016 | | | 2,525,000 | | | | 2,540,952 | |
| | | | | | | | 6,561,867 | |
|
| Specialized Finance–0.38% | |
Air Lease Corp., Sr. Unsec. Global Notes,
2.63%, 09/04/2018 | | | 865,000 | | | | 857,475 | |
4.25%, 09/15/2024 | | | 430,000 | | | | 423,281 | |
Aviation Capital Group Corp., Sr. Unsec. Notes, 2.88%, 09/17/2018(c) | | | 745,000 | | | | 738,569 | |
4.88%, 10/01/2025(c) | | | 735,000 | | | | 734,363 | |
Intercontinental Exchange, Inc., Sr. Unsec. Gtd. Global Notes, 3.75%, 12/01/2025 | | | 675,000 | | | | 677,471 | |
Moody’s Corp., Sr. Unsec. Global Notes, 4.50%, 09/01/2022 | | | 935,000 | | | | 995,450 | |
National Rural Utilities Cooperative Finance Corp., Sr. Sec. Collateral Trust Bonds, 3.05%, 02/15/2022 | | | 195,000 | | | | 197,113 | |
| | | | | | | | 4,623,722 | |
See accompanying Notes to Financial Statements which are an integral part of the financial statements.
Invesco V.I. Equity and Income Fund
| | | | | | | | |
| | | Principal
Amount | | | Value | |
| Specialty Stores–0.06% | |
GNC Holdings, Inc., Sr. Unsec. Gtd. Conv. Notes, 1.50%, 08/15/2020(c) | | $ | 839,000 | | | $ | 675,919 | |
|
| Steel–0.04% | |
ArcelorMittal (Luxembourg),
Sr. Unsec. Global Bonds, 10.85%, 06/01/2019 | | | 446,000 | | | | 424,258 | |
Sr. Unsec. Global Notes, 6.13%, 06/01/2018 | | | 15,000 | | | | 13,706 | |
7.75%, 03/01/2041 | | | 115,000 | | | | 79,494 | |
| | | | | | | | 517,458 | |
|
| Systems Software–0.41% | |
FireEye, Inc.,
Series A, Sr. Unsec. Conv. Notes, 1.00%, 06/01/2020(c)(d) | | | 1,085,000 | | | | 928,353 | |
Series B, Sr. Unsec. Conv. Notes, 1.63%, 06/01/2022(c)(d) | | | 1,085,000 | | | | 875,460 | |
Microsoft Corp., Sr. Unsec. Global Notes, 3.50%, 02/12/2035 | | | 403,000 | | | | 372,404 | |
NetSuite Inc., Sr. Unsec. Conv. Notes, 0.25%, 06/01/2018 | | | 2,326,000 | | | | 2,302,740 | |
Oracle Corp., Sr. Unsec. Global Notes, 4.30%, 07/08/2034 | | | 600,000 | | | | 596,160 | |
| | | | | | | | 5,075,117 | |
|
| Technology Hardware, Storage & Peripherals–0.62% | |
Apple Inc., Sr. Unsec. Global Notes, 2.15%, 02/09/2022 | | | 716,000 | | | | 698,143 | |
Hewlett Packard Enterprise Co., Sr. Unsec. Gtd. Notes, 2.85%, 10/05/2018(c) | | | 1,385,000 | | | | 1,385,134 | |
6.20%, 10/15/2035(c) | | | 695,000 | | | | 671,456 | |
SanDisk Corp., Sr. Unsec. Conv. Bonds, 0.50%, 10/15/2020 | | | 3,936,000 | | | | 4,093,440 | |
Seagate HDD Cayman,
Sr. Unsec. Gtd. Global Bonds, 4.75%, 01/01/2025 | | | 325,000 | | | | 272,187 | |
Sr. Unsec. Gtd. Notes, 5.75%, 12/01/2034(c) | | | 702,000 | | | | 501,930 | |
| | | | | | | | 7,622,290 | |
|
| Thrifts & Mortgage Finance–0.88% | |
MGIC Investment Corp., Sr. Unsec. Conv. Notes,
2.00%, 04/01/2020 | | | 710,000 | | | | 990,450 | |
5.00%, 05/01/2017 | | | 6,201,000 | | | | 6,410,284 | |
Radian Group Inc., Sr. Unsec. Conv. Notes,
2.25%, 03/01/2019 | | | 412,000 | | | | 532,767 | |
3.00%, 11/15/2017 | | | 2,275,000 | | | | 2,859,391 | |
| | | | | | | | 10,792,892 | |
| | | | | | | | |
| | | Principal
Amount | | | Value | |
| Tobacco–0.24% | |
Philip Morris International Inc., Sr. Unsec. Global Bonds, 1.25%, 08/11/2017 | | $ | 214,000 | | | $ | 214,339 | |
Sr. Unsec. Global Notes, 2.50%, 05/16/2016 | | | 1,065,000 | | | | 1,071,513 | |
3.60%, 11/15/2023 | | | 405,000 | | | | 422,320 | |
4.88%, 11/15/2043 | | | 1,210,000 | | | | 1,280,460 | |
| | | | | | | | 2,988,632 | |
|
| Trucking–0.05% | |
Penske Truck Leasing Co., L.P./PTL Finance Corp., Sr. Unsec. Notes, 2.50%, 03/15/2016(c) | | | 670,000 | | | | 671,451 | |
|
| Wireless Telecommunication Services–0.22% | |
America Movil S.A.B. de C.V. (Mexico), Sr. Unsec. Global Notes, 4.38%, 07/16/2042 | | | 600,000 | | | | 538,379 | |
Sr. Unsec. Gtd. Global Notes, 2.38%, 09/08/2016 | | | 255,000 | | | | 256,671 | |
Crown Castle Towers LLC, Sr. Sec. Gtd. First Lien Notes, 4.88%, 08/15/2020(c) | | | 538,000 | | | | 575,692 | |
6.11%, 01/15/2020(c) | | | 770,000 | | | | 839,538 | |
Rogers Communications Inc. (Canada), Sr. Unsec. Gtd. Global Notes, 4.50%, 03/15/2043 | | | 585,000 | | | | 548,511 | |
| | | | | | | | 2,758,791 | |
Total Bonds & Notes
(Cost $269,167,697) | | | | 272,422,549 | |
|
U.S. Treasury Securities–8.02% | |
| U.S. Treasury Bills–0.01%(h) | |
0.24%, 05/26/2016(i) | | | 10,000 | | | | 9,984 | |
0.29%, 05/26/2016(i) | | | 135,000 | | | | 134,791 | |
| | | | | | | | 144,775 | |
|
| U.S. Treasury Notes–7.43% | |
2.25%, 03/31/2016 | | | 2,000,000 | | | | 2,009,087 | |
0.75%, 06/30/2017 | | | 9,000,000 | | | | 8,972,537 | |
0.88%, 11/30/2017 | | | 19,563,000 | | | | 19,509,816 | |
0.75%, 02/28/2018 | | | 6,200,000 | | | | 6,148,178 | |
1.25%, 12/15/2018 | | | 23,475,000 | | | | 23,429,849 | |
1.25%, 01/31/2019 | | | 8,000,000 | | | | 7,975,899 | |
3.63%, 08/15/2019 | | | 1,525,000 | | | | 1,637,439 | |
3.38%, 11/15/2019 | | | 300,000 | | | | 320,387 | |
3.63%, 02/15/2020 | | | 46,000 | | | | 49,627 | |
2.63%, 11/15/2020 | | | 600,000 | | | | 623,509 | |
1.63%, 11/30/2020 | | | 3,539,200 | | | | 3,519,152 | |
2.00%, 11/30/2022 | | | 1,063,000 | | | | 1,057,024 | |
2.25%, 11/15/2025 | | | 15,874,500 | | | | 15,835,817 | |
| | | | | | | | 91,088,321 | |
See accompanying Notes to Financial Statements which are an integral part of the financial statements.
Invesco V.I. Equity and Income Fund
| | | | | | | | |
| | | Principal
Amount | | | Value | |
| U.S. Treasury Bonds–0.58% | |
4.50%, 08/15/2039 | | $ | 40,000 | | | $ | 51,129 | |
4.38%, 05/15/2040 | | | 80,000 | | | | 100,558 | |
2.88%, 08/15/2045 | | | 7,099,200 | | | | 6,885,698 | |
| | | | | | | | 7,037,385 | |
Total U.S. Treasury Securities
(Cost $98,209,614) | | | | 98,270,481 | |
| | |
| | | Shares | | | | |
Preferred Stocks–0.88% | |
| Asset Management & Custody Banks–0.21% | |
AMG Capital Trust II, $2.58 Jr. Unsec. Gtd. Sub. Conv. Pfd. | | | 43,000 | | | | 2,424,125 | |
State Street Corp., Series D, 5.90% Pfd. | | | 5,468 | | | | 151,354 | |
| | | | | | | | 2,575,479 | |
|
| Diversified Banks–0.03% | |
Wells Fargo & Co., 5.85% Pfd. | | | 12,000 | | | | 313,440 | |
|
| Oil & Gas Storage & Transportation–0.31% | |
El Paso Energy Capital Trust I,
$2.38 Jr. Unsec. Gtd. Sub. Conv. Pfd. | | | 95,499 | | | | 3,867,710 | |
|
| Regional Banks–0.33% | |
KeyCorp, Series A, $7.75 Conv. Pfd. | | | 30,290 | | | | 4,016,454 | |
Total Preferred Stocks
(Cost $8,871,203) | | | | 10,773,083 | |
| | |
| | | Principal
Amount | | | | |
U.S. Government Sponsored Agency Securities–0.32% | |
| Federal Home Loan Mortgage Corp. (FHLMC)–0.32% | |
Unsec. Global Notes, 5.00%, 04/18/2017 | | $ | 1,500,000 | | | | 1,577,356 | |
5.50%, 08/23/2017 | | | 140,000 | | | | 150,046 | |
4.88%, 06/13/2018 | | | 1,000,000 | | | | 1,086,566 | |
6.75%, 03/15/2031 | | | 750,000 | | | | 1,077,102 | |
Total U.S. Government Sponsored Agency Securities (Cost $3,699,586) | | | | 3,891,070 | |
| | | | | | | | |
| | | Principal
Amount | | | Value | |
U.S. Government Sponsored Agency Mortgage-Backed Securities–0.00% | |
| Federal Home Loan Mortgage Corp. (FHLMC)–0.00% | |
Pass Through Ctfs., 6.50%, 02/01/2026 | | $ | 232 | | | $ | 264 | |
5.50%, 02/01/2037 | | | 63 | | | | 69 | |
| | | | | | | | 333 | |
|
| Federal National Mortgage Association (FNMA)–0.00% | |
Pass Through Ctfs., 6.00%, 01/01/2017 | | | 153 | | | | 155 | |
5.50%, 03/01/2021 | | | 141 | | | | 150 | |
8.00%, 08/01/2021 | | | 1,406 | | | | 1,465 | |
9.50%, 04/01/2030 | | | 3,956 | | | | 4,562 | |
| | | | | | | | 6,332 | |
Total U.S. Government Sponsored Agency Mortgage-Backed Securities (Cost $6,393) | | | | 6,665 | |
| | |
| | | Shares | | | | |
Money Market Funds–5.00% | |
Liquid Assets Portfolio–Institutional Class, 0.29%(j) | | | 30,665,862 | | | | 30,665,862 | |
Premier Portfolio–Institutional Class, 0.24%(j) | | | 30,665,862 | | | | 30,665,862 | |
Total Money Market Funds
(Cost $61,331,724) | | | | 61,331,724 | |
TOTAL INVESTMENTS–99.71%
(Cost $1,080,263,152) | | | | 1,222,046,045 | |
OTHER ASSETS LESS LIABILITIES–0.29% | | | | 3,502,710 | |
NET ASSETS–100.00% | | | $ | 1,225,548,755 | |
Investment Abbreviations:
| | |
| ADR | | – American Depositary Receipt |
| Conv. | | – Convertible |
| Ctfs. | | – Certificates |
| Deb. | | – Debentures |
| | |
| Gtd. | | – Guaranteed |
| Jr. | | – Junior |
| Pfd. | | – Preferred |
| REIT | | – Real Estate Investment Trust |
| | |
| Sec. | | – Secured |
| Sr. | | – Senior |
| Sub. | | – Subordinated |
| Unsec. | | – Unsecured |
Notes to Schedule of Investments:
| (a) | Industry and/or sector classifications used in this report are generally according to the Global Industry Classification Standard, which was developed by and is the exclusive property and a service mark of MSCI Inc. and Standard & Poor’s. |
| (b) | Non-income producing security. |
| (c) | Security purchased or received in a transaction exempt from registration under the Securities Act of 1933, as amended (the “1933 Act”). The security may be resold pursuant to an exemption from registration under the 1933 Act, typically to qualified institutional buyers. The aggregate value of these securities at December 31, 2015 was $51,126,816, which represented 4.17% of the Fund’s Net Assets. |
| (d) | Security has an irrevocable call by the issuer or mandatory put by the holder. Maturity date reflects such call or put. |
| (e) | Perpetual bond with no specified maturity date. |
| (f) | Exchangeable for a basket of four common stocks and one ordinary share. |
| (g) | Exchangeable for a basket of five common stocks. |
| (h) | Security traded on a discount basis. The interest rate shown represents the discount rate at the time of purchase by the Fund. |
| (i) | All or a portion of the value was pledged as collateral to cover margin requirements for open futures contracts. See Note 1K and Note 4. |
| (j) | The money market fund and the Fund are affiliated by having the same investment adviser. The rate shown is the 7-day SEC standardized yield as of December 31, 2015. |
See accompanying Notes to Financial Statements which are an integral part of the financial statements.
Invesco V.I. Equity and Income Fund
Statement of Assets and Liabilities
December 31, 2015
Statement of Operations
For the year ended December 31, 2015
| | | | |
Assets: | | | | |
Investments, at value (Cost $1,018,931,428) | | $ | 1,160,714,321 | |
Investments in affiliated money market funds, at value and cost | | | 61,331,724 | |
Total investments, at value (Cost $1,080,263,152) | | | 1,222,046,045 | |
Cash | | | 36,968 | |
Foreign currencies, at value (Cost $317,643) | | | 316,366 | |
Receivable for: | | | | |
Investments sold | | | 295,582 | |
Fund shares sold | | | 253,705 | |
Dividends and interest | | | 4,135,419 | |
Investment for trustee deferred compensation and retirement plans | | | 135,752 | |
Unrealized appreciation on forward foreign currency contracts outstanding | | | 623,951 | |
Total assets | | | 1,227,843,788 | |
| |
Liabilities: | | | | |
Payable for: | | | | |
Investments purchased | | | 262,283 | |
Fund shares reacquired | | | 357,607 | |
Variation margin — futures contracts | | | 20,469 | |
Accrued fees to affiliates | | | 1,461,023 | |
Accrued trustees’ and officers’ fees and benefits | | | 390 | |
Accrued other operating expenses | | | 38,593 | |
Trustee deferred compensation and retirement plans | | | 154,668 | |
Total liabilities | | | 2,295,033 | |
Net assets applicable to shares outstanding | | $ | 1,225,548,755 | |
| |
Net assets consist of: | | | | |
Shares of beneficial interest | | $ | 1,030,292,492 | |
Undistributed net investment income | | | 18,089,251 | |
Undistributed net realized gain | | | 34,754,581 | |
Net unrealized appreciation | | | 142,412,431 | |
| | | $ | 1,225,548,755 | |
| |
Net Assets: | | | | |
Series I | | $ | 96,287,258 | |
Series II | | $ | 1,129,261,497 | |
|
Shares outstanding, $0.001 par value per share,
with an unlimited number of shares authorized: | |
Series I | | | 5,933,346 | |
Series II | | | 69,869,982 | |
Series I: | | | | |
Net asset value per share | | $ | 16.23 | |
Series II: | | | | |
Net asset value per share | | $ | 16.16 | |
| | | | |
Investment income: | | | | |
Dividends (net of foreign withholding taxes of $528,436) | | $ | 19,898,701 | |
Dividends from affiliated money market funds | | | 73,092 | |
Interest | | | 9,249,817 | |
Total investment income | | | 29,221,610 | |
| |
Expenses: | | | | |
Advisory fees | | | 5,047,266 | |
Administrative services fees | | | 3,444,909 | |
Custodian fees | | | 61,925 | |
Distribution fees — Series II | | | 3,128,375 | |
Transfer agent fees | | | 34,121 | |
Trustees’ and officers’ fees and benefits | | | 41,965 | |
Other | | | 91,252 | |
Total expenses | | | 11,849,813 | |
Less: Fees waived | | | (131,138 | ) |
Net expenses | | | 11,718,675 | |
Net investment income | | | 17,502,935 | |
| |
Realized and unrealized gain (loss) from: | | | | |
Net realized gain (loss) from: | | | | |
Investment securities | | | 41,679,660 | |
Foreign currencies | | | (31,860 | ) |
Forward foreign currency contracts | | | 6,027,559 | |
Futures contracts | | | (229,954 | ) |
| | | | 47,445,405 | |
Change in net unrealized appreciation (depreciation) of: | | | | |
Investment securities | | | (100,174,695 | ) |
Foreign currencies | | | 4,183 | |
Forward foreign currency contracts | | | (877,239 | ) |
Futures contracts | | | 133,902 | |
| | | | (100,913,849 | ) |
Net realized and unrealized gain (loss) | | | (53,468,444 | ) |
Net increase (decrease) in net assets resulting from operations | | $ | (35,965,509 | ) |
See accompanying Notes to Financial Statements which are an integral part of the financial statements.
Invesco V.I. Equity and Income Fund
Statement of Changes in Net Assets
For the years ended December 31, 2015 and 2014
| | | | | | | | |
| | | 2015 | | | 2014 | |
Operations: | | | | | | | | |
Net investment income | | $ | 17,502,935 | | | $ | 22,445,326 | |
Net realized gain | | | 47,445,405 | | | | 121,129,530 | |
Change in net unrealized appreciation (depreciation) | | | (100,913,849 | ) | | | (32,934,416 | ) |
Net increase (decrease) in net assets resulting from operations | | | (35,965,509 | ) | | | 110,640,440 | |
| | |
Distributions to shareholders from net investment income: | | | | | | | | |
Series I | | | (2,355,976 | ) | | | (1,165,658 | ) |
Series ll | | | (27,649,010 | ) | | | (19,943,171 | ) |
Total distributions from net investment income | | | (30,004,986 | ) | | | (21,108,829 | ) |
| | |
Distributions to shareholders from net realized gains: | | | | | | | | |
Series l | | | (8,165,729 | ) | | | (3,150,794 | ) |
Series ll | | | (106,824,586 | ) | | | (61,507,641 | ) |
Total distributions from net realized gains | | | (114,990,315 | ) | | | (64,658,435 | ) |
| | |
Share transactions–net: | | | | | | | | |
Series l | | | 36,709,676 | | | | 11,041,950 | |
Series ll | | | 6,488,787 | | | | 23,062,524 | |
Net increase in net assets resulting from share transactions | | | 43,198,463 | | | | 34,104,474 | |
Net increase (decrease) in net assets | | | (137,762,347 | ) | | | 58,977,650 | |
| | |
Net assets: | | | | | | | | |
Beginning of year | | | 1,363,311,102 | | | | 1,304,333,452 | |
End of year (includes undistributed net investment income of $18,089,251 and $23,975,461, respectively) | | $ | 1,225,548,755 | | | $ | 1,363,311,102 | |
Notes to Financial Statements
December 31, 2015
NOTE 1—Significant Accounting Policies
Invesco V.I. Equity and Income Fund (the “Fund”) is a series portfolio of AIM Variable Insurance Funds (Invesco Variable Insurance Funds) (the “Trust”). The Trust is a Delaware statutory trust registered under the Investment Company Act of 1940, as amended (the “1940 Act”), as an open-end series management investment company consisting of twenty-four separate portfolios, (each constituting a “Fund”). The assets, liabilities and operations of each portfolio are accounted for separately. Information presented in these financial statements pertains only to the Fund. Matters affecting each Fund or class will be voted on exclusively by the shareholders of such Fund or class. Current Securities and Exchange Commission (“SEC”) guidance, however, requires participating insurance companies offering separate accounts to vote shares proportionally in accordance with the instructions of the contract owners whose investments are funded by shares of each Fund or class.
The Fund’s investment objectives are both capital appreciation and current income.
The Fund currently offers two classes of shares, Series I and Series II, both of which are offered to insurance company separate accounts funding variable annuity contracts and variable life insurance policies (“variable products”).
The following is a summary of the significant accounting policies followed by the Fund in the preparation of its financial statements.
| A. | Security Valuations — Securities, including restricted securities, are valued according to the following policy. |
Debt obligations (including convertible securities) and unlisted equities are fair valued using an evaluated quote provided by an independent pricing service. Evaluated quotes provided by the pricing service may be determined without exclusive reliance on quoted prices, and may reflect appropriate factors such as institution-size trading in similar groups of securities, developments related to specific securities, dividend rate (for unlisted equities), yield (for debt obligations), quality, type of issue, coupon rate (for debt obligations), maturity (for debt obligations), individual trading characteristics and other market data. Debt obligations are subject to interest rate and credit risks. In addition, all debt obligations involve some risk of default with respect to interest and/or principal payments.
A security listed or traded on an exchange (except convertible securities) is valued at its last sales price or official closing price as of the close of the customary trading session on the exchange where the security is principally traded, or lacking any sales or official closing price on a particular day, the security may be valued at the closing bid price on that day. Securities traded in the over-the-counter market are valued based on prices furnished by independent pricing services or market makers. When such securities are valued by an independent pricing service they may be considered fair valued. Futures contracts are valued at the final settlement price set by an exchange on which they are principally traded. Listed options are valued at the mean between the last bid and asked prices from the exchange on which they are principally traded. Options not listed on an exchange are valued by an independent source at the mean between the last bid and asked prices. For purposes of determining net asset value (“NAV”) per share, futures and option contracts generally are valued 15 minutes after the close of the customary trading session of the New York Stock Exchange (“NYSE”).
Invesco V.I. Equity and Income Fund
Investments in open-end and closed-end registered investment companies that do not trade on an exchange are valued at the end-of-day net asset value per share. Investments in open-end and closed-end registered investment companies that trade on an exchange are valued at the last sales price or official closing price as of the close of the customary trading session on the exchange where the security is principally traded.
Foreign securities’ (including foreign exchange contracts) prices are converted into U.S. dollar amounts using the applicable exchange rates as of the close of the NYSE. If market quotations are available and reliable for foreign exchange-traded equity securities, the securities will be valued at the market quotations. Because trading hours for certain foreign securities end before the close of the NYSE, closing market quotations may become unreliable. If between the time trading ends on a particular security and the close of the customary trading session on the NYSE, events occur that the Adviser determines are significant and make the closing price unreliable, the Fund may fair value the security. If the event is likely to have affected the closing price of the security, the security will be valued at fair value in good faith using procedures approved by the Board of Trustees. Adjustments to closing prices to reflect fair value may also be based on a screening process of an independent pricing service to indicate the degree of certainty, based on historical data, that the closing price in the principal market where a foreign security trades is not the current value as of the close of the NYSE. Foreign securities’ prices meeting the approved degree of certainty that the price is not reflective of current value will be priced at the indication of fair value from the independent pricing service. Multiple factors may be considered by the independent pricing service in determining adjustments to reflect fair value and may include information relating to sector indices, American Depositary Receipts and domestic and foreign index futures. Foreign securities may have additional risks including exchange rate changes, potential for sharply devalued currencies and high inflation, political and economic upheaval, the relative lack of issuer information, relatively low market liquidity and the potential lack of strict financial and accounting controls and standards.
Securities for which market prices are not provided by any of the above methods may be valued based upon quotes furnished by independent sources. The last bid price may be used to value equity securities. The mean between the last bid and asked prices is used to value debt obligations, including corporate loans.
Securities for which market quotations are not readily available or became unreliable are valued at fair value as determined in good faith by or under the supervision of the Trust’s officers following procedures approved by the Board of Trustees. Issuer specific events, market trends, bid/asked quotes of brokers and information providers and other market data may be reviewed in the course of making a good faith determination of a security’s fair value.
The Fund may invest in securities that are subject to interest rate risk, meaning the risk that the prices will generally fall as interest rates rise and, conversely, the prices will generally rise as interest rates fall. Specific securities differ in their sensitivity to changes in interest rates depending on their individual characteristics. Changes in interest rates may result in increased market volatility, which may affect the value and/or liquidity of certain Fund investments.
Valuations change in response to many factors including the historical and prospective earnings of the issuer, the value of the issuer’s assets, general economic conditions, interest rates, investor perceptions and market liquidity. Because of the inherent uncertainties of valuation, the values reflected in the financial statements may materially differ from the value received upon actual sale of those investments.
| B. | Securities Transactions and Investment Income — Securities transactions are accounted for on a trade date basis. Realized gains or losses on sales are computed on the basis of specific identification of the securities sold. Interest income (net of withholding tax, if any) is recorded on the accrual basis from settlement date. Paydown gains and losses on mortgage and asset-backed securities are recorded as adjustments to interest income. Dividend income (net of withholding tax, if any) is recorded on the ex-dividend date. Bond premiums and discounts are amortized and/or accreted for financial reporting purposes. |
The Fund may periodically participate in litigation related to Fund investments. As such, the Fund may receive proceeds from litigation settlements. Any proceeds received are included in the Statement of Operations as realized gain (loss) for investments no longer held and as unrealized gain (loss) for investments still held.
Brokerage commissions and mark ups are considered transaction costs and are recorded as an increase to the cost basis of securities purchased and/or a reduction of proceeds on a sale of securities. Such transaction costs are included in the determination of net realized and unrealized gain (loss) from investment securities reported in the Statement of Operations and the Statement of Changes in Net Assets and the net realized and unrealized gains (losses) on securities per share in the Financial Highlights. Transaction costs are included in the calculation of the Fund’s net asset value and, accordingly, they reduce the Fund’s total returns. These transaction costs are not considered operating expenses and are not reflected in net investment income reported in the Statement of Operations and the Statement of Changes in Net Assets, or the net investment income per share and the ratios of expenses and net investment income reported in the Financial Highlights, nor are they limited by any expense limitation arrangements between the Fund and the investment adviser.
The Fund allocates income and realized and unrealized capital gains and losses to a class based on the relative net assets of each class.
| C. | Country Determination — For the purposes of making investment selection decisions and presentation in the Schedule of Investments, the investment adviser may determine the country in which an issuer is located and/or credit risk exposure based on various factors. These factors include the laws of the country under which the issuer is organized, where the issuer maintains a principal office, the country in which the issuer derives 50% or more of its total revenues and the country that has the primary market for the issuer’s securities, as well as other criteria. Among the other criteria that may be evaluated for making this determination are the country in which the issuer maintains 50% or more of its assets, the type of security, financial guarantees and enhancements, the nature of the collateral and the sponsor organization. Country of issuer and/or credit risk exposure has been determined to be the United States of America, unless otherwise noted. |
| D. | Distributions — Distributions from net investment income and net realized capital gain, if any, are generally declared and paid to separate accounts of participating insurance companies annually and recorded on the ex-dividend date. |
| E. | Federal Income Taxes — The Fund intends to comply with the requirements of Subchapter M of the Internal Revenue Code of 1986, as amended (the “Internal Revenue Code”), necessary to qualify as a regulated investment company and to distribute substantially all of the Fund’s taxable earnings to shareholders. As such, the Fund will not be subject to federal income taxes on otherwise taxable income (including net realized capital gain) that is distributed to shareholders. Therefore, no provision for federal income taxes is recorded in the financial statements. |
The Fund recognizes the tax benefits of uncertain tax positions only when the position is more likely than not to be sustained. Management has analyzed the Fund’s uncertain tax positions and concluded that no liability for unrecognized tax benefits should be recorded related to uncertain
Invesco V.I. Equity and Income Fund
tax positions. Management is not aware of any tax positions for which it is reasonably possible that the total amounts of unrecognized tax benefits will change materially in the next 12 months.
The Fund files tax returns in the U.S. Federal jurisdiction and certain other jurisdictions. Generally, the Fund is subject to examinations by such taxing authorities for up to three years after the filing of the return for the tax period.
| F. | Expenses — Fees provided for under the Rule 12b-1 plan of a particular class of the Fund and which are directly attributable to that class are charged to the operations of such class. All other expenses are allocated among the classes based on relative net assets. |
| G. | Accounting Estimates — The preparation of financial statements in conformity with accounting principles generally accepted in the United States of America (“GAAP”) requires management to make estimates and assumptions that affect the reported amounts of assets and liabilities at the date of the financial statements and the reported amounts of revenues and expenses during the reporting period including estimates and assumptions related to taxation. Actual results could differ from those estimates by a significant amount. In addition, the Fund monitors for material events or transactions that may occur or become known after the period-end date and before the date the financial statements are released to print. |
| H. | Indemnifications — Under the Trust’s organizational documents, each Trustee, officer, employee or other agent of the Trust is indemnified against certain liabilities that may arise out of the performance of their duties to the Fund. Additionally, in the normal course of business, the Fund enters into contracts, including the Fund’s servicing agreements, that contain a variety of indemnification clauses. The Fund’s maximum exposure under these arrangements is unknown as this would involve future claims that may be made against the Fund that have not yet occurred. The risk of material loss as a result of such indemnification claims is considered remote. |
| I. | Foreign Currency Translations — Foreign currency is valued at the close of the NYSE based on quotations posted by banks and major currency dealers. Portfolio securities and other assets and liabilities denominated in foreign currencies are translated into U.S. dollar amounts at date of valuation. Purchases and sales of portfolio securities (net of foreign taxes withheld on disposition) and income items denominated in foreign currencies are translated into U.S. dollar amounts on the respective dates of such transactions. The Fund does not separately account for the portion of the results of operations resulting from changes in foreign exchange rates on investments and the fluctuations arising from changes in market prices of securities held. The combined results of changes in foreign exchange rates and the fluctuation of market prices on investments (net of estimated foreign tax withholding) are included with the net realized and unrealized gain or loss from investments in the Statement of Operations. Reported net realized foreign currency gains or losses arise from (1) sales of foreign currencies, (2) currency gains or losses realized between the trade and settlement dates on securities transactions, and (3) the difference between the amounts of dividends, interest, and foreign withholding taxes recorded on the Fund’s books and the U.S. dollar equivalent of the amounts actually received or paid. Net unrealized foreign currency gains and losses arise from changes in the fair values of assets and liabilities, other than investments in securities at fiscal period end, resulting from changes in exchange rates. |
The Fund may invest in foreign securities, which may be subject to foreign taxes on income, gains on investments or currency repatriation, a portion of which may be recoverable. Foreign taxes, if any, are recorded based on the tax regulations and rates that exist in the foreign markets in which the Fund invests and are shown in the Statement of Operations.
| J. | Forward Foreign Currency Contracts — The Fund may engage in foreign currency transactions either on a spot (i.e. for prompt delivery and settlement) basis, or through forward foreign currency contracts, to manage or minimize currency or exchange rate risk. |
The Fund may also enter into forward foreign currency contracts for the purchase or sale of a security denominated in a foreign currency in order to “lock in” the U.S. dollar price of that security, or the Fund may also enter into forward foreign currency contracts that do not provide for physical settlement of the two currencies, but instead are settled by a single cash payment calculated as the difference between the agreed upon exchange rate and the spot rate at settlement based upon an agreed upon notional amount (non-deliverable forwards). The Fund will set aside liquid assets in an amount equal to daily mark-to-market obligation for forward foreign currency contracts.
A forward foreign currency contract is an obligation between two parties (“Counterparties”) to purchase or sell a specific currency for an agreed-upon price at a future date. The use of forward foreign currency contracts does not eliminate fluctuations in the price of the underlying securities the Fund owns or intends to acquire but establishes a rate of exchange in advance. Fluctuations in the value of these contracts are measured by the difference in the contract date and reporting date exchange rates and are recorded as unrealized appreciation (depreciation) until the contracts are closed. When the contracts are closed, realized gains (losses) are recorded. Realized and unrealized gains (losses) on the contracts are included in the Statement of Operations. The primary risks associated with forward foreign currency contracts include failure of the Counterparty to meet the terms of the contract and the value of the foreign currency changing unfavorably. These risks may be in excess of the amounts reflected in the Statement of Assets and Liabilities.
| K. | Futures Contracts — The Fund may enter into futures contracts to manage exposure to interest rate, equity and market price movements and/or currency risks. A futures contract is an agreement between Counterparties to purchase or sell a specified underlying security, currency or commodity (or delivery of a cash settlement price, in the case of an index future) for a fixed price at a future date. The Fund currently invests only in exchange-traded futures and they are standardized as to maturity date and underlying financial instrument. Initial margin deposits required upon entering into futures contracts are satisfied by the segregation of specific securities or cash as collateral at the futures commission merchant (broker). During the period the futures contracts are open, changes in the value of the contracts are recognized as unrealized gains or losses by recalculating the value of the contracts on a daily basis. Subsequent or variation margin payments are received or made depending upon whether unrealized gains or losses are incurred. These amounts are reflected as receivables or payables on the Statement of Assets and Liabilities. When the contracts are closed or expire, the Fund recognizes a realized gain or loss equal to the difference between the proceeds from, or cost of, the closing transaction and the Fund’s basis in the contract. The net realized gain (loss) and the change in unrealized gain (loss) on futures contracts held during the period is included on the Statement of Operations. The primary risks associated with futures contracts are market risk and the absence of a liquid secondary market. If the Fund were unable to liquidate a futures contract and/or enter into an offsetting closing transaction, the Fund would continue to be subject to market risk with respect to the value of the contracts and continue to be required to maintain the margin deposits on the futures contracts. Futures contracts have minimal Counterparty risk since the exchange’s clearinghouse, as Counterparty to all exchange-traded futures, guarantees the futures against default. Risks may exceed amounts recognized in the Statement of Assets and Liabilities. |
Invesco V.I. Equity and Income Fund
| L. | Collateral — To the extent the Fund has designated or segregated a security as collateral and that security is subsequently sold, it is the Fund’s practice to replace such collateral no later than the next business day. |
NOTE 2—Advisory Fees and Other Fees Paid to Affiliates
The Trust has entered into a master investment advisory agreement with Invesco Advisers, Inc. (the “Adviser” or “Invesco”). Under the terms of the investment advisory agreement, the Fund pays an advisory fee to the Adviser based on the annual rate of the Fund’s average daily net assets as follows:
| | | | |
| Average Daily Net Assets | | Rate | |
First $150 million | | | 0.50% | |
Next $100 million | | | 0.45% | |
Next $100 million | | | 0.40% | |
Over $350 million | | | 0.35% | |
For the year ended December 31, 2015, the effective advisory fees incurred by the Fund was 0.38%.
Under the terms of a master sub-advisory agreement between the Adviser and each of Invesco Asset Management Deutschland GmbH, Invesco Asset Management Limited, Invesco Asset Management (Japan) Limited, Invesco Hong Kong Limited, Invesco Senior Secured Management, Inc. and Invesco Canada Ltd. (collectively, the “Affiliated Sub-Advisers”) the Adviser, not the Fund, may pay 40% of the fees paid to the Adviser to any such Affiliated Sub-Adviser(s) that provide(s) discretionary investment management services to the Fund based on the percentage of assets allocated to such Affiliated Sub-Adviser(s).
The Adviser has contractually agreed, through at least June 30, 2016, to waive advisory fees and/or reimburse expenses of all shares to the extent necessary to limit total annual fund operating expenses after fee waiver and/or expense reimbursement (excluding certain items discussed below) of Series I shares to 1.50% and Series II shares to 1.75% of average daily net assets. In determining the Adviser’s obligation to waive advisory fees and/or reimburse expenses, the following expenses are not taken into account, and could cause the total annual fund operating expenses after fee waiver and/or expense reimbursement to exceed the numbers reflected above: (1) interest; (2) taxes; (3) dividend expense on short sales; (4) extraordinary or non-routine items, including litigation expenses; and (5) expenses that the Fund has incurred but did not actually pay because of an expense offset arrangement. Unless Invesco continues the fee waiver agreement, it will terminate on June 30, 2016. The fee waiver agreement cannot be terminated during its term. The Adviser did not waive fees and/or reimburse expenses during the period under this expense limitation.
Further, the Adviser has contractually agreed, through at least June 30, 2017, to waive the advisory fee payable by the Fund in an amount equal to 100% of the net advisory fees the Adviser receives from the affiliated money market funds on investments by the Fund of uninvested cash in such affiliated money market funds.
For the year ended December 31, 2015, the Adviser waived advisory fees of $131,138.
The Trust has entered into a master administrative services agreement with Invesco pursuant to which the Fund has agreed to pay Invesco a fee for costs incurred in providing accounting services and fund administrative services to the Fund and to reimburse Invesco for administrative services fees paid to insurance companies that have agreed to provide services to the participants of separate accounts. These administrative services provided by the insurance companies may include, among other things: the printing of prospectuses, financial reports and proxy statements and the delivery of the same to existing participants; the maintenance of master accounts; the facilitation of purchases and redemptions requested by the participants; and the servicing of participants’ accounts. Pursuant to such agreement, for the year ended December 31, 2015, Invesco was paid $312,035 for accounting and fund administrative services and reimbursed $3,132,874 for services provided by insurance companies.
The Trust has entered into a transfer agency and service agreement with Invesco Investment Services, Inc. (“IIS”) pursuant to which the Fund has agreed to pay IIS a fee for providing transfer agency and shareholder services to the Fund and reimburse IIS for certain expenses incurred by IIS in the course of providing such services. For the year ended December 31, 2015, expenses incurred under the agreement are shown in the Statement of Operations as Transfer agent fees.
The Trust has entered into a master distribution agreement with Invesco Distributors, Inc. (“IDI”) to serve as the distributor for the Fund. The Trust has adopted a plan pursuant to Rule 12b-1 under the 1940 Act with respect to the Fund’s Series II shares (the “Plan”). The Fund, pursuant to the Plan, pays IDI compensation at the annual rate of 0.25% of the Fund’s average daily net assets of Series II shares. Of the Plan payments, up to 0.25% of the average daily net assets of the Series II shares may be paid to insurance companies who furnish continuing personal shareholder services to customers who purchase and own Series II shares of the Fund. For the year ended December 31, 2015, expenses incurred under the Plan are detailed in the Statement of Operations as Distribution fees.
For the year ended December 31, 2015, the Fund incurred $5,332 in brokerage commissions with Invesco Capital Markets, Inc., an affiliate of the Adviser and IDI, for portfolio transactions executed on behalf of the Fund.
Certain officers and trustees of the Trust are officers and directors of the Adviser, IIS and/or IDI.
Invesco V.I. Equity and Income Fund
NOTE 3—Additional Valuation Information
GAAP defines fair value as the price that would be received to sell an asset or paid to transfer a liability in an orderly transaction between market participants at the measurement date, under current market conditions. GAAP establishes a hierarchy that prioritizes the inputs to valuation methods, giving the highest priority to readily available unadjusted quoted prices in an active market for identical assets (Level 1) and the lowest priority to significant unobservable inputs (Level 3), generally when market prices are not readily available or are unreliable. Based on the valuation inputs, the securities or other investments are tiered into one of three levels. Changes in valuation methods may result in transfers in or out of an investment’s assigned level:
| | Level 1 — | Prices are determined using quoted prices in an active market for identical assets. |
| | Level 2 — | Prices are determined using other significant observable inputs. Observable inputs are inputs that other market participants may use in pricing a security. These may include quoted prices for similar securities, interest rates, prepayment speeds, credit risk, yield curves, loss severities, default rates, discount rates, volatilities and others. |
| | Level 3 — | Prices are determined using significant unobservable inputs. In situations where quoted prices or observable inputs are unavailable (for example, when there is little or no market activity for an investment at the end of the period), unobservable inputs may be used. Unobservable inputs reflect the Fund’s own assumptions about the factors market participants would use in determining fair value of the securities or instruments and would be based on the best available information. |
The following is a summary of the tiered valuation input levels, as of December 31, 2015. The level assigned to the securities valuations may not be an indication of the risk or liquidity associated with investing in those securities. Because of the inherent uncertainties of valuation, the values reflected in the financial statements may materially differ from the value received upon actual sale of those investments.
| | | | | | | | | | | | | | | | |
| | | Level 1 | | | Level 2 | | | Level 3 | | | Total | |
Equity Securities | | $ | 805,752,301 | | | $ | 41,702,979 | | | $ | — | | | $ | 847,455,280 | |
U.S. Treasury Securities | | | — | | | | 98,270,481 | | | | — | | | | 98,270,481 | |
U.S. Government Sponsored Agency Securities | | | — | | | | 3,897,735 | | | | — | | | | 3,897,735 | |
Corporate Debt Securities | | | — | | | | 272,422,549 | | | | — | | | | 272,422,549 | |
| | | | 805,752,301 | | | | 416,293,744 | | | | — | | | | 1,222,046,045 | |
Forward Foreign Currency Contracts* | | | — | | | | 623,951 | | | | — | | | | 623,951 | |
Futures Contracts* | | | 18,250 | | | | — | | | | — | | | | 18,250 | |
Total Investments | | $ | 805,770,551 | | | $ | 416,917,695 | | | $ | — | | | $ | 1,222,688,246 | |
| * | Unrealized appreciation. |
NOTE 4—Derivative Investments
Value of Derivative Investments at Period-End
The table below summarizes the value of the Fund’s derivative investments, detailed by primary risk exposure, held as of December 31, 2015:
| | | | | | | | |
| | | Value | |
| Risk Exposure/Derivative Type | | Assets | | | Liabilities | |
Currency risk: | | | | | | | | |
Forward foreign currency contracts(a) | | $ | 623,951 | | | $ | — | |
Interest rate risk: | | | | | | | | |
Futures contracts(b) | | | 21,464 | | | | (3,214 | ) |
Total | | $ | 645,415 | | | $ | (3,214 | ) |
| (a) | Values are disclosed on the Statement of Assets and Liabilities under the caption Unrealized appreciation on forward foreign currency contracts outstanding. |
| (b) | Includes cumulative appreciation (depreciation) of futures contracts. Only current day’s variation margin receivable (payable) is reported within the Statement of Assets and Liabilities. |
Effect of Derivative Investments for the year ended December 31, 2015
The table below summarizes the gains (losses) on derivative investments, detailed by primary risk exposure, recognized in earnings during the period:
| | | | | | | | |
| | | Location of Gain (Loss) on
Statement of Operations | |
| | | Forward Foreign
Currency Contracts | | | Futures
Contracts | |
Realized Gain (Loss): | | | | | | | | |
Currency risk | | $ | 6,027,559 | | | $ | — | |
Interest rate risk | | | — | | | | (229,954 | ) |
Change in Net Unrealized Appreciation (Depreciation): | | | | | | | | |
Currency risk | | | (877,239 | ) | | | — | |
Interest rate risk | | | — | | | | 133,902 | |
Total | | $ | 5,150,320 | | | $ | (96,052 | ) |
Invesco V.I. Equity and Income Fund
The table below summarizes the average notional value of forward foreign currency contracts and futures contracts outstanding during the period.
| | | | | | | | |
| | | Forward Foreign
Currency Contracts | | | Futures
Contracts | |
Average notional value | | $ | 81,944,082 | | | $ | 10,403,330 | |
| | | | | | | | | | | | | | | | | | | | | | | | | | |
| Open Forward Foreign Currency Contracts | |
Settlement Date | | Counterparty | | Contract to | | | Notional
Value | | | Unrealized
Appreciation | |
| | | Deliver | | | Receive | | | |
01/15/16 | | Bank of New York Mellon (The) | | | CAD | | | | 6,688,718 | | | | USD | | | | 4,921,595 | | | $ | 4,832,522 | | | $ | 89,073 | |
01/15/16 | | Bank of New York Mellon (The) | | | CHF | | | | 3,731,195 | | | | USD | | | | 3,767,628 | | | | 3,727,508 | | | | 40,120 | |
01/15/16 | | Bank of New York Mellon (The) | | | EUR | | | | 8,186,625 | | | | USD | | | | 8,928,579 | | | | 8,900,184 | | | | 28,395 | |
01/15/16 | | Bank of New York Mellon (The) | | | GBP | | | | 5,411,755 | | | | USD | | | | 8,121,745 | | | | 7,978,066 | | | | 143,679 | |
01/15/16 | | Bank of New York Mellon (The) | | | ILS | | | | 16,101,622 | | | | USD | | | | 4,144,988 | | | | 4,139,048 | | | | 5,940 | |
01/15/16 | | State Street Bank and Trust Co. | | | CAD | | | | 6,688,717 | | | | USD | | | | 4,920,598 | | | | 4,832,521 | | | | 88,077 | |
01/15/16 | | State Street Bank and Trust Co. | | | CHF | | | | 3,731,195 | | | | USD | | | | 3,768,389 | | | | 3,727,508 | | | | 40,881 | |
01/15/16 | | State Street Bank and Trust Co. | | | EUR | | | | 8,186,625 | | | | USD | | | | 8,931,158 | | | | 8,900,184 | | | | 30,974 | |
01/15/16 | | State Street Bank and Trust Co. | | | GBP | | | | 5,411,755 | | | | USD | | | | 8,124,451 | | | | 7,978,066 | | | | 146,385 | |
01/15/16 | | State Street Bank and Trust Co. | | | ILS | | | | 16,101,622 | | | | USD | | | | 4,149,475 | | | | 4,139,048 | | | | 10,427 | |
Total Open Forward Foreign Currency Contracts — Currency Risk | | | | | | | | | | | | | | | | | | | | | | $ | 623,951 | |
Currency Abbreviations:
| | |
| CAD | | – Canadian Dollar |
| CHF | | – Swiss Franc |
| | |
| EUR | | – Euro |
| GBP | | – British Pound Sterling |
| | |
| ILS | | – Israeli Shekel |
| USD | | – U.S. Dollar |
| | | | | | | | | | | | | | | | | | | | |
| Open Futures Contracts | |
| Futures Contracts | | Type of
Contract | | | Number of
Contracts | | | Expiration
Month | | | Notional Value | | | Unrealized
Appreciation
(Depreciation) | |
U.S. Treasury 5 Year Notes | | | Short | | | | 33 | | | | March-2016 | | | $ | (3,904,570 | ) | | $ | 11,272 | |
U.S. Treasury 10 Year Notes | | | Short | | | | 23 | | | | March-2016 | | | | (2,895,844 | ) | | | 10,192 | |
U.S. Treasury 30 Year Bonds | | | Short | | | | 18 | | | | March-2016 | | | | (2,767,500 | ) | | | (3,214 | ) |
Total Futures Contracts — Interest Rate Risk | | | | | | | | | | | | | | | | | | $ | 18,250 | |
Offsetting Assets and Liabilities
Accounting Standards Update (“ASU”) No. 2011-11, Disclosures about Offsetting Assets and Liabilities, which was subsequently clarified in Financial Accounting Standards Board ASU 2013-01 “Clarifying the Scope of Disclosures about Offsetting Assets and Liabilities” is intended to enhance disclosures about financial instruments and derivative instruments that are subject to offsetting arrangements on the Statement of Assets and Liabilities and to enable investors to better understand the effect of those arrangements on the Fund’s financial position. In order for an arrangement to be eligible for netting, the Fund must have a basis to conclude that such netting arrangements are legally enforceable. The Fund enters into netting agreements and collateral agreements in an attempt to reduce the Fund’s Counterparty credit risk by providing for a single net settlement with a Counterparty of all financial transactions covered by the agreement in an event of default as defined under such agreement.
The following tables present derivative instruments that are either subject to an enforceable netting agreement or offset by collateral arrangements as of December 31, 2015.
| | | | | | | | | | | | | | | | | | | | |
| Assets: | |
| | | Gross Amounts
of Recognized
Assets | | | Gross Amounts Not Offset in the
Statement of Assets and Liabilities | | | | |
| Counterparty | | | Financial
Instruments | | | Collateral Received | | | Net
Amount | |
| | | | Non-Cash | | | Cash | | |
Bank of New York Mellon (The) | | $ | 307,207 | | | $ | — | | | $ | — | | | $ | — | | | $ | 307,207 | |
State Street Bank and Trust Co. | | | 316,744 | | | | — | | | | — | | | | — | | | | 316,744 | |
Total | | $ | 623,951 | | | $ | — | | | $ | — | | | $ | — | | | $ | 623,951 | |
Invesco V.I. Equity and Income Fund
NOTE 5—Trustees’ and Officers’ Fees and Benefits
Trustees’ and Officers’ Fees and Benefits include amounts accrued by the Fund to pay remuneration to certain Trustees and Officers of the Fund. Trustees have the option to defer compensation payable by the Fund, and Trustees’ and Officers’ Fees and Benefits also include amounts accrued by the Fund to fund such deferred compensation amounts. Those Trustees who defer compensation have the option to select various Invesco Funds in which their deferral accounts shall be deemed to be invested. Finally, certain current Trustees were eligible to participate in a retirement plan that provided for benefits to be paid upon retirement to Trustees over a period of time based on the number of years of service. The Fund may have certain former Trustees who also participate in a retirement plan and receive benefits under such plan. Trustees’ and Officers’ Fees and Benefits include amounts accrued by the Fund to fund such retirement benefits. Obligations under the deferred compensation and retirement plans represent unsecured claims against the general assets of the Fund.
NOTE 6—Cash Balances
The Fund is permitted to temporarily carry a negative or overdrawn balance in its account with State Street Bank and Trust Company, the custodian bank. Such balances, if any at period end, are shown in the Statement of Assets and Liabilities under the payable caption Amount due custodian. To compensate the custodian bank for such overdrafts, the overdrawn Fund may either (1) leave funds as a compensating balance in the account so the custodian bank can be compensated by earning the additional interest; or (2) compensate by paying the custodian bank at a rate agreed upon by the custodian bank and Invesco, not to exceed the contractually agreed upon rate.
NOTE 7—Distributions to Shareholders and Tax Components of Net Assets
Tax Character of Distributions to Shareholders Paid During the Fiscal Years Ended December 31, 2015 and 2014:
| | | | | | | | |
| | | 2015 | | | 2014 | |
Ordinary income | | $ | 38,507,602 | | | $ | 21,108,829 | |
Long-term capital gain | | | 106,487,699 | | | | 64,658,435 | |
Total distributions | | $ | 144,995,301 | | | $ | 85,767,264 | |
Tax Components of Net Assets at Period-End:
| | | | |
| | | 2015 | |
Undistributed ordinary income | | $ | 22,576,561 | |
Undistributed long-term gain | | | 41,897,454 | |
Net unrealized appreciation — investments | | | 133,028,480 | |
Net unrealized appreciation (depreciation) — other investments | | | (12,663 | ) |
Temporary book/tax differences | | | (295,658 | ) |
Capital loss carryforward | | | (1,937,911 | ) |
Shares of beneficial interest | | | 1,030,292,492 | |
Total net assets | | $ | 1,225,548,755 | |
The difference between book-basis and tax-basis unrealized appreciation (depreciation) is due to differences in the timing of recognition of gains and losses on investments for tax and book purposes. The Fund’s net unrealized appreciation difference is attributable primarily to wash sales, book to tax accretion and amortization differences and contingent payment debt instruments.
The temporary book/tax differences are a result of timing differences between book and tax recognition of income and/or expenses. The Fund’s temporary book/tax differences are the result of the trustee deferral of compensation and retirement plan benefits.
Capital loss carryforward is calculated and reported as of a specific date. Results of transactions and other activity after that date may affect the amount of capital loss carryforward actually available for the Fund to utilize. Capital losses generated in years beginning after December 22, 2010 can be carried forward for an unlimited period, whereas previous losses expire in eight tax years. Capital losses with an expiration period may not be used to offset capital gains until all net capital losses without an expiration date have been utilized. Capital loss carryforwards with no expiration date will retain their character as either short-term or long-term capital losses instead of as short-term capital losses as under prior law. The ability to utilize capital loss carryforwards in the future may be limited under the Internal Revenue Code and related regulations based on the results of future transactions.
The Fund has a capital loss carryforward as of December 31, 2015, which expires as follows:
| | | | | | | | | | | | |
| Capital Loss Carryforward* | |
| Expiration | | Short-Term | | | Long-Term | | | Total | |
December 31, 2016 | | $ | 1,413,888 | | | $ | — | | | $ | 1,413,888 | |
December 31, 2017 | | | 524,023 | | | | — | | | | 524,023 | |
| | | $ | 1,937,911 | | | $ | — | | | $ | 1,937,911 | |
| * | Capital loss carryforward as of the date listed above is reduced for limitations, if any, to the extent required by the Internal Revenue Code and may be further limited depending upon a variety of factors, including the realization of net unrealized gains or losses as of the date of any reorganization. |
Invesco V.I. Equity and Income Fund
NOTE 8—Investment Securities
The aggregate amount of investment securities (other than short-term securities, U.S. Treasury obligations and money market funds, if any) purchased and sold by the Fund during the year ended December 31, 2015 was $347,592,910 and $381,878,421, respectively. During the same period, purchases and sales of U.S. Treasury obligations were $736,666,295 and $738,807,882, respectively. Cost of investments on a tax basis includes the adjustments for financial reporting purposes as of the most recently completed federal income tax reporting period-end.
| | | | |
| Unrealized Appreciation (Depreciation) of Investment Securities on a Tax Basis | |
Aggregate unrealized appreciation of investment securities | | $ | 185,139,837 | |
Aggregate unrealized (depreciation) of investment securities | | | (52,111,357 | ) |
Net unrealized appreciation of investment securities | | $ | 133,028,480 | |
Cost of investments for tax purposes is $1,089,017,565.
NOTE 9—Reclassification of Permanent Differences
Primarily as a result of differing book/tax treatment of bond premiums and contingent payment debt instruments, on December 31, 2015, undistributed net investment income was increased by $6,615,841 and undistributed net realized gain was decreased by $6,615,841. This reclassification had no effect on the net assets of the Fund.
NOTE 10—Share Information
| | | | | | | | | | | | | | | | |
| | | Summary of Share Activity | |
| | | Years ended December 31, | |
| | | 2015(a) | | | 2014 | |
| | | Shares | | | Amount | | | Shares | | | Amount | |
Sold: | | | | | | | | | | | | | | | | |
Series I | | | 2,393,497 | | | $ | 43,442,791 | | | | 1,020,293 | | | $ | 19,539,518 | |
Series II | | | 4,982,232 | | | | 91,088,229 | | | | 5,344,545 | | | | 100,231,484 | |
| | | | |
Issued as reinvestment of dividends: | | | | | | | | | | | | | | | | |
Series I | | | 666,352 | | | | 10,521,705 | | | | 232,944 | | | | 4,316,452 | |
Series II | | | 8,548,862 | | | | 134,473,596 | | | | 4,409,898 | | | | 81,450,812 | |
| | | | |
Reacquired: | | | | | | | | | | | | | | | | |
Series I | | | (949,803 | ) | | | (17,254,820 | ) | | | (673,937 | ) | | | (12,814,020 | ) |
Series II | | | (12,109,186 | ) | | | (219,073,038 | ) | | | (8,476,370 | ) | | | (158,619,772 | ) |
Net increase in share activity | | | 3,531,954 | | | $ | 43,198,463 | | | | 1,857,373 | | | $ | 34,104,474 | |
| (a) | There are entities that are record owners of more than 5% of the outstanding shares of the Fund and in the aggregate own 73% of the outstanding shares of the Fund. The Fund and the Fund’s principal underwriter or adviser, are parties to participation agreements with these entities whereby these entities sell units of interest in separate accounts funding variable products that are invested in the Fund. The Fund, Invesco and/or Invesco affiliates may make payments to these entities, which are considered to be related to the Fund, for providing services to the Fund, Invesco and/or Invesco affiliates including but not limited to services such as, securities brokerage, third party record keeping and account servicing and administrative services. The Fund has no knowledge as to whether all or any portion of the shares owned of record by these entities are also owned beneficially. |
Invesco V.I. Equity and Income Fund
NOTE 11—Financial Highlights
The following schedule presents financial highlights for a share of the Fund outstanding throughout the periods indicated.
| | | | | | | | | | | | | | | | | | | | | | | | | | | | | | | | | | | | | | | | | | | | | | | | | | | | | | | | |
| | | Net asset
value,
beginning
of period | | | Net
investment
income(a) | | | Net gains
(losses)
on securities
(both
realized and
unrealized) | | | Total from
investment
operations | | | Dividends
from net
investment
income | | | Distributions
from net
realized
gains | | | Total
distributions | | | Net asset
value, end
of period | | | Total
return(b) | | | Net assets,
end of period
(000’s omitted) | | | Ratio of
expenses
to average
net assets
with fee waivers
and/or expenses
absorbed | | | Ratio of
expenses
to average net
assets without
fee waivers
and/or expenses
absorbed | | | Ratio of net
investment
income
to average
net assets | | | Portfolio
turnover(c) | |
Series I | | | | | | | | | | | | | | | | | | | | | | | | | | | | | | | | | | | | | | | | | | | | | | | | | | | | | | | | |
Year ended 12/31/15 | | $ | 18.93 | | | $ | 0.28 | | | $ | (0.78 | ) | | $ | (0.50 | ) | | $ | (0.49 | ) | | $ | (1.71 | ) | | $ | (2.20 | ) | | $ | 16.23 | | | | (2.29 | )% | | $ | 96,287 | | | | 0.64 | %(d) | | | 0.65 | %(d) | | | 1.55 | %(d) | | | 87 | % |
Year ended 12/31/14 | | | 18.58 | | | | 0.37 | (e) | | | 1.28 | | | | 1.65 | | | | (0.35 | ) | | | (0.95 | ) | | | (1.30 | ) | | | 18.93 | | | | 9.03 | | | | 72,391 | | | | 0.66 | | | | 0.67 | | | | 1.92 | (e) | | | 85 | |
Year ended 12/31/13 | | | 15.08 | | | | 0.27 | | | | 3.51 | | | | 3.78 | | | | (0.28 | ) | | | — | | | | (0.28 | ) | | | 18.58 | | | | 25.18 | | | | 60,288 | | | | 0.66 | | | | 0.67 | | | | 1.59 | | | | 41 | |
Year ended 12/31/12 | | | 13.65 | | | | 0.28 | | | | 1.42 | | | | 1.70 | | | | (0.27 | ) | | | — | | | | (0.27 | ) | | | 15.08 | | | | 12.49 | | | | 53,990 | | | | 0.66 | | | | 0.67 | | | | 1.85 | | | | 31 | |
Year ended 12/31/11 | | | 14.06 | | | | 0.25 | | | | (0.41 | ) | | | (0.16 | ) | | | (0.25 | ) | | | — | | | | (0.25 | ) | | | 13.65 | | | | (1.19 | ) | | | 56,053 | | | | 0.66 | | | | 0.67 | | | | 1.83 | | | | 28 | |
Series II | | | | | | | | | | | | | | | | | | | | | | | | | | | | | | | | | | | | | | | | | | | | | | | | | | | | | | | | |
Year ended 12/31/15 | | | 18.86 | | | | 0.23 | | | | (0.78 | ) | | | (0.55 | ) | | | (0.44 | ) | | | (1.71 | ) | | | (2.15 | ) | | | 16.16 | | | | (2.58 | ) | | | 1,129,261 | | | | 0.89 | (d) | | | 0.90 | (d) | | | 1.30 | (d) | | | 87 | |
Year ended 12/31/14 | | | 18.52 | | | | 0.32 | (e) | | | 1.28 | | | | 1.60 | | | | (0.31 | ) | | | (0.95 | ) | | | (1.26 | ) | | | 18.86 | | | | 8.77 | | | | 1,290,920 | | | | 0.91 | | | | 0.92 | | | | 1.67 | (e) | | | 85 | |
Year ended 12/31/13 | | | 15.05 | | | | 0.23 | | | | 3.50 | | | | 3.73 | | | | (0.26 | ) | | | — | | | | (0.26 | ) | | | 18.52 | | | | 24.88 | | | | 1,244,045 | | | | 0.91 | | | | 0.92 | | | | 1.34 | | | | 41 | |
Year ended 12/31/12 | | | 13.63 | | | | 0.25 | | | | 1.44 | | | | 1.69 | | | | (0.27 | ) | | | — | | | | (0.27 | ) | | | 15.05 | | | | 12.39 | | | | 962,938 | | | | 0.81 | | | | 0.92 | | | | 1.70 | | | | 31 | |
Year ended 12/31/11 | | | 14.05 | | | | 0.25 | | | | (0.42 | ) | | | (0.17 | ) | | | (0.25 | ) | | | — | | | | (0.25 | ) | | | 13.63 | | | | (1.30 | ) | | | 864,716 | | | | 0.71 | | | | 0.92 | | | | 1.78 | | | | 28 | |
| (a) | Calculated using average shares outstanding. |
| (b) | Includes adjustments in accordance with accounting principles generally accepted in the United States of America and as such, the net asset value for financial reporting purposes and the returns based upon those net asset values may differ from the net asset value and returns for shareholder transactions. Total returns are not annualized for periods less than one year, if applicable and do not reflect charges assessed in connection with a variable product, which if included would reduce total returns. |
| (c) | Portfolio turnover is calculated at the fund level and is not annualized for periods less than one year, if applicable. For the year ended December 31, 2011, the portfolio turnover calculation excludes the value of securities purchased of $84,964,454 and sold of $24,142,395 in the effort to realign the Fund’s portfolio holdings after the reorganization of Invesco V.I. Basic Balanced Fund, Invesco V.I. Income Builder Fund and Invesco V.I. Select Dimensions Balanced Fund into the Fund. |
| (d) | Ratios are based on average daily net assets (000’s omitted) of $83,583 and $1,251,350 for Series I and Series II shares, respectively. |
| (e) | Net investment income per share and the ratio of net investment income to average net assets include significant dividends received during the period. Net investment income per share and the ratio of net investment income to average net assets excluding the significant dividends are $0.27 and 1.41% and $0.22 and 1.16% for Series I and Series II shares, respectively. |
Invesco V.I. Equity and Income Fund
Report of Independent Registered Public Accounting Firm
To the Board of Trustees of AIM Variable Insurance Funds (Invesco Variable Insurance Funds)
and Shareholders of Invesco V.I. Equity and Income Fund:
In our opinion, the accompanying statement of assets and liabilities, including the schedule of investments, and the related statements of operations and of changes in net assets and the financial highlights present fairly, in all material respects, the financial position of Invesco V.I. Equity and Income Fund (one of the funds constituting AIM Variable Insurance Funds (Invesco Variable Insurance Funds), hereafter referred to as the “Fund”) at December 31, 2015, the results of its operations for the year then ended, the changes in its net assets for each of the two years in the period then ended and the financial highlights for each of the five years in the period then ended, in conformity with accounting principles generally accepted in the United States of America. These financial statements and financial highlights (hereafter referred to as “financial statements”) are the responsibility of the Fund’s management. Our responsibility is to express an opinion on these financial statements based on our audits. We conducted our audits of these financial statements in accordance with the standards of the Public Company Accounting Oversight Board (United States). Those standards require that we plan and perform the audit to obtain reasonable assurance about whether the financial statements are free of material misstatement. An audit includes examining, on a test basis, evidence supporting the amounts and disclosures in the financial statements, assessing the accounting principles used and significant estimates made by management, and evaluating the overall financial statement presentation. We believe that our audits, which included confirmation of securities at December 31, 2015 by correspondence with the custodian and brokers, and the application of alternative auditing procedures where confirmations of security purchases have not been received, provide a reasonable basis for our opinion.
PRICEWATERHOUSECOOPERS LLP
Houston, Texas
February 15, 2016
Invesco V.I. Equity and Income Fund
Calculating your ongoing Fund expenses
Example
As a shareholder of the Fund, you incur ongoing costs, including management fees; distribution and/or service fees (12b-1); and other Fund expenses. This example is intended to help you understand your ongoing costs (in dollars) of investing in the Fund and to compare these costs with ongoing costs of investing in other mutual funds. The example is based on an investment of $1,000 invested at the beginning of the period and held for the entire period July 1, 2015 through December 31, 2015.
The actual and hypothetical expenses in the examples below do not represent the effect of any fees or other expenses assessed in connection with a variable product; if they did, the expenses shown would be higher while the ending account values shown would be lower.
Actual expenses
The table below provides information about actual account values and actual expenses. You may use the information in this table, together with the amount you invested, to estimate the expenses that you paid over the period. Simply divide your account value by $1,000 (for example, an $8,600 account value divided by $1,000 = 8.6), then multiply the result by the number in the table under the heading entitled “Actual Expenses Paid During Period” to estimate the expenses you paid on your account during this period.
Hypothetical example for comparison purposes
The table below also provides information about hypothetical account values and hypothetical expenses based on the Fund’s actual expense ratio and an assumed rate of return of 5% per year before expenses, which is not the Fund’s actual return.
The hypothetical account values and expenses may not be used to estimate the actual ending account balance or expenses you paid for the period. You may use this information to compare the ongoing costs of investing in the Fund and other funds. To do so, compare this 5% hypothetical example with the 5% hypothetical examples that appear in the shareholder reports of the other funds.
Please note that the expenses shown in the table are meant to highlight your ongoing costs. Therefore, the hypothetical information is useful in comparing ongoing costs, and will not help you determine the relative total costs of owning different funds.
| | | | | | | | | | | | | | | | | | | | | | | | |
| Class | | Beginning
Account Value
(07/01/15) | | | ACTUAL | | | HYPOTHETICAL (5% annual return before
expenses) | | | Annualized
Expense
Ratio | |
| | | Ending
Account Value
(12/31/15)1 | | | Expenses
Paid During
Period2 | | | Ending
Account Value
(12/31/15) | | | Expenses
Paid During
Period2 | | |
Series I | | $ | 1,000.00 | | | $ | 963.80 | | | $ | 3.17 | | | $ | 1,021.98 | | | $ | 3.26 | | | | 0.64 | % |
Series II | | | 1,000.00 | | | | 962.40 | | | | 4.40 | | | | 1,020.72 | | | | 4.53 | | | | 0.89 | |
| 1 | The actual ending account value is based on the actual total return of the Fund for the period July 1, 2015 through December 31, 2015, after actual expenses and will differ from the hypothetical ending account value which is based on the Fund’s expense ratio and a hypothetical annual return of 5% before expenses. |
| 2 | Expenses are equal to the Fund’s annualized expense ratio as indicated above multiplied by the average account value over the period, multiplied by 184/365 to reflect the most recent fiscal half year. |
Invesco V.I. Equity and Income Fund
Tax Information
Form 1099-DIV, Form 1042-S and other year–end tax information provide shareholders with actual calendar year amounts that should be included in their tax returns. Shareholders should consult their tax advisors.
The following distribution information is being provided as required by the Internal Revenue Code or to meet a specific state’s requirement.
The Fund designates the following amounts or, if subsequently determined to be different, the maximum amount allowable for its fiscal year ended December 31, 2015:
| | | | |
Federal and State Income Tax | | | |
Long-Term Capital Gain Distributions | | $ | 106,487,699 | |
Corporate Dividends Received Deduction* | | | 36.49 | % |
U.S. Treasury Obligations* | | | 4.57 | % |
| | * | The above percentages are based on ordinary income dividends paid to shareholders during the Fund’s fiscal year. |
Invesco V.I. Equity and Income Fund
Trustees and Officers
The address of each trustee and officer is AIM Variable Insurance Funds (Invesco Variable Insurance Funds) (the “Trust”), 11 Greenway Plaza, Suite 1000, Houston, Texas 77046-1173. The trustees serve for the life of the Trust, subject to their earlier death, incapacitation, resignation, retirement or removal as more specifically provided in the Trust’s organizational documents. Each officer serves for a one year term or until their successors are elected and qualified. Column two below includes length of time served with predecessor entities, if any.
| | | | | | | | |
Name, Year of Birth and
Position(s) Held with the Trust | | Trustee and/
or Officer Since | | Principal Occupation(s)
During Past 5 Years | | Number of Funds in Fund Complex Overseen by Trustee | | Other Directorship(s) Held by Trustee During Past 5 Years |
| Interested Persons | | | | | | | | |
| Martin L. Flanagan1 — 1960 Trustee | | 2007 | | Executive Director, Chief Executive Officer and President, Invesco Ltd. (ultimate parent of Invesco and a global investment management firm); Advisor to the Board, Invesco Advisers, Inc. (formerly known as Invesco Institutional (N.A.), Inc.); Trustee, The Invesco Funds; Vice Chair, Investment Company Institute; and Member of Executive Board, SMU Cox School of Business Formerly: Chairman and Chief Executive Officer, Invesco Advisers, Inc. (registered investment adviser); Director, Chairman, Chief Executive Officer and President, IVZ Inc. (holding company), INVESCO Group Services, Inc. (service provider) and Invesco North American Holdings, Inc. (holding company); Director, Chief Executive Officer and President, Invesco Holding Company Limited (parent of Invesco and a global investment management firm); Director, Invesco Ltd.; Chairman, Investment Company Institute and President, Co-Chief Executive Officer, Co-President, Chief Operating Officer and Chief Financial Officer, Franklin Resources, Inc. (global investment management organization) | | 146 | | None |
Philip A. Taylor2 — 1954 Trustee, President and Principal Executive Officer | | 2006 | | Head of North American Retail and Senior Managing Director, Invesco Ltd.; Director, Co-Chairman, Co-President and Co-Chief Executive Officer, Invesco Advisers, Inc. (formerly known as Invesco Institutional (N.A.), Inc.) (registered investment adviser); Director, Chairman, Chief Executive Officer and President, Invesco Management Group, Inc. (formerly known as Invesco Aim Management Group, Inc.) (financial services holding company); Director and Chairman, Invesco Investment Services, Inc. (formerly known as Invesco Aim Investment Services, Inc.) (registered transfer agent) Chief Executive Officer, Invesco Corporate Class Inc. (corporate mutual fund company) Director, Chairman and Chief Executive Officer, Invesco Canada Ltd. (formerly known as Invesco Trimark Ltd./Invesco Trimark Ltèe) (registered investment adviser and registered transfer agent); Trustee, President and Principal Executive Officer, The Invesco Funds (other than AIM Treasurer’s Series Trust (Invesco Treasurer’s Series Trust), Short-Term Investments Trust and Invesco Management Trust); Trustee and Executive Vice President, The Invesco Funds (AIM Treasurer’s Series Trust (Invesco Treasurer’s Series Trust), Short-Term Investments Trust and Invesco Management Trust only); Director, Invesco Investment Advisers LLC (formerly known as Van Kampen Asset Management); Director, Chief Executive Officer and President, Van Kampen Exchange Corp. Formerly: Director and President, INVESCO Funds Group, Inc. (registered investment adviser and registered transfer agent); Director and Chairman, IVZ Distributors, Inc. (formerly known as INVESCO Distributors, Inc.) (registered broker dealer); Director, President and Chairman, Invesco Inc. (holding company), Invesco Canada Holdings Inc. (holding company), Trimark Investments Ltd./Placements Trimark Ltèe and Invesco Financial Services Ltd/Services Financiers Invesco Ltèe; Chief Executive Officer, Invesco Canada Fund Inc (corporate mutual fund company); Director and Chairman, Van Kampen Investor Services Inc.; Director, Chief Executive Officer and President, 1371 Preferred Inc. (holding company) and Van Kampen Investments Inc.; Director and President, AIM GP Canada Inc. (general partner for limited partnerships) and Van Kampen Advisors, Inc.; Director and Chief Executive Officer, Invesco Trimark Dealer Inc. (registered broker dealer); Director, Invesco Distributors, Inc. (formerly known as Invesco Aim Distributors, Inc.) (registered broker dealer); Manager, Invesco PowerShares Capital Management LLC; Director, Chief Executive Officer and President, Invesco Advisers, Inc.; Director, Chairman, Chief Executive Officer and President, Invesco Aim Capital Management, Inc.; President, Invesco Trimark Dealer Inc. and Invesco Trimark Ltd./Invesco Trimark Ltèe; Director and President, AIM Trimark Corporate Class Inc. and AIM Trimark Canada Fund Inc.; Senior Managing Director, Invesco Holding Company Limited; Director and Chairman, Fund Management Company (former registered broker dealer); President and Principal Executive Officer, The Invesco Funds (AIM Treasurer’s Series Trust (Invesco Treasurer’s Series Trust), and Short-Term Investments Trust only); President, AIM Trimark Global Fund Inc. and AIM Trimark Canada Fund Inc | | 146 | | None |
| 1 | Mr. Flanagan is considered an interested person (within the meaning of Section 2(a)(19) of the 1940 Act) of the Trust because he is an officer of the Adviser to the Trust, and an officer and a director of Invesco Ltd., ultimate parent of the Adviser. |
| 2 | Mr. Taylor is considered an interested person (within the meaning of Section 2(a)(19) of the 1940 Act) of the Trust because he is an officer and a director of the Adviser. |
Invesco V.I. Equity and Income Fund
Trustees and Officers—(continued)
| | | | | | | | |
Name, Year of Birth and
Position(s) Held with the Trust | | Trustee and/
or Officer Since | | Principal Occupation(s)
During Past 5 Years | | Number of Funds in Fund Complex Overseen by Trustee | | Other Directorship(s)
Held by Trustee During Past 5 Years |
| Independent Trustees | | | | | | | | |
Bruce L. Crockett — 1944 Trustee and Chair | | 2003 | | Chairman, Crockett Technologies Associates (technology consulting company) Formerly: Director, Captaris (unified messaging provider); Director, President and Chief Executive Officer, COMSAT Corporation; Chairman, Board of Governors of INTELSAT (international communications company); ACE Limited (insurance company); Independent Directors Council and Investment Company Institute | | 146 | | ALPS (Attorneys Liability Protection Society) (insurance company) and Globe Specialty Metals, Inc. (metallurgical company) |
David C. Arch — 1945 Trustee | | 2010 | | Chairman of Blistex Inc., a consumer health care products manufacturer | | 146 | | Board member of the Illinois Manufacturers’ Association; Member of the Board of Visitors, Institute for the Humanities, University of Michigan |
James T. Bunch — 1942 Trustee | | 2000 | | Managing Member, Grumman Hill Group LLC (family office/private equity investments) Formerly: Chairman of the Board of Trustees, Evans Scholars Foundation and Chairman, Board of Governors, Western Golf Association | | 146 | | Trustee, Evans Scholars Foundation; and Chairman of the Board, Denver Film Society |
Albert R. Dowden — 1941 Trustee | | 2003 | | Director of a number of public and private business corporations, including the Boss Group, Ltd. (private investment and management); Nature’s Sunshine Products, Inc. and Reich & Tang Funds (5 portfolios) (registered investment company) Formerly: Director, Homeowners of America Holding Corporation/Homeowners of America Insurance Company (property casualty company); Director, Continental Energy Services, LLC (oil and gas pipeline service); Director, CompuDyne Corporation (provider of product and services to the public security market) and Director, Annuity and Life Re (Holdings), Ltd. (reinsurance company); Director, President and Chief Executive Officer, Volvo Group North America, Inc.; Senior Vice President, AB Volvo; Director of various public and private corporations; Chairman, DHJ Media, Inc.; Director, Magellan Insurance Company; and Director, The Hertz Corporation, Genmar Corporation (boat manufacturer), National Media Corporation; Advisory Board of Rotary Power International (designer, manufacturer, and seller of rotary power engines); and Chairman, Cortland Trust, Inc. (registered investment company) | | 146 | | Director of: Nature’s Sunshine Products, Inc., Reich & Tang Funds, Homeowners of America Holding Corporation/ Homeowners of America Insurance Company, the Boss Group |
Jack M. Fields — 1952 Trustee | | 2003 | | Chief Executive Officer, Twenty First Century Group, Inc. (government affairs company); Owner and Chief Executive Officer, Dos Angeles Ranch, L.P. (cattle, hunting, corporate entertainment); and Discovery Global Education Fund (non-profit) Formerly: Chief Executive Officer, Texana Timber LP (sustainable forestry company); Director of Cross Timbers Quail Research Ranch (non-profit); and member of the U.S. House of Representatives | | 146 | | Insperity, Inc. (formerly known as Administaff) |
Eli Jones — Trustee | | 2016 | | Professor and Dean, Mays Business School, Texas A&M University Formerly: Professor and Dean, Walton College of Business, University of Arkansas, and E.J. Ourso College of Business, Louisiana State University | | 146 | | Director, Insperity, Inc., (2011-present) and ARVEST Bank (2012-2015) |
Prema Mathai-Davis — 1950 Trustee | | 2003 | | Retired. Formerly: Chief Executive Officer, YWCA of the U.S.A. | | 146 | | None |
Larry Soll — 1942 Trustee | | 1997 | | Retired. Formerly: Chairman, Chief Executive Officer and President, Synergen Corp. (a biotechnology company) | | 146 | | None |
Robert C. Troccoli — Trustee | | 2016 | | Retired. Formerly: Senior Partner, KPMG LLP | | 146 | | None |
Raymond Stickel, Jr. — 1944 Trustee | | 2005 | | Retired. Formerly: Director, Mainstay VP Series Funds, Inc. (25 portfolios) and Partner, Deloitte & Touche | | 146 | | None |
Suzanne H. Woolsey — 1941 Trustee | | 2014 | | Chief Executive Officer of Woolsey Partners LLC | | 146 | | Emeritus Chair of the Board of Trustees of the Institute for Defense Analyses; Trustee of Colorado College; Trustee of California Institute of Technology; Prior to 2014, Director of Fluor Corp.; Prior to 2010, Trustee of the German Marshall Fund of the United States; Prior to 2010 Trustee of the Rocky Mountain Institute |
Invesco V.I. Equity and Income Fund
Trustees and Officers—(continued)
| | | | | | | | |
Name, Year of Birth and
Position(s) Held with the Trust | | Trustee and/
or Officer Since | | Principal Occupation(s)
During Past 5 Years | | Number of Funds in Fund Complex Overseen by Trustee | | Other Directorship(s)
Held by Trustee During Past 5 Years |
| Other Officers | | | | | | | | |
Russell C. Burk — 1958 Senior Vice President and Senior Officer | | 2005 | | Senior Vice President and Senior Officer, The Invesco Funds | | N/A | | N/A |
John M. Zerr — 1962 Senior Vice President, Chief Legal Officer and Secretary | | 2006 | | Director, Senior Vice President, Secretary and General Counsel, Invesco Management Group, Inc. (formerly known as Invesco Aim Management Group, Inc.) and Van Kampen Exchange Corp.; Senior Vice President, Invesco Advisers, Inc. (formerly known as Invesco Institutional (N.A.), Inc.) (registered investment adviser); Senior Vice President and Secretary, Invesco Distributors, Inc. (formerly known as Invesco Aim Distributors, Inc.); Director, Vice President and Secretary, Invesco Investment Services, Inc. (formerly known as Invesco Aim Investment Services, Inc.); Senior Vice President, Chief Legal Officer and Secretary, The Invesco Funds; Managing Director, Invesco PowerShares Capital Management LLC; Director, Secretary and General Counsel, Invesco Investment Advisers LLC (formerly known as Van Kampen Asset Management); Secretary and General Counsel, Invesco Capital Markets, Inc. (formerly known as Van Kampen Funds Inc.) and Chief Legal Officer, PowerShares Exchange-Traded Fund Trust, PowerShares Exchange-Traded Fund Trust II, PowerShares India Exchange-Traded Fund Trust, PowerShares Actively Managed Exchange-Traded Fund Trust, and PowerShares Actively Managed Exchange-Traded Commodity Fund Trust Formerly: Director, Vice President and Secretary, IVZ Distributors, Inc. (formerly known as INVESCO distributors, Inc.); Director and Vice President, INVESCO Funds Group, Inc.; Director and Vice President, Van Kampen Advisors Inc.; Director, Vice President, Secretary and General Counsel, Van Kampen Investor Services Inc.; Director, Invesco Distributors, Inc. (formerly known as Invesco Aim Distributors, Inc.); Director, Senior Vice President, General Counsel and Secretary, Invesco Aim Advisers, Inc. and Van Kampen Investments Inc.; Director, Vice President and Secretary, Fund Management Company; Director, Senior Vice President, Secretary, General Counsel and Vice President, Invesco Aim Capital Management, Inc.; Chief Operating Officer and General Counsel, Liberty Ridge Capital, Inc. (an investment adviser); Vice President and Secretary, PBHG Funds (an investment company) and PBHG Insurance Series Fund (an investment company); Chief Operating Officer, General Counsel and Secretary, Old Mutual Investment Partners (a broker-dealer); General Counsel and Secretary, Old Mutual Fund Services (an administrator) and Old Mutual Shareholder Services (a shareholder servicing center); Executive Vice President, General Counsel and Secretary, Old Mutual Capital, Inc. (an investment adviser); and Vice President and Secretary, Old Mutual Advisors Funds (an investment company) | | N/A | | N/A |
Sheri Morris — 1964 Vice President, Treasurer and Principal Financial Officer | | 2003 | | Vice President, Treasurer and Principal Financial Officer, The Invesco Funds; Vice President, Invesco Advisers, Inc. (formerly known as Invesco Institutional (N.A.), Inc.) (registered investment adviser); and Vice President, PowerShares Exchange-Traded Fund Trust, PowerShares Exchange-Traded Fund Trust II, PowerShares India Exchange-Traded Fund Trust, PowerShares Actively Managed Exchange-Traded Fund Trust, and PowerShares Actively Managed Exchange-Traded Commodity Fund Trust Formerly: Vice President, Invesco Aim Advisers, Inc., Invesco Aim Capital Management, Inc. and Invesco Aim Private Asset Management, Inc.; Assistant Vice President and Assistant Treasurer, The Invesco Funds and Assistant Vice President, Invesco Advisers, Inc., Invesco Aim Capital Management, Inc. and Invesco Aim Private Asset Management, Inc.; and Treasurer, PowerShares Exchange-Traded Fund Trust, PowerShares Exchange-Traded Fund Trust II, PowerShares India Exchange-Traded Fund Trust and PowerShares Actively Managed Exchange-Traded Fund Trust | | N/A | | N/A |
Invesco V.I. Equity and Income Fund
Trustees and Officers—(continued)
| | | | | | | | |
Name, Year of Birth and
Position(s) Held with the Trust | | Trustee and/
or Officer Since | | Principal Occupation(s)
During Past 5 Years | | Number of Funds in Fund Complex Overseen by Trustee | | Other Directorship(s)
Held by Trustee During Past 5 Years |
| Other Officers—(continued) | | | | | | | | |
Karen Dunn Kelley — 1960 Vice President | | 2003 | | Senior Managing Director, Investments, Invesco Ltd.; Director, Co-President, Co-Chief Executive Officer, and Co-Chairman, Invesco Advisers, Inc. (formerly known as Invesco Institutional (N.A.), Inc.) (registered investment adviser); Chairman, Invesco Senior Secured Management, Inc.; Senior Vice President, Invesco Management Group, Inc. (formerly known as Invesco Aim Management Group, Inc.); Executive Vice President, Invesco Distributors, Inc. (formerly known as Invesco Aim Distributors, Inc.); Director, Invesco Mortgage Capital Inc. and Invesco Management Company Limited; Vice President, The Invesco Funds (other than AIM Treasurer’s Series Trust (Invesco Treasurer’s Series Trust), Short-Term Investments Trust and Invesco Management Trust); and President and Principal Executive Officer, The Invesco Funds (AIM Treasurer’s Series Trust (Invesco Treasurer’s Series Trust), Short-Term Investments Trust and Invesco Management Trust only) Formerly: Director and President, INVESCO Asset Management (Bermuda) Ltd., Director, INVESCO Global Asset Management Limited and INVESCO Management S.A.; Senior Vice President, Van Kampen Investments Inc. and Invesco Advisers, Inc. (formerly known as Invesco Institutional (N.A.), Inc.) (registered investment adviser); Vice President, Invesco Advisers, Inc. (formerly known as Invesco Institutional (N.A.), Inc.); Director of Cash Management and Senior Vice President, Invesco Advisers, Inc. and Invesco Aim Capital Management, Inc.; Director and President, Fund Management Company; Chief Cash Management Officer, Director of Cash Management, Senior Vice President, and Managing Director, Invesco Aim Capital Management, Inc.; Director of Cash Management, Senior Vice President, and Vice President, Invesco Advisers, Inc. and The Invesco Funds (AIM Treasurer’s Series Trust (Invesco Treasurer’s Series Trust), and Short-Term Investments Trust only) | | N/A | | N/A |
Crissie M. Wisdom — 1969 Anti-Money Laundering Compliance Officer | | 2013 | | Anti-Money Laundering Compliance Officer, Invesco Advisers, Inc. (formerly known as Invesco Institutional (N.A.), Inc.) (registered investment adviser), Invesco Capital Markets, Inc. (formerly known as Van Kampen Funds Inc.), Invesco Distributors, Inc., Invesco Investment Services, Inc., Invesco Management Group, Inc., Van Kampen Exchange Corp., The Invesco Funds, and PowerShares Exchange-Traded Fund Trust, PowerShares Exchange-Traded Fund Trust II, PowerShares India Exchange-Traded Fund Trust, PowerShares Actively Managed Exchange-Traded Fund Trust and PowerShares Actively Managed Exchange-Traded Commodity Fund Trust; Anti-Money Laundering Compliance Officer and Bank Secrecy Act Officer, INVESCO National Trust Company and Invesco Trust Company; and Fraud Prevention Manager and Controls and Risk Analysis Manager for Invesco Investment Services, Inc. | | N/A | | N/A |
Lisa O. Brinkley — 1959 Chief Compliance Officer | | 2015 | | Senior Vice President and Chief Compliance Officer, Invesco Advisers, Inc. (registered investment adviser) (formerly known as Invesco Institutional (N.A., Inc.); and Chief Compliance Officer, The Invesco Funds Formerly: Global Assurance Officer, Invesco Ltd. and Vice President, The Invesco Funds; Chief Compliance Officer, Invesco Distributors, Inc. (formerly known as Invesco Aim Distributors, Inc.), Invesco Investment Services, Inc.(formerly known as Invesco Aim Investment Services, Inc.) and Van Kampen Investor Services Inc.; Senior Vice President, Invesco Management Group, Inc.; Senior Vice President and Chief Compliance Officer, Invesco Advisers, Inc. and The Invesco Funds; Vice President and Chief Compliance Officer, Invesco Aim Capital Management, Inc. and Invesco Distributors, Inc.; Vice President, Invesco Investment Services, Inc. and Fund Management Company | | N/A | | N/A |
The Statement of Additional Information of the Trust includes additional information about the Fund’s Trustees and is available upon request, without charge, by calling 1.800.959.4246. Please refer to the Fund’s prospectus for information on the Fund’s sub-advisers.
| | | | | | |
Office of the Fund 11 Greenway Plaza, Suite 1000 Houston, TX 77046-1173 | | Investment Adviser Invesco Advisers, Inc. 1555 Peachtree Street, N.E. Atlanta, GA 30309 | | Distributor Invesco Distributors, Inc. 11 Greenway Plaza, Suite 1000 Houston, TX 77046-1173 | | Auditors PricewaterhouseCoopers LLP 1000 Louisiana Street, Suite 5800 Houston, TX 77002-5678 |
| | | |
| | | | | | |
Counsel to the Fund Stradley Ronon Stevens & Young, LLP 2005 Market Street, Suite 2600 Philadelphia, PA 19103-7018 | | Counsel to the Independent Trustees Goodwin Procter LLP 901 New York Avenue, N.W. Washington, D.C. 20001 | | Transfer Agent Invesco Investment Services, Inc. 11 Greenway Plaza, Suite 1000 Houston, TX 77046-1173 | | Custodian State Street Bank and Trust Company 225 Franklin Street Boston, MA 02110-2801 |
Invesco V.I. Equity and Income Fund
| | | | |
| | |
 | | Annual Report to Shareholders | | December 31, 2015 |
| | |
| | Invesco V.I. Global Core Equity Fund |

| | |
| | The Fund provides a complete list of its holdings four times in each fiscal year, at the quarter-ends. For the second and fourth quarters, the lists appear in the Fund’s semiannual and annual reports to shareholders. For the first and third quarters, the Fund files the lists with the Securities and Exchange Commission (SEC) on Form N-Q. The Fund’s Form N-Q filings are available on the SEC website, sec.gov. Copies of the Fund’s Forms N-Q may be reviewed and copied at the SEC Public Reference Room in Washington, D.C. You can obtain information on the operation of the Public Reference Room, including information about duplicating fee charges, by calling 202 551 8090 or 800 732 0330, or by electronic request at the following email address: publicinfo@sec.gov. The SEC file numbers for the Fund are 811-07452 and 033-57340. The Fund’s most recent portfolio holdings, as filed on Form N-Q, have also been made available to insurance companies issuing variable annuity contracts and variable life insurance policies (“variable products”) that invest in the Fund. A description of the policies and procedures that the Fund uses to determine how to vote proxies relating to portfolio securities is available without charge, upon request, from our Client Services department at 800 959 4246 or at invesco.com/proxyguidelines. The information is also available on the SEC website, sec.gov. Information regarding how the Fund voted proxies related to its portfolio securities during the most recent 12-month period ended June 30 is available at invesco.com/ proxysearch. The information is also available on the SEC website, sec.gov. Invesco Advisers, Inc. is an investment adviser; it provides investment advisory services to individual and institutional clients and does not sell securities. Invesco Distributors, Inc. is the US distributor for Invesco Ltd.’s retail mutual funds, exchange-traded funds and institutional money market funds. Both are wholly owned, indirect subsidiaries of Invesco Ltd. This report must be accompanied or preceded by a currently effective Fund prospectus and variable product prospectus, which contain more complete information, including sales charges and expenses. Investors should read each carefully before investing. Invesco Distributors, Inc. VIGCE-AR-1 NOT FDIC INSURED | MAY LOSE VALUE | NO BANK GUARANTEE |
Management’s Discussion of Fund Performance
Performance summary
For the year ended December 31, 2015, Series I shares of Invesco V.I. Global Core Equity Fund (the Fund), underperformed the MSCI World Index, the Fund’s broad market/style-specific benchmark.
Your Fund’s long-term performance appears later in this report.
Fund vs. Indexes
Total returns, 12/31/14 to 12/31/15, excluding variable product issuer charges. If variable product issuer charges were included, returns would be lower.
| | | | | |
| Series I Shares | | | | -1.42 | % |
| Series II Shares | | | | -1.65 | |
| MSCI World Indext▼ (Broad Market/Style-Specific Index) | | | | -0.87 | |
| Lipper VUF Global Multi-Cap Value Funds Classification Averagen (Peer Group) | | | | -5.78 | |
Source(s): ▼FactSet Research Systems Inc.; nLipper Inc.
Market conditions and your Fund
Global equity markets faced significant headwinds during the year ended December 31, 2015. Developed markets were generally able to better withstand these headwinds, as more fragile emerging markets began to falter.
As the year began, the view that the US Federal Reserve (the Fed) would begin raising rates while other central banks were loosening monetary policy led the US dollar to strengthen against many currencies. At the same time, oil prices continued to decline as increased supply outstripped demand. This had the effect of hurting commodity – and materials-based economies – and companies in related sectors. A colder-than-expected winter in the US and concerns about a possible Greek exit from the eurozone contributed to market uncertainty. During the summer of 2015, China’s surprise devaluation of the renminbi and a significant downturn in its financial markets triggered a massive sell-off in global equity markets, particularly in already-vulnerable emerging markets. In the fall of 2015, markets around the world began to regain their footing, but the impact of a late-year
crash in oil prices offset these gains.
The global economy continued to expand, albeit slowly, during 2015. However, that growth became increasingly uneven across developed and emerging economies. Central bank policies also began to diverge as the Fed followed through on its commitment to normalize monetary policy by raising interest rates – even as the European Central Bank extended its asset purchase program and Japan introduced additional quantitative easing. While European equity markets were fairly resilient, or flat, for the year, many emerging markets – particularly China, Brazil and Russia – struggled and ended the year down significantly.
During the year, stock selection in the energy, financials and telecommunication services sectors benefited Fund performance relative to the Fund’s broad market/style-specific benchmark. In addition, underweight exposure to the energy and materials sectors benefited Fund performance. The largest detractors from Fund performance relative to the MSCI World Index included stock selection in the consumer discretionary, consumer staples, industrials and information technology (IT) sectors.
From a geographic perspective, stock selection in Germany and the Netherlands was beneficial to the Fund’s relative performance. Also aiding performance was the Fund’s underweight exposure to Australia. Conversely, stock selection in Japan and the US was the largest detractor from the Fund’s relative performance.
Randstad Holdings, a Dutch staffing and human resources services company, was a top contributor for the year. The company benefited from Europe’s improving employment outlook. We sold our position within the holding before the end of the reporting period.
In the positive-performing financials sector, First Republic Bank performed strongly after reporting strong operational execution and growth.
Detracting from the Fund’s performance was American Express. The stock’s performance was hurt after the company announced it would end its partnership program with Costco (not a Fund holding).
In addition, Komatsu, a Japanese industrial firm, was hurt by global mining trends, particularly in China.
During the reporting period, our largest overweight positions relative to the MSCI World Index were in the consumer discretionary, consumer staples, industrials and IT sectors. The Fund also had a slight overweight position in the telecommunication services sector. The largest underweight positions were in the energy and materials sectors.
As always, we are focused on companies that provide an attractive return on invested capital, trade at attractive valuations and have management teams with a long-term perspective. In short, we seek to take advantage of the market’s volatile behavior and short-term focus. We believe our conservative approach should position the Fund to navigate the
| | | | | |
| Portfolio Composition |
By country | | | | % of total net assets | |
| | | | | |
| |
| United States | | | | 57.9 | % |
| United Kingdom | | | | 11.2 | |
| Japan | | | | 7.6 | |
| Switzerland | | | | 4.8 | |
| France | | | | 4.5 | |
| Netherlands | | | | 3.1 | |
| Countries each less than 2.0% of portfolio | | | | 10.9 | |
| | | | | |
| Top 10 Equity Holdings |
| | | | % of total net assets | |
| | | | | |
| |
| 1. Alphabet Inc.-Class C | | | | 3.4 | % |
2. American Express Co. | | | | 3.0 | |
| 3. Berkshire Hathaway Inc.- Class A | | | | 2.8 | |
| 4. Roche Holding AG | | | | 2.7 | |
| 5. Allergan PLC | | | | 2.4 | |
6. Vodafone Group PLC- Class A-ADR | | | | 2.3 | |
| 7. Royal Dutch Shell PLC- Class A-ADR | | | | 2.2 | |
| 8. Priceline Group Inc. (The) | | | | 2.1 | |
| 9. International Business Machines Corp. | | | | 2.0 | |
| 10. Progressive Corp. (The) | | | | 2.0 | |
| | | | | |
| Total Net Assets | | | | $78.5 million | |
| |
| Total Number of Holdings | | | | 83 | |
The Fund’s holdings are subject to change, and there is no assurance that the Fund will continue to hold any particular security.
Data presented here are as of December 31, 2015.
Invesco V.I. Global Core Equity Fund
evolving economic backdrop.
We thank you for your continued investment in Invesco V.I. Global Core Equity Fund.
The views and opinions expressed in management’s discussion of Fund performance are those of Invesco Advisers, Inc. These views and opinions are subject to change at any time based on factors such as market and economic conditions. These views and opinions may not be relied upon as investment advice or recommendations, or as an offer for a particular security. The information is not a complete analysis of every aspect of any market, country, industry, security or the Fund. Statements of fact are from sources considered reliable, but Invesco Advisers, Inc. makes no representation or warranty as to their completeness or accuracy. Although historical performance is no guarantee of future results, these insights may help you understand our investment management philosophy.
See important Fund and, if applicable, index disclosures later in this report.
| | |
 | | Erik Esselink Portfolio Manager, is manager of Invesco V.I. Global Core Equity Fund. He joined Invesco in 2007. |
Mr. Esselink earned a bachelor of science degree from the Rotterdam School of Economics, where he studied commercial economics.
| | |
| |
 | | Brian Nelson Chartered Financial Analyst, Portfolio Manager, is manager of Invesco V.I. Global Core Equity Fund. |
He joined Invesco in 2004. Mr. Nelson earned a BA from the University of California, Santa Barbara.
Assisted by Invesco’s Global Core Equity Team
Invesco V.I. Global Core Equity Fund
Your Fund’s Long-Term Performance
Results of a $10,000 Investment – Oldest Share Class(es)
Fund and index data from 12/31/05
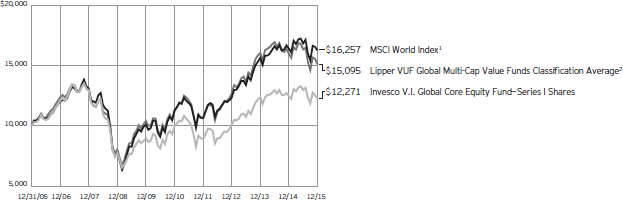
| 1 | Source: FactSet Research Systems Inc. |
Past performance cannot guarantee comparable future results.
| | | | | |
| Average Annual Total Returns |
As of 12/31/15 | | | | | |
| |
| Series I Shares | | | | | |
| Inception (1/2/97) | | | | 4.54 | % |
| 10 Years | | | | 2.07 | |
| 5 Years | | | | 4.27 | |
| 1 Year | | | | -1.42 | |
| |
| Series II Shares | | | | | |
| 10 Years | | | | 1.82 | % |
| 5 Years | | | | 4.02 | |
| 1 Year | | | | -1.65 | |
Effective June 1, 2010, Class I shares of the predecessor fund, Universal Funds Global Value Equity Portfolio, advised by Morgan Stanley Investment Management Inc. were reorganized into Series I shares of Invesco Van Kampen V.I. Global Value Equity Fund (renamed Invesco V.I. Global Core Equity Fund on April 30, 2012). Returns shown above for Series I shares are blended returns of the predecessor fund and Invesco V.I. Global Value Equity Fund Share class returns will differ from the predecessor fund because of different expenses.
Series II shares incepted on June 1, 2010. Series II share performance shown prior to that date is that of the predecessor fund’s Class I shares restated to reflect the higher 12b-1 fees applicable to Series II shares.
The performance data quoted represent past performance and cannot guarantee comparable future results; current performance may be lower or higher. Please contact your variable product issuer or financial adviser for the most recent month-end variable product performance. Performance figures reflect Fund expenses, reinvested distributions and changes in net asset value. Investment return and principal value will fluctuate so that you may have a gain or loss when you sell shares.
The total annual Fund operating expense ratio set forth in the most recent Fund prospectus as of the date of this report for Series I and Series II shares was 1.06% and 1.31% respectively. The expense ratios presented above may vary from the expense ratios presented in other sections of this report that are based on expenses incurred during the period covered by this report.
Invesco V.I. Global Core Equity Fund, a series portfolio of AIM Variable Insurance Funds (Invesco Variable Insurance Funds), is currently offered through insurance companies issuing variable products. You cannot purchase shares of the Fund directly. Performance figures given represent
the Fund and are not intended to reflect actual variable product values. They do not reflect sales charges, expenses and fees assessed in connection with a variable product. Sales charges, expenses and fees, which are determined by the variable product issuers, will vary and will lower the total return.
The most recent month-end performance at the Fund level, excluding variable product charges, is available at 800 451 4246. As mentioned above, for the most recent month-end performance including variable product charges, please contact your variable product issuer or financial adviser.
Fund performance reflects any applicable fee waivers and/or expense reimbursements. Had the adviser not waived fees and/or reimbursed expenses currently or in the past, returns would have been lower. See current prospectus for more information.
Invesco V.I. Global Core Equity Fund
Invesco V.I. Global Core Equity Fund’s investment objective is long-term capital appreciation by investing primarily in equity securities of issuers throughout the world, including US issuers.
| n | | Unless otherwise stated, information presented in this report is as of December 31, 2015, and is based on total net assets. |
| n | | Unless otherwise noted, all data provided by Invesco. |
| n | | To access your Fund’s reports/prospectus, visit invesco.com/fundreports. |
Principal risks of investing in the Fund
Active trading risk. The Fund engages in frequent trading of portfolio securities. Active trading results in added expenses and may result in a lower return.
Depositary receipts risk. Depositary receipts involve many of the same risks as those associated with direct investment in foreign securities. In addition, the underlying issuers of certain depositary receipts, particularly unsponsored or unregistered depositary receipts, are under no obligation to distribute shareholder communications to the holders of such receipts or to pass through to them any voting rights with respect to the deposited securities.
Derivatives risk. The value of a derivative instrument depends largely on (and is derived from) the value of an underlying security, currency, commodity, interest rate, index or other asset (each referred to as an underlying asset). In addition to risks relating to the underlying assets, the use of derivatives may include other, possibly greater, risks, including counterparty, leverage and liquidity risks. Counterparty risk is the risk that the counterparty to the derivative contract will default on its obligation to pay the Fund the amount owed or otherwise perform under the derivative contract. Derivatives create leverage risk because they do not require payment up front equal to the economic exposure created by owning the derivative. As a result, an adverse change in the value of the underlying asset could result in the Fund sustaining a loss that is substantially greater than the amount invested in the derivative, which may make the Fund’s returns more volatile and increase the risk of loss. Derivative instruments may also be less liquid than more traditional investments and the Fund may be unable to sell or close out its derivative positions at a desirable time or price. This risk may be more acute under adverse market conditions, during which the Fund may be most in need of liquidating its derivative positions. Derivatives may also be harder to value, less tax efficient and subject to changing government regulation that could impact the Fund’s ability to use certain derivatives or their cost. Also, derivatives used for hedging or to gain or limit
exposure to a particular market segment may not provide the expected benefits, particularly during adverse market conditions.
Developing/emerging markets securities risk. The prices of securities issued by foreign companies and governments located in developing/emerging markets countries may be affected more negatively by inflation, devaluation of their currencies, higher transaction costs, delays in settlement, adverse political developments, the introduction of capital controls, withholding taxes, nationalization of private assets, expropriation, social unrest, war or lack of timely information than those in developed countries.
Foreign securities risk. The Fund’s foreign investments may be affected by changes in a foreign country’s exchange rates, political and social instability, changes in economic or taxation policies, difficulties when enforcing obligations, decreased liquidity, and increased volatility. Foreign companies may be subject to less regulation resulting in less publicly available information about the companies.
Geographic focus risk. From time to time the Fund may invest a substantial amount of its assets in securities of issuers located in a single country or a limited number of countries. If the Fund focuses its investments in this manner, it assumes the risk that economic, political and social conditions in those countries will have a significant impact on its investment performance. The Fund’s investment performance may also be more volatile if it focuses its investments in certain countries, especially emerging markets countries.
Investing in the European Union risk. Many countries in the European Union are susceptible to high economic risks associated with high levels of debt, notably due to investments in sovereign debts of European countries such as Greece, Italy and Spain. One or more member states might exit the European Union, placing its currency and banking system in jeopardy. The European Union faces major issues involving its membership, structure, procedures and policies, including the adoption, abandonment or adjustment of the new constitutional treaty, the European Union’s enlargement to the south and east, and resolution of the European
Union’s problematic fiscal and democratic accountability. Efforts of the member states to further unify their economic and monetary policies may increase the potential for the downward movement of one member state’s market to cause a similar effect on other member states’ markets. European countries that are part of the European Economic and Monetary Union may be significantly affected by the tight fiscal and monetary controls that the union seeks to impose on its members.
Management risk. The investment techniques and risk analysis used by the Fund’s portfolio managers may not produce the desired results.
Market risk. The prices of and the income generated by the Fund’s securities may decline in response to, among other things, investor sentiment, general economic and market conditions, regional or global instability, and currency and interest rate fluctuations.
Preferred securities risk. Preferred securities may include provisions that permit the issuer, in its discretion, to defer or omit distributions for a certain period of time. If the Fund owns a security that is deferring or omitting its distributions, the Fund may be required to report the distribution on its tax returns, even though it may not have received this income. Further, preferred securities may lose substantial value due to the omission or deferment of dividend payments.
About indexes used in this report
The MSCI World IndexSM is an unmanaged index considered representative of stocks of developed countries. The index is computed using the net return, which withholds applicable taxes for nonresident investors.
The Lipper VUF Global Multi-Cap Value Funds Classification Average represents an average of all variable insurance underlying funds in the Lipper Global Multi-Cap Value Funds classification.
The Fund is not managed to track the performance of any particular index, including the index(es) described here, and consequently, the performance of the Fund may deviate significantly from the performance of the index(es).
A direct investment cannot be made in an index. Unless otherwise indicated,
Invesco V.I. Global Core Equity Fund
index results include reinvested dividends, and they do not reflect sales charges. Performance of the peer group, if applicable, reflects fund expenses; performance of a market index does not.
Other information
The returns shown in management’s discussion of Fund performance are based on net asset values calculated for shareholder transactions. Generally accepted accounting principles require adjustments to be made to the net assets of the Fund at period end for financial reporting purposes, and as such, the net asset values for shareholder transactions and the returns based on those net asset values may differ from the net asset values and returns reported in the Financial Highlights. Additionally, the returns and net asset values shown throughout this report are at the Fund level only and do not include variable product issuer charges. If such charges were included, the total returns would be lower.
Industry classifications used in this report are generally according to the Global Industry Classification Standard, which was developed by and is the exclusive property and a service mark of MSCI Inc. and Standard & Poor’s.
Invesco V.I. Global Core Equity Fund
Schedule of Investments
December 31, 2015
| | | | | | | | |
| | | Shares | | | Value | |
Common Stocks & Other Equity Interests–99.96% | |
| Australia–1.08% | |
Australia and New Zealand Banking Group Ltd. | | | 42,026 | | | $ | 848,185 | |
|
| Canada–1.07% | |
Toronto-Dominion Bank (The) | | | 12,649 | | | | 495,670 | |
Vermilion Energy, Inc. | | | 12,548 | | | | 340,953 | |
| | | | 836,623 | |
|
| China–0.95% | |
Baidu, Inc.–ADR(a) | | | 3,931 | | | | 743,116 | |
|
| Finland–1.01% | |
Sampo Oyj–Class A | | | 15,641 | | | | 792,782 | |
|
| France–4.48% | |
Danone | | | 20,738 | | | | 1,399,553 | |
LVMH Moet Hennessy Louis Vuitton S.E. | | | 5,784 | | | | 904,194 | |
Publicis Groupe S.A. | | | 18,280 | | | | 1,212,411 | |
| | | | 3,516,158 | |
|
| Hong Kong–1.39% | |
AIA Group Ltd. | | | 182,800 | | | | 1,089,035 | |
|
| Ireland–1.53% | |
Shire PLC–ADR | | | 5,839 | | | | 1,196,995 | |
|
| Israel–0.63% | |
Teva Pharmaceutical Industries Ltd.–ADR | | | 7,531 | | | | 494,335 | |
|
| Japan–7.56% | |
ASICS Corp. | | | 37,800 | | | | 782,337 | |
FANUC Corp. | | | 2,600 | | | | 448,217 | |
KDDI Corp. | | | 40,600 | | | | 1,051,011 | |
Komatsu Ltd. | | | 51,000 | | | | 830,985 | |
Mitsubishi UFJ Financial Group, Inc. | | | 197,800 | | | | 1,224,163 | |
ORIX Corp. | | | 57,000 | | | | 799,605 | |
Toyota Motor Corp. | | | 13,000 | | | | 797,941 | |
| | | | 5,934,259 | |
|
| Netherlands–3.14% | |
GrandVision N.V.(b) | | | 35,065 | | | | 1,052,216 | |
Koninklijke DSM N.V. | | | 12,648 | | | | 632,934 | |
Koninklijke Philips N.V. | | | 30,581 | | | | 777,535 | |
| | | | 2,462,685 | |
|
| Singapore–0.99% | |
DBS Group Holdings Ltd. | | | 66,600 | | | | 779,692 | |
|
| Sweden–0.62% | |
Sandvik AB | | | 56,573 | | | | 489,874 | |
|
| Switzerland–4.78% | |
ABB Ltd. | | | 48,532 | | | | 861,402 | |
Roche Holding AG | | | 7,598 | | | | 2,093,814 | |
TE Connectivity Ltd. | | | 12,362 | | | | 798,709 | |
| | | | 3,753,925 | |
| | | | | | | | |
| | | Shares | | | Value | |
| Taiwan–1.61% | |
Taiwan Semiconductor Manufacturing Co. Ltd. | | | 292,000 | | | $ | 1,259,427 | |
|
| United Kingdom–11.22% | |
British American Tobacco PLC | | | 10,713 | | | | 594,970 | |
Diageo PLC | | | 56,831 | | | | 1,549,757 | |
Kingfisher PLC | | | 114,071 | | | | 552,328 | |
Liberty Global PLC–Series A(a) | | | 14,901 | | | | 631,206 | |
Liberty Global PLC–Series C(a) | | | 33,216 | | | | 1,354,216 | |
Liberty Global PLC LiLAC–Series A(a) | | | 745 | | | | 30,821 | |
Liberty Global PLC LiLAC–Series C(a) | | | 1,660 | | | | 71,380 | |
Rio Tinto PLC | | | 17,448 | | | | 509,147 | |
Royal Dutch Shell PLC–Class A–ADR | | | 37,508 | | | | 1,717,491 | |
Vodafone Group PLC–ADR | | | 55,513 | | | | 1,790,849 | |
| | | | 8,802,165 | |
|
| United States–57.90% | |
AbbVie Inc. | | | 20,617 | | | | 1,221,351 | |
ACE Ltd. | | | 7,297 | | | | 852,654 | |
Allergan PLC(a) | | | 5,897 | | | | 1,842,812 | |
Alphabet Inc.–Class C(a) | | | 3,482 | | | | 2,642,420 | |
American Express Co. | | | 33,940 | | | | 2,360,527 | |
Amphenol Corp.–Class A | | | 13,981 | | | | 730,228 | |
Apple Inc. | | | 5,314 | | | | 559,352 | |
Archer-Daniels-Midland Co. | | | 13,945 | | | | 511,503 | |
Berkshire Hathaway Inc.–Class A(a) | | | 11 | | | | 2,175,800 | |
Biogen Inc.(a) | | | 3,155 | | | | 966,534 | |
BioMarin Pharmaceutical Inc.(a) | | | 2,378 | | | | 249,119 | |
Cabot Oil & Gas Corp. | | | 16,490 | | | | 291,708 | |
Celgene Corp.(a) | | | 11,227 | | | | 1,344,545 | |
Cisco Systems, Inc. | | | 19,280 | | | | 523,548 | |
Coca-Cola Co. (The) | | | 24,636 | | | | 1,058,363 | |
Cognizant Technology Solutions Corp.–
Class A(a) | | | 9,974 | | | | 598,639 | |
Comcast Corp.–Class A | | | 20,264 | | | | 1,143,498 | |
Concho Resources Inc.(a) | | | 4,568 | | | | 424,184 | |
Dick’s Sporting Goods, Inc. | | | 18,666 | | | | 659,843 | |
Eaton Corp. PLC(a) | | | 23,218 | | | | 1,208,265 | |
Eli Lilly and Co. | | | 7,694 | | | | 648,296 | |
EMC Corp. | | | 22,695 | | | | 582,808 | |
EOG Resources, Inc. | | | 9,491 | | | | 671,868 | |
Express Scripts Holding Co.(a) | | | 7,500 | | | | 655,575 | |
Exxon Mobil Corp. | | | 18,296 | | | | 1,426,173 | |
First Republic Bank | | | 18,730 | | | | 1,237,304 | |
General Electric Co. | | | 39,721 | | | | 1,237,309 | |
Halliburton Co. | | | 26,998 | | | | 919,012 | |
HCA Holdings, Inc.(a) | | | 13,385 | | | | 905,228 | |
Hertz Global Holdings, Inc.(a) | | | 55,922 | | | | 795,770 | |
Illumina, Inc.(a) | | | 1,060 | | | | 203,462 | |
Incyte Corp.(a) | | | 1,270 | | | | 137,731 | |
International Business Machines Corp. | | | 11,369 | | | | 1,564,602 | |
Macy’s, Inc. | | | 21,212 | | | | 741,996 | |
See accompanying Notes to Financial Statements which are an integral part of the financial statements.
Invesco V.I. Global Core Equity Fund
| | | | | | | | |
| | | Shares | | | Value | |
| United States–(continued) | | | | | | | | |
Marsh & McLennan Cos., Inc. | | | 18,956 | | | $ | 1,051,110 | |
Moody’s Corp. | | | 11,976 | | | | 1,201,672 | |
Nielsen Holdings PLC | | | 21,105 | | | | 983,493 | |
Northern Trust Corp. | | | 14,319 | | | | 1,032,257 | |
Priceline Group Inc. (The)(a) | | | 1,280 | | | | 1,631,936 | |
Progressive Corp. (The) | | | 48,779 | | | | 1,551,172 | |
QUALCOMM, Inc. | | | 24,552 | | | | 1,227,232 | |
Twitter, Inc.(a) | | | 26,352 | | | | 609,785 | |
United Parcel Service, Inc.–Class B | | | 7,869 | | | | 757,234 | |
| | | | | | | | |
| | | Shares | | | Value | |
| United States–(continued) | | | | | | | | |
Vertex Pharmaceuticals Inc.(a) | | | 1,910 | | | $ | 240,335 | |
Wal-Mart Stores, Inc. | | | 15,993 | | | | 980,371 | |
Walt Disney Co. (The) | | | 10,158 | | | | 1,067,403 | |
| | | | | 45,426,027 | |
TOTAL INVESTMENTS–99.96%
(Cost $78,909,447) | | | | 78,425,283 | |
OTHER ASSETS LESS LIABILITIES–0.04% | | | | 27,963 | |
NET ASSETS–100.00% | | | $ | 78,453,246 | |
Investment Abbreviations:
| | |
| ADR | | – American Depositary Receipt |
Notes to Schedule of Investments:
| (a) | Non-income producing security. |
| (b) | Security purchased or received in transaction exempt from registration under the Securities Act of 1933, as amended (the “1933 Act”). The security may be resold pursuant to an exemption from registration under the 1933 Act, typically to qualified institutional buyers. The value of this security at December 31, 2015 represented 1.34% of the Fund’s Net Assets. |
See accompanying Notes to Financial Statements which are an integral part of the financial statements.
Invesco V.I. Global Core Equity Fund
Statement of Assets and Liabilities
December 31, 2015
Statement of Operations
For the year ended December 31, 2015
| | | | |
Assets: | |
Investments, at value (Cost $78,909,447) | | $ | 78,425,283 | |
Foreign currencies, at value (Cost $47,954) | | | 46,089 | |
Receivable for: | | | | |
Fund shares sold | | | 38,201 | |
Dividends | | | 140,658 | |
Investment for trustee deferred compensation and retirement plans | | | 32,336 | |
Total assets | | | 78,682,567 | |
| |
Liabilities: | | | | |
Payable for: | | | | |
Fund shares reacquired | | | 19,564 | |
Amount due custodian | | | 99,238 | |
Accrued fees to affiliates | | | 50,095 | |
Accrued trustees’ and officers’ fees and benefits | | | 135 | |
Accrued other operating expenses | | | 25,710 | |
Trustee deferred compensation and retirement plans | | | 34,579 | |
Total liabilities | | | 229,321 | |
Net assets applicable to shares outstanding | | $ | 78,453,246 | |
| |
Net assets consist of: | | | | |
Shares of beneficial interest | | $ | 83,993,834 | |
Undistributed net investment income | | | 654,359 | |
Undistributed net realized gain (loss) | | | (5,704,949 | ) |
Net unrealized appreciation (depreciation) | | | (489,998 | ) |
| | | $ | 78,453,246 | |
|
Net Assets: | |
Series I | | $ | 65,166,974 | |
Series II | | $ | 13,286,272 | |
|
Shares outstanding, $0.001 par value per share,
with an unlimited number of shares authorized: | |
Series I | | | 7,800,253 | |
Series II | | | 1,591,011 | |
Series I: | | | | |
Net asset value per share | | $ | 8.35 | |
Series II: | | | | |
Net asset value per share | | $ | 8.35 | |
| | | | |
Investment income: | |
Dividends (net of foreign withholding taxes of $113,071) | | $ | 1,772,151 | |
Dividends from affiliated money market funds | | | 353 | |
Total investment income | | | 1,772,504 | |
| |
Expenses: | | | | |
Advisory fees | | | 583,531 | |
Administrative services fees | | | 226,118 | |
Custodian fees | | | 25,072 | |
Distribution fees — Series II | | | 37,675 | |
Transfer agent fees | | | 10,917 | |
Trustees’ and officers’ fees and benefits | | | 20,020 | |
Other | | | 61,586 | |
Total expenses | | | 964,919 | |
Less: Fees waived | | | (679 | ) |
Net expenses | | | 964,240 | |
Net investment income | | | 808,264 | |
| |
Realized and unrealized gain (loss) from: | | | | |
Net realized gain (loss) from: | | | | |
Investment securities | | | 1,110,134 | |
Foreign currencies | | | (30,411 | ) |
| | | | 1,079,723 | |
Change in net unrealized appreciation (depreciation) of: | | | | |
Investment securities | | | (2,800,325 | ) |
Foreign currencies | | | (977 | ) |
| | | | (2,801,302 | ) |
Net realized and unrealized gain (loss) | | | (1,721,579 | ) |
Net increase (decrease) in net assets resulting from operations | | $ | (913,315 | ) |
See accompanying Notes to Financial Statements which are an integral part of the financial statements.
Invesco V.I. Global Core Equity Fund
Statement of Changes in Net Assets
For the years ended December 31, 2015 and 2014
| | | | | | | | |
| | | 2015 | | | 2014 | |
Operations: | | | | | | | | |
Net investment income | | $ | 808,264 | | | $ | 1,192,210 | |
Net realized gain | | | 1,079,723 | | | | 16,897,503 | |
Change in net unrealized appreciation (depreciation) | | | (2,801,302 | ) | | | (17,272,407 | ) |
Net increase (decrease) in net assets resulting from operations | | | (913,315 | ) | | | 817,306 | |
| | |
Distributions to shareholders from net investment income: | | | | | | | | |
Series I | | | (951,512 | ) | | | (1,568,741 | ) |
Series ll | | | (150,626 | ) | | | (282,838 | ) |
Total distributions from net investment income | | | (1,102,138 | ) | | | (1,851,579 | ) |
| | |
Distributions to shareholders from net realized gains: | | | | | | | | |
Series l | | | (2,459,784 | ) | | | — | |
Series ll | | | (507,950 | ) | | | — | |
Total distributions from net realized gains | | | (2,967,734 | ) | | | — | |
| | |
Share transactions–net: | | | | | | | | |
Series l | | | (4,453,265 | ) | | | (9,243,389 | ) |
Series ll | | | (1,936,288 | ) | | | (5,156,863 | ) |
Net increase (decrease) in net assets resulting from share transactions | | | (6,389,553 | ) | | | (14,400,252 | ) |
Net increase (decrease) in net assets | | | (11,372,740 | ) | | | (15,434,525 | ) |
| | |
Net assets: | | | | | | | | |
Beginning of year | | | 89,825,986 | | | | 105,260,511 | |
End of year (includes undistributed net investment income of $654,359 and $978,644, respectively) | | $ | 78,453,246 | | | $ | 89,825,986 | |
Notes to Financial Statements
December 31, 2015
NOTE 1—Significant Accounting Policies
Invesco V.I. Global Core Equity Fund (the “Fund”) is a series portfolio of AIM Variable Insurance Funds (Invesco Variable Insurance Funds) (the “Trust”). The Trust is a Delaware statutory trust registered under the Investment Company Act of 1940, as amended (the “1940 Act”), as an open-end series management investment company consisting of twenty-four separate portfolios, (each constituting a “Fund”). The assets, liabilities and operations of each portfolio are accounted for separately. Information presented in these financial statements pertains only to the Fund. Matters affecting each Fund or class will be voted on exclusively by the shareholders of such Fund or class. Current Securities and Exchange Commission (“SEC”) guidance, however, requires participating insurance companies offering separate accounts to vote shares proportionally in accordance with the instructions of the contract owners whose investments are funded by shares of each Fund or class.
The Fund’s investment objective is long-term capital appreciation by investing primarily in equity securities of issuers throughout the world, including U.S. issuers.
The Fund currently offers two classes of shares, Series I and Series II, both of which are offered to insurance company separate accounts funding variable annuity contracts and variable life insurance policies (“variable products”).
The following is a summary of the significant accounting policies followed by the Fund in the preparation of its financial statements.
| A. | Security Valuations — Securities, including restricted securities, are valued according to the following policy. |
A security listed or traded on an exchange (except convertible securities) is valued at its last sales price or official closing price as of the close of the customary trading session on the exchange where the security is principally traded, or lacking any sales or official closing price on a particular day, the security may be valued at the closing bid price on that day. Securities traded in the over-the-counter market are valued based on prices furnished by independent pricing services or market makers. When such securities are valued by an independent pricing service they may be considered fair valued. Futures contracts are valued at the final settlement price set by an exchange on which they are principally traded. Listed options are valued at the mean between the last bid and asked prices from the exchange on which they are principally traded. Options not listed on an exchange are valued by an independent source at the mean between the last bid and asked prices. For purposes of determining net asset value (“NAV”) per share, futures and option contracts generally are valued 15 minutes after the close of the customary trading session of the New York Stock Exchange (“NYSE”).
Investments in open-end and closed-end registered investment companies that do not trade on an exchange are valued at the end-of-day net asset value per share. Investments in open-end and closed-end registered investment companies that trade on an exchange are valued at the last sales price or official closing price as of the close of the customary trading session on the exchange where the security is principally traded.
Invesco V.I. Global Core Equity Fund
Debt obligations (including convertible securities) and unlisted equities are fair valued using an evaluated quote provided by an independent pricing service. Evaluated quotes provided by the pricing service may be determined without exclusive reliance on quoted prices, and may reflect appropriate factors such as institution-size trading in similar groups of securities, developments related to specific securities, dividend rate (for unlisted equities), yield (for debt obligations), quality, type of issue, coupon rate (for debt obligations), maturity (for debt obligations), individual trading characteristics and other market data. Debt obligations are subject to interest rate and credit risks. In addition, all debt obligations involve some risk of default with respect to interest and/or principal payments.
Foreign securities’ (including foreign exchange contracts) prices are converted into U.S. dollar amounts using the applicable exchange rates as of the close of the NYSE. If market quotations are available and reliable for foreign exchange-traded equity securities, the securities will be valued at the market quotations. Because trading hours for certain foreign securities end before the close of the NYSE, closing market quotations may become unreliable. If between the time trading ends on a particular security and the close of the customary trading session on the NYSE, events occur that the Adviser determines are significant and make the closing price unreliable, the Fund may fair value the security. If the event is likely to have affected the closing price of the security, the security will be valued at fair value in good faith using procedures approved by the Board of Trustees. Adjustments to closing prices to reflect fair value may also be based on a screening process of an independent pricing service to indicate the degree of certainty, based on historical data, that the closing price in the principal market where a foreign security trades is not the current value as of the close of the NYSE. Foreign securities’ prices meeting the approved degree of certainty that the price is not reflective of current value will be priced at the indication of fair value from the independent pricing service. Multiple factors may be considered by the independent pricing service in determining adjustments to reflect fair value and may include information relating to sector indices, American Depositary Receipts and domestic and foreign index futures. Foreign securities may have additional risks including exchange rate changes, potential for sharply devalued currencies and high inflation, political and economic upheaval, the relative lack of issuer information, relatively low market liquidity and the potential lack of strict financial and accounting controls and standards.
Securities for which market prices are not provided by any of the above methods may be valued based upon quotes furnished by independent sources. The last bid price may be used to value equity securities. The mean between the last bid and asked prices is used to value debt obligations, including corporate loans.
Securities for which market quotations are not readily available or became unreliable are valued at fair value as determined in good faith by or under the supervision of the Trust’s officers following procedures approved by the Board of Trustees. Issuer specific events, market trends, bid/asked quotes of brokers and information providers and other market data may be reviewed in the course of making a good faith determination of a security’s fair value.
The Fund may invest in securities that are subject to interest rate risk, meaning the risk that the prices will generally fall as interest rates rise and, conversely, the prices will generally rise as interest rates fall. Specific securities differ in their sensitivity to changes in interest rates depending on their individual characteristics. Changes in interest rates may result in increased market volatility, which may affect the value and/or liquidity of certain Fund investments.
Valuations change in response to many factors including the historical and prospective earnings of the issuer, the value of the issuer’s assets, general economic conditions, interest rates, investor perceptions and market liquidity. Because of the inherent uncertainties of valuation, the values reflected in the financial statements may materially differ from the value received upon actual sale of those investments.
| B. | Securities Transactions and Investment Income — Securities transactions are accounted for on a trade date basis. Realized gains or losses on sales are computed on the basis of specific identification of the securities sold. Interest income (net of withholding tax, if any) is recorded on the accrual basis from settlement date. Dividend income (net of withholding tax, if any) is recorded on the ex-dividend date. |
The Fund may periodically participate in litigation related to Fund investments. As such, the Fund may receive proceeds from litigation settlements. Any proceeds received are included in the Statement of Operations as realized gain (loss) for investments no longer held and as unrealized gain (loss) for investments still held.
Brokerage commissions and mark ups are considered transaction costs and are recorded as an increase to the cost basis of securities purchased and/or a reduction of proceeds on a sale of securities. Such transaction costs are included in the determination of net realized and unrealized gain (loss) from investment securities reported in the Statement of Operations and the Statement of Changes in Net Assets and the net realized and unrealized gains (losses) on securities per share in the Financial Highlights. Transaction costs are included in the calculation of the Fund’s net asset value and, accordingly, they reduce the Fund’s total returns. These transaction costs are not considered operating expenses and are not reflected in net investment income reported in the Statement of Operations and the Statement of Changes in Net Assets, or the net investment income per share and the ratios of expenses and net investment income reported in the Financial Highlights, nor are they limited by any expense limitation arrangements between the Fund and the investment adviser.
The Fund allocates income and realized and unrealized capital gains and losses to a class based on the relative net assets of each class.
| C. | Country Determination — For the purposes of making investment selection decisions and presentation in the Schedule of Investments, the investment adviser may determine the country in which an issuer is located and/or credit risk exposure based on various factors. These factors include the laws of the country under which the issuer is organized, where the issuer maintains a principal office, the country in which the issuer derives 50% or more of its total revenues and the country that has the primary market for the issuer’s securities, as well as other criteria. Among the other criteria that may be evaluated for making this determination are the country in which the issuer maintains 50% or more of its assets, the type of security, financial guarantees and enhancements, the nature of the collateral and the sponsor organization. Country of issuer and/or credit risk exposure has been determined to be the United States of America, unless otherwise noted. |
| D. | Distributions — Distributions from net investment income and net realized capital gain, if any, are generally declared and paid to separate accounts of participating insurance companies annually and recorded on the ex-dividend date. |
| E. | Federal Income Taxes — The Fund intends to comply with the requirements of Subchapter M of the Internal Revenue Code of 1986, as amended (the “Internal Revenue Code”), necessary to qualify as a regulated investment company and to distribute substantially all of the Fund’s taxable earnings to shareholders. As such, the Fund will not be subject to federal income taxes on otherwise taxable income (including net realized capital gain) that is distributed to shareholders. Therefore, no provision for federal income taxes is recorded in the financial statements. |
The Fund recognizes the tax benefits of uncertain tax positions only when the position is more likely than not to be sustained. Management has analyzed the Fund’s uncertain tax positions and concluded that no liability for unrecognized tax benefits should be recorded related to uncertain
Invesco V.I. Global Core Equity Fund
tax positions. Management is not aware of any tax positions for which it is reasonably possible that the total amounts of unrecognized tax benefits will change materially in the next 12 months.
The Fund files tax returns in the U.S. Federal jurisdiction and certain other jurisdictions. Generally, the Fund is subject to examinations by such taxing authorities for up to three years after the filing of the return for the tax period.
| F. | Expenses — Fees provided for under the Rule 12b-1 plan of a particular class of the Fund and which are directly attributable to that class are charged to the operations of such class. All other expenses are allocated among the classes based on relative net assets. |
| G. | Accounting Estimates — The preparation of financial statements in conformity with accounting principles generally accepted in the United States of America (“GAAP”) requires management to make estimates and assumptions that affect the reported amounts of assets and liabilities at the date of the financial statements and the reported amounts of revenues and expenses during the reporting period including estimates and assumptions related to taxation. Actual results could differ from those estimates by a significant amount. In addition, the Fund monitors for material events or transactions that may occur or become known after the period-end date and before the date the financial statements are released to print. |
| H. | Indemnifications — Under the Trust’s organizational documents, each Trustee, officer, employee or other agent of the Trust is indemnified against certain liabilities that may arise out of the performance of their duties to the Fund. Additionally, in the normal course of business, the Fund enters into contracts, including the Fund’s servicing agreements, that contain a variety of indemnification clauses. The Fund’s maximum exposure under these arrangements is unknown as this would involve future claims that may be made against the Fund that have not yet occurred. The risk of material loss as a result of such indemnification claims is considered remote. |
| I. | Foreign Currency Translations — Foreign currency is valued at the close of the NYSE based on quotations posted by banks and major currency dealers. Portfolio securities and other assets and liabilities denominated in foreign currencies are translated into U.S. dollar amounts at date of valuation. Purchases and sales of portfolio securities (net of foreign taxes withheld on disposition) and income items denominated in foreign currencies are translated into U.S. dollar amounts on the respective dates of such transactions. The Fund does not separately account for the portion of the results of operations resulting from changes in foreign exchange rates on investments and the fluctuations arising from changes in market prices of securities held. The combined results of changes in foreign exchange rates and the fluctuation of market prices on investments (net of estimated foreign tax withholding) are included with the net realized and unrealized gain or loss from investments in the Statement of Operations. Reported net realized foreign currency gains or losses arise from (1) sales of foreign currencies, (2) currency gains or losses realized between the trade and settlement dates on securities transactions, and (3) the difference between the amounts of dividends, interest, and foreign withholding taxes recorded on the Fund’s books and the U.S. dollar equivalent of the amounts actually received or paid. Net unrealized foreign currency gains and losses arise from changes in the fair values of assets and liabilities, other than investments in securities at fiscal period end, resulting from changes in exchange rates. |
The Fund may invest in foreign securities, which may be subject to foreign taxes on income, gains on investments or currency repatriation, a portion of which may be recoverable. Foreign taxes, if any, are recorded based on the tax regulations and rates that exist in the foreign markets in which the Fund invests and are shown in the Statement of Operations.
| J. | Forward Foreign Currency Contracts — The Fund may engage in foreign currency transactions either on a spot (i.e. for prompt delivery and settlement) basis, or through forward foreign currency contracts, to manage or minimize currency or exchange rate risk. |
The Fund may also enter into forward foreign currency contracts for the purchase or sale of a security denominated in a foreign currency in order to “lock in” the U.S. dollar price of that security, or the Fund may also enter into forward foreign currency contracts that do not provide for physical settlement of the two currencies, but instead are settled by a single cash payment calculated as the difference between the agreed upon exchange rate and the spot rate at settlement based upon an agreed upon notional amount (non-deliverable forwards). The Fund will set aside liquid assets in an amount equal to daily mark-to-market obligation for forward foreign currency contracts.
A forward foreign currency contract is an obligation between two parties (“Counterparties”) to purchase or sell a specific currency for an agreed-upon price at a future date. The use of forward foreign currency contracts does not eliminate fluctuations in the price of the underlying securities the Fund owns or intends to acquire but establishes a rate of exchange in advance. Fluctuations in the value of these contracts are measured by the difference in the contract date and reporting date exchange rates and are recorded as unrealized appreciation (depreciation) until the contracts are closed. When the contracts are closed, realized gains (losses) are recorded. Realized and unrealized gains (losses) on the contracts are included in the Statement of Operations. The primary risks associated with forward foreign currency contracts include failure of the Counterparty to meet the terms of the contract and the value of the foreign currency changing unfavorably. These risks may be in excess of the amounts reflected in the Statement of Assets and Liabilities.
NOTE 2—Advisory Fees and Other Fees Paid to Affiliates
The Trust has entered into a master investment advisory agreement with Invesco Advisers, Inc. (the “Adviser” or “Invesco”). Under the terms of the investment advisory agreement, the Fund pays an advisory fee to the Adviser based on the annual rate of the Fund’s average daily net assets as follows:
| | | | | | |
| Average Daily Net Assets | | Rate |
First $1 billion | | | 0 | .67% | | |
Next $500 million | | | 0 | .645% | | |
Next $1 billion | | | 0 | .62% | | |
Next $1 billion | | | 0 | .595% | | |
Next $1 billion | | | 0 | .57% | | |
Over $4.5 billion | | | 0 | .545% | | |
For the year ended December 31, 2015, the effective advisory fees incurred by the Fund was 0.67%.
Under the terms of a master sub-advisory agreement between the Adviser and each of Invesco Asset Management Deutschland GmbH, Invesco Asset Management Limited, Invesco Asset Management (Japan) Limited, Invesco Hong Kong Limited, Invesco Senior Secured Management, Inc. and
Invesco V.I. Global Core Equity Fund
Invesco Canada Ltd. (collectively, the “Affiliated Sub-Advisers”) the Adviser, not the Fund, may pay 40% of the fees paid to the Adviser to any such Affiliated Sub-Adviser(s) that provide(s) discretionary investment management services to the Fund based on the percentage of assets allocated to such Affiliated Sub-Adviser(s).
The Adviser has contractually agreed, through at least June 30, 2016, to waive advisory fees and/or reimburse expenses of all shares to the extent necessary to limit total annual fund operating expenses after fee waiver and/or expense reimbursement (excluding certain items discussed below) of Series I shares to 2.25% and Series II shares to 2.50% of average daily net assets. In determining the Adviser’s obligation to waive advisory fees and/or reimburse expenses, the following expenses are not taken into account, and could cause the total annual fund operating expenses after fee waiver and/or expense reimbursement to exceed the numbers reflected above: (1) interest; (2) taxes; (3) dividend expense on short sales; (4) extraordinary or non-routine items, including litigation expenses; and (5) expenses that the Fund has incurred but did not actually pay because of an expense offset arrangement. Unless Invesco continues the fee waiver agreement, it will terminate on June 30, 2016. The fee waiver agreement cannot be terminated during its term. The Adviser did not waive fees and/or reimburse expenses during the period under this expense limitation.
The Adviser has contractually agreed, through at least June 30, 2017, to waive the advisory fee payable by the Fund in an amount equal to 100% of the net advisory fees the Adviser receives from the affiliated money market funds on investments by the Fund of uninvested cash in such affiliated money market funds.
For the year ended December 31, 2015, the Adviser waived advisory fees of $679.
The Trust has entered into a master administrative services agreement with Invesco pursuant to which the Fund has agreed to pay Invesco a fee for costs incurred in providing accounting services and fund administrative services to the Fund and to reimburse Invesco for administrative services fees paid to insurance companies that have agreed to provide services to the participants of separate accounts. These administrative services provided by the insurance companies may include, among other things: the printing of prospectuses, financial reports and proxy statements and the delivery of the same to existing participants; the maintenance of master accounts; the facilitation of purchases and redemptions requested by the participants; and the servicing of participants’ accounts. Pursuant to such agreement, for the year ended December 31, 2015, Invesco was paid $50,000 for accounting and fund administrative services and reimbursed $176,118 for services provided by insurance companies.
The Trust has entered into a transfer agency and service agreement with Invesco Investment Services, Inc. (“IIS”) pursuant to which the Fund has agreed to pay IIS a fee for providing transfer agency and shareholder services to the Fund and reimburse IIS for certain expenses incurred by IIS in the course of providing such services. For the year ended December 31, 2015, expenses incurred under the agreement are shown in the Statement of Operations as Transfer agent fees.
The Trust has entered into a master distribution agreement with Invesco Distributors, Inc. (“IDI”) to serve as the distributor for the Fund. The Trust has adopted a plan pursuant to Rule 12b-1 under the 1940 Act with respect to the Fund’s Series II shares (the “Plan”). The Fund, pursuant to the Plan, pays IDI compensation at the annual rate of 0.25% of the Fund’s average daily net assets of Series II shares. Of the Plan payments, up to 0.25% of the average daily net assets of the Series II shares may be paid to insurance companies who furnish continuing personal shareholder services to customers who purchase and own Series II shares of the Fund. For the year ended December 31, 2015, expenses incurred under the Plan are detailed in the Statement of Operations as Distribution fees.
For the year ended December 31, 2015, the Fund incurred $282 in brokerage commissions with Invesco Capital Markets, Inc., an affiliate of the Adviser and IDI, for portfolio transactions executed on behalf of the Fund.
Certain officers and trustees of the Trust are officers and directors of the Adviser, IIS and/or IDI.
NOTE 3—Additional Valuation Information
GAAP defines fair value as the price that would be received to sell an asset or paid to transfer a liability in an orderly transaction between market participants at the measurement date, under current market conditions. GAAP establishes a hierarchy that prioritizes the inputs to valuation methods, giving the highest priority to readily available unadjusted quoted prices in an active market for identical assets (Level 1) and the lowest priority to significant unobservable inputs (Level 3), generally when market prices are not readily available or are unreliable. Based on the valuation inputs, the securities or other investments are tiered into one of three levels. Changes in valuation methods may result in transfers in or out of an investment’s assigned level:
| | Level 1 — | Prices are determined using quoted prices in an active market for identical assets. |
| | Level 2 — | Prices are determined using other significant observable inputs. Observable inputs are inputs that other market participants may use in pricing a security. These may include quoted prices for similar securities, interest rates, prepayment speeds, credit risk, yield curves, loss severities, default rates, discount rates, volatilities and others. |
| | Level 3 — | Prices are determined using significant unobservable inputs. In situations where quoted prices or observable inputs are unavailable (for example, when there is little or no market activity for an investment at the end of the period), unobservable inputs may be used. Unobservable inputs reflect the Fund’s own assumptions about the factors market participants would use in determining fair value of the securities or instruments and would be based on the best available information. |
Invesco V.I. Global Core Equity Fund
The following is a summary of the tiered valuation input levels, as of December 31, 2015. The level assigned to the securities valuations may not be an indication of the risk or liquidity associated with investing in those securities. Because of the inherent uncertainties of valuation, the values reflected in the financial statements may materially differ from the value received upon actual sale of those investments.
| | | | | | | | | | | | | | | | |
| | | Level 1 | | | Level 2 | | | Level 3 | | | Total | |
Australia | | $ | — | | | $ | 848,185 | | | $ | — | | | $ | 848,185 | |
Canada | | | 836,623 | | | | — | | | | — | | | | 836,623 | |
China | | | 743,116 | | | | — | | | | — | | | | 743,116 | |
Finland | | | — | | | | 792,782 | | | | — | | | | 792,782 | |
France | | | — | | | | 3,516,158 | | | | — | | | | 3,516,158 | |
Hong Kong | | | — | | | | 1,089,035 | | | | — | | | | 1,089,035 | |
Ireland | | | 1,196,995 | | | | — | | | | — | | | | 1,196,995 | |
Israel | | | 494,335 | | | | — | | | | — | | | | 494,335 | |
Japan | | | — | | | | 5,934,259 | | | | — | | | | 5,934,259 | |
Netherlands | | | — | | | | 2,462,685 | | | | — | | | | 2,462,685 | |
Singapore | | | — | | | | 779,692 | | | | — | | | | 779,692 | |
Sweden | | | — | | | | 489,874 | | | | — | | | | 489,874 | |
Switzerland | | | 798,709 | | | | 2,955,216 | | | | — | | | | 3,753,925 | |
Taiwan | | | — | | | | 1,259,427 | | | | — | | | | 1,259,427 | |
United Kingdom | | | 6,105,110 | | | | 2,697,055 | | | | — | | | | 8,802,165 | |
United States | | | 45,426,027 | | | | — | | | | — | | | | 45,426,027 | |
Total Investments | | $ | 55,600,915 | | | $ | 22,824,368 | | | $ | — | | | $ | 78,425,283 | |
NOTE 4—Trustees’ and Officers’ Fees and Benefits
Trustees’ and Officers’ Fees and Benefits include amounts accrued by the Fund to pay remuneration to certain Trustees and Officers of the Fund. Trustees have the option to defer compensation payable by the Fund, and Trustees’ and Officers’ Fees and Benefits also include amounts accrued by the Fund to fund such deferred compensation amounts. Those Trustees who defer compensation have the option to select various Invesco Funds in which their deferral accounts shall be deemed to be invested. Finally, certain current Trustees were eligible to participate in a retirement plan that provided for benefits to be paid upon retirement to Trustees over a period of time based on the number of years of service. The Fund may have certain former Trustees who also participate in a retirement plan and receive benefits under such plan. Trustees’ and Officers’ Fees and Benefits include amounts accrued by the Fund to fund such retirement benefits. Obligations under the deferred compensation and retirement plans represent unsecured claims against the general assets of the Fund.
NOTE 5—Cash Balances
The Fund is permitted to temporarily carry a negative or overdrawn balance in its account with State Street Bank and Trust Company, the custodian bank. Such balances, if any at period end, are shown in the Statement of Assets and Liabilities under the payable caption Amount due custodian. To compensate the custodian bank for such overdrafts, the overdrawn Fund may either (1) leave funds as a compensating balance in the account so the custodian bank can be compensated by earning the additional interest; or (2) compensate by paying the custodian bank at a rate agreed upon by the custodian bank and Invesco, not to exceed the contractually agreed upon rate.
NOTE 6—Distributions to Shareholders and Tax Components of Net Assets
Tax Character of Distributions to Shareholders Paid During the Fiscal Years Ended December 31, 2015 and 2014:
| | | | | | | | |
| | | 2015 | | | 2014 | |
Ordinary income | | $ | 1,102,138 | | | $ | 1,851,579 | |
Long-term capital gain | | | 2,967,734 | | | | — | |
Total distributions | | $ | 4,069,872 | | | $ | 1,851,579 | |
Tax Components of Net Assets at Period-End:
| | | | |
| | | 2015 | |
Undistributed ordinary income | | $ | 703,774 | |
Net unrealized appreciation (depreciation) — investments | | | (545,866 | ) |
Net unrealized appreciation (depreciation) — other investments | | | (5,834 | ) |
Temporary book/tax differences | | | (35,073 | ) |
Capital loss carryforward | | | (5,657,589 | ) |
Shares of beneficial interest | | | 83,993,834 | |
Total net assets | | $ | 78,453,246 | |
Invesco V.I. Global Core Equity Fund
The difference between book-basis and tax-basis unrealized appreciation (depreciation) is due to differences in the timing of recognition of gains and losses on investments for tax and book purposes. The Fund’s net unrealized appreciation (depreciation) difference is attributable primarily to wash sales and the tax treatment of passive foreign investment companies.
The temporary book/tax differences are a result of timing differences between book and tax recognition of income and/or expenses. The Fund’s temporary book/tax differences are the result of the trustee deferral of compensation and retirement plan benefits.
Capital loss carryforward is calculated and reported as of a specific date. Results of transactions and other activity after that date may affect the amount of capital loss carryforward actually available for the Fund to utilize. Capital losses generated in years beginning after December 22, 2010 can be carried forward for an unlimited period, whereas previous losses expire in eight tax years. Capital losses with an expiration period may not be used to offset capital gains until all net capital losses without an expiration date have been utilized. Capital loss carryforwards with no expiration date will retain their character as either short-term or long-term capital losses instead of as short-term capital losses as under prior law. The ability to utilize capital loss carryforwards in the future may be limited under the Internal Revenue Code and related regulations based on the results of future transactions.
The Fund has a capital loss carryforward as of December 31, 2015, which expires as follows:
| | | | | | | | | | | | |
| Capital Loss Carryforward* | |
| Expiration | | Short-Term | | | Long-Term | | | Total | |
December 31, 2017 | | $ | 5,657,589 | | | $ | — | | | $ | 5,657,589 | |
| * | Capital loss carryforward as of the date listed above is reduced for limitations, if any, to the extent required by the Internal Revenue Code and may be further limited depending upon a variety of factors, including the realization of net unrealized gains or losses as of the date of any reorganization. |
NOTE 7—Investment Securities
The aggregate amount of investment securities (other than short-term securities, U.S. Treasury obligations and money market funds, if any) purchased and sold by the Fund during the year ended December 31, 2015 was $64,869,556 and $73,837,992, respectively. Cost of investments on a tax basis includes the adjustments for financial reporting purposes as of the most recently completed federal income tax reporting period-end.
| | | | |
| Unrealized Appreciation (Depreciation) of Investment Securities on a Tax Basis | |
Aggregate unrealized appreciation of investment securities | | $ | 5,823,582 | |
Aggregate unrealized (depreciation) of investment securities | | | (6,369,448 | ) |
Net unrealized appreciation (depreciation) of investment securities | | $ | (545,866 | ) |
Cost of investments for tax purposes is $78,971,149.
NOTE 8—Reclassification of Permanent Differences
Primarily as a result of differing book/tax treatment of foreign currency transactions and distributions, on December 31, 2015, undistributed net investment income was decreased by $30,411, undistributed net realized gain (loss) was increased by $33,679 and shares of beneficial interest was decreased by $3,268. This reclassification had no effect on the net assets of the Fund.
NOTE 9—Share Information
| | | | | | | | | | | | | | | | |
| | | Summary of Share Activity | |
| | | Years ended December 31, | |
| | | 2015(a) | | | 2014 | |
| | | Shares | | | Amount | | | Shares | | | Amount | |
Sold: | | | | | | | | | | | | | | | | |
Series I | | | 579,461 | | | $ | 5,386,251 | | | | 549,322 | | | $ | 5,025,349 | |
Series II | | | 16,698 | | | | 149,459 | | | | 18,390 | | | | 164,182 | |
| | | | |
Issued as reinvestment of dividends: | | | | | | | | | | | | | | | | |
Series I | | | 421,668 | | | | 3,411,296 | | | | 172,959 | | | | 1,568,741 | |
Series II | | | 81,327 | | | | 657,932 | | | | 31,158 | | | | 282,599 | |
| | | | |
Reacquired: | | | | | | | | | | | | | | | | |
Series I | | | (1,455,728 | ) | | | (13,250,812 | ) | | | (1,740,296 | ) | | | (15,837,479 | ) |
Series II | | | (299,886 | ) | | | (2,743,679 | ) | | | (610,889 | ) | | | (5,603,644 | ) |
Net increase (decrease) in share activity | | | (656,460 | ) | | $ | (6,389,553 | ) | | | (1,579,356 | ) | | $ | (14,400,252 | ) |
| (a) | There are entities that are record owners of more than 5% of the outstanding shares of the Fund and in the aggregate own 85% of the outstanding shares of the Fund. The Fund and the Fund’s principal underwriter or adviser, are parties to participation agreements with these entities whereby these entities sell units of interest in separate accounts funding variable products that are invested in the Fund. The Fund, Invesco and/or Invesco affiliates may make payments to these entities, which are considered to be related to the Fund, for providing services to the Fund, Invesco and/or Invesco affiliates including but not limited to services such as, securities brokerage, third party record keeping and account servicing and administrative services. The Fund has no knowledge as to whether all or any portion of the shares owned of record by these entities are also owned beneficially. |
Invesco V.I. Global Core Equity Fund
NOTE 10—Financial Highlights
The following schedule presents financial highlights for a share of the Fund outstanding throughout the periods indicated.
| | | | | | | | | | | | | | | | | | | | | | | | | | | | | | | | | | | | | | | | | | | | | | | | | | | | | | | | |
| | | Net asset
value,
beginning
of period | | | Net
investment
income(a) | | | Net gains
(losses) on securities (both
realized and unrealized) | | | Total from
investment operations | | | Dividends
from net
investment income | | | Distributions from net
realized gains | | | Total
distributions | | | Net asset value, end of period | | | Total
return(b) | | | Net assets, end of period
(000’s omitted) | | | Ratio of
expenses to average net assets
with fee waivers
and/or expenses absorbed | | | Ratio of
expenses
to average net
assets without fee waivers
and/or expenses
absorbed | | | Ratio of net
investment
income to average
net assets | | | Portfolio
turnover(c) | |
Series I | | | | | | | | | | | | | | | | | | | | | | | | | | | | | | | | | | | | | | | | | | | | | | | | | | | | | | | | |
Year ended 12/31/15 | | $ | 8.94 | | | $ | 0.09 | | | $ | (0.23 | ) | | $ | (0.14 | ) | | $ | (0.13 | ) | | $ | (0.32 | ) | | $ | (0.45 | ) | | $ | 8.35 | | | | (1.42 | )% | | $ | 65,167 | | | | 1.06 | %(d) | | | 1.06 | %(d) | | | 0.98 | %(d) | | | 75 | % |
Year ended 12/31/14 | | | 9.06 | | | | 0.12 | | | | (0.05 | ) | | | 0.07 | | | | (0.19 | ) | | | — | | | | (0.19 | ) | | | 8.94 | | | | 0.69 | | | | 73,816 | | | | 1.06 | | | | 1.06 | | | | 1.26 | | | | 123 | |
Year ended 12/31/13 | | | 7.54 | | | | 0.15 | | | | 1.54 | | | | 1.69 | | | | (0.17 | ) | | | — | | | | (0.17 | ) | | | 9.06 | | | | 22.50 | | | | 83,982 | | | | 1.08 | | | | 1.08 | | | | 1.81 | | | | 32 | |
Year ended 12/31/12 | | | 6.80 | | | | 0.14 | | | | 0.79 | | | | 0.93 | | | | (0.19 | ) | | | — | | | | (0.19 | ) | | | 7.54 | | | | 13.75 | | | | 74,517 | | | | 1.00 | | | | 1.08 | | | | 1.98 | | | | 23 | |
Year ended 12/31/11 | | | 7.87 | | | | 0.20 | | | | (1.02 | ) | | | (0.82 | ) | | | (0.25 | ) | | | — | | | | (0.25 | ) | | | 6.80 | | | | (10.89 | ) | | | 78,125 | | | | 0.97 | | | | 1.00 | | | | 2.70 | | | | 62 | |
Series II | | | | | | | | | | | | | | | | | | | | | | | | | | | | | | | | | | | | | | | | | | | | | | | | | | | | | | | | |
Year ended 12/31/15 | | | 8.93 | | | | 0.07 | | | | (0.23 | ) | | | (0.16 | ) | | | (0.10 | ) | | | (0.32 | ) | | | (0.42 | ) | | | 8.35 | | | | (1.65 | ) | | | 13,286 | | | | 1.31 | (d) | | | 1.31 | (d) | | | 0.73 | (d) | | | 75 | |
Year ended 12/31/14 | | | 9.04 | | | | 0.10 | | | | (0.05 | ) | | | 0.05 | | | | (0.16 | ) | | | — | | | | (0.16 | ) | | | 8.93 | | | | 0.48 | | | | 16,010 | | | | 1.31 | | | | 1.31 | | | | 1.01 | | | | 123 | |
Year ended 12/31/13 | | | 7.52 | | | | 0.13 | | | | 1.53 | | | | 1.66 | | | | (0.14 | ) | | | — | | | | (0.14 | ) | | | 9.04 | | | | 22.25 | | | | 21,279 | | | | 1.33 | | | | 1.33 | | | | 1.56 | | | | 32 | |
Year ended 12/31/12 | | | 6.79 | | | | 0.12 | | | | 0.78 | | | | 0.90 | | | | (0.17 | ) | | | — | | | | (0.17 | ) | | | 7.52 | | | | 13.41 | | | | 21,001 | | | | 1.25 | | | | 1.33 | | | | 1.73 | | | | 23 | |
Year ended 12/31/11 | | | 7.86 | | | | 0.18 | | | | (1.02 | ) | | | (0.84 | ) | | | (0.23 | ) | | | — | | | | (0.23 | ) | | | 6.79 | | | | (11.12 | ) | | | 21,742 | | | | 1.22 | | | | 1.25 | | | | 2.45 | | | | 62 | |
| (a) | Calculated using average shares outstanding. |
| (b) | Includes adjustments in accordance with accounting principles generally accepted in the United States of America and as such, the net asset value for financial reporting purposes and the returns based upon those net asset values may differ from the net asset value and returns for shareholder transactions. Total returns are not annualized for periods less than one year, if applicable, and do not reflect charges assessed in connection with a variable product, which if included would reduce total returns. |
| (c) | Portfolio turnover is calculated at the fund level and is not annualized for periods less than one year, if applicable. For the period ended December 31. 2011, the portfolio turnover calculation excludes the value of securities purchased of $68,458,544 and sold of $8,561.566 in the effort to realign the Fund’s portfolio holdings after the reorganization of Invesco V.I. Dividend Growth Fund into the Fund. |
| (d) | Ratios are based on average daily net assets (000’s omitted) of $72,024 for Series I and $15,070 for Series II, respectively. |
Invesco V.I. Global Core Equity Fund
Report of Independent Registered Public Accounting Firm
To the Board of Trustees of AIM Variable Insurance Funds (Invesco Variable Insurance Funds)
and Shareholders of Invesco V.I. Global Core Equity Fund:
In our opinion, the accompanying statement of assets and liabilities, including the schedule of investments, and the related statements of operations and of changes in net assets and the financial highlights present fairly, in all material respects, the financial position of Invesco V.I. Global Core Equity Fund (one of the funds constituting AIM Variable Insurance Funds (Invesco Variable Insurance Funds), hereafter referred to as the “Fund”) at December 31, 2015, the results of its operations for the year then ended, the changes in its net assets for each of the two years in the period then ended and the financial highlights for each of the five years in the period then ended, in conformity with accounting principles generally accepted in the United States of America. These financial statements and financial highlights (hereafter referred to as “financial statements”) are the responsibility of the Fund’s management. Our responsibility is to express an opinion on these financial statements based on our audits. We conducted our audits of these financial statements in accordance with the standards of the Public Company Accounting Oversight Board (United States). Those standards require that we plan and perform the audit to obtain reasonable assurance about whether the financial statements are free of material misstatement. An audit includes examining, on a test basis, evidence supporting the amounts and disclosures in the financial statements, assessing the accounting principles used and significant estimates made by management, and evaluating the overall financial statement presentation. We believe that our audits, which included confirmation of securities at December 31, 2015 by correspondence with the custodian, provide a reasonable basis for our opinion.
PRICEWATERHOUSECOOPERS LLP
Houston, Texas
February 15, 2016
Invesco V.I. Global Core Equity Fund
Calculating your ongoing Fund expenses
Example
As a shareholder of the Fund, you incur ongoing costs, including management fees; distribution and/or service fees (12b-1); and other Fund expenses. This example is intended to help you understand your ongoing costs (in dollars) of investing in the Fund and to compare these costs with ongoing costs of investing in other mutual funds. The example is based on an investment of $1,000 invested at the beginning of the period and held for the entire period July 1, 2015 through December 31, 2015.
The actual and hypothetical expenses in the examples below do not represent the effect of any fees or other expenses assessed in connection with a variable product; if they did, the expenses shown would be higher while the ending account values shown would be lower.
Actual expenses
The table below provides information about actual account values and actual expenses. You may use the information in this table, together with the amount you invested, to estimate the expenses that you paid over the period. Simply divide your account value by $1,000 (for example, an $8,600 account value divided by $1,000 = 8.6), then multiply the result by the number in the table under the heading entitled “Actual Expenses Paid During Period” to estimate the expenses you paid on your account during this period.
Hypothetical example for comparison purposes
The table below also provides information about hypothetical account values and hypothetical expenses based on the Fund’s actual expense ratio and an assumed rate of return of 5% per year before expenses, which is not the Fund’s actual return.
The hypothetical account values and expenses may not be used to estimate the actual ending account balance or expenses you paid for the period. You may use this information to compare the ongoing costs of investing in the Fund and other funds. To do so, compare this 5% hypothetical example with the 5% hypothetical examples that appear in the shareholder reports of the other funds.
Please note that the expenses shown in the table are meant to highlight your ongoing costs. Therefore, the hypothetical information is useful in comparing ongoing costs, and will not help you determine the relative total costs of owning different funds.
| | | | | | | | | | | | | | | | | | | | | | | | |
| Class | | Beginning Account Value (07/01/15) | | | ACTUAL | | | HYPOTHETICAL (5% annual return before expenses) | | | Annualized Expense Ratio | |
| | | Ending Account Value (12/31/15)1 | | | Expenses Paid During Period2 | | | Ending Account Value (12/31/15) | | | Expenses Paid During Period2 | | |
| Series I | | $ | 1,000.00 | | | $ | 945.60 | | | $ | 5.25 | | | $ | 1,019.81 | | | $ | 5.45 | | | | 1.07 | % |
| Series II | | | 1,000.00 | | | | 945.40 | | | | 6.47 | | | | 1,018.55 | | | | 6.72 | | | | 1.32 | |
| 1 | The actual ending account value is based on the actual total return of the Fund for the period July 1, 2015 through December 31, 2015, after actual expenses and will differ from the hypothetical ending account value which is based on the Fund’s expense ratio and a hypothetical annual return of 5% before expenses. |
| 2 | Expenses are equal to the Fund’s annualized expense ratio as indicated above multiplied by the average account value over the period, multiplied by 184/365 to reflect the most recent fiscal half year. |
Invesco V.I. Global Core Equity Fund
Tax Information
Form 1099-DIV, Form 1042-S and other year–end tax information provide shareholders with actual calendar year amounts that should be included in their tax returns. Shareholders should consult their tax advisors.
The following distribution information is being provided as required by the Internal Revenue Code or to meet a specific state’s requirement.
The Fund designates the following amounts or, if subsequently determined to be different, the maximum amount allowable for its fiscal year ended December 31, 2015:
| | | | |
Federal and State Income Tax | |
Long-Term Capital Gain Distributions | | $ | 2,967,734 | |
Corporate Dividends Received Deduction* | | | 60.65 | % |
U.S. Treasury Obligations* | | | 0 | % |
| | * | The above percentages are based on ordinary income dividends paid to shareholders during the Fund’s fiscal year. |
Invesco V.I. Global Core Equity Fund
Trustees and Officers
The address of each trustee and officer is AIM Variable Insurance Funds (Invesco Variable Insurance Funds) (the “Trust”), 11 Greenway Plaza, Suite 1000, Houston, Texas 77046-1173. The trustees serve for the life of the Trust, subject to their earlier death, incapacitation, resignation, retirement or removal as more specifically provided in the Trust’s organizational documents. Each officer serves for a one year term or until their successors are elected and qualified. Column two below includes length of time served with predecessor entities, if any.
| | | | | | | | |
Name, Year of Birth and
Position(s) Held with the Trust | | Trustee and/
or Officer Since | | Principal Occupation(s)
During Past 5 Years | | Number of Funds in Fund Complex Overseen by Trustee | | Other Directorship(s) Held by Trustee During Past 5 Years |
| Interested Persons | | | | | | | | |
| Martin L. Flanagan1 — 1960 Trustee | | 2007 | | Executive Director, Chief Executive Officer and President, Invesco Ltd. (ultimate parent of Invesco and a global investment management firm); Advisor to the Board, Invesco Advisers, Inc. (formerly known as Invesco Institutional (N.A.), Inc.); Trustee, The Invesco Funds; Vice Chair, Investment Company Institute; and Member of Executive Board, SMU Cox School of Business Formerly: Chairman and Chief Executive Officer, Invesco Advisers, Inc. (registered investment adviser); Director, Chairman, Chief Executive Officer and President, IVZ Inc. (holding company), INVESCO Group Services, Inc. (service provider) and Invesco North American Holdings, Inc. (holding company); Director, Chief Executive Officer and President, Invesco Holding Company Limited (parent of Invesco and a global investment management firm); Director, Invesco Ltd.; Chairman, Investment Company Institute and President, Co-Chief Executive Officer, Co-President, Chief Operating Officer and Chief Financial Officer, Franklin Resources, Inc. (global investment management organization) | | 146 | | None |
Philip A. Taylor2 — 1954 Trustee, President and Principal Executive Officer | | 2006 | | Head of North American Retail and Senior Managing Director, Invesco Ltd.; Director, Co-Chairman, Co-President and Co-Chief Executive Officer, Invesco Advisers, Inc. (formerly known as Invesco Institutional (N.A.), Inc.) (registered investment adviser); Director, Chairman, Chief Executive Officer and President, Invesco Management Group, Inc. (formerly known as Invesco Aim Management Group, Inc.) (financial services holding company); Director and Chairman, Invesco Investment Services, Inc. (formerly known as Invesco Aim Investment Services, Inc.) (registered transfer agent) Chief Executive Officer, Invesco Corporate Class Inc. (corporate mutual fund company) Director, Chairman and Chief Executive Officer, Invesco Canada Ltd. (formerly known as Invesco Trimark Ltd./Invesco Trimark Ltèe) (registered investment adviser and registered transfer agent); Trustee, President and Principal Executive Officer, The Invesco Funds (other than AIM Treasurer’s Series Trust (Invesco Treasurer’s Series Trust), Short-Term Investments Trust and Invesco Management Trust); Trustee and Executive Vice President, The Invesco Funds (AIM Treasurer’s Series Trust (Invesco Treasurer’s Series Trust), Short-Term Investments Trust and Invesco Management Trust only); Director, Invesco Investment Advisers LLC (formerly known as Van Kampen Asset Management); Director, Chief Executive Officer and President, Van Kampen Exchange Corp. Formerly: Director and President, INVESCO Funds Group, Inc. (registered investment adviser and registered transfer agent); Director and Chairman, IVZ Distributors, Inc. (formerly known as INVESCO Distributors, Inc.) (registered broker dealer); Director, President and Chairman, Invesco Inc. (holding company), Invesco Canada Holdings Inc. (holding company), Trimark Investments Ltd./Placements Trimark Ltèe and Invesco Financial Services Ltd/Services Financiers Invesco Ltèe; Chief Executive Officer, Invesco Canada Fund Inc (corporate mutual fund company); Director and Chairman, Van Kampen Investor Services Inc.; Director, Chief Executive Officer and President, 1371 Preferred Inc. (holding company) and Van Kampen Investments Inc.; Director and President, AIM GP Canada Inc. (general partner for limited partnerships) and Van Kampen Advisors, Inc.; Director and Chief Executive Officer, Invesco Trimark Dealer Inc. (registered broker dealer); Director, Invesco Distributors, Inc. (formerly known as Invesco Aim Distributors, Inc.) (registered broker dealer); Manager, Invesco PowerShares Capital Management LLC; Director, Chief Executive Officer and President, Invesco Advisers, Inc.; Director, Chairman, Chief Executive Officer and President, Invesco Aim Capital Management, Inc.; President, Invesco Trimark Dealer Inc. and Invesco Trimark Ltd./Invesco Trimark Ltèe; Director and President, AIM Trimark Corporate Class Inc. and AIM Trimark Canada Fund Inc.; Senior Managing Director, Invesco Holding Company Limited; Director and Chairman, Fund Management Company (former registered broker dealer); President and Principal Executive Officer, The Invesco Funds (AIM Treasurer’s Series Trust (Invesco Treasurer’s Series Trust), and Short-Term Investments Trust only); President, AIM Trimark Global Fund Inc. and AIM Trimark Canada Fund Inc | | 146 | | None |
| 1 | Mr. Flanagan is considered an interested person (within the meaning of Section 2(a)(19) of the 1940 Act) of the Trust because he is an officer of the Adviser to the Trust, and an officer and a director of Invesco Ltd., ultimate parent of the Adviser. |
| 2 | Mr. Taylor is considered an interested person (within the meaning of Section 2(a)(19) of the 1940 Act) of the Trust because he is an officer and a director of the Adviser. |
Invesco V.I. Global Core Equity Fund
Trustees and Officers—(continued)
| | | | | | | | |
Name, Year of Birth and
Position(s) Held with the Trust | | Trustee and/
or Officer Since | | Principal Occupation(s)
During Past 5 Years | | Number of Funds in Fund Complex Overseen by Trustee | | Other Directorship(s)
Held by Trustee During Past 5 Years |
| Independent Trustees | | | | | | | | |
Bruce L. Crockett — 1944 Trustee and Chair | | 2003 | | Chairman, Crockett Technologies Associates (technology consulting company) Formerly: Director, Captaris (unified messaging provider); Director, President and Chief Executive Officer, COMSAT Corporation; Chairman, Board of Governors of INTELSAT (international communications company); ACE Limited (insurance company); Independent Directors Council and Investment Company Institute | | 146 | | ALPS (Attorneys Liability Protection Society) (insurance company) and Globe Specialty Metals, Inc. (metallurgical company) |
David C. Arch — 1945 Trustee | | 2010 | | Chairman of Blistex Inc., a consumer health care products manufacturer | | 146 | | Board member of the Illinois Manufacturers’ Association; Member of the Board of Visitors, Institute for the Humanities, University of Michigan |
James T. Bunch — 1942 Trustee | | 2000 | | Managing Member, Grumman Hill Group LLC (family office/private equity investments) Formerly: Chairman of the Board of Trustees, Evans Scholars Foundation and Chairman, Board of Governors, Western Golf Association | | 146 | | Trustee, Evans Scholars Foundation; and Chairman of the Board, Denver Film Society |
Albert R. Dowden — 1941 Trustee | | 2003 | | Director of a number of public and private business corporations, including the Boss Group, Ltd. (private investment and management); Nature’s Sunshine Products, Inc. and Reich & Tang Funds (5 portfolios) (registered investment company) Formerly: Director, Homeowners of America Holding Corporation/Homeowners of America Insurance Company (property casualty company); Director, Continental Energy Services, LLC (oil and gas pipeline service); Director, CompuDyne Corporation (provider of product and services to the public security market) and Director, Annuity and Life Re (Holdings), Ltd. (reinsurance company); Director, President and Chief Executive Officer, Volvo Group North America, Inc.; Senior Vice President, AB Volvo; Director of various public and private corporations; Chairman, DHJ Media, Inc.; Director, Magellan Insurance Company; and Director, The Hertz Corporation, Genmar Corporation (boat manufacturer), National Media Corporation; Advisory Board of Rotary Power International (designer, manufacturer, and seller of rotary power engines); and Chairman, Cortland Trust, Inc. (registered investment company) | | 146 | | Director of: Nature’s Sunshine Products, Inc., Reich & Tang Funds, Homeowners of America Holding Corporation/ Homeowners of America Insurance Company, the Boss Group |
Jack M. Fields — 1952 Trustee | | 2003 | | Chief Executive Officer, Twenty First Century Group, Inc. (government affairs company); Owner and Chief Executive Officer, Dos Angeles Ranch, L.P. (cattle, hunting, corporate entertainment); and Discovery Global Education Fund (non-profit) Formerly: Chief Executive Officer, Texana Timber LP (sustainable forestry company); Director of Cross Timbers Quail Research Ranch (non-profit); and member of the U.S. House of Representatives | | 146 | | Insperity, Inc. (formerly known as Administaff) |
Eli Jones — Trustee | | 2016 | | Professor and Dean, Mays Business School, Texas A&M University Formerly: Professor and Dean, Walton College of Business, University of Arkansas, and E.J. Ourso College of Business, Louisiana State University | | 146 | | Director, Insperity, Inc., (2011-present) and ARVEST Bank (2012-2015) |
Prema Mathai-Davis — 1950 Trustee | | 2003 | | Retired. Formerly: Chief Executive Officer, YWCA of the U.S.A. | | 146 | | None |
Larry Soll — 1942 Trustee | | 1997 | | Retired. Formerly: Chairman, Chief Executive Officer and President, Synergen Corp. (a biotechnology company) | | 146 | | None |
Robert C. Troccoli — Trustee | | 2016 | | Retired. Formerly: Senior Partner, KPMG LLP | | 146 | | None |
Raymond Stickel, Jr. — 1944 Trustee | | 2005 | | Retired. Formerly: Director, Mainstay VP Series Funds, Inc. (25 portfolios) and Partner, Deloitte & Touche | | 146 | | None |
Suzanne H. Woolsey — 1941 Trustee | | 2014 | | Chief Executive Officer of Woolsey Partners LLC | | 146 | | Emeritus Chair of the Board of Trustees of the Institute for Defense Analyses; Trustee of Colorado College; Trustee of California Institute of Technology; Prior to 2014, Director of Fluor Corp.; Prior to 2010, Trustee of the German Marshall Fund of the United States; Prior to 2010 Trustee of the Rocky Mountain Institute |
Invesco V.I. Global Core Equity Fund
Trustees and Officers—(continued)
| | | | | | | | |
Name, Year of Birth and
Position(s) Held with the Trust | | Trustee and/
or Officer Since | | Principal Occupation(s)
During Past 5 Years | | Number of Funds in Fund Complex Overseen by Trustee | | Other Directorship(s)
Held by Trustee During Past 5 Years |
| Other Officers | | | | | | | | |
Russell C. Burk — 1958 Senior Vice President and Senior Officer | | 2005 | | Senior Vice President and Senior Officer, The Invesco Funds | | N/A | | N/A |
John M. Zerr — 1962 Senior Vice President, Chief Legal Officer and Secretary | | 2006 | | Director, Senior Vice President, Secretary and General Counsel, Invesco Management Group, Inc. (formerly known as Invesco Aim Management Group, Inc.) and Van Kampen Exchange Corp.; Senior Vice President, Invesco Advisers, Inc. (formerly known as Invesco Institutional (N.A.), Inc.) (registered investment adviser); Senior Vice President and Secretary, Invesco Distributors, Inc. (formerly known as Invesco Aim Distributors, Inc.); Director, Vice President and Secretary, Invesco Investment Services, Inc. (formerly known as Invesco Aim Investment Services, Inc.); Senior Vice President, Chief Legal Officer and Secretary, The Invesco Funds; Managing Director, Invesco PowerShares Capital Management LLC; Director, Secretary and General Counsel, Invesco Investment Advisers LLC (formerly known as Van Kampen Asset Management); Secretary and General Counsel, Invesco Capital Markets, Inc. (formerly known as Van Kampen Funds Inc.) and Chief Legal Officer, PowerShares Exchange-Traded Fund Trust, PowerShares Exchange-Traded Fund Trust II, PowerShares India Exchange-Traded Fund Trust, PowerShares Actively Managed Exchange-Traded Fund Trust, and PowerShares Actively Managed Exchange-Traded Commodity Fund Trust Formerly: Director, Vice President and Secretary, IVZ Distributors, Inc. (formerly known as INVESCO distributors, Inc.); Director and Vice President, INVESCO Funds Group, Inc.; Director and Vice President, Van Kampen Advisors Inc.; Director, Vice President, Secretary and General Counsel, Van Kampen Investor Services Inc.; Director, Invesco Distributors, Inc. (formerly known as Invesco Aim Distributors, Inc.); Director, Senior Vice President, General Counsel and Secretary, Invesco Aim Advisers, Inc. and Van Kampen Investments Inc.; Director, Vice President and Secretary, Fund Management Company; Director, Senior Vice President, Secretary, General Counsel and Vice President, Invesco Aim Capital Management, Inc.; Chief Operating Officer and General Counsel, Liberty Ridge Capital, Inc. (an investment adviser); Vice President and Secretary, PBHG Funds (an investment company) and PBHG Insurance Series Fund (an investment company); Chief Operating Officer, General Counsel and Secretary, Old Mutual Investment Partners (a broker-dealer); General Counsel and Secretary, Old Mutual Fund Services (an administrator) and Old Mutual Shareholder Services (a shareholder servicing center); Executive Vice President, General Counsel and Secretary, Old Mutual Capital, Inc. (an investment adviser); and Vice President and Secretary, Old Mutual Advisors Funds (an investment company) | | N/A | | N/A |
Sheri Morris — 1964 Vice President, Treasurer and Principal Financial Officer | | 2003 | | Vice President, Treasurer and Principal Financial Officer, The Invesco Funds; Vice President, Invesco Advisers, Inc. (formerly known as Invesco Institutional (N.A.), Inc.) (registered investment adviser); and Vice President, PowerShares Exchange-Traded Fund Trust, PowerShares Exchange-Traded Fund Trust II, PowerShares India Exchange-Traded Fund Trust, PowerShares Actively Managed Exchange-Traded Fund Trust, and PowerShares Actively Managed Exchange-Traded Commodity Fund Trust Formerly: Vice President, Invesco Aim Advisers, Inc., Invesco Aim Capital Management, Inc. and Invesco Aim Private Asset Management, Inc.; Assistant Vice President and Assistant Treasurer, The Invesco Funds and Assistant Vice President, Invesco Advisers, Inc., Invesco Aim Capital Management, Inc. and Invesco Aim Private Asset Management, Inc.; and Treasurer, PowerShares Exchange-Traded Fund Trust, PowerShares Exchange-Traded Fund Trust II, PowerShares India Exchange-Traded Fund Trust and PowerShares Actively Managed Exchange-Traded Fund Trust | | N/A | | N/A |
Invesco V.I. Global Core Equity Fund
Trustees and Officers—(continued)
| | | | | | | | |
Name, Year of Birth and
Position(s) Held with the Trust | | Trustee and/
or Officer Since | | Principal Occupation(s)
During Past 5 Years | | Number of Funds in Fund Complex Overseen by Trustee | | Other Directorship(s)
Held by Trustee During Past 5 Years |
| Other Officers—(continued) | | | | | | | | |
Karen Dunn Kelley — 1960 Vice President | | 2003 | | Senior Managing Director, Investments, Invesco Ltd.; Director, Co-President, Co-Chief Executive Officer, and Co-Chairman, Invesco Advisers, Inc. (formerly known as Invesco Institutional (N.A.), Inc.) (registered investment adviser); Chairman, Invesco Senior Secured Management, Inc.; Senior Vice President, Invesco Management Group, Inc. (formerly known as Invesco Aim Management Group, Inc.); Executive Vice President, Invesco Distributors, Inc. (formerly known as Invesco Aim Distributors, Inc.); Director, Invesco Mortgage Capital Inc. and Invesco Management Company Limited; Vice President, The Invesco Funds (other than AIM Treasurer’s Series Trust (Invesco Treasurer’s Series Trust), Short-Term Investments Trust and Invesco Management Trust); and President and Principal Executive Officer, The Invesco Funds (AIM Treasurer’s Series Trust (Invesco Treasurer’s Series Trust), Short-Term Investments Trust and Invesco Management Trust only) Formerly: Director and President, INVESCO Asset Management (Bermuda) Ltd., Director, INVESCO Global Asset Management Limited and INVESCO Management S.A.; Senior Vice President, Van Kampen Investments Inc. and Invesco Advisers, Inc. (formerly known as Invesco Institutional (N.A.), Inc.) (registered investment adviser); Vice President, Invesco Advisers, Inc. (formerly known as Invesco Institutional (N.A.), Inc.); Director of Cash Management and Senior Vice President, Invesco Advisers, Inc. and Invesco Aim Capital Management, Inc.; Director and President, Fund Management Company; Chief Cash Management Officer, Director of Cash Management, Senior Vice President, and Managing Director, Invesco Aim Capital Management, Inc.; Director of Cash Management, Senior Vice President, and Vice President, Invesco Advisers, Inc. and The Invesco Funds (AIM Treasurer’s Series Trust (Invesco Treasurer’s Series Trust), and Short-Term Investments Trust only) | | N/A | | N/A |
Crissie M. Wisdom — 1969 Anti-Money Laundering Compliance Officer | | 2013 | | Anti-Money Laundering Compliance Officer, Invesco Advisers, Inc. (formerly known as Invesco Institutional (N.A.), Inc.) (registered investment adviser), Invesco Capital Markets, Inc. (formerly known as Van Kampen Funds Inc.), Invesco Distributors, Inc., Invesco Investment Services, Inc., Invesco Management Group, Inc., Van Kampen Exchange Corp., The Invesco Funds, and PowerShares Exchange-Traded Fund Trust, PowerShares Exchange-Traded Fund Trust II, PowerShares India Exchange-Traded Fund Trust, PowerShares Actively Managed Exchange-Traded Fund Trust and PowerShares Actively Managed Exchange-Traded Commodity Fund Trust; Anti-Money Laundering Compliance Officer and Bank Secrecy Act Officer, INVESCO National Trust Company and Invesco Trust Company; and Fraud Prevention Manager and Controls and Risk Analysis Manager for Invesco Investment Services, Inc. | | N/A | | N/A |
Lisa O. Brinkley — 1959 Chief Compliance Officer | | 2015 | | Senior Vice President and Chief Compliance Officer, Invesco Advisers, Inc. (registered investment adviser) (formerly known as Invesco Institutional (N.A., Inc.); and Chief Compliance Officer, The Invesco Funds Formerly: Global Assurance Officer, Invesco Ltd. and Vice President, The Invesco Funds; Chief Compliance Officer, Invesco Distributors, Inc. (formerly known as Invesco Aim Distributors, Inc.), Invesco Investment Services, Inc.(formerly known as Invesco Aim Investment Services, Inc.) and Van Kampen Investor Services Inc.; Senior Vice President, Invesco Management Group, Inc.; Senior Vice President and Chief Compliance Officer, Invesco Advisers, Inc. and The Invesco Funds; Vice President and Chief Compliance Officer, Invesco Aim Capital Management, Inc. and Invesco Distributors, Inc.; Vice President, Invesco Investment Services, Inc. and Fund Management Company | | N/A | | N/A |
The Statement of Additional Information of the Trust includes additional information about the Fund’s Trustees and is available upon request, without charge, by calling 1.800.959.4246. Please refer to the Fund’s prospectus for information on the Fund’s sub-advisers.
| | | | | | |
Office of the Fund 11 Greenway Plaza, Suite 1000 Houston, TX 77046-1173 | | Investment Adviser Invesco Advisers, Inc. 1555 Peachtree Street, N.E. Atlanta, GA 30309 | | Distributor Invesco Distributors, Inc. 11 Greenway Plaza, Suite 1000 Houston, TX 77046-1173 | | Auditors PricewaterhouseCoopers LLP 1000 Louisiana Street, Suite 5800 Houston, TX 77002-5678 |
| | | |
| | | | | | |
Counsel to the Fund Stradley Ronon Stevens & Young, LLP 2005 Market Street, Suite 2600 Philadelphia, PA 19103-7018 | | Counsel to the Independent Trustees Goodwin Procter LLP 901 New York Avenue, N.W. Washington, D.C. 20001 | | Transfer Agent Invesco Investment Services, Inc. 11 Greenway Plaza, Suite 1000 Houston, TX 77046-1173 | | Custodian State Street Bank and Trust Company 225 Franklin Street Boston, MA 02110-2801 |
Invesco V.I. Global Core Equity Fund
| | | | |
| | |
 | | Annual Report to Shareholders | | December 31, 2015 |
| | |
| | Invesco V.I. Global Health Care Fund |

| | |
| | The Fund provides a complete list of its holdings four times in each fiscal year, at the quarter-ends. For the second and fourth quarters, the lists appear in the Fund’s semiannual and annual reports to shareholders. For the first and third quarters, the Fund files the lists with the Securities and Exchange Commission (SEC) on Form N-Q. The Fund’s Form N-Q filings are available on the SEC website, sec.gov. Copies of the Fund’s Forms N-Q may be reviewed and copied at the SEC Public Reference Room in Washington, D.C. You can obtain information on the operation of the Public Reference Room, including information about duplicating fee charges, by calling 202 551 8090 or 800 732 0330, or by electronic request at the following email address: publicinfo@sec.gov. The SEC file numbers for the Fund are 811-07452 and 033-57340. The Fund’s most recent portfolio holdings, as filed on Form N-Q, have also been made available to insurance companies issuing variable annuity contracts and variable life insurance policies (“variable products”) that invest in the Fund. A description of the policies and procedures that the Fund uses to determine how to vote proxies relating to portfolio securities is available without charge, upon request, from our Client Services department at 800 959 4246 or at invesco.com/proxyguidelines. The information is also available on the SEC website, sec.gov. Information regarding how the Fund voted proxies related to its portfolio securities during the most recent 12-month period ended June 30 is available at invesco.com/ proxysearch. The information is also available on the SEC website, sec.gov. Invesco Advisers, Inc. is an investment adviser; it provides investment advisory services to individual and institutional clients and does not sell securities. Invesco Distributors, Inc. is the US distributor for Invesco Ltd.’s retail mutual funds, exchange-traded funds and institutional money market funds. Both are wholly owned, indirect subsidiaries of Invesco Ltd. This report must be accompanied or preceded by a currently effective Fund prospectus and variable product prospectus, which contain more complete information, including sales charges and expenses. Investors should read each carefully before investing. Invesco Distributors, Inc. I-VIGHC-AR-1 NOT FDIC INSURED | MAY LOSE VALUE | NO BANK GUARANTEE |
Management’s Discussion of Fund Performance
Performance summary
For the year ended December 31, 2015, Series I shares of Invesco V.I. Global Health Care Fund (the Fund), underperformed the MSCI World Health Care Index, the Fund’s style-specific benchmark.
Your Fund’s long-term performance appears later in this report.
Fund vs. Indexes
Total returns, 12/31/14 to 12/31/15, excluding variable product issuer charges. If variable product issuer charges were included, returns would be lower.
| | | | | |
| Series I Shares | | | | 3.16 | % |
| Series II Shares | | | | 2.89 | |
| MSCI World Index▼ (Broad Market Index) | | | | -0.87 | |
| MSCI World Health Care Index▼ (Style-Specific Index) | | | | 6.60 | |
| Lipper VUF Health/Biotechnology Funds Classification Averagen (Peer Group) | | | | 8.48 | |
Source(s): ▼FactSet Research Systems Inc.; nLipper Inc.
Market conditions and your Fund
Global equity markets faced significant headwinds during the year ended December 31, 2015. Developed markets were generally able to withstand these headwinds, even as more fragile emerging markets began to falter.
As the year began, concerns that the US Federal Reserve (the Fed) would begin raising rates while other central banks were loosening monetary policy led the US dollar to strengthen against many currencies. At the same time, oil prices continued to decline as increased supply outstripped demand. This had the effect of hurting commodity- and materials-based economies – and companies in related sectors. A colder-than-expected winter in the US and concerns about a possible Greek exit from the eurozone contributed to market uncertainty. During the summer of 2015, China’s surprise devaluation of the renminbi and a significant downturn in its financial markets triggered a massive sell-off in global equity markets, particularly in already-vulnerable emerging markets. In the fall of 2015, markets around the world began to regain their footing, but the impact of a late-year crash in oil prices offset these gains.
The global economy continued to expand, albeit slowly, during 2015. However, that growth became increasingly uneven across developed and emerging economies. Central bank policies also began to diverge as the Fed followed through on its commitment to normalize monetary policy by raising interest rates – even as the European Central Bank extended its asset purchase program and Japan introduced additional quantitative easing. While US and European equity markets were fairly resilient, or flat, for the year, many emerging markets struggled – particularly China, Brazil and Russia – and ended the year down significantly.
The 10 sectors of the MSCI World Index were split evenly, with half delivering positive returns and the other half negative. Energy had a double-digit loss for the reporting period, while the health care sector had the highest return for the reporting period. Although the sector posted a gain for the year, the health care sector experienced significant pressure in the fall of 2015, as political candidates and the media focused attention on drug pricing and price increases. This caused a sell-off particularly in the biotechnology and specialty pharmaceutical
industries though both industries ended the reporting period with a positive return.
The biotechnology and pharmaceuticals industries were the largest contributors to the Fund’s relative performance versus the Fund’s style-specific benchmark, and included some of the Fund’s top contributors for the year.
The top individual contributor to Fund performance was Incyte, a biopharmaceutical firm focused primarily on oncology drugs. During the reporting period, the company reported strong sales of Jakafi, its drug used to treat a rare bone marrow disorder.
Another key contributor to Fund performance was Salix Pharmaceuticals, a company that specializes in developing and marketing products for the prevention and treatment of gastrointestinal disorders. Reflecting an ongoing trend towards consolidation within the health care sector, Salix was acquired by Valeant (not a Fund holding) in April for approximately $11 billion. We sold our holdings in Salix Pharmaceuticals before the close of the reporting period.
On the negative side, the Fund’s underperformance relative to its style-specific index was largely attributable to stock selection and an overweight position in the health care facilities industry. Within the industry, a number of the Fund’s holdings were among the largest individual detractors, including hospital operation Community Health Systems and assisted living operator Brookdale Senior Living. Community Health Systems reported declining profits and weaker earnings as the initial benefits from the Affordable Care Act waned, and the rate of uninsured admissions increased. Brookdale’s earnings were below expectations, and company management lowered earnings estimates for the remainder of its fiscal year, as occupancy was lower than anticipated.
| | | | | |
| Portfolio Composition |
By country | | | | % of total net assets | |
| | | | | |
| |
| United States | | | | 72.2 | % |
| Switzerland | | | | 6.4 | |
| Ireland | | | | 4.7 | |
| France | | | | 3.1 | |
| United Kingdom | | | | 2.7 | |
| Japan | | | | 2.3 | |
| Countries each less than 2.0%of portfolio | | | | 4.8 | |
| Money Market Funds Plus Other Assets Less Liabilities | | | | 3.8 | |
| | | | | |
| Top 10 Equity Holdings* | | |
% of total net assets |
| | | | | |
| |
| 1. Allergan PLC | | | | 5.3 | % |
2. Roche Holding AG | | | | 4.1 | |
| 3. Shire PLC-ADR | | | | 4.1 | |
| 4. Biogen Inc. | | | | 4.0 | |
| 5. Merck & Co., Inc. | | | | 3.9 | |
| 6. Celgene Corp. | | | | 2.9 | |
| 7. AbbVie Inc. | | | | 2.8 | |
| 8. Bristol-Myers Squibb Co. | | | | 2.7 | |
| 9. Amgen Inc. | | | | 2.6 | |
| 10. Vertex Pharmaceuticals Inc. | | | | 2.5 | |
| | |
| Total Net Assets | | $313 million |
| |
Total Number of Holdings* | | 72 |
The Fund’s holdings are subject to change, and there is no assurance that the Fund will continue to hold any particular security.
*Excluding money market fund holdings.
Data presented here are as of December 31, 2015.
Invesco V.I. Global Health Care Fund
Stock selection in the health care equipment industry, and stock selection and an underweight allocation in the health care services and managed care industries also detracted from results during the reporting period. The Fund’s cash position also tempered the Fund’s results relative to the style-specific benchmark.
During the reporting period, we used currency forward contracts to hedge currency exposure of non-US-based companies held in the Fund. Derivatives were used solely for hedging and not for speculative purposes or leverage. The use of currency forward contracts had a positive impact on the Fund’s performance relative to the style-specific benchmark. This was primarily due to the continued strength of the US dollar relative to many major foreign currencies.
Over the course of the year, we reduced our exposure to the health care equipment, managed care and health care facilities industries, and we increased our exposure to the biotechnology and pharmaceutical industries. We maintained an underweight position in the large-cap pharmaceuticals industry relative to the style-specific benchmark; however, it was the Fund’s largest absolute industry exposure at the end of the reporting period. The Fund’s largest overweight position was in the biotechnology industry.
At the end of the reporting period, we continued to emphasize specialty pharmaceuticals and biotechnology stocks based on their generally robust product portfolios, strong development pipelines and our view that many of these companies could be targets for acquisition. We remained primarily focused on companies with new product cycles, less reimbursement risk and less competition. At the end of the reporting period, the Fund was primarily invested in US stocks, and the Fund’s non-US allocation was focused mainly on European large-cap pharmaceuticals, which had fewer patent expiration concerns than their US counterparts.
As always, thank you for your continued investment in Invesco V.I. Global Health Care Fund.
The views and opinions expressed in management’s discussion of Fund performance are those of Invesco Advisers, Inc. These views and opinions are subject to change at any time based on factors such as market and economic conditions. These views and opinions may not be relied upon as investment advice or recommendations, or as an offer for a particular security. The information is not a complete analysis of every aspect of any market, country, industry, security or the Fund. Statements of fact are from sources considered reliable, but Invesco Advisers, Inc. makes no representation or warranty as to their completeness or accuracy. Although historical performance is no guarantee of future results, these insights may help you understand our investment management philosophy.
See important Fund and, if applicable, index disclosures later in this report.
| | |
 | | Derek Taner Chartered Financial Analyst, Portfolio Manager,is manager of Invesco V.I. Global Health Care Fund. |
He joined Invesco in 2005.
Mr. Taner earned a BS in business administration with an emphasis in accounting and finance and an MBA from the University of California, Berkeley Haas School of Business.
Invesco V.I. Global Health Care Fund
Your Fund’s Long-Term Performance
Results of a $10,000 Investment – Oldest Share Class(es)
Fund and index data from 12/31/05
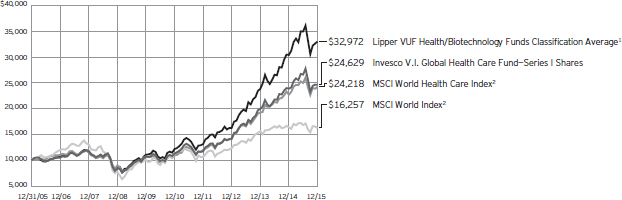
| 2 | Source: FactSet Research Systems Inc. |
Past performance cannot guarantee comparable future results.
| | | | | |
| Average Annual Total Returns |
As of 12/31/15 | | | | | |
| |
| Series I Shares | | | | | |
| Inception (5/21/97) | | | | 9.28 | % |
| 10 Years | | | | 9.43 | |
| 5 Years | | | | 16.87 | |
| 1 Year | | | | 3.16 | |
| |
| Series II Shares | | | | | |
| Inception (4/30/04) | | | | 8.84 | % |
| 10 Years | | | | 9.16 | |
| 5 Years | | | | 16.58 | |
1 Year | | | | 2.89 | |
The performance of the Fund’s Series I and Series II share classes will differ primarily due to different class expenses.
The performance data quoted represent past performance and cannot guarantee comparable future results; current performance may be lower or higher. Please contact your variable product issuer or financial adviser for the most recent month-end variable product performance. Performance figures reflect Fund expenses, reinvested distributions and changes in net asset value. Investment return and principal value will fluctuate so that you may have a gain or loss when you sell shares.
The net annual Fund operating expense ratio set forth in the most recent Fund prospectus as of the date of this report for Series I and Series II shares was 1.09% and 1.34%, respectively.1 The total annual Fund operating expense ratio set forth in the most recent Fund prospectus as of the date of this report for Series I and Series II shares was 1.10% and 1.35%, respectively. The expense ratios presented above may vary from the expense ratios presented in other sections of this report that are based on expenses incurred during the period covered by this report.
Invesco V.I. Global Health Care Fund, a series portfolio of AIM Variable Insurance Funds (Invesco Variable Insurance Funds), is currently offered through insurance companies issuing variable products. You cannot purchase shares of the Fund directly. Performance figures given represent the Fund and are not intended to reflect actual variable product values. They do not reflect sales charges, expenses and fees assessed in connection with a variable product. Sales charges, expenses and fees, which are determined by the variable product issuers, will vary and will lower the total return.
The most recent month-end performance at the Fund level, excluding variable product charges, is available at 800 451 4246. As mentioned above, for the most recent month-end performance including variable product charges, please contact your variable product issuer or financial adviser.
Fund performance reflects any applicable fee waivers and/or expense reimbursements. Had the adviser not waived fees and/or reimbursed expenses currently or in the past, returns would have been lower. See current prospectus for more information.
| 1 | Total annual Fund operating expenses after any contractual fee waivers and/or expense reimbursements by the adviser in effect through at least June 30, 2017. See current prospectus for more information. |
Invesco V.I. Global Health Care Fund
Invesco V.I. Global Health Care Fund’s investment objective is long-term growth of capital.
| n | | Unless otherwise stated, information presented in this report is as of December 31, 2015, and is based on total net assets. |
| n | | Unless otherwise noted, all data provided by Invesco. |
| n | | To access your Fund’s reports/prospectus, visit invesco.com/fundreports. |
Principal risks of investing in the Fund
Convertible securities risk. The Fund may own convertible securities, the value of which may be affected by market interest rates, the risk that the issuer will default, the value of the underlying stock or the right of the issuer to buy back the convertible securities.
Depositary receipts risk. Depositary receipts involve many of the same risks as those associated with direct investment in foreign securities. In addition, the underlying issuers of certain depositary receipts, particularly unsponsored or unregistered depositary receipts, are under no obligation to distribute shareholder communications to the holders of such receipts or to pass through to them any voting rights with respect to the deposited securities.
Derivatives risk. The value of a derivative instrument depends largely on (and is derived from) the value of an underlying security, currency, commodity, interest rate, index or other asset (each referred to as an underlying asset). In addition to risks relating to the underlying assets, the use of derivatives may include other, possibly greater, risks, including counterparty, leverage and liquidity risks. Counterparty risk is the risk that the counterparty to the derivative contract will default on its obligation to pay the Fund the amount owed or otherwise perform under the derivative contract. Derivatives create leverage risk because they do not require payment up front equal to the economic exposure created by owning the derivative. As a result, an adverse change in the value of the underlying asset could result in the Fund sustaining a loss that is substantially greater than the amount invested in the derivative, which may make the Fund’s returns more volatile and increase the risk of loss. Derivative instruments may also be less liquid than more traditional investments and the Fund may be unable to sell or close out its derivative positions at a desirable time or price. This risk may be more acute under adverse market conditions, during which the Fund may be most in need of liquidating its derivative positions. Derivatives may also be harder to value, less tax efficient and subject to changing government regulation that could impact the Fund’s ability to use
certain derivatives or their cost. Also, derivatives used for hedging or to gain or limit exposure to a particular market segment may not provide the expected benefits, particularly during adverse market conditions.
Developing/emerging markets securities risk. The prices of securities issued by foreign companies and governments located in developing/emerging markets countries may be affected more negatively by inflation, devaluation of their currencies, higher transaction costs, delays in settlement, adverse political developments, the introduction of capital controls, withholding taxes, nationalization of private assets, expropriation, social unrest, war or lack of timely information than those in developed countries.
Foreign securities risk. The Fund’s foreign investments may be affected by changes in a foreign country’s exchange rates, political and social instability, changes in economic or taxation policies, difficulties when enforcing obligations, decreased liquidity, and increased volatility. Foreign companies may be subject to less regulation resulting in less publicly available information about the companies.
Geographic focus risk. From time to time the Fund may invest a substantial amount of its assets in securities of issuers located in a single country or a limited number of countries. If the Fund focuses its investments in this manner, it assumes the risk that economic, political and social conditions in those countries will have a significant impact on its investment performance. The Fund’s investment performance may also be more volatile if it focuses its investments in certain countries, especially emerging markets countries.
Health care sector risk. The Fund will concentrate its investments in the securities of domestic and foreign issuers in the health care industry. The Fund’s performance is vulnerable to factors affecting the health care industry, including government regulation, obsolescence caused by scientific advances and technological innovations.
Management risk. The investment techniques and risk analysis used by the Fund’s portfolio managers may not produce the desired results.
Market risk. The prices of and the
income generated by the Fund’s securities may decline in response to, among other things, investor sentiment, general economic and market conditions, regional or global instability, and currency and interest rate fluctuations.
Preferred securities risk. Preferred securities may include provisions that permit the issuer, in its discretion, to defer or omit distributions for a certain period of time. If the Fund owns a security that is deferring or omitting its distributions, the Fund may be required to report the distribution on its tax returns, even though it may not have received this income. Further, preferred securities may lose substantial value due to the omission or deferment of dividend payments.
Small- and mid-capitalization risks. Stocks of small- and mid-sized companies tend to be more vulnerable to adverse developments and may have little or no operating history or track record of success, and limited product lines, markets, management and financial resources. The securities of small- and mid-sized companies may be more volatile due to less market interest and less publicly available information about the issuer. They also may be illiquid or restricted as to resale, or may trade less frequently and in smaller volumes, all of which may cause difficulty when establishing or closing a position at a desirable price.
About indexes used in this report
The MSCI World IndexSM is an unmanaged index considered representative of stocks of developed countries. The index is computed using the net return, which withholds applicable taxes for non-resident investors.
The MSCI World Health Care Index is an unmanaged index considered representative of health care stocks of developed countries. The index is computed using the net return, which withholds applicable taxes for non-resident investors.
The Lipper VUF Health/Biotechnology Funds Classification Average represents an average of all variable insurance underlying funds in the Lipper Health/ Biotechnology Funds classification.
The Fund is not managed to track the performance of any particular index, including the index(es) described here, and consequently, the performance of
Invesco V.I. Global Health Care Fund
the Fund may deviate significantly from the performance of the
index(es).
A direct investment cannot be made in an index. Unless otherwise indicated, index results include reinvested dividends, and they do not refiect sales charges. Performance of the peer group, if applicable, refiects fund expenses; performance of a market index does not.
Other information
The returns shown in management’s discussion of Fund performance are based on net asset values calculated for shareholder transactions. Generally accepted accounting principles require adjustments to be made to the net assets of the Fund at period end for financial reporting purposes, and as such, the net asset values for shareholder transactions and the returns based on those net asset values may differ from the net asset values and returns reported in the Financial Highlights. Additionally, the returns and net asset values shown throughout this report are at the Fund level only and do not include variable product issuer charges. If such charges were included, the total returns would be lower.
Industry classifications used in this report are generally according to the Global Industry Classification Standard, which was developed by and is the exclusive property and a service mark of MSCI Inc. and Standard & Poor’s.
Invesco V.I. Global Health Care Fund
Schedule of Investments(a)
December 31, 2015
| | | | | | | | |
| | | Shares | | | Value | |
Common Stocks & Other Equity Interests–96.19% | |
| Biotechnology–31.31% | |
AbbVie Inc. | | | 146,879 | | | $ | 8,701,112 | |
ACADIA Pharmaceuticals Inc.(b) | | | 50,257 | | | | 1,791,662 | |
Alder Biopharmaceuticals, Inc.(b) | | | 62,419 | | | | 2,061,699 | |
Alexion Pharmaceuticals, Inc.(b) | | | 27,580 | | | | 5,260,885 | |
AMAG Pharmaceuticals, Inc.(b) | | | 34,007 | | | | 1,026,671 | |
Amgen Inc. | | | 49,331 | | | | 8,007,901 | |
Atara Biotherapeutics Inc.(b) | | | 12,715 | | | | 335,803 | |
Biogen Inc.(b) | | | 41,107 | | | | 12,593,129 | |
BioMarin Pharmaceutical Inc.(b) | | | 58,473 | | | | 6,125,631 | |
Bluebird Bio, Inc.(b) | | | 24,590 | | | | 1,579,170 | |
Celgene Corp.(b) | | | 76,223 | | | | 9,128,466 | |
DBV Technologies S.A.–ADR (France)(b) | | | 87,018 | | | | 3,159,624 | |
Flexion Therapeutics, Inc.(b) | | | 46,869 | | | | 903,166 | |
Gilead Sciences, Inc. | | | 46,577 | | | | 4,713,127 | |
Heron Therapeutics, Inc.(b) | | | 101,754 | | | | 2,716,832 | |
Incyte Corp.(b) | | | 55,269 | | | | 5,993,923 | |
Medivation Inc.(b) | | | 78,920 | | | | 3,814,993 | |
Neurocrine Biosciences, Inc.(b) | | | 41,363 | | | | 2,339,905 | |
Prothena Corp. PLC (Ireland)(b) | | | 28,656 | | | | 1,951,760 | |
REGENXBIO Inc.(b) | | | 34,956 | | | | 580,270 | |
Sarepta Therapeutics, Inc.(b) | | | 51,061 | | | | 1,969,933 | |
Spark Therapeutics, Inc.(b) | | | 39,502 | | | | 1,789,836 | |
Synergy Pharmaceuticals, Inc.(b) | | | 231,515 | | | | 1,312,690 | |
United Therapeutics Corp.(b) | | | 12,090 | | | | 1,893,415 | |
Vanda Pharmaceuticals Inc.(b) | | | 35,918 | | | | 334,397 | |
Vertex Pharmaceuticals Inc.(b) | | | 62,784 | | | | 7,900,111 | |
| | | | | | | | 97,986,111 | |
|
| Drug Retail–0.43% | |
Raia Drogasil S.A. (Brazil) | | | 148,860 | | | | 1,333,456 | |
|
| Health Care Distributors–2.03% | |
Cardinal Health, Inc. | | | 38,001 | | | | 3,392,350 | |
McKesson Corp. | | | 14,953 | | | | 2,949,180 | |
| | | | | | | | 6,341,530 | |
|
| Health Care Equipment–3.87% | |
Olympus Corp. (Japan) | | | 98,500 | | | | 3,879,568 | |
ResMed Inc. | | | 68,936 | | | | 3,701,174 | |
Wright Medical Group N.V.(b) | | | 188,175 | | | | 4,550,071 | |
| | | | | | | | 12,130,813 | |
|
| Health Care Facilities–3.92% | |
Brookdale Senior Living Inc.(b) | | | 125,971 | | | | 2,325,425 | |
Community Health Systems Inc.(b) | | | 42,877 | | | | 1,137,527 | |
HCA Holdings, Inc.(b) | | | 70,205 | | | | 4,747,964 | |
Tenet Healthcare Corp.(b) | | | 25,028 | | | | 758,348 | |
Universal Health Services, Inc.–Class B | | | 27,711 | | | | 3,311,187 | |
| | | | | | | | 12,280,451 | |
| | | | | | | | |
| | | Shares | | | Value | |
| Health Care Services–2.32% | |
Air Methods Corp.(b) | | | 46,991 | | | $ | 1,970,332 | |
Express Scripts Holding Co.(b) | | | 59,956 | | | | 5,240,754 | |
InnovaCare Inc.(b)(c) | | | 122,652 | | | | 49,061 | |
| | | | | | | | 7,260,147 | |
|
| Life Sciences Tools & Services–2.10% | |
Agilent Technologies, Inc. | | | 46,191 | | | | 1,931,246 | |
Thermo Fisher Scientific, Inc. | | | 32,846 | | | | 4,659,205 | |
| | | | | | | | 6,590,451 | |
|
| Managed Health Care–3.65% | |
Aetna Inc. | | | 49,605 | | | | 5,363,293 | |
Qualicorp S.A. (Brazil) | | | 109,000 | | | | 388,853 | |
UnitedHealth Group Inc. | | | 48,107 | | | | 5,659,307 | |
| | | | | | | | 11,411,453 | |
|
| Pharmaceuticals–46.56% | |
Agile Therapeutics, Inc.(b) | | | 76,590 | | | | 747,518 | |
Akorn, Inc.(b) | | | 58,143 | | | | 2,169,315 | |
Allergan PLC(b) | | | 53,272 | | | | 16,647,500 | |
AstraZeneca PLC–ADR (United Kingdom) | | | 147,423 | | | | 5,005,011 | |
Bayer AG (Germany) | | | 36,021 | | | | 4,519,242 | |
Bristol-Myers Squibb Co. | | | 124,580 | | | | 8,569,858 | |
Cempra, Inc.(b) | | | 48,971 | | | | 1,524,467 | |
Dermira, Inc.(b) | | | 83,583 | | | | 2,892,808 | |
Eli Lilly and Co. | | | 80,656 | | | | 6,796,075 | |
Endo International PLC(b) | | | 78,716 | | | | 4,818,994 | |
GlaxoSmithKline PLC–ADR (United Kingdom) | | | 81,899 | | | | 3,304,625 | |
Hikma Pharmaceuticals PLC (Jordan) | | | 90,408 | | | | 3,061,486 | |
Jazz Pharmaceuticals PLC(b) | | | 29,212 | | | | 4,106,039 | |
Johnson & Johnson | | | 45,453 | | | | 4,668,932 | |
Lipocine Inc.(b) | | | 121,754 | | | | 1,574,279 | |
Medicines Co. (The)(b) | | | 60,102 | | | | 2,244,209 | |
Merck & Co., Inc. | | | 230,990 | | | | 12,200,892 | |
Mylan N.V.(b) | | | 75,010 | | | | 4,055,791 | |
Nippon Shinyaku Co., Ltd. (Japan) | | | 94,000 | | | | 3,470,870 | |
Novartis AG–ADR (Switzerland) | | | 84,031 | | | | 7,230,027 | |
Pfizer Inc. | | | 154,913 | | | | 5,000,592 | |
Roche Holding AG (Switzerland) | | | 46,919 | | | | 12,929,674 | |
Sanofi–ADR (France) | | | 150,275 | | | | 6,409,229 | |
Shire PLC–ADR (Ireland) | | | 62,947 | | | | 12,904,135 | |
Supernus Pharmaceuticals Inc.(b) | | | 133,231 | | | | 1,790,625 | |
Teva Pharmaceutical Industries Ltd.–ADR (Israel) | | | 86,393 | | | | 5,670,836 | |
Zogenix, Inc.(b) | | | 95,229 | | | | 1,403,675 | |
| | | | | | | | 145,716,704 | |
Total Common Stocks & Other Equity Interests
(Cost $234,061,143) | | | | 301,051,116 | |
See accompanying Notes to Financial Statements which are an integral part of the financial statements.
Invesco V.I. Global Health Care Fund
| | | | | | | | |
| | | Shares | | | Value | |
Money Market Funds–3.79% | | | | | |
Liquid Assets Portfolio–Institutional Class, 0.29%(d) | | | 5,925,229 | | | $ | 5,925,229 | |
Premier Portfolio–Institutional Class, 0.24%(d) | | | 5,925,229 | | | | 5,925,229 | |
Total Money Market Funds
(Cost $11,850,458) | | | | 11,850,458 | |
TOTAL INVESTMENTS–99.98%
(Cost $245,911,601) | | | | 312,901,574 | |
OTHER ASSETS LESS LIABILITIES–0.02% | | | | 73,185 | |
NET ASSETS–100.00% | | | $ | 312,974,759 | |
Investment Abbreviations:
| | |
| ADR | | – American Depositary Receipt |
Notes to Schedule of Investments:
| (a) | Industry and/or sector classifications used in this report are generally according to the Global Industry Classification Standard, which was developed by and is the exclusive property and a service mark of MSCI Inc. and Standard & Poor’s. |
| (b) | Non-income producing security. |
| (c) | Security purchased or received in transaction exempt from registration under the Securities Act of 1933, as amended (the “1933 Act”). The security may be resold pursuant to an exemption from registration under the 1933 Act, typically to qualified institutional buyers. The value of this security at December 31, 2015 represented less than 1% of the Fund’s Net Assets. |
| (d) | The money market fund and the Fund are affiliated by having the same investment adviser. The rate shown is the 7-day SEC standardized yield as of December 31, 2015. |
See accompanying Notes to Financial Statements which are an integral part of the financial statements.
Invesco V.I. Global Health Care Fund
Statement of Assets and Liabilities
December 31, 2015
Statement of Operations
For the year ended December 31, 2015
| | | | |
Assets: | |
Investments, at value (Cost $234,061,143) | | $ | 301,051,116 | |
Investments in affiliated money market funds, at value and cost | | | 11,850,458 | |
Total investments, at value (Cost $245,911,601) | | | 312,901,574 | |
Foreign currencies, at value (Cost $73,782) | | | 66,737 | |
Receivable for: | | | | |
Fund shares sold | | | 31,035 | |
Dividends | | | 413,157 | |
Investment for trustee deferred compensation and retirement plans | | | 66,032 | |
Other assets | | | 38,949 | |
Total assets | | | 313,517,484 | |
| |
Liabilities: | | | | |
Payable for: | | | | |
Fund shares reacquired | | | 170,769 | |
Accrued fees to affiliates | | | 262,177 | |
Accrued trustees’ and officers’ fees and benefits | | | 103 | |
Accrued other operating expenses | | | 33,262 | |
Trustee deferred compensation and retirement plans | | | 76,414 | |
Total liabilities | | | 542,725 | |
Net assets applicable to shares outstanding | | $ | 312,974,759 | |
| |
Net assets consist of: | | | | |
Shares of beneficial interest | | $ | 209,595,838 | |
Undistributed net investment income (loss) | | | (79,216 | ) |
Undistributed net realized gain | | | 36,488,168 | |
Net unrealized appreciation | | | 66,969,969 | |
| | | $ | 312,974,759 | |
|
Net Assets: | |
Series I | | $ | 209,510,963 | |
Series II | | $ | 103,463,796 | |
|
Shares outstanding, $0.001 par value per share,
with an unlimited number of shares authorized: | |
Series I | | | 6,599,400 | |
Series II | | | 3,376,060 | |
Series I: | | | | |
Net asset value per share | | $ | 31.75 | |
Series II: | | | | |
Net asset value per share | | $ | 30.65 | |
| | | | |
Investment income: | |
Dividends (net of foreign withholding taxes of $176,467) | | $ | 3,504,060 | |
Dividends from affiliated money market funds | | | 16,416 | |
Total investment income | | | 3,520,476 | |
| |
Expenses: | | | | |
Advisory fees | | | 2,470,444 | |
Administrative services fees | | | 905,536 | |
Custodian fees | | | 20,970 | |
Distribution fees — Series II | | | 244,955 | |
Transfer agent fees | | | 40,745 | |
Trustees’ and officers’ fees and benefits | | | 25,006 | |
Other | | | 58,465 | |
Total expenses | | | 3,766,121 | |
Less: Fees waived | | | (29,599 | ) |
Net expenses | | | 3,736,522 | |
Net investment income (loss) | | | (216,046 | ) |
| |
Realized and unrealized gain (loss) from: | | | | |
Net realized gain (loss) from: | | | | |
Investment securities | | | 36,561,187 | |
Foreign currencies | | | (10,922 | ) |
Forward foreign currency contracts | | | 524,173 | |
| | | | 37,074,438 | |
Change in net unrealized appreciation (depreciation) of: | | | | |
Investment securities | | | (30,221,986 | ) |
Foreign currencies | | | (7,102 | ) |
Forward foreign currency contracts | | | (370,285 | ) |
| | | | (30,599,373 | ) |
Net realized and unrealized gain | | | 6,475,065 | |
Net increase in net assets resulting from operations | | $ | 6,259,019 | |
See accompanying Notes to Financial Statements which are an integral part of the financial statements.
Invesco V.I. Global Health Care Fund
Statement of Changes in Net Assets
For the years ended December 31, 2015 and 2014
| | | | | | | | |
| | | 2015 | | | 2014 | |
Operations: | | | | | |
Net investment income (loss) | | $ | (216,046 | ) | | $ | (199,494 | ) |
Net realized gain | | | 37,074,438 | | | | 29,406,927 | |
Change in net unrealized appreciation (depreciation) | | | (30,599,373 | ) | | | 17,172,506 | |
Net increase in net assets resulting from operations | | | 6,259,019 | | | | 46,379,939 | |
| | |
Distributions to shareholders from net realized gains: | | | | | | | | |
Series l | | | (20,284,975 | ) | | | (7,510,881 | ) |
Series ll | | | (9,450,446 | ) | | | (2,701,370 | ) |
Total distributions from net realized gains | | | (29,735,421 | ) | | | (10,212,251 | ) |
| | |
Share transactions–net: | | | | | | | | |
Series l | | | 3,788,123 | | | | 12,895,089 | |
Series ll | | | 34,032,284 | | | | 10,544,688 | |
Net increase in net assets resulting from share transactions | | | 37,820,407 | | | | 23,439,777 | |
Net increase in net assets | | | 14,344,005 | | | | 59,607,465 | |
| | |
Net assets: | | | | | | | | |
Beginning of year | | | 298,630,754 | | | | 239,023,289 | |
End of year (includes undistributed net investment income (loss) of $(79,216) and $(74,525), respectively) | | $ | 312,974,759 | | | $ | 298,630,754 | |
Notes to Financial Statements
December 31, 2015
NOTE 1—Significant Accounting Policies
Invesco V.I. Global Health Care Fund (the “Fund”) is a series portfolio of AIM Variable Insurance Funds (Invesco Variable Insurance Funds) (the “Trust”). The Trust is a Delaware statutory trust registered under the Investment Company Act of 1940, as amended (the “1940 Act”), as an open-end series management investment company consisting of twenty-four separate portfolios, (each constituting a “Fund”). The assets, liabilities and operations of each portfolio are accounted for separately. Information presented in these financial statements pertains only to the Fund. Matters affecting each Fund or class will be voted on exclusively by the shareholders of such Fund or class. Current Securities and Exchange Commission (“SEC”) guidance, however, requires participating insurance companies offering separate accounts to vote shares proportionally in accordance with the instructions of the contract owners whose investments are funded by shares of each Fund or class.
The Fund’s investment objective is long-term growth of capital.
The Fund currently offers two classes of shares, Series I and Series II, both of which are offered to insurance company separate accounts funding variable annuity contracts and variable life insurance policies (“variable products”).
The following is a summary of the significant accounting policies followed by the Fund in the preparation of its financial statements.
| A. | Security Valuations — Securities, including restricted securities, are valued according to the following policy. |
A security listed or traded on an exchange (except convertible securities) is valued at its last sales price or official closing price as of the close of the customary trading session on the exchange where the security is principally traded, or lacking any sales or official closing price on a particular day, the security may be valued at the closing bid price on that day. Securities traded in the over-the-counter market are valued based on prices furnished by independent pricing services or market makers. When such securities are valued by an independent pricing service they may be considered fair valued. Futures contracts are valued at the final settlement price set by an exchange on which they are principally traded. Listed options are valued at the mean between the last bid and asked prices from the exchange on which they are principally traded. Options not listed on an exchange are valued by an independent source at the mean between the last bid and asked prices. For purposes of determining net asset value (“NAV”) per share, futures and option contracts generally are valued 15 minutes after the close of the customary trading session of the New York Stock Exchange (“NYSE”).
Investments in open-end and closed-end registered investment companies that do not trade on an exchange are valued at the end-of-day net asset value per share. Investments in open-end and closed-end registered investment companies that trade on an exchange are valued at the last sales price or official closing price as of the close of the customary trading session on the exchange where the security is principally traded.
Debt obligations (including convertible securities) and unlisted equities are fair valued using an evaluated quote provided by an independent pricing service. Evaluated quotes provided by the pricing service may be determined without exclusive reliance on quoted prices, and may reflect appropriate factors such as institution-size trading in similar groups of securities, developments related to specific securities, dividend rate (for unlisted equities), yield (for debt obligations), quality, type of issue, coupon rate (for debt obligations), maturity (for debt obligations), individual trading characteristics and other market data. Debt obligations are subject to interest rate and credit risks. In addition, all debt obligations involve some risk of default with respect to interest and/or principal payments.
Invesco V.I. Global Health Care Fund
Foreign securities’ (including foreign exchange contracts) prices are converted into U.S. dollar amounts using the applicable exchange rates as of the close of the NYSE. If market quotations are available and reliable for foreign exchange-traded equity securities, the securities will be valued at the market quotations. Because trading hours for certain foreign securities end before the close of the NYSE, closing market quotations may become unreliable. If between the time trading ends on a particular security and the close of the customary trading session on the NYSE, events occur that the Adviser determines are significant and make the closing price unreliable, the Fund may fair value the security. If the event is likely to have affected the closing price of the security, the security will be valued at fair value in good faith using procedures approved by the Board of Trustees. Adjustments to closing prices to reflect fair value may also be based on a screening process of an independent pricing service to indicate the degree of certainty, based on historical data, that the closing price in the principal market where a foreign security trades is not the current value as of the close of the NYSE. Foreign securities’ prices meeting the approved degree of certainty that the price is not reflective of current value will be priced at the indication of fair value from the independent pricing service. Multiple factors may be considered by the independent pricing service in determining adjustments to reflect fair value and may include information relating to sector indices, American Depositary Receipts and domestic and foreign index futures. Foreign securities may have additional risks including exchange rate changes, potential for sharply devalued currencies and high inflation, political and economic upheaval, the relative lack of issuer information, relatively low market liquidity and the potential lack of strict financial and accounting controls and standards.
Securities for which market prices are not provided by any of the above methods may be valued based upon quotes furnished by independent sources. The last bid price may be used to value equity securities. The mean between the last bid and asked prices is used to value debt obligations, including corporate loans.
Securities for which market quotations are not readily available or became unreliable are valued at fair value as determined in good faith by or under the supervision of the Trust’s officers following procedures approved by the Board of Trustees. Issuer specific events, market trends, bid/asked quotes of brokers and information providers and other market data may be reviewed in the course of making a good faith determination of a security’s fair value.
The Fund may invest in securities that are subject to interest rate risk, meaning the risk that the prices will generally fall as interest rates rise and, conversely, the prices will generally rise as interest rates fall. Specific securities differ in their sensitivity to changes in interest rates depending on their individual characteristics. Changes in interest rates may result in increased market volatility, which may affect the value and/or liquidity of certain Fund investments.
Valuations change in response to many factors including the historical and prospective earnings of the issuer, the value of the issuer’s assets, general economic conditions, interest rates, investor perceptions and market liquidity. Because of the inherent uncertainties of valuation, the values reflected in the financial statements may materially differ from the value received upon actual sale of those investments.
| B. | Securities Transactions and Investment Income — Securities transactions are accounted for on a trade date basis. Realized gains or losses on sales are computed on the basis of specific identification of the securities sold. Interest income (net of withholding tax, if any) is recorded on the accrual basis from settlement date. Dividend income (net of withholding tax, if any) is recorded on the ex-dividend date. |
The Fund may periodically participate in litigation related to Fund investments. As such, the Fund may receive proceeds from litigation settlements. Any proceeds received are included in the Statement of Operations as realized gain (loss) for investments no longer held and as unrealized gain (loss) for investments still held.
Brokerage commissions and mark ups are considered transaction costs and are recorded as an increase to the cost basis of securities purchased and/or a reduction of proceeds on a sale of securities. Such transaction costs are included in the determination of net realized and unrealized gain (loss) from investment securities reported in the Statement of Operations and the Statement of Changes in Net Assets and the net realized and unrealized gains (losses) on securities per share in the Financial Highlights. Transaction costs are included in the calculation of the Fund’s net asset value and, accordingly, they reduce the Fund’s total returns. These transaction costs are not considered operating expenses and are not reflected in net investment income reported in the Statement of Operations and the Statement of Changes in Net Assets, or the net investment income per share and the ratios of expenses and net investment income reported in the Financial Highlights, nor are they limited by any expense limitation arrangements between the Fund and the investment adviser.
The Fund allocates income and realized and unrealized capital gains and losses to a class based on the relative net assets of each class.
| C. | Country Determination — For the purposes of making investment selection decisions and presentation in the Schedule of Investments, the investment adviser may determine the country in which an issuer is located and/or credit risk exposure based on various factors. These factors include the laws of the country under which the issuer is organized, where the issuer maintains a principal office, the country in which the issuer derives 50% or more of its total revenues and the country that has the primary market for the issuer’s securities, as well as other criteria. Among the other criteria that may be evaluated for making this determination are the country in which the issuer maintains 50% or more of its assets, the type of security, financial guarantees and enhancements, the nature of the collateral and the sponsor organization. Country of issuer and/or credit risk exposure has been determined to be the United States of America, unless otherwise noted. |
| D. | Distributions — Distributions from net investment income and net realized capital gain, if any, are generally declared and paid to separate accounts of participating insurance companies annually and recorded on the ex-dividend date. |
| E. | Federal Income Taxes — The Fund intends to comply with the requirements of Subchapter M of the Internal Revenue Code of 1986, as amended (the “Internal Revenue Code”), necessary to qualify as a regulated investment company and to distribute substantially all of the Fund’s taxable earnings to shareholders. As such, the Fund will not be subject to federal income taxes on otherwise taxable income (including net realized capital gain) that is distributed to shareholders. Therefore, no provision for federal income taxes is recorded in the financial statements. |
The Fund recognizes the tax benefits of uncertain tax positions only when the position is more likely than not to be sustained. Management has analyzed the Fund’s uncertain tax positions and concluded that no liability for unrecognized tax benefits should be recorded related to uncertain tax positions. Management is not aware of any tax positions for which it is reasonably possible that the total amounts of unrecognized tax benefits will change materially in the next 12 months.
The Fund files tax returns in the U.S. Federal jurisdiction and certain other jurisdictions. Generally, the Fund is subject to examinations by such taxing authorities for up to three years after the filing of the return for the tax period.
| F. | Expenses — Fees provided for under the Rule 12b-1 plan of a particular class of the Fund and which are directly attributable to that class are charged to the operations of such class. All other expenses are allocated among the classes based on relative net assets. |
Invesco V.I. Global Health Care Fund
| G. | Accounting Estimates — The preparation of financial statements in conformity with accounting principles generally accepted in the United States of America (“GAAP”) requires management to make estimates and assumptions that affect the reported amounts of assets and liabilities at the date of the financial statements and the reported amounts of revenues and expenses during the reporting period including estimates and assumptions related to taxation. Actual results could differ from those estimates by a significant amount. In addition, the Fund monitors for material events or transactions that may occur or become known after the period-end date and before the date the financial statements are released to print. |
| H. | Indemnifications — Under the Trust’s organizational documents, each Trustee, officer, employee or other agent of the Trust is indemnified against certain liabilities that may arise out of the performance of their duties to the Fund. Additionally, in the normal course of business, the Fund enters into contracts, including the Fund’s servicing agreements, that contain a variety of indemnification clauses. The Fund’s maximum exposure under these arrangements is unknown as this would involve future claims that may be made against the Fund that have not yet occurred. The risk of material loss as a result of such indemnification claims is considered remote. |
| I. | Foreign Currency Translations — Foreign currency is valued at the close of the NYSE based on quotations posted by banks and major currency dealers. Portfolio securities and other assets and liabilities denominated in foreign currencies are translated into U.S. dollar amounts at date of valuation. Purchases and sales of portfolio securities (net of foreign taxes withheld on disposition) and income items denominated in foreign currencies are translated into U.S. dollar amounts on the respective dates of such transactions. The Fund does not separately account for the portion of the results of operations resulting from changes in foreign exchange rates on investments and the fluctuations arising from changes in market prices of securities held. The combined results of changes in foreign exchange rates and the fluctuation of market prices on investments (net of estimated foreign tax withholding) are included with the net realized and unrealized gain or loss from investments in the Statement of Operations. Reported net realized foreign currency gains or losses arise from (1) sales of foreign currencies, (2) currency gains or losses realized between the trade and settlement dates on securities transactions, and (3) the difference between the amounts of dividends, interest, and foreign withholding taxes recorded on the Fund’s books and the U.S. dollar equivalent of the amounts actually received or paid. Net unrealized foreign currency gains and losses arise from changes in the fair values of assets and liabilities, other than investments in securities at fiscal period end, resulting from changes in exchange rates. |
The Fund may invest in foreign securities, which may be subject to foreign taxes on income, gains on investments or currency repatriation, a portion of which may be recoverable. Foreign taxes, if any, are recorded based on the tax regulations and rates that exist in the foreign markets in which the Fund invests and are shown in the Statement of Operations.
| J. | Forward Foreign Currency Contracts — The Fund may engage in foreign currency transactions either on a spot (i.e. for prompt delivery and settlement) basis, or through forward foreign currency contracts, to manage or minimize currency or exchange rate risk. |
The Fund may also enter into forward foreign currency contracts for the purchase or sale of a security denominated in a foreign currency in order to “lock in” the U.S. dollar price of that security, or the Fund may also enter into forward foreign currency contracts that do not provide for physical settlement of the two currencies, but instead are settled by a single cash payment calculated as the difference between the agreed upon exchange rate and the spot rate at settlement based upon an agreed upon notional amount (non-deliverable forwards). The Fund will set aside liquid assets in an amount equal to daily mark-to-market obligation for forward foreign currency contracts.
A forward foreign currency contract is an obligation between two parties (“Counterparties”) to purchase or sell a specific currency for an agreed-upon price at a future date. The use of forward foreign currency contracts does not eliminate fluctuations in the price of the underlying securities the Fund owns or intends to acquire but establishes a rate of exchange in advance. Fluctuations in the value of these contracts are measured by the difference in the contract date and reporting date exchange rates and are recorded as unrealized appreciation (depreciation) until the contracts are closed. When the contracts are closed, realized gains (losses) are recorded. Realized and unrealized gains (losses) on the contracts are included in the Statement of Operations. The primary risks associated with forward foreign currency contracts include failure of the Counterparty to meet the terms of the contract and the value of the foreign currency changing unfavorably. These risks may be in excess of the amounts reflected in the Statement of Assets and Liabilities.
| K. | Other Risks — The Fund’s performance is vulnerable to factors affecting the health care industry, including government regulation, obsolescence caused by scientific advances and technological innovations. |
The Fund has invested in non-publicly traded companies, some of which are in the startup or development stages. These investments are inherently risky, as the market for the technologies or products these companies are developing are typically in the early stages and may never materialize. The Fund could lose its entire investment in these companies. These investments are valued at fair value as determined in good faith in accordance with procedures approved by the Board of Trustees. Investments in privately held venture capital securities are illiquid.
NOTE 2—Advisory Fees and Other Fees Paid to Affiliates
The Trust has entered into a master investment advisory agreement with Invesco Advisers, Inc. (the “Adviser” or “Invesco”). Under the terms of the investment advisory agreement, the Fund pays an advisory fee to the Adviser based on the annual rate of the Fund’s average daily net assets as follows:
| | | | | | |
| Average Daily Net Assets | | Rate |
First $250 million | | | 0 | .75% | | |
Next $250 million | | | 0 | .74% | | |
Next $500 million | | | 0 | .73% | | |
Next $1.5 billion | | | 0 | .72% | | |
Next $2.5 billion | | | 0 | .71% | | |
Next $2.5 billion | | | 0 | .70% | | |
Next $2.5 billion | | | 0 | .69% | | |
Over $10 billion | | | 0 | .68% | | |
Invesco V.I. Global Health Care Fund
For the year ended December 31, 2015, the effective advisory fees incurred by the Fund was 0.75%.
Under the terms of a master sub-advisory agreement between the Adviser and each of Invesco Asset Management Deutschland GmbH, Invesco Asset Management Limited, Invesco Asset Management (Japan) Limited, Invesco Hong Kong Limited, Invesco Senior Secured Management, Inc. and Invesco Canada Ltd. (collectively, the “Affiliated Sub-Advisers”) the Adviser, not the Fund, may pay 40% of the fees paid to the Adviser to any such Affiliated Sub-Adviser(s) that provide(s) discretionary investment management services to the Fund based on the percentage of assets allocated to such Affiliated Sub-Adviser(s).
The Adviser has contractually agreed, through at least June 30, 2016, to waive advisory fees and/or reimburse expenses of all shares to the extent necessary to limit total annual fund operating expenses after fee waiver and/or expense reimbursement (excluding certain items discussed below) of Series I shares to 2.00% and Series II shares to 2.25% of average daily net assets. In determining the Adviser’s obligation to waive advisory fees and/or reimburse expenses, the following expenses are not taken into account, and could cause the total annual fund operating expenses after fee waiver and/or expense reimbursement to exceed the numbers reflected above: (1) interest; (2) taxes; (3) dividend expense on short sales; (4) extraordinary or non-routine items, including litigation expenses; and (5) expenses that the Fund has incurred but did not actually pay because of an expense offset arrangement. Unless Invesco continues the fee waiver agreement, it will terminate on June 30, 2016. The fee waiver agreement cannot be terminated during its term. The Adviser did not waive fees and/or reimburse expenses during the period under this expense limitation.
Further, the Adviser has contractually agreed, through at least June 30, 2017, to waive the advisory fee payable by the Fund in an amount equal to 100% of the net advisory fees the Adviser receives from the affiliated money market funds on investments by the Fund of uninvested cash in such affiliated money market funds.
For the year ended December 31, 2015, the Adviser waived advisory fees of $29,599.
The Trust has entered into a master administrative services agreement with Invesco pursuant to which the Fund has agreed to pay Invesco a fee for costs incurred in providing accounting services and fund administrative services to the Fund and to reimburse Invesco for administrative services fees paid to insurance companies that have agreed to provide services to the participants of separate accounts. These administrative services provided by the insurance companies may include, among other things: the printing of prospectuses, financial reports and proxy statements and the delivery of the same to existing participants; the maintenance of master accounts; the facilitation of purchases and redemptions requested by the participants; and the servicing of participants’ accounts. Pursuant to such agreement, for the year ended December 31, 2015, Invesco was paid $81,007 for accounting and fund administrative services and reimbursed $824,529 for services provided by insurance companies.
The Trust has entered into a transfer agency and service agreement with Invesco Investment Services, Inc. (“IIS”) pursuant to which the Fund has agreed to pay IIS a fee for providing transfer agency and shareholder services to the Fund and reimburse IIS for certain expenses incurred by IIS in the course of providing such services. For the year ended December 31, 2015, expenses incurred under the agreement are shown in the Statement of Operations as Transfer agent fees.
The Trust has entered into a master distribution agreement with Invesco Distributors, Inc. (“IDI”) to serve as the distributor for the Fund. The Trust has adopted a plan pursuant to Rule 12b-1 under the 1940 Act with respect to the Fund’s Series II shares (the “Plan”). The Fund, pursuant to the Plan, pays IDI compensation at the annual rate of 0.25% of the Fund’s average daily net assets of Series II shares. Of the Plan payments, up to 0.25% of the average daily net assets of the Series II shares may be paid to insurance companies who furnish continuing personal shareholder services to customers who purchase and own Series II shares of the Fund. For the year ended December 31, 2015, expenses incurred under the Plan are detailed in the Statement of Operations as Distribution fees.
For the year ended December 31, 2015, the Fund incurred $1,254 in brokerage commissions with Invesco Capital Markets, Inc., an affiliate of the Adviser and IDI, for portfolio transactions executed on behalf of the Fund.
Certain officers and trustees of the Trust are officers and directors of the Adviser, IIS and/or IDI.
NOTE 3—Additional Valuation Information
GAAP defines fair value as the price that would be received to sell an asset or paid to transfer a liability in an orderly transaction between market participants at the measurement date, under current market conditions. GAAP establishes a hierarchy that prioritizes the inputs to valuation methods, giving the highest priority to readily available unadjusted quoted prices in an active market for identical assets (Level 1) and the lowest priority to significant unobservable inputs (Level 3), generally when market prices are not readily available or are unreliable. Based on the valuation inputs, the securities or other investments are tiered into one of three levels. Changes in valuation methods may result in transfers in or out of an investment’s assigned level:
| | Level 1 — | Prices are determined using quoted prices in an active market for identical assets. |
| | Level 2 — | Prices are determined using other significant observable inputs. Observable inputs are inputs that other market participants may use in pricing a security. These may include quoted prices for similar securities, interest rates, prepayment speeds, credit risk, yield curves, loss severities, default rates, discount rates, volatilities and others. |
| | Level 3 — | Prices are determined using significant unobservable inputs. In situations where quoted prices or observable inputs are unavailable (for example, when there is little or no market activity for an investment at the end of the period), unobservable inputs may be used. Unobservable inputs reflect the Fund’s own assumptions about the factors market participants would use in determining fair value of the securities or instruments and would be based on the best available information. |
The following is a summary of the tiered valuation input levels, as of December 31, 2015. The level assigned to the securities valuations may not be an indication of the risk or liquidity associated with investing in those securities. Because of the inherent uncertainties of valuation, the values reflected in the financial statements may materially differ from the value received upon actual sale of those investments.
| | | | | | | | | | | | | | | | |
| | | Level 1 | | | Level 2 | | | Level 3 | | | Total | |
Equity Securities | | $ | 284,991,673 | | | $ | 27,860,840 | | | $ | 49,061 | | | $ | 312,901,574 | |
Invesco V.I. Global Health Care Fund
NOTE 4—Derivative Investments
Effect of Derivative Investments for the year ended December 31, 2015
The table below summarizes the gains (losses) on derivative investments, detailed by primary risk exposure, recognized in earnings during the period:
| | | | |
| | | Location of Gain (Loss) on
Statement of Operations | |
| | Forward Foreign
Currency Contracts | |
Realized Gain: | | | | |
Currency risk | | $ | 524,173 | |
Change in Net Unrealized Appreciation (Depreciation): | | | | |
Currency risk | | | (370,285 | ) |
Total | | $ | 153,888 | |
The table below summarizes the eleven month average notional value of forward foreign currency contracts.
| | | | |
| | | Forward Foreign
Currency Contracts | |
Average notional value | | $ | 8,689,248 | |
NOTE 5—Trustees’ and Officers’ Fees and Benefits
Trustees’ and Officers’ Fees and Benefits include amounts accrued by the Fund to pay remuneration to certain Trustees and Officers of the Fund. Trustees have the option to defer compensation payable by the Fund, and Trustees’ and Officers’ Fees and Benefits also include amounts accrued by the Fund to fund such deferred compensation amounts. Those Trustees who defer compensation have the option to select various Invesco Funds in which their deferral accounts shall be deemed to be invested. Finally, certain current Trustees were eligible to participate in a retirement plan that provided for benefits to be paid upon retirement to Trustees over a period of time based on the number of years of service. The Fund may have certain former Trustees who also participate in a retirement plan and receive benefits under such plan. Trustees’ and Officers’ Fees and Benefits include amounts accrued by the Fund to fund such retirement benefits. Obligations under the deferred compensation and retirement plans represent unsecured claims against the general assets of the Fund.
NOTE 6—Cash Balances
The Fund is permitted to temporarily carry a negative or overdrawn balance in its account with State Street Bank and Trust Company, the custodian bank. Such balances, if any at period end, are shown in the Statement of Assets and Liabilities under the payable caption Amount due custodian. To compensate the custodian bank for such overdrafts, the overdrawn Fund may either (1) leave funds as a compensating balance in the account so the custodian bank can be compensated by earning the additional interest; or (2) compensate by paying the custodian bank at a rate agreed upon by the custodian bank and Invesco, not to exceed the contractually agreed upon rate.
NOTE 7—Distributions to Shareholders and Tax Components of Net Assets
Tax Character of Distributions to Shareholders Paid During the Fiscal Years Ended December 31, 2015 and 2014:
| | | | | | | | |
| | | 2015 | | | 2014 | |
Ordinary income | | $ | 487,576 | | | $ | 989,626 | |
Long-term capital gain | | | 29,247,845 | | | | 9,222,625 | |
Total distributions | | $ | 29,735,421 | | | $ | 10,212,251 | |
Tax Components of Net Assets at Period-End:
| | | | |
| | | 2015 | |
Undistributed ordinary income | | $ | 5,116,806 | |
Undistributed long-term gain | | | 31,371,361 | |
Net unrealized appreciation — investments | | | 66,989,973 | |
Net unrealized appreciation (depreciation) — other investments | | | (20,004 | ) |
Temporary book/tax differences | | | (79,215 | ) |
Shares of beneficial interest | | | 209,595,838 | |
Total net assets | | $ | 312,974,759 | |
The temporary book/tax differences are a result of timing differences between book and tax recognition of income and/or expenses. The Fund’s temporary book/tax differences are the result of the trustee deferral of compensation and retirement plan benefits.
Capital loss carryforward is calculated and reported as of a specific date. Results of transactions and other activity after that date may affect the amount of capital loss carryforward actually available for the Fund to utilize. Capital losses generated in years beginning after December 22, 2010 can be carried forward for an unlimited period, whereas previous losses expire in eight tax years. Capital losses with an expiration period may not be
Invesco V.I. Global Health Care Fund
used to offset capital gains until all net capital losses without an expiration date have been utilized. Capital loss carryforwards with no expiration date will retain their character as either short-term or long-term capital losses instead of as short-term capital losses as under prior law. The ability to utilize capital loss carryforwards in the future may be limited under the Internal Revenue Code and related regulations based on the results of future transactions.
The Fund does not have a capital loss carryforward as of December 31, 2015.
NOTE 8—Investment Securities
The aggregate amount of investment securities (other than short-term securities, U.S. Treasury obligations and money market funds, if any) purchased and sold by the Fund during the year ended December 31, 2015 was $157,243,839 and $128,953,569, respectively. Cost of investments on a tax basis includes the adjustments for financial reporting purposes as of the most recently completed federal income tax reporting period-end.
| | | | |
| Unrealized Appreciation (Depreciation) of Investment Securities on a Tax Basis | |
Aggregate unrealized appreciation of investment securities | | $ | 77,909,808 | |
Aggregate unrealized (depreciation) of investment securities | | | (10,919,835 | ) |
Net unrealized appreciation of investment securities | | $ | 66,989,973 | |
Cost of investments is the same for tax and financial reporting purposes.
NOTE 9—Reclassification of Permanent Differences
Primarily as a result of differing book/tax treatment of net operating losses, on December 31, 2015, undistributed net investment income (loss) was increased by $211,355 and undistributed net realized gain was decreased by $211,355. This reclassification had no effect on the net assets of the Fund.
NOTE 10—Share Information
| | | | | | | | | | | | | | | | |
| | | Summary of Share Activity | |
| | | Years ended December 31, | |
| | | 2015(a) | | | 2014 | |
| | | Shares | | | Amount | | | Shares | | | Amount | |
Sold: | | | | | | | | | | | | | | | | |
Series I | | | 1,916,081 | | | $ | 69,260,617 | | | | 1,630,036 | | | $ | 52,263,554 | |
Series II | | | 907,124 | | | | 31,689,711 | | | | 460,983 | | | | 14,311,931 | |
| | | | |
Issued as reinvestment of dividends: | | | | | | | | | | | | | | | | |
Series I | | | 636,492 | | | | 20,284,975 | | | | 232,319 | | | | 7,510,881 | |
Series II | | | 307,032 | | | | 9,450,446 | | | | 86,004 | | | | 2,701,370 | |
| | | | |
Reacquired: | | | | | | | | | | | | | | | | |
Series I | | | (2,481,998 | ) | | | (85,757,469 | ) | | | (1,490,077 | ) | | | (46,879,346 | ) |
Series II | | | (218,560 | ) | | | (7,107,873 | ) | | | (213,643 | ) | | | (6,468,613 | ) |
Net increase in share activity | | | 1,066,171 | | | $ | 37,820,407 | | | | 705,622 | | | $ | 23,439,777 | |
| (a) | There are entities that are record owners of more than 5% of the outstanding shares of the Fund and in the aggregate own 52% of the outstanding shares of the Fund. The Fund and the Fund’s principal underwriter or adviser, are parties to participation agreements with these entities whereby these entities sell units of interest in separate accounts funding variable products that are invested in the Fund. The Fund, Invesco and/or Invesco affiliates may make payments to these entities, which are considered to be related to the Fund, for providing services to the Fund, Invesco and/or Invesco affiliates including but not limited to services such as, securities brokerage, third party record keeping and account servicing and administrative services. The Fund has no knowledge as to whether all or any portion of the shares owned of record by these entities are also owned beneficially. |
Invesco V.I. Global Health Care Fund
NOTE 11—Financial Highlights
The following schedule presents financial highlights for a share of the Fund outstanding throughout the periods indicated.
| | | | | | | | | | | | | | | | | | | | | | | | | | | | | | | | | | | | | | | | | | | | | | | | | | | | | | | | |
| | | Net asset
value,
beginning
of period | | | Net
investment
income
(loss)(a) | | | Net gains
on securities
(both
realized and
unrealized) | | | Total from
investment
operations | | | Dividends
from net
investment
income | | | Distributions
from net
realized
gains | | | Total
distributions | | | Net asset
value, end
of period | | | Total
return(b) | | | Net assets,
end of period
(000’s omitted) | | | Ratio of
expenses
to average
net assets
with fee waivers
and/or expenses
absorbed | | | Ratio of
expenses
to average net
assets without
fee waivers
and/or expenses
absorbed | | | Ratio of net
investment
income (loss)
to average
net assets | | | Portfolio
turnover(c) | |
Series I | |
Year ended 12/31/15 | | $ | 33.78 | | | $ | 0.00 | | | $ | 1.08 | | | $ | 1.08 | | | $ | — | | | $ | (3.11 | ) | | $ | (3.11 | ) | | $ | 31.75 | | | | 3.16 | % | | $ | 209,511 | | | | 1.06 | %(d) | | | 1.07 | %(d) | | | 0.01 | %(d) | | | 42 | % |
Year ended 12/31/14 | | | 29.32 | | | | (0.00 | ) | | | 5.71 | | | | 5.71 | | | | — | | | | (1.25 | ) | | | (1.25 | ) | | | 33.78 | | | | 19.67 | | | | 220,561 | | | | 1.08 | | | | 1.09 | | | | (0.01 | ) | | | 29 | |
Year ended 12/31/13 | | | 21.00 | | | | 0.01 | | | | 8.49 | | | | 8.50 | | | | (0.18 | ) | | | — | | | | (0.18 | ) | | | 29.32 | | | | 40.54 | | | | 180,535 | | | | 1.09 | | | | 1.10 | | | | 0.03 | | | | 32 | |
Year ended 12/31/12 | | | 17.37 | | | | 0.12 | (e) | | | 3.51 | | | | 3.63 | | | | — | | | | — | | | | — | | | | 21.00 | | | | 20.90 | | | | 128,898 | | | | 1.12 | | | | 1.13 | | | | 0.63 | (e) | | | 43 | |
Year ended 12/31/11 | | | 16.71 | | | | 0.00 | | | | 0.66 | | | | 0.66 | | | | — | | | | — | | | | — | | | | 17.37 | | | | 3.95 | | | | 114,476 | | | | 1.11 | | | | 1.12 | | | | 0.03 | | | | 42 | |
Series II | | | | | | | | | | | | | | | | | | | | | | | | | | | | | | | | | | | | | | | | | | | | | | | | | | | | | | | | |
Year ended 12/31/15 | | | 32.80 | | | | (0.08 | ) | | | 1.04 | | | | 0.96 | | | | — | | | | (3.11 | ) | | | (3.11 | ) | | | 30.65 | | | | 2.89 | | | | 103,464 | | | | 1.31 | (d) | | | 1.32 | (d) | | | (0.24 | )(d) | | | 42 | |
Year ended 12/31/14 | | | 28.57 | | | | (0.08 | ) | | | 5.56 | | | | 5.48 | | | | — | | | | (1.25 | ) | | | (1.25 | ) | | | 32.80 | | | | 19.38 | | | | 78,070 | | | | 1.33 | | | | 1.34 | | | | (0.26 | ) | | | 29 | |
Year ended 12/31/13 | | | 20.49 | | | | (0.05 | ) | | | 8.27 | | | | 8.22 | | | | (0.14 | ) | | | — | | | | (0.14 | ) | | | 28.57 | | | | 40.16 | | | | 58,488 | | | | 1.34 | | | | 1.35 | | | | (0.22 | ) | | | 32 | |
Year ended 12/31/12 | | | 16.99 | | | | 0.07 | (e) | | | 3.43 | | | | 3.50 | | | | — | | | | — | | | | — | | | | 20.49 | | | | 20.60 | | | | 32,823 | | | | 1.37 | | | | 1.38 | | | | 0.38 | (e) | | | 43 | |
Year ended 12/31/11 | | | 16.38 | | | | (0.04 | ) | | | 0.65 | | | | 0.61 | | | | — | | | | — | | | | — | | | | 16.99 | | | | 3.72 | | | | 27,448 | | | | 1.36 | | | | 1.37 | | | | (0.22 | ) | | | 42 | |
| (a) | Calculated using average shares outstanding. |
| (b) | Includes adjustments in accordance with accounting principles generally accepted in the United States of America and as such, the net asset value for financial reporting purposes and the returns based upon those net asset values may differ from the net asset value and returns for shareholder transactions. Total returns are not annualized for periods less than one year, if applicable, and do not reflect charges assessed in connection with a variable product, which if included would reduce total returns. |
| (c) | Portfolio turnover is calculated at the fund level and is not annualized for periods less than one year, if applicable. |
| (d) | Ratios are based on average daily net assets (000’s omitted) of $232,484 and $97,982, for Series I and Series II shares, respectively. |
| (e) | Net investment income (loss) per share and the ratio of net investment income (loss) to average net assets includes significant dividends received during the period. Net investment income (loss) per share and the ratio of net investment income (loss) to average net assets excluding the significant dividends are $(0.01) and (0.02)% and $(0.06) and (0.27)% for Series I and Series II shares, respectively. |
Invesco V.I. Global Health Care Fund
Report of Independent Registered Public Accounting Firm
To the Board of Trustees of AIM Variable Insurance Funds (Invesco Variable Insurance Funds)
and Shareholders of Invesco V.I. Global Health Care Fund:
In our opinion, the accompanying statement of assets and liabilities, including the schedule of investments, and the related statements of operations and of changes in net assets and the financial highlights present fairly, in all material respects, the financial position of Invesco V.I. Global Health Care Fund (one of the funds constituting AIM Variable Insurance Funds (Invesco Variable Insurance Funds), hereafter referred to as the “Fund”) at December 31, 2015, the results of its operations for the year then ended, the changes in its net assets for each of the two years in the period then ended and the financial highlights for each of the five years in the period then ended, in conformity with accounting principles generally accepted in the United States of America. These financial statements and financial highlights (hereafter referred to as “financial statements”) are the responsibility of the Fund’s management. Our responsibility is to express an opinion on these financial statements based on our audits. We conducted our audits of these financial statements in accordance with the standards of the Public Company Accounting Oversight Board (United States). Those standards require that we plan and perform the audit to obtain reasonable assurance about whether the financial statements are free of material misstatement. An audit includes examining, on a test basis, evidence supporting the amounts and disclosures in the financial statements, assessing the accounting principles used and significant estimates made by management, and evaluating the overall financial statement presentation. We believe that our audits, which included confirmation of securities at December 31, 2015 by correspondence with the custodian, provide a reasonable basis for our opinion.
PRICEWATERHOUSECOOPERS LLP
Houston, Texas
February 15, 2016
Invesco V.I. Global Health Care Fund
Calculating your ongoing Fund expenses
Example
As a shareholder of the Fund, you incur ongoing costs, including management fees; distribution and/or service fees (12b-1); and other Fund expenses. This example is intended to help you understand your ongoing costs (in dollars) of investing in the Fund and to compare these costs with ongoing costs of investing in other mutual funds. The example is based on an investment of $1,000 invested at the beginning of the period and held for the entire period July 1, 2015 through December 31, 2015.
The actual and hypothetical expenses in the examples below do not represent the effect of any fees or other expenses assessed in connection with a variable product; if they did, the expenses shown would be higher while the ending account values shown would be lower.
Actual expenses
The table below provides information about actual account values and actual expenses. You may use the information in this table, together with the amount you invested, to estimate the expenses that you paid over the period. Simply divide your account value by $1,000 (for example, an $8,600 account value divided by $1,000 = 8.6), then multiply the result by the number in the table under the heading entitled “Actual Expenses Paid During Period” to estimate the expenses you paid on your account during this period.
Hypothetical example for comparison purposes
The table below also provides information about hypothetical account values and hypothetical expenses based on the Fund’s actual expense ratio and an assumed rate of return of 5% per year before expenses, which is not the Fund’s actual return.
The hypothetical account values and expenses may not be used to estimate the actual ending account balance or expenses you paid for the period. You may use this information to compare the ongoing costs of investing in the Fund and other funds. To do so, compare this 5% hypothetical example with the 5% hypothetical examples that appear in the shareholder reports of the other funds.
Please note that the expenses shown in the table are meant to highlight your ongoing costs. Therefore, the hypothetical information is useful in comparing ongoing costs, and will not help you determine the relative total costs of owning different funds.
| | | | | | | | | | | | | | | | | | | | | | | | |
| Class | | Beginning
Account Value
(07/01/15) | | | ACTUAL | | | HYPOTHETICAL (5% annual return before
expenses) | | | Annualized
Expense Ratio | |
| | | Ending
Account Value
(12/31/15)1 | | | Expenses
Paid During
Period2 | | | Ending
Account Value
(12/31/15) | | | Expenses
Paid During
Period2 | | |
| Series I | | $ | 1,000.00 | | | $ | 926.10 | | | $ | 5.15 | | | $ | 1,019.86 | | | $ | 5.40 | | | | 1.06 | % |
| Series II | | | 1,000.00 | | | | 925.10 | | | | 6.36 | | | | 1,018.60 | | | | 6.67 | | | | 1.31 | |
| 1 | The actual ending account value is based on the actual total return of the Fund for the period July 1, 2015 through December 31, 2015, after actual expenses and will differ from the hypothetical ending account value which is based on the Fund’s expense ratio and a hypothetical annual return of 5% before expenses. |
| 2 | Expenses are equal to the Fund’s annualized expense ratio as indicated above multiplied by the average account value over the period, multiplied by 184/365 to reflect the most recent fiscal half year. |
Invesco V.I. Global Health Care Fund
Tax Information
Form 1099-DIV, Form 1042-S and other year–end tax information provide shareholders with actual calendar year amounts that should be included in their tax returns. Shareholders should consult their tax advisors.
The following distribution information is being provided as required by the Internal Revenue Code or to meet a specific state’s requirement.
The Fund designates the following amounts or, if subsequently determined to be different, the maximum amount allowable for its fiscal year ended December 31, 2015:
| | | | |
Federal and State Income Tax | |
Long-Term Capital Gain Distributions | | $ | 29,247,845 | |
Corporate Dividends Received Deduction* | | | 99.73 | % |
U.S. Treasury Obligations* | | | 0.00 | % |
| | * | The above percentages are based on ordinary income dividends paid to shareholders during the Fund’s fiscal year. |
Invesco V.I. Global Health Care Fund
Trustees and Officers
The address of each trustee and officer is AIM Variable Insurance Funds (Invesco Variable Insurance Funds) (the “Trust”), 11 Greenway Plaza, Suite 1000, Houston, Texas 77046-1173. The trustees serve for the life of the Trust, subject to their earlier death, incapacitation, resignation, retirement or removal as more specifically provided in the Trust’s organizational documents. Each officer serves for a one year term or until their successors are elected and qualified. Column two below includes length of time served with predecessor entities, if any.
| | | | | | | | |
Name, Year of Birth and
Position(s) Held with the Trust | | Trustee and/
or Officer Since | | Principal Occupation(s)
During Past 5 Years | | Number of Funds in Fund Complex Overseen by Trustee | | Other Directorship(s) Held by Trustee During Past 5 Years |
| Interested Persons | | | | | | | | |
| Martin L. Flanagan1 — 1960 Trustee | | 2007 | | Executive Director, Chief Executive Officer and President, Invesco Ltd. (ultimate parent of Invesco and a global investment management firm); Advisor to the Board, Invesco Advisers, Inc. (formerly known as Invesco Institutional (N.A.), Inc.); Trustee, The Invesco Funds; Vice Chair, Investment Company Institute; and Member of Executive Board, SMU Cox School of Business Formerly: Chairman and Chief Executive Officer, Invesco Advisers, Inc. (registered investment adviser); Director, Chairman, Chief Executive Officer and President, IVZ Inc. (holding company), INVESCO Group Services, Inc. (service provider) and Invesco North American Holdings, Inc. (holding company); Director, Chief Executive Officer and President, Invesco Holding Company Limited (parent of Invesco and a global investment management firm); Director, Invesco Ltd.; Chairman, Investment Company Institute and President, Co-Chief Executive Officer, Co-President, Chief Operating Officer and Chief Financial Officer, Franklin Resources, Inc. (global investment management organization) | | 146 | | None |
Philip A. Taylor2 — 1954 Trustee, President and Principal Executive Officer | | 2006 | | Head of North American Retail and Senior Managing Director, Invesco Ltd.; Director, Co-Chairman, Co-President and Co-Chief Executive Officer, Invesco Advisers, Inc. (formerly known as Invesco Institutional (N.A.), Inc.) (registered investment adviser); Director, Chairman, Chief Executive Officer and President, Invesco Management Group, Inc. (formerly known as Invesco Aim Management Group, Inc.) (financial services holding company); Director and Chairman, Invesco Investment Services, Inc. (formerly known as Invesco Aim Investment Services, Inc.) (registered transfer agent) Chief Executive Officer, Invesco Corporate Class Inc. (corporate mutual fund company) Director, Chairman and Chief Executive Officer, Invesco Canada Ltd. (formerly known as Invesco Trimark Ltd./Invesco Trimark Ltèe) (registered investment adviser and registered transfer agent); Trustee, President and Principal Executive Officer, The Invesco Funds (other than AIM Treasurer’s Series Trust (Invesco Treasurer’s Series Trust), Short-Term Investments Trust and Invesco Management Trust); Trustee and Executive Vice President, The Invesco Funds (AIM Treasurer’s Series Trust (Invesco Treasurer’s Series Trust), Short-Term Investments Trust and Invesco Management Trust only); Director, Invesco Investment Advisers LLC (formerly known as Van Kampen Asset Management); Director, Chief Executive Officer and President, Van Kampen Exchange Corp. Formerly: Director and President, INVESCO Funds Group, Inc. (registered investment adviser and registered transfer agent); Director and Chairman, IVZ Distributors, Inc. (formerly known as INVESCO Distributors, Inc.) (registered broker dealer); Director, President and Chairman, Invesco Inc. (holding company), Invesco Canada Holdings Inc. (holding company), Trimark Investments Ltd./Placements Trimark Ltèe and Invesco Financial Services Ltd/Services Financiers Invesco Ltèe; Chief Executive Officer, Invesco Canada Fund Inc (corporate mutual fund company); Director and Chairman, Van Kampen Investor Services Inc.; Director, Chief Executive Officer and President, 1371 Preferred Inc. (holding company) and Van Kampen Investments Inc.; Director and President, AIM GP Canada Inc. (general partner for limited partnerships) and Van Kampen Advisors, Inc.; Director and Chief Executive Officer, Invesco Trimark Dealer Inc. (registered broker dealer); Director, Invesco Distributors, Inc. (formerly known as Invesco Aim Distributors, Inc.) (registered broker dealer); Manager, Invesco PowerShares Capital Management LLC; Director, Chief Executive Officer and President, Invesco Advisers, Inc.; Director, Chairman, Chief Executive Officer and President, Invesco Aim Capital Management, Inc.; President, Invesco Trimark Dealer Inc. and Invesco Trimark Ltd./Invesco Trimark Ltèe; Director and President, AIM Trimark Corporate Class Inc. and AIM Trimark Canada Fund Inc.; Senior Managing Director, Invesco Holding Company Limited; Director and Chairman, Fund Management Company (former registered broker dealer); President and Principal Executive Officer, The Invesco Funds (AIM Treasurer’s Series Trust (Invesco Treasurer’s Series Trust), and Short-Term Investments Trust only); President, AIM Trimark Global Fund Inc. and AIM Trimark Canada Fund Inc | | 146 | | None |
| 1 | Mr. Flanagan is considered an interested person (within the meaning of Section 2(a)(19) of the 1940 Act) of the Trust because he is an officer of the Adviser to the Trust, and an officer and a director of Invesco Ltd., ultimate parent of the Adviser. |
| 2 | Mr. Taylor is considered an interested person (within the meaning of Section 2(a)(19) of the 1940 Act) of the Trust because he is an officer and a director of the Adviser. |
Invesco V.I. Global Health Care Fund
Trustees and Officers—(continued)
| | | | | | | | |
Name, Year of Birth and
Position(s) Held with the Trust | | Trustee and/
or Officer Since | | Principal Occupation(s)
During Past 5 Years | | Number of Funds in Fund Complex Overseen by Trustee | | Other Directorship(s)
Held by Trustee During Past 5 Years |
| Independent Trustees | | | | | | | | |
Bruce L. Crockett — 1944 Trustee and Chair | | 2003 | | Chairman, Crockett Technologies Associates (technology consulting company) Formerly: Director, Captaris (unified messaging provider); Director, President and Chief Executive Officer, COMSAT Corporation; Chairman, Board of Governors of INTELSAT (international communications company); ACE Limited (insurance company); Independent Directors Council and Investment Company Institute | | 146 | | ALPS (Attorneys Liability Protection Society) (insurance company) and Globe Specialty Metals, Inc. (metallurgical company) |
David C. Arch — 1945 Trustee | | 2010 | | Chairman of Blistex Inc., a consumer health care products manufacturer | | 146 | | Board member of the Illinois Manufacturers’ Association; Member of the Board of Visitors, Institute for the Humanities, University of Michigan |
James T. Bunch — 1942 Trustee | | 2000 | | Managing Member, Grumman Hill Group LLC (family office/private equity investments) Formerly: Chairman of the Board of Trustees, Evans Scholars Foundation and Chairman, Board of Governors, Western Golf Association | | 146 | | Trustee, Evans Scholars Foundation; and Chairman of the Board, Denver Film Society |
Albert R. Dowden — 1941 Trustee | | 2003 | | Director of a number of public and private business corporations, including the Boss Group, Ltd. (private investment and management); Nature’s Sunshine Products, Inc. and Reich & Tang Funds (5 portfolios) (registered investment company) Formerly: Director, Homeowners of America Holding Corporation/Homeowners of America Insurance Company (property casualty company); Director, Continental Energy Services, LLC (oil and gas pipeline service); Director, CompuDyne Corporation (provider of product and services to the public security market) and Director, Annuity and Life Re (Holdings), Ltd. (reinsurance company); Director, President and Chief Executive Officer, Volvo Group North America, Inc.; Senior Vice President, AB Volvo; Director of various public and private corporations; Chairman, DHJ Media, Inc.; Director, Magellan Insurance Company; and Director, The Hertz Corporation, Genmar Corporation (boat manufacturer), National Media Corporation; Advisory Board of Rotary Power International (designer, manufacturer, and seller of rotary power engines); and Chairman, Cortland Trust, Inc. (registered investment company) | | 146 | | Director of: Nature’s Sunshine Products, Inc., Reich & Tang Funds, Homeowners of America Holding Corporation/ Homeowners of America Insurance Company, the Boss Group |
Jack M. Fields — 1952 Trustee | | 2003 | | Chief Executive Officer, Twenty First Century Group, Inc. (government affairs company); Owner and Chief Executive Officer, Dos Angeles Ranch, L.P. (cattle, hunting, corporate entertainment); and Discovery Global Education Fund (non-profit) Formerly: Chief Executive Officer, Texana Timber LP (sustainable forestry company); Director of Cross Timbers Quail Research Ranch (non-profit); and member of the U.S. House of Representatives | | 146 | | Insperity, Inc. (formerly known as Administaff) |
Eli Jones — Trustee | | 2016 | | Professor and Dean, Mays Business School, Texas A&M University Formerly: Professor and Dean, Walton College of Business, University of Arkansas, and E.J. Ourso College of Business, Louisiana State University | | 146 | | Director, Insperity, Inc., (2011-present) and ARVEST Bank (2012-2015) |
Prema Mathai-Davis — 1950 Trustee | | 2003 | | Retired. Formerly: Chief Executive Officer, YWCA of the U.S.A. | | 146 | | None |
Larry Soll — 1942 Trustee | | 1997 | | Retired. Formerly: Chairman, Chief Executive Officer and President, Synergen Corp. (a biotechnology company) | | 146 | | None |
Robert C. Troccoli — Trustee | | 2016 | | Retired. Formerly: Senior Partner, KPMG LLP | | 146 | | None |
Raymond Stickel, Jr. — 1944 Trustee | | 2005 | | Retired. Formerly: Director, Mainstay VP Series Funds, Inc. (25 portfolios) and Partner, Deloitte & Touche | | 146 | | None |
Suzanne H. Woolsey — 1941 Trustee | | 2014 | | Chief Executive Officer of Woolsey Partners LLC | | 146 | | Emeritus Chair of the Board of Trustees of the Institute for Defense Analyses; Trustee of Colorado College; Trustee of California Institute of Technology; Prior to 2014, Director of Fluor Corp.; Prior to 2010, Trustee of the German Marshall Fund of the United States; Prior to 2010 Trustee of the Rocky Mountain Institute |
Invesco V.I. Global Health Care Fund
Trustees and Officers—(continued)
| | | | | | | | |
Name, Year of Birth and
Position(s) Held with the Trust | | Trustee and/
or Officer Since | | Principal Occupation(s)
During Past 5 Years | | Number of Funds in Fund Complex Overseen by Trustee | | Other Directorship(s)
Held by Trustee During Past 5 Years |
| Other Officers | | | | | | | | |
Russell C. Burk — 1958 Senior Vice President and Senior Officer | | 2005 | | Senior Vice President and Senior Officer, The Invesco Funds | | N/A | | N/A |
John M. Zerr — 1962 Senior Vice President, Chief Legal Officer and Secretary | | 2006 | | Director, Senior Vice President, Secretary and General Counsel, Invesco Management Group, Inc. (formerly known as Invesco Aim Management Group, Inc.) and Van Kampen Exchange Corp.; Senior Vice President, Invesco Advisers, Inc. (formerly known as Invesco Institutional (N.A.), Inc.) (registered investment adviser); Senior Vice President and Secretary, Invesco Distributors, Inc. (formerly known as Invesco Aim Distributors, Inc.); Director, Vice President and Secretary, Invesco Investment Services, Inc. (formerly known as Invesco Aim Investment Services, Inc.); Senior Vice President, Chief Legal Officer and Secretary, The Invesco Funds; Managing Director, Invesco PowerShares Capital Management LLC; Director, Secretary and General Counsel, Invesco Investment Advisers LLC (formerly known as Van Kampen Asset Management); Secretary and General Counsel, Invesco Capital Markets, Inc. (formerly known as Van Kampen Funds Inc.) and Chief Legal Officer, PowerShares Exchange-Traded Fund Trust, PowerShares Exchange-Traded Fund Trust II, PowerShares India Exchange-Traded Fund Trust, PowerShares Actively Managed Exchange-Traded Fund Trust, and PowerShares Actively Managed Exchange-Traded Commodity Fund Trust Formerly: Director, Vice President and Secretary, IVZ Distributors, Inc. (formerly known as INVESCO distributors, Inc.); Director and Vice President, INVESCO Funds Group, Inc.; Director and Vice President, Van Kampen Advisors Inc.; Director, Vice President, Secretary and General Counsel, Van Kampen Investor Services Inc.; Director, Invesco Distributors, Inc. (formerly known as Invesco Aim Distributors, Inc.); Director, Senior Vice President, General Counsel and Secretary, Invesco Aim Advisers, Inc. and Van Kampen Investments Inc.; Director, Vice President and Secretary, Fund Management Company; Director, Senior Vice President, Secretary, General Counsel and Vice President, Invesco Aim Capital Management, Inc.; Chief Operating Officer and General Counsel, Liberty Ridge Capital, Inc. (an investment adviser); Vice President and Secretary, PBHG Funds (an investment company) and PBHG Insurance Series Fund (an investment company); Chief Operating Officer, General Counsel and Secretary, Old Mutual Investment Partners (a broker-dealer); General Counsel and Secretary, Old Mutual Fund Services (an administrator) and Old Mutual Shareholder Services (a shareholder servicing center); Executive Vice President, General Counsel and Secretary, Old Mutual Capital, Inc. (an investment adviser); and Vice President and Secretary, Old Mutual Advisors Funds (an investment company) | | N/A | | N/A |
Sheri Morris — 1964 Vice President, Treasurer and Principal Financial Officer | | 2003 | | Vice President, Treasurer and Principal Financial Officer, The Invesco Funds; Vice President, Invesco Advisers, Inc. (formerly known as Invesco Institutional (N.A.), Inc.) (registered investment adviser); and Vice President, PowerShares Exchange-Traded Fund Trust, PowerShares Exchange-Traded Fund Trust II, PowerShares India Exchange-Traded Fund Trust, PowerShares Actively Managed Exchange-Traded Fund Trust, and PowerShares Actively Managed Exchange-Traded Commodity Fund Trust Formerly: Vice President, Invesco Aim Advisers, Inc., Invesco Aim Capital Management, Inc. and Invesco Aim Private Asset Management, Inc.; Assistant Vice President and Assistant Treasurer, The Invesco Funds and Assistant Vice President, Invesco Advisers, Inc., Invesco Aim Capital Management, Inc. and Invesco Aim Private Asset Management, Inc.; and Treasurer, PowerShares Exchange-Traded Fund Trust, PowerShares Exchange-Traded Fund Trust II, PowerShares India Exchange-Traded Fund Trust and PowerShares Actively Managed Exchange-Traded Fund Trust | | N/A | | N/A |
��
Invesco V.I. Global Health Care Fund
Trustees and Officers—(continued)
| | | | | | | | |
Name, Year of Birth and
Position(s) Held with the Trust | | Trustee and/
or Officer Since | | Principal Occupation(s)
During Past 5 Years | | Number of Funds in Fund Complex Overseen by Trustee | | Other Directorship(s)
Held by Trustee During Past 5 Years |
| Other Officers—(continued) | | | | | | | | |
Karen Dunn Kelley — 1960 Vice President | | 2003 | | Senior Managing Director, Investments, Invesco Ltd.; Director, Co-President, Co-Chief Executive Officer, and Co-Chairman, Invesco Advisers, Inc. (formerly known as Invesco Institutional (N.A.), Inc.) (registered investment adviser); Chairman, Invesco Senior Secured Management, Inc.; Senior Vice President, Invesco Management Group, Inc. (formerly known as Invesco Aim Management Group, Inc.); Executive Vice President, Invesco Distributors, Inc. (formerly known as Invesco Aim Distributors, Inc.); Director, Invesco Mortgage Capital Inc. and Invesco Management Company Limited; Vice President, The Invesco Funds (other than AIM Treasurer’s Series Trust (Invesco Treasurer’s Series Trust), Short-Term Investments Trust and Invesco Management Trust); and President and Principal Executive Officer, The Invesco Funds (AIM Treasurer’s Series Trust (Invesco Treasurer’s Series Trust), Short-Term Investments Trust and Invesco Management Trust only) Formerly: Director and President, INVESCO Asset Management (Bermuda) Ltd., Director, INVESCO Global Asset Management Limited and INVESCO Management S.A.; Senior Vice President, Van Kampen Investments Inc. and Invesco Advisers, Inc. (formerly known as Invesco Institutional (N.A.), Inc.) (registered investment adviser); Vice President, Invesco Advisers, Inc. (formerly known as Invesco Institutional (N.A.), Inc.); Director of Cash Management and Senior Vice President, Invesco Advisers, Inc. and Invesco Aim Capital Management, Inc.; Director and President, Fund Management Company; Chief Cash Management Officer, Director of Cash Management, Senior Vice President, and Managing Director, Invesco Aim Capital Management, Inc.; Director of Cash Management, Senior Vice President, and Vice President, Invesco Advisers, Inc. and The Invesco Funds (AIM Treasurer’s Series Trust (Invesco Treasurer’s Series Trust), and Short-Term Investments Trust only) | | N/A | | N/A |
Crissie M. Wisdom — 1969 Anti-Money Laundering Compliance Officer | | 2013 | | Anti-Money Laundering Compliance Officer, Invesco Advisers, Inc. (formerly known as Invesco Institutional (N.A.), Inc.) (registered investment adviser), Invesco Capital Markets, Inc. (formerly known as Van Kampen Funds Inc.), Invesco Distributors, Inc., Invesco Investment Services, Inc., Invesco Management Group, Inc., Van Kampen Exchange Corp., The Invesco Funds, and PowerShares Exchange-Traded Fund Trust, PowerShares Exchange-Traded Fund Trust II, PowerShares India Exchange-Traded Fund Trust, PowerShares Actively Managed Exchange-Traded Fund Trust and PowerShares Actively Managed Exchange-Traded Commodity Fund Trust; Anti-Money Laundering Compliance Officer and Bank Secrecy Act Officer, INVESCO National Trust Company and Invesco Trust Company; and Fraud Prevention Manager and Controls and Risk Analysis Manager for Invesco Investment Services, Inc. | | N/A | | N/A |
Lisa O. Brinkley — 1959 Chief Compliance Officer | | 2015 | | Senior Vice President and Chief Compliance Officer, Invesco Advisers, Inc. (registered investment adviser) (formerly known as Invesco Institutional (N.A., Inc.); and Chief Compliance Officer, The Invesco Funds Formerly: Global Assurance Officer, Invesco Ltd. and Vice President, The Invesco Funds; Chief Compliance Officer, Invesco Distributors, Inc. (formerly known as Invesco Aim Distributors, Inc.), Invesco Investment Services, Inc.(formerly known as Invesco Aim Investment Services, Inc.) and Van Kampen Investor Services Inc.; Senior Vice President, Invesco Management Group, Inc.; Senior Vice President and Chief Compliance Officer, Invesco Advisers, Inc. and The Invesco Funds; Vice President and Chief Compliance Officer, Invesco Aim Capital Management, Inc. and Invesco Distributors, Inc.; Vice President, Invesco Investment Services, Inc. and Fund Management Company | | N/A | | N/A |
The Statement of Additional Information of the Trust includes additional information about the Fund’s Trustees and is available upon request, without charge, by calling 1.800.959.4246. Please refer to the Fund’s prospectus for information on the Fund’s sub-advisers.
| | | | | | |
Office of the Fund 11 Greenway Plaza, Suite 1000 Houston, TX 77046-1173 | | Investment Adviser Invesco Advisers, Inc. 1555 Peachtree Street, N.E. Atlanta, GA 30309 | | Distributor Invesco Distributors, Inc. 11 Greenway Plaza, Suite 1000 Houston, TX 77046-1173 | | Auditors PricewaterhouseCoopers LLP 1000 Louisiana Street, Suite 5800 Houston, TX 77002-5678 |
| | | |
| | | | | | |
Counsel to the Fund Stradley Ronon Stevens & Young, LLP 2005 Market Street, Suite 2600 Philadelphia, PA 19103-7018 | | Counsel to the Independent Trustees Goodwin Procter LLP 901 New York Avenue, N.W. Washington, D.C. 20001 | | Transfer Agent Invesco Investment Services, Inc. 11 Greenway Plaza, Suite 1000 Houston, TX 77046-1173 | | Custodian State Street Bank and Trust Company 225 Franklin Street Boston, MA 02110-2801 |
Invesco V.I. Global Health Care Fund
| | | | |
| | |
 | | Annual Report to Shareholders | | December 31, 2015 |
| | |
| | Invesco V.I. Global Real Estate Fund |

| | |
| | The Fund provides a complete list of its holdings four times in each fiscal year, at the quarter-ends. For the second and fourth quarters, the lists appear in the Fund’s semiannual and annual reports to shareholders. For the first and third quarters, the Fund files the lists with the Securities and Exchange Commission (SEC) on Form N-Q. The Fund’s Form N-Q filings are available on the SEC website, sec.gov. Copies of the Fund’s Forms N-Q may be reviewed and copied at the SEC Public Reference Room in Washington, D.C. You can obtain information on the operation of the Public Reference Room, including information about duplicating fee charges, by calling 202 551 8090 or 800 732 0330, or by electronic request at the following email address: publicinfo@sec.gov. The SEC file numbers for the Fund are 811-07452 and 033-57340. The Fund’s most recent portfolio holdings, as filed on Form N-Q, have also been made available to insurance companies issuing variable annuity contracts and variable life insurance policies (“variable products”) that invest in the Fund. A description of the policies and procedures that the Fund uses to determine how to vote proxies relating to portfolio securities is available without charge, upon request, from our Client Services department at 800 959 4246 or at invesco.com/proxyguidelines. The information is also available on the SEC website, sec.gov. Information regarding how the Fund voted proxies related to its portfolio securities during the most recent 12-month period ended June 30 is available at invesco.com/ proxysearch. The information is also available on the SEC website, sec.gov. Invesco Advisers, Inc. is an investment adviser; it provides investment advisory services to individual and institutional clients and does not sell securities. Invesco Distributors, Inc. is the US distributor for Invesco Ltd.’s retail mutual funds, exchange-traded funds and institutional money market funds. Both are wholly owned, indirect subsidiaries of Invesco Ltd. This report must be accompanied or preceded by a currently effective Fund prospectus and variable product prospectus, which contain more complete information, including sales charges and expenses. Investors should read each carefully before investing. Invesco Distributors, Inc. VIGRE-AR-1 NOT FDIC INSURED | MAY LOSE VALUE | NO BANK GUARANTEE |
Management’s Discussion of Fund Performance
Performance summary
For the year ended December 31, 2015, Series I shares of Invesco V.I. Global Real Estate Fund (the Fund) underperformed its style-specific benchmark, the Custom Invesco Global Real Estate Index.
Your Fund’s long-term performance appears later in this report.
Fund vs. Indexes
Total returns, 12/31/14 to 12/31/15, excluding variable product issuer charges.
If variable product issuer charges were included, returns would be lower.
| | | | | |
| Series I Shares | | | | -1.48% | |
| Series II Shares | | | | -1.74 | |
| MSCI World Index▼ (Broad Market Index) | | | | -0.87 | |
| Custom Invesco Global Real Estate Indexn (Style-Specific Index) | | | | -1.19 | |
| Lipper VUF Real Estate Funds Classification Average¿ (Peer Group) | | | | 2.33 | |
Source(s): ▼FactSet Research Systems Inc.; nInvesco, FactSet Research Systems Inc.; ¿Lipper Inc. | |
Market conditions and your Fund
Global equity markets faced significant headwinds during the year ended December 31, 2015. Developed markets were generally able to better withstand these headwinds than more fragile emerging markets, many of which faltered.
As the year began, the view that the US Federal Reserve (the Fed) would begin raising rates while other central banks were loosening monetary policy led the US dollar to strengthen against many currencies. At the same time, oil prices continued to decline as increased supply outstripped demand. This had the effect of hurting commodity- and materials-based economies – and companies in related sectors. A colder-than-expected winter in the US and concerns about a possible Greek exit from the eurozone contributed to market uncertainty. During the summer of 2015, China’s surprise devaluation of the renminbi and a significant downturn in its financial markets triggered a sell-off in global equity markets, particularly in already-vulnerable
emerging markets. In the fall, markets around the world began to regain their footing, but the impact of a late-year crash in oil prices offset these gains.
The global economy continued to expand, albeit slowly, during 2015. However, that growth became increasingly uneven across developed and emerging economies. Central bank policies also began to diverge as the Fed followed through on its commitment to normalize monetary policy by raising interest rates – even as the European Central Bank extended its asset purchase program and Japan introduced additional quantitative easing. While developed equity markets were fairly resilient during the year, many emerging markets – particularly Greece and Brazil – struggled and ended the year down significantly.
Real estate supply and demand fundamentals and capital flows provided a supportive operating environment for listed real estate companies in 2015. Prime commercial property valuations in most markets rose throughout the year as global capital continued to circulate in search of quality real assets.
Key contributors to relative performance versus the Fund’s style-specific benchmark included positive security selection in Japan, Singapore and the UK. Overweight allocation in Japan and the UK, as well as underweight allocation in Singapore, Brazil and Hong Kong, also contributed to relative Fund returns.
Primary detractors from relative Fund performance were security selections in China, Australia, the UAE and the Netherlands. Overweight allocation in the UAE and underweight allocation in Switzerland and Spain also detracted from relative Fund returns.
Top contributors to the Fund’s absolute performance included AvalonBay Communities and Simon Property Group. AvalonBay, which owns and manages distinctive apartment homes in several US markets, offered an above-average cash flow growth profile. Regional mall landlord Simon Property is one of the largest global real estate companies with retail properties and investments across North America, Europe and Asia. Heightened concerns regarding moderating retail sales growth and potential store closures prompted us to reduce our position in Simon Property toward the end of the year, although the position remained overweight relative to the Fund’ style-specific index.
Top absolute detractors from Fund performance included Ventas and Sun Hung Kai Properties. We eliminated our position in Ventas, a health care-focused US real estate investment trust (REIT), during the year due to a moderation in the company’s internal and external growth opportunities. Sun Hung Kai is one of the largest property companies in Hong Kong focusing on premium residential and commercial development. In general, Hong Kong developer stocks underperformed
| | | | | |
| Portfolio Composition | |
By country | | | | % of total net assets | |
| United States | | | | 48.2% | |
| Japan | | | | 9.9 | |
| Hong Kong | | | | 6.9 | |
| United Kingdom | | | | 5.7 | |
| China | | | | 5.1 | |
| Australia | | | | 5.0 | |
| France | | | | 3.2 | |
| Germany | | | | 3.0 | |
Countries Each Less | |
Than 2.0% Of Portfolio | | | | 11.6 | |
Money Market Funds | | | | | |
Plus Other Assets Less Liabilities | | | | 1.4 | |
| | | | | | | |
| Top 10 Equity Holdings* | |
| | % of total net assets | |
| 1. | | Simon Property Group, Inc. | | | | 4.6% | |
| 2. | | AvalonBay Communities, Inc. | | | | 4.2 | |
| 3. | | HCP, Inc. | | | | 2.7 | |
| 4. | | Mitsubishi Estate Co. Ltd. | | | | 2.6 | |
| 5. | | Land Securities Group PLC | | | | 2.5 | |
| 6. | | Mitsui Fudosan Co., Ltd. | | | | 2.3 | |
| 7. | | Boston Properties, Inc. | | | | 2.1 | |
| 8. | | Unibail-Rodamco S.E. | | | | 1.9 | |
| 9. | | Sun Hung Kai Properties Ltd. | | | | 1.9 | |
10. | | Prologis, Inc. | | | | 1.8 | |
| | | | | |
Total Net Assets | | | $ | 416.8 million | |
Total Number of Holdings* | | | | 149 | |
The Fund’s holdings are subject to change, and there is no assurance that the Fund will continue to hold any particular security.
*Excluding money market fund holdings.
Data presented here are as of December 31, 2015.
Invesco V.I. Global Real Estate Fund
amid concerns about a rate hike in US and slowing economic growth in China.
At the end of the reporting period, listed real estate companies were generally well positioned from a capital allocation and risk management perspective. Most companies undertaking active development were delivering buildings into supply-hungry markets and collecting rewards for doing so. Additionally, despite good availability of debt financing, listed real estate continued to show moderate levels of financial leverage.
Overall, we maintained a bias toward companies with higher quality assets and lower-leveraged balance sheets – particularly those in supply-constrained real estate markets. We also favored companies with above-average growth prospects, given that rates may continue to rise modestly over the mid-term.
We thank you for your continued investment in Invesco V.I. Global Real Estate Fund.
The views and opinions expressed in management’s discussion of Fund performance are those of Invesco Advisers, Inc. These views and opinions are subject to change at any time based on factors such as market and economic conditions. These views and opinions may not be relied upon as investment advice or recommendations, or as an offer for a particular security. The information is not a complete analysis of every aspect of any market, country, industry, security or the Fund. Statements of fact are from sources considered reliable, but Invesco Advisers, Inc. makes no representation or warranty as to their completeness or accuracy. Although historical performance is no guarantee of future results, these insights may help you understand our investment management philosophy.
See important Fund and, if applicable, index disclosures later in this report.
| | |
 | | Joe Rodriguez Jr. Portfolio Manager, is lead manager of Invesco V.I. Global Real Estate Fund. He is Head of Global Securities with Invesco Real Estate, where |
| he oversees all phases of the unit, including securities research and administration. Mr. Rodriguez joined Invesco in 1990. He earned a BBA in economics and finance and an MBA in finance from Baylor University. |
| | |
 | | Mark Blackburn Chartered Financial Analyst, Portfolio Manager, is manager of Invesco V.I. Global Real Estate Fund. He joined Invesco in 1998. |
| Mr. Blackburn earned a BS in accounting from Louisiana State University and an MBA from Southern Methodist University. |
| | |
 | | James Cowen Portfolio Manager, is manager of Invesco V.I. Global Real Estate Fund. He joined Invesco in 2000. Mr. Cowen earned a Master of |
| Town and Country Planning degree from the University of Manchester and a Master of Philosophy degree in land economy from Cambridge University. |
| | |
 | | Paul Curbo Chartered Financial Analyst, Portfolio Manager, is manager of Invesco V.I. Global Real Estate Fund. He joined Invesco in 1998. |
| Mr. Curbo earned a BBA in finance from The University of Texas at Austin. |
| | |
 | | Darin Turner Portfolio Manager, is manager of Invesco V.I. Global Real Estate Fund. He joined Invesco in 2005. Mr. Turner earned a BBA in finance |
| from Baylor University, an MS in real estate from The University of Texas at Arlington and an MBA specializing in investments from Southern Methodist University. |
| | |
 | | Ping Ying Wang Chartered Financial Analyst, Portfolio Manager, is manager of Invesco V.I. Global Real Estate Fund. She joined Invesco in 1998. |
| Ms. Wang earned a BS in international finance from the People’s University of China and a PhD in finance from The University of Texas at Dallas. |
Invesco V.I. Global Real Estate Fund
Your Fund’s Long-Term Performance
Results of a $10,000 Investment – Oldest Share Class(es)
Fund and index data from 12/31/05
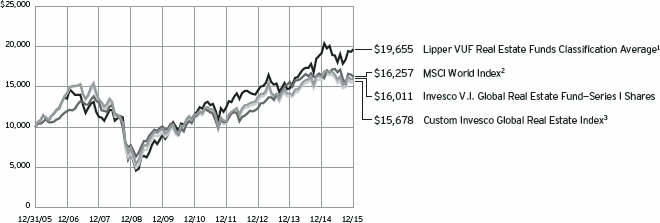
| 2 | Source: FactSet Research Systems Inc. |
| 3 | Source(s): Invesco, FactSet Research Systems Inc. |
Past performance cannot guarantee comparable future results.
| | | | | |
| Average Annual Total Returns |
As of 12/31/15 | | | | | |
| |
| Series I Shares | | | | | |
| Inception (3/31/98) | | | | 8.08% | |
| 10 Years | | | | 4.82 | |
| 5 Years | | | | 6.80 | |
| 1 Year | | | | -1.48 | |
| |
| Series II Shares | | | | | |
| Inception (4/30/04) | | | | 8.15% | |
| 10 Years | | | | 4.57 | |
| 5 Years | | | | 6.54 | |
| 1 Year | | | | -1.74 | |
The performance of the Fund’s Series I and Series II share classes will differ primarily due to different class expenses.
The performance data quoted represent past performance and cannot guarantee comparable future results; current performance may be lower or higher. Please contact your variable product issuer or financial adviser for the most recent month-end variable product performance. Performance figures reflect Fund expenses,
reinvested distributions and changes in net asset value. Investment return and principal value will fluctuate so that you may have a gain or loss when you sell shares.
The total annual Fund operating expense ratio set forth in the most recent Fund prospectus as of the date of this report for Series I and Series II shares was 1.10% and 1.35%, respectively. The expense ratios presented above may vary from the expense ratios presented in other sections of this report that are based on expenses incurred during the period covered by this report.
Invesco V.I. Global Real Estate Fund, a series portfolio of AIM Variable Insurance Funds (Invesco Variable Insurance Funds), is currently offered through insurance companies issuing variable products. You cannot purchase shares of the Fund directly. Performance figures given represent the Fund and are not intended to reflect
actual variable product values. They do not reflect sales charges, expenses and fees assessed in connection with a variable product. Sales charges, expenses and fees, which are determined by the variable product issuers, will vary and will lower the total return.
The most recent month-end performance at the Fund level, excluding variable product charges, is available at 800 451 4246. As mentioned above, for the most recent month-end performance including variable product charges, please contact your variable product issuer or financial adviser.
Fund performance reflects any applicable fee waivers and/or expense reimbursements. Had the adviser not waived fees and/or reimbursed expenses currently or in the past, returns would have been lower. See current prospectus for more information.
Invesco V.I. Global Real Estate Fund
Invesco V.I. Global Real Estate Fund’s investment objective is total return through growth of capital and current income.
| n | Unless otherwise stated, information presented in this report is as of December 31, 2015, and is based on total net assets. |
| n | Unless otherwise noted, all data provided by Invesco. |
| n | To access your Fund’s reports/prospectus, visit invesco.com/fundreports. |
Principal risks of investing in the Fund
Convertible securities risk. The Fund may own convertible securities, the value of which may be affected by market interest rates, the risk that the issuer will default, the value of the underlying stock or the right of the issuer to buy back the convertible securities.
Credit risk. The issuer of instruments in which the Fund invests may be unable to meet interest and/or principal payments, thereby causing its instruments to decrease in value and lowering the issuer’s credit rating.
Derivatives risk. The value of a derivative instrument depends largely on (and is derived from) the value of an underlying security, currency, commodity, interest rate, index or other asset (each referred to as an underlying asset). In addition to risks relating to the underlying assets, the use of derivatives may include other, possibly greater, risks, including counterparty, leverage and liquidity risks. Counterparty risk is the risk that the counterparty to the derivative contract will default on its obligation to pay the Fund the amount owed or otherwise perform under the derivative contract. Derivatives create leverage risk because they do not require payment up front equal to the economic exposure created by owning the derivative. As a result, an adverse change in the value of the underlying asset could result in the Fund sustaining a loss that is substantially greater than the amount invested in the derivative, which may make the Fund’s returns more volatile and increase the risk of loss. Derivative instruments may also be less liquid than more traditional investments and the Fund may be unable to sell or close out its derivative positions at a desirable time or price. This risk may be more acute under adverse market conditions, during which the Fund may be most in need of liquidating its derivative positions. Derivatives may also be harder to value, less tax efficient and subject to changing government regulation that could impact the Fund’s ability to use certain derivatives or their cost. Also, derivatives used for hedging or to gain or limit exposure to a particular market segment may not provide the expected benefits, particularly during adverse market conditions.
Developing/emerging markets securities risk. The prices of securities issued by foreign companies and governments located in developing/ emerging markets countries may be affected more negatively by inflation, devaluation of their currencies, higher transaction costs, delays in settlement, adverse political developments, the introduction of capital controls, withholding taxes, nationalization of private assets, expropriation, social unrest, war or lack of timely information than those in developed countries.
Foreign securities risk. The Fund’s foreign investments may be affected by changes in a foreign country’s exchange rates, political and social instability, changes in economic or taxation policies, difficulties when enforcing obligations, decreased liquidity, and increased volatility. Foreign companies may be subject to less regulation resulting in less publicly available information about the companies.
Geographic focus risk. From time to time the Fund may invest a substantial amount of its assets in securities of issuers located in a single country or a limited number of countries. If the Fund focuses its investments in this manner, it assumes the risk that economic, political and social conditions in those countries will have a significant impact on its investment performance. The Fund’s investment performance may also be more volatile if it focuses its investments in certain countries, especially emerging markets countries.
High yield bond (junk bond) risk. Junk bonds involve a greater risk of default or price changes due to changes in the credit quality of the issuer. The values of junk bonds fluctuate more than those of high- quality bonds in response to company, political, regulatory or economic developments. Values of junk bonds can decline significantly over short periods of time.
Interest rate risk. Interest rate risk refers to the risk that bond prices generally fall as interest rates rise; conversely, bond prices generally rise as interest rates fall. Specific bonds differ in their sensitivity to changes in interest rates depending on their individual characteristics, including duration.
Management risk. The investment techniques and risk analysis used by the Fund’s portfolio managers may not produce the desired results.
Market risk. The prices of and the income generated by the Fund’s securities may decline in response to, among other things, investor sentiment, general economic and market conditions, regional or global instability, and currency and interest rate fluctuations.
Mortgage- and asset-backed securities risk. The Fund may invest in mortgage- and asset-backed securities that are subject to prepayment or call risk, which is the risk that the borrower’s payments may be received earlier or later than expected due to changes in prepayment rates on underlying loans. Faster prepayments often happen when interest rates are falling. As a result, the Fund may reinvest these early payments at lower interest rates, thereby reducing the Fund’s income. Conversely, when interest rates rise, prepayments may happen more slowly, causing the security to lengthen in duration. Longer duration securities tend to be more volatile. Securities may be prepaid at a price less than the original purchase value. An unexpectedly high rate of defaults on the mortgages held by a mortgage pool may adversely affect the value of mortgage-backed securities and could result in losses to the Fund. The risk of such defaults is generally higher in the case of mortgage pools that include subprime mortgages. Subprime mortgages refer to loans made to borrowers with weakened credit histories or with lower capacity to make timely payments on their mortgages.
Preferred securities risk. Preferred securities may include provisions that permit the issuer, in its discretion, to defer or omit distributions for a certain period of time. If the Fund owns a security that is deferring or omitting its distributions, the Fund may be required to report the distribution on its tax returns, even though it may not have received this income. Further, preferred securities may lose substantial value due to the omission or deferment of dividend payments.
REIT risk/real estate risk. The Fund concentrates its investments in the securities of real estate and real estate related companies. Investments in real
Invesco V.I. Global Real Estate Fund
estate related instruments may be affected by economic, legal, cultural, environmental or technological factors that affect property values, rents or occupancies of real estate related to the Fund’s holdings. Shares of real estate related companies, which tend to be small- and mid-cap companies, may be more volatile and less liquid. If a real estate related company defaults on certain types of debt obligations, the Fund may own real estate directly, which involves additional risks such as environmental liabilities; difficulty in valuing and selling the real estate; and economic or regulatory changes.
Short sales risk. Short sales may cause the Fund to repurchase a security at a higher price, thereby causing the Fund to incur a loss. A short position in a security poses more risk than holding the same security long. As there is no limit on how much the price of the security can increase, the Fund’s exposure is unlimited. In order to establish a short position in a security, the Fund must borrow the security from a broker. The Fund may not always be able to borrow a security the Fund seeks to sell short at a particular time or at an acceptable price. The Fund also may not always be able to close out the short position by replacing the borrowed securities at a particular time or at an acceptable price. The Fund will incur increased transaction costs associated with selling securities short. In addition, taking short positions in securities results in a form of leverage which may cause the Fund to be volatile.
Small- and mid-capitalization risks. Stocks of small- and mid-sized companies tend to be more vulnerable to adverse developments and may have little or no operating history or track record of success, and limited product lines, markets, management and financial resources. The securities of small- and mid-sized companies may be more volatile due to less market interest and less publicly available information about the issuer. They also may be illiquid or restricted as to resale, or may trade less frequently and in smaller volumes, all of which may cause difficulty when establishing or closing a position at a desirable price.
About indexes used in this report
The MSCI World IndexSM is an unmanaged index considered representative of stocks of developed countries. The index is computed using the net return, which withholds applicable taxes for non-resident investors.
The Custom Invesco Global Real Estate Index is composed of the FTSE EPRA/NAREIT Developed Index (gross) from fund inception through February, 17, 2005; the FTSE EPRA/NAREIT Developed Index (net) index from February 18, 2005, through June 30, 2014; and the FTSE EPRA/NAREIT Global (net) index from July 1, 2014. FTSE EPRA/NAREIT Developed Index is an unmanaged index considered representative of listed real estate companies and REITs worldwide. FTSE EPRA/NAREIT Global Index is a free float, market capitalization-weighted real estate index designed to represent publicly traded equity REITs and listed property companies in 38 countries worldwide, covering both the developed and emerging markets.
The Lipper VUF Real Estate Funds Classification Average represents an average of all variable insurance underlying funds in the Lipper Real Estate Funds classification.
The Fund is not managed to track the performance of any particular index, including the index(es) described here, and consequently, the performance of the Fund may deviate significantly from the performance of the index(es).
A direct investment cannot be made in an index. Unless otherwise indicated, index results include reinvested dividends, and they do not reflect sales charges. Performance of the peer group, if applicable, reflects fund expenses; performance of a market index does not.
Other information
The returns shown in management’s discussion of Fund performance are based on net asset values calculated for shareholder transactions. Generally accepted accounting principles require adjustments to be made to the net assets of the Fund at period end for financial reporting purposes, and as such, the net asset values for shareholder transactions and the returns based on those net asset
values may differ from the net asset values and returns reported in the Financial Highlights. Additionally, the returns and net asset values shown throughout this report are at the Fund level only and do not include variable product issuer charges. If such charges were included, the total returns would be lower.
Invesco V.I. Global Real Estate Fund
Schedule of Investments
December 31, 2015
| | | | | | | | |
| | | Shares | | | Value | |
Real Estate Investment Trusts, Common Stocks & Other Equity Interests–98.65% | |
| Australia–5.05% | | | | | | | | |
DEXUS Property Group | | | 269,414 | | | $ | 1,460,993 | |
Goodman Group | | | 655,189 | | | | 2,966,530 | |
Mirvac Group | | | 1,071,461 | | | | 1,533,351 | |
Scentre Group | | | 1,078,745 | | | | 3,269,434 | |
Stockland | | | 945,791 | | | | 2,808,006 | |
Vicinity Centres | | | 2,638,065 | | | | 5,346,497 | |
Westfield Corp. | | | 531,274 | | | | 3,655,151 | |
| | | | | 21,039,962 | |
|
| Brazil–0.37% | |
BR Malls Participacoes S.A. | | | 147,200 | | | | 410,067 | |
Even Construtora e Incorporadora S.A. | | | 255,800 | | | | 266,082 | |
EZ Tec Empreendimentos e Participacoes S.A. | | | 126,547 | | | | 405,144 | |
Multiplan Empreendimentos Imobiliarios S.A. | | | 49,600 | | | | 473,965 | |
| | | | | 1,555,258 | |
|
| Canada–1.99% | |
Allied Properties REIT | | | 130,800 | | | | 2,983,315 | |
Canadian REIT | | | 67,600 | | | | 2,054,153 | |
First Capital Realty, Inc. | | | 96,701 | | | | 1,281,988 | |
H&R REIT | | | 134,200 | | | | 1,943,944 | |
| | | | | 8,263,400 | |
|
| China–5.08% | |
Beijing Capital Land Ltd.–Class H | | | 278,000 | | | | 126,375 | |
China Jinmao Holdings Group Ltd. | | | 2,318,000 | | | | 787,488 | |
China Overseas Land & Investment Ltd. | | | 1,232,000 | | | | 4,277,528 | |
China Resources Land Ltd. | | | 1,202,444 | | | | 3,468,069 | |
China Vanke Co., Ltd.–Class H | | | 402,000 | | | | 1,187,830 | |
CIFI Holdings (Group) Co. Ltd. | | | 4,314,000 | | | | 956,662 | |
Dalian Wanda Commercial Properties Co. Ltd.–Class H(a) | | | 105,907 | | | | 613,132 | |
Global Logistic Properties Ltd. | | | 810,000 | | | | 1,219,556 | |
Greentown China Holdings Ltd.(b) | | | 762,000 | | | | 750,609 | |
Guangzhou R&F Properties Co. Ltd.–Class H | | | 516,800 | | | | 631,488 | |
KWG Property Holding Ltd. | | | 1,149,500 | | | | 849,171 | |
Longfor Properties Co. Ltd. | | | 1,093,000 | | | | 1,621,280 | |
Shenzhen Investment Ltd. | | | 3,696,000 | | | | 1,717,703 | |
Shimao Property Holdings Ltd. | | | 164,000 | | | | 288,494 | |
Shui On Land Ltd. | | | 5,368,500 | | | | 1,468,688 | |
Sino-Ocean Land Holdings Ltd. | | | 1,907,500 | | | | 1,212,241 | |
| | | | | 21,176,314 | |
|
| France–3.23% | |
ICADE | | | 39,455 | | | | 2,648,833 | |
Klepierre | | | 36,250 | | | | 1,607,551 | |
Mercialys S.A. | | | 66,829 | | | | 1,353,393 | |
Unibail-Rodamco S.E. | | | 30,864 | | | | 7,825,691 | |
| | | | | 13,435,468 | |
| | | | | | | | |
| | | Shares | | | Value | |
| Germany–3.02% | |
Deutsche Wohnen AG | | | 97,436 | | | $ | 2,712,336 | |
LEG Immobilien AG | | | 65,093 | | | | 5,340,856 | |
Vonovia SE | | | 146,664 | | | | 4,542,875 | |
| | | | | 12,596,067 | |
|
| Hong Kong–6.92% | |
Cheung Kong Property Holdings Ltd. | | | 652,500 | | | | 4,209,345 | |
Henderson Land Development Co. Ltd. | | | 141,000 | | | | 858,322 | |
Hongkong Land Holdings Ltd. | | | 550,900 | | | | 3,841,750 | |
Link REIT | | | 602,500 | | | | 3,594,377 | |
New World China Land Ltd. | | | 446,000 | | | | 357,371 | |
New World Development Co. Ltd. | | | 2,504,000 | | | | 2,456,971 | |
Sun Hung Kai Properties Ltd. | | | 650,000 | | | | 7,801,150 | |
Swire Properties Ltd. | | | 1,438,800 | | | | 4,135,446 | |
Wharf Holdings Ltd. (The) | | | 286,000 | | | | 1,578,622 | |
| | | | | 28,833,354 | |
|
| India–0.11% | |
Ascendas India Trust | | | 762,800 | | | | 468,025 | |
|
| Indonesia–0.49% | |
PT Bumi Serpong Damai Tbk | | | 5,171,700 | | | | 663,608 | |
PT Lippo Karawaci Tbk | | | 4,123,900 | | | | 308,190 | |
PT Pakuwon Jati Tbk | | | 19,626,100 | | | | 697,325 | |
PT Summarecon Agung Tbk | | | 3,297,200 | | | | 390,209 | |
| | | | | 2,059,332 | |
|
| Ireland–0.36% | |
Green REIT PLC | | | 859,866 | | | | 1,488,594 | |
|
| Japan–9.88% | |
Activia Properties, Inc. | | | 495 | | | | 2,101,683 | |
Advance Residence Investment Corp. | | | 172 | | | | 378,588 | |
Daiwa House REIT Investment Corp. | | | 41 | | | | 160,080 | |
GLP J-REIT(a) | | | 213 | | | | 206,067 | |
GLP J-REIT | | | 790 | | | | 764,288 | |
Hulic Reit, Inc. | | | 232 | | | | 323,808 | |
Japan Hotel REIT Investment Corp. | | | 3,940 | | | | 2,912,232 | |
Japan Logistics Fund Inc. | | | 208 | | | | 403,276 | |
Japan Real Estate Investment Corp. | | | 1,055 | | | | 5,130,907 | |
Japan Retail Fund Investment Corp. | | | 1,095 | | | | 2,102,744 | |
Kenedix Retail REIT Corp. | | | 473 | | | | 1,001,735 | |
Mitsubishi Estate Co. Ltd. | | | 523,000 | | | | 10,840,191 | |
Mitsui Fudosan Co., Ltd. | | | 390,000 | | | | 9,772,414 | |
Nippon Prologis REIT Inc. | | | 441 | | | | 796,921 | |
Nomura Real Estate Master Fund, Inc. | | | 1,235 | | | | 1,535,080 | |
Tokyu Fudosan Holdings, Corp. | | | 272,700 | | | | 1,706,366 | |
United Urban Investment Corp. | | | 773 | | | | 1,048,471 | |
| | | | | 41,184,851 | |
|
| Malaysia–0.36% | |
IGB REIT | | | 1,957,500 | | | | 610,828 | |
See accompanying Notes to Financial Statements which are an integral part of the financial statements.
Invesco V.I. Global Real Estate Fund
| | | | | | | | |
| | | Shares | | | Value | |
Malaysia–(continued) | | | | | | | | |
IOI Properties Group Berhad | | | 875,300 | | | $ | 458,619 | |
KLCCP Stapled Group | | | 121,500 | | | | 199,475 | |
SP Setia Berhad Group | | | 317,600 | | | | 236,670 | |
| | | | | 1,505,592 | |
|
| Malta–0.00% | |
BGP Holdings PLC
(Acquired 08/06/09; Cost $0)(a)(b) | | | 3,053,090 | | | | 0 | |
|
| Mexico–0.77% | |
Fibra Uno Administracion S.A. de C.V. | | | 1,104,000 | | | | 2,432,982 | |
Macquarie Mexico Real Estate Management S.A. de C.V. | | | 600,200 | | | | 765,635 | |
| | | | | 3,198,617 | |
|
| Netherlands–0.82% | |
Wereldhave N.V. | | | 61,042 | | | | 3,422,883 | |
|
| Philippines–0.76% | |
Ayala Land, Inc. | | | 1,381,900 | | | | 1,012,196 | |
Megaworld Corp. | | | 7,163,100 | | | | 647,310 | |
Robinsons Land Corp. | | | 726,100 | | | | 425,706 | |
SM Prime Holdings Inc. | | | 2,326,900 | | | | 1,076,511 | |
| | | | | 3,161,723 | |
|
| Singapore–1.64% | |
Ascendas REIT | | | 1,246,700 | | | | 1,996,581 | |
Ascendas REIT–Rts.(b) | | | 46,751 | | | | 2,044 | |
CapitaLand Ltd. | | | 1,140,100 | | | | 2,675,692 | |
CapitaLand Retail China Trust | | | 397,000 | | | | 416,469 | |
Mapletree Industrial Trust | | | 1,619,400 | | | | 1,735,948 | |
| | | | | 6,826,734 | |
|
| South Africa–0.85% | |
Growthpoint Properties Ltd. | | | 1,233,004 | | | | 1,852,187 | |
Hyprop Investments Ltd. | | | 122,659 | | | | 819,749 | |
Resilient REIT Ltd. | | | 119,154 | | | | 887,372 | |
| | | | | 3,559,308 | |
|
| Spain–0.74% | |
Inmobiliaria Colonial S.A.(b) | | | 2,246,890 | | | | 1,560,650 | |
Merlin Properties Socimi, S.A. | | | 122,793 | | | | 1,532,385 | |
| | | | | 3,093,035 | |
|
| Sweden–1.41% | |
Castellum AB | | | 95,566 | | | | 1,354,034 | |
Fabege AB | | | 131,440 | | | | 2,160,696 | |
Wihlborgs Fastigheter AB | | | 116,723 | | | | 2,354,459 | |
| | | | | 5,869,189 | |
|
| Thailand–0.33% | |
Central Pattana PCL | | | 429,100 | | | | 555,593 | |
L.P.N. Development PCL | | | 337,700 | | | | 149,391 | |
Land and Houses PCL | | | 1,195,500 | | | | 305,178 | |
Pruksa Real Estate PCL | | | 514,100 | | | | 376,322 | |
| | | | | 1,386,484 | |
| | | | | | | | |
| | | Shares | | | Value | |
| United Arab Emirates–0.60% | |
Emaar Malls Group PJSC(b) | | | 1,077,988 | | | $ | 807,212 | |
Emaar Properties PJSC | | | 1,104,262 | | | | 1,701,734 | |
| | | | | 2,508,946 | |
|
| United Kingdom–5.72% | |
Big Yellow Group PLC | | | 76,232 | | | | 905,762 | |
Derwent London PLC | | | 59,485 | | | | 3,213,446 | |
Great Portland Estates PLC | | | 436,160 | | | | 5,316,469 | |
Kennedy Wilson Europe Real Estate PLC | | | 106,574 | | | | 1,893,343 | |
Land Securities Group PLC | | | 595,182 | | | | 10,318,352 | |
UNITE Group PLC (The) | | | 226,379 | | | | 2,185,661 | |
| | | | | 23,833,033 | |
|
| United States–48.15% | |
American Campus Communities, Inc. | | | 115,334 | | | | 4,767,908 | |
American Homes 4 Rent–Class A | | | 129,675 | | | | 2,160,386 | |
AvalonBay Communities, Inc. | | | 94,651 | | | | 17,428,089 | |
Boston Properties, Inc. | | | 69,664 | | | | 8,884,947 | |
Brandywine Realty Trust | | | 118,679 | | | | 1,621,155 | |
Brixmor Property Group, Inc. | | | 277,684 | | | | 7,169,801 | |
Brookdale Senior Living Inc.(b) | | | 144,808 | | | | 2,673,156 | |
Camden Property Trust | | | 27,408 | | | | 2,103,838 | |
Care Capital Properties, Inc. | | | 110,487 | | | | 3,377,588 | |
Cousins Properties, Inc. | | | 422,945 | | | | 3,988,371 | |
CyrusOne Inc. | | | 116,589 | | | | 4,366,258 | |
DiamondRock Hospitality Co. | | | 321,669 | | | | 3,104,106 | |
Empire State Realty Trust Inc.–Class A | | | 230,677 | | | | 4,168,333 | |
Equinix, Inc. | | | 12,095 | | | | 3,657,528 | |
Equity Lifestyle Properties, Inc. | | | 24,492 | | | | 1,632,882 | |
Essex Property Trust, Inc. | | | 10,156 | | | | 2,431,448 | |
Extra Space Storage Inc. | | | 79,245 | | | | 6,990,201 | |
Federal Realty Investment Trust | | | 37,493 | | | | 5,477,727 | |
First Industrial Realty Trust, Inc. | | | 138,120 | | | | 3,056,596 | |
General Growth Properties, Inc. | | | 214,300 | | | | 5,831,103 | |
HCP, Inc. | | | 291,862 | | | | 11,160,803 | |
Healthcare Realty Trust, Inc. | | | 213,992 | | | | 6,060,253 | |
Healthcare Trust of America, Inc.–Class A | | | 138,860 | | | | 3,745,054 | |
Hilton Worldwide Holdings Inc. | | | 224,610 | | | | 4,806,654 | |
Hudson Pacific Properties Inc. | | | 160,957 | | | | 4,529,330 | |
InfraREIT Inc. | | | 79,400 | | | | 1,468,900 | |
Kilroy Realty Corp. | | | 40,143 | | | | 2,540,249 | |
LaSalle Hotel Properties | | | 51,470 | | | | 1,294,985 | |
Mid-America Apartment Communities, Inc. | | | 54,861 | | | | 4,981,927 | |
Prologis, Inc. | | | 172,396 | | | | 7,399,236 | |
Public Storage | | | 29,155 | | | | 7,221,694 | |
QTS Realty Trust, Inc.–Class A | | | 47,448 | | | | 2,140,379 | |
Realty Income Corp. | | | 90,241 | | | | 4,659,143 | |
Retail Opportunity Investments Corp. | | | 220,663 | | | | 3,949,868 | |
Rexford Industrial Realty, Inc. | | | 129,294 | | | | 2,115,250 | |
RLJ Lodging Trust | | | 28,428 | | | | 614,898 | |
Simon Property Group, Inc. | | | 97,851 | | | | 19,026,148 | |
Sunstone Hotel Investors, Inc. | | | 148,000 | | | | 1,848,520 | |
See accompanying Notes to Financial Statements which are an integral part of the financial statements.
Invesco V.I. Global Real Estate Fund
| | | | | | | | |
| | | Shares | | | Value | |
| United States–(continued) | |
Terreno Realty Corp. | | | 10,610 | | | $ | 239,998 | |
Vornado Realty Trust | | | 71,600 | | | | 7,157,136 | |
Washington REIT | | | 119,100 | | | | 3,222,846 | |
Weingarten Realty Investors | | | 162,899 | | | | 5,633,047 | |
| | | | | | | | 200,707,739 | |
Total Real Estate Investment Trusts, Common Stocks & Other Equity Interests
(Cost $372,352,750) | | | | 411,173,908 | |
|
Money Market Funds–0.81% | |
Liquid Assets Portfolio–Institutional Class, 0.29%(c) | | | 1,675,884 | | | | 1,675,884 | |
Premier Portfolio–Institutional Class, 0.24%(c) | | | 1,675,884 | | | | 1,675,884 | |
Total Money Market Funds
(Cost $3,351,768) | | | | | | | 3,351,768 | |
TOTAL INVESTMENTS–99.46%
(Cost $375,704,518) | | | | | | | 414,525,676 | |
OTHER ASSETS LESS LIABILITIES–0.54% | | | | | | | 2,270,547 | |
NET ASSETS–100.00% | | | | | | $ | 416,796,223 | |
Investment Abbreviations:
| | |
| REIT | | – Real Estate Investment Trust |
| Rts. | | – Rights |
Notes to Schedule of Investments:
| (a) | Security purchased or received in a transaction exempt from registration under the Securities Act of 1933, as amended (the “1933 Act”). The security may be resold pursuant to an exemption from registration under the 1933 Act, typically to qualified institutional buyers. The aggregate value of these securities at December 31, 2015 was $819,199, which represented less than 1% of the Fund’s Net Assets. |
| (b) | Non-income producing security. |
| (c) | The money market fund and the Fund are affiliated by having the same investment adviser. The rate shown is the 7-day SEC standardized yield as of December 31, 2015. |
See accompanying Notes to Financial Statements which are an integral part of the financial statements.
Invesco V.I. Global Real Estate Fund
Statement of Assets and Liabilities
December 31, 2015
Statement of Operations
For the year ended December 31, 2015
| | | | |
Assets: | | | | |
Investments, at value (Cost $372,352,750) | | $ | 411,173,908 | |
Investments in affiliated money market funds, at value and cost | | | 3,351,768 | |
Total investments, at value (Cost $375,704,518) | | | 414,525,676 | |
Foreign currencies, at value (Cost $1,289,938) | | | 1,286,595 | |
Receivable for: | | | | |
Investments sold | | | 2,698,225 | |
Fund shares sold | | | 89,167 | |
Dividends | | | 1,590,240 | |
Investment for trustee deferred compensation and retirement plans | | | 58,863 | |
Other assets | | | 901 | |
Total assets | | | 420,249,667 | |
| |
Liabilities: | | | | |
Payable for: | | | | |
Investments purchased | | | 2,677,754 | |
Fund shares reacquired | | | 249,935 | |
Accrued fees to affiliates | | | 395,868 | |
Accrued trustees’ and officers’ fees and benefits | | | 163 | |
Accrued other operating expenses | | | 61,798 | |
Trustee deferred compensation and retirement plans | | | 67,926 | |
Total liabilities | | | 3,453,444 | |
Net assets applicable to shares outstanding | | $ | 416,796,223 | |
| |
Net assets consist of: | | | | |
Shares of beneficial interest | | $ | 375,618,799 | |
Undistributed net investment income | | | (1,060,884 | ) |
Undistributed net realized gain | | | 3,426,950 | |
Net unrealized appreciation | | | 38,811,358 | |
| | | $ | 416,796,223 | |
| |
Net Assets: | | | | |
Series I | | $ | 208,795,864 | |
Series II | | $ | 208,000,359 | |
|
Shares outstanding, $0.001 par value per share,
with an unlimited number of shares authorized: | |
Series I | | | 12,765,273 | |
Series II | | | 13,074,397 | |
Series I: | | | | |
Net asset value per share | | $ | 16.36 | |
Series II: | | | | |
Net asset value per share | | $ | 15.91 | |
| | | | |
Investment income: | | | | |
Dividends (net of foreign withholding taxes of $582,030) | | $ | 12,361,682 | |
Dividends from affiliated money market funds | | | 5,164 | |
Total investment income | | | 12,366,846 | |
| |
Expenses: | | | | |
Advisory fees | | | 3,188,088 | |
Administrative services fees | | | 1,160,410 | |
Custodian fees | | | 245,096 | |
Distribution fees — Series II | | | 530,168 | |
Transfer agent fees | | | 42,813 | |
Trustees’ and officers’ fees and benefits | | | 26,489 | |
Other | | | 79,049 | |
Total expenses | | | 5,272,113 | |
Less: Fees waived | | | (9,029 | ) |
Net expenses | | | 5,263,084 | |
Net investment income | | | 7,103,762 | |
| |
Realized and unrealized gain (loss) from: | | | | |
Net realized gain (loss) from: | | | | |
Investment securities | | | 22,006,812 | |
Foreign currencies | | | (175,428 | ) |
| | | | 21,831,384 | |
Change in net unrealized appreciation (depreciation) of: | | | | |
Investment securities | | | (36,965,340 | ) |
Foreign currencies | | | 23,726 | |
| | | | (36,941,614 | ) |
Net realized and unrealized gain (loss) | | | (15,110,230 | ) |
Net increase (decrease) in net assets resulting from operations | | $ | (8,006,468 | ) |
See accompanying Notes to Financial Statements which are an integral part of the financial statements.
Invesco V.I. Global Real Estate Fund
Statement of Changes in Net Assets
For the years ended December 31, 2015 and 2014
| | | | | | | | |
| | | 2015 | | | 2014 | |
Operations: | | | | | | | | |
Net investment income | | $ | 7,103,762 | | | $ | 7,143,594 | |
Net realized gain | | | 21,831,384 | | | | 11,244,543 | |
Change in net unrealized appreciation (depreciation) | | | (36,941,614 | ) | | | 31,597,399 | |
Net increase (decrease) in net assets resulting from operations | | | (8,006,468 | ) | | | 49,985,536 | |
| | |
Distributions to shareholders from net investment income: | | | | | | | | |
Series I | | | (7,476,164 | ) | | | (3,251,796 | ) |
Series ll | | | (7,026,530 | ) | | | (2,549,836 | ) |
Total distributions from net investment income | | | (14,502,694 | ) | | | (5,801,632 | ) |
| | |
Share transactions–net: | | | | | | | | |
Series l | | | 9,891,161 | | | | (3,501,175 | ) |
Series ll | | | 19,285,906 | | | | 9,465,501 | |
Net increase in net assets resulting from share transactions | | | 29,177,067 | | | | 5,964,326 | |
Net increase in net assets | | | 6,667,905 | | | | 50,148,230 | |
| | |
Net assets: | | | | | | | | |
Beginning of year | | | 410,128,318 | | | | 359,980,088 | |
End of year (includes undistributed net investment income of $(1,060,884) and $3,345,301, respectively) | | $ | 416,796,223 | | | $ | 410,128,318 | |
Notes to Financial Statements
December 31, 2015
NOTE 1—Significant Accounting Policies
Invesco V.I. Global Real Estate Fund (the “Fund”) is a series portfolio of AIM Variable Insurance Funds (Invesco Variable Insurance Funds) (the “Trust”). The Trust is a Delaware statutory trust registered under the Investment Company Act of 1940, as amended (the “1940 Act”), as an open-end series management investment company consisting of twenty-four separate portfolios, (each constituting a “Fund”). The assets, liabilities and operations of each portfolio are accounted for separately. Information presented in these financial statements pertains only to the Fund. Matters affecting each Fund or class will be voted on exclusively by the shareholders of such Fund or class. Current Securities and Exchange Commission (“SEC”) guidance, however, requires participating insurance companies offering separate accounts to vote shares proportionally in accordance with the instructions of the contract owners whose investments are funded by shares of each Fund or class.
The Fund’s investment objective is total return through growth of capital and current income.
The Fund currently offers two classes of shares, Series I and Series II, both of which are offered to insurance company separate accounts funding variable annuity contracts and variable life insurance policies (“variable products”).
The following is a summary of the significant accounting policies followed by the Fund in the preparation of its financial statements.
| A. | Security Valuations — Securities, including restricted securities, are valued according to the following policy. |
A security listed or traded on an exchange (except convertible securities) is valued at its last sales price or official closing price as of the close of the customary trading session on the exchange where the security is principally traded, or lacking any sales or official closing price on a particular day, the security may be valued at the closing bid price on that day. Securities traded in the over-the-counter market are valued based on prices furnished by independent pricing services or market makers. When such securities are valued by an independent pricing service they may be considered fair valued. Futures contracts are valued at the final settlement price set by an exchange on which they are principally traded. Listed options are valued at the mean between the last bid and asked prices from the exchange on which they are principally traded. Options not listed on an exchange are valued by an independent source at the mean between the last bid and asked prices. For purposes of determining net asset value (“NAV”) per share, futures and option contracts generally are valued 15 minutes after the close of the customary trading session of the New York Stock Exchange (“NYSE”).
Investments in open-end and closed-end registered investment companies that do not trade on an exchange are valued at the end-of-day net asset value per share. Investments in open-end and closed-end registered investment companies that trade on an exchange are valued at the last sales price or official closing price as of the close of the customary trading session on the exchange where the security is principally traded.
Debt obligations (including convertible securities) and unlisted equities are fair valued using an evaluated quote provided by an independent pricing service. Evaluated quotes provided by the pricing service may be determined without exclusive reliance on quoted prices, and may reflect appropriate factors such as institution-size trading in similar groups of securities, developments related to specific securities, dividend rate (for unlisted equities), yield (for debt obligations), quality, type of issue, coupon rate (for debt obligations), maturity (for debt obligations), individual trading characteristics and other market data. Debt obligations are subject to interest rate and credit risks. In addition, all debt obligations involve some risk of default with respect to interest and/or principal payments.
Invesco V.I. Global Real Estate Fund
Foreign securities’ (including foreign exchange contracts) prices are converted into U.S. dollar amounts using the applicable exchange rates as of the close of the NYSE. If market quotations are available and reliable for foreign exchange-traded equity securities, the securities will be valued at the market quotations. Because trading hours for certain foreign securities end before the close of the NYSE, closing market quotations may become unreliable. If between the time trading ends on a particular security and the close of the customary trading session on the NYSE, events occur that the Adviser determines are significant and make the closing price unreliable, the Fund may fair value the security. If the event is likely to have affected the closing price of the security, the security will be valued at fair value in good faith using procedures approved by the Board of Trustees. Adjustments to closing prices to reflect fair value may also be based on a screening process of an independent pricing service to indicate the degree of certainty, based on historical data, that the closing price in the principal market where a foreign security trades is not the current value as of the close of the NYSE. Foreign securities’ prices meeting the approved degree of certainty that the price is not reflective of current value will be priced at the indication of fair value from the independent pricing service. Multiple factors may be considered by the independent pricing service in determining adjustments to reflect fair value and may include information relating to sector indices, American Depositary Receipts and domestic and foreign index futures. Foreign securities may have additional risks including exchange rate changes, potential for sharply devalued currencies and high inflation, political and economic upheaval, the relative lack of issuer information, relatively low market liquidity and the potential lack of strict financial and accounting controls and standards.
Securities for which market prices are not provided by any of the above methods may be valued based upon quotes furnished by independent sources. The last bid price may be used to value equity securities. The mean between the last bid and asked prices is used to value debt obligations, including corporate loans.
Securities for which market quotations are not readily available or became unreliable are valued at fair value as determined in good faith by or under the supervision of the Trust’s officers following procedures approved by the Board of Trustees. Issuer specific events, market trends, bid/asked quotes of brokers and information providers and other market data may be reviewed in the course of making a good faith determination of a security’s fair value.
The Fund may invest in securities that are subject to interest rate risk, meaning the risk that the prices will generally fall as interest rates rise and, conversely, the prices will generally rise as interest rates fall. Specific securities differ in their sensitivity to changes in interest rates depending on their individual characteristics. Changes in interest rates may result in increased market volatility, which may affect the value and/or liquidity of certain Fund investments.
Valuations change in response to many factors including the historical and prospective earnings of the issuer, the value of the issuer’s assets, general economic conditions, interest rates, investor perceptions and market liquidity. Because of the inherent uncertainties of valuation, the values reflected in the financial statements may materially differ from the value received upon actual sale of those investments.
| B. | Securities Transactions and Investment Income — Securities transactions are accounted for on a trade date basis. Realized gains or losses on sales are computed on the basis of specific identification of the securities sold. Interest income (net of withholding tax, if any) is recorded on the accrual basis from settlement date. Dividend income (net of withholding tax, if any) is recorded on the ex-dividend date. |
The Fund may periodically participate in litigation related to Fund investments. As such, the Fund may receive proceeds from litigation settlements. Any proceeds received are included in the Statement of Operations as realized gain (loss) for investments no longer held and as unrealized gain (loss) for investments still held.
Brokerage commissions and mark ups are considered transaction costs and are recorded as an increase to the cost basis of securities purchased and/or a reduction of proceeds on a sale of securities. Such transaction costs are included in the determination of net realized and unrealized gain (loss) from investment securities reported in the Statement of Operations and the Statement of Changes in Net Assets and the net realized and unrealized gains (losses) on securities per share in the Financial Highlights. Transaction costs are included in the calculation of the Fund’s net asset value and, accordingly, they reduce the Fund’s total returns. These transaction costs are not considered operating expenses and are not reflected in net investment income reported in the Statement of Operations and the Statement of Changes in Net Assets, or the net investment income per share and the ratios of expenses and net investment income reported in the Financial Highlights, nor are they limited by any expense limitation arrangements between the Fund and the investment adviser.
The Fund allocates income and realized and unrealized capital gains and losses to a class based on the relative net assets of each class.
The Fund recharacterizes distributions received from REIT investments based on information provided by the REIT into the following categories: ordinary income, long-term and short-term capital gains, and return of capital. If information is not available on a timely basis from the REIT, the recharacterization will be based on available information which may include the previous year’s allocation. If new or additional information becomes available from the REIT at a later date, a recharacterization will be made in the following year. The Fund records as dividend income the amount recharacterized as ordinary income and as realized gain the amount recharacterized as capital gain in the Statement of Operations, and the amount recharacterized as return of capital as a reduction to the cost of investments in the Statement of Assets and Liabilities. These recharacterizations are reflected in the accompanying financial statements.
| C. | Country Determination — For the purposes of making investment selection decisions and presentation in the Schedule of Investments, the investment adviser may determine the country in which an issuer is located and/or credit risk exposure based on various factors. These factors include the laws of the country under which the issuer is organized, where the issuer maintains a principal office, the country in which the issuer derives 50% or more of its total revenues and the country that has the primary market for the issuer’s securities, as well as other criteria. Among the other criteria that may be evaluated for making this determination are the country in which the issuer maintains 50% or more of its assets, the type of security, financial guarantees and enhancements, the nature of the collateral and the sponsor organization. Country of issuer and/or credit risk exposure has been determined to be the United States of America, unless otherwise noted. |
| D. | Distributions — Distributions from net investment income and net realized capital gain, if any, are generally declared and paid to separate accounts of participating insurance companies annually and recorded on the ex-dividend date. |
| E. | Federal Income Taxes — The Fund intends to comply with the requirements of Subchapter M of the Internal Revenue Code of 1986, as amended (the “Internal Revenue Code”), necessary to qualify as a regulated investment company and to distribute substantially all of the Fund’s taxable earnings to shareholders. As such, the Fund will not be subject to federal income taxes on otherwise taxable income (including net realized capital gain) that is distributed to shareholders. Therefore, no provision for federal income taxes is recorded in the financial statements. |
Invesco V.I. Global Real Estate Fund
The Fund recognizes the tax benefits of uncertain tax positions only when the position is more likely than not to be sustained. Management has analyzed the Fund’s uncertain tax positions and concluded that no liability for unrecognized tax benefits should be recorded related to uncertain tax positions. Management is not aware of any tax positions for which it is reasonably possible that the total amounts of unrecognized tax benefits will change materially in the next 12 months.
The Fund files tax returns in the U.S. Federal jurisdiction and certain other jurisdictions. Generally, the Fund is subject to examinations by such taxing authorities for up to three years after the filing of the return for the tax period.
| F. | Expenses — Fees provided for under the Rule 12b-1 plan of a particular class of the Fund and which are directly attributable to that class are charged to the operations of such class. All other expenses are allocated among the classes based on relative net assets. |
| G. | Accounting Estimates — The preparation of financial statements in conformity with accounting principles generally accepted in the United States of America (“GAAP”) requires management to make estimates and assumptions that affect the reported amounts of assets and liabilities at the date of the financial statements and the reported amounts of revenues and expenses during the reporting period including estimates and assumptions related to taxation. Actual results could differ from those estimates by a significant amount. In addition, the Fund monitors for material events or transactions that may occur or become known after the period-end date and before the date the financial statements are released to print. |
| H. | Indemnifications — Under the Trust’s organizational documents, each Trustee, officer, employee or other agent of the Trust is indemnified against certain liabilities that may arise out of the performance of their duties to the Fund. Additionally, in the normal course of business, the Fund enters into contracts, including the Fund’s servicing agreements, that contain a variety of indemnification clauses. The Fund’s maximum exposure under these arrangements is unknown as this would involve future claims that may be made against the Fund that have not yet occurred. The risk of material loss as a result of such indemnification claims is considered remote. |
| I. | Foreign Currency Translations — Foreign currency is valued at the close of the NYSE based on quotations posted by banks and major currency dealers. Portfolio securities and other assets and liabilities denominated in foreign currencies are translated into U.S. dollar amounts at date of valuation. Purchases and sales of portfolio securities (net of foreign taxes withheld on disposition) and income items denominated in foreign currencies are translated into U.S. dollar amounts on the respective dates of such transactions. The Fund does not separately account for the portion of the results of operations resulting from changes in foreign exchange rates on investments and the fluctuations arising from changes in market prices of securities held. The combined results of changes in foreign exchange rates and the fluctuation of market prices on investments (net of estimated foreign tax withholding) are included with the net realized and unrealized gain or loss from investments in the Statement of Operations. Reported net realized foreign currency gains or losses arise from (1) sales of foreign currencies, (2) currency gains or losses realized between the trade and settlement dates on securities transactions, and (3) the difference between the amounts of dividends, interest, and foreign withholding taxes recorded on the Fund’s books and the U.S. dollar equivalent of the amounts actually received or paid. Net unrealized foreign currency gains and losses arise from changes in the fair values of assets and liabilities, other than investments in securities at fiscal period end, resulting from changes in exchange rates. |
The Fund may invest in foreign securities, which may be subject to foreign taxes on income, gains on investments or currency repatriation, a portion of which may be recoverable. Foreign taxes, if any, are recorded based on the tax regulations and rates that exist in the foreign markets in which the Fund invests and are shown in the Statement of Operations.
| J. | Forward Foreign Currency Contracts — The Fund may engage in foreign currency transactions either on a spot (i.e. for prompt delivery and settlement) basis, or through forward foreign currency contracts, to manage or minimize currency or exchange rate risk. |
The Fund may also enter into forward foreign currency contracts for the purchase or sale of a security denominated in a foreign currency in order to “lock in” the U.S. dollar price of that security, or the Fund may also enter into forward foreign currency contracts that do not provide for physical settlement of the two currencies, but instead are settled by a single cash payment calculated as the difference between the agreed upon exchange rate and the spot rate at settlement based upon an agreed upon notional amount (non-deliverable forwards). The Fund will set aside liquid assets in an amount equal to daily mark-to-market obligation for forward foreign currency contracts.
A forward foreign currency contract is an obligation between two parties (“Counterparties”) to purchase or sell a specific currency for an agreed-upon price at a future date. The use of forward foreign currency contracts does not eliminate fluctuations in the price of the underlying securities the Fund owns or intends to acquire but establishes a rate of exchange in advance. Fluctuations in the value of these contracts are measured by the difference in the contract date and reporting date exchange rates and are recorded as unrealized appreciation (depreciation) until the contracts are closed. When the contracts are closed, realized gains (losses) are recorded. Realized and unrealized gains (losses) on the contracts are included in the Statement of Operations. The primary risks associated with forward foreign currency contracts include failure of the Counterparty to meet the terms of the contract and the value of the foreign currency changing unfavorably. These risks may be in excess of the amounts reflected in the Statement of Assets and Liabilities.
| K. | Other Risks — The Fund’s investments are concentrated in a comparatively narrow segment of the economy. Consequently, the Fund may tend to be more volatile than other mutual funds, and the value of the Fund’s investments may tend to rise and fall more rapidly. |
Because the Fund concentrates its assets in the real estate industry, an investment in the Fund will be closely linked to the performance of the real estate markets. Property values may fall due to increasing vacancies or declining rents resulting from economic, legal, cultural or technological developments.
Invesco V.I. Global Real Estate Fund
NOTE 2—Advisory Fees and Other Fees Paid to Affiliates
The Trust has entered into a master investment advisory agreement with Invesco Advisers, Inc. (the “Adviser” or “Invesco”). Under the terms of the investment advisory agreement, the Fund pays an advisory fee to the Adviser based on the annual rate of the Fund’s average daily net assets as follows:
| | | | |
| Average Daily Net Assets | | Rate | |
First $250 million | | | 0.75% | |
Next $250 million | | | 0.74% | |
Next $500 million | | | 0.73% | |
Next $1.5 billion | | | 0.72% | |
Next $2.5 billion | | | 0.71% | |
Next $2.5 billion | | | 0.70% | |
Next $2.5 billion | | | 0.69% | |
Over $10 billion | | | 0.68% | |
For the year ended December 31, 2015, the effective advisory fees incurred by the Fund was 0.75%.
Under the terms of a master sub-advisory agreement between the Adviser and each of Invesco Asset Management Deutschland GmbH, Invesco Asset Management Limited, Invesco Asset Management (Japan) Limited, Invesco Hong Kong Limited, Invesco Senior Secured Management, Inc. and Invesco Canada Ltd. (collectively, the “Affiliated Sub-Advisers”) the Adviser, not the Fund, may pay 40% of the fees paid to the Adviser to any such Affiliated Sub-Adviser(s) that provide(s) discretionary investment management services to the Fund based on the percentage of assets allocated to such Affiliated Sub-Adviser(s).
The Adviser has contractually agreed, through at least June 30, 2016, to waive advisory fees and/or reimburse expenses of all shares to the extent necessary to limit total annual fund operating expenses after fee waiver and/or expense reimbursement (excluding certain items discussed below) of Series I shares to 2.00% and Series II shares to 2.25% of average daily net assets. In determining the Adviser’s obligation to waive advisory fees and/or reimburse expenses, the following expenses are not taken into account, and could cause the total annual fund operating expenses after fee waiver and/or expense reimbursement to exceed the numbers reflected above: (1) interest; (2) taxes; (3) dividend expense on short sales; (4) extraordinary or non-routine items, including litigation expenses; and (5) expenses that the Fund has incurred but did not actually pay because of an expense offset arrangement. Unless Invesco continues the fee waiver agreement, it will terminate on June 30, 2016. The fee waiver agreement cannot be terminated during its term. The Adviser did not waive fees and/or reimburse expenses during the period under this expense limitation.
Further, the Adviser has contractually agreed, through at least June 30, 2017, to waive the advisory fee payable by the Fund in an amount equal to 100% of the net advisory fees the Adviser receives from the affiliated money market funds on investments by the Fund of uninvested cash in such affiliated money market funds.
For the year ended December 31, 2015, the Adviser waived advisory fees of $9,029.
The Trust has entered into a master administrative services agreement with Invesco pursuant to which the Fund has agreed to pay Invesco a fee for costs incurred in providing accounting services and fund administrative services to the Fund and to reimburse Invesco for administrative services fees paid to insurance companies that have agreed to provide services to the participants of separate accounts. These administrative services provided by the insurance companies may include, among other things: the printing of prospectuses, financial reports and proxy statements and the delivery of the same to existing participants; the maintenance of master accounts; the facilitation of purchases and redemptions requested by the participants; and the servicing of participants’ accounts. Pursuant to such agreement, for the year ended December 31, 2015, Invesco was paid $103,312 for accounting and fund administrative services and reimbursed $1,057,098 for services provided by insurance companies.
The Trust has entered into a transfer agency and service agreement with Invesco Investment Services, Inc. (“IIS”) pursuant to which the Fund has agreed to pay IIS a fee for providing transfer agency and shareholder services to the Fund and reimburse IIS for certain expenses incurred by IIS in the course of providing such services. For the year ended December 31, 2015, expenses incurred under the agreement are shown in the Statement of Operations as Transfer agent fees.
The Trust has entered into a master distribution agreement with Invesco Distributors, Inc. (“IDI”) to serve as the distributor for the Fund. The Trust has adopted a plan pursuant to Rule 12b-1 under the 1940 Act with respect to the Fund’s Series II shares (the “Plan”). The Fund, pursuant to the Plan, pays IDI compensation at the annual rate of 0.25% of the Fund’s average daily net assets of Series II shares. Of the Plan payments, up to 0.25% of the average daily net assets of the Series II shares may be paid to insurance companies who furnish continuing personal shareholder services to customers who purchase and own Series II shares of the Fund. For the year ended December 31, 2015, expenses incurred under the Plan are detailed in the Statement of Operations as Distribution fees.
Certain officers and trustees of the Trust are officers and directors of the Adviser, IIS and/or IDI.
NOTE 3—Additional Valuation Information
GAAP defines fair value as the price that would be received to sell an asset or paid to transfer a liability in an orderly transaction between market participants at the measurement date, under current market conditions. GAAP establishes a hierarchy that prioritizes the inputs to valuation methods, giving the highest priority to readily available unadjusted quoted prices in an active market for identical assets (Level 1) and the lowest priority to significant unobservable inputs (Level 3), generally when market prices are not readily available or are unreliable. Based on the valuation inputs, the securities or other investments are tiered into one of three levels. Changes in valuation methods may result in transfers in or out of an investment’s assigned level:
| | Level 1 — | Prices are determined using quoted prices in an active market for identical assets. |
Invesco V.I. Global Real Estate Fund
| | Level 2 — | Prices are determined using other significant observable inputs. Observable inputs are inputs that other market participants may use in pricing a security. These may include quoted prices for similar securities, interest rates, prepayment speeds, credit risk, yield curves, loss severities, default rates, discount rates, volatilities and others. |
| | Level 3 — | Prices are determined using significant unobservable inputs. In situations where quoted prices or observable inputs are unavailable (for example, when there is little or no market activity for an investment at the end of the period), unobservable inputs may be used. Unobservable inputs reflect the Fund’s own assumptions about the factors market participants would use in determining fair value of the securities or instruments and would be based on the best available information. |
The following is a summary of the tiered valuation input levels, as of December 31, 2015. The level assigned to the securities valuations may not be an indication of the risk or liquidity associated with investing in those securities. Because of the inherent uncertainties of valuation, the values reflected in the financial statements may materially differ from the value received upon actual sale of those investments.
During the year ended December 31, 2015, there were transfers from Level 1 to Level 2 of $4,485,114 and from Level 2 to Level 1 of $8,160,332, due to foreign fair value adjustments.
| | | | | | | | | | | | | | | | |
| | | Level 1 | | | Level 2 | | | Level 3 | | | Total | |
Australia | | $ | — | | | $ | 21,039,962 | | | $ | — | | | $ | 21,039,962 | |
Brazil | | | 266,082 | | | | 1,289,176 | | | | — | | | | 1,555,258 | |
Canada | | | 8,263,400 | | | | — | | | | — | | | | 8,263,400 | |
China | | | 1,187,830 | | | | 19,988,484 | | | | — | | | | 21,176,314 | |
France | | | 1,353,393 | | | | 12,082,075 | | | | — | | | | 13,435,468 | |
Germany | | | 8,053,192 | | | | 4,542,875 | | | | — | | | | 12,596,067 | |
Hong Kong | | | 357,371 | | | | 28,475,983 | | | | — | | | | 28,833,354 | |
India | | | 468,025 | | | | — | | | | — | | | | 468,025 | |
Indonesia | | | — | | | | 2,059,332 | | | | — | | | | 2,059,332 | |
Ireland | | | 1,488,594 | | | | — | | | | — | | | | 1,488,594 | |
Japan | | | 1,535,080 | | | | 39,649,771 | | | | — | | | | 41,184,851 | |
Malaysia | | | 1,306,117 | | | | 199,475 | | | | — | | | | 1,505,592 | |
Malta | | | — | | | | — | | | | 0 | | | | 0 | |
Mexico | | | 3,198,617 | | | | — | | | | — | | | | 3,198,617 | |
Netherlands | | | — | | | | 3,422,883 | | | | — | | | | 3,422,883 | |
Philippines | | | 1,502,217 | | | | 1,659,506 | | | | — | | | | 3,161,723 | |
Singapore | | | 1,737,992 | | | | 5,088,742 | | | | — | | | | 6,826,734 | |
South Africa | | | 2,671,936 | | | | 887,372 | | | | — | | | | 3,559,308 | |
Spain | | | — | | | | 3,093,035 | | | | — | | | | 3,093,035 | |
Sweden | | | — | | | | 5,869,189 | | | | — | | | | 5,869,189 | |
Thailand | | | 305,178 | | | | 1,081,306 | | | | — | | | | 1,386,484 | |
United Arab Emirates | | | — | | | | 2,508,946 | | | | — | | | | 2,508,946 | |
United Kingdom | | | 905,762 | | | | 22,927,271 | | | | — | | | | 23,833,033 | |
United States | | | 204,059,507 | | | | — | | | | — | | | | 204,059,507 | |
Total Investments | | $ | 238,660,293 | | | $ | 175,865,383 | | | $ | — | | | $ | 414,525,676 | |
NOTE 4—Trustees’ and Officers’ Fees and Benefits
Trustees’ and Officers’ Fees and Benefits include amounts accrued by the Fund to pay remuneration to certain Trustees and Officers of the Fund. Trustees have the option to defer compensation payable by the Fund, and Trustees’ and Officers’ Fees and Benefits also include amounts accrued by the Fund to fund such deferred compensation amounts. Those Trustees who defer compensation have the option to select various Invesco Funds in which their deferral accounts shall be deemed to be invested. Finally, certain current Trustees were eligible to participate in a retirement plan that provided for benefits to be paid upon retirement to Trustees over a period of time based on the number of years of service. The Fund may have certain former Trustees who also participate in a retirement plan and receive benefits under such plan. Trustees’ and Officers’ Fees and Benefits include amounts accrued by the Fund to fund such retirement benefits. Obligations under the deferred compensation and retirement plans represent unsecured claims against the general assets of the Fund.
NOTE 5—Cash Balances
The Fund is permitted to temporarily carry a negative or overdrawn balance in its account with State Street Bank and Trust Company, the custodian bank. Such balances, if any at period end, are shown in the Statement of Assets and Liabilities under the payable caption Amount due custodian. To compensate the custodian bank for such overdrafts, the overdrawn Fund may either (1) leave funds as a compensating balance in the account so the custodian bank can be compensated by earning the additional interest; or (2) compensate by paying the custodian bank at a rate agreed upon by the custodian bank and Invesco, not to exceed the contractually agreed upon rate.
Invesco V.I. Global Real Estate Fund
NOTE 6—Distributions to Shareholders and Tax Components of Net Assets
Tax Character of Distributions to Shareholders Paid During the Fiscal Years Ended December 31, 2015 and 2014:
| | | | | | | | |
| | | 2015 | | | 2014 | |
Ordinary income | | $ | 14,502,694 | | | $ | 5,801,632 | |
Tax Components of Net Assets at Period-End:
| | | | |
| | | 2015 | |
Undistributed ordinary income | | $ | 5,798,886 | |
Undistributed long-term gain | | | 7,348,517 | |
Net unrealized appreciation — investments | | | 28,110,059 | |
Net unrealized appreciation (depreciation) — other investments | | | (9,799 | ) |
Temporary book/tax differences | | | (70,239 | ) |
Shares of beneficial interest | | | 375,618,799 | |
Total net assets | | $ | 416,796,223 | |
The difference between book-basis and tax-basis unrealized appreciation (depreciation) is due to differences in the timing of recognition of gains and losses on investments for tax and book purposes. The Fund’s net unrealized appreciation difference is attributable primarily to wash sales and passive foreign investment companies.
The temporary book/tax differences are a result of timing differences between book and tax recognition of income and/or expenses. The Fund’s temporary book/tax differences are the result of the trustee deferral of compensation and retirement plan benefits.
Capital loss carryforward is calculated and reported as of a specific date. Results of transactions and other activity after that date may affect the amount of capital loss carryforward actually available for the Fund to utilize. Capital losses generated in years beginning after December 22, 2010 can be carried forward for an unlimited period, whereas previous losses expire in eight tax years. Capital losses with an expiration period may not be used to offset capital gains until all net capital losses without an expiration date have been utilized. Capital loss carryforwards with no expiration date will retain their character as either short-term or long-term capital losses instead of as short-term capital losses as under prior law. The ability to utilize capital loss carryforwards in the future may be limited under the Internal Revenue Code and related regulations based on the results of future transactions.
The Fund does not have a capital loss carryforward as of December 31, 2015.
NOTE 7—Investment Securities
The aggregate amount of investment securities (other than short-term securities, U.S. Treasury obligations and money market funds, if any) purchased and sold by the Fund during the year ended December 31, 2015 was $328,366,240 and $302,317,692, respectively. Cost of investments on a tax basis includes the adjustments for financial reporting purposes as of the most recently completed federal income tax reporting period-end.
| | | | |
| Unrealized Appreciation (Depreciation) of Investment Securities on a Tax Basis | |
Aggregate unrealized appreciation of investment securities | | $ | 47,732,555 | |
Aggregate unrealized (depreciation) of investment securities | | | (19,622,496 | ) |
Net unrealized appreciation of investment securities | | $ | 28,110,059 | |
Cost of investments for tax purposes is $386,415,617.
NOTE 8—Reclassification of Permanent Differences
Primarily as a result of differing book/tax treatment of passive foreign investment companies and foreign currency transactions, on December 31, 2015, undistributed net investment income was increased by $2,992,747, undistributed net realized gain was decreased by $2,992,207 and shares of beneficial interest was decreased by $540. This reclassification had no effect on the net assets of the Fund.
Invesco V.I. Global Real Estate Fund
NOTE 9—Share Information
| | | | | | | | | | | | | | | | |
| | | Summary of Share Activity | |
| | | Years ended December 31, | |
| | | 2015(a) | | | 2014 | |
| | | Shares | | | Amount | | | Shares | | | Amount | |
Sold: | | | | | | | | | | | | | | | | |
Series I | | | 3,027,072 | | | $ | 52,252,851 | | | | 3,252,789 | | | $ | 54,247,717 | |
Series II | | | 2,517,858 | | | | 42,781,073 | | | | 3,484,973 | | | | 56,243,205 | |
| | | | |
Issued as reinvestment of dividends: | | | | | | | | | | | | | | | | |
Series I | | | 478,321 | | | | 7,476,164 | | | | 200,852 | | | | 3,251,796 | |
Series II | | | 461,968 | | | | 7,026,530 | | | | 161,586 | | | | 2,549,836 | |
| | | | |
Reacquired: | | | | | | | | | | | | | | | | |
Series I | | | (2,911,646 | ) | | | (49,837,854 | ) | | | (3,695,733 | ) | | | (61,000,688 | ) |
Series II | | | (1,836,058 | ) | | | (30,521,697 | ) | | | (3,133,157 | ) | | | (49,327,540 | ) |
Net increase in share activity | | | 1,737,515 | | | $ | 29,177,067 | | | | 271,310 | | | $ | 5,964,326 | |
| (a) | There are entities that are record owners of more than 5% of the outstanding shares of the Fund and in the aggregate own 67% of the outstanding shares of the Fund. The Fund and the Fund’s principal underwriter or adviser, are parties to participation agreements with these entities whereby these entities sell units of interest in separate accounts funding variable products that are invested in the Fund. The Fund, Invesco and/or Invesco affiliates may make payments to these entities, which are considered to be related to the Fund, for providing services to the Fund, Invesco and/or Invesco affiliates including but not limited to services such as, securities brokerage, third party record keeping and account servicing and administrative services. The Fund has no knowledge as to whether all or any portion of the shares owned of record by these entities are also owned beneficially. |
NOTE 10—Financial Highlights
The following schedule presents financial highlights for a share of the Fund outstanding throughout the periods indicated.
| | | | | | | | | | | | | | | | | | | | | | | | | | | | | | | | | | | | | | | | | | | | | | | | |
| | | Net asset
value,
beginning
of period | | | Net
investment
income(a) | | | Net gains
(losses)
on securities
(both
realized and
unrealized) | | | Total from
investment
operations | | | Dividends
from net
investment
income | | | Net asset
value, end
of period | | | Total
return(b) | | | Net assets,
end of period
(000’s omitted) | | | Ratio of
expenses
to average
net assets
with fee waivers
and/or expenses
absorbed | | | Ratio of
expenses
to average net
assets without
fee waivers
and/or expenses
absorbed | | | Ratio of net
investment
income
to average
net assets | | | Portfolio
turnover(c) | |
Series I | | | | | | | | | | | | | | | | | | | | | | | | | | | | | | | | | | | | | | | | | | | | | | | | |
Year ended 12/31/15 | | $ | 17.24 | | | $ | 0.31 | | | $ | (0.59 | ) | | $ | (0.28 | ) | | $ | (0.60 | ) | | $ | 16.36 | | | | (1.48 | )% | | $ | 208,796 | | | | 1.11 | %(d) | | | 1.11 | %(d) | | | 1.79 | %(d) | | | 72 | % |
Year ended 12/31/14 | | | 15.29 | | | | 0.33 | | | | 1.89 | | | | 2.22 | | | | (0.27 | ) | | | 17.24 | | | | 14.62 | | | | 209,829 | | | | 1.10 | | | | 1.10 | | | | 1.99 | | | | 44 | |
Year ended 12/31/13 | | | 15.47 | | | | 0.22 | | | | 0.21 | | | | 0.43 | | | | (0.61 | ) | | | 15.29 | | | | 2.71 | | | | 189,835 | | | | 1.10 | | | | 1.10 | | | | 1.41 | | | | 49 | |
Year ended 12/31/12 | | | 12.14 | | | | 0.27 | | | | 3.14 | | | | 3.41 | | | | (0.08 | ) | | | 15.47 | | | | 28.12 | | | | 176,933 | | | | 1.14 | | | | 1.14 | | | | 1.94 | | | | 51 | |
Year ended 12/31/11 | | | 13.58 | | | | 0.24 | | | | (1.16 | ) | | | (0.92 | ) | | | (0.52 | ) | | | 12.14 | | | | (6.51 | ) | | | 134,254 | | | | 1.14 | | | | 1.14 | | | | 1.77 | | | | 47 | |
Series II | | | | | | | | | | | | | | | | | | | | | | | | | | | | | | | | | | | | | | | | | | | | | | | | |
Year ended 12/31/15 | | | 16.79 | | | | 0.26 | | | | (0.58 | ) | | | (0.32 | ) | | | (0.56 | ) | | | 15.91 | | | | (1.74 | ) | | | 208,000 | | | | 1.36 | (d) | | | 1.36 | (d) | | | 1.54 | (d) | | | 72 | |
Year ended 12/31/14 | | | 14.90 | | | | 0.28 | | | | 1.84 | | | | 2.12 | | | | (0.23 | ) | | | 16.79 | | | | 14.34 | | | | 200,299 | | | | 1.35 | | | | 1.35 | | | | 1.74 | | | | 44 | |
Year ended 12/31/13 | | | 15.11 | | | | 0.18 | | | | 0.20 | | | | 0.38 | | | | (0.59 | ) | | | 14.90 | | | | 2.44 | | | | 170,145 | | | | 1.35 | | | | 1.35 | | | | 1.16 | | | | 49 | |
Year ended 12/31/12 | | | 11.87 | | | | 0.23 | | | | 3.07 | | | | 3.30 | | | | (0.06 | ) | | | 15.11 | | | | 27.85 | | | | 124,219 | | | | 1.39 | | | | 1.39 | | | | 1.69 | | | | 51 | |
Year ended 12/31/11 | | | 13.31 | | | | 0.20 | | | | (1.13 | ) | | | (0.93 | ) | | | (0.51 | ) | | | 11.87 | | | | (6.73 | ) | | | 62,349 | | | | 1.39 | | | | 1.39 | | | | 1.52 | | | | 47 | |
| (a) | Calculated using average shares outstanding. |
| (b) | Includes adjustments in accordance with accounting principles generally accepted in the United States of America and as such, the net asset value for financial reporting purposes and the returns based upon those net asset values may differ from the net asset value and returns for shareholder transactions. Total returns are not annualized for periods less than one year, if applicable, and do not reflect charges assessed in connection with a variable product, which if included would reduce total returns. |
| (c) | Portfolio turnover is calculated at the fund level and is not annualized for periods less than one year, if applicable. |
| (d) | Ratios are based on average daily net assets (000’s omitted) of $215,377 and $212,067 for Series I and Series II shares, respectively. |
Invesco V.I. Global Real Estate Fund
Report of Independent Registered Public Accounting Firm
To the Board of Trustees of AIM Variable Insurance Funds (Invesco Variable Insurance Funds)
and Shareholders of Invesco V.I. Global Real Estate Fund:
In our opinion, the accompanying statement of assets and liabilities, including the schedule of investments, and the related statements of operations and of changes in net assets and the financial highlights present fairly, in all material respects, the financial position of Invesco V.I. Global Real Estate Fund (one of the funds constituting AIM Variable Insurance Funds (Invesco Variable Insurance Funds), hereafter referred to as the “Fund”) at December 31, 2015, the results of its operations for the year then ended, the changes in its net assets for each of the two years in the period then ended and the financial highlights for each of the five years in the period then ended, in conformity with accounting principles generally accepted in the United States of America. These financial statements and financial highlights (hereafter referred to as “financial statements”) are the responsibility of the Fund’s management. Our responsibility is to express an opinion on these financial statements based on our audits. We conducted our audits of these financial statements in accordance with the standards of the Public Company Accounting Oversight Board (United States). Those standards require that we plan and perform the audit to obtain reasonable assurance about whether the financial statements are free of material misstatement. An audit includes examining, on a test basis, evidence supporting the amounts and disclosures in the financial statements, assessing the accounting principles used and significant estimates made by management, and evaluating the overall financial statement presentation. We believe that our audits, which included confirmation of securities at December 31, 2015 by correspondence with the custodian and brokers, and the application of alternative auditing procedures where confirmations of security purchases have not been received, provide a reasonable basis for our opinion.
PRICEWATERHOUSECOOPERS LLP
Houston, Texas
February 15, 2016
Invesco V.I. Global Real Estate Fund
Calculating your ongoing Fund expenses
Example
As a shareholder of the Fund, you incur ongoing costs, including management fees; distribution and/or service fees (12b-1); and other Fund expenses. This example is intended to help you understand your ongoing costs (in dollars) of investing in the Fund and to compare these costs with ongoing costs of investing in other mutual funds. The example is based on an investment of $1,000 invested at the beginning of the period and held for the entire period July 1, 2015 through December 31, 2015.
The actual and hypothetical expenses in the examples below do not represent the effect of any fees or other expenses assessed in connection with a variable product; if they did, the expenses shown would be higher while the ending account values shown would be lower.
Actual expenses
The table below provides information about actual account values and actual expenses. You may use the information in this table, together with the amount you invested, to estimate the expenses that you paid over the period. Simply divide your account value by $1,000 (for example, an $8,600 account value divided by $1,000 = 8.6), then multiply the result by the number in the table under the heading entitled “Actual Expenses Paid During Period” to estimate the expenses you paid on your account during this period.
Hypothetical example for comparison purposes
The table below also provides information about hypothetical account values and hypothetical expenses based on the Fund’s actual expense ratio and an assumed rate of return of 5% per year before expenses, which is not the Fund’s actual return.
The hypothetical account values and expenses may not be used to estimate the actual ending account balance or expenses you paid for the period. You may use this information to compare the ongoing costs of investing in the Fund and other funds. To do so, compare this 5% hypothetical example with the 5% hypothetical examples that appear in the shareholder reports of the other funds.
Please note that the expenses shown in the table are meant to highlight your ongoing costs. Therefore, the hypothetical information is useful in comparing ongoing costs, and will not help you determine the relative total costs of owning different funds.
| | | | | | | | | | | | | | | | | | | | | | | | |
| Class | | Beginning
Account Value
(07/01/15) | | | ACTUAL | | | HYPOTHETICAL
(5% annual return before
expenses) | | | Annualized
Expense
Ratio | |
| | | Ending
Account Value
(12/31/15)1 | | | Expenses
Paid During
Period2 | | | Ending
Account Value
(12/31/15) | | | Expenses
Paid During
Period2 | | |
Series I | | $ | 1,000.00 | | | $ | 1,005.00 | | | $ | 5.66 | | | $ | 1,019.56 | | | $ | 5.70 | | | | 1.12 | % |
Series II | | | 1,000.00 | | | | 1,003.50 | | | | 6.92 | | | | 1,018.30 | | | | 6.97 | | | | 1.37 | |
| 1 | The actual ending account value is based on the actual total return of the Fund for the period July 1, 2015 through December 31, 2015, after actual expenses and will differ from the hypothetical ending account value which is based on the Fund’s expense ratio and a hypothetical annual return of 5% before expenses. |
| 2 | Expenses are equal to the Fund’s annualized expense ratio as indicated above multiplied by the average account value over the period, multiplied by 184/365 to reflect the most recent fiscal half year. |
Invesco V.I. Global Real Estate Fund
Tax Information
Form 1099-DIV, Form 1042-S and other year–end tax information provide shareholders with actual calendar year amounts that should be included in their tax returns. Shareholders should consult their tax advisors.
The following distribution information is being provided as required by the Internal Revenue Code or to meet a specific state’s requirement.
The Fund designates the following amounts or, if subsequently determined to be different, the maximum amount allowable for its fiscal year ended December 31, 2015:
| | | | |
Federal and State Income Tax | |
Corporate Dividends Received Deduction* | | | 0.00 | % |
U.S. Treasury Obligations* | | | 0.00 | % |
| | * | The above percentages are based on ordinary income dividends paid to shareholders during the Fund’s fiscal year |
Invesco V.I. Global Real Estate Fund
Trustees and Officers
The address of each trustee and officer is AIM Variable Insurance Funds (Invesco Variable Insurance Funds) (the “Trust”), 11 Greenway Plaza, Suite 1000, Houston, Texas 77046-1173. The trustees serve for the life of the Trust, subject to their earlier death, incapacitation, resignation, retirement or removal as more specifically provided in the Trust’s organizational documents. Each officer serves for a one year term or until their successors are elected and qualified. Column two below includes length of time served with predecessor entities, if any.
| | | | | | | | |
Name, Year of Birth and
Position(s) Held with the Trust | | Trustee and/
or Officer Since | | Principal Occupation(s)
During Past 5 Years | | Number of Funds in Fund Complex Overseen by Trustee | | Other Directorship(s) Held by Trustee During Past 5 Years |
| Interested Persons | | | | | | | | |
| Martin L. Flanagan1 — 1960 Trustee | | 2007 | | Executive Director, Chief Executive Officer and President, Invesco Ltd. (ultimate parent of Invesco and a global investment management firm); Advisor to the Board, Invesco Advisers, Inc. (formerly known as Invesco Institutional (N.A.), Inc.); Trustee, The Invesco Funds; Vice Chair, Investment Company Institute; and Member of Executive Board, SMU Cox School of Business Formerly: Chairman and Chief Executive Officer, Invesco Advisers, Inc. (registered investment adviser); Director, Chairman, Chief Executive Officer and President, IVZ Inc. (holding company), INVESCO Group Services, Inc. (service provider) and Invesco North American Holdings, Inc. (holding company); Director, Chief Executive Officer and President, Invesco Holding Company Limited (parent of Invesco and a global investment management firm); Director, Invesco Ltd.; Chairman, Investment Company Institute and President, Co-Chief Executive Officer, Co-President, Chief Operating Officer and Chief Financial Officer, Franklin Resources, Inc. (global investment management organization) | | 146 | | None |
Philip A. Taylor2 — 1954 Trustee, President and Principal Executive Officer | | 2006 | | Head of North American Retail and Senior Managing Director, Invesco Ltd.; Director, Co-Chairman, Co-President and Co-Chief Executive Officer, Invesco Advisers, Inc. (formerly known as Invesco Institutional (N.A.), Inc.) (registered investment adviser); Director, Chairman, Chief Executive Officer and President, Invesco Management Group, Inc. (formerly known as Invesco Aim Management Group, Inc.) (financial services holding company); Director and Chairman, Invesco Investment Services, Inc. (formerly known as Invesco Aim Investment Services, Inc.) (registered transfer agent) Chief Executive Officer, Invesco Corporate Class Inc. (corporate mutual fund company) Director, Chairman and Chief Executive Officer, Invesco Canada Ltd. (formerly known as Invesco Trimark Ltd./Invesco Trimark Ltèe) (registered investment adviser and registered transfer agent); Trustee, President and Principal Executive Officer, The Invesco Funds (other than AIM Treasurer’s Series Trust (Invesco Treasurer’s Series Trust), Short-Term Investments Trust and Invesco Management Trust); Trustee and Executive Vice President, The Invesco Funds (AIM Treasurer’s Series Trust (Invesco Treasurer’s Series Trust), Short-Term Investments Trust and Invesco Management Trust only); Director, Invesco Investment Advisers LLC (formerly known as Van Kampen Asset Management); Director, Chief Executive Officer and President, Van Kampen Exchange Corp. Formerly: Director and President, INVESCO Funds Group, Inc. (registered investment adviser and registered transfer agent); Director and Chairman, IVZ Distributors, Inc. (formerly known as INVESCO Distributors, Inc.) (registered broker dealer); Director, President and Chairman, Invesco Inc. (holding company), Invesco Canada Holdings Inc. (holding company), Trimark Investments Ltd./Placements Trimark Ltèe and Invesco Financial Services Ltd/Services Financiers Invesco Ltèe; Chief Executive Officer, Invesco Canada Fund Inc (corporate mutual fund company); Director and Chairman, Van Kampen Investor Services Inc.; Director, Chief Executive Officer and President, 1371 Preferred Inc. (holding company) and Van Kampen Investments Inc.; Director and President, AIM GP Canada Inc. (general partner for limited partnerships) and Van Kampen Advisors, Inc.; Director and Chief Executive Officer, Invesco Trimark Dealer Inc. (registered broker dealer); Director, Invesco Distributors, Inc. (formerly known as Invesco Aim Distributors, Inc.) (registered broker dealer); Manager, Invesco PowerShares Capital Management LLC; Director, Chief Executive Officer and President, Invesco Advisers, Inc.; Director, Chairman, Chief Executive Officer and President, Invesco Aim Capital Management, Inc.; President, Invesco Trimark Dealer Inc. and Invesco Trimark Ltd./Invesco Trimark Ltèe; Director and President, AIM Trimark Corporate Class Inc. and AIM Trimark Canada Fund Inc.; Senior Managing Director, Invesco Holding Company Limited; Director and Chairman, Fund Management Company (former registered broker dealer); President and Principal Executive Officer, The Invesco Funds (AIM Treasurer’s Series Trust (Invesco Treasurer’s Series Trust), and Short-Term Investments Trust only); President, AIM Trimark Global Fund Inc. and AIM Trimark Canada Fund Inc | | 146 | | None |
| 1 | Mr. Flanagan is considered an interested person (within the meaning of Section 2(a)(19) of the 1940 Act) of the Trust because he is an officer of the Adviser to the Trust, and an officer and a director of Invesco Ltd., ultimate parent of the Adviser. |
| 2 | Mr. Taylor is considered an interested person (within the meaning of Section 2(a)(19) of the 1940 Act) of the Trust because he is an officer and a director of the Adviser. |
Invesco V.I. Global Real Estate Fund
Trustees and Officers—(continued)
| | | | | | | | |
Name, Year of Birth and
Position(s) Held with the Trust | | Trustee and/
or Officer Since | | Principal Occupation(s)
During Past 5 Years | | Number of Funds in Fund Complex Overseen by Trustee | | Other Directorship(s)
Held by Trustee During Past 5 Years |
| Independent Trustees | | | | | | | | |
Bruce L. Crockett — 1944 Trustee and Chair | | 2003 | | Chairman, Crockett Technologies Associates (technology consulting company) Formerly: Director, Captaris (unified messaging provider); Director, President and Chief Executive Officer, COMSAT Corporation; Chairman, Board of Governors of INTELSAT (international communications company); ACE Limited (insurance company); Independent Directors Council and Investment Company Institute | | 146 | | ALPS (Attorneys Liability Protection Society) (insurance company) and Globe Specialty Metals, Inc. (metallurgical company) |
David C. Arch — 1945 Trustee | | 2010 | | Chairman of Blistex Inc., a consumer health care products manufacturer | | 146 | | Board member of the Illinois Manufacturers’ Association; Member of the Board of Visitors, Institute for the Humanities, University of Michigan |
James T. Bunch — 1942 Trustee | | 2000 | | Managing Member, Grumman Hill Group LLC (family office/private equity investments) Formerly: Chairman of the Board of Trustees, Evans Scholars Foundation and Chairman, Board of Governors, Western Golf Association | | 146 | | Trustee, Evans Scholars Foundation; and Chairman of the Board, Denver Film Society |
Albert R. Dowden — 1941 Trustee | | 2003 | | Director of a number of public and private business corporations, including the Boss Group, Ltd. (private investment and management); Nature’s Sunshine Products, Inc. and Reich & Tang Funds (5 portfolios) (registered investment company) Formerly: Director, Homeowners of America Holding Corporation/Homeowners of America Insurance Company (property casualty company); Director, Continental Energy Services, LLC (oil and gas pipeline service); Director, CompuDyne Corporation (provider of product and services to the public security market) and Director, Annuity and Life Re (Holdings), Ltd. (reinsurance company); Director, President and Chief Executive Officer, Volvo Group North America, Inc.; Senior Vice President, AB Volvo; Director of various public and private corporations; Chairman, DHJ Media, Inc.; Director, Magellan Insurance Company; and Director, The Hertz Corporation, Genmar Corporation (boat manufacturer), National Media Corporation; Advisory Board of Rotary Power International (designer, manufacturer, and seller of rotary power engines); and Chairman, Cortland Trust, Inc. (registered investment company) | | 146 | | Director of: Nature’s Sunshine Products, Inc., Reich & Tang Funds, Homeowners of America Holding Corporation/ Homeowners of America Insurance Company, the Boss Group |
Jack M. Fields — 1952 Trustee | | 2003 | | Chief Executive Officer, Twenty First Century Group, Inc. (government affairs company); Owner and Chief Executive Officer, Dos Angeles Ranch, L.P. (cattle, hunting, corporate entertainment); and Discovery Global Education Fund (non-profit) Formerly: Chief Executive Officer, Texana Timber LP (sustainable forestry company); Director of Cross Timbers Quail Research Ranch (non-profit); and member of the U.S. House of Representatives | | 146 | | Insperity, Inc. (formerly known as Administaff) |
Eli Jones — Trustee | | 2016 | | Professor and Dean, Mays Business School, Texas A&M University Formerly: Professor and Dean, Walton College of Business, University of Arkansas, and E.J. Ourso College of Business, Louisiana State University | | 146 | | Director, Insperity, Inc., (2011-present) and ARVEST Bank (2012-2015) |
Prema Mathai-Davis — 1950 Trustee | | 2003 | | Retired. Formerly: Chief Executive Officer, YWCA of the U.S.A. | | 146 | | None |
Larry Soll — 1942 Trustee | | 1997 | | Retired. Formerly: Chairman, Chief Executive Officer and President, Synergen Corp. (a biotechnology company) | | 146 | | None |
Robert C. Troccoli — Trustee | | 2016 | | Retired. Formerly: Senior Partner, KPMG LLP | | 146 | | None |
Raymond Stickel, Jr. — 1944 Trustee | | 2005 | | Retired. Formerly: Director, Mainstay VP Series Funds, Inc. (25 portfolios) and Partner, Deloitte & Touche | | 146 | | None |
Suzanne H. Woolsey — 1941 Trustee | | 2014 | | Chief Executive Officer of Woolsey Partners LLC | | 146 | | Emeritus Chair of the Board of Trustees of the Institute for Defense Analyses; Trustee of Colorado College; Trustee of California Institute of Technology; Prior to 2014, Director of Fluor Corp.; Prior to 2010, Trustee of the German Marshall Fund of the United States; Prior to 2010 Trustee of the Rocky Mountain Institute |
Invesco V.I. Global Real Estate Fund
Trustees and Officers—(continued)
| | | | | | | | |
Name, Year of Birth and
Position(s) Held with the Trust | | Trustee and/
or Officer Since | | Principal Occupation(s)
During Past 5 Years | | Number of Funds in Fund Complex Overseen by Trustee | | Other Directorship(s)
Held by Trustee During Past 5 Years |
| Other Officers | | | | | | | | |
Russell C. Burk — 1958 Senior Vice President and Senior Officer | | 2005 | | Senior Vice President and Senior Officer, The Invesco Funds | | N/A | | N/A |
John M. Zerr — 1962 Senior Vice President, Chief Legal Officer and Secretary | | 2006 | | Director, Senior Vice President, Secretary and General Counsel, Invesco Management Group, Inc. (formerly known as Invesco Aim Management Group, Inc.) and Van Kampen Exchange Corp.; Senior Vice President, Invesco Advisers, Inc. (formerly known as Invesco Institutional (N.A.), Inc.) (registered investment adviser); Senior Vice President and Secretary, Invesco Distributors, Inc. (formerly known as Invesco Aim Distributors, Inc.); Director, Vice President and Secretary, Invesco Investment Services, Inc. (formerly known as Invesco Aim Investment Services, Inc.); Senior Vice President, Chief Legal Officer and Secretary, The Invesco Funds; Managing Director, Invesco PowerShares Capital Management LLC; Director, Secretary and General Counsel, Invesco Investment Advisers LLC (formerly known as Van Kampen Asset Management); Secretary and General Counsel, Invesco Capital Markets, Inc. (formerly known as Van Kampen Funds Inc.) and Chief Legal Officer, PowerShares Exchange-Traded Fund Trust, PowerShares Exchange-Traded Fund Trust II, PowerShares India Exchange-Traded Fund Trust, PowerShares Actively Managed Exchange-Traded Fund Trust, and PowerShares Actively Managed Exchange-Traded Commodity Fund Trust Formerly: Director, Vice President and Secretary, IVZ Distributors, Inc. (formerly known as INVESCO distributors, Inc.); Director and Vice President, INVESCO Funds Group, Inc.; Director and Vice President, Van Kampen Advisors Inc.; Director, Vice President, Secretary and General Counsel, Van Kampen Investor Services Inc.; Director, Invesco Distributors, Inc. (formerly known as Invesco Aim Distributors, Inc.); Director, Senior Vice President, General Counsel and Secretary, Invesco Aim Advisers, Inc. and Van Kampen Investments Inc.; Director, Vice President and Secretary, Fund Management Company; Director, Senior Vice President, Secretary, General Counsel and Vice President, Invesco Aim Capital Management, Inc.; Chief Operating Officer and General Counsel, Liberty Ridge Capital, Inc. (an investment adviser); Vice President and Secretary, PBHG Funds (an investment company) and PBHG Insurance Series Fund (an investment company); Chief Operating Officer, General Counsel and Secretary, Old Mutual Investment Partners (a broker-dealer); General Counsel and Secretary, Old Mutual Fund Services (an administrator) and Old Mutual Shareholder Services (a shareholder servicing center); Executive Vice President, General Counsel and Secretary, Old Mutual Capital, Inc. (an investment adviser); and Vice President and Secretary, Old Mutual Advisors Funds (an investment company) | | N/A | | N/A |
Sheri Morris — 1964 Vice President, Treasurer and Principal Financial Officer | | 2003 | | Vice President, Treasurer and Principal Financial Officer, The Invesco Funds; Vice President, Invesco Advisers, Inc. (formerly known as Invesco Institutional (N.A.), Inc.) (registered investment adviser); and Vice President, PowerShares Exchange-Traded Fund Trust, PowerShares Exchange-Traded Fund Trust II, PowerShares India Exchange-Traded Fund Trust, PowerShares Actively Managed Exchange-Traded Fund Trust, and PowerShares Actively Managed Exchange-Traded Commodity Fund Trust Formerly: Vice President, Invesco Aim Advisers, Inc., Invesco Aim Capital Management, Inc. and Invesco Aim Private Asset Management, Inc.; Assistant Vice President and Assistant Treasurer, The Invesco Funds and Assistant Vice President, Invesco Advisers, Inc., Invesco Aim Capital Management, Inc. and Invesco Aim Private Asset Management, Inc.; and Treasurer, PowerShares Exchange-Traded Fund Trust, PowerShares Exchange-Traded Fund Trust II, PowerShares India Exchange-Traded Fund Trust and PowerShares Actively Managed Exchange-Traded Fund Trust | | N/A | | N/A |
Invesco V.I. Global Real Estate Fund
Trustees and Officers—(continued)
| | | | | | | | |
Name, Year of Birth and
Position(s) Held with the Trust | | Trustee and/
or Officer Since | | Principal Occupation(s)
During Past 5 Years | | Number of Funds in Fund Complex Overseen by Trustee | | Other Directorship(s)
Held by Trustee During Past 5 Years |
| Other Officers—(continued) | | | | | | | | |
Karen Dunn Kelley — 1960 Vice President | | 2003 | | Senior Managing Director, Investments, Invesco Ltd.; Director, Co-President, Co-Chief Executive Officer, and Co-Chairman, Invesco Advisers, Inc. (formerly known as Invesco Institutional (N.A.), Inc.) (registered investment adviser); Chairman, Invesco Senior Secured Management, Inc.; Senior Vice President, Invesco Management Group, Inc. (formerly known as Invesco Aim Management Group, Inc.); Executive Vice President, Invesco Distributors, Inc. (formerly known as Invesco Aim Distributors, Inc.); Director, Invesco Mortgage Capital Inc. and Invesco Management Company Limited; Vice President, The Invesco Funds (other than AIM Treasurer’s Series Trust (Invesco Treasurer’s Series Trust), Short-Term Investments Trust and Invesco Management Trust); and President and Principal Executive Officer, The Invesco Funds (AIM Treasurer’s Series Trust (Invesco Treasurer’s Series Trust), Short-Term Investments Trust and Invesco Management Trust only) Formerly: Director and President, INVESCO Asset Management (Bermuda) Ltd., Director, INVESCO Global Asset Management Limited and INVESCO Management S.A.; Senior Vice President, Van Kampen Investments Inc. and Invesco Advisers, Inc. (formerly known as Invesco Institutional (N.A.), Inc.) (registered investment adviser); Vice President, Invesco Advisers, Inc. (formerly known as Invesco Institutional (N.A.), Inc.); Director of Cash Management and Senior Vice President, Invesco Advisers, Inc. and Invesco Aim Capital Management, Inc.; Director and President, Fund Management Company; Chief Cash Management Officer, Director of Cash Management, Senior Vice President, and Managing Director, Invesco Aim Capital Management, Inc.; Director of Cash Management, Senior Vice President, and Vice President, Invesco Advisers, Inc. and The Invesco Funds (AIM Treasurer’s Series Trust (Invesco Treasurer’s Series Trust), and Short-Term Investments Trust only) | | N/A | | N/A |
Crissie M. Wisdom — 1969 Anti-Money Laundering Compliance Officer | | 2013 | | Anti-Money Laundering Compliance Officer, Invesco Advisers, Inc. (formerly known as Invesco Institutional (N.A.), Inc.) (registered investment adviser), Invesco Capital Markets, Inc. (formerly known as Van Kampen Funds Inc.), Invesco Distributors, Inc., Invesco Investment Services, Inc., Invesco Management Group, Inc., Van Kampen Exchange Corp., The Invesco Funds, and PowerShares Exchange-Traded Fund Trust, PowerShares Exchange-Traded Fund Trust II, PowerShares India Exchange-Traded Fund Trust, PowerShares Actively Managed Exchange-Traded Fund Trust and PowerShares Actively Managed Exchange-Traded Commodity Fund Trust; Anti-Money Laundering Compliance Officer and Bank Secrecy Act Officer, INVESCO National Trust Company and Invesco Trust Company; and Fraud Prevention Manager and Controls and Risk Analysis Manager for Invesco Investment Services, Inc. | | N/A | | N/A |
Lisa O. Brinkley — 1959 Chief Compliance Officer | | 2015 | | Senior Vice President and Chief Compliance Officer, Invesco Advisers, Inc. (registered investment adviser) (formerly known as Invesco Institutional (N.A., Inc.); and Chief Compliance Officer, The Invesco Funds Formerly: Global Assurance Officer, Invesco Ltd. and Vice President, The Invesco Funds; Chief Compliance Officer, Invesco Distributors, Inc. (formerly known as Invesco Aim Distributors, Inc.), Invesco Investment Services, Inc.(formerly known as Invesco Aim Investment Services, Inc.) and Van Kampen Investor Services Inc.; Senior Vice President, Invesco Management Group, Inc.; Senior Vice President and Chief Compliance Officer, Invesco Advisers, Inc. and The Invesco Funds; Vice President and Chief Compliance Officer, Invesco Aim Capital Management, Inc. and Invesco Distributors, Inc.; Vice President, Invesco Investment Services, Inc. and Fund Management Company | | N/A | | N/A |
The Statement of Additional Information of the Trust includes additional information about the Fund’s Trustees and is available upon request, without charge, by calling 1.800.959.4246. Please refer to the Fund’s prospectus for information on the Fund’s sub-advisers.
| | | | | | |
Office of the Fund 11 Greenway Plaza, Suite 1000 Houston, TX 77046-1173 | | Investment Adviser Invesco Advisers, Inc. 1555 Peachtree Street, N.E. Atlanta, GA 30309 | | Distributor Invesco Distributors, Inc. 11 Greenway Plaza, Suite 1000 Houston, TX 77046-1173 | | Auditors PricewaterhouseCoopers LLP 1000 Louisiana Street, Suite 5800 Houston, TX 77002-5678 |
| | | |
| | | | | | |
Counsel to the Fund Stradley Ronon Stevens & Young, LLP 2005 Market Street, Suite 2600 Philadelphia, PA 19103-7018 | | Counsel to the Independent Trustees Goodwin Procter LLP 901 New York Avenue, N.W. Washington, D.C. 20001 | | Transfer Agent Invesco Investment Services, Inc. 11 Greenway Plaza, Suite 1000 Houston, TX 77046-1173 | | Custodian State Street Bank and Trust Company 225 Franklin Street Boston, MA 02110-2801 |
Invesco V.I. Global Real Estate Fund
| | | | |
| | |

| | Annual Report to Shareholders | | December 31, 2015 |
| | |
| | Invesco V.I. Government Securities Fund |

| | |
| | The Fund provides a complete list of its holdings four times in each fiscal year, at the quarter-ends. For the second and fourth quarters, the lists appear in the Fund’s semiannual and annual reports to shareholders. For the first and third quarters, the Fund files the lists with the Securities and Exchange Commission (SEC) on Form N-Q. The Fund’s Form N-Q filings are available on the SEC website, sec.gov. Copies of the Fund’s Forms N-Q may be reviewed and copied at the SEC Public Reference Room in Washington, D.C. You can obtain information on the operation of the Public Reference Room, including information about duplicating fee charges, by calling 202 551 8090 or 800 732 0330, or by electronic request at the following email address: publicinfo@sec.gov. The SEC file numbers for the Fund are 811-07452 and 033-57340. The Fund’s most recent portfolio holdings, as filed on Form N-Q, have also been made available to insurance companies issuing variable annuity contracts and variable life insurance policies (“variable products”) that invest in the Fund. A description of the policies and procedures that the Fund uses to determine how to vote proxies relating to portfolio securities is available without charge, upon request, from our Client Services department at 800 959 4246 or at invesco.com/proxyguidelines. The information is also available on the SEC website, sec.gov. Information regarding how the Fund voted proxies related to its portfolio securities during the most recent 12-month period ended June 30 is available at invesco.com/ proxysearch. The information is also available on the SEC website, sec.gov. Invesco Advisers, Inc. is an investment adviser; it provides investment advisory services to individual and institutional clients and does not sell securities. Invesco Distributors, Inc. is the US distributor for Invesco Ltd.’s retail mutual funds, exchange-traded funds and institutional money market funds. Both are wholly owned, indirect subsidiaries of Invesco Ltd. This report must be accompanied or preceded by a currently effective Fund prospectus and variable product prospectus, which contain more complete information, including sales charges and expenses. Investors should read each carefully before investing. Invesco Distributors, Inc. VIGOV-AR-1 NOT FDIC INSURED | MAY LOSE VALUE | NO BANK GUARANTEE |
Management’s Discussion of Fund Performance
Performance summary
For the year ended December 31, 2015, Series I shares of Invesco V.I. Government Securities Fund (the Fund) had positive performance, but underperformed the Fund’s style-specific index, the Barclays U.S Government Index.
Your Fund’s long-term performance appears later in this report.
Fund vs. Indexes
Total returns, 12/31/14 to 12/31/15, excluding variable product issuer charges.
If variable product issuer charges were included, returns would be lower.
| | | | | |
| Series I Shares | | | | 0.34 | % |
| Series II Shares | | | | 0.06 | |
| Barclays U.S. Aggregate Index▼(Broad Market Index) | | | | 0.55 | |
| Barclays U.S. Government Index▼ (Style-Specific Index) | | | | 0.86 | |
| Lipper VUF General U.S. Government Funds Indexn (Peer Group Index) | | | | 0.67 | |
Source(s): ▼FactSet Research Systems Inc.; nLipper Inc.
Market conditions and your Fund
Economic data during 2015 was generally positive, but there were certainly pockets of weakness (manufacturing, mining and drilling), as the year came to an end. Employment was strong during the year, pushing the unemployment rate down to 5%.1 Manufacturing started out the year relatively strong, but began to show signs of weakness as energy prices continued to test new lows. Housing remained relatively robust, and final consumer sales, including sales of autos, were very strong throughout the year. One of the missing components to a strong economic environment was rising inflation, as inflation in the price of goods (food, apparel, gas) remained unusually low, largely due to falling commodity and energy prices, while inflation on the service side (rents, medical care, education) was relatively strong. Combining goods inflation and service inflation produced very low inflation points.
What 2015 is most likely to be remembered for is the US Federal Reserve (the
Fed) hiking rates for the first time since 2006. Market expectations for Fed hikes were pushed from early 2015 to late 2015 as inflation remained stubbornly low. As employment continued to look strong, and the market began to build in a large enough probability of a Fed rate hike, the Fed took advantage of that opportunity and raised the federal funds target rate to a range of 0.25% to 0.50% (up from a range of zero to 0.25%).2 Interest rates reacted accordingly as the very front end of the yield curve moved higher by 40 basis points during the year but rates further out the yield curve moved substantially less than that.3 A basis point is one one-hundredth of a percentage point.
The year began positively for bonds as lower oil prices and a stronger dollar pushed long-end yields down significantly. That tone changed as the European Central Bank expanded its quantitative easing program dramatically in the first quarter of 2015, prompting a scramble by the market to add risky assets. However, when data suggested that China’s economy, the world’s second-largest, was slowing
more quickly than expected, reverberations began to be felt around the globe.
Fixed income overall had a mixed year, as Treasury rates moved somewhat higher throughout 2015 and growing global economic risk and concerns about Fed tightening monetary policy forced credit spreads wider. Agency mortgage-backed securities underperformed Treasuries for most of the year before a strong showing in December brought excess returns close to flat.
Given this market backdrop, the Fund’s total return was positive, but the Fund underperformed its style-specific benchmark, the Barclays U.S. Government Index.
Positive contributors to Fund performance included our underweight allocation to Treasuries relative to the style-specific benchmark as well as our yield curve positioning. In addition, our exposure to 15-year conventional mortgages and ultra-high coupon 30-year fixed rate mortgages performed well.
There were several factors that detracted from the Fund’s performance during the year. Our small exposure to Treasury Inflation Protected Securities and volatility hedges to protect against large moves in interest rates offset our positive performance. In addition, the widening of credit spreads had an impact on our commercial mortgage-backed security positions.
The Fund uses duration and yield curve positioning for risk management and for generating returns. Duration measures a portfolio’s price sensitivity to interest rate changes, with a shorter duration tending to be less sensitive to these changes. Yield curve positioning refers to actively emphasizing points (maturities) along the yield curve with favorable risk/return expectations. Duration was managed
| | | | |
| Portfolio Composition | | |
| By security type | | % of total net assets | | |
| | |
| U.S. Government Sponsored Agency Mortgage-Backed Securities | | 50.0% | | |
| Non-U.S. Government Sponsored Agency Securities | | 19.9 | | |
| U.S. Treasury Securities | | 18.9 | | |
| U.S. Government Sponsored Agency Securities | | 9.5 | | |
| Money Market Funds Plus Other Assets Less Liabilities | | 1.7 | | |
| | | | | | | |
| Top 10 Debt Issuers* | | |
| | % of total net assets |
| | | | | | | |
| | |
| 1. | | U.S. Treasury | | | | 18.5 | % |
| 2. | | Federal National Mortgage Association | | | | 13.4 | |
| 3. | | Federal Home Loan Mortgage Corp. | | | | 13.2 | |
| 4. | | Freddie Mac REMICs | | | | 8.2 | |
| 5. | | Fannie Mae REMICs | | | | 7.7 | |
| 6. | | Government National Mortgage Association | | | | 4.2 | |
| 7. | | Ginnie Mae REMICs | | | | 4.0 | |
| 8. | | Federal Agriculture Mortgage Corp. | | | | 3.2 | |
| 9. | | La Hipotecaria Panamanian Mortgage Trust | | | | 3.0 | |
| 10. | | Tennessee Valley Authority | | | | 2.7 | |
| | |
Total Net Assets | | $588.5 million |
| |
Total Number of Holdings* | | 740 |
The Fund’s holdings are subject to change, and there is no assurance that the Fund will continue to hold any particular security.
| * | Excluding US Treasury bills and money market fund holdings. |
Data presented here are as of December 31, 2015.
Invesco V.I. Government Securities Fund
with cash, bonds and futures positions. Buying and selling interest rate futures contracts was an important tool we used to manage interest rate risk.
Please note that our strategy is implemented using derivative instruments, including futures, swaps and options. Therefore, a portion of the performance of the strategy, both positive and negative, can be attributed to these instruments. Derivatives can be a cost-effective way to gain or hedge exposure to certain risks. However, derivatives may amplify traditional investment risks through the creation of leverage and may be less liquid than traditional securities.
We wish to remind you that the Fund is subject to interest rate risk, meaning when interest rates rise, the value of fixed income securities tend to fall. This risk may be greater in the current market environment because interest rates are at or near historic lows. The degree to which the value of fixed income securities may decline due to rising interest rates may vary depending on the speed and magnitude of the increase in interest rates, as well as individual security characteristics such as price, maturity, duration and coupon and market forces such as supply and demand for similar securities. We are monitoring interest rates, and the market, economic and geopolitical factors that may impact the direction, speed and magnitude of changes to interest rates across the maturity spectrum, including the potential impact of monetary policy changes by the Fed and certain foreign central banks. If interest rates rise, markets may experience increased volatility, which may affect the value and/or liquidity of certain of the Fund’s investments.
We welcome new investors who joined the Fund during the year and thank you for your investment in Invesco V.I. Government Securities Fund.
| 1 | Source: Bureau of Labor Statistics |
| 2 | Source: US Federal Reserve |
The views and opinions expressed in management’s discussion of Fund performance are those of Invesco Advisers, Inc. These views and opinions are subject to change at any time based on factors such as market and economic conditions. These views and opinions may not be relied upon as investment advice or recommendations, or as an offer for a particular security. The information is not a complete analysis of every aspect of any market, country, industry, security or the Fund. Statements of fact are from sources considered reliable, but Invesco Advisers, Inc. makes no representation or warranty as to their completeness or accuracy. Although historical performance is no guarantee of future results, these insights may help you understand our investment management philosophy.
See important Fund and, if applicable, index disclosures later in this report.
| | |
 | | Clint Dudley Chartered Financial Analyst, Portfolio Manager, is manager of Invesco V.I. Government Securities |
| Fund. He joined Invesco in 1998. Mr. Dudley earned a BBA and an MBA from Baylor University. |
| | |
 | | Brian Schneider Chartered Financial Analyst, Portfolio Manager, is manager of Invesco V.I. Government Securities |
| Fund. He joined Invesco in 1987. Mr. Schneider earned a BA in economics and an MBA from Bellarmine University (formerly Bellarmine College). |
| | |
 | | Robert Waldner Chartered Financial Analyst, Portfolio Manager, is manager of Invesco V.I. Government Securities |
| Fund. He joined Invesco in 2013. Mr. Waldner earned a BSE degree in civil engineering from Princeton University. |
Invesco V.I. Government Securities Fund
Your Fund’s Long-Term Performance
Results of a $10,000 Investment – Oldest Share Class(es)
Fund and index data from 12/31/05
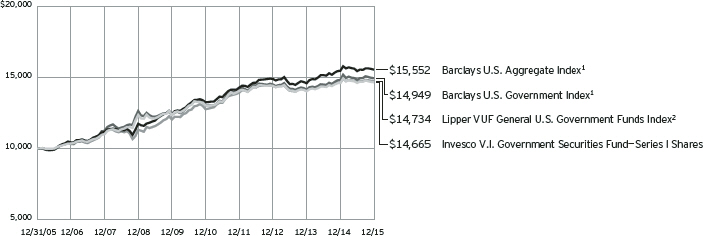
| 1 | Source: FactSet Research Systems Inc. |
Past performance cannot guarantee
comparable future results.
| | | | | |
| Average Annual Total Returns |
As of 12/31/15 | | | | | |
| |
| Series I Shares | | | | | |
| Inception (5/5/93) | | | | 4.46 | % |
| 10 Years | | | | 3.90 | |
| 5 Years | | | | 2.39 | |
| 1 Year | | | | 0.34 | |
| |
| Series II Shares | | | | | |
| Inception (9/19/01) | | | | 3.51 | % |
| 10 Years | | | | 3.64 | |
| 5 Years | | | | 2.13 | |
| 1 Year | | | | 0.06 | |
The performance of the Fund’s Series I and Series II share classes will differ primarily due to different class expenses.
The performance data quoted represent past performance and cannot guarantee comparable future results; current performance may be lower or higher. Please contact your variable product issuer or financial adviser for the most recent month-end variable product performance. Performance figures reflect Fund expenses, reinvested distributions and changes in net asset value. Investment return and principal value will fluctuate so that you may have a gain or loss when you sell shares.
The total annual Fund operating expense ratio set forth in the most recent Fund prospectus as of the date of this report for Series I and Series II shares was 0.78% and 1.03%, respectively. The expense ratios presented above may vary from the expense ratios presented in other sections of this report that are based on expenses incurred during the period covered by this report.
Invesco V.I. Government Securities Fund, a series portfolio of AIM Variable Insurance Funds (Invesco Variable Insurance Funds), is currently offered through insurance companies issuing variable products. You cannot purchase shares of the Fund directly. Performance figures given represent the Fund and are not intended to reflect actual variable product values. They do not reflect sales charges, expenses and fees assessed in connection with a variable product. Sales charges, expenses and fees, which are determined by the variable product issuers, will vary and will lower the total return.
The most recent month-end performance at the Fund level, excluding variable product charges, is available at 800 451 4246. As mentioned above,
for the most recent month-end performance including variable product charges, please contact your variable product issuer or financial adviser.
Fund performance reflects any applicable fee waivers and/or expense reimbursements. Had the adviser not waived fees and/or reimbursed expenses currently or in the past, returns would have been lower. See current prospectus for more information.
Invesco V.I. Government Securities Fund
Invesco V.I. Government Securities Fund’s investment objective is total return, comprised of current income and capital appreciation.
| ¢ | Unless otherwise stated, information presented in this report is as of December 31, 2015, and is based on total net assets. |
| ¢ | Unless otherwise noted, all data provided by Invesco. |
| ¢ | To access your Fund’s reports/prospectus, visit invesco.com/fundreports. |
Principal risks of investing in the Fund
Call risk. If interest rates fall, it is possible that issuers of debt securities with high interest rates will prepay or call their securities before their maturity dates. In this event, the proceeds from the called securities would likely be reinvested by the Fund in securities bearing the new, lower interest rates, resulting in a possible decline in the Fund’s income and distributions to shareholders.
Changing fixed income market conditions risk. The current low interest rate environment was created in part by the Federal Reserve Board (FRB) and certain foreign central banks keeping the federal funds and equivalent foreign rates at or near zero. There is a risk that interest rates will rise when the FRB and central banks raise these rates. This risk is heightened due to the FRB’s quantitative easing program and the “tapering” of other similar foreign central bank actions. This eventual increase in the federal funds and equivalent foreign rates may expose fixed income markets to heightened volatility and reduced liquidity for certain fixed income investments, particularly those with longer maturities. In addition, decreases in fixed income dealer market-making capacity may also potentially lead to heightened volatility and reduced liquidity in the fixed income markets. As a result, the value of the Fund’s investments and share price may decline. Changes in central bank policies could also result in higher than normal shareholder redemptions, which could potentially increase portfolio turnover and the Fund’s transaction costs.
Collateralized loan obligations risk. In addition to the normal interest rate, default and other risks of fixed income securities, collateralized loan obligations carry additional risks, including the possibility that distributions from collateral securities will not be adequate to make interest or other payments, the quality of the collateral may decline in value or default, the Fund may invest in collateralized loan obligations that are subordinate to other classes, values may be volatile, and disputes with the issuer may produce unexpected investment results.
Credit risk. The issuer of instruments in which the Fund invests may be unable to meet interest and/or principal payments,
thereby causing its instruments to decrease in value and lowering the issuer’s credit rating.
Derivatives risk. The value of a derivative instrument depends largely on (and is derived from) the value of an underlying security, currency, commodity, interest rate, index or other asset (each referred to as an underlying asset). In addition to risks relating to the underlying assets, the use of derivatives may include other, possibly greater, risks, including counterparty, leverage and liquidity risks. Counterparty risk is the risk that the counterparty to the derivative contract will default on its obligation to pay the Fund the amount owed or otherwise perform under the derivative contract. Derivatives create leverage risk because they do not require payment up front equal to the economic exposure created by owning the derivative. As a result, an adverse change in the value of the underlying asset could result in the Fund sustaining a loss that is substantially greater than the amount invested in the derivative, which may make the Fund’s returns more volatile and increase the risk of loss. Derivative instruments may also be less liquid than more traditional investments and the Fund may be unable to sell or close out its derivative positions at a desirable time or price. This risk may be more acute under adverse market conditions, during which the Fund may be most in need of liquidating its derivative positions. Derivatives may also be harder to value, less tax efficient and subject to changing government regulation that could impact the Fund’s ability to use certain derivatives or their cost. Also, derivatives used for hedging or to gain or limit exposure to a particular market segment may not provide the expected benefits, particularly during adverse market conditions.
Interest rate risk. Interest rate risk refers to the risk that bond prices generally fall as interest rates rise; conversely, bond prices generally rise as interest rates fall. Specific bonds differ in their sensitivity to changes in interest rates depending on their individual characteristics, including duration.
Management risk. The investment techniques and risk analysis used by the Fund’s portfolio managers may not produce the desired results.
Market risk. The prices of and the income generated by the Fund’s securities may decline in response to, among other things, investor sentiment, general economic and market conditions, regional or global instability, and currency and interest rate fluctuations.
Mortgage- and asset-backed securities risk. The Fund may invest in mortgage-and asset-backed securities that are subject to prepayment or call risk, which is the risk that the borrower’s payments may be received earlier or later than expected due to changes in prepayment rates on underlying loans. Faster prepayments often happen when interest rates are falling. As a result, the Fund may reinvest these early payments at lower interest rates, thereby reducing the Fund’s income. Conversely, when interest rates rise, prepayments may happen more slowly, causing the security to lengthen in duration. Longer duration securities tend to be more volatile. Securities may be prepaid at a price less than the original purchase value. An unexpectedly high rate of defaults on the mortgages held by a mortgage pool may adversely affect the value of mortgage-backed securities and could result in losses to the Fund. The risk of such defaults is generally higher in the case of mortgage pools that include subprime mortgages. Subprime mortgages refer to loans made to borrowers with weakened credit histories or with lower capacity to make timely payments on their mortgages.
Reinvestment risk. Reinvestment risk is the risk that a bond’s cash flows (coupon income and principal repayment) will be reinvested at an interest rate below that on the original bond.
TBA transactions risk. TBA transactions involve the risk that the securities received may be less favorable than what was anticipated by the Fund when entering into the TBA transaction. TBA transactions also involve the risk that a counterparty will fail to deliver the securities, exposing the Fund to further losses. Whether or not the Fund takes delivery of the securities at the termination date of a TBA transaction, the Fund will nonetheless be exposed to changes in the value of the underlying investments during the term of the agreement. When the Fund enters into a short sale of a TBA mortgage it does not own, the Fund may have
Invesco V.I. Government Securities Fund
to purchase deliverable mortgages to settle the short sale at a higher price than anticipated, thereby causing a loss. A short position in a TBA mortgage poses more risk than holding the same TBA mortgage long. As there is no limit on how much the price of mortgage securities can increase, the Fund’s exposure is unlimited. The Fund may not always be able to purchase mortgage securities to close out the short position at a particular time or at an acceptable price. A Fund will earmark or segregate liquid assets in an amount at least equal to its exposure for the duration of the contract. The Fund will incur increased transaction costs associated with selling TBA mortgages short. In addition, taking short positions in TBA mortgages results in a form of leverage which could increase the volatility of the Fund’s share price.
US government obligations risk. The Fund may invest in obligations issued by US government agencies and instrumentalities that may receive varying levels of support from the government, which could affect the Fund’s ability to recover should they default.
When-issued and delayed delivery risks. When-issued and delayed delivery transactions are subject to market risk as the value or yield of a security at delivery may be more or less than the purchase price or the yield generally available on securities when delivery occurs. In addition, the Fund is subject to counterparty risk because it relies on the buyer or seller, as the case may be, to consummate the transaction, and failure by the other party to complete the transaction may result in the Fund missing the opportunity of obtaining a price or yield considered to be advantageous.
Zero coupon or pay-in-kind securities risk. The value, interest rates, and liquidity of non-cash paying instruments, such as zero coupon and pay-in-kind securities, are subject to greater fluctuation than other types of securities. The higher yields and interest rates on pay-in-kind securities reflect the payment deferral and increased credit risk associated with such instruments and that such investments may represent a higher credit risk than coupon loans. Pay-in-kind securities may have a potential variability in valuations because their continuing accruals require continuing judgments about the
collectability of the deferred payments and the value of any associated collateral.
About indexes used in this report
The Barclays U.S. Aggregate Index is an unmanaged index considered representative of the US investment-grade, fixed-rate bond market.
The Barclays U.S. Government Index is an unmanaged index considered representative of fixed income obligations issued by the US Treasury, government agencies and quasi-federal corporations.
The Lipper VUF General U.S. Government Funds Index is an unmanaged index considered representative of general US government variable insurance underlying funds tracked by Lipper.
The Fund is not managed to track the performance of any particular index, including the index(es) described here, and consequently, the performance of the Fund may deviate significantly from the performance of the index(es).
A direct investment cannot be made in an index. Unless otherwise indicated, index results include reinvested dividends, and they do not reflect sales charges. Performance of the peer group, if applicable, reflects fund expenses; performance of a market index does not.
Other information
The returns shown in management’s discussion of Fund performance are based on net asset values calculated for shareholder transactions. Generally accepted accounting principles require adjustments to be made to the net assets of the Fund at period end for financial reporting purposes, and as such, the net asset values for shareholder transactions and the returns based on those net asset values may differ from the net asset values and returns reported in the Financial Highlights. Additionally, the returns and net asset values shown throughout this report are at the Fund level only and do not include variable product issuer charges. If such charges were included, the total returns would be lower.
Invesco V.I. Government Securities Fund
Schedule of Investments
December 31, 2015
| | | | | | | | |
| | | Principal
Amount | | | Value | |
U.S. Government Sponsored Agency Mortgage-Backed Securities–50.02% | |
| Collateralized Mortgage Obligations–20.11% | |
Fannie Mae REMICs,
4.00%, 07/25/2018 to 07/25/2040 | | $ | 4,570,211 | | | $ | 4,797,214 | |
5.00%, 08/25/2019 | | | 1,109,363 | | | | 1,145,952 | |
4.50%, 10/25/2022 | | | 46,991 | | | | 47,015 | |
3.00%, 10/25/2025 to 09/25/2036 | | | 1,415,644 | | | | 1,441,443 | |
2.50%, 03/25/2026 | | | 1,436,217 | | | | 1,452,166 | |
7.00%, 09/18/2027 | | | 437,487 | | | | 485,765 | |
6.50%, 03/25/2032 | | | 1,174,293 | | | | 1,345,260 | |
5.75%, 10/25/2035 | | | 659,671 | | | | 727,960 | |
0.52%, 05/25/2036(a) | | | 4,336,939 | | | | 4,351,336 | |
4.25%, 02/25/2037 | | | 1,877,210 | | | | 1,963,173 | |
0.72%, 03/25/2037 to 03/25/2040(a) | | | 5,347,111 | | | | 5,387,242 | |
0.62%, 06/25/2038(a) | | | 6,939,838 | | | | 6,958,194 | |
6.57%, 06/25/2039(a) | | | 4,760,214 | | | | 5,544,439 | |
0.77%, 02/25/2041(a) | | | 4,853,881 | | | | 4,883,897 | |
0.69%, 05/25/2041(a) | | | 2,791,089 | | | | 2,803,535 | |
0.74%, 11/25/2041(a) | | | 2,080,045 | | | | 2,092,254 | |
Federal Home Loan Bank
5.77%, 03/23/2018 | | | 1,009,869 | | | | 1,081,532 | |
Freddie Mac REMICs,
4.00%, 12/15/2017 to 06/15/2039 | | | 2,989,394 | | | | 3,142,354 | |
5.00%, 02/15/2018 to 04/15/2019 | | | 1,116,819 | | | | 1,145,414 | |
4.50%, 07/15/2018 | | | 315,842 | | | | 325,572 | |
3.00%, 10/15/2018 to 04/15/2026 | | | 3,071,859 | | | | 3,140,502 | |
3.50%, 12/15/2027 | | | 382 | | | | 382 | |
0.70%, 12/15/2035 to 03/15/2040(a) | | | 7,059,025 | | | | 7,103,695 | |
0.50%, 03/15/2036(a) | | | 4,088,030 | | | | 4,117,262 | |
0.54%, 11/15/2036(a) | | | 6,810,198 | | | | 6,790,788 | |
0.60%, 05/15/2037 to 06/15/2037(a) | | | 5,156,071 | | | | 5,184,069 | |
1.06%, 11/15/2039(a) | | | 1,271,184 | | | | 1,298,173 | |
0.65%, 03/15/2040 to 02/15/2042(a) | | | 15,926,878 | | | | 16,011,751 | |
Ginnie Mae REMICs,
6.00%, 01/16/2025 | | | 710,445 | | | | 781,265 | |
4.50%, 01/16/2034 to 09/16/2034 | | | 781,322 | | | | 793,469 | |
5.73%, 08/20/2034(a) | | | 1,658,752 | | | | 1,861,826 | |
4.00%, 12/20/2036 to 02/20/2038 | | | 768,870 | | | | 781,985 | |
5.88%, 01/20/2039(a) | | | 5,687,352 | | | | 6,413,908 | |
1.14%, 09/16/2039(a) | | | 2,027,684 | | | | 2,078,113 | |
4.50%, 07/20/2041(a) | | | 1,264,438 | | | | 1,341,559 | |
1.73%, 09/20/2041(a) | | | 5,565,746 | | | | 5,766,139 | |
Ginnie Mae REMICs, IO,
1.59%, 09/20/2064(a) | | | 10,915,047 | | | | 1,050,573 | |
1.63%, 11/20/2064(a) | | | 7,157,586 | | | | 745,954 | |
1.68%, 12/20/2064(a) | | | 18,419,034 | | | | 1,950,576 | |
| | | | | 118,333,706 | |
| | | | | | | | |
| | | Principal
Amount | | | Value | |
| Federal Deposit Insurance Co. (FDIC)–0.03% | |
Series 2010-S1, Class 1A, Structured Sale Gtd., Floating Rate Notes,
0.79%, 02/25/2048(a)(b) | | $ | 157,461 | | | $ | 157,502 | |
|
| Federal Home Loan Mortgage Corp. (FHLMC)–12.31% | |
Pass Through Ctfs.,
6.50%, 03/01/2016 to 12/01/2035 | | | 4,131,820 | | | | 4,751,663 | |
7.00%, 12/01/2016 to 12/01/2037 | | | 4,862,400 | | | | 5,530,196 | |
6.00%, 04/01/2017 to 07/01/2038 | | | 1,008,281 | | | | 1,087,908 | |
5.00%, 07/01/2018 to 01/01/2040 | | | 2,254,857 | | | | 2,472,145 | |
10.50%, 08/01/2019 | | | 88 | | | | 89 | |
4.50%, 09/01/2020 to 08/01/2041 | | | 13,540,595 | | | | 14,745,822 | |
8.50%, 09/01/2020 to 08/01/2031 | | | 577,698 | | | | 658,043 | |
10.00%, 03/01/2021 | | | 16,049 | | | | 17,300 | |
9.00%, 06/01/2021 to 06/01/2022 | | | 107,796 | | | | 114,608 | |
8.00%, 12/01/2021 to 09/01/2036 | | | 2,017,746 | | | | 2,298,234 | |
7.50%, 09/01/2022 to 06/01/2035 | | | 1,446,885 | | | | 1,649,457 | |
5.50%, 12/01/2022 | | | 622,037 | | | | 659,196 | |
3.50%, 08/01/2026 | | | 1,163,540 | | | | 1,223,590 | |
3.00%, 05/01/2027 | | | 1,863,592 | | | | 1,936,392 | |
7.05%, 05/20/2027 | | | 134,702 | | | | 150,055 | |
6.03%, 10/20/2030 | | | 1,007,476 | | | | 1,152,722 | |
Pass Through Ctfs., ARM,
2.62%, 09/01/2035(a) | | | 7,104,676 | | | | 7,504,406 | |
2.57%, 07/01/2036(a) | | | 5,536,574 | | | | 5,867,066 | |
2.32%, 10/01/2036(a) | | | 3,359,356 | | | | 3,534,641 | |
2.75%, 10/01/2036(a) | | | 227,534 | | | | 241,836 | |
2.84%, 11/01/2037(a) | | | 2,850,930 | | | | 3,017,182 | |
2.66%, 01/01/2038(a) | | | 133,816 | | | | 142,949 | |
2.37%, 06/01/2043(a) | | | 4,782,774 | | | | 4,969,310 | |
2.92%, 02/01/2045(a) | | | 2,922,157 | | | | 2,978,974 | |
2.78%, 08/01/2045(a) | | | 2,514,529 | | | | 2,562,500 | |
3.12%, 09/01/2045(a) | | | 3,106,176 | | | | 3,183,573 | |
| | | | | | | | 72,449,857 | |
|
| Federal National Mortgage Association (FNMA)–13.37% | |
Pass Through Ctfs.,
7.00%, 02/01/2016 to 06/01/2036 | | | 6,486,194 | | | | 7,114,252 | |
6.50%, 03/01/2016 to 11/01/2037 | | | 4,192,622 | | | | 4,668,856 | |
7.50%, 04/01/2017 to 08/01/2037 | | | 6,382,584 | | | | 7,413,115 | |
6.00%, 09/01/2017 to 10/01/2038 | | | 3,245,451 | | | | 3,649,348 | |
5.00%, 11/01/2017 to 12/01/2033 | | | 513,690 | | | | 541,256 | |
8.50%, 11/01/2017 to 08/01/2037 | | | 1,460,701 | | | | 1,679,258 | |
8.00%, 12/01/2017 to 11/01/2037 | | | 4,563,439 | | | | 5,401,711 | |
4.50%, 04/01/2019 to 08/01/2041 | | | 10,217,766 | | | | 10,991,768 | |
5.50%, 03/01/2021 to 05/01/2035 | | | 2,297,472 | | | | 2,623,541 | |
6.75%, 07/01/2024 | | | 515,007 | | | | 588,963 | |
6.95%, 10/01/2025 | | | 21,422 | | | | 22,291 | |
3.50%, 03/01/2027 to 08/01/2027 | | | 13,157,090 | | | | 13,825,013 | |
3.00%, 05/01/2027 to 08/01/2027 | | | 6,025,331 | | | | 6,241,874 | |
See accompanying Notes to Financial Statements which are an integral part of the financial statements.
Invesco V.I. Government Securities Fund
| | | | | | | | |
| | | Principal
Amount | | | Value | |
| Federal National Mortgage Association (FNMA)–(continued) | |
Pass Through Ctfs., ARM,
2.63%, 10/01/2034(a) | | $ | 3,035,390 | | | $ | 3,224,278 | |
2.46%, 05/01/2035(a) | | | 544,005 | | | | 575,400 | |
2.37%, 03/01/2038(a) | | | 148,459 | | | | 157,599 | |
2.79%, 02/01/2042(a) | | | 2,324,086 | | | | 2,405,334 | |
2.29%, 06/01/2043(a) | | | 3,717,929 | | | | 3,744,798 | |
2.26%, 08/01/2043(a) | | | 3,780,781 | | | | 3,837,723 | |
| | | | | 78,706,378 | |
|
Government National Mortgage Association
(GNMA)–4.20% | |
Pass Through Ctfs.,
6.50%, 05/20/2016 to 01/15/2035 | | | 4,810,834 | | | | 5,479,648 | |
7.50%, 03/15/2017 to 10/15/2035 | | | 3,098,066 | | | | 3,573,428 | |
7.00%, 04/15/2017 to 12/15/2036 | | | 1,215,840 | | | | 1,333,962 | |
8.00%, 05/15/2017 to 01/15/2037 | | | 1,681,051 | | | | 1,984,770 | |
10.50%, 09/15/2017 | | | 137 | | | | 137 | |
8.50%, 12/15/2017 to 01/15/2037 | | | 184,559 | | | | 194,307 | |
10.00%, 06/15/2019 | | | 7,092 | | | | 7,531 | |
6.00%, 09/15/2020 to 08/15/2033 | | | 781,172 | | | | 866,969 | |
5.00%, 02/15/2025 | | | 205,494 | | | | 225,207 | |
6.95%, 08/20/2025 to 08/20/2027 | | | 328,815 | | | | 338,191 | |
6.38%, 10/20/2027 to 04/20/2028 | | | 368,030 | | | | 419,618 | |
6.10%, 12/20/2033 | | | 4,935,499 | | | | 5,696,553 | |
3.50%, 10/20/2042 | | | 4,461,084 | | | | 4,598,570 | |
| | | | | 24,718,891 | |
Total U.S. Government Sponsored Agency Mortgage-Backed Securities
(Cost $288,499,534) | | | | 294,366,334 | |
|
Non-U.S. Government Sponsored Agency Securities–19.84% | |
| Collateralized Mortgage Obligations–14.32% | |
Banc of America Commercial Mortgage Trust, Series 2015-UBS7, Class XA, IO Variable Rate Pass Through Ctfs.,
0.94%, 09/15/2048(a) | | | 17,004,375 | | | | 1,096,020 | |
Barclays Bank Commercial Mortgage Securities Trust, Series 2015-RRI, Class D, Floating Rate Pass Through Ctfs., 3.10%, 05/15/2032(a)(b) | | | 2,460,000 | | | | 2,423,495 | |
Citigroup Commercial Mortgage Trust, Series 2014-388G, Class B, Floating Rate Pass Through Ctfs., 1.38%, 06/15/2033(a)(b) | | | 6,100,000 | | | | 5,991,812 | |
Commercial Mortgage Trust,
Series 2013-THL, Class A2, Floating Rate Pass Through Ctfs., 1.33%, 06/08/2030(a)(b) | | | 5,900,000 | | | | 5,894,340 | |
Series 2015-CR23, Class CMB, Variable Rate Pass Through Ctfs., 3.68%, 05/10/2048(a)(b) | | | 4,620,000 | | | | 4,687,883 | |
Series 2015-CR24, Class B,
Variable Rate Pass Through Ctfs., 4.37%, 08/10/2055(a) | | | 6,200,000 | | | | 6,430,145 | |
Credit Suisse Mortgage Capital Trust, Series 2015-TOWN, Class B, Floating Rate Pass Through Ctfs., 2.23%, 03/15/2017(a)(b) | | | 7,100,000 | | | | 7,063,390 | |
| | | | | | | | |
| | | Principal
Amount | | | Value | |
| Collateralized Mortgage Obligations–(continued) | |
La Hipotecaria El Salvadorian Mortgage Trust (El Salvador), Series 2013-1A, Class A, Pass Through Ctfs., 3.50%, 10/25/2041 (Acquired 04/22/2013;
Cost $10,201,863)(b) | | $ | 9,856,872 | | | $ | 10,300,431 | |
La Hipotecaria Panamanian Mortgage Trust (El Salvador), Series 2010-1GA, Class A, Floating Rate Pass Through Ctfs., 2.50%, 09/08/2039
(Acquired 11/05/2010;
Cost $17,575,178)(a)(b) | | | 17,011,667 | | | | 17,581,558 | |
LSTAR Commercial Mortgage Trust, Series 2014-2, Class A2, Pass Through Ctfs., 2.77%, 01/20/2041(b) | | | 6,054,022 | | | | 6,028,690 | |
Towd Point Mortgage Trust,
Series 2015-1, Class AES, Pass Through Ctfs., 3.00%, 10/25/2053(b) | | | 5,069,908 | | | | 5,066,153 | |
Wells Fargo Commercial Mortgage Trust, Series 2015-C28, Class B, Variable Rate Pass Through Ctfs., 4.14%, 05/15/2048(a) | | | 5,900,000 | | | | 5,873,423 | |
Series 2015-C29, Class C,
Variable Rate Pass Through Ctfs., 4.22%, 06/15/2048(a) | | | 6,224,000 | | | | 5,850,731 | |
| | | | | | | | 84,288,071 | |
|
| Bonds & Notes–3.59% | |
Israel Government Agency for International Development (AID) Bond, Unsec. Gtd. Global Bonds, 5.13%, 11/01/2024 | | | 3,800,000 | | | | 4,508,069 | |
Private Export Funding Corp.,
Series BB, Sec. Gtd. Notes, 4.30%, 12/15/2021 | | | 1,540,000 | | | | 1,702,383 | |
Series DD, Sec. Gtd. Notes, 2.13%, 07/15/2016 | | | 5,000,000 | | | | 5,028,968 | |
Series FF, Sec. Gtd. Notes, 1.38%, 02/15/2017 | | | 5,000,000 | | | | 5,008,725 | |
Series HH, Sr. Sec. Gtd. Notes, 1.45%, 08/15/2019 | | | 5,000,000 | | | | 4,909,305 | |
| | | | | | | | 21,157,450 | |
|
| Structured Agency Credit Risk Notes (STACR)–1.93% | |
Freddie Mac,
Series 2014-DN1, Class M2,
Floating Rate STACR® Debt Notes, 2.42%, 02/25/2024(a)(c) | | | 4,300,000 | | | | 4,288,783 | |
Series 2014-DN2, Class M2,
Floating Rate STACR® Debt Notes, 1.87%, 04/25/2024(a)(c) | | | 6,050,000 | | | | 5,950,000 | |
Series 2014-DN4, Class M2,
Floating Rate STACR® Debt Notes, 2.62%, 10/25/2024(a)(c) | | | 1,100,000 | | | | 1,103,565 | |
| | | | | | | | 11,342,348 | |
Total Non-U.S. Government Sponsored Agency Securities
(Cost $116,448,237) | | | | 116,787,869 | |
See accompanying Notes to Financial Statements which are an integral part of the financial statements.
Invesco V.I. Government Securities Fund
| | | | | | | | |
| | | Principal
Amount | | | Value | |
U.S. Treasury Securities–18.89% | |
| U.S. Treasury Bills–0.39%(d)(e) | |
0.06%, 05/26/2016 | | $ | 95,000 | | | $ | 94,853 | |
0.23%, 05/26/2016 | | | 45,000 | | | | 44,930 | |
0.24%, 05/26/2016 | | | 110,000 | | | | 109,830 | |
0.29%, 05/26/2016 | | | 1,830,000 | | | | 1,827,164 | |
0.31%, 05/26/2016 | | | 245,000 | | | | 244,620 | |
| | | | | | | | 2,321,397 | |
|
| U.S. Treasury Notes–14.45% | |
0.63%, 08/31/2017 | | | 3,400,000 | | | | 3,378,496 | |
0.75%, 12/31/2017 | | | 5,000,000 | | | | 4,967,554 | |
0.88%, 01/31/2018 | | | 5,400,000 | | | | 5,374,256 | |
1.13%, 06/15/2018 | | | 7,400,000 | | | | 7,385,635 | |
1.00%, 08/15/2018 | | | 7,300,000 | | | | 7,256,215 | |
1.50%, 12/31/2018 | | | 5,500,000 | | | | 5,526,385 | |
1.63%, 06/30/2019 | | | 4,000,000 | | | | 4,018,634 | |
1.63%, 07/31/2019 | | | 2,700,000 | | | | 2,710,055 | |
1.75%, 09/30/2019 | | | 2,500,000 | | | | 2,517,528 | |
1.38%, 04/30/2020 | | | 2,000,000 | | | | 1,974,269 | |
1.38%, 08/31/2020 | | | 2,000,000 | | | | 1,968,346 | |
2.00%, 09/30/2020 | | | 4,000,000 | | | | 4,044,206 | |
1.75%, 12/31/2020 | | | 8,000,000 | | | | 7,995,128 | |
2.13%, 06/30/2021 | | | 4,500,000 | | | | 4,556,838 | |
2.13%, 08/15/2021 | | | 2,700,000 | | | | 2,732,001 | |
2.00%, 10/31/2021 | | | 2,500,000 | | | | 2,506,984 | |
2.00%, 11/15/2021 | | | 3,300,000 | | | | 3,309,221 | |
2.13%, 06/30/2022 | | | 3,000,000 | | | | 3,014,986 | |
2.00%, 07/31/2022 | | | 7,000,000 | | | | 6,982,476 | |
2.25%, 11/15/2025 | | | 2,800,000 | | | | 2,793,177 | |
| | | | | | | | 85,012,390 | |
|
| U.S. Treasury Bonds–3.07% | |
8.75%, 05/15/2020 | | | 3,500,000 | | | | 4,535,663 | |
7.88%, 02/15/2021 | | | 1,100,000 | | | | 1,423,969 | |
5.38%, 02/15/2031 | | | 3,800,000 | | | | 5,147,934 | |
3.38%, 05/15/2044 | | | 6,000,000 | | | | 6,431,805 | |
3.00%, 05/15/2045 | | | 500,000 | | | | 496,995 | |
| | | | | | | | 18,036,366 | |
|
| U.S. Treasury Inflation — Indexed Bonds–0.49% | |
0.75%, 02/15/2045 | | | 3,282,565 | (f) | | | 2,856,239 | |
|
| U.S. Treasury Inflation — Indexed Notes–0.49% | |
0.38%, 07/15/2025 | | | 3,008,820 | (f) | | | 2,912,183 | |
Total U.S. Treasury Securities
(Cost $110,058,928) | | | | | | | 111,138,575 | |
| | | | | | | | |
| | | Principal
Amount | | | Value | |
U.S. Government Sponsored Agency
Securities–9.53% | |
| Federal Agricultural Mortgage Corp. (FAMC)–3.19% | |
Sr. Unsec. Medium-Term Notes,
2.00%, 07/27/2016 | | $ | 4,000,000 | | | $ | 4,028,854 | |
Series 2007-1, Sec. Gtd. Notes,
5.13%, 04/19/2017(b) | | | 14,000,000 | | | | 14,757,316 | |
| | | | | | | | 18,786,170 | |
|
| Federal Farm Credit Bank (FFCB)–0.46% | |
Unsec. Medium-Term Notes,
5.75%, 12/07/2028 | | | 2,100,000 | | | | 2,681,116 | |
|
| Federal Home Loan Bank (FHLB)–1.74% | |
Unsec. Bonds,
3.38%, 06/12/2020 | | | 6,220,000 | | | | 6,643,467 | |
2.88%, 09/11/2020 | | | 3,455,000 | | | | 3,617,471 | |
| | | | | | | | 10,260,938 | |
|
| Federal Home Loan Mortgage Corp. (FHLMC)–0.86% | |
Unsec. Global Notes,
2.38%, 01/13/2022 | | | 5,000,000 | | | | 5,074,348 | |
|
| Financing Corp (FICO)–0.56% | |
Sec. Bonds,
9.80%, 04/06/2018 | | | 700,000 | | | | 830,803 | |
Series E, Sec. Bonds,
9.65%, 11/02/2018 | | | 1,985,000 | | | | 2,431,936 | |
| | | | | | | | 3,262,739 | |
|
| Tennessee Valley Authority (TVA)–2.72% | |
Sr. Unsec. Global Notes,
4.88%, 12/15/2016 | | | 13,553,000 | | | | 14,072,337 | |
Sr. Unsec. Global Notes,
1.88%, 08/15/2022 | | | 2,000,000 | | | | 1,949,210 | |
| | | | | | | | 16,021,547 | |
Total U.S. Government Sponsored Agency Securities
(Cost $54,705,679) | | | | | | | 56,086,858 | |
| | |
| | | Shares | | | | |
Money Market Funds–1.11% | |
Government & Agency Portfolio–Institutional Class, 0.13%
(Cost $6,528,420)(g) | | | 6,528,420 | | | | 6,528,420 | |
TOTAL INVESTMENTS–99.39%
(Cost $576,240,798) | | | | | | | 584,908,056 | |
OTHER ASSETS LESS LIABILITIES–0.61% | | | | 3,573,192 | |
NET ASSETS–100.00% | | | | | | $ | 588,481,248 | |
See accompanying Notes to Financial Statements which are an integral part of the financial statements.
Invesco V.I. Government Securities Fund
Investment Abbreviations:
| | |
| ARM | | – Adjustable Rate Mortgage |
| Ctfs. | | – Certificates |
| Gtd. | | – Guaranteed |
| IO | | – Interest Only |
| REMICs | | – Real Estate Mortgage Investment Conduits |
| Sec. | | – Secured |
| Sr. | | – Senior |
| Unsec. | | – Unsecured |
Notes to Schedule of Investments:
| (a) | Interest or dividend rate is redetermined periodically. Rate shown is the rate in effect on December 31, 2015. |
| (b) | Security purchased or received in a transaction exempt from registration under the Securities Act of 1933, as amended (the “1933 Act”). The security may be resold pursuant to an exemption from registration under the 1933 Act, typically to qualified institutional buyers. The aggregate value of these securities at December 31, 2015 was $79,952,570, which represented 13.59% of the Fund’s Net Assets. |
| (c) | Principal payments are determined by the delinquency and principal payment experience on the STACR® reference pool. Freddie Mac transfers credit risk from the mortgages in the reference pool to credit investors who invest in the STACR® debt notes. |
| (d) | Security traded on a discount basis. The interest rate shown represents the discount rate at the time of purchase by the Fund. |
| (e) | All or a portion of the value was pledged as collateral to cover margin requirements for open futures contracts. See Note 1K and Note 4. |
| (f) | Principal amount of security and interest payments are adjusted for inflation. See Note 1I. |
| (g) | The money market fund and the Fund are affiliated by having the same investment adviser. The rate shown is the 7-day SEC standardized yield as of December 31, 2015. |
See accompanying Notes to Financial Statements which are an integral part of the financial statements.
Invesco V.I. Government Securities Fund
Statement of Assets and Liabilities
December 31, 2015
Statement of Operations
For the year ended December 31, 2015
| | | | |
Assets: | |
Investments, at value (Cost $569,712,378) | | $ | 578,379,636 | |
Investments in affiliated money market funds, at value and cost | | | 6,528,420 | |
Total investments, at value (Cost $576,240,798) | | | 584,908,056 | |
Cash | | | 47,813 | |
Receivable for: | | | | |
Short positions covered | | | 133,867 | |
Investments sold | | | 16,743 | |
Variation margin — futures | | | 424,513 | |
Fund shares sold | | | 1,007,997 | |
Dividends and interest | | | 2,019,725 | |
Principal paydowns | | | 669,670 | |
Investment for trustee deferred compensation and retirement plans | | | 217,072 | |
Other assets | | | 10,827 | |
Total assets | | | 589,456,283 | |
| |
Liabilities: | | | | |
Payable for: | | | | |
Fund shares reacquired | | | 243,474 | |
Accrued fees to affiliates | | | 483,883 | |
Accrued trustees’ and officers’ fees and benefits | | | 178 | |
Trustee deferred compensation and retirement plans | | | 247,500 | |
Total liabilities | | | 975,035 | |
Net assets applicable to shares outstanding | | $ | 588,481,248 | |
| |
Net assets consist of: | | | | |
Shares of beneficial interest | | $ | 589,458,017 | |
Undistributed net investment income | | | 11,306,883 | |
Undistributed net realized gain (loss) | | | (21,231,111 | ) |
Net unrealized appreciation | | | 8,947,459 | |
| | | $ | 588,481,248 | |
|
Net Assets: | |
Series I | | $ | 393,089,700 | |
Series II | | $ | 195,391,548 | |
|
Shares outstanding, $0.001 par value per share,
with an unlimited number of shares authorized: | |
Series I | | | 34,122,078 | |
Series II | | | 17,108,388 | |
Series I: | | | | |
Net asset value per share | | $ | 11.52 | |
Series II: | | | | |
Net asset value per share | | $ | 11.42 | |
| | | | |
Investment income: | |
Interest | | $ | 14,139,983 | |
Dividends from affiliated money market funds | | | 3,372 | |
Total investment income | | | 14,143,355 | |
| |
Expenses: | | | | |
Advisory fees | | | 3,005,040 | |
Administrative services fees | | | 1,698,764 | |
Custodian fees | | | 23,353 | |
Distribution fees — Series II | | | 501,090 | |
Transfer agent fees | | | 23,347 | |
Trustees’ and officers’ fees and benefits | | | 35,806 | |
Other | | | 111,449 | |
Total expenses | | | 5,398,849 | |
Less: Fees waived | | | (2,458 | ) |
Net expenses | | | 5,396,391 | |
Net investment income | | | 8,746,964 | |
| |
Realized and unrealized gain (loss) from: | | | | |
Net realized gain from: | | | | |
Investment securities | | | 1,566,774 | |
Futures contracts | | | 1,475,129 | |
Securities sold short | | | 83,601 | |
Swap agreements | | | 206,340 | |
| | | | 3,331,844 | |
Change in net unrealized appreciation (depreciation) of: | | | | |
Investment securities | | | (7,011,751 | ) |
Futures contracts | | | (2,874,753 | ) |
| | | | (9,886,504 | ) |
Net realized and unrealized gain (loss) | | | (6,554,660 | ) |
Net increase in net assets resulting from operations | | $ | 2,192,304 | |
See accompanying Notes to Financial Statements which are an integral part of the financial statements.
Invesco V.I. Government Securities Fund
Statement of Changes in Net Assets
For the years ended December 31, 2015 and 2014
| | | | | | | | |
| | | 2015 | | | 2014 | |
Operations: | | | | | | | | |
Net investment income | | $ | 8,746,964 | | | $ | 9,666,678 | |
Net realized gain | | | 3,331,844 | | | | 9,333,238 | |
Change in net unrealized appreciation (depreciation) | | | (9,886,504 | ) | | | 11,266,181 | |
Net increase in net assets resulting from operations | | | 2,192,304 | | | | 30,266,097 | |
| | |
Distributions to shareholders from net investment income: | | | | | | | | |
Series I | | | (9,684,904 | ) | | | (16,177,318 | ) |
Series ll | | | (3,821,202 | ) | | | (6,330,149 | ) |
Total distributions from net investment income | | | (13,506,106 | ) | | | (22,507,467 | ) |
| | |
Share transactions–net: | | | | | | | | |
Series l | | | (73,711,835 | ) | | | (96,681,441 | ) |
Series ll | | | (13,837,280 | ) | | | (16,660,069 | ) |
Net increase (decrease) in net assets resulting from share transactions | | | (87,549,115 | ) | | | (113,341,510 | ) |
Net increase (decrease) in net assets | | | (98,862,917 | ) | | | (105,582,880 | ) |
| | |
Net assets: | | | | | | | | |
Beginning of year | | | 687,344,165 | | | | 792,927,045 | |
End of year (includes undistributed net investment income of $11,306,883 and $12,310,425, respectively) | | $ | 588,481,248 | | | $ | 687,344,165 | |
Notes to Financial Statements
December 31, 2015
NOTE 1—Significant Accounting Policies
Invesco V.I. Government Securities Fund (the “Fund”) is a series portfolio of AIM Variable Insurance Funds (Invesco Variable Insurance Funds) (the “Trust”). The Trust is a Delaware statutory trust registered under the Investment Company Act of 1940, as amended (the “1940 Act”), as an open-end series management investment company consisting of twenty-four separate portfolios, (each constituting a “Fund”). The assets, liabilities and operations of each portfolio are accounted for separately. Information presented in these financial statements pertains only to the Fund. Matters affecting each Fund or class will be voted on exclusively by the shareholders of such Fund or class. Current Securities and Exchange Commission (“SEC”) guidance, however, requires participating insurance companies offering separate accounts to vote shares proportionally in accordance with the instructions of the contract owners whose investments are funded by shares of each Fund or class.
The Fund’s investment objective is total return, comprised of current income and capital appreciation.
The Fund currently offers two classes of shares, Series I and Series II, both of which are offered to insurance company separate accounts funding variable annuity contracts and variable life insurance policies (“variable products”).
The following is a summary of the significant accounting policies followed by the Fund in the preparation of its financial statements.
| A. | Security Valuations — Securities, including restricted securities, are valued according to the following policy. |
Debt obligations (including convertible securities) and unlisted equities are fair valued using an evaluated quote provided by an independent pricing service. Evaluated quotes provided by the pricing service may be determined without exclusive reliance on quoted prices, and may reflect appropriate factors such as institution-size trading in similar groups of securities, developments related to specific securities, dividend rate (for unlisted equities), yield (for debt obligations), quality, type of issue, coupon rate (for debt obligations), maturity (for debt obligations), individual trading characteristics and other market data. Debt obligations are subject to interest rate and credit risks. In addition, all debt obligations involve some risk of default with respect to interest and/or principal payments.
A security listed or traded on an exchange (except convertible securities) is valued at its last sales price or official closing price as of the close of the customary trading session on the exchange where the security is principally traded, or lacking any sales or official closing price on a particular day, the security may be valued at the closing bid price on that day. Securities traded in the over-the-counter market are valued based on prices furnished by independent pricing services or market makers. When such securities are valued by an independent pricing service they may be considered fair valued. Futures contracts are valued at the final settlement price set by an exchange on which they are principally traded. Listed options are valued at the mean between the last bid and asked prices from the exchange on which they are principally traded. Options not listed on an exchange are valued by an independent source at the mean between the last bid and asked prices. For purposes of determining net asset value (“NAV”) per share, futures and option contracts generally are valued 15 minutes after the close of the customary trading session of the New York Stock Exchange (“NYSE”).
Investments in open-end and closed-end registered investment companies that do not trade on an exchange are valued at the end-of-day net asset value per share. Investments in open-end and closed-end registered investment companies that trade on an exchange are valued at the last sales price or official closing price as of the close of the customary trading session on the exchange where the security is principally traded.
Invesco V.I. Government Securities Fund
Swap agreements are fair valued using an evaluated quote, if available, provided by an independent pricing service. Evaluated quotes provided by the pricing service are valued based on a model which may include end-of-day net present values, spreads, ratings, industry, company performance and returns of referenced assets.
Foreign securities’ (including foreign exchange contracts) prices are converted into U.S. dollar amounts using the applicable exchange rates as of the close of the NYSE. If market quotations are available and reliable for foreign exchange-traded equity securities, the securities will be valued at the market quotations. Because trading hours for certain foreign securities end before the close of the NYSE, closing market quotations may become unreliable. If between the time trading ends on a particular security and the close of the customary trading session on the NYSE, events occur that the Adviser determines are significant and make the closing price unreliable, the Fund may fair value the security. If the event is likely to have affected the closing price of the security, the security will be valued at fair value in good faith using procedures approved by the Board of Trustees. Adjustments to closing prices to reflect fair value may also be based on a screening process of an independent pricing service to indicate the degree of certainty, based on historical data, that the closing price in the principal market where a foreign security trades is not the current value as of the close of the NYSE. Foreign securities’ prices meeting the approved degree of certainty that the price is not reflective of current value will be priced at the indication of fair value from the independent pricing service. Multiple factors may be considered by the independent pricing service in determining adjustments to reflect fair value and may include information relating to sector indices, American Depositary Receipts and domestic and foreign index futures. Foreign securities may have additional risks including exchange rate changes, potential for sharply devalued currencies and high inflation, political and economic upheaval, the relative lack of issuer information, relatively low market liquidity and the potential lack of strict financial and accounting controls and standards.
Securities for which market prices are not provided by any of the above methods may be valued based upon quotes furnished by independent sources. The last bid price may be used to value equity securities. The mean between the last bid and asked prices is used to value debt obligations, including corporate loans.
Securities for which market quotations are not readily available or became unreliable are valued at fair value as determined in good faith by or under the supervision of the Trust’s officers following procedures approved by the Board of Trustees. Issuer specific events, market trends, bid/asked quotes of brokers and information providers and other market data may be reviewed in the course of making a good faith determination of a security’s fair value.
The Fund may invest in securities that are subject to interest rate risk, meaning the risk that the prices will generally fall as interest rates rise and, conversely, the prices will generally rise as interest rates fall. Specific securities differ in their sensitivity to changes in interest rates depending on their individual characteristics. Changes in interest rates may result in increased market volatility, which may affect the value and/or liquidity of certain Fund investments.
Valuations change in response to many factors including the historical and prospective earnings of the issuer, the value of the issuer’s assets, general economic conditions, interest rates, investor perceptions and market liquidity. Because of the inherent uncertainties of valuation, the values reflected in the financial statements may materially differ from the value received upon actual sale of those investments.
| B. | Securities Transactions and Investment Income — Securities transactions are accounted for on a trade date basis. Realized gains or losses on sales are computed on the basis of specific identification of the securities sold. Interest income (net of withholding tax, if any) is recorded on the accrual basis from settlement date. Paydown gains and losses on mortgage and asset-backed securities are recorded as adjustments to interest income. Dividend income (net of withholding tax, if any) is recorded on the ex-dividend date. Bond premiums and discounts are amortized and/or accreted for financial reporting purposes. |
The Fund may periodically participate in litigation related to Fund investments. As such, the Fund may receive proceeds from litigation settlements. Any proceeds received are included in the Statement of Operations as realized gain (loss) for investments no longer held and as unrealized gain (loss) for investments still held.
Brokerage commissions and mark ups are considered transaction costs and are recorded as an increase to the cost basis of securities purchased and/or a reduction of proceeds on a sale of securities. Such transaction costs are included in the determination of net realized and unrealized gain (loss) from investment securities reported in the Statement of Operations and the Statement of Changes in Net Assets and the net realized and unrealized gains (losses) on securities per share in the Financial Highlights. Transaction costs are included in the calculation of the Fund’s net asset value and, accordingly, they reduce the Fund’s total returns. These transaction costs are not considered operating expenses and are not reflected in net investment income reported in the Statement of Operations and the Statement of Changes in Net Assets, or the net investment income per share and the ratios of expenses and net investment income reported in the Financial Highlights, nor are they limited by any expense limitation arrangements between the Fund and the investment adviser.
The Fund allocates income and realized and unrealized capital gains and losses to a class based on the relative net assets of each class.
| C. | Country Determination — For the purposes of making investment selection decisions and presentation in the Schedule of Investments, the investment adviser may determine the country in which an issuer is located and/or credit risk exposure based on various factors. These factors include the laws of the country under which the issuer is organized, where the issuer maintains a principal office, the country in which the issuer derives 50% or more of its total revenues and the country that has the primary market for the issuer’s securities, as well as other criteria. Among the other criteria that may be evaluated for making this determination are the country in which the issuer maintains 50% or more of its assets, the type of security, financial guarantees and enhancements, the nature of the collateral and the sponsor organization. Country of issuer and/or credit risk exposure has been determined to be the United States of America, unless otherwise noted. |
| D. | Distributions — Distributions from net investment income and net realized capital gain, if any, are generally declared and paid to separate accounts of participating insurance companies annually and recorded on the ex-dividend date. |
| E. | Federal Income Taxes — The Fund intends to comply with the requirements of Subchapter M of the Internal Revenue Code of 1986, as amended (the “Internal Revenue Code”), necessary to qualify as a regulated investment company and to distribute substantially all of the Fund’s taxable earnings to shareholders. As such, the Fund will not be subject to federal income taxes on otherwise taxable income (including net realized capital gain) that is distributed to shareholders. Therefore, no provision for federal income taxes is recorded in the financial statements. |
The Fund recognizes the tax benefits of uncertain tax positions only when the position is more likely than not to be sustained. Management has analyzed the Fund’s uncertain tax positions and concluded that no liability for unrecognized tax benefits should be recorded related to uncertain tax positions. Management is not aware of any tax positions for which it is reasonably possible that the total amounts of unrecognized tax benefits will change materially in the next 12 months.
Invesco V.I. Government Securities Fund
| F. | Expenses — Fees provided for under the Rule 12b-1 plan of a particular class of the Fund and which are directly attributable to that class are charged to the operations of such class. All other expenses are allocated among the classes based on relative net assets. |
| G. | Accounting Estimates — The preparation of financial statements in conformity with accounting principles generally accepted in the United States of America (“GAAP”) requires management to make estimates and assumptions that affect the reported amounts of assets and liabilities at the date of the financial statements and the reported amounts of revenues and expenses during the reporting period including estimates and assumptions related to taxation. Actual results could differ from those estimates by a significant amount. In addition, the Fund monitors for material events or transactions that may occur or become known after the period-end date and before the date the financial statements are released to print. |
| H. | Indemnifications — Under the Trust’s organizational documents, each Trustee, officer, employee or other agent of the Trust is indemnified against certain liabilities that may arise out of the performance of their duties to the Fund. Additionally, in the normal course of business, the Fund enters into contracts, including the Fund’s servicing agreements, that contain a variety of indemnification clauses. The Fund’s maximum exposure under these arrangements is unknown as this would involve future claims that may be made against the Fund that have not yet occurred. The risk of material loss as a result of such indemnification claims is considered remote. |
| I. | Treasury Inflation-Protected Securities — The Fund may invest in Treasury Inflation-Protected Securities (“TIPS”). TIPS are fixed income securities whose principal value is periodically adjusted to the rate of inflation. The principal value of TIPS will be adjusted upward or downward, and any increase or decrease in the principal amount of TIPS will be included as interest income in the Statement of Operations, even though investors do not receive their principal until maturity. |
| J. | Securities Sold Short — The Fund may enter into short sales of securities which it concurrently holds (“covered”) or for which it holds no corresponding position (“not covered”). Securities sold short represent a liability of the Fund to acquire specific securities at prevailing market prices at a future date in order to satisfy the obligation to deliver the securities sold. The liability is recorded on the books of the Fund at the market value of the common stock determined each day in accordance with the Fund’s security valuations policy. The Fund will incur a loss if the price of the security increases between the date of short sale and the date on which the Fund replaces the borrowed security. The Fund realizes a gain if the price of the security declines between those dates. For positions not covered, there is no ceiling on the ultimate price paid for the securities to cover the short position and therefore, the loss could exceed the amount of proceeds received. |
The Fund is required to segregate cash or securities as collateral in margin accounts with the broker at a level that is equal to the obligation to the broker who delivered such securities to the buyer on behalf of the Fund. The short stock rebate presented in the Statement of Operations represents the net income earned on short sale proceeds held on deposit with the broker and margin interest earned or incurred on short sale transactions. The Fund may also earn or incur margin interest on short sale transactions. Margin interest is the income earned (or expenses incurred) as a result of the market value of securities sold short being less than (or greater than) the proceeds received on the short sales. Margin interest earned is shown in the Statement of Operations as Interest and margin interest expenses incurred are shown in the Statement of Operations as Interest, facilities and maintenance fees.
| K. | Futures Contracts — The Fund may enter into futures contracts to manage exposure to interest rate, equity and market price movements and/or currency risks. A futures contract is an agreement between two parties (“Counterparties”) to purchase or sell a specified underlying security, currency or commodity (or delivery of a cash settlement price, in the case of an index future) for a fixed price at a future date. The Fund currently invests only in exchange-traded futures and they are standardized as to maturity date and underlying financial instrument. Initial margin deposits required upon entering into futures contracts are satisfied by the segregation of specific securities or cash as collateral at the futures commission merchant (broker). During the period the futures contracts are open, changes in the value of the contracts are recognized as unrealized gains or losses by recalculating the value of the contracts on a daily basis. Subsequent or variation margin payments are received or made depending upon whether unrealized gains or losses are incurred. These amounts are reflected as receivables or payables on the Statement of Assets and Liabilities. When the contracts are closed or expire, the Fund recognizes a realized gain or loss equal to the difference between the proceeds from, or cost of, the closing transaction and the Fund’s basis in the contract. The net realized gain (loss) and the change in unrealized gain (loss) on futures contracts held during the period is included on the Statement of Operations. The primary risks associated with futures contracts are market risk and the absence of a liquid secondary market. If the Fund were unable to liquidate a futures contract and/or enter into an offsetting closing transaction, the Fund would continue to be subject to market risk with respect to the value of the contracts and continue to be required to maintain the margin deposits on the futures contracts. Futures contracts have minimal Counterparty risk since the exchange’s clearinghouse, as Counterparty to all exchange-traded futures, guarantees the futures against default. Risks may exceed amounts recognized in the Statement of Assets and Liabilities. |
| L. | Dollar Rolls and Forward Commitment Transactions — The Fund may enter into dollar roll transactions to enhance the Fund’s performance. The Fund executes its dollar roll transactions in the to be announced (“TBA”) market whereby the Fund makes a forward commitment to purchase a security and, instead of accepting delivery, the position is offset by the sale of the security with a simultaneous agreement to repurchase at a future date. |
The Fund accounts for dollar roll transactions as purchases and sales and realizes gains and losses on these transactions. These transactions increase the Fund’s portfolio turnover rate. The Fund will segregate liquid assets in an amount equal to its dollar roll commitments. Dollar roll transactions are considered borrowings under the 1940 Act.
Dollar roll transactions involve the risk that a Counterparty to the transaction may fail to complete the transaction. If this occurs, the Fund may lose the opportunity to purchase or sell the security at the agreed upon price. Dollar roll transactions also involve the risk that the value of the securities retained by the Fund may decline below the price of the securities that the Fund has sold but is obligated to purchase under the agreement.
| M. | Put Options Purchased — The Fund may purchase put options including options on securities indexes, or foreign currency and/or futures contracts. By purchasing a put option, the Fund obtains the right (but not the obligation) to sell the option’s underlying instrument at a fixed strike price. In return for this right, the Fund pays an option premium. The option’s underlying instrument may be a security, securities index, or a futures contract. |
Additionally, the Fund may enter into an option on a swap agreement, also called a “swaption”. A swaption is an option that gives the buyer the right, but not the obligation, to enter into a swap on a future date in exchange for paying a market-based premium. A receiver swaption gives the
Invesco V.I. Government Securities Fund
owner the right to receive the total return of a specified asset, reference rate or index. Swaptions also include options that allow an existing swap to be terminated or extended by one of the Counterparties.
Put options may be used by the Fund to hedge securities it owns by locking in a minimum price at which the Fund can sell. If security prices fall, the put option could be exercised to offset all or a portion of the Fund’s resulting losses. At the same time, because the maximum the Fund has at risk is the cost of the option, purchasing put options does not eliminate the potential for the Fund to profit from an increase in the value of the securities hedged. Realized and unrealized gains and losses on these contracts are included in the Statement of Operations as Net realized gain from Investment securities. A risk in buying an option is that the Fund pays a premium whether or not the option is exercised. In addition, there can be no assurance that a liquid secondary market will exist for any option purchased.
| N. | Swap Agreements — The Fund may enter into various swap transactions, including interest rate, total return, index, currency and credit default swap contracts (“CDS”) for investment purposes or to manage interest rate, currency or credit risk. Such transactions are agreements between two parties (“Counterparties”). A swap agreement may be negotiated bilaterally and traded over-the-counter (“OTC”) between two parties (“uncleared/OTC”) or, in some instances, must be transacted through a future commission merchant (“FCM”) and cleared through a clearinghouse that serves as a central Counterparty (“centrally cleared swap”). These agreements may contain among other conditions, events of default and termination events, and various covenants and representations such as provisions that require the Fund to maintain a pre-determined level of net assets, and/or provide limits regarding the decline of the Fund’s NAV over specific periods of time. If the Fund were to trigger such provisions and have open derivative positions at that time, the Counterparty may be able to terminate such agreement and request immediate payment in an amount equal to the net liability positions, if any. |
Interest rate, total return, index, and currency swap agreements are two-party contracts entered into primarily to exchange the returns (or differentials in rates of returns) earned or realized on particular predetermined investments or instruments. The gross returns to be exchanged or “swapped” between the parties are calculated with respect to a notional amount, i.e., the return on or increase in value of a particular dollar amount invested at a particular interest rate or return of an underlying asset, in a particular foreign currency, or in a “basket” of securities representing a particular index.
In a centrally cleared swap, the Fund’s ultimate Counterparty is a central clearinghouse. The Fund initially will enter into centrally cleared swaps through an executing broker. When a fund enters into a centrally cleared swap, it must deliver to the central Counterparty (via the FCM) an amount referred to as “initial margin.” Initial margin requirements are determined by the central Counterparty, but an FCM may require additional initial margin above the amount required by the central Counterparty. Initial margin deposits required upon entering into centrally cleared swaps are satisfied by cash or securities as collateral at the FCM. Securities deposited as initial margin are designated on the Schedule of Investments and cash deposited is recorded on the Statement of Assets and Liabilities. During the term of a cleared swap agreement, a “variation margin” amount may be required to be paid by the Fund or may be received by the Fund, based on the daily change in price of the underlying reference instrument subject to the swap agreement and is recorded as a receivable or payable for variation margin in the Statement of Assets and Liabilities until the centrally cleared swap is terminated at which time a realized gain or loss is recorded.
A CDS is an agreement between Counterparties to exchange the credit risk of an issuer. A buyer of a CDS is said to buy protection by paying a fixed payment over the life of the agreement and in some situations an upfront payment to the seller of the CDS. If a defined credit event occurs (such as payment default or bankruptcy), the Fund as a protection buyer would cease paying its fixed payment, the Fund would deliver eligible bonds issued by the reference entity to the seller, and the seller would pay the full notional value, or the “par value”, of the referenced obligation to the Fund. A seller of a CDS is said to sell protection and thus would receive a fixed payment over the life of the agreement and an upfront payment, if applicable. If a credit event occurs, the Fund as a protection seller would cease to receive the fixed payment stream, the Fund would pay the buyer “par value” or the full notional value of the referenced obligation, and the Fund would receive the eligible bonds issued by the reference entity. In turn, these bonds may be sold in order to realize a recovery value. Alternatively, the seller of the CDS and its Counterparty may agree to net the notional amount and the market value of the bonds and make a cash payment equal to the difference to the buyer of protection. If no credit event occurs, the Fund receives the fixed payment over the life of the agreement. As the seller, the Fund would effectively add leverage to its portfolio because, in addition to its total net assets, the Fund would be subject to investment exposure on the notional amount of the CDS. In connection with these agreements, cash and securities may be identified as collateral in accordance with the terms of the respective swap agreements to provide assets of value and recourse in the event of default under the swap agreement or bankruptcy/insolvency of a party to the swap agreement. If a Counterparty becomes bankrupt or otherwise fails to perform its obligations due to financial difficulties, the Fund may experience significant delays in obtaining any recovery in a bankruptcy or other reorganization proceeding. The Fund may obtain only limited recovery or may obtain no recovery in such circumstances. The Fund’s maximum risk of loss from Counterparty risk, either as the protection seller or as the protection buyer, is the value of the contract. The risk may be mitigated by having a master netting arrangement between the Fund and the Counterparty and by the designation of collateral by the Counterparty to cover the Fund’s exposure to the Counterparty.
Implied credit spreads represent the current level at which protection could be bought or sold given the terms of the existing CDS contract and serve as an indicator of the current status of the payment/performance risk of the CDS. An implied spread that has widened or increased since entry into the initial contract may indicate a deteriorating credit profile and increased risk of default for the reference entity. A declining or narrowing spread may indicate an improving credit profile or decreased risk of default for the reference entity. Alternatively, credit spreads may increase or decrease reflecting the general tolerance for risk in the credit markets.
An interest rate swap is an agreement between Counterparties pursuant to which the parties exchange a floating rate payment for a fixed rate payment based on a specified notional amount.
Changes in the value of centrally cleared and OTC swap agreements are recognized as unrealized gains (losses) in the Statement of Operations by “marking to market” on a daily basis to reflect the value of the swap agreement at the end of each trading day. Payments received or paid at the beginning of the agreement are reflected as such on the Statement of Assets and Liabilities and may be referred to as upfront payments. The Fund accrues for the fixed payment stream and amortizes upfront payments, if any, on swap agreements on a daily basis with the net amount, recorded as a component of realized gain (loss) on the Statement of Operations. A liquidation payment received or made at the termination of a swap agreement is recorded as realized gain (loss) on the Statement of Operations. The Fund segregates liquid securities having a value at least equal to the amount of the potential obligation of a Fund under any swap transaction. Entering into these agreements involves, to varying degrees, lack of liquidity and elements of credit, market, and Counterparty risk in excess of amounts recognized on the Statement of Assets and
Invesco V.I. Government Securities Fund
Liabilities. Such risks involve the possibility that a swap is difficult to sell or liquidate; the Counterparty does not honor its obligations under the agreement and unfavorable interest rates and market fluctuations. It is possible that developments in the swaps market, including potential government regulation, could adversely affect the Fund’s ability to terminate existing swap agreements or to realize amounts to be received under such agreements. A short position in a security poses more risk than holding the same security long. As there is no limit on how much the price of the security can increase, the Fund’s exposure is unlimited.
| O. | Other Risks — The Fund may invest in obligations issued by agencies and instrumentalities of the U.S. Government that may vary in the level of support they receive from the government. The government may choose not to provide financial support to government sponsored agencies or instrumentalities if it is not legally obligated to do so. In this case, if the issuer defaulted, the Fund may not be able to recover its investment in such issuer from the U.S. Government. Many securities purchased by the Fund are not guaranteed by the U.S. Government. |
| P. | Collateral — To the extent the Fund has designated or segregated a security as collateral and that security is subsequently sold, it is the Fund’s practice to replace such collateral no later than the next business day. |
NOTE 2—Advisory Fees and Other Fees Paid to Affiliates
The Trust has entered into a master investment advisory agreement with Invesco Advisers, Inc. (the “Adviser” or “Invesco”). Under the terms of the investment advisory agreement, the Fund pays an advisory fee to the Adviser based on the annual rate of the Fund’s average daily net assets as follows:
| | | | |
| Average Daily Net Assets | | Rate | |
First $250 million | | | 0.50% | |
Over $250 million | | | 0.45% | |
For the year ended December 31, 2015, the effective advisory fees incurred by the Fund was 0.47%.
Under the terms of a master sub-advisory agreement between the Adviser and each of Invesco Asset Management Deutschland GmbH, Invesco Asset Management Limited, Invesco Asset Management (Japan) Limited, Invesco Hong Kong Limited, Invesco Senior Secured Management, Inc. and Invesco Canada Ltd. (collectively, the “Affiliated Sub-Advisers”) the Adviser, not the Fund, may pay 40% of the fees paid to the Adviser to any such Affiliated Sub-Adviser(s) that provide(s) discretionary investment management services to the Fund based on the percentage of assets allocated to such Affiliated Sub-Adviser(s).
The Adviser has contractually agreed, through at least June 30, 2016, to waive advisory fees and/or reimburse expenses of all shares to the extent necessary to limit total annual fund operating expenses after fee waivers and/or expense reimbursements (excluding certain items discussed below) of Series I shares to 1.50% and Series II shares to 1.75% of average daily net assets. In determining the Adviser’s obligation to waive advisory fees and/or reimburse expenses, the following expenses are not taken into account, and could cause the total annual fund operating expenses after fee waivers and/or expense reimbursements to exceed the numbers reflected above: (1) interest; (2) taxes; (3) dividend expense on short sales; (4) extraordinary or non-routine items, including litigation expenses; and (5) expenses that the Fund has incurred but did not actually pay because of an expense offset arrangement. Unless Invesco continues the fee waiver agreement, it will terminate on June 30, 2016. The fee waiver agreement cannot be terminated during its term. The Adviser did not waive fees and/or reimburse expenses during the period under this expense limitation.
Further, the Adviser has contractually agreed, through at least June 30, 2017, to waive the advisory fee payable by the Fund in an amount equal to 100% of the net advisory fees the Adviser receives from the affiliated money market funds on investments by the Fund of uninvested cash in such affiliated money market funds.
For the year ended December 31, 2015, the Adviser waived advisory fees of $2,458.
The Trust has entered into a master administrative services agreement with Invesco pursuant to which the Fund has agreed to pay Invesco a fee for costs incurred in providing accounting services and fund administrative services to the Fund and to reimburse Invesco for administrative services fees paid to insurance companies that have agreed to provide services to the participants of separate accounts. These administrative services provided by the insurance companies may include, among other things: the printing of prospectuses, financial reports and proxy statements and the delivery of the same to existing participants; the maintenance of master accounts; the facilitation of purchases and redemptions requested by the participants; and the servicing of participants’ accounts. Pursuant to such agreement, for the year ended December 31, 2015, Invesco was paid $152,202 for accounting and fund administrative services and reimbursed $1,546,562 for services provided by insurance companies.
The Trust has entered into a transfer agency and service agreement with Invesco Investment Services, Inc. (“IIS”) pursuant to which the Fund has agreed to pay IIS a fee for providing transfer agency and shareholder services to the Fund and reimburse IIS for certain expenses incurred by IIS in the course of providing such services. For the year ended December 31, 2015, expenses incurred under the agreement are shown in the Statement of Operations as Transfer agent fees.
The Trust has entered into a master distribution agreement with Invesco Distributors, Inc. (“IDI”) to serve as the distributor for the Fund. The Trust has adopted a plan pursuant to Rule 12b-1 under the 1940 Act with respect to the Fund’s Series II shares (the “Plan”). The Fund, pursuant to the Plan, pays IDI compensation at the annual rate of 0.25% of the Fund’s average daily net assets of Series II shares. Of the Plan payments, up to 0.25% of the average daily net assets of the Series II shares may be paid to insurance companies who furnish continuing personal shareholder services to customers who purchase and own Series II shares of the Fund. For the year ended December 31, 2015, expenses incurred under the Plan are detailed in the Statement of Operations as Distribution fees.
Certain officers and trustees of the Trust are officers and directors of the Adviser, IIS and/or IDI.
Invesco V.I. Government Securities Fund
NOTE 3—Additional Valuation Information
GAAP defines fair value as the price that would be received to sell an asset or paid to transfer a liability in an orderly transaction between market participants at the measurement date, under current market conditions. GAAP establishes a hierarchy that prioritizes the inputs to valuation methods, giving the highest priority to readily available unadjusted quoted prices in an active market for identical assets (Level 1) and the lowest priority to significant unobservable inputs (Level 3), generally when market prices are not readily available or are unreliable. Based on the valuation inputs, the securities or other investments are tiered into one of three levels. Changes in valuation methods may result in transfers in or out of an investment’s assigned level:
| | Level 1 — | Prices are determined using quoted prices in an active market for identical assets. |
| | Level 2 — | Prices are determined using other significant observable inputs. Observable inputs are inputs that other market participants may use in pricing a security. These may include quoted prices for similar securities, interest rates, prepayment speeds, credit risk, yield curves, loss severities, default rates, discount rates, volatilities and others. |
| | Level 3 — | Prices are determined using significant unobservable inputs. In situations where quoted prices or observable inputs are unavailable (for example, when there is little or no market activity for an investment at the end of the period), unobservable inputs may be used. Unobservable inputs reflect the Fund’s own assumptions about the factors market participants would use in determining fair value of the securities or instruments and would be based on the best available information. |
The following is a summary of the tiered valuation input levels, as of December 31, 2015. The level assigned to the securities valuations may not be an indication of the risk or liquidity associated with investing in those securities. Because of the inherent uncertainties of valuation, the values reflected in the financial statements may materially differ from the value received upon actual sale of those investments.
| | | | | | | | | | | | | | | | |
| | | Level 1 | | | Level 2 | | | Level 3 | | | Total | |
Equity Securities | | $ | 6,528,420 | | | $ | — | | | $ | — | | | $ | 6,528,420 | |
U.S. Treasury Securities | | | — | | | | 111,138,575 | | | | — | | | | 111,138,575 | |
U.S. Government Sponsored Agency Securities | | | — | | | | 350,453,192 | | | | — | | | | 350,453,192 | |
Structured Agency Credit Risk Notes | | | — | | | | 11,342,348 | | | | — | | | | 11,342,348 | |
Corporate Debt Securities | | | — | | | | 16,649,381 | | | | — | | | | 16,649,381 | |
Collateralized Municipal Obligations | | | — | | | | 84,288,071 | | | | — | | | | 84,288,071 | |
Foreign Sovereign Debt Securities | | | — | | | | 4,508,069 | | | | — | | | | 4,508,069 | |
| | | | 6,528,420 | | | | 578,379,636 | | | | — | | | | 584,908,056 | |
Futures Contracts* | | | 280,201 | | | | — | | | | — | | | | 280,201 | |
Total Investments | | $ | 6,808,621 | | | $ | 578,379,636 | | | $ | — | | | $ | 585,188,257 | |
| * | Unrealized appreciation. |
NOTE 4—Derivative Investments
Value of Derivative Investments at Period-End
The table below summarizes the value of the Fund’s derivative investments, detailed by primary risk exposure, held as of December 31, 2015:
| | | | | | | | |
| | | Value | |
| Risk Exposure/Derivative Type | | Assets | | | Liabilities | |
Interest rate risk: | | | | | | | | |
Futures contracts(a) | | $ | 374,287 | | | $ | (94,086 | ) |
| (a) | Includes cumulative appreciation (depreciation) of futures contracts. Only current day’s variation margin receivable is reported within the Statement of Assets and Liabilities. |
Effect of Derivative Investments for the year ended December 31, 2015
The table below summarizes the gains (losses) on derivative investments, detailed by primary risk exposure, recognized in earnings during the period:
| | | | | | | | | | | | |
| | | Location of Gain (Loss) on
Statement of Operations | |
| | | Futures Contracts | | | Options(a) | | | Swap Agreements | |
Realized Gain (Loss): | | | | | | | | | | | | |
Interest rate risk | | $ | 1,475,129 | | | $ | (633,372 | ) | | $ | 206,340 | |
Change in Net Unrealized Appreciation (Depreciation): | | | | | | | | | | | | |
Interest rate risk | | | (2,874,753 | ) | | | 172,976 | | | | — | |
Total | | $ | (1,399,624 | ) | | $ | (460,396 | ) | | $ | 206,340 | |
| (a) | Options purchased are included in the net realized gain (loss) from investment securities and change in net unrealized appreciation (depreciation) on investment securities. |
The table below summarizes the twelve months average notional value of futures contracts, the eight months average notional value of options purchased, options written and the four months average notional value of swap agreements outstanding during the period.
| | | | | | | | | | | | |
| | | Futures Contracts | | | Options Purchased | | | Swap Agreements | |
Average notional value | | $ | 142,014,147 | | | $ | 104,875,000 | | | $ | 38,750,000 | |
Invesco V.I. Government Securities Fund
| | | | | | | | | | | | | | | | | | | | |
| Open Futures Contracts | |
| Futures Contracts | | Type of
Contract | | | Number of
Contracts | | | Expiration
Month | | | Notional
Value | | | Unrealized
Appreciation
(Depreciation) | |
U.S. Treasury 2 Year Notes | | | Short | | | | 95 | | | | March-2016 | | | $ | (20,637,266 | ) | | $ | 27,777 | |
U.S. Treasury 5 Year Notes | | | Long | | | | 213 | | | | March-2016 | | | | 25,202,227 | | | | (65,738 | ) |
U.S. Treasury 10 Year Notes | | | Long | | | | 85 | | | | March-2016 | | | | 10,702,031 | | | | (27,607 | ) |
U.S. Treasury 30 Year Notes | | | Short | | | | 36 | | | | March-2016 | | | | (5,535,000 | ) | | | (741 | ) |
U.S. Treasury Ultra Bonds | | | Long | | | | 397 | | | | March-2016 | | | | 62,998,937 | | | | 346,510 | |
Total Futures Contracts — Interest Rate Risk | | | | | | | | | | | | | | | | | | $ | 280,201 | |
NOTE 5—Trustees’ and Officers’ Fees and Benefits
Trustees’ and Officers’ Fees and Benefits include amounts accrued by the Fund to pay remuneration to certain Trustees and Officers of the Fund. Trustees have the option to defer compensation payable by the Fund, and Trustees’ and Officers’ Fees and Benefits also include amounts accrued by the Fund to fund such deferred compensation amounts. Those Trustees who defer compensation have the option to select various Invesco Funds in which their deferral accounts shall be deemed to be invested. Finally, certain current Trustees were eligible to participate in a retirement plan that provided for benefits to be paid upon retirement to Trustees over a period of time based on the number of years of service. The Fund may have certain former Trustees who also participate in a retirement plan and receive benefits under such plan. Trustees’ and Officers’ Fees and Benefits include amounts accrued by the Fund to fund such retirement benefits. Obligations under the deferred compensation and retirement plans represent unsecured claims against the general assets of the Fund.
NOTE 6—Cash Balances
The Fund may borrow for leveraging in an amount up to 5% of the Fund’s total assets (excluding the amount borrowed) at the time the borrowing is made. In doing so, the Fund is permitted to temporarily carry a negative or overdrawn balance in its account with State Street Bank and Trust Company, the custodian bank. Such balances, if any at period end, are shown in the Statement of Assets and Liabilities under the payable caption Amount due custodian. To compensate the custodian bank for such overdrafts, the overdrawn Fund may either (1) leave funds as a compensating balance in the account so the custodian bank can be compensated by earning the additional interest; or (2) compensate by paying the custodian bank at a rate agreed upon by the custodian bank and Invesco, not to exceed the contractually agreed upon rate. The Fund may not purchase additional securities when any borrowings from banks exceed 5% of the Fund’s total assets.
NOTE 7—Distributions to Shareholders and Tax Components of Net Assets
Tax Character of Distributions to Shareholders Paid During the Fiscal Years Ended December 31, 2015 and 2014:
| | | | | | | | |
| | | 2015 | | | 2014 | |
Ordinary income | | $ | 13,506,106 | | | $ | 22,507,467 | |
Tax Components of Net Assets at Period-End:
| | | | |
| | | 2015 | |
Undistributed ordinary income | | $ | 11,569,186 | |
Net unrealized appreciation — investments | | | 8,665,387 | |
Temporary book/tax differences | | | (553,768 | ) |
Capital loss carryforward | | | (20,657,574 | ) |
Shares of beneficial interest | | | 589,458,017 | |
Total net assets | | $ | 588,481,248 | |
The difference between book-basis and tax-basis unrealized appreciation (depreciation) is due to differences in the timing of recognition of gains and losses on investments for tax and book purposes. The Fund’s net unrealized appreciation difference is attributable primarily to wash sales and TIPS.
The temporary book/tax differences are a result of timing differences between book and tax recognition of income and/or expenses. The Fund’s temporary book/tax differences are the result of the trustee deferral of compensation and retirement plan benefits.
Capital loss carryforward is calculated and reported as of a specific date. Results of transactions and other activity after that date may affect the amount of capital loss carryforward actually available for the Fund to utilize. Capital losses generated in years beginning after December 22, 2010 can be carried forward for an unlimited period, whereas previous losses expire in eight tax years. Capital losses with an expiration period may not be used to offset capital gains until all net capital losses without an expiration date have been utilized. Capital loss carryforwards with no expiration date will retain their character as either short-term or long-term capital losses instead of as short-term capital losses as under prior law. The ability to utilize capital loss carryforwards in the future may be limited under the Internal Revenue Code and related regulations based on the results of future transactions.
Invesco V.I. Government Securities Fund
The Fund has a capital loss carryforward as of December 31, 2015, which expires as follows:
| | | | | | | | | | | | |
| Capital Loss Carryforward* | |
| Expiration | | Short-Term | | | Long-Term | | | Total | |
February 28, 2017 | | $ | 3,845,837 | | | $ | — | | | $ | 3,845,837 | |
Not subject to expiration | | | 9,837,916 | | | | 6,973,821 | | | | 16,811,737 | |
| | | $ | 13,683,753 | | | $ | 6,973,821 | | | $ | 20,657,574 | |
| * | Capital loss carryforward as of the date listed above is reduced for limitations, if any, to the extent required by the Internal Revenue Code and may be further limited depending upon a variety of factors, including the realization of net unrealized gains or losses as of the date of any reorganization. |
NOTE 8—Investment Securities
The aggregate amount of investment securities (other than short-term securities, U.S. Treasury obligations and money market funds, if any) purchased and sold by the Fund during the year ended December 31, 2015 was $280,816,740 and $349,006,467, respectively. During the same period, purchases and sales of U.S. Treasury obligations were $95,735,680 and $119,727,855, respectively. Cost of investments on a tax basis includes the adjustments for financial reporting purposes as of the most recently completed federal income tax reporting period-end.
| | | | |
| Unrealized Appreciation (Depreciation) of Investment Securities on a Tax Basis | |
Aggregate unrealized appreciation of investment securities | | $ | 11,371,770 | |
Aggregate unrealized (depreciation) of investment securities | | | (2,706,383 | ) |
Net unrealized appreciation of investment securities | | $ | 8,665,387 | |
Cost of investments for tax purposes is $576,242,669.
NOTE 9—Reclassification of Permanent Differences
Primarily as a result of differing book/tax treatment of paydowns and dollar rolls, on December 31, 2015, undistributed net investment income was increased by $3,755,600 and undistributed net realized gain (loss) was decreased by $3,755,600. This reclassification had no effect on the net assets of the Fund.
NOTE 10—Share Information
| | | | | | | | | | | | | | | | |
| | | Summary of Share Activity | |
| | | Years ended December 31, | |
| | | 2015(a) | | | 2014 | |
| | | Shares | | | Amount | | | Shares | | | Amount | |
Sold: | | | | | | | | | | | | | | | | |
Series I | | | 5,071,141 | | | $ | 59,701,741 | | | | 3,780,129 | | | $ | 44,538,169 | |
Series II | | | 2,597,649 | | | | 30,202,874 | | | | 2,344,721 | | | | 27,332,900 | |
| | | | |
Issued as reinvestment of dividends: | | | | | | | | | | | | | | | | |
Series I | | | 834,905 | | | | 9,684,904 | | | | 1,398,212 | | | | 16,177,318 | |
Series II | | | 331,990 | | | | 3,821,202 | | | | 551,407 | | | | 6,330,149 | |
| | | | |
Reacquired: | | | | | | | | | | | | | | | | |
Series I | | | (12,198,556 | ) | | | (143,098,480 | ) | | | (13,365,628 | ) | | | (157,396,928 | ) |
Series II | | | (4,103,260 | ) | | | (47,861,356 | ) | | | (4,310,995 | ) | | | (50,323,118 | ) |
Net increase (decrease) in share activity | | | (7,466,131 | ) | | $ | (87,549,115 | ) | | | (9,602,154 | ) | | $ | (113,341,510 | ) |
| (a) | There are entities that are record owners of more than 5% of the outstanding shares of the Fund and in the aggregate own 82% of the outstanding shares of the Fund. The Fund and the Fund’s principal underwriter or advisor, are parties to participation agreements with these entities whereby these entities sell units of interest in separate accounts funding variable products that are invested in the Fund. The Fund, Invesco and/or Invesco affiliates may make payments to these entities, which are considered to be related to the Fund, for providing services to the Fund, Invesco and or Invesco affiliates including but not limited to services such as, securities brokerage, third party record keeping and account servicing and administrative services. The Trust has no knowledge as to whether all or any portion of the shares owned of record by these entities are also owned beneficially. |
Invesco V.I. Government Securities Fund
NOTE 11—Financial Highlights
The following schedule presents financial highlights for a share of the Fund outstanding throughout the periods indicated.
| | | | | | | | | | | | | | | | | | | | | | | | | | | | | | | | | | | | | | | | | | | | | | | | |
| | | Net asset
value,
beginning
of period | | | Net
investment
income(a) | | | Net gains
(losses)
on securities
(both
realized and
unrealized) | | | Total from
investment
operations | | | Dividends
from net
investment
income | | | Net asset
value, end
of period | | | Total
return(b) | | | Net assets,
end of period
(000’s omitted) | | | Ratio of
expenses
to average net assets with fee waivers
and/or expenses
absorbed | | | Ratio of
expenses
to average net
assets without
fee waivers
and/or expenses
absorbed | | | Ratio of net
investment
income
to average
net assets | | | Portfolio
turnover(c) | |
Series I | | | | | | | | | | | | | | | | | | | | | | | | | | | | | | | | | | | | | | | | | | | | | | | | |
Year ended 12/31/15 | | $ | 11.74 | | | $ | 0.17 | | | $ | (0.13 | ) | | $ | 0.04 | | | $ | (0.26 | ) | | $ | 11.52 | | | | 0.34 | % | | $ | 393,090 | | | | 0.77 | %(d) | | | 0.77 | %(d) | | | 1.44 | %(d) | | | 59 | % |
Year ended 12/31/14 | | | 11.64 | | | | 0.16 | | | | 0.32 | | | | 0.48 | | | | (0.38 | ) | | | 11.74 | | | | 4.14 | | | | 474,556 | | | | 0.78 | | | | 0.78 | | | | 1.36 | | | | 55 | |
Year ended 12/31/13 | | | 12.40 | | | | 0.13 | | | | (0.45 | ) | | | (0.32 | ) | | | (0.44 | ) | | | 11.64 | | | | (2.62 | ) | | | 565,690 | | | | 0.74 | | | | 0.76 | | | | 1.10 | | | | 139 | |
Year ended 12/31/12 | | | 12.49 | | | | 0.19 | | | | 0.12 | | | | 0.31 | | | | (0.40 | ) | | | 12.40 | | | | 2.47 | | | | 873,212 | | | | 0.65 | | | | 0.76 | | | | 1.49 | | | | 118 | |
Year ended 12/31/11 | | | 12.00 | | | | 0.25 | | | | 0.67 | | | | 0.92 | | | | (0.43 | ) | | | 12.49 | | | | 7.91 | | | | 970,029 | | | | 0.63 | | | | 0.75 | | | | 2.03 | | | | 85 | |
Series II | | | | | | | | | | | | | | | | | | | | | | | | | | | | | | | | | | | | | | | | | | | | | | | | |
Year ended 12/31/15 | | | 11.64 | | | | 0.14 | | | | (0.13 | ) | | | 0.01 | | | | (0.23 | ) | | | 11.42 | | | | 0.06 | | | | 195,392 | | | | 1.02 | (d) | | | 1.02 | (d) | | | 1.19 | (d) | | | 59 | |
Year ended 12/31/14 | | | 11.54 | | | | 0.13 | | | | 0.31 | | | | 0.44 | | | | (0.34 | ) | | | 11.64 | | | | 3.88 | | | | 212,788 | | | | 1.03 | | | | 1.03 | | | | 1.11 | | | | 55 | |
Year ended 12/31/13 | | | 12.29 | | | | 0.10 | | | | (0.45 | ) | | | (0.35 | ) | | | (0.40 | ) | | | 11.54 | | | | (2.85 | ) | | | 227,237 | | | | 0.99 | | | | 1.01 | | | | 0.85 | | | | 139 | |
Year ended 12/31/12 | | | 12.39 | | | | 0.16 | | | | 0.12 | | | | 0.28 | | | | (0.38 | ) | | | 12.29 | | | | 2.22 | | | | 261,083 | | | | 0.90 | | | | 1.01 | | | | 1.24 | | | | 118 | |
Year ended 12/31/11 | | | 11.92 | | | | 0.21 | | | | 0.67 | | | | 0.88 | | | | (0.41 | ) | | | 12.39 | | | | 7.63 | | | | 295,318 | | | | 0.88 | | | | 1.00 | | | | 1.78 | | | | 85 | |
| (a) | Calculated using average shares outstanding. |
| (b) | Includes adjustments in accordance with accounting principles generally accepted in the United States of America and as such, the net asset value for financial reporting purposes and the returns based upon those net asset values may differ from the net asset value and returns for shareholder transactions. Total returns are not annualized for periods less than one year, if applicable and do not reflect charges assessed in connection with a variable product, which if included would reduce total returns. |
| (c) | Portfolio turnover is calculated at the fund level and is not annualized for periods less than one year, if applicable. For the period ended December 31, 2011, the portfolio turnover calculation excludes the value of securities purchased of $309,171,077 and sold of $25,033,352 in the effort to realign the Fund’s portfolio holdings after the reorganization of Invesco Van Kampen V.I. Government Fund into the Fund. |
| (d) | Ratios are based on average daily net assets (000’s omitted) of $439,573 and $200,436 for Series I and Series II shares, respectively. |
Invesco V.I. Government Securities Fund
Report of Independent Registered Public Accounting Firm
To the Board of Trustees of AIM Variable Insurance Funds (Invesco Variable Insurance Funds)
and Shareholders of Invesco V.I. Government Securities Fund:
In our opinion, the accompanying statement of assets and liabilities, including the schedule of investments, and the related statements of operations and of changes in net assets and the financial highlights present fairly, in all material respects, the financial position of Invesco V.I. Government Securities Fund (one of the funds constituting AIM Variable Insurance Funds (Invesco Variable Insurance Funds), hereafter referred to as the “Fund”) at December 31, 2015, the results of its operations for the year then ended, the changes in its net assets for each of the two years in the period then ended and the financial highlights for each of the five years in the period then ended, in conformity with accounting principles generally accepted in the United States of America. These financial statements and financial highlights (hereafter referred to as “financial statements”) are the responsibility of the Fund’s management. Our responsibility is to express an opinion on these financial statements based on our audits. We conducted our audits of these financial statements in accordance with the standards of the Public Company Accounting Oversight Board (United States). Those standards require that we plan and perform the audit to obtain reasonable assurance about whether the financial statements are free of material misstatement. An audit includes examining, on a test basis, evidence supporting the amounts and disclosures in the financial statements, assessing the accounting principles used and significant estimates made by management, and evaluating the overall financial statement presentation. We believe that our audits, which included confirmation of securities at December 31, 2015 by correspondence with the custodian and brokers, and the application of alternative auditing procedures where confirmations of security purchases have not been received, provide a reasonable basis for our opinion.
PRICEWATERHOUSECOOPERS LLP
Houston, Texas
February 15, 2016
Invesco V.I. Government Securities Fund
Calculating your ongoing Fund expenses
Example
As a shareholder of the Fund, you incur ongoing costs, including management fees; distribution and/or service fees (12b-1); and other Fund expenses. This example is intended to help you understand your ongoing costs (in dollars) of investing in the Fund and to compare these costs with ongoing costs of investing in other mutual funds. The example is based on an investment of $1,000 invested at the beginning of the period and held for the entire period July 1, 2015 through December 31, 2015.
The actual and hypothetical expenses in the examples below do not represent the effect of any fees or other expenses assessed in connection with a variable product; if they did, the expenses shown would be higher while the ending account values shown would be lower.
Actual expenses
The table below provides information about actual account values and actual expenses. You may use the information in this table, together with the amount you invested, to estimate the expenses that you paid over the period. Simply divide your account value by $1,000 (for example, an $8,600 account value divided by $1,000 = 8.6), then multiply the result by the number in the table under the heading entitled “Actual Expenses Paid During Period” to estimate the expenses you paid on your account during this period.
Hypothetical example for comparison purposes
The table below also provides information about hypothetical account values and hypothetical expenses based on the Fund’s actual expense ratio and an assumed rate of return of 5% per year before expenses, which is not the Fund’s actual return.
The hypothetical account values and expenses may not be used to estimate the actual ending account balance or expenses you paid for the period. You may use this information to compare the ongoing costs of investing in the Fund and other funds. To do so, compare this 5% hypothetical example with the 5% hypothetical examples that appear in the shareholder reports of the other funds.
Please note that the expenses shown in the table are meant to highlight your ongoing costs. Therefore, the hypothetical information is useful in comparing ongoing costs, and will not help you determine the relative total costs of owning different funds.
| | | | | | | | | | | | | | | | | | | | | | | | |
| Class | | Beginning
Account Value
(07/01/15) | | | ACTUAL | | | HYPOTHETICAL (5% annual return before expenses) | | | Annualized
Expense
Ratio | |
| | | Ending
Account Value
(12/31/15)1 | | | Expenses
Paid During
Period2 | | | Ending
Account Value
(12/31/15) | | | Expenses
Paid During
Period2 | | |
| Series I | | $ | 1,000.00 | | | $ | 1,002.60 | | | $ | 3.84 | | | $ | 1,021.37 | | | $ | 3.87 | | | | 0.76 | % |
| Series II | | | 1,000.00 | | | | 1,001.50 | | | | 5.10 | | | | 1,020.11 | | | | 5.14 | | | | 1.01 | |
| 1 | The actual ending account value is based on the actual total return of the Fund for the period July 1, 2015 through December 31, 2015, after actual expenses and will differ from the hypothetical ending account value which is based on the Fund’s expense ratio and a hypothetical annual return of 5% before expenses. |
| 2 | Expenses are equal to the Fund’s annualized expense ratio as indicated above multiplied by the average account value over the period, multiplied by 184/365 to reflect the most recent fiscal half year. |
Invesco V.I. Government Securities Fund
Tax Information
Form 1099-DIV, Form 1042-S and other year–end tax information provide shareholders with actual calendar year amounts that should be included in their tax returns. Shareholders should consult their tax advisors.
The following distribution information is being provided as required by the Internal Revenue Code or to meet a specific state’s requirement.
The Fund designates the following amounts or, if subsequently determined to be different, the maximum amount allowable for its fiscal year ended December 31, 2015:
| | | | |
Federal and State Income Tax | |
Corporate Dividends Received Deduction* | | | 0.00 | % |
U.S. Treasury Obligations* | | | 10.41 | % |
| | * | The above percentages are based on ordinary income dividends paid to shareholders during the Fund’s fiscal year. |
Invesco V.I. Government Securities Fund
Trustees and Officers
The address of each trustee and officer is AIM Variable Insurance Funds (Invesco Variable Insurance Funds) (the “Trust”), 11 Greenway Plaza, Suite 1000, Houston, Texas 77046-1173. The trustees serve for the life of the Trust, subject to their earlier death, incapacitation, resignation, retirement or removal as more specifically provided in the Trust’s organizational documents. Each officer serves for a one year term or until their successors are elected and qualified. Column two below includes length of time served with predecessor entities, if any.
| | | | | | | | |
Name, Year of Birth and
Position(s) Held with the Trust | | Trustee and/
or Officer Since | | Principal Occupation(s)
During Past 5 Years | | Number of Funds in Fund Complex Overseen by Trustee | | Other Directorship(s) Held by Trustee During Past 5 Years |
| Interested Persons | | | | | | | | |
| Martin L. Flanagan1 — 1960 Trustee | | 2007 | | Executive Director, Chief Executive Officer and President, Invesco Ltd. (ultimate parent of Invesco and a global investment management firm); Advisor to the Board, Invesco Advisers, Inc. (formerly known as Invesco Institutional (N.A.), Inc.); Trustee, The Invesco Funds; Vice Chair, Investment Company Institute; and Member of Executive Board, SMU Cox School of Business Formerly: Chairman and Chief Executive Officer, Invesco Advisers, Inc. (registered investment adviser); Director, Chairman, Chief Executive Officer and President, IVZ Inc. (holding company), INVESCO Group Services, Inc. (service provider) and Invesco North American Holdings, Inc. (holding company); Director, Chief Executive Officer and President, Invesco Holding Company Limited (parent of Invesco and a global investment management firm); Director, Invesco Ltd.; Chairman, Investment Company Institute and President, Co-Chief Executive Officer, Co-President, Chief Operating Officer and Chief Financial Officer, Franklin Resources, Inc. (global investment management organization) | | 146 | | None |
Philip A. Taylor2 — 1954 Trustee, President and Principal Executive Officer | | 2006 | | Head of North American Retail and Senior Managing Director, Invesco Ltd.; Director, Co-Chairman, Co-President and Co-Chief Executive Officer, Invesco Advisers, Inc. (formerly known as Invesco Institutional (N.A.), Inc.) (registered investment adviser); Director, Chairman, Chief Executive Officer and President, Invesco Management Group, Inc. (formerly known as Invesco Aim Management Group, Inc.) (financial services holding company); Director and Chairman, Invesco Investment Services, Inc. (formerly known as Invesco Aim Investment Services, Inc.) (registered transfer agent) Chief Executive Officer, Invesco Corporate Class Inc. (corporate mutual fund company) Director, Chairman and Chief Executive Officer, Invesco Canada Ltd. (formerly known as Invesco Trimark Ltd./Invesco Trimark Ltèe) (registered investment adviser and registered transfer agent); Trustee, President and Principal Executive Officer, The Invesco Funds (other than AIM Treasurer’s Series Trust (Invesco Treasurer’s Series Trust), Short-Term Investments Trust and Invesco Management Trust); Trustee and Executive Vice President, The Invesco Funds (AIM Treasurer’s Series Trust (Invesco Treasurer’s Series Trust), Short-Term Investments Trust and Invesco Management Trust only); Director, Invesco Investment Advisers LLC (formerly known as Van Kampen Asset Management); Director, Chief Executive Officer and President, Van Kampen Exchange Corp. Formerly: Director and President, INVESCO Funds Group, Inc. (registered investment adviser and registered transfer agent); Director and Chairman, IVZ Distributors, Inc. (formerly known as INVESCO Distributors, Inc.) (registered broker dealer); Director, President and Chairman, Invesco Inc. (holding company), Invesco Canada Holdings Inc. (holding company), Trimark Investments Ltd./Placements Trimark Ltèe and Invesco Financial Services Ltd/Services Financiers Invesco Ltèe; Chief Executive Officer, Invesco Canada Fund Inc (corporate mutual fund company); Director and Chairman, Van Kampen Investor Services Inc.; Director, Chief Executive Officer and President, 1371 Preferred Inc. (holding company) and Van Kampen Investments Inc.; Director and President, AIM GP Canada Inc. (general partner for limited partnerships) and Van Kampen Advisors, Inc.; Director and Chief Executive Officer, Invesco Trimark Dealer Inc. (registered broker dealer); Director, Invesco Distributors, Inc. (formerly known as Invesco Aim Distributors, Inc.) (registered broker dealer); Manager, Invesco PowerShares Capital Management LLC; Director, Chief Executive Officer and President, Invesco Advisers, Inc.; Director, Chairman, Chief Executive Officer and President, Invesco Aim Capital Management, Inc.; President, Invesco Trimark Dealer Inc. and Invesco Trimark Ltd./Invesco Trimark Ltèe; Director and President, AIM Trimark Corporate Class Inc. and AIM Trimark Canada Fund Inc.; Senior Managing Director, Invesco Holding Company Limited; Director and Chairman, Fund Management Company (former registered broker dealer); President and Principal Executive Officer, The Invesco Funds (AIM Treasurer’s Series Trust (Invesco Treasurer’s Series Trust), and Short-Term Investments Trust only); President, AIM Trimark Global Fund Inc. and AIM Trimark Canada Fund Inc | | 146 | | None |
| 1 | Mr. Flanagan is considered an interested person (within the meaning of Section 2(a)(19) of the 1940 Act) of the Trust because he is an officer of the Adviser to the Trust, and an officer and a director of Invesco Ltd., ultimate parent of the Adviser. |
| 2 | Mr. Taylor is considered an interested person (within the meaning of Section 2(a)(19) of the 1940 Act) of the Trust because he is an officer and a director of the Adviser. |
Invesco V.I. Government Securities Fund
Trustees and Officers—(continued)
| | | | | | | | |
Name, Year of Birth and
Position(s) Held with the Trust | | Trustee and/
or Officer Since | | Principal Occupation(s)
During Past 5 Years | | Number of Funds in Fund Complex Overseen by Trustee | | Other Directorship(s)
Held by Trustee During Past 5 Years |
| Independent Trustees | | | | | | | | |
Bruce L. Crockett — 1944 Trustee and Chair | | 2003 | | Chairman, Crockett Technologies Associates (technology consulting company) Formerly: Director, Captaris (unified messaging provider); Director, President and Chief Executive Officer, COMSAT Corporation; Chairman, Board of Governors of INTELSAT (international communications company); ACE Limited (insurance company); Independent Directors Council and Investment Company Institute | | 146 | | ALPS (Attorneys Liability Protection Society) (insurance company) and Globe Specialty Metals, Inc. (metallurgical company) |
David C. Arch — 1945 Trustee | | 2010 | | Chairman of Blistex Inc., a consumer health care products manufacturer | | 146 | | Board member of the Illinois Manufacturers’ Association; Member of the Board of Visitors, Institute for the Humanities, University of Michigan |
James T. Bunch — 1942 Trustee | | 2000 | | Managing Member, Grumman Hill Group LLC (family office/private equity investments) Formerly: Chairman of the Board of Trustees, Evans Scholars Foundation and Chairman, Board of Governors, Western Golf Association | | 146 | | Trustee, Evans Scholars Foundation; and Chairman of the Board, Denver Film Society |
Albert R. Dowden — 1941 Trustee | | 2003 | | Director of a number of public and private business corporations, including the Boss Group, Ltd. (private investment and management); Nature’s Sunshine Products, Inc. and Reich & Tang Funds (5 portfolios) (registered investment company) Formerly: Director, Homeowners of America Holding Corporation/Homeowners of America Insurance Company (property casualty company); Director, Continental Energy Services, LLC (oil and gas pipeline service); Director, CompuDyne Corporation (provider of product and services to the public security market) and Director, Annuity and Life Re (Holdings), Ltd. (reinsurance company); Director, President and Chief Executive Officer, Volvo Group North America, Inc.; Senior Vice President, AB Volvo; Director of various public and private corporations; Chairman, DHJ Media, Inc.; Director, Magellan Insurance Company; and Director, The Hertz Corporation, Genmar Corporation (boat manufacturer), National Media Corporation; Advisory Board of Rotary Power International (designer, manufacturer, and seller of rotary power engines); and Chairman, Cortland Trust, Inc. (registered investment company) | | 146 | | Director of: Nature’s Sunshine Products, Inc., Reich & Tang Funds, Homeowners of America Holding Corporation/ Homeowners of America Insurance Company, the Boss Group |
Jack M. Fields — 1952 Trustee | | 2003 | | Chief Executive Officer, Twenty First Century Group, Inc. (government affairs company); Owner and Chief Executive Officer, Dos Angeles Ranch, L.P. (cattle, hunting, corporate entertainment); and Discovery Global Education Fund (non-profit) Formerly: Chief Executive Officer, Texana Timber LP (sustainable forestry company); Director of Cross Timbers Quail Research Ranch (non-profit); and member of the U.S. House of Representatives | | 146 | | Insperity, Inc. (formerly known as Administaff) |
Eli Jones — Trustee | | 2016 | | Professor and Dean, Mays Business School, Texas A&M University Formerly: Professor and Dean, Walton College of Business, University of Arkansas, and E.J. Ourso College of Business, Louisiana State University | | 146 | | Director, Insperity, Inc., (2011-present) and ARVEST Bank (2012-2015) |
Prema Mathai-Davis — 1950 Trustee | | 2003 | | Retired. Formerly: Chief Executive Officer, YWCA of the U.S.A. | | 146 | | None |
Larry Soll — 1942 Trustee | | 1997 | | Retired. Formerly: Chairman, Chief Executive Officer and President, Synergen Corp. (a biotechnology company) | | 146 | | None |
Robert C. Troccoli — Trustee | | 2016 | | Retired. Formerly: Senior Partner, KPMG LLP | | 146 | | None |
Raymond Stickel, Jr. — 1944 Trustee | | 2005 | | Retired. Formerly: Director, Mainstay VP Series Funds, Inc. (25 portfolios) and Partner, Deloitte & Touche | | 146 | | None |
Suzanne H. Woolsey — 1941 Trustee | | 2014 | | Chief Executive Officer of Woolsey Partners LLC | | 146 | | Emeritus Chair of the Board of Trustees of the Institute for Defense Analyses; Trustee of Colorado College; Trustee of California Institute of Technology; Prior to 2014, Director of Fluor Corp.; Prior to 2010, Trustee of the German Marshall Fund of the United States; Prior to 2010 Trustee of the Rocky Mountain Institute |
Invesco V.I. Government Securities Fund
Trustees and Officers—(continued)
| | | | | | | | |
Name, Year of Birth and
Position(s) Held with the Trust | | Trustee and/
or Officer Since | | Principal Occupation(s)
During Past 5 Years | | Number of Funds in Fund Complex Overseen by Trustee | | Other Directorship(s)
Held by Trustee During Past 5 Years |
| Other Officers | | | | | | | | |
Russell C. Burk — 1958 Senior Vice President and Senior Officer | | 2005 | | Senior Vice President and Senior Officer, The Invesco Funds | | N/A | | N/A |
John M. Zerr — 1962 Senior Vice President, Chief Legal Officer and Secretary | | 2006 | | Director, Senior Vice President, Secretary and General Counsel, Invesco Management Group, Inc. (formerly known as Invesco Aim Management Group, Inc.) and Van Kampen Exchange Corp.; Senior Vice President, Invesco Advisers, Inc. (formerly known as Invesco Institutional (N.A.), Inc.) (registered investment adviser); Senior Vice President and Secretary, Invesco Distributors, Inc. (formerly known as Invesco Aim Distributors, Inc.); Director, Vice President and Secretary, Invesco Investment Services, Inc. (formerly known as Invesco Aim Investment Services, Inc.); Senior Vice President, Chief Legal Officer and Secretary, The Invesco Funds; Managing Director, Invesco PowerShares Capital Management LLC; Director, Secretary and General Counsel, Invesco Investment Advisers LLC (formerly known as Van Kampen Asset Management); Secretary and General Counsel, Invesco Capital Markets, Inc. (formerly known as Van Kampen Funds Inc.) and Chief Legal Officer, PowerShares Exchange-Traded Fund Trust, PowerShares Exchange-Traded Fund Trust II, PowerShares India Exchange-Traded Fund Trust, PowerShares Actively Managed Exchange-Traded Fund Trust, and PowerShares Actively Managed Exchange-Traded Commodity Fund Trust Formerly: Director, Vice President and Secretary, IVZ Distributors, Inc. (formerly known as INVESCO distributors, Inc.); Director and Vice President, INVESCO Funds Group, Inc.; Director and Vice President, Van Kampen Advisors Inc.; Director, Vice President, Secretary and General Counsel, Van Kampen Investor Services Inc.; Director, Invesco Distributors, Inc. (formerly known as Invesco Aim Distributors, Inc.); Director, Senior Vice President, General Counsel and Secretary, Invesco Aim Advisers, Inc. and Van Kampen Investments Inc.; Director, Vice President and Secretary, Fund Management Company; Director, Senior Vice President, Secretary, General Counsel and Vice President, Invesco Aim Capital Management, Inc.; Chief Operating Officer and General Counsel, Liberty Ridge Capital, Inc. (an investment adviser); Vice President and Secretary, PBHG Funds (an investment company) and PBHG Insurance Series Fund (an investment company); Chief Operating Officer, General Counsel and Secretary, Old Mutual Investment Partners (a broker-dealer); General Counsel and Secretary, Old Mutual Fund Services (an administrator) and Old Mutual Shareholder Services (a shareholder servicing center); Executive Vice President, General Counsel and Secretary, Old Mutual Capital, Inc. (an investment adviser); and Vice President and Secretary, Old Mutual Advisors Funds (an investment company) | | N/A | | N/A |
Sheri Morris — 1964 Vice President, Treasurer and Principal Financial Officer | | 2003 | | Vice President, Treasurer and Principal Financial Officer, The Invesco Funds; Vice President, Invesco Advisers, Inc. (formerly known as Invesco Institutional (N.A.), Inc.) (registered investment adviser); and Vice President, PowerShares Exchange-Traded Fund Trust, PowerShares Exchange-Traded Fund Trust II, PowerShares India Exchange-Traded Fund Trust, PowerShares Actively Managed Exchange-Traded Fund Trust, and PowerShares Actively Managed Exchange-Traded Commodity Fund Trust Formerly: Vice President, Invesco Aim Advisers, Inc., Invesco Aim Capital Management, Inc. and Invesco Aim Private Asset Management, Inc.; Assistant Vice President and Assistant Treasurer, The Invesco Funds and Assistant Vice President, Invesco Advisers, Inc., Invesco Aim Capital Management, Inc. and Invesco Aim Private Asset Management, Inc.; and Treasurer, PowerShares Exchange-Traded Fund Trust, PowerShares Exchange-Traded Fund Trust II, PowerShares India Exchange-Traded Fund Trust and PowerShares Actively Managed Exchange-Traded Fund Trust | | N/A | | N/A |
Invesco V.I. Government Securities Fund
Trustees and Officers—(continued)
| | | | | | | | |
Name, Year of Birth and
Position(s) Held with the Trust | | Trustee and/
or Officer Since | | Principal Occupation(s)
During Past 5 Years | | Number of Funds in Fund Complex Overseen by Trustee | | Other Directorship(s)
Held by Trustee During Past 5 Years |
| Other Officers—(continued) | | | | | | | | |
Karen Dunn Kelley — 1960 Vice President | | 2003 | | Senior Managing Director, Investments, Invesco Ltd.; Director, Co-President, Co-Chief Executive Officer, and Co-Chairman, Invesco Advisers, Inc. (formerly known as Invesco Institutional (N.A.), Inc.) (registered investment adviser); Chairman, Invesco Senior Secured Management, Inc.; Senior Vice President, Invesco Management Group, Inc. (formerly known as Invesco Aim Management Group, Inc.); Executive Vice President, Invesco Distributors, Inc. (formerly known as Invesco Aim Distributors, Inc.); Director, Invesco Mortgage Capital Inc. and Invesco Management Company Limited; Vice President, The Invesco Funds (other than AIM Treasurer’s Series Trust (Invesco Treasurer’s Series Trust), Short-Term Investments Trust and Invesco Management Trust); and President and Principal Executive Officer, The Invesco Funds (AIM Treasurer’s Series Trust (Invesco Treasurer’s Series Trust), Short-Term Investments Trust and Invesco Management Trust only) Formerly: Director and President, INVESCO Asset Management (Bermuda) Ltd., Director, INVESCO Global Asset Management Limited and INVESCO Management S.A.; Senior Vice President, Van Kampen Investments Inc. and Invesco Advisers, Inc. (formerly known as Invesco Institutional (N.A.), Inc.) (registered investment adviser); Vice President, Invesco Advisers, Inc. (formerly known as Invesco Institutional (N.A.), Inc.); Director of Cash Management and Senior Vice President, Invesco Advisers, Inc. and Invesco Aim Capital Management, Inc.; Director and President, Fund Management Company; Chief Cash Management Officer, Director of Cash Management, Senior Vice President, and Managing Director, Invesco Aim Capital Management, Inc.; Director of Cash Management, Senior Vice President, and Vice President, Invesco Advisers, Inc. and The Invesco Funds (AIM Treasurer’s Series Trust (Invesco Treasurer’s Series Trust), and Short-Term Investments Trust only) | | N/A | | N/A |
Crissie M. Wisdom — 1969 Anti-Money Laundering Compliance Officer | | 2013 | | Anti-Money Laundering Compliance Officer, Invesco Advisers, Inc. (formerly known as Invesco Institutional (N.A.), Inc.) (registered investment adviser), Invesco Capital Markets, Inc. (formerly known as Van Kampen Funds Inc.), Invesco Distributors, Inc., Invesco Investment Services, Inc., Invesco Management Group, Inc., Van Kampen Exchange Corp., The Invesco Funds, and PowerShares Exchange-Traded Fund Trust, PowerShares Exchange-Traded Fund Trust II, PowerShares India Exchange-Traded Fund Trust, PowerShares Actively Managed Exchange-Traded Fund Trust and PowerShares Actively Managed Exchange-Traded Commodity Fund Trust; Anti-Money Laundering Compliance Officer and Bank Secrecy Act Officer, INVESCO National Trust Company and Invesco Trust Company; and Fraud Prevention Manager and Controls and Risk Analysis Manager for Invesco Investment Services, Inc. | | N/A | | N/A |
Lisa O. Brinkley — 1959 Chief Compliance Officer | | 2015 | | Senior Vice President and Chief Compliance Officer, Invesco Advisers, Inc. (registered investment adviser) (formerly known as Invesco Institutional (N.A., Inc.); and Chief Compliance Officer, The Invesco Funds Formerly: Global Assurance Officer, Invesco Ltd. and Vice President, The Invesco Funds; Chief Compliance Officer, Invesco Distributors, Inc. (formerly known as Invesco Aim Distributors, Inc.), Invesco Investment Services, Inc.(formerly known as Invesco Aim Investment Services, Inc.) and Van Kampen Investor Services Inc.; Senior Vice President, Invesco Management Group, Inc.; Senior Vice President and Chief Compliance Officer, Invesco Advisers, Inc. and The Invesco Funds; Vice President and Chief Compliance Officer, Invesco Aim Capital Management, Inc. and Invesco Distributors, Inc.; Vice President, Invesco Investment Services, Inc. and Fund Management Company | | N/A | | N/A |
The Statement of Additional Information of the Trust includes additional information about the Fund’s Trustees and is available upon request, without charge, by calling 1.800.959.4246. Please refer to the Fund’s prospectus for information on the Fund’s sub-advisers.
| | | | | | |
Office of the Fund 11 Greenway Plaza, Suite 1000 Houston, TX 77046-1173 | | Investment Adviser Invesco Advisers, Inc. 1555 Peachtree Street, N.E. Atlanta, GA 30309 | | Distributor Invesco Distributors, Inc. 11 Greenway Plaza, Suite 1000 Houston, TX 77046-1173 | | Auditors PricewaterhouseCoopers LLP 1000 Louisiana Street, Suite 5800 Houston, TX 77002-5678 |
| | | |
| | | | | | |
Counsel to the Fund Stradley Ronon Stevens & Young, LLP 2005 Market Street, Suite 2600 Philadelphia, PA 19103-7018 | | Counsel to the Independent Trustees Goodwin Procter LLP 901 New York Avenue, N.W. Washington, D.C. 20001 | | Transfer Agent Invesco Investment Services, Inc. 11 Greenway Plaza, Suite 1000 Houston, TX 77046-1173 | | Custodian State Street Bank and Trust Company 225 Franklin Street Boston, MA 02110-2801 |
Invesco V.I. Government Securities Fund
| | | | |
| | |

| | Annual Report to Shareholders | | December 31, 2015 |
| | |
| | Invesco V.I. Growth and Income Fund |

| | |
| | The Fund provides a complete list of its holdings four times in each fiscal year, at the quarter-ends. For the second and fourth quarters, the lists appear in the Fund’s semiannual and annual reports to shareholders. For the first and third quarters, the Fund files the lists with the Securities and Exchange Commission (SEC) on Form N-Q. The Fund’s Form N-Q filings are available on the SEC website, sec.gov. Copies of the Fund’s Forms N-Q may be reviewed and copied at the SEC Public Reference Room in Washington, D.C. You can obtain information on the operation of the Public Reference Room, including information about duplicating fee charges, by calling 202 551 8090 or 800 732 0330, or by electronic request at the following email address: publicinfo@sec.gov. The SEC file numbers for the Fund are 811-07452 and 033-57340. The Fund’s most recent portfolio holdings, as filed on Form N-Q, have also been made available to insurance companies issuing variable annuity contracts and variable life insurance policies (“variable products”) that invest in the Fund. A description of the policies and procedures that the Fund uses to determine how to vote proxies relating to portfolio securities is available without charge, upon request, from our Client Services department at 800 959 4246 or at invesco.com/proxyguidelines. The information is also available on the SEC website, sec.gov. Information regarding how the Fund voted proxies related to its portfolio securities during the most recent 12-month period ended June 30 is available at invesco.com/ proxysearch. The information is also available on the SEC website, sec.gov. Invesco Advisers, Inc. is an investment adviser; it provides investment advisory services to individual and institutional clients and does not sell securities. Invesco Distributors, Inc. is the US distributor for Invesco Ltd.’s retail mutual funds, exchange-traded funds and institutional money market funds. Both are wholly owned, indirect subsidiaries of Invesco Ltd. This report must be accompanied or preceded by a currently effective Fund prospectus and variable product prospectus, which contain more complete information, including sales charges and expenses. Investors should read each carefully before investing. Invesco Distributors, Inc. VK-VIGRI-AR-1 NOT FDIC INSURED | MAY LOSE VALUE | NO BANK GUARANTEE |
Management’s Discussion of Fund Performance
Performance summary
For the year ended December 31, 2015, Series I shares of Invesco V.I. Growth and Income Fund (the Fund) outperformed the Russell 1000 Value Index, the Fund’s style-specific benchmark.
Your Fund’s long-term performance appears later in this report.
Fund vs. Indexes
Total returns, 12/31/14 to 12/31/15, excluding variable product issuer charges.
If variable product issuer charges were included, returns would be lower.
| | | | | |
| Series I Shares | | | | -3.06 | % |
| Series II Shares | | | | -3.31 | |
| S&P 500 Index▼ (Broad Market Index) | | | | 1.38 | |
| Russell 1000 Value Index▼ (Style-Specific Index) | | | | -3.83 | |
| Lipper VUF Large-Cap Value Funds Indexn (Peer Group Index) | | | | -3.86 | |
Source(s): ▼FactSet Research Systems Inc.; nLipper Inc.
Market conditions and your Fund
The US economy continued its modest, but steady growth, during the year ended December 31, 2015 – although the health of individual economic sectors varied dramatically. The headline economic story was a steady decline in already-battered energy markets, as oil prices plummeted when increased supply overwhelmed demand. This decline particularly affected companies with US-based offshore or shale-based resources – companies whose cost to recover oil is higher than many traditional producers. On the other end of the spectrum, the improved position of the US consumer was the more subtle story which drove the US economy forward during the year.
As the year began, economic growth appeared to be stronger in the US than in the rest of the world. US equity markets were recovering from the crash of oil prices initiated by OPEC’s decision to maintain high production despite low prices and slowing global growth. The view that the US Federal Reserve (the Fed) would begin raising rates while other central banks were loosening monetary
policy led the US dollar to strengthen against many currencies. This hurt commodity- and materials-based economies – and companies in related sectors. Additionally, US-based multinational companies faced foreign exchange headwinds. Low interest rates, the increasing availability of credit and an improving employment picture all contributed to higher consumer confidence and consumer spending, which drove US equity markets higher, particularly through the spring, and helped overcome fears that Greece and the eurozone would fail to reach an agreement on a financial bailout plan.
In the summer of 2015, US equity markets moved sharply lower. A significant downturn in China’s financial markets and weak global economic growth led the Fed to delay raising interest rates; this, in turn, increased investor uncertainty and market volatility. A continued decline in oil prices also contributed to market volatility. In the fall, however, US markets rallied, the Fed saw enough economic stabilization to finally raise interest rates, and most major US market indexes ended the year barely in positive territory.
For the reporting period, value stocks, as a group, underperformed growth stocks by a large margin, regardless of market capitalization. Sector performance within the Russell 1000 Value Index was mainly negative, with health care, telecommunication services and industrials being the only sectors with positive performance.
Strong stock selection in the information technology sector was a large contributor to the Fund’s performance relative to its style-specific index for the reporting period. Notably, Amdocs, in the software and services industry, was a large driver of Fund performance, posting a double-digit return for the year. Amdocs’ stock price rallied when the company reported record revenues in July 2015, after expanding its product suite and renewing major service contracts. Also, not owning HP, a component of the style-specific index, helped relative Fund performance, as the stock struggled during the reporting period.
Stock selection in the consumer discretionary sector also added to Fund performance relative to the style-specific benchmark. Within the sector, Carnival was a notable contributor to Fund performance. The stock rose more than 20% for the reporting period. The cruise line operator reported higher-than-expected earnings and raised its outlook for 2016.
Energy was the worst-performing sector during the year, with continued weak oil prices driving down stock prices throughout the sector. As such, the Fund’s meaningful underweight exposure to the sector relative to the style-specific index was a positive contributor to the Fund’s relative return.
We used currency forward contracts during the reporting period for the purpose of hedging currency exposure of non-US-based companies held in the
| | | | | |
| Portfolio Composition |
By sector | | | | % of total net assets | |
| | | | | |
| |
| Financials | | | | 31.3 | % |
| Health Care | | | | 13.6 | |
| Information Technology | | | | 12.6 | |
| Energy | | | | 10.8 | |
| Consumer Discretionary | | | | 8.8 | |
| Industrials | | | | 8.2 | |
| Consumer Staples | | | | 7.5 | |
| Telecommunication Services | | | | 2.6 | |
| Utilities | | | | 1.6 | |
| Materials | | | | 0.6 | |
Money Market Funds | | | | | |
| Plus Other Assets Less Liabilities | | | | 2.4 | |
|
| Top 10 Equity Holdings* |
| % of total net assets |
| | | | | | | |
| | |
1. | | Citigroup Inc. | | | | 4.6 | % |
2. | | JPMorgan Chase & Co. | | | | 4.6 | |
3. | | General Electric Co. | | | | 3.7 | |
4. | | Bank of America Corp. | | | | 2.9 | |
5. | | Morgan Stanley | | | | 2.3 | |
6. | | Carnival Corp. | | | | 2.2 | |
7. | | PNC Financial Services | | | | | |
| | | Group, Inc. (The) | | | | 1.9 | |
8. | | Citizens Financial Group Inc. | | | | 1.8 | |
9. | | Royal Dutch Shell PLC- Class A | | | | 1.8 | |
10. | | Merck & Co., Inc. | | | | 1.8 | |
| | | | | |
| Total Net Assets | | | $ | 1.6 billion | |
| | | | | |
| |
Total Number of Holdings* | | | | 82 | |
The Fund’s holdings are subject to change, and there is no assurance that the Fund will continue to hold any particular security.
*Excluding money market fund holdings.
Data presented here are as of December 31, 2015.
Invesco V.I. Growth and Income Fund
portfolio. Derivatives were used for the purpose of hedging and not for speculative purposes or leverage. The use of currency forward contracts had a large positive impact on the Fund’s performance relative to the Russell 1000 Value Index for the reporting period. This was mainly due to the strength of the US dollar compared to the foreign currencies in which the Fund’s non-US holdings were denominated.
Stock selection in the consumer staples sector was a large detractor from the Fund’s performance, relative to the style-specific index, for the year. The stock of Archer-Daniels-Midland sold off during the fourth quarter after the company’s third-quarter profits missed analysts’ expectations. Also, the company admitted that it may continue to be challenged by the strong US dollar and depressed ethanol margins.
Stock selection in and underweight exposure to the industrials sector also detracted from the Fund’s relative performance. In the commercial and professional services industry, Tyco International performed poorly for the reporting period, falling by double digits. In the fourth quarter, Tyco met analysts’ earnings expectations; however, revenue fell short due to the foreign exchange impact of the strong US dollar.
Stock selection in the materials sector also detracted from Fund performance. Mosaic, a potash producer for fertilizer, was a large detractor, posting a negative return for the reporting period due to the impact of slowing emerging market economies and waning demand for fertilizer.
Equity markets experienced continued volatility during the reporting period based on political unrest in Eastern Europe, a sluggish Chinese economy and the effects on the global economy of falling oil prices. We believe that market volatility creates opportunities to invest in companies with attractive valuations and strong fundamentals. We believe that ultimately those valuations and fundamentals will be reflected in those companies’ stock prices.
Thank you for your investment in Invesco V.I. Growth and Income Fund and for sharing our long-term investment horizon.
The views and opinions expressed in management’s discussion of Fund performance are those of Invesco Advisers, Inc. These views and opinions are subject to change at any time based on factors such as market and economic conditions. These views and opinions may not be relied upon as investment advice or recommendations, or as an offer for a particular security. The information is not a complete analysis of every aspect of any market, country, industry, security or the Fund. Statements of fact are from sources considered reliable, but Invesco Advisers, Inc. makes no representation or warranty as to their completeness or accuracy. Although historical performance is no guarantee of future results, these insights may help you understand our investment management philosophy.
See important Fund and, if applicable, index disclosures later in this report.
Thomas Bastian
Chartered Financial Analyst, Portfolio Manager, is lead manager of Invesco V.I. Growth and Income Fund. He joined Invesco in 2010. Mr. Bastian earned a BA in accounting from St. John’s University and an MBA in finance from University of Michigan.
Brian Jurkash
Portfolio Manager, is manager of Invesco V.I. Growth and Income Fund. He joined Invesco in 2000. Mr. Jurkash earned a BBA degree in finance from Stephen F. Austin State University and an MBA in finance from the University of Houston.
Sergio Marcheli
Portfolio Manager, is manager of Invesco V.I. Growth and Income Fund. He joined Invesco in 2010. Mr. Marcheli earned a BBA from the University of Houston and an MBA from the University of St. Thomas.
James Roeder
Chartered Financial Analyst, Portfolio Manager, is manager of Invesco V.I. Growth and Income Fund. He joined Invesco in 2010. Mr. Roeder earned a BS in accounting from Clemson University and an MBA in economics and finance from the University of Chicago Booth School of Business.
Matthew Titus
Chartered Financial Analyst, Portfolio Manager, is manager of Invesco V.I. Growth and Income Fund. He joined the management team effective January 25, 2016, after the close of the reporting period. Mr. Titus joined Invesco in 2016. He earned a bachelor’s degree in accounting and economics from Luther College in Decorah, Iowa, and an MBA from Ohio State University.
Invesco V.I. Growth and Income Fund
Your Fund’s Long-Term Performance
Results of a $10,000 Investment – Oldest Share Class(es)
Fund and index data from 12/31/05
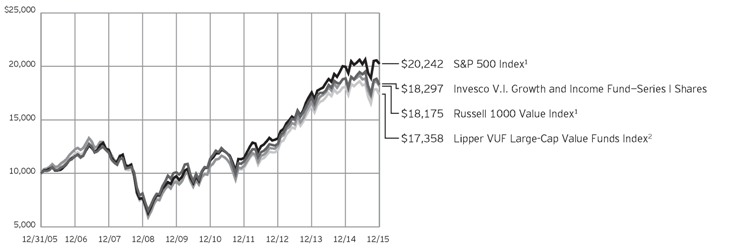
| 1 | Source: FactSet Research Systems Inc. |
Past performance cannot guarantee comparable future results.
| | | | | |
| Average Annual Total Returns |
As of 12/31/15 | | | | | |
| |
| Series I Shares | | | | | |
| Inception (12/23/96) | | | | 8.51 | % |
| 10 Years | | | | 6.23 | |
| 5 Years | | | | 10.00 | |
| 1 Year | | | | -3.06 | |
| |
| Series II Shares | | | | | |
| Inception (9/18/00) | | | | 5.89 | % |
| 10 Years | | | | 5.96 | |
| 5 Years | | | | 9.71 | |
| 1 Year | | | | -3.31 | |
Effective June 1, 2010, Class I and Class II shares of the predecessor fund, Van Kampen Life Investment Trust Growth and Income Portfolio, advised by Van Kampen Asset Management were reorganized into Series I and Series II shares, respectively, of Invesco Van Kampen V.I. Growth and Income Fund (renamed Invesco V.I. Growth and Income Fund on April 29, 2013). Returns shown above for Series I and Series II shares are blended returns of the predecessor fund and Invesco V.I. Growth and Income Fund. Share class returns will differ from the predecessor fund because of different expenses.
The performance data quoted represent past performance and
cannot guarantee comparable future results; current performance may be lower or higher. Please contact your variable product issuer or financial adviser for the most recent month-end variable product performance. Performance figures reflect Fund expenses, reinvested distributions and changes in net asset value. Investment return and principal value will fluctuate so that you may have a gain or loss when you sell shares.
The net annual Fund operating expense ratio set forth in the most recent Fund prospectus as of the date of this report for Series I and Series II shares was 0.78% and 1.03%, respectively.1 The total annual Fund operating expense ratio set forth in the most recent Fund prospectus as of the date of this report for Series I and Series II shares was 0.83% and 1.08%, respectively. The expense ratios presented above may vary from the expense ratios presented in other sections of this report that are based on expenses incurred during the period covered by this report.
Invesco V.I. Growth and Income Fund, a series portfolio of AIM Variable Insurance Funds (Invesco Variable Insurance Funds), is currently offered through insurance companies issuing
variable products. You cannot purchase shares of the Fund directly. Performance figures given represent the Fund and are not intended to reflect actual variable product values. They do not reflect sales charges, expenses and fees assessed in connection with a variable product. Sales charges, expenses and fees, which are determined by the variable product issuers, will vary and will lower the total return.
The most recent month-end performance at the Fund level, excluding variable product charges, is available at 800 451 4246. As mentioned above, for the most recent month-end performance including variable product charges, please contact your variable product issuer or financial adviser.
Fund performance reflects any applicable fee waivers and/or expense reimbursements. Had the adviser not waived fees and/or reimbursed expenses currently or in the past, returns would have been lower. See current prospectus for more information.
| 1 | Total annual Fund operating expenses after any contractual fee waivers and/or expense reimbursements by the adviser in effect through at least April 30, 2017. See current prospectus for more information. |
Invesco V.I. Growth and Income Fund
Invesco V.I. Growth and Income Fund’s investment objective is to seek long-term growth of capital and income.
| n | | Unless otherwise stated, information presented in this report is as of December 31, 2015, and is based on total net assets. |
| n | | Unless otherwise noted, all data provided by Invesco. |
| n | | To access your Fund’s reports/prospectus, visit invesco.com/fundreports. |
Principal risks of investing in the Fund
Convertible securities risk. The Fund may own convertible securities, the value of which may be affected by market interest rates, the risk that the issuer will default, the value of the underlying stock or the right of the issuer to buy back the convertible securities.
Depositary receipts risk. Depositary receipts involve many of the same risks as those associated with direct investment in foreign securities. In addition, the underlying issuers of certain depositary receipts, particularly unsponsored or unregistered depositary receipts, are under no obligation to distribute shareholder communications to the holders of such receipts or to pass through to them any voting rights with respect to the deposited securities.
Derivatives risk. The value of a derivative instrument depends largely on (and is derived from) the value of an underlying security, currency, commodity, interest rate, index or other asset (each referred to as an underlying asset). In addition to risks relating to the underlying assets, the use of derivatives may include other, possibly greater, risks, including counterparty, leverage and liquidity risks. Counterparty risk is the risk that the counterparty to the derivative contract will default on its obligation to pay the Fund the amount owed or otherwise perform under the derivative contract. Derivatives create leverage risk because they do not require payment up front equal to the economic exposure created by owning the derivative. As a result, an adverse change in the value of the underlying asset could result in the Fund sustaining a loss that is substantially greater than the amount invested in the derivative, which may make the Fund’s returns more volatile and increase the risk of loss. Derivative instruments may also be less liquid than more traditional investments and the Fund may be unable to sell or close out its derivative positions at a desirable time or price. This risk may be more acute under adverse market conditions, during which the Fund may be most in need of liquidating its derivative positions. Derivatives may also be harder to value, less tax efficient and subject to changing government regulation that could impact the Fund’s ability to use certain derivatives or their cost. Also, derivatives used for
hedging or to gain or limit exposure to a particular market segment may not provide the expected benefits, particularly during adverse market conditions.
Foreign securities risk. The Fund’s foreign investments may be affected by changes in a foreign country’s exchange rates, political and social instability, changes in economic or taxation policies, difficulties when enforcing obligations, decreased liquidity, and increased volatility. Foreign companies may be subject to less regulation resulting in less publicly available information about the companies.
Management risk. The investment techniques and risk analysis used by the Fund’s portfolio managers may not produce the desired results.
Market risk. The prices of and the income generated by the Fund’s securities may decline in response to, among other things, investor sentiment, general economic and market conditions, regional or global instability, and currency and interest rate fluctuations.
Real estate investment trust (REIT)/real estate risk. Investments in real estate related instruments may be affected by economic, legal, cultural, environmental or technological factors that affect property values, rents or occupancies of real estate related to the Fund’s holdings. Shares of real estate related companies, which tend to be small- and mid-cap companies, may be more volatile and less liquid.
Small- and mid-capitalization risks. Stocks of small- and mid-sized companies tend to be more vulnerable to adverse developments and may have little or no operating history or track record of success, and limited product lines, markets, management and financial resources. The securities of small- and mid-sized companies may be more volatile due to less market interest and less publicly available information about the issuer. They also may be illiquid or restricted as to resale, or may trade less frequently and in smaller volumes, all of which may cause difficulty when establishing or closing a position at a desirable price.
Value investing style risk. The Fund emphasizes a value style of investing, which focuses on undervalued companies with characteristics for improved valuations. This style of investing is subject to the risk that the valuations never improve or that the returns on value equity securities are less than returns on other styles
of investing or the overall stock market. Value stocks also may decline in price, even though in theory they are already underpriced.
About indexes used in this report
The S&P 500® Index is an unmanaged index considered representative of the US stock market.
The Russell 1000® Value Index is an unmanaged index considered representative of large-cap value stocks. The Russell 1000 Value Index is a trademark/service mark of the Frank Russell Co. Russell® is a trademark of the Frank Russell Co.
The Lipper VUF Large-Cap Value Funds Index is an unmanaged index considered representative of large-cap value variable insurance underlying funds tracked by Lipper.
The Fund is not managed to track the performance of any particular index, including the index(es) described here, and consequently, the performance of the Fund may deviate significantly from the performance of the index(es).
A direct investment cannot be made in an index. Unless otherwise indicated, index results include reinvested dividends, and they do not reflect sales charges. Performance of the peer group, if applicable, reflects fund expenses; performance of a market index does not.
Other information
The returns shown in management’s discussion of Fund performance are based on net asset values calculated for shareholder transactions. Generally accepted accounting principles require adjustments to be made to the net assets of the Fund at period end for financial reporting purposes, and as such, the net asset values for shareholder transactions and the returns based on those net asset values may differ from the net asset values and returns reported in the Financial Highlights. Additionally, the returns and net asset values shown throughout this report are at the Fund level only and do not include variable product issuer charges. If such charges were included, the total returns would be lower.
Industry classifications used in this report are generally according to the Global Industry Classification Standard, which was developed by and is the exclusive property and a service mark of MSCI Inc. and Standard & Poor’s.
Invesco V.I. Growth and Income Fund
Schedule of Investments(a)
December 31, 2015
| | | | | | | | |
| | | Shares | | | Value | |
Common Stocks & Other Equity Interests–97.63% | |
| Aerospace & Defense–1.24% | |
General Dynamics Corp. | | | 143,572 | | | $ | 19,721,050 | |
|
| Agricultural Products–1.02% | |
Archer-Daniels-Midland Co. | | | 439,124 | | | | 16,107,068 | |
|
| Application Software–0.93% | |
Citrix Systems, Inc.(b) | | | 195,255 | | | | 14,771,041 | |
|
| Asset Management & Custody Banks–2.54% | |
Northern Trust Corp. | | | 249,071 | | | | 17,955,528 | |
State Street Corp. | | | 335,335 | | | | 22,252,831 | |
| | | | | | | | 40,208,359 | |
|
| Automobile Manufacturers–0.88% | |
General Motors Co. | | | 408,903 | | | | 13,906,791 | |
|
| Biotechnology–1.22% | |
Amgen Inc. | | | 96,375 | | | | 15,644,554 | |
Baxalta Inc. | | | 94,218 | | | | 3,677,328 | |
| | | | | | | | 19,321,882 | |
|
| Broadcasting–0.26% | |
CBS Corp.–Class B | | | 88,254 | | | | 4,159,411 | |
|
| Cable & Satellite–2.33% | |
Comcast Corp.–Class A | | | 381,525 | | | | 21,529,456 | |
Time Warner Cable Inc. | | | 83,298 | | | | 15,459,276 | |
| | | | | | | | 36,988,732 | |
|
| Communications Equipment–4.16% | |
Cisco Systems, Inc. | | | 930,393 | | | | 25,264,822 | |
Juniper Networks, Inc. | | | 746,056 | | | | 20,591,146 | |
QUALCOMM, Inc. | | | 400,647 | | | | 20,026,340 | |
| | | | | | | | 65,882,308 | |
|
| Construction Machinery & Heavy Trucks–0.69% | |
Caterpillar Inc. | | | 161,034 | | | | 10,943,871 | |
|
| Data Processing & Outsourced Services–1.09% | |
PayPal Holdings, Inc.(b) | | | 476,278 | | | | 17,241,264 | |
|
| Diversified Banks–13.02% | |
Bank of America Corp. | | | 2,714,630 | | | | 45,687,223 | |
Citigroup Inc. | | | 1,408,785 | | | | 72,904,624 | |
Comerica Inc. | | | 365,154 | | | | 15,274,392 | |
JPMorgan Chase & Co. | | | 1,096,551 | | | | 72,405,262 | |
| | | | | | | | 206,271,501 | |
|
| Electric Utilities–0.77% | |
FirstEnergy Corp. | | | 384,914 | | | | 12,213,321 | |
|
| Fertilizers & Agricultural Chemicals–0.64% | |
Mosaic Co. (The) | | | 366,929 | | | | 10,123,571 | |
| | | | | | | | |
| | | Shares | | | Value | |
| Food Distributors–0.80% | |
Sysco Corp. | | | 309,856 | | | $ | 12,704,096 | |
|
| General Merchandise Stores–1.77% | |
Target Corp. | | | 385,947 | | | | 28,023,612 | |
|
| Health Care Equipment–2.34% | |
Baxter International Inc. | | | 402,703 | | | | 15,363,120 | |
Medtronic PLC | | | 282,834 | | | | 21,755,591 | |
| | | | | | | | 37,118,711 | |
|
| Health Care Services–0.84% | |
Express Scripts Holding Co.(b) | | | 151,889 | | | | 13,276,617 | |
|
| Hotels, Resorts & Cruise Lines–2.17% | |
Carnival Corp. | | | 629,602 | | | | 34,300,717 | |
|
| Household Products–1.32% | |
Procter & Gamble Co. (The) | | | 263,030 | | | | 20,887,212 | |
|
| Hypermarkets & Super Centers–1.51% | |
Wal-Mart Stores, Inc. | | | 389,677 | | | | 23,887,200 | |
|
| Industrial Conglomerates–3.67% | |
General Electric Co. | | | 1,866,532 | | | | 58,142,472 | |
|
| Industrial Machinery–0.80% | |
Ingersoll-Rand PLC | | | 230,468 | | | | 12,742,576 | |
|
| Insurance Brokers–3.05% | |
Aon PLC | | | 176,648 | | | | 16,288,712 | |
Marsh & McLennan Cos., Inc. | | | 310,122 | | | | 17,196,265 | |
Willis Group Holdings PLC | | | 304,366 | | | | 14,783,057 | |
| | | | | | | | 48,268,034 | |
|
| Integrated Oil & Gas–4.90% | |
Exxon Mobil Corp. | | | 182,120 | | | | 14,196,254 | |
Occidental Petroleum Corp. | | | 248,390 | | | | 16,793,648 | |
Royal Dutch Shell PLC–Class A (United Kingdom) | | | 1,275,324 | | | | 28,651,104 | |
TOTAL S.A. (France) | | | 404,765 | | | | 18,026,552 | |
| | | | | | | | 77,667,558 | |
|
| Integrated Telecommunication Services–1.66% | |
Koninklijke KPN N.V. (Netherlands) | | | 1,169,017 | | | | 4,414,246 | |
Orange S.A. (France) | | | 251,913 | | | | 4,226,178 | |
Telecom Italia S.p.A. (Italy)(b) | | | 2,353,446 | | | | 2,966,326 | |
Telefónica, S.A. (Spain) | | | 189,927 | | | | 2,096,348 | |
Verizon Communications Inc. | | | 273,917 | | | | 12,660,444 | |
| | | | | | | | 26,363,542 | |
|
| Internet Software & Services–1.04% | |
eBay Inc.(b) | | | 602,002 | | | | 16,543,015 | |
|
| Investment Banking & Brokerage–4.48% | |
Charles Schwab Corp. (The) | | | 539,682 | | | | 17,771,728 | |
Goldman Sachs Group, Inc. (The) | | | 90,442 | | | | 16,300,362 | |
See accompanying Notes to Financial Statements which are an integral part of the financial statements.
Invesco V.I. Growth and Income Fund
| | | | | | | | |
| | | Shares | | | Value | |
| Investment Banking & Brokerage–(continued) | |
Morgan Stanley | | | 1,159,115 | | | $ | 36,871,448 | |
| | | | | | | | 70,943,538 | |
|
| IT Consulting & Other Services–0.58% | |
Amdocs Ltd. | | | 169,267 | | | | 9,236,900 | |
|
| Managed Health Care–1.51% | |
Anthem, Inc. | | | 84,353 | | | | 11,762,182 | |
UnitedHealth Group Inc. | | | 103,408 | | | | 12,164,917 | |
| | | | | | | | 23,927,099 | |
|
| Movies & Entertainment–0.72% | |
Time Warner Inc. | | | 176,096 | | | | 11,388,128 | |
|
| Multi-Utilities–0.82% | |
PG&E Corp. | | | 243,262 | | | | 12,939,106 | |
|
| Oil & Gas Equipment & Services–1.97% | |
Baker Hughes Inc. | | | 341,179 | | | | 15,745,411 | |
Weatherford International PLC(b) | | | 1,847,283 | | | | 15,498,704 | |
| | | | | | | | 31,244,115 | |
|
| Oil & Gas Exploration & Production–3.94% | |
Anadarko Petroleum Corp. | | | 152,267 | | | | 7,397,131 | |
Apache Corp. | | | 557,484 | | | | 24,791,313 | |
Canadian Natural Resources Ltd. (Canada) | | | 785,198 | | | | 17,143,145 | |
Devon Energy Corp. | | | 410,227 | | | | 13,127,264 | |
| | | | | | | | 62,458,853 | |
|
| Other Diversified Financial Services–1.25% | |
Voya Financial, Inc. | | | 538,134 | | | | 19,862,526 | |
|
| Packaged Foods & Meats–1.36% | |
Mondelez International, Inc.–Class A | | | 479,618 | | | | 21,506,071 | |
|
| Pharmaceuticals–7.69% | |
Eli Lilly and Co. | | | 221,264 | | | | 18,643,705 | |
Merck & Co., Inc. | | | 537,889 | | | | 28,411,297 | |
Novartis AG (Switzerland) | | | 259,785 | | | | 22,204,429 | |
Pfizer Inc. | | | 499,918 | | | | 16,137,353 | |
Sanofi (France) | | | 169,462 | | | | 14,475,198 | |
Teva Pharmaceutical Industries Ltd.–ADR (Israel) | | | 334,643 | | | | 21,965,966 | |
| | | | | | | | 121,837,948 | |
|
| Publishing–0.70% | |
Thomson Reuters Corp. | | | 291,722 | | | | 11,045,877 | |
| | | | | | | | |
| | | Shares | | | Value | |
| Railroads–0.89% | |
CSX Corp. | | | 542,801 | | | $ | 14,085,686 | |
|
| Regional Banks–6.31% | |
BB&T Corp. | | | 364,799 | | | | 13,793,050 | |
Citizens Financial Group Inc. | | | 1,114,600 | | | | 29,191,374 | |
Fifth Third Bancorp | | | 854,707 | | | | 17,179,611 | |
First Horizon National Corp. | | | 713,760 | | | | 10,363,795 | |
PNC Financial Services Group, Inc. (The) | | | 309,136 | | | | 29,463,752 | |
| | | | | | | | 99,991,582 | |
|
| Security & Alarm Services–0.93% | |
Tyco International PLC | | | 459,894 | | | | 14,666,020 | |
|
| Semiconductor Equipment–1.09% | |
Applied Materials, Inc. | | | 923,406 | | | | 17,239,990 | |
|
| Semiconductors–1.33% | |
Intel Corp. | | | 610,744 | | | | 21,040,131 | |
|
| Specialized Finance–0.68% | |
CME Group Inc.–Class A | | | 119,204 | | | | 10,799,882 | |
|
| Systems Software–1.43% | |
Microsoft Corp. | | | 407,357 | | | | 22,600,166 | |
|
| Technology Hardware, Storage & Peripherals–0.92% | |
NetApp, Inc. | | | 549,931 | | | | 14,589,669 | |
|
| Tobacco–1.45% | |
Philip Morris International Inc. | | | 260,749 | | | | 22,922,445 | |
|
| Wireless Telecommunication Services–0.92% | |
Vodafone Group PLC–ADR (United Kingdom) | | | 451,622 | | | | 14,569,326 | |
Total Common Stocks & Other Equity Interests
(Cost $1,408,119,640) | | | | 1,546,680,590 | |
|
Money Market Funds–2.54% | |
Liquid Assets Portfolio–Institutional Class, 0.29%(c) | | | 20,132,678 | | | | 20,132,678 | |
Premier Portfolio–Institutional Class, 0.24%(c) | | | 20,132,679 | | | | 20,132,679 | |
Total Money Market Funds
(Cost $40,265,357) | | | | 40,265,357 | |
TOTAL INVESTMENTS–100.17%
(Cost $1,448,384,997) | | | | 1,586,945,947 | |
OTHER ASSETS LESS LIABILITIES–(0.17)% | | | | (2,768,861 | ) |
NET ASSETS–100.00% | | | $ | 1,584,177,086 | |
Investment Abbreviations:
| | |
| ADR | | – American Depositary Receipt |
Notes to Schedule of Investments:
| (a) | Industry and/or sector classifications used in this report are generally according to the Global Industry Classification Standard, which was developed by and is the exclusive property and a service mark of MSCI Inc. and Standard & Poor’s. |
| (b) | Non-income producing security. |
| (c) | The money market fund and the Fund are affiliated by having the same investment adviser. The rate shown is the 7-day SEC standardized yield as of December 31, 2015. |
See accompanying Notes to Financial Statements which are an integral part of the financial statements.
Invesco V.I. Growth and Income Fund
Statement of Assets and Liabilities
December 31, 2015
Statement of Operations
For the year ended December 31, 2015
| | | | |
Assets: | |
Investments, at value (Cost $1,408,119,640) | | $ | 1,546,680,590 | |
Investments in affiliated money market funds, at value and cost | | | 40,265,357 | |
Total investments, at value (Cost $1,448,384,997) | | | 1,586,945,947 | |
Cash | | | 66,836 | |
Foreign currencies, at value (Cost $664,359) | | | 661,785 | |
Receivable for: | | | | |
Investments sold | | | 602,901 | |
Fund shares sold | | | 33,235 | |
Dividends | | | 3,436,874 | |
Fund expenses absorbed | | | 16,142 | |
Investment for trustee deferred compensation and retirement plans | | | 178,310 | |
Unrealized appreciation on forward foreign currency contracts outstanding | | | 1,305,569 | |
Total assets | | | 1,593,247,599 | |
|
Liabilities: | |
Payable for: | | | | |
Investments purchased | | | 526,466 | |
Fund shares reacquired | | | 6,355,876 | |
Accrued fees to affiliates | | | 1,931,284 | |
Accrued trustees’ and officers’ fees and benefits | | | 358 | |
Accrued other operating expenses | | | 46,262 | |
Trustee deferred compensation and retirement plans | | | 210,267 | |
Total liabilities | | | 9,070,513 | |
Net assets applicable to shares outstanding | | $ | 1,584,177,086 | |
|
Net assets consist of: | |
Shares of beneficial interest | | $ | 1,252,263,152 | |
Undistributed net investment income | | | 17,242,643 | |
Undistributed net realized gain | | | 174,839,336 | |
Net unrealized appreciation | | | 139,831,955 | |
| | | $ | 1,584,177,086 | |
|
Net Assets: | |
Series I | | $ | 149,066,116 | |
Series II | | $ | 1,435,110,970 | |
|
Shares outstanding, $0.001 par value per share,
with an unlimited number of shares authorized: | |
Series I | | | 7,605,377 | |
Series II | | | 73,313,397 | |
Series I: | | | | |
Net asset value per share | | $ | 19.60 | |
Series II: | | | | |
Net asset value per share | | $ | 19.58 | |
| | | | |
Investment income: | |
Dividends (net of foreign withholding taxes of $1,166,787) | | $ | 41,170,843 | |
Dividends from affiliated money market funds | | | 67,430 | |
Total investment income | | | 41,238,273 | |
| |
Expenses: | | | | |
Advisory fees | | | 10,623,034 | |
Administrative services fees | | | 4,848,871 | |
Custodian fees | | | 98,200 | |
Distribution fees — Series II | | | 4,319,625 | |
Transfer agent fees | | | 32,702 | |
Trustees’ and officers’ fees and benefits | | | 52,342 | |
Other | | | 92,595 | |
Total expenses | | | 20,067,369 | |
Less: Fees waived | | | (1,130,627 | ) |
Net expenses | | | 18,936,742 | |
Net investment income | | | 22,301,531 | |
| |
Realized and unrealized gain (loss) from: | | | | |
Net realized gain (loss) from: | | | | |
Investment securities | | | 165,335,667 | |
Foreign currencies | | | (153,556 | ) |
Forward foreign currency contracts | | | 13,419,594 | |
| | | | 178,601,705 | |
Change in net unrealized appreciation (depreciation) of: | | | | |
Investment securities | | | (268,899,884 | ) |
Foreign currencies | | | 14,851 | |
Forward foreign currency contracts | | | (2,077,668 | ) |
| | | | (270,962,701 | ) |
Net realized and unrealized gain (loss) | | | (92,360,996 | ) |
Net increase (decrease) in net assets resulting from operations | | $ | (70,059,465 | ) |
See accompanying Notes to Financial Statements which are an integral part of the financial statements.
Invesco V.I. Growth and Income Fund
Statement of Changes in Net Assets
For the years ended December 31, 2015 and 2014
| | | | | | | | |
| | | 2015 | | | 2014 | |
Operations: | | | | | |
Net investment income | | $ | 22,301,531 | | | $ | 42,740,162 | |
Net realized gain | | | 178,601,705 | | | | 395,204,349 | |
Change in net unrealized appreciation (depreciation) | | | (270,962,701 | ) | | | (249,263,259 | ) |
Net increase (decrease) in net assets resulting from operations | | | (70,059,465 | ) | | | 188,681,252 | |
| | |
Distributions to shareholders from net investment income: | | | | | | | | |
Series I | | | (4,613,558 | ) | | | (2,868,324 | ) |
Series ll | | | (39,391,652 | ) | | | (27,337,329 | ) |
Total distributions from net investment income | | | (44,005,210 | ) | | | (30,205,653 | ) |
| | |
Distributions to shareholders from net realized gains: | | | | | | | | |
Series l | | | (23,975,128 | ) | | | (18,653,014 | ) |
Series ll | | | (230,492,529 | ) | | | (213,598,375 | ) |
Total distributions from net realized gains | | | (254,467,657 | ) | | | (232,251,389 | ) |
| | |
Share transactions–net: | | | | | | | | |
Series l | | | 20,537,185 | | | | (3,091,739 | ) |
Series ll | | | (58,547,345 | ) | | | (438,796,408 | ) |
Net increase (decrease) in net assets resulting from share transactions | | | (38,010,160 | ) | | | (441,888,147 | ) |
Net increase (decrease) in net assets | | | (406,542,492 | ) | | | (515,663,937 | ) |
| | |
Net assets: | | | | | | | | |
Beginning of year | | | 1,990,719,578 | | | | 2,506,383,515 | |
End of year (includes undistributed net investment income of $17,242,643 and $39,229,409, respectively) | | $ | 1,584,177,086 | | | $ | 1,990,719,578 | |
Notes to Financial Statements
December 31, 2015
NOTE 1—Significant Accounting Policies
Invesco V.I. Growth and Income Fund (the “Fund”) is a series portfolio of AIM Variable Insurance Funds (Invesco Variable Insurance Funds) (the “Trust”). The Trust is a Delaware statutory trust registered under the Investment Company Act of 1940, as amended (the “1940 Act”), as an open-end series management investment company consisting of twenty-four separate portfolios, (each constituting a “Fund”). The assets, liabilities and operations of each portfolio are accounted for separately. Information presented in these financial statements pertains only to the Fund. Matters affecting each Fund or class will be voted on exclusively by the shareholders of such Fund or class. Current Securities and Exchange Commission (“SEC”) guidance, however, requires participating insurance companies offering separate accounts to vote shares proportionally in accordance with the instructions of the contract owners whose investments are funded by shares of each Fund or class.
The Fund’s investment objective is to seek long-term growth of capital and income.
The Fund currently offers two classes of shares, Series I and Series II, both of which are offered to insurance company separate accounts funding variable annuity contracts and variable life insurance policies (“variable products”).
The following is a summary of the significant accounting policies followed by the Fund in the preparation of its financial statements.
| A. | Security Valuations — Securities, including restricted securities, are valued according to the following policy. |
A security listed or traded on an exchange (except convertible securities) is valued at its last sales price or official closing price as of the close of the customary trading session on the exchange where the security is principally traded, or lacking any sales or official closing price on a particular day, the security may be valued at the closing bid price on that day. Securities traded in the over-the-counter market are valued based on prices furnished by independent pricing services or market makers. When such securities are valued by an independent pricing service they may be considered fair valued. Futures contracts are valued at the final settlement price set by an exchange on which they are principally traded. Listed options are valued at the mean between the last bid and asked prices from the exchange on which they are principally traded. Options not listed on an exchange are valued by an independent source at the mean between the last bid and asked prices. For purposes of determining net asset value (“NAV”) per share, futures and option contracts generally are valued 15 minutes after the close of the customary trading session of the New York Stock Exchange (“NYSE”).
Investments in open-end and closed-end registered investment companies that do not trade on an exchange are valued at the end-of-day net asset value per share. Investments in open-end and closed-end registered investment companies that trade on an exchange are valued at the last sales price or official closing price as of the close of the customary trading session on the exchange where the security is principally traded.
Debt obligations (including convertible securities) and unlisted equities are fair valued using an evaluated quote provided by an independent pricing service. Evaluated quotes provided by the pricing service may be determined without exclusive reliance on quoted prices, and may reflect
Invesco V.I. Growth and Income Fund
appropriate factors such as institution-size trading in similar groups of securities, developments related to specific securities, dividend rate (for unlisted equities), yield (for debt obligations), quality, type of issue, coupon rate (for debt obligations), maturity (for debt obligations), individual trading characteristics and other market data. Debt obligations are subject to interest rate and credit risks. In addition, all debt obligations involve some risk of default with respect to interest and/or principal payments.
Foreign securities’ (including foreign exchange contracts) prices are converted into U.S. dollar amounts using the applicable exchange rates as of the close of the NYSE. If market quotations are available and reliable for foreign exchange-traded equity securities, the securities will be valued at the market quotations. Because trading hours for certain foreign securities end before the close of the NYSE, closing market quotations may become unreliable. If between the time trading ends on a particular security and the close of the customary trading session on the NYSE, events occur that the Adviser determines are significant and make the closing price unreliable, the Fund may fair value the security. If the event is likely to have affected the closing price of the security, the security will be valued at fair value in good faith using procedures approved by the Board of Trustees. Adjustments to closing prices to reflect fair value may also be based on a screening process of an independent pricing service to indicate the degree of certainty, based on historical data, that the closing price in the principal market where a foreign security trades is not the current value as of the close of the NYSE. Foreign securities’ prices meeting the approved degree of certainty that the price is not reflective of current value will be priced at the indication of fair value from the independent pricing service. Multiple factors may be considered by the independent pricing service in determining adjustments to reflect fair value and may include information relating to sector indices, American Depositary Receipts and domestic and foreign index futures. Foreign securities may have additional risks including exchange rate changes, potential for sharply devalued currencies and high inflation, political and economic upheaval, the relative lack of issuer information, relatively low market liquidity and the potential lack of strict financial and accounting controls and standards.
Securities for which market prices are not provided by any of the above methods may be valued based upon quotes furnished by independent sources. The last bid price may be used to value equity securities. The mean between the last bid and asked prices is used to value debt obligations, including corporate loans.
Securities for which market quotations are not readily available or became unreliable are valued at fair value as determined in good faith by or under the supervision of the Trust’s officers following procedures approved by the Board of Trustees. Issuer specific events, market trends, bid/asked quotes of brokers and information providers and other market data may be reviewed in the course of making a good faith determination of a security’s fair value.
The Fund may invest in securities that are subject to interest rate risk, meaning the risk that the prices will generally fall as interest rates rise and, conversely, the prices will generally rise as interest rates fall. Specific securities differ in their sensitivity to changes in interest rates depending on their individual characteristics. Changes in interest rates may result in increased market volatility, which may affect the value and/or liquidity of certain Fund investments.
Valuations change in response to many factors including the historical and prospective earnings of the issuer, the value of the issuer’s assets, general economic conditions, interest rates, investor perceptions and market liquidity. Because of the inherent uncertainties of valuation, the values reflected in the financial statements may materially differ from the value received upon actual sale of those investments.
| B. | Securities Transactions and Investment Income — Securities transactions are accounted for on a trade date basis. Realized gains or losses on sales are computed on the basis of specific identification of the securities sold. Interest income (net of withholding tax, if any) is recorded on the accrual basis from settlement date. Dividend income (net of withholding tax, if any) is recorded on the ex-dividend date. |
The Fund may periodically participate in litigation related to Fund investments. As such, the Fund may receive proceeds from litigation settlements. Any proceeds received are included in the Statement of Operations as realized gain (loss) for investments no longer held and as unrealized gain (loss) for investments still held.
Brokerage commissions and mark ups are considered transaction costs and are recorded as an increase to the cost basis of securities purchased and/or a reduction of proceeds on a sale of securities. Such transaction costs are included in the determination of net realized and unrealized gain (loss) from investment securities reported in the Statement of Operations and the Statement of Changes in Net Assets and the net realized and unrealized gains (losses) on securities per share in the Financial Highlights. Transaction costs are included in the calculation of the Fund’s net asset value and, accordingly, they reduce the Fund’s total returns. These transaction costs are not considered operating expenses and are not reflected in net investment income reported in the Statement of Operations and the Statement of Changes in Net Assets, or the net investment income per share and the ratios of expenses and net investment income reported in the Financial Highlights, nor are they limited by any expense limitation arrangements between the Fund and the investment adviser.
The Fund allocates income and realized and unrealized capital gains and losses to a class based on the relative net assets of each class.
| C. | Country Determination — For the purposes of making investment selection decisions and presentation in the Schedule of Investments, the investment adviser may determine the country in which an issuer is located and/or credit risk exposure based on various factors. These factors include the laws of the country under which the issuer is organized, where the issuer maintains a principal office, the country in which the issuer derives 50% or more of its total revenues and the country that has the primary market for the issuer’s securities, as well as other criteria. Among the other criteria that may be evaluated for making this determination are the country in which the issuer maintains 50% or more of its assets, the type of security, financial guarantees and enhancements, the nature of the collateral and the sponsor organization. Country of issuer and/or credit risk exposure has been determined to be the United States of America, unless otherwise noted. |
| D. | Distributions — Distributions from net investment income and net realized capital gain, if any, are generally declared and paid to separate accounts of participating insurance companies annually and recorded on the ex-dividend date. |
| E. | Federal Income Taxes — The Fund intends to comply with the requirements of Subchapter M of the Internal Revenue Code of 1986, as amended (the “Internal Revenue Code”), necessary to qualify as a regulated investment company and to distribute substantially all of the Fund’s taxable earnings to shareholders. As such, the Fund will not be subject to federal income taxes on otherwise taxable income (including net realized capital gain) that is distributed to shareholders. Therefore, no provision for federal income taxes is recorded in the financial statements. |
The Fund recognizes the tax benefits of uncertain tax positions only when the position is more likely than not to be sustained. Management has analyzed the Fund’s uncertain tax positions and concluded that no liability for unrecognized tax benefits should be recorded related to uncertain tax positions. Management is not aware of any tax positions for which it is reasonably possible that the total amounts of unrecognized tax benefits will change materially in the next 12 months.
Invesco V.I. Growth and Income Fund
The Fund files tax returns in the U.S. Federal jurisdiction and certain other jurisdictions. Generally, the Fund is subject to examinations by such taxing authorities for up to three years after the filing of the return for the tax period.
| F. | Expenses — Fees provided for under the Rule 12b-1 plan of a particular class of the Fund and which are directly attributable to that class are charged to the operations of such class. All other expenses are allocated among the classes based on relative net assets. |
| G. | Accounting Estimates — The preparation of financial statements in conformity with accounting principles generally accepted in the United States of America (“GAAP”) requires management to make estimates and assumptions that affect the reported amounts of assets and liabilities at the date of the financial statements and the reported amounts of revenues and expenses during the reporting period including estimates and assumptions related to taxation. Actual results could differ from those estimates by a significant amount. In addition, the Fund monitors for material events or transactions that may occur or become known after the period-end date and before the date the financial statements are released to print. |
| H. | Indemnifications — Under the Trust’s organizational documents, each Trustee, officer, employee or other agent of the Trust is indemnified against certain liabilities that may arise out of the performance of their duties to the Fund. Additionally, in the normal course of business, the Fund enters into contracts, including the Fund’s servicing agreements, that contain a variety of indemnification clauses. The Fund’s maximum exposure under these arrangements is unknown as this would involve future claims that may be made against the Fund that have not yet occurred. The risk of material loss as a result of such indemnification claims is considered remote. |
| I. | Foreign Currency Translations — Foreign currency is valued at the close of the NYSE based on quotations posted by banks and major currency dealers. Portfolio securities and other assets and liabilities denominated in foreign currencies are translated into U.S. dollar amounts at date of valuation. Purchases and sales of portfolio securities (net of foreign taxes withheld on disposition) and income items denominated in foreign currencies are translated into U.S. dollar amounts on the respective dates of such transactions. The Fund does not separately account for the portion of the results of operations resulting from changes in foreign exchange rates on investments and the fluctuations arising from changes in market prices of securities held. The combined results of changes in foreign exchange rates and the fluctuation of market prices on investments (net of estimated foreign tax withholding) are included with the net realized and unrealized gain or loss from investments in the Statement of Operations. Reported net realized foreign currency gains or losses arise from (1) sales of foreign currencies, (2) currency gains or losses realized between the trade and settlement dates on securities transactions, and (3) the difference between the amounts of dividends, interest, and foreign withholding taxes recorded on the Fund’s books and the U.S. dollar equivalent of the amounts actually received or paid. Net unrealized foreign currency gains and losses arise from changes in the fair values of assets and liabilities, other than investments in securities at fiscal period end, resulting from changes in exchange rates. |
The Fund may invest in foreign securities, which may be subject to foreign taxes on income, gains on investments or currency repatriation, a portion of which may be recoverable. Foreign taxes, if any, are recorded based on the tax regulations and rates that exist in the foreign markets in which the Fund invests and are shown in the Statement of Operations.
| J. | Forward Foreign Currency Contracts — The Fund may engage in foreign currency transactions either on a spot (i.e. for prompt delivery and settlement) basis, or through forward foreign currency contracts, to manage or minimize currency or exchange rate risk. |
The Fund may also enter into forward foreign currency contracts for the purchase or sale of a security denominated in a foreign currency in order to “lock in” the U.S. dollar price of that security, or the Fund may also enter into forward foreign currency contracts that do not provide for physical settlement of the two currencies, but instead are settled by a single cash payment calculated as the difference between the agreed upon exchange rate and the spot rate at settlement based upon an agreed upon notional amount (non-deliverable forwards). The Fund will set aside liquid assets in an amount equal to daily mark-to-market obligation for forward foreign currency contracts.
A forward foreign currency contract is an obligation between two parties (“Counterparties”) to purchase or sell a specific currency for an agreed-upon price at a future date. The use of forward foreign currency contracts does not eliminate fluctuations in the price of the underlying securities the Fund owns or intends to acquire but establishes a rate of exchange in advance. Fluctuations in the value of these contracts are measured by the difference in the contract date and reporting date exchange rates and are recorded as unrealized appreciation (depreciation) until the contracts are closed. When the contracts are closed, realized gains (losses) are recorded. Realized and unrealized gains (losses) on the contracts are included in the Statement of Operations. The primary risks associated with forward foreign currency contracts include failure of the Counterparty to meet the terms of the contract and the value of the foreign currency changing unfavorably. These risks may be in excess of the amounts reflected in the Statement of Assets and Liabilities.
NOTE 2—Advisory Fees and Other Fees Paid to Affiliates
The Trust has entered into a master investment advisory agreement with Invesco Advisers, Inc. (the “Adviser” or “Invesco”). Under the terms of the investment advisory agreement, the Fund pays an advisory fee to the Adviser based on the annual rate of the Fund’s average daily net assets as follows:
| | | | |
| Average Daily Net Assets | | Rate | |
First $500 million | | | 0.60% | |
Over $500 million | | | 0.55% | |
For the year ended December 31, 2015, the effective advisory fees incurred by the Fund was 0.56%.
Under the terms of a master sub-advisory agreement between the Adviser and each of Invesco Asset Management Deutschland GmbH, Invesco Asset Management Limited, Invesco Asset Management (Japan) Limited, Invesco Hong Kong Limited, Invesco Senior Secured Management, Inc. and Invesco Canada Ltd. (collectively, the “Affiliated Sub-Advisers”) the Adviser, not the Fund, may pay 40% of the fees paid to the Adviser to any such Affiliated Sub-Adviser(s) that provide(s) discretionary investment management services to the Fund based on the percentage of assets allocated to such Affiliated Sub-Adviser(s).
The Adviser has contractually agreed, through at least April 30, 2017, to waive advisory fees and/or reimburse expenses of all shares to the extent necessary to limit total annual fund operating expenses after fee waiver and/or expense reimbursement (excluding certain items discussed below) of Series I shares to 0.78% and Series II shares to 1.03% of average daily net assets. In determining the Adviser’s obligation to waive advisory fees and/or reimburse expenses, the following expenses are not taken into account, and could cause the total annual fund operating
Invesco V.I. Growth and Income Fund
expenses after fee waiver and/or expense reimbursement to exceed the numbers reflected above: (1) interest; (2) taxes; (3) dividend expense on short sales; (4) extraordinary or non-routine items, including litigation expenses; and (5) expenses that the Fund has incurred but did not actually pay because of an expense offset arrangement. Unless Invesco continues the fee waiver agreement, it will terminate on April 30, 2017. The fee waiver agreement cannot be terminated during its term.
Further, the Adviser has contractually agreed, through at least June 30, 2017, to waive the advisory fee payable by the Fund in an amount equal to 100% of the net advisory fees the Adviser receives from the affiliated money market funds on investments by the Fund of uninvested cash in such affiliated money market funds.
For the year ended December 31, 2015, the Adviser waived advisory fees of $1,130,627.
The Trust has entered into a master administrative services agreement with Invesco pursuant to which the Fund has agreed to pay Invesco a fee for costs incurred in providing accounting services and fund administrative services to the Fund and to reimburse Invesco for administrative services fees paid to insurance companies that have agreed to provide services to the participants of separate accounts. These administrative services provided by the insurance companies may include, among other things: the printing of prospectuses, financial reports and proxy statements and the delivery of the same to existing participants; the maintenance of master accounts; the facilitation of purchases and redemptions requested by the participants; and the servicing of participants’ accounts. Pursuant to such agreement, for the year ended December 31, 2015, Invesco was paid $400,181 for accounting and fund administrative services and reimbursed $4,448,690 for services provided by insurance companies.
The Trust has entered into a transfer agency and service agreement with Invesco Investment Services, Inc. (“IIS”) pursuant to which the Fund has agreed to pay IIS a fee for providing transfer agency and shareholder services to the Fund and reimburse IIS for certain expenses incurred by IIS in the course of providing such services. For the year ended December 31, 2015, expenses incurred under the agreement are shown in the Statement of Operations as Transfer agent fees.
The Trust has entered into a master distribution agreement with Invesco Distributors, Inc. (“IDI”) to serve as the distributor for the Fund. The Trust has adopted a plan pursuant to Rule 12b-1 under the 1940 Act with respect to the Fund’s Series II shares (the “Plan”). The Fund, pursuant to the Plan, pays IDI compensation at the annual rate of 0.25% of the Fund’s average daily net assets of Series II shares. Of the Plan payments, up to 0.25% of the average daily net assets of the Series II shares may be paid to insurance companies who furnish continuing personal shareholder services to customers who purchase and own Series II shares of the Fund. For the year ended December 31, 2015, expenses incurred under the Plan are detailed in the Statement of Operations as Distribution fees.
For the year ended December 31, 2015, the Fund incurred $11,911 in brokerage commissions with Invesco Capital Markets, Inc., an affiliate of the Adviser and IDI, for portfolio transactions executed on behalf of the Fund.
Certain officers and trustees of the Trust are officers and directors of the Adviser, IIS and/or IDI.
NOTE 3—Additional Valuation Information
GAAP defines fair value as the price that would be received to sell an asset or paid to transfer a liability in an orderly transaction between market participants at the measurement date, under current market conditions. GAAP establishes a hierarchy that prioritizes the inputs to valuation methods, giving the highest priority to readily available unadjusted quoted prices in an active market for identical assets (Level 1) and the lowest priority to significant unobservable inputs (Level 3), generally when market prices are not readily available or are unreliable. Based on the valuation inputs, the securities or other investments are tiered into one of three levels. Changes in valuation methods may result in transfers in or out of an investment’s assigned level:
| | Level 1 — | Prices are determined using quoted prices in an active market for identical assets. |
| | Level 2 — | Prices are determined using other significant observable inputs. Observable inputs are inputs that other market participants may use in pricing a security. These may include quoted prices for similar securities, interest rates, prepayment speeds, credit risk, yield curves, loss severities, default rates, discount rates, volatilities and others. |
| | Level 3 — | Prices are determined using significant unobservable inputs. In situations where quoted prices or observable inputs are unavailable (for example, when there is little or no market activity for an investment at the end of the period), unobservable inputs may be used. Unobservable inputs reflect the Fund’s own assumptions about the factors market participants would use in determining fair value of the securities or instruments and would be based on the best available information. |
The following is a summary of the tiered valuation input levels, as of December 31, 2015. The level assigned to the securities valuations may not be an indication of the risk or liquidity associated with investing in those securities. Because of the inherent uncertainties of valuation, the values reflected in the financial statements may materially differ from the value received upon actual sale of those investments.
| | | | | | | | | | | | | | | | |
| | | Level 1 | | | Level 2 | | | Level 3 | | | Total | |
Equity Securities | | $ | 1,504,360,764 | | | $ | 82,585,183 | | | $ | — | | | $ | 1,586,945,947 | |
Forward Foreign Currency Contracts* | | | — | | | | 1,305,569 | | | | — | | | | 1,305,569 | |
Total Investments | | $ | 1,504,360,764 | | | $ | 83,890,752 | | | $ | — | | | $ | 1,588,251,516 | |
| * | Unrealized appreciation. |
NOTE 4—Derivative Investments
Value of Derivative Investments at Period-End
The table below summarizes the value of the Fund’s derivative investments, detailed by primary risk exposure, held as of December 31, 2015:
| | | | | | | | |
| | | Value | |
| Risk Exposure/Derivative Type | | Assets | | | Liabilities | |
Currency risk | | | | | | | | |
Forward foreign currency contracts(a) | | $ | 1,305,569 | | | $ | — | |
| (a) | Values are disclosed on the Statement of Assets and Liabilities under the caption Unrealized appreciation on forward foreign currency contracts outstanding. |
Invesco V.I. Growth and Income Fund
Effect of Derivative Investments for the year ended December 31, 2015
The table below summarizes the gains (losses) on derivative investments, detailed by primary risk exposure, recognized in earnings during the period:
| | | | |
| | | Location of Gain (Loss) on
Statement of Operations | |
| | | Forward Foreign
Currency Contracts | |
Realized Gain: | | | | |
Currency risk | | $ | 13,419,594 | |
Change in Unrealized Appreciation (Depreciation): | | | | |
Currency risk | | | (2,077,668 | ) |
Total | | $ | 11,341,926 | |
The table below summarizes the average notional value of forward foreign currency contracts outstanding during the period.
| | | | |
| | | Forward Foreign
Currency Contracts | |
Average notional value | | $ | 178,582,944 | |
| | | | | | | | | | | | | | | | | | | | | | | | | | |
| Open Forward Foreign Currency Contracts | |
Settlement
Date | | Counterparty | | Contract to | | | Notional
Value | | | Unrealized
Appreciation | |
| | | Deliver | | | Receive | | | |
01/15/16 | | Bank of New York Mellon (The) | | | CAD | | | | 14,420,929 | | | | USD | | | | 10,610,997 | | | $ | 10,418,956 | | | $ | 192,041 | |
01/15/16 | | State Street Bank and Trust Co. | | | CAD | | | | 14,420,928 | | | | USD | | | | 10,608,850 | | | | 10,418,955 | | | | 189,895 | |
01/15/16 | | Bank of New York Mellon (The) | | | CHF | | | | 8,309,831 | | | | USD | | | | 8,390,972 | | | | 8,301,621 | | | | 89,351 | |
01/15/16 | | State Street Bank and Trust Co. | | | CHF | | | | 8,309,830 | | | | USD | | | | 8,392,666 | | | | 8,301,620 | | | | 91,046 | |
01/15/16 | | Bank of New York Mellon (The) | | | EUR | | | | 16,403,132 | | | | USD | | | | 17,889,748 | | | | 17,832,854 | | | | 56,894 | |
01/15/16 | | State Street Bank and Trust Co. | | | EUR | | | | 16,403,132 | | | | USD | | | | 17,894,915 | | | | 17,832,854 | | | | 62,061 | |
01/15/16 | | Bank of New York Mellon (The) | | | GBP | | | | 11,037,449 | | | | USD | | | | 16,564,562 | | | | 16,271,523 | | | | 293,039 | |
01/15/16 | | State Street Bank and Trust Co. | | | GBP | | | | 11,037,450 | | | | USD | | | | 16,570,082 | | | | 16,271,524 | | | | 298,558 | |
01/15/16 | | Bank of New York Mellon (The) | | | ILS | | | | 32,154,719 | | | | USD | | | | 8,277,485 | | | | 8,265,623 | | | | 11,862 | |
01/15/16 | | State Street Bank and Trust Co. | | | ILS | | | | 32,154,719 | | | | USD | | | | 8,286,444 | | | | 8,265,622 | | | | 20,822 | |
Total open forward foreign currency contracts — Currency Risk | | | | | | | | | | | | | | | | | | | | | | $ | 1,305,569 | |
Currency Abbreviations:
| | |
| CAD | | –Canadian Dollar |
| CHF | | –Swiss Franc |
| | |
| EUR | | –Euro |
| GBP | | –British Pound Sterling |
| | |
| ILS | | –Israeli Shekel |
| USD | | –U.S. Dollar |
Offsetting Assets and Liabilities
Accounting Standards Update (“ASU”) No. 2011-11, Disclosures about Offsetting Assets and Liabilities, which was subsequently clarified in Financial Accounting Standards Board ASU 2013-01 “Clarifying the Scope of Disclosures about Offsetting Assets and Liabilities” is intended to enhance disclosures about financial instruments and derivative instruments that are subject to offsetting arrangements on the Statement of Assets and Liabilities and to enable investors to better understand the effect of those arrangements on the Fund’s financial position. In order for an arrangement to be eligible for netting, the Fund must have a basis to conclude that such netting arrangements are legally enforceable. The Fund enters into netting agreements and collateral agreements in an attempt to reduce the Fund’s Counterparty credit risk by providing for a single net settlement with a Counterparty of all financial transactions covered by the agreement in an event of default as defined under such agreement.
The following tables present derivative instruments that are either subject to an enforceable netting agreement or offset by collateral arrangements as of December 31, 2015.
| | | | | | | | | | | | | | | | | | | | |
| Counterparty | | Gross amounts
of Recognized
Assets | | | Gross Amounts Not Offset in the
Statement of Assets and Liabilities | | | Net
Amount | |
| | | Financial
Instruments | | | Collateral Received | | |
| | | | Non-Cash | | | Cash | | |
Bank of New York Mellon (The) | | $ | 662,382 | | | $ | — | | | $ | — | | | $ | — | | | $ | 662,382 | |
State Street Bank and Trust Co. | | | 643,187 | | | | — | | | | — | | | | — | | | | 643,187 | |
Total | | $ | 1,305,569 | | | $ | — | | | $ | — | | | $ | — | | | $ | 1,305,569 | |
NOTE 5—Security Transactions with Affiliated Funds
The Fund is permitted to purchase or sell securities from or to certain other Invesco Funds under specified conditions outlined in procedures adopted by the Board of Trustees of the Trust. The procedures have been designed to ensure that any purchase or sale of securities by the Fund from or to another fund or portfolio that is or could be considered an affiliate by virtue of having a common investment adviser (or affiliated investment advisers), common Trustees and/or common officers complies with Rule 17a-7 of the 1940 Act. Further, as defined under the procedures, each transaction is effected at the current market price. Pursuant to these procedures, for the year ended December 31, 2015, the Fund engaged in securities purchases of $260,266.
Invesco V.I. Growth and Income Fund
NOTE 6—Trustees’ and Officers�� Fees and Benefits
Trustees’ and Officers’ Fees and Benefits include amounts accrued by the Fund to pay remuneration to certain Trustees and Officers of the Fund. Trustees have the option to defer compensation payable by the Fund, and Trustees’ and Officers’ Fees and Benefits also include amounts accrued by the Fund to fund such deferred compensation amounts. Those Trustees who defer compensation have the option to select various Invesco Funds in which their deferral accounts shall be deemed to be invested. Finally, certain current Trustees were eligible to participate in a retirement plan that provided for benefits to be paid upon retirement to Trustees over a period of time based on the number of years of service. The Fund may have certain former Trustees who also participate in a retirement plan and receive benefits under such plan. Trustees’ and Officers’ Fees and Benefits include amounts accrued by the Fund to fund such retirement benefits. Obligations under the deferred compensation and retirement plans represent unsecured claims against the general assets of the Fund.
NOTE 7—Cash Balances
The Fund is permitted to temporarily carry a negative or overdrawn balance in its account with State Street Bank and Trust Company, the custodian bank. Such balances, if any at period end, are shown in the Statement of Assets and Liabilities under the payable caption Amount due custodian. To compensate the custodian bank for such overdrafts, the overdrawn Fund may either (1) leave funds as a compensating balance in the account so the custodian bank can be compensated by earning the additional interest; or (2) compensate by paying the custodian bank at a rate agreed upon by the custodian bank and Invesco, not to exceed the contractually agreed upon rate.
NOTE 8—Distributions to Shareholders and Tax Components of Net Assets
Tax Character of Distributions to Shareholders Paid During the Fiscal Years Ended December 31, 2015 and 2014:
| | | | | | | | |
| | | 2015 | | | 2014 | |
Ordinary income | | $ | 59,704,246 | | | $ | 46,556,343 | |
Long-term capital gain | | | 238,768,621 | | | | 215,900,699 | |
Total distributions | | $ | 298,472,867 | | | $ | 262,457,042 | |
Tax Components of Net Assets at Period-End:
| | | | |
| | | 2015 | |
Undistributed ordinary income | | $ | 17,466,631 | |
Undistributed long-term gain | | | 176,902,217 | |
Net unrealized appreciation — investments | | | 137,803,637 | |
Net unrealized appreciation (depreciation) — other investments | | | (34,564 | ) |
Temporary book/tax differences | | | (223,987 | ) |
Shares of beneficial interest | | | 1,252,263,152 | |
Total net assets | | $ | 1,584,177,086 | |
The difference between book-basis and tax-basis unrealized appreciation (depreciation) is due to differences in the timing of recognition of gains and losses on investments for tax and book purposes. The Fund’s net unrealized appreciation difference is attributable primarily to wash sales.
The temporary book/tax differences are a result of timing differences between book and tax recognition of income and/or expenses. The Fund’s temporary book/tax differences are the result of the trustee deferral of compensation and retirement plan benefits.
Capital loss carryforward is calculated and reported as of a specific date. Results of transactions and other activity after that date may affect the amount of capital loss carryforward actually available for the Fund to utilize. Capital losses generated in years beginning after December 22, 2010 can be carried forward for an unlimited period, whereas previous losses expire in eight tax years. Capital losses with an expiration period may not be used to offset capital gains until all net capital losses without an expiration date have been utilized. Capital loss carryforwards with no expiration date will retain their character as either short-term or long-term capital losses instead of as short-term capital losses as under prior law. The ability to utilize capital loss carryforwards in the future may be limited under the Internal Revenue Code and related regulations based on the results of future transactions.
The Fund does not have a capital loss carryforward as of December 31, 2015.
NOTE 9—Investment Securities
The aggregate amount of investment securities (other than short-term securities, U.S. Treasury obligations and money market funds, if any) purchased and sold by the Fund during the year ended December 31, 2015 was $401,424,966 and $674,845,397, respectively. Cost of investments on a tax basis includes the adjustments for financial reporting purposes as of the most recently completed federal income tax reporting period-end.
| | | | |
| Unrealized Appreciation (Depreciation) of Investment Securities on a Tax Basis | |
Aggregate unrealized appreciation of investment securities | | $ | 253,827,900 | |
Aggregate unrealized (depreciation) of investment securities | | | (116,024,263 | ) |
Net unrealized appreciation of investment securities | | $ | 137,803,637 | |
Cost of investments for tax purposes is $1,449,142,310.
Invesco V.I. Growth and Income Fund
NOTE 10—Reclassification of Permanent Differences
Primarily as a result of differing book/tax treatment of foreign currency transactions and distributions, on December 31, 2015, undistributed net investment income was decreased by $283,087, undistributed net realized gain was increased by $283,087. This reclassification had no effect on the net assets of the Fund.
NOTE 11—Share Information
| | | | | | | | | | | | | | | | |
| | | Summary of Share Activity | |
| | | Years ended December 31, | |
| | | 2015(a) | | | 2014 | |
| | | Shares | | | Amount | | | Shares | | | Amount | |
Sold: | | | | | | | | | | | | | | | | |
Series I | | | 873,247 | | | $ | 20,855,550 | | | | 581,688 | | | $ | 15,339,280 | |
Series II | | | 9,865,909 | | | | 222,630,272 | | | | 4,416,406 | | | | 110,573,933 | |
| | | | |
Issued as reinvestment of dividends: | | | | | | | | | | | | | | | | |
Series I | | | 1,523,917 | | | | 28,588,686 | | | | 878,063 | | | | 21,521,338 | |
Series II | | | 14,393,823 | | | | 269,884,181 | | | | 9,846,167 | | | | 240,935,704 | |
| | | | |
Reacquired: | | | | | | | | | | | | | | | | |
Series I | | | (1,228,356 | ) | | | (28,907,051 | ) | | | (1,513,399 | ) | | | (39,952,357 | ) |
Series II | | | (23,832,436 | ) | | | (551,061,798 | ) | | | (30,433,883 | ) | | | (790,306,045 | ) |
Net increase in share activity | | | 1,596,104 | | | $ | (38,010,160 | ) | | | (16,224,958 | ) | | $ | (441,888,147 | ) |
| (a) | There are entities that are record owners of more than 5% of the outstanding shares of the Fund and in the aggregate own 82% of the outstanding shares of the Fund. The Fund and the Fund’s principal underwriter or adviser, are parties to participation agreements with these entities whereby these entities sell units of interest in separate accounts funding variable products that are invested in the Fund. The Fund, Invesco and/or Invesco affiliates may make payments to these entities, which are considered to be related to the Fund, for providing services to the Fund, Invesco and/or Invesco affiliates including but not limited to services such as, securities brokerage, third party record keeping and account servicing and administrative services. The Fund has no knowledge as to whether all or any portion of the shares owned of record by these entities are also owned beneficially. |
NOTE 12—Financial Highlights
The following schedule presents financial highlights for a share of the Fund outstanding throughout the periods indicated.
| | | | | | | | | | | | | | | | | | | | | | | | | | | | | | | | | | | | | | | | | | | | | | | | | | | | | | | | |
| | | Net asset
value,
beginning
of period | | | Net
investment
income(a) | | | Net gains
(losses)
on securities
(both
realized and
unrealized) | | | Total from
investment
operations | | | Dividends
from net
investment
income | | | Distributions
from net
realized
gains | | | Total
distributions | | | Net asset
value, end
of period | | | Total
return(b) | | | Net assets,
end of period
(000’s omitted) | | | Ratio of
expenses
to average
net assets
with fee waivers
and/or expenses
absorbed | | | Ratio of
expenses
to average net
assets without
fee waivers
and/or expenses
absorbed | | | Ratio of net
investment
income
to average
net assets | | | Portfolio
turnover(c) | |
Series I | | | | | | | | | | | | | | | | | | | | | | | | | | | | | | | | | | | | | | | | | | | | | | | | | | | | | | | | |
Year ended 12/31/15 | | $ | 25.15 | | | $ | 0.33 | | | $ | (1.30 | ) | | $ | (0.97 | ) | | $ | (0.74 | ) | | $ | (3.84 | ) | | $ | (4.58 | ) | | $ | 19.60 | | | | (3.06 | )% | | $ | 149,066 | | | | 0.78 | %(e) | | | 0.84 | %(e) | | | 1.41 | %(e) | | | 22 | % |
Year ended 12/31/14 | | | 26.29 | | | | 0.59 | (d) | | | 2.02 | | | | 2.61 | | | | (0.50 | ) | | | (3.25 | ) | | | (3.75 | ) | | | 25.15 | | | | 10.28 | | | | 161,866 | | | | 0.78 | | | | 0.83 | | | | 2.22 | (d) | | | 31 | |
Year ended 12/31/13 | | | 20.07 | | | | 0.32 | | | | 6.47 | | | | 6.79 | | | | (0.36 | ) | | | (0.21 | ) | | | (0.57 | ) | | | 26.29 | | | | 34.08 | | | | 170,637 | | | | 0.75 | | | | 0.83 | | | | 1.37 | | | | 29 | |
Year ended 12/31/12 | | | 17.77 | | | | 0.33 | | | | 2.27 | | | | 2.60 | | | | (0.30 | ) | | | — | | | | (0.30 | ) | | | 20.07 | | | | 14.63 | | | | 139,947 | | | | 0.66 | | | | 0.84 | | | | 1.72 | | | | 31 | |
Year ended 12/31/11 | | | 18.40 | | | | 0.30 | | | | (0.70 | ) | | | (0.40 | ) | | | (0.23 | ) | | | — | | | | (0.23 | ) | | | 17.77 | | | | (2.01 | ) | | | 156,617 | | | | 0.61 | | | | 0.84 | | | | 1.65 | | | | 28 | |
Series II | | | | | | | | | | | | | | | | | | | | | | | | | | | | | | | | | | | | | | | | | | | | | | | | | | | | | | | | |
Year ended 12/31/15 | | | 25.09 | | | | 0.27 | | | | (1.29 | ) | | | (1.02 | ) | | | (0.65 | ) | | | (3.84 | ) | | | (4.49 | ) | | | 19.58 | | | | (3.26 | ) | | | 1,435,111 | | | | 1.03 | (e) | | | 1.09 | (e) | | | 1.16 | (e) | | | 22 | |
Year ended 12/31/14 | | | 26.23 | | | | 0.52 | (d) | | | 2.01 | | | | 2.53 | | | | (0.42 | ) | | | (3.25 | ) | | | (3.67 | ) | | | 25.09 | | | | 9.96 | | | | 1,828,854 | | | | 1.03 | | | | 1.08 | | | | 1.97 | (d) | | | 31 | |
Year ended 12/31/13 | | | 20.03 | | | | 0.26 | | | | 6.46 | | | | 6.72 | | | | (0.31 | ) | | | (0.21 | ) | | | (0.52 | ) | | | 26.23 | | | | 33.77 | | | | 2,335,747 | | | | 1.00 | | | | 1.08 | | | | 1.12 | | | | 29 | |
Year ended 12/31/12 | | | 17.74 | | | | 0.28 | | | | 2.27 | | | | 2.55 | | | | (0.26 | ) | | | — | | | | (0.26 | ) | | | 20.03 | | | | 14.35 | | | | 1,946,286 | | | | 0.91 | | | | 1.09 | | | | 1.47 | | | | 31 | |
Year ended 12/31/11 | | | 18.37 | | | | 0.25 | | | | (0.69 | ) | | | (0.44 | ) | | | (0.19 | ) | | | — | | | | (0.19 | ) | | | 17.74 | | | | (2.26 | ) | | | 1,724,830 | | | | 0.86 | | | | 1.09 | | | | 1.40 | | | | 28 | |
| (a) | Calculated using average shares outstanding. |
| (b) | Includes adjustments in accordance with accounting principles generally accepted in the United States of America and as such, the net asset value for financial reporting purposes and the returns based upon those net asset values may differ from the net asset value and returns for shareholder transactions. Total returns are not annualized for periods less than one year, if applicable and do not reflect charges assessed in connection with a variable product, which if included would reduce total returns. |
| (c) | Portfolio turnover is calculated at the fund level and is not annualized for periods less than one year, if applicable. |
| (d) | Net investment income per share and the ratio of net investment income to average net assets include significant dividends received during the period. Net investment income per share and the ratio of net investment income to average net assets excluding the significant dividends are $0.35 and 1.29%, and $0.28 and 1.04%, for Series I and Series II, respectively. |
| (e) | Ratios are based on average daily net assets (000’s omitted) of $158,156 and $1,727,850 for Series I and Series II shares, respectively. |
Invesco V.I. Growth and Income Fund
Report of Independent Registered Public Accounting Firm
To the Board of Trustees of AIM Variable Insurance Funds (Invesco Variable Insurance Funds)
and Shareholders of Invesco V.I. Growth and Income Fund:
In our opinion, the accompanying statement of assets and liabilities, including the schedule of investments, and the related statements of operations and of changes in net assets and the financial highlights present fairly, in all material respects, the financial position of Invesco V.I. Growth and Income Fund (one of the funds constituting AIM Variable Insurance Funds (Invesco Variable Insurance Funds), hereafter referred to as the “Fund”) at December 31, 2015, the results of its operations for the year then ended, the changes in its net assets for each of the two years in the period then ended and the financial highlights for each of the five years in the period then ended, in conformity with accounting principles generally accepted in the United States of America. These financial statements and financial highlights (hereafter referred to as “financial statements”) are the responsibility of the Fund’s management. Our responsibility is to express an opinion on these financial statements based on our audits. We conducted our audits of these financial statements in accordance with the standards of the Public Company Accounting Oversight Board (United States). Those standards require that we plan and perform the audit to obtain reasonable assurance about whether the financial statements are free of material misstatement. An audit includes examining, on a test basis, evidence supporting the amounts and disclosures in the financial statements, assessing the accounting principles used and significant estimates made by management, and evaluating the overall financial statement presentation. We believe that our audits, which included confirmation of securities at December 31, 2015 by correspondence with the custodian and brokers, and the application of alternative auditing procedures where confirmations of security purchases have not been received, provide a reasonable basis for our opinion.
PRICEWATERHOUSECOOPERS LLP
Houston, Texas
February 15, 2016
Invesco V.I. Growth and Income Fund
Calculating your ongoing Fund expenses
Example
As a shareholder of the Fund, you incur ongoing costs, including management fees; distribution and/or service fees (12b-1); and other Fund expenses. This example is intended to help you understand your ongoing costs (in dollars) of investing in the Fund and to compare these costs with ongoing costs of investing in other mutual funds. The example is based on an investment of $1,000 invested at the beginning of the period and held for the entire period July 1, 2015 through December 31, 2015.
The actual and hypothetical expenses in the examples below do not represent the effect of any fees or other expenses assessed in connection with a variable product; if they did, the expenses shown would be higher while the ending account values shown would be lower.
Actual expenses
The table below provides information about actual account values and actual expenses. You may use the information in this table, together with the amount you invested, to estimate the expenses that you paid over the period. Simply divide your account value by $1,000 (for example, an $8,600 account value divided by $1,000 = 8.6), then multiply the result by the number in the table under the heading entitled “Actual Expenses Paid During Period” to estimate the expenses you paid on your account during this period.
Hypothetical example for comparison purposes
The table below also provides information about hypothetical account values and hypothetical expenses based on the Fund’s actual expense ratio and an assumed rate of return of 5% per year before expenses, which is not the Fund’s actual return.
The hypothetical account values and expenses may not be used to estimate the actual ending account balance or expenses you paid for the period. You may use this information to compare the ongoing costs of investing in the Fund and other funds. To do so, compare this 5% hypothetical example with the 5% hypothetical examples that appear in the shareholder reports of the other funds.
Please note that the expenses shown in the table are meant to highlight your ongoing costs. Therefore, the hypothetical information is useful in comparing ongoing costs, and will not help you determine the relative total costs of owning different funds.
| | | | | | | | | | | | | | | | | | | | | | | | |
| Class | | Beginning
Account Value
(07/01/15) | | | ACTUAL | | | HYPOTHETICAL (5% annual return before expenses) | | | Annualized
Expense
Ratio | |
| | | Ending
Account Value
(12/31/15)1 | | | Expenses
Paid During
Period2 | | | Ending
Account Value
(12/31/15) | | | Expenses
Paid During
Period2 | | |
Series I | | $ | 1,000.00 | | | $ | 950.10 | | | $ | 3.83 | | | $ | 1,021.27 | | | $ | 3.97 | | | | 0.78 | % |
Series II | | | 1,000.00 | | | | 948.70 | | | | 5.06 | | | | 1,020.01 | | | | 5.24 | | | | 1.03 | |
| 1 | The actual ending account value is based on the actual total return of the Fund for the period July 1, 2015 through December 31, 2015, after actual expenses and will differ from the hypothetical ending account value which is based on the Fund’s expense ratio and a hypothetical annual return of 5% before expenses. |
| 2 | Expenses are equal to the Fund’s annualized expense ratio as indicated above multiplied by the average account value over the period, multiplied by 184/365 to reflect the most recent fiscal half year. |
Invesco V.I. Growth and Income Fund
Tax Information
Form 1099-DIV, Form 1042-S and other year–end tax information provide shareholders with actual calendar year amounts that should be included in their tax returns. Shareholders should consult their tax advisors.
The following distribution information is being provided as required by the Internal Revenue Code or to meet a specific state’s requirement.
The Fund designates the following amounts or, if subsequently determined to be different, the maximum amount allowable for its fiscal year ended December 31, 2015:
| | | | |
Federal and State Income Tax | |
Long-Term Capital Gain Distributions | | $ | 238,768,621 | |
Corporate Dividends Received Deduction* | | | 61.60 | % |
U.S. Treasury Obligations* | | | 0.00 | % |
| | * | The above percentages are based on ordinary income dividends paid to shareholders during the Fund’s fiscal year. |
Invesco V.I. Growth and Income Fund
Trustees and Officers
The address of each trustee and officer is AIM Variable Insurance Funds (Invesco Variable Insurance Funds) (the “Trust”), 11 Greenway Plaza, Suite 1000, Houston, Texas 77046-1173. The trustees serve for the life of the Trust, subject to their earlier death, incapacitation, resignation, retirement or removal as more specifically provided in the Trust’s organizational documents. Each officer serves for a one year term or until their successors are elected and qualified. Column two below includes length of time served with predecessor entities, if any.
| | | | | | | | |
Name, Year of Birth and
Position(s) Held with the Trust | | Trustee and/
or Officer Since | | Principal Occupation(s)
During Past 5 Years | | Number of Funds in Fund Complex Overseen by Trustee | | Other Directorship(s) Held by Trustee During Past 5 Years |
| Interested Persons | | | | | | | | |
| Martin L. Flanagan1 — 1960 Trustee | | 2007 | | Executive Director, Chief Executive Officer and President, Invesco Ltd. (ultimate parent of Invesco and a global investment management firm); Advisor to the Board, Invesco Advisers, Inc. (formerly known as Invesco Institutional (N.A.), Inc.); Trustee, The Invesco Funds; Vice Chair, Investment Company Institute; and Member of Executive Board, SMU Cox School of Business Formerly: Chairman and Chief Executive Officer, Invesco Advisers, Inc. (registered investment adviser); Director, Chairman, Chief Executive Officer and President, IVZ Inc. (holding company), INVESCO Group Services, Inc. (service provider) and Invesco North American Holdings, Inc. (holding company); Director, Chief Executive Officer and President, Invesco Holding Company Limited (parent of Invesco and a global investment management firm); Director, Invesco Ltd.; Chairman, Investment Company Institute and President, Co-Chief Executive Officer, Co-President, Chief Operating Officer and Chief Financial Officer, Franklin Resources, Inc. (global investment management organization) | | 146 | | None |
Philip A. Taylor2 — 1954 Trustee, President and Principal Executive Officer | | 2006 | | Head of North American Retail and Senior Managing Director, Invesco Ltd.; Director, Co-Chairman, Co-President and Co-Chief Executive Officer, Invesco Advisers, Inc. (formerly known as Invesco Institutional (N.A.), Inc.) (registered investment adviser); Director, Chairman, Chief Executive Officer and President, Invesco Management Group, Inc. (formerly known as Invesco Aim Management Group, Inc.) (financial services holding company); Director and Chairman, Invesco Investment Services, Inc. (formerly known as Invesco Aim Investment Services, Inc.) (registered transfer agent) Chief Executive Officer, Invesco Corporate Class Inc. (corporate mutual fund company) Director, Chairman and Chief Executive Officer, Invesco Canada Ltd. (formerly known as Invesco Trimark Ltd./Invesco Trimark Ltèe) (registered investment adviser and registered transfer agent); Trustee, President and Principal Executive Officer, The Invesco Funds (other than AIM Treasurer’s Series Trust (Invesco Treasurer’s Series Trust), Short-Term Investments Trust and Invesco Management Trust); Trustee and Executive Vice President, The Invesco Funds (AIM Treasurer’s Series Trust (Invesco Treasurer’s Series Trust), Short-Term Investments Trust and Invesco Management Trust only); Director, Invesco Investment Advisers LLC (formerly known as Van Kampen Asset Management); Director, Chief Executive Officer and President, Van Kampen Exchange Corp. Formerly: Director and President, INVESCO Funds Group, Inc. (registered investment adviser and registered transfer agent); Director and Chairman, IVZ Distributors, Inc. (formerly known as INVESCO Distributors, Inc.) (registered broker dealer); Director, President and Chairman, Invesco Inc. (holding company), Invesco Canada Holdings Inc. (holding company), Trimark Investments Ltd./Placements Trimark Ltèe and Invesco Financial Services Ltd/Services Financiers Invesco Ltèe; Chief Executive Officer, Invesco Canada Fund Inc (corporate mutual fund company); Director and Chairman, Van Kampen Investor Services Inc.; Director, Chief Executive Officer and President, 1371 Preferred Inc. (holding company) and Van Kampen Investments Inc.; Director and President, AIM GP Canada Inc. (general partner for limited partnerships) and Van Kampen Advisors, Inc.; Director and Chief Executive Officer, Invesco Trimark Dealer Inc. (registered broker dealer); Director, Invesco Distributors, Inc. (formerly known as Invesco Aim Distributors, Inc.) (registered broker dealer); Manager, Invesco PowerShares Capital Management LLC; Director, Chief Executive Officer and President, Invesco Advisers, Inc.; Director, Chairman, Chief Executive Officer and President, Invesco Aim Capital Management, Inc.; President, Invesco Trimark Dealer Inc. and Invesco Trimark Ltd./Invesco Trimark Ltèe; Director and President, AIM Trimark Corporate Class Inc. and AIM Trimark Canada Fund Inc.; Senior Managing Director, Invesco Holding Company Limited; Director and Chairman, Fund Management Company (former registered broker dealer); President and Principal Executive Officer, The Invesco Funds (AIM Treasurer’s Series Trust (Invesco Treasurer’s Series Trust), and Short-Term Investments Trust only); President, AIM Trimark Global Fund Inc. and AIM Trimark Canada Fund Inc | | 146 | | None |
| 1 | Mr. Flanagan is considered an interested person (within the meaning of Section 2(a)(19) of the 1940 Act) of the Trust because he is an officer of the Adviser to the Trust, and an officer and a director of Invesco Ltd., ultimate parent of the Adviser. |
| 2 | Mr. Taylor is considered an interested person (within the meaning of Section 2(a)(19) of the 1940 Act) of the Trust because he is an officer and a director of the Adviser. |
Invesco V.I. Growth and Income Fund
Trustees and Officers—(continued)
| | | | | | | | |
Name, Year of Birth and
Position(s) Held with the Trust | | Trustee and/
or Officer Since | | Principal Occupation(s)
During Past 5 Years | | Number of Funds in Fund Complex Overseen by Trustee | | Other Directorship(s)
Held by Trustee During Past 5 Years |
| Independent Trustees | | | | | | | | |
Bruce L. Crockett — 1944 Trustee and Chair | | 2003 | | Chairman, Crockett Technologies Associates (technology consulting company) Formerly: Director, Captaris (unified messaging provider); Director, President and Chief Executive Officer, COMSAT Corporation; Chairman, Board of Governors of INTELSAT (international communications company); ACE Limited (insurance company); Independent Directors Council and Investment Company Institute | | 146 | | ALPS (Attorneys Liability Protection Society) (insurance company) and Globe Specialty Metals, Inc. (metallurgical company) |
David C. Arch — 1945 Trustee | | 2010 | | Chairman of Blistex Inc., a consumer health care products manufacturer | | 146 | | Board member of the Illinois Manufacturers’ Association; Member of the Board of Visitors, Institute for the Humanities, University of Michigan |
James T. Bunch — 1942 Trustee | | 2000 | | Managing Member, Grumman Hill Group LLC (family office/private equity investments) Formerly: Chairman of the Board of Trustees, Evans Scholars Foundation and Chairman, Board of Governors, Western Golf Association | | 146 | | Trustee, Evans Scholars Foundation; and Chairman of the Board, Denver Film Society |
Albert R. Dowden — 1941 Trustee | | 2003 | | Director of a number of public and private business corporations, including the Boss Group, Ltd. (private investment and management); Nature’s Sunshine Products, Inc. and Reich & Tang Funds (5 portfolios) (registered investment company) Formerly: Director, Homeowners of America Holding Corporation/Homeowners of America Insurance Company (property casualty company); Director, Continental Energy Services, LLC (oil and gas pipeline service); Director, CompuDyne Corporation (provider of product and services to the public security market) and Director, Annuity and Life Re (Holdings), Ltd. (reinsurance company); Director, President and Chief Executive Officer, Volvo Group North America, Inc.; Senior Vice President, AB Volvo; Director of various public and private corporations; Chairman, DHJ Media, Inc.; Director, Magellan Insurance Company; and Director, The Hertz Corporation, Genmar Corporation (boat manufacturer), National Media Corporation; Advisory Board of Rotary Power International (designer, manufacturer, and seller of rotary power engines); and Chairman, Cortland Trust, Inc. (registered investment company) | | 146 | | Director of: Nature’s Sunshine Products, Inc., Reich & Tang Funds, Homeowners of America Holding Corporation/ Homeowners of America Insurance Company, the Boss Group |
Jack M. Fields — 1952 Trustee | | 2003 | | Chief Executive Officer, Twenty First Century Group, Inc. (government affairs company); Owner and Chief Executive Officer, Dos Angeles Ranch, L.P. (cattle, hunting, corporate entertainment); and Discovery Global Education Fund (non-profit) Formerly: Chief Executive Officer, Texana Timber LP (sustainable forestry company); Director of Cross Timbers Quail Research Ranch (non-profit); and member of the U.S. House of Representatives | | 146 | | Insperity, Inc. (formerly known as Administaff) |
Eli Jones — Trustee | | 2016 | | Professor and Dean, Mays Business School, Texas A&M University Formerly: Professor and Dean, Walton College of Business, University of Arkansas, and E.J. Ourso College of Business, Louisiana State University | | 146 | | Director, Insperity, Inc., (2011-present) and ARVEST Bank (2012-2015) |
Prema Mathai-Davis — 1950 Trustee | | 2003 | | Retired. Formerly: Chief Executive Officer, YWCA of the U.S.A. | | 146 | | None |
Larry Soll — 1942 Trustee | | 1997 | | Retired. Formerly: Chairman, Chief Executive Officer and President, Synergen Corp. (a biotechnology company) | | 146 | | None |
Robert C. Troccoli — Trustee | | 2016 | | Retired. Formerly: Senior Partner, KPMG LLP | | 146 | | None |
Raymond Stickel, Jr. — 1944 Trustee | | 2005 | | Retired. Formerly: Director, Mainstay VP Series Funds, Inc. (25 portfolios) and Partner, Deloitte & Touche | | 146 | | None |
Suzanne H. Woolsey — 1941 Trustee | | 2014 | | Chief Executive Officer of Woolsey Partners LLC | | 146 | | Emeritus Chair of the Board of Trustees of the Institute for Defense Analyses; Trustee of Colorado College; Trustee of California Institute of Technology; Prior to 2014, Director of Fluor Corp.; Prior to 2010, Trustee of the German Marshall Fund of the United States; Prior to 2010 Trustee of the Rocky Mountain Institute |
Invesco V.I. Growth and Income Fund
Trustees and Officers—(continued)
| | | | | | | | |
Name, Year of Birth and
Position(s) Held with the Trust | | Trustee and/
or Officer Since | | Principal Occupation(s)
During Past 5 Years | | Number of Funds in Fund Complex Overseen by Trustee | | Other Directorship(s)
Held by Trustee During Past 5 Years |
| Other Officers | | | | | | | | |
Russell C. Burk — 1958 Senior Vice President and Senior Officer | | 2005 | | Senior Vice President and Senior Officer, The Invesco Funds | | N/A | | N/A |
John M. Zerr — 1962 Senior Vice President, Chief Legal Officer and Secretary | | 2006 | | Director, Senior Vice President, Secretary and General Counsel, Invesco Management Group, Inc. (formerly known as Invesco Aim Management Group, Inc.) and Van Kampen Exchange Corp.; Senior Vice President, Invesco Advisers, Inc. (formerly known as Invesco Institutional (N.A.), Inc.) (registered investment adviser); Senior Vice President and Secretary, Invesco Distributors, Inc. (formerly known as Invesco Aim Distributors, Inc.); Director, Vice President and Secretary, Invesco Investment Services, Inc. (formerly known as Invesco Aim Investment Services, Inc.); Senior Vice President, Chief Legal Officer and Secretary, The Invesco Funds; Managing Director, Invesco PowerShares Capital Management LLC; Director, Secretary and General Counsel, Invesco Investment Advisers LLC (formerly known as Van Kampen Asset Management); Secretary and General Counsel, Invesco Capital Markets, Inc. (formerly known as Van Kampen Funds Inc.) and Chief Legal Officer, PowerShares Exchange-Traded Fund Trust, PowerShares Exchange-Traded Fund Trust II, PowerShares India Exchange-Traded Fund Trust, PowerShares Actively Managed Exchange-Traded Fund Trust, and PowerShares Actively Managed Exchange-Traded Commodity Fund Trust Formerly: Director, Vice President and Secretary, IVZ Distributors, Inc. (formerly known as INVESCO distributors, Inc.); Director and Vice President, INVESCO Funds Group, Inc.; Director and Vice President, Van Kampen Advisors Inc.; Director, Vice President, Secretary and General Counsel, Van Kampen Investor Services Inc.; Director, Invesco Distributors, Inc. (formerly known as Invesco Aim Distributors, Inc.); Director, Senior Vice President, General Counsel and Secretary, Invesco Aim Advisers, Inc. and Van Kampen Investments Inc.; Director, Vice President and Secretary, Fund Management Company; Director, Senior Vice President, Secretary, General Counsel and Vice President, Invesco Aim Capital Management, Inc.; Chief Operating Officer and General Counsel, Liberty Ridge Capital, Inc. (an investment adviser); Vice President and Secretary, PBHG Funds (an investment company) and PBHG Insurance Series Fund (an investment company); Chief Operating Officer, General Counsel and Secretary, Old Mutual Investment Partners (a broker-dealer); General Counsel and Secretary, Old Mutual Fund Services (an administrator) and Old Mutual Shareholder Services (a shareholder servicing center); Executive Vice President, General Counsel and Secretary, Old Mutual Capital, Inc. (an investment adviser); and Vice President and Secretary, Old Mutual Advisors Funds (an investment company) | | N/A | | N/A |
Sheri Morris — 1964 Vice President, Treasurer and Principal Financial Officer | | 2003 | | Vice President, Treasurer and Principal Financial Officer, The Invesco Funds; Vice President, Invesco Advisers, Inc. (formerly known as Invesco Institutional (N.A.), Inc.) (registered investment adviser); and Vice President, PowerShares Exchange-Traded Fund Trust, PowerShares Exchange-Traded Fund Trust II, PowerShares India Exchange-Traded Fund Trust, PowerShares Actively Managed Exchange-Traded Fund Trust, and PowerShares Actively Managed Exchange-Traded Commodity Fund Trust Formerly: Vice President, Invesco Aim Advisers, Inc., Invesco Aim Capital Management, Inc. and Invesco Aim Private Asset Management, Inc.; Assistant Vice President and Assistant Treasurer, The Invesco Funds and Assistant Vice President, Invesco Advisers, Inc., Invesco Aim Capital Management, Inc. and Invesco Aim Private Asset Management, Inc.; and Treasurer, PowerShares Exchange-Traded Fund Trust, PowerShares Exchange-Traded Fund Trust II, PowerShares India Exchange-Traded Fund Trust and PowerShares Actively Managed Exchange-Traded Fund Trust | | N/A | | N/A |
Invesco V.I. Growth and Income Fund
Trustees and Officers—(continued)
| | | | | | | | |
Name, Year of Birth and
Position(s) Held with the Trust | | Trustee and/
or Officer Since | | Principal Occupation(s)
During Past 5 Years | | Number of Funds in Fund Complex Overseen by Trustee | | Other Directorship(s)
Held by Trustee During Past 5 Years |
| Other Officers—(continued) | | | | | | | | |
Karen Dunn Kelley — 1960 Vice President | | 2003 | | Senior Managing Director, Investments, Invesco Ltd.; Director, Co-President, Co-Chief Executive Officer, and Co-Chairman, Invesco Advisers, Inc. (formerly known as Invesco Institutional (N.A.), Inc.) (registered investment adviser); Chairman, Invesco Senior Secured Management, Inc.; Senior Vice President, Invesco Management Group, Inc. (formerly known as Invesco Aim Management Group, Inc.); Executive Vice President, Invesco Distributors, Inc. (formerly known as Invesco Aim Distributors, Inc.); Director, Invesco Mortgage Capital Inc. and Invesco Management Company Limited; Vice President, The Invesco Funds (other than AIM Treasurer’s Series Trust (Invesco Treasurer’s Series Trust), Short-Term Investments Trust and Invesco Management Trust); and President and Principal Executive Officer, The Invesco Funds (AIM Treasurer’s Series Trust (Invesco Treasurer’s Series Trust), Short-Term Investments Trust and Invesco Management Trust only) Formerly: Director and President, INVESCO Asset Management (Bermuda) Ltd., Director, INVESCO Global Asset Management Limited and INVESCO Management S.A.; Senior Vice President, Van Kampen Investments Inc. and Invesco Advisers, Inc. (formerly known as Invesco Institutional (N.A.), Inc.) (registered investment adviser); Vice President, Invesco Advisers, Inc. (formerly known as Invesco Institutional (N.A.), Inc.); Director of Cash Management and Senior Vice President, Invesco Advisers, Inc. and Invesco Aim Capital Management, Inc.; Director and President, Fund Management Company; Chief Cash Management Officer, Director of Cash Management, Senior Vice President, and Managing Director, Invesco Aim Capital Management, Inc.; Director of Cash Management, Senior Vice President, and Vice President, Invesco Advisers, Inc. and The Invesco Funds (AIM Treasurer’s Series Trust (Invesco Treasurer’s Series Trust), and Short-Term Investments Trust only) | | N/A | | N/A |
Crissie M. Wisdom — 1969 Anti-Money Laundering Compliance Officer | | 2013 | | Anti-Money Laundering Compliance Officer, Invesco Advisers, Inc. (formerly known as Invesco Institutional (N.A.), Inc.) (registered investment adviser), Invesco Capital Markets, Inc. (formerly known as Van Kampen Funds Inc.), Invesco Distributors, Inc., Invesco Investment Services, Inc., Invesco Management Group, Inc., Van Kampen Exchange Corp., The Invesco Funds, and PowerShares Exchange-Traded Fund Trust, PowerShares Exchange-Traded Fund Trust II, PowerShares India Exchange-Traded Fund Trust, PowerShares Actively Managed Exchange-Traded Fund Trust and PowerShares Actively Managed Exchange-Traded Commodity Fund Trust; Anti-Money Laundering Compliance Officer and Bank Secrecy Act Officer, INVESCO National Trust Company and Invesco Trust Company; and Fraud Prevention Manager and Controls and Risk Analysis Manager for Invesco Investment Services, Inc. | | N/A | | N/A |
Lisa O. Brinkley — 1959 Chief Compliance Officer | | 2015 | | Senior Vice President and Chief Compliance Officer, Invesco Advisers, Inc. (registered investment adviser) (formerly known as Invesco Institutional (N.A., Inc.); and Chief Compliance Officer, The Invesco Funds Formerly: Global Assurance Officer, Invesco Ltd. and Vice President, The Invesco Funds; Chief Compliance Officer, Invesco Distributors, Inc. (formerly known as Invesco Aim Distributors, Inc.), Invesco Investment Services, Inc.(formerly known as Invesco Aim Investment Services, Inc.) and Van Kampen Investor Services Inc.; Senior Vice President, Invesco Management Group, Inc.; Senior Vice President and Chief Compliance Officer, Invesco Advisers, Inc. and The Invesco Funds; Vice President and Chief Compliance Officer, Invesco Aim Capital Management, Inc. and Invesco Distributors, Inc.; Vice President, Invesco Investment Services, Inc. and Fund Management Company | | N/A | | N/A |
The Statement of Additional Information of the Trust includes additional information about the Fund’s Trustees and is available upon request, without charge, by calling 1.800.959.4246. Please refer to the Fund’s prospectus for information on the Fund’s sub-advisers.
| | | | | | |
Office of the Fund 11 Greenway Plaza, Suite 1000 Houston, TX 77046-1173 | | Investment Adviser Invesco Advisers, Inc. 1555 Peachtree Street, N.E. Atlanta, GA 30309 | | Distributor Invesco Distributors, Inc. 11 Greenway Plaza, Suite 1000 Houston, TX 77046-1173 | | Auditors PricewaterhouseCoopers LLP 1000 Louisiana Street, Suite 5800 Houston, TX 77002-5678 |
| | | |
| | | | | | |
Counsel to the Fund Stradley Ronon Stevens & Young, LLP 2005 Market Street, Suite 2600 Philadelphia, PA 19103-7018 | | Counsel to the Independent Trustees Goodwin Procter LLP 901 New York Avenue, N.W. Washington, D.C. 20001 | | Transfer Agent Invesco Investment Services, Inc. 11 Greenway Plaza, Suite 1000 Houston, TX 77046-1173 | | Custodian State Street Bank and Trust Company 225 Franklin Street Boston, MA 02110-2801 |
Invesco V.I. Growth and Income Fund
| | | | |
| | |
 | | Annual Report to Shareholders | | December 31, 2015 |
| | |
| | Invesco V.I. High Yield Fund |

| | |
| | The Fund provides a complete list of its holdings four times in each fiscal year, at the quarter-ends. For the second and fourth quarters, the lists appear in the Fund’s semiannual and annual reports to shareholders. For the first and third quarters, the Fund files the lists with the Securities and Exchange Commission (SEC) on Form N-Q. The Fund’s Form N-Q filings are available on the SEC website, sec.gov. Copies of the Fund’s Forms N-Q may be reviewed and copied at the SEC Public Reference Room in Washington, D.C. You can obtain information on the operation of the Public Reference Room, including information about duplicating fee charges, by calling 202 551 8090 or 800 732 0330, or by electronic request at the following email address: publicinfo@sec.gov. The SEC file numbers for the Fund are 811-07452 and 033-57340. The Fund’s most recent portfolio holdings, as filed on Form N-Q, have also been made available to insurance companies issuing variable annuity contracts and variable life insurance policies (“variable products”) that invest in the Fund. A description of the policies and procedures that the Fund uses to determine how to vote proxies relating to portfolio securities is available without charge, upon request, from our Client Services department at 800 959 4246 or at invesco.com/proxyguidelines. The information is also available on the SEC website, sec.gov. Information regarding how the Fund voted proxies related to its portfolio securities during the most recent 12-month period ended June 30 is available at invesco.com/ proxysearch. The information is also available on the SEC website, sec.gov. Invesco Advisers, Inc. is an investment adviser; it provides investment advisory services to individual and institutional clients and does not sell securities. Invesco Distributors, Inc. is the US distributor for Invesco Ltd.’s retail mutual funds, exchange-traded funds and institutional money market funds. Both are wholly owned, indirect subsidiaries of Invesco Ltd. This report must be accompanied or preceded by a currently effective Fund prospectus and variable product prospectus, which contain more complete information, including sales charges and expenses. Investors should read each carefully before investing. Invesco Distributors, Inc. VIHYI-AR-1 NOT FDIC INSURED | MAY LOSE VALUE | NO BANK GUARANTE |
Management’s Discussion of Fund Performance
Performance summary
For the year ended December 31, 2015, Series I shares of Invesco V.I. High Yield Fund (the Fund) outperformed the Barclays U.S. Corporate High Yield 2% Issuer Cap Index, the Fund’s style-specific index.
Your Fund’s long-term performance appears later in this report.
Fund vs. Indexes
Total returns, 12/31/14 to 12/31/15, excluding variable product issuer charges. If variable product issuer charges were included, returns would be lower.
| | | | | |
Series I Shares | | | | -3.17 | % |
Series II Shares | | | | -3.37 | |
Barclays U.S. Aggregate Index▼ (Broad Market Index) | | | | 0.55 | |
Barclays U.S. Corporate High Yield 2% Issuer Cap Index▼ (Style-Specific Index) | | | | -4.43 | |
Lipper VUF High Current Yield Bond Funds Classification Averagen (Peer Group) | | | | -3.29 | |
Source(s): ▼FactSet Research Systems Inc.; nLipper Inc.
Market conditions and your Fund
The high yield market produced negative results for the year ended December 31, 2015, as the market sold off during the second half of the year. The US economy continued its modest, but steady growth, during the year – although the health of individual economic sectors varied dramatically. The headline economic story was a steady decline in already-battered energy markets, as oil prices plummeted when increased supply overwhelmed demand.
As the year began, the view that the US Federal Reserve (the Fed) would begin raising rates while other central banks were loosening monetary policy led the US dollar to strengthen against many currencies. At the same time, oil prices continued to decline, which hurt commodity- and materials-based economies and companies in related sectors. A colder-than-expected winter in the US and concerns about a possible Greek exit
from the eurozone contributed to market uncertainty. Additionally, US-based multinational companies faced foreign exchange headwinds. Low interest rates, the increasing availability of credit and an improving employment picture all contributed to higher consumer confidence and consumer spending.
The high yield market had a fairly strong first quarter and despite increased volatility in the second quarter, performed well through the first half of 2015. The second half of the year was a different story as credit concerns in commodity sectors remained prevalent in the market and spread to other sectors as well. There was also uncertainty regarding the Fed interest rate hike as a significant downturn in China’s financial markets and weak global economic growth led the Fed to delay raising interest rates. This increased investor uncertainty and market volatility. The global economy continued to expand, albeit slowly, during
2015. Central bank policies also began to diverge as the Fed followed through on its commitment to normalize monetary policy by raising interest rates – even as the European Central Bank extended its asset purchase program and Japan introduced additional quantitative easing. Late in the fourth quarter, investors became fearful about the level of liquidity in the high yield market after the closure of a distressed debt fund. However, these fears were overblown, as the fund was a highly concentrated portfolio that invested in illiquid, distressed names and was not representative of most high yield funds. Additionally, the normally strong seasonal performance did not occur as investors were decidedly risk averse. The lowest credit tier of the market underperformed as investors remained risk averse through year end.
The par-weighted high yield default rate decreased to 1.82% in December 2015, which is consistent with the default rate seen over the last few years.1 New issuance was down again in 2015 after the record-breaking year in 2013, which saw $399 billion of new issuance.1 Due to the challenging macroeconomic backdrop, new issuance slowed down considerably in the second half of the year and ended at $293 billion.1
The Barclays U.S. Corporate High Yield 2% Issuer Cap Index, which measures the performance of the US high yield bond market, and which is the Fund’s style-specific index, generated a negative return for the year ended December 31, 2015. Likewise, the Fund generated negative returns for the year; however, it outperformed its style-specific index.
| | | | | |
| Portfolio Composition† |
| By credit quality, based on total investments* | | | | | |
| |
| BBB | | | | 4.8 | % |
| BB | | | | 45.3 | |
| B | | | | 40.0 | |
| CCC | | | | 7.5 | |
| Non-Rated | | | | 2.4 | |
| † | Source: Standard & Poor’s. A credit rating is an assessment provided by a nationally recognized statistical rating organization (NRSRO) of the creditworthiness of an issuer with respect to debt obligations, including specific securities, money market instruments or other debts. Ratings are measured on a scale that generally ranges from AAA (highest) to D (lowest); ratings are subject to change without notice. “Non-Rated” indicates the debtor was not rated, and should not be interpreted as indicating low quality. For more information on Standard and Poor’s rating methodology, please visit standardandpoors.com and select “Understanding Ratings” under Rating Resources on the homepage. |
| | | | | | | |
| Top 10 Debt Issuers* |
| | |
| 1. | | HCA, Inc. | | | | 2.0 | % |
| 2. | | Valeant Pharmaceuticals International, Inc. | | | | 1.9 | |
| 3. | | T-Mobile USA, Inc. | | | | 1.6 | |
| 4. | | Tenet Healthcare Corp. | | | | 1.5 | |
| 5. | | CCO Holdings LLC/CCO Holdings Capital Corp. | | | | 1.5 | |
| 6. | | International Lease Finance Corp. | | | | 1.4 | |
| 7. | | Treehouse Foods Inc. | | | | 1.3 | |
| 8. | | DISH DBS Corp. | | | | 1.3 | |
| 9. | | Alphabet Holding Co., Inc. | | | | 1.2 | |
| 10. | | TransDigm Inc. | | | | 1.2 | |
| | | | | |
| Total Net Assets | | | $ | 144.4 million | |
| |
| Total Number of Holdings* | | | | 292 | |
The Fund’s holdings are subject to change, and there is no assurance that the Fund will continue to hold any particular security.
| * | Excluding US Treasury bills and money market fund holdings. |
Data presented here are as of December 31, 2015.
Invesco V.I. High Yield Fund
The most significant contributor to the Fund’s performance versus its style-specific index was credit selection in the independent energy sector. Additionally, underweight exposure to the metals and mining and the oil field services sectors contributed to the Fund’s relative performance, as these were two of the worst-performing sectors in the market. Also helping relative performance was our overweight allocation to, and credit selection in, the building materials sector.
The leading detractor from Fund performance was the environmental sector; this was due both to an overweight allocation and to our credit selection. Similarly, the cable satellite and midstream sectors were detractors due to both credit selection and sector allocation. Additionally, issuer selection in the home construction, automotive and transportation sectors hindered Fund performance relative to the style-specific index. Finally, our underweight exposure to higher-rated credits throughout the year hurt our relative performance as the highest-rated tier of the high yield market outperformed.
We used currency forward contracts during the reporting period for the purpose of hedging currency exposure of non-US-dollar-denominated debt. The use of currency forward contracts had a positive impact on the Fund’s performance relative to our style-specific index for the reporting period. This was due to the strengthening of the US dollar. We also used credit default swaps (CDX) to efficiently manage the portfolio and to take advantage of relative value opportunities. The use of CDX also had a small benefit to Fund performance.
At the close of 2015, we were awaiting fourth quarter earnings reports. We generally expected fourth quarter earnings to look similar to third quarter earnings in that the known trouble spots were still likely under pressure. We remained underweight in the metals and mining sector, as we expect little fundamental improvement in the coming months. The building materials and home builders sectors continued to be an attractive area for us. Despite the December 2015 interest rate hike, we believe there may be continued gains in these sectors. We were slightly underweight in the energy sector, specifically the exploration and production segment of the sector. Within the energy sector, we found the most value in higher-related credits with exposure to the Permian Basin in Texas. We think mergers and acquisitions may accelerate going forward, and that this will be an area of investor interest. With recent
market volatility, average yields are above the 9% level, and we believe there is some value in the market through careful credit selection.
We wish to remind you that the Fund is subject to interest rate risk, meaning when interest rates rise, the value of fixed income securities tends to fall. This risk may be greater in the current market environment because interest rates are at or near historic lows. The degree to which the value of fixed income securities may decline due to rising interest rates may vary depending on the speed and magnitude of the increase in interest rates, as well as individual security characteristics such as price, maturity, duration and coupon and market forces such as supply and demand for similar securities. We are monitoring interest rates, and the market, economic and geopolitical factors that may impact the direction, speed and magnitude of changes to interest rates across the maturity spectrum, including the potential impact of monetary policy changes by the Fed and certain foreign central banks. If interest rates rise, markets may experience increased volatility, which may affect the value and/ or liquidity of certain of the Fund’s investments.
Thank you for investing in Invesco V.I. High Yield Fund and for sharing our long-term investment horizon.
| 1 | Source: JP Morgan High Yield Market Monitor |
The views and opinions expressed in management’s discussion of Fund performance are those of Invesco Advisers, Inc. These views and opinions are subject to change at any time based on factors such as market and economic conditions. These views and opinions may not be relied upon as investment advice or recommendations, or as an offer for a particular security. The information is not a complete analysis of every aspect of any market, country, industry, security or the Fund. Statements of fact are from sources considered reliable, but Invesco Advisers, Inc. makes no representation or warranty as to their completeness or accuracy. Although historical performance is no guarantee of future results, these insights may help you understand our investment management philosophy.
See important Fund and, if applicable, index disclosures later in this report.
| | |
 | | Darren Hughes Chartered Financial Analyst, Portfolio Manager, is manager of Invesco V.I. High Yield Fund. He joined |
| Invesco in 1992. Mr. Hughes earned a BBA in finance and economics from Baylor University. |
| |
 | | Scott Roberts Chartered Financial Analyst, Portfolio Manager, is manager of Invesco V.I. High Yield Fund. He joined |
| Invesco in 2000. Mr. Roberts earned a BBA in finance from the University of Houston. |
Invesco V.I. High Yield Fund
Your Fund’s Long-Term Performance
Results of a $10,000 Investment – Oldest Share Class(es)
Fund and index data from 12/31/05
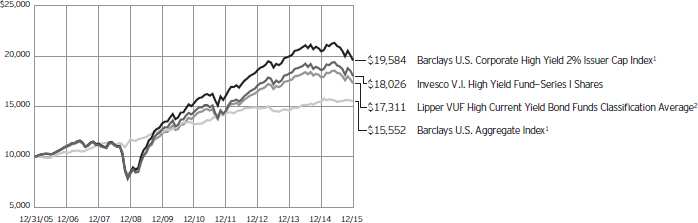
| 1 | Source: FactSet Research Systems Inc. |
Past performance cannot guarantee comparable future results.
| | | | | |
| Average Annual Total Returns |
As of 12/31/15 | | | | | |
| |
| Series I Shares | | | | | |
| Inception (5/1/98) | | | | 3.86 | % |
| 10 Years | | | | 6.07 | |
| 5 Years | | | | 4.51 | |
| 1 Year | | | | -3.17 | |
| |
| Series II Shares | | | | | |
| Inception (3/26/02) | | | | 6.65 | % |
| 10 Years | | | | 5.82 | |
| 5 Years | | | | 4.28 | |
| 1 Year | | | | -3.37 | |
The performance of the Fund’s Series I and Series II share classes will differ primarily due to different class expenses.
The performance data quoted represent past performance and cannot guarantee comparable future results; current performance may be lower or higher. Please contact your variable product issuer or financial adviser for the most recent month-end variable product performance. Performance figures reflect Fund expenses, reinvested distributions and changes in net asset value. Investment return and principal value will fluctuate so that you may have a gain or loss when you sell shares.
The net annual Fund operating expense ratio set forth in the most recent Fund prospectus as of the date of this report for Series I and Series II shares was 0.98% and 1.23%, respectively.1 The total annual Fund operating expense ratio set forth in the most recent Fund prospectus as of the date of this report for Series I and Series II shares was 0.99% and 1.24%, respectively. The expense ratios presented above may vary from the expense ratios presented in other sections of this report that are based on expenses incurred during the period covered by this report.
Invesco V.I. High Yield Fund, a series portfolio of AIM Variable Insurance Funds (Invesco Variable Insurance Funds), is currently offered through insurance companies issuing variable products. You cannot purchase shares of the Fund directly. Performance figures given represent the Fund and are not intended to reflect actual variable product values. They do not reflect sales charges, expenses and fees assessed in connection with a variable product. Sales charges, expenses and fees, which are determined by the variable product issuers, will vary and will lower the total return.
The most recent month-end performance data at the Fund level, excluding variable product charges, is available at 800 451 4246. As mentioned above, for the most recent month-end performance including variable product charges, please contact your variable product issuer or financial adviser.
Fund performance reflects any applicable fee waivers and/or expense reimbursements. Had the adviser not waived fees and/or reimbursed expenses currently or in the past, returns would have been lower. See current prospectus for more information.
| 1 | Total annual Fund operating expenses after any contractual fee waivers and/or expense reimbursements by the adviser in effect through at least June 30, 2017. See current prospectus for more information. |
Invesco V.I. High Yield Fund
Invesco V.I. High Yield Fund’s investment objective is total return, comprised of current income and capital appreciation.
| n | | Unless otherwise stated, information presented in this report is as of December 31, 2015, and is based on total net assets. |
| n | | Unless otherwise noted, all data provided by Invesco. |
| n | | To access your Fund’s reports/prospectus, visit invesco.com/fundreports. |
Principal risks of investing in the Fund
Changing fixed income market conditions risk. The current low interest rate environment was created in part by the Federal Reserve Board (FRB) and certain foreign central banks keeping the federal funds and equivalent foreign rates at or near zero. There is a risk that interest rates will rise when the FRB and central banks raise these rates. This risk is heightened due to the FRB’s quantitative easing program and the “tapering” of other similar foreign central bank actions. This eventual increase in the federal funds and equivalent foreign rates may expose fixed income markets to heightened volatility and reduced liquidity for certain fixed income investments, particularly those with longer maturities. In addition, decreases in fixed income dealer market-making capacity may also potentially lead to heightened volatility and reduced liquidity in the fixed income markets. As a result, the value of the Fund’s investments and share price may decline. Changes in central bank policies could also result in higher than normal shareholder redemptions, which could potentially increase portfolio turnover and the Fund’s transaction costs.
Collateralized loan obligations risk. In addition to the normal interest rate, default and other risks of fixed income securities, collateralized loan obligations carry additional risks, including the possibility that distributions from collateral securities will not be adequate to make interest or other payments, the quality of the collateral may decline in value or default, the Fund may invest in collateralized loan obligations that are subordinate to other classes, values may be volatile, and disputes with the issuer may produce unexpected investment results.
Convertible securities risk. The Fund may own convertible securities, the value of which may be affected by market interest rates, the risk that the issuer will default, the value of the underlying stock or the right of the issuer to buy back the convertible securities.
Credit risk. The issuer of instruments in which the Fund invests may be unable to meet interest and/or principal payments, thereby causing its instruments to decrease in value and lowering the issuer’s credit rating.
Derivatives risk. The value of a derivative instrument depends largely on (and is derived from) the value of an underlying security, currency, commodity, interest rate, index or other asset (each referred to as an underlying asset). In addition to risks relating to the underlying assets, the use of derivatives may include other, possibly greater, risks, including counterparty, leverage and liquidity risks. Counterparty risk is the risk that the counterparty to the derivative contract will default on its obligation to pay the Fund the amount owed or otherwise perform under the derivative contract. Derivatives create leverage risk because they do not require payment up front equal to the economic exposure created by owning the derivative. As a result, an adverse change in the value of the underlying asset could result in the Fund sustaining a loss that is substantially greater than the amount invested in the derivative, which may make the Fund’s returns more volatile and increase the risk of loss. Derivative instruments may also be less liquid than more traditional investments and the Fund may be unable to sell or close out its derivative positions at a desirable time or price. This risk may be more acute under adverse market conditions, during which the Fund may be most in need of liquidating its derivative positions. Derivatives may also be harder to value, less tax efficient and subject to changing government regulation that could impact the Fund’s ability to use certain derivatives or their cost. Also, derivatives used for hedging or to gain or limit exposure to a particular market segment may not provide the expected benefits, particularly during adverse market conditions.
Developing/emerging markets securities risk. The prices of securities issued by foreign companies and governments located in developing/emerging markets countries may be affected more negatively by inflation, devaluation of their currencies, higher transaction costs, delays in settlement, adverse political developments, the introduction of capital controls, withholding taxes, nationalization of private assets, expropriation, social unrest, war or lack of timely information than those in developed countries.
Foreign securities risk. The Fund’s foreign investments may be affected by
changes in a foreign country’s exchange rates, political and social instability, changes in economic or taxation policies, difficulties when enforcing obligations, decreased liquidity, and increased volatility. Foreign companies may be subject to less regulation resulting in less publicly available information about the companies.
High yield bond (junk bond) risk. Junk bonds involve a greater risk of default or price changes due to changes in the credit quality of the issuer. The values of junk bonds fluctuate more than those of high- quality bonds in response to company, political, regulatory or economic developments. Values of junk bonds can decline significantly over short periods of time.
Interest rate risk. Interest rate risk refers to the risk that bond prices generally fall as interest rates rise; conversely, bond prices generally rise as interest rates fall. Specific bonds differ in their sensitivity to changes in interest rates depending on their individual characteristics, including duration.
Liquidity risk. The Fund may hold illiquid securities that it is unable to sell at the preferred time or price and could lose its entire investment in such securities.
Management risk. The investment techniques and risk analysis used by the Fund’s portfolio managers may not produce the desired results.
Market risk. The prices of and the income generated by the Fund’s securities may decline in response to, among other things, investor sentiment, general economic and market conditions, regional or global instability, and currency and interest rate fluctuations.
Mortgage- and asset-backed securities risk. The Fund may invest in mortgage- and asset-backed securities that are subject to prepayment or call risk, which is the risk that the borrower’s payments may be received earlier or later than expected due to changes in prepayment rates on underlying loans. Faster prepayments often happen when interest rates are falling. As a result, the Fund may reinvest these early payments at lower interest rates, thereby reducing the Fund’s income. Conversely, when interest rates rise, prepayments may happen more slowly, causing the security to lengthen in duration. Longer duration securities tend to be more volatile. Securities may be prepaid at a price less than the original
Invesco V.I. High Yield Fund
purchase value. An unexpectedly high rate of defaults on the mortgages held by a mortgage pool may adversely affect the value of mortgage-backed securities and could result in losses to the Fund. The risk of such defaults is generally higher in the case of mortgage pools that include subprime mortgages. Subprime mortgages refer to loans made to borrowers with weakened credit histories or with lower capacity to make timely payments on their mortgages.
Municipal securities risk. The Fund may invest in municipal securities. Constitutional amendments, legislative enactments, executive orders, administrative regulations, voter initiatives, and the issuer’s regional economic conditions may affect the municipal security’s value, interest payments, repayment of principal and the Fund’s ability to sell it. Failure of a municipal security issuer to comply with applicable tax requirements may make income paid thereon taxable, resulting in a decline in the security’s value. In addition, there could be changes in applicable tax laws or tax treatments that reduce or eliminate the current federal income tax exemption on municipal securities or otherwise adversely affect the current federal or state tax status of municipal securities.
Preferred securities risk. Preferred securities may include provisions that permit the issuer, in its discretion, to defer or omit distributions for a certain period of time. If the Fund owns a security that is deferring or omitting its distributions, the Fund may be required to report the distribution on its tax returns, even though it may not have received this income. Further, preferred securities may lose substantial value due to the omission or deferment of dividend payments.
Reinvestment risk. Reinvestment risk is the risk that a bond’s cash flows (coupon income and principal repayment) will be reinvested at an interest rate below that on the original bond.
Zero coupon or pay-in-kind securities risk. The value, interest rates, and liquidity of non-cash paying instruments, such as zero coupon and pay-in-kind securities, are subject to greater fluctuation than other types of securities. The higher yields and interest rates on pay-in-kind securities reflect the payment deferral
and increased credit risk associated with such instruments and that such investments may represent a higher credit risk than coupon loans. Pay-in-kind securities may have a potential variability in valuations because their continuing accruals require continuing judgments about the collectability of the deferred payments and the value of any associated collateral.
About indexes used in this report
The Barclays U.S. Aggregate Index is an unmanaged index considered representative of the US investment-grade, fixed-rate bond market.
The Barclays U.S. Corporate High Yield 2% Issuer Cap Index is an unmanaged index comprising US corporate, fixed-rate, noninvestment-grade debt with at least one year to maturity and at least $150 million in par outstanding. Index weights for each issuer are capped at 2%.
The Lipper VUF High Current Yield Bond Funds Classification Average represents an average of all variable insurance underlying funds in the Lipper High Current Yield Bond Funds classification.
The Fund is not managed to track the performance of any particular index, including the index(es) described here, and consequently, the performance of the Fund may deviate significantly from the performance of the index(es).
A direct investment cannot be made in an index. Unless otherwise indicated, index results include reinvested dividends, and they do not reflect sales charges. Performance of the peer group, if applicable, reflects fund expenses; performance of a market index does not.
Other information
The returns shown in management’s discussion of Fund performance are based on net asset values calculated for shareholder transactions. Generally accepted accounting principles require adjustments to be made to the net assets of the Fund at period end for financial reporting purposes, and as such, the net asset values for shareholder transactions and the returns based on those net asset values may differ from the net asset values and returns reported in the Financial Highlights. Additionally, the returns and net asset values shown throughout this report are at the Fund level only and do not include variable product issuer charges. If such charges were included, the total returns would be lower.
Invesco V.I. High Yield Fund
Schedule of Investments(a)
December 31, 2015
| | | | | | | | |
| | | Principal Amount | | | Value | |
U.S. Dollar Denominated Bonds and Notes–92.30% | |
| Advertising–0.26% | |
Lamar Media Corp., Sr. Unsec. Gtd. Sub. Global Notes, 5.00%, 05/01/2023 | | $ | 370,000 | | | $ | 376,938 | |
|
| Aerospace & Defense–3.61% | |
Aerojet Rocketdyne Holdings, Inc., Sec. Gtd. Second Lien Global Notes, 7.13%, 03/15/2021 | | | 461,000 | | | | 482,321 | |
Bombardier Inc. (Canada), Sr. Unsec. Notes, | | | | | | | | |
7.50%, 03/15/2018(b) | | | 290,000 | | | | 285,650 | |
7.50%, 03/15/2025(b) | | | 432,000 | | | | 302,940 | |
7.75%, 03/15/2020(b) | | | 797,000 | | | | 650,551 | |
Huntington Ingalls Industries Inc., Sr. Unsec. Gtd. Notes, 5.00%, 11/15/2025(b) | | | 110,000 | | | | 112,338 | |
KLX Inc., Sr. Unsec. Gtd. Notes, 5.88%, 12/01/2022(b) | | | 749,000 | | | | 716,231 | |
Moog Inc., Sr. Unsec. Gtd. Notes, 5.25%, 12/01/2022(b) | | | 500,000 | | | | 511,250 | |
Orbital ATK Inc., Sr. Unsec. Gtd. Notes, 5.50%, 10/01/2023(b) | | | 380,000 | | | | 388,075 | |
TransDigm Inc., | | | | | | | | |
Sr. Unsec. Gtd. Sub. Global Notes, 5.50%, 10/15/2020 | | | 520,000 | | | | 505,050 | |
Sr. Unsec. Gtd. Sub. Notes, 6.50%, 05/15/2025(b) | | | 1,297,000 | | | | 1,264,575 | |
| | | | | 5,218,981 | |
|
| Agricultural & Farm Machinery–0.29% | |
Titan International Inc., Sr. Sec. Gtd. First Lien Global Notes, 6.88%, 10/01/2020 | | | 564,000 | | | | 423,000 | |
|
| Airlines–0.50% | |
Air Canada (Canada), Sr. Unsec. Gtd. Notes, 7.75%, 04/15/2021(b) | | | 690,000 | | | | 722,775 | |
|
| Alternative Carriers–2.21% | |
EarthLink Holdings Corp., Sr. Sec. Gtd. First Lien Global Notes, 7.38%, 06/01/2020 | | | 565,000 | | | | 577,712 | |
Level 3 Communications, Inc., Sr. Unsec. Global Notes, 5.75%, 12/01/2022 | | | 1,122,000 | | | | 1,150,050 | |
Level 3 Financing, Inc., Sr. Unsec. Gtd. Notes, | | | | | | | | |
5.13%, 05/01/2023(b) | | | 190,000 | | | | 190,950 | |
5.38%, 01/15/2024(b) | | | 780,000 | | | | 787,800 | |
5.38%, 05/01/2025(b) | | | 480,000 | | | | 478,800 | |
| | | | | 3,185,312 | |
|
| Apparel Retail–0.81% | |
Hot Topic, Inc., Sr. Sec. Gtd. First Lien Notes, 9.25%, 06/15/2021(b) | | | 995,000 | | | | 881,819 | |
Men’s Wearhouse, Inc. (The), Sr. Unsec. Gtd. Global Notes, 7.00%, 07/01/2022 | | | 411,000 | | | | 293,351 | |
| | | | | 1,175,170 | |
| | | | | | | | |
| | | Principal Amount | | | Value | |
| Apparel, Accessories & Luxury Goods–0.17% | |
William Carter Co. (The), Sr. Unsec. Gtd. Global Notes, 5.25%, 08/15/2021 | | $ | 244,000 | | | $ | 251,930 | |
|
| Auto Parts & Equipment–1.21% | |
CTP Transportation Products LLC/CTP Finance Inc., Sr. Sec. Notes, 8.25%, 12/15/2019(b) | | | 670,000 | | | | 701,825 | |
Dana Holding Corp., Sr. Unsec. Notes, | | | | | | | | |
5.38%, 09/15/2021 | | | 133,000 | | | | 133,000 | |
5.50%, 12/15/2024 | | | 313,000 | | | | 305,566 | |
Gestamp Funding Luxembourg S.A. (Spain), Sr. Sec. Gtd. First Lien Notes, 5.63%, 05/31/2020(b) | | | 220,000 | | | | 224,708 | |
Tenneco Inc., Sr. Unsec. Gtd. Global Notes, 5.38%, 12/15/2024 | | | 368,000 | | | | 375,820 | |
| | | | | 1,740,919 | |
|
| Biotechnology–0.00% | |
Savient Pharmaceuticals, Inc., Sr. Unsec. Conv. Notes, 4.75%, 02/01/2018(c) | | | 120,000 | | | | 0 | |
|
| Broadcasting–1.45% | |
IHeartCommunications, Inc., Series B, Sr. Unsec. Gtd. Global Notes, 6.50%, 11/15/2022 | | | 514,000 | | | | 505,005 | |
Netflix, Inc., Sr. Unsec. Global Notes, 5.75%, 03/01/2024 | | | 411,000 | | | | 424,358 | |
Sinclair Television Group Inc., Sr. Unsec. Gtd. Notes, 5.63%, 08/01/2024(b) | | | 299,000 | | | | 291,525 | |
TEGNA, Inc., Sr. Unsec. Gtd. Global Notes, 6.38%, 10/15/2023 | | | 374,000 | | | | 393,635 | |
Tribune Media Co., Sr. Unsec. Gtd. Notes, 5.88%, 07/15/2022(b) | | | 475,000 | | | | 476,187 | |
| | | | | 2,090,710 | |
|
| Building Products–4.54% | |
Allegion PLC, Sr. Unsec. Gtd. Notes, 5.88%, 09/15/2023 | | | 408,000 | | | | 417,690 | |
BMC Stock Holdings, Inc., Sr. Sec. Gtd. First Lien Notes, 9.00%, 09/15/2018(b) | | | 742,000 | | | | 774,463 | |
Builders FirstSource, Inc., | | | | | | | | |
Sr. Sec. First Lien Notes, 7.63%, 06/01/2021(b) | | | 1,210,000 | | | | 1,278,062 | |
Sr. Unsec. Gtd. Notes, 10.75%, 08/15/2023(b) | | | 435,000 | | | | 433,369 | |
Building Materials Corp. of America, Sr. Unsec. Notes, | | | | | | | | |
5.38%, 11/15/2024(b) | | | 1,115,000 | | | | 1,117,787 | |
6.00%, 10/15/2025(b) | | | 250,000 | | | | 258,750 | |
Gibraltar Industries Inc., Sr. Unsec. Gtd. Sub. Global Notes, 6.25%, 02/01/2021 | | | 1,010,000 | | | | 1,031,462 | |
Hardwoods Acquisition, Inc., Sr. Sec. Gtd. First Lien Notes, 7.50%, 08/01/2021(b) | | | 215,000 | | | | 179,525 | |
See accompanying Notes to Financial Statements which are an integral part of the financial statements.
Invesco V.I. High Yield Fund
| | | | | | | | |
| | | Principal Amount | | | Value | |
| Building Products–(continued) | |
NCI Building Systems, Inc., Sr. Unsec. Gtd. Notes, 8.25%, 01/15/2023(b) | | $ | 150,000 | | | $ | 158,063 | |
Norbord Inc. (Canada), | | | | | | | | |
Sr. Sec. First Lien Notes, 5.38%, 12/01/2020(b) | | | 449,000 | | | | 453,490 | |
Sr. Sec. Gtd. First Lien Notes, 6.25%, 04/15/2023(b) | | | 460,000 | | | | 455,400 | |
| | | | | 6,558,061 | |
|
| Cable & Satellite–7.10% | |
CCO Holdings LLC/CCO Holdings Capital Corp., Sr. Unsec. Gtd. Notes, | | | | | | | | |
5.13%, 05/01/2023(b) | | | 1,118,000 | | | | 1,123,590 | |
5.38%, 05/01/2025(b) | | | 1,010,000 | | | | 1,012,525 | |
CCOH Safari LLC, Sr. Unsec. Notes, 5.75%, 02/15/2026(b) | | | 998,000 | | | | 1,005,485 | |
DigitalGlobe Inc., Sr. Unsec. Gtd. Notes, 5.25%, 02/01/2021(b) | | | 333,000 | | | | 278,888 | |
DISH DBS Corp., Sr. Unsec. Gtd. Global Notes, | | | | | | | | |
5.13%, 05/01/2020 | | | 600,000 | | | | 595,500 | |
5.88%, 11/15/2024 | | | 1,480,000 | | | | 1,317,200 | |
Hughes Satellite Systems Corp., Sr. Unsec. Gtd. Global Notes, 7.63%, 06/15/2021 | | | 517,000 | | | | 550,605 | |
Intelsat Jackson Holdings S.A. (Luxembourg), Sr. Unsec. Gtd. Global Bonds, 5.50%, 08/01/2023 | | | 1,028,000 | | | | 812,120 | |
Mediacom Broadband LLC/Corp., Sr. Unsec. Gtd. Global Notes, 5.50%, 04/15/2021 | | | 370,000 | | | | 357,975 | |
Numericable-SFR SA (France), Sr. Sec. Gtd. First Lien Bonds, 6.00%, 05/15/2022(b) | | | 1,645,000 | | | | 1,603,875 | |
Unitymedia Hessen GmbH & Co. KG/Unitymedia NRW GmbH (Germany), Sr. Sec. Gtd. First Lien Bonds, 5.00%, 01/15/2025(b) | | | 890,000 | | | | 855,005 | |
VTR Finance B.V. (Chile), Sr. Sec. First Lien Notes, 6.88%, 01/15/2024(b) | | | 590,000 | | | | 548,700 | |
Ziggo Bond Finance B.V. (Netherlands), Sr. Unsec. Notes, 5.88%, 01/15/2025(b) | | | 200,000 | | | | 186,500 | |
| | | | | 10,247,968 | |
|
| Casinos & Gaming–1.71% | |
Boyd Gaming Corp., Sr. Unsec. Gtd. Global Notes, 6.88%, 05/15/2023 | | | 1,245,000 | | | | 1,285,462 | |
Churchill Downs Inc., Sr. Unsec. Gtd. Notes, 5.38%, 12/15/2021(b) | | | 329,000 | | | | 332,290 | |
MGM Resorts International, Sr. Unsec. Gtd. Notes, | | | | | | | | |
6.00%, 03/15/2023 | | | 375,000 | | | | 373,125 | |
7.75%, 03/15/2022 | | | 319,000 | | | | 339,735 | |
Mohegan Tribal Gaming Authority, Sr. Unsec. Gtd. Notes, 9.75%, 09/01/2021(b) | | | 135,000 | | | | 135,338 | |
| | | | | 2,465,950 | |
| | | | | | | | |
| | | Principal Amount | | | Value | |
| Commercial Printing–0.48% | |
Multi-Color Corp., Sr. Unsec. Gtd. Notes, 6.13%, 12/01/2022(b) | | $ | 698,000 | | | $ | 695,382 | |
|
| Computer & Electronics Retail–0.46% | |
Rent-A-Center, Inc., Sr. Unsec. Gtd. Global Notes, 4.75%, 05/01/2021 | | | 879,000 | | | | 657,052 | |
|
| Construction & Engineering–0.65% | |
AECOM, Sr. Unsec. Gtd. Global Notes, 5.75%, 10/15/2022 | | | 913,000 | | | | 939,185 | |
|
| Construction Machinery & Heavy Trucks–3.35% | |
Allied Specialty Vehicles, Inc., Sr. Sec. Notes, 8.50%, 11/01/2019(b) | | | 1,182,000 | | | | 1,207,117 | |
Commercial Vehicle Group Inc., Sec. Gtd. Second Lien Global Notes, 7.88%, 04/15/2019 | | | 1,142,000 | | | | 1,003,532 | |
Meritor Inc., Sr. Unsec. Gtd. Notes, | | | | | | | | |
6.25%, 02/15/2024 | | | 186,000 | | | | 160,193 | |
6.75%, 06/15/2021 | | | 497,000 | | | | 459,725 | |
Navistar International Corp., | | | | | | | | |
Sr. Unsec. Gtd. Notes, 8.25%, 11/01/2021 | | | 770,000 | | | | 515,900 | |
Sr. Unsec. Sub. Conv. Bonds, 4.75%, 04/15/2019 | | | 455,000 | | | | 219,538 | |
Oshkosh Corp., Sr. Unsec. Gtd. Global Notes, | | | | | | | | |
5.38%, 03/01/2022 | | | 1,088,000 | | | | 1,094,800 | |
5.38%, 03/01/2025 | | | 179,000 | | | | 177,210 | |
| | | | | 4,838,015 | |
|
| Construction Materials–0.37% | |
Cemex S.A.B. de C.V. (Mexico), Sr. Sec. Gtd. First Lien Notes, 5.88%, 03/25/2019(b) | | | 430,000 | | | | 410,650 | |
CPG Merger Sub LLC, Sr. Unsec. Gtd. Notes, 8.00%, 10/01/2021(b) | | | 120,000 | | | | 118,350 | |
| | | | | 529,000 | |
|
| Consumer Finance–0.92% | |
Ally Financial Inc.,
Sr. Unsec. Global Notes, | | | | | | | | |
4.63%, 03/30/2025 | | | 599,000 | | | | 590,015 | |
5.13%, 09/30/2024 | | | 176,000 | | | | 181,060 | |
Unsec. Sub. Global Notes, 5.75%, 11/20/2025 | | | 170,000 | | | | 172,550 | |
Credit Acceptance Corp., Sr. Unsec. Gtd. Notes, 7.38%, 03/15/2023(b) | | | 380,000 | | | | 380,000 | |
| | | | | 1,323,625 | |
|
| Data Processing & Outsourced Services–0.98% | |
First Data Corp., | | | | | | | | |
Sr. Sec. First Lien Notes, 5.00%, 01/15/2024(b) | | | 343,000 | | | | 343,000 | |
Sr. Unsec. Gtd. Notes, 7.00%, 12/01/2023(b) | | | 1,065,000 | | | | 1,068,994 | |
| | | | | 1,411,994 | |
See accompanying Notes to Financial Statements which are an integral part of the financial statements.
Invesco V.I. High Yield Fund
| | | | | | | | |
| | | Principal Amount | | | Value | |
| Diversified Banks–0.38% | |
Royal Bank of Scotland Group PLC (The) (United Kingdom), Unsec. Sub. Global Bonds, 6.13%, 12/15/2022 | | $ | 500,000 | | | $ | 544,548 | |
|
| Diversified Chemicals–0.39% | |
Chemours Co. (The), Sr. Unsec. Notes, 6.63%, 05/15/2023(b) | | | 317,000 | | | | 226,655 | |
Compass Minerals International, Inc., Sr. Unsec. Gtd. Notes, 4.88%, 07/15/2024(b) | | | 350,000 | | | | 335,125 | |
| | | | | 561,780 | |
|
| Diversified Metals & Mining–0.72% | |
FMG Resources (August 2006) Pty. Ltd. (Australia), Sr. Unsec. Gtd. Notes, | | | | | | | | |
6.88%, 04/01/2022(b) | | | 175,000 | | | | 110,250 | |
8.25%, 11/01/2019(b) | | | 845,000 | | | | 680,225 | |
HudBay Minerals, Inc. (Canada), Sr. Unsec. Gtd. Global Notes, 9.50%, 10/01/2020 | | | 102,000 | | | | 75,735 | |
Lundin Mining Corp. (Canada), Sr. Sec. Gtd. First Lien Notes, 7.88%, 11/01/2022(b) | | | 188,000 | | | | 173,900 | |
| | | | | 1,040,110 | |
|
| Electrical Components & Equipment–1.03% | |
EnerSys, Sr. Unsec. Gtd. Notes, 5.00%, 04/30/2023(b) | | | 858,000 | | | | 858,000 | |
Sensata Technologies B.V., Sr. Unsec. Gtd. Notes, | | | | | | | | |
4.88%, 10/15/2023(b) | | | 270,000 | | | | 263,925 | |
5.00%, 10/01/2025(b) | | | 370,000 | | | | 358,900 | |
| | | | | 1,480,825 | |
|
| Environmental & Facilities Services–0.52% | |
ADS Waste Holdings, Inc., Sr. Unsec. Gtd. Global Notes, 8.25%, 10/01/2020 | | | 746,000 | | | | 755,325 | |
|
| Food Retail–1.19% | |
1011778 BC ULC/ New Red Finance, Inc. (Canada), Sec. Gtd. Second Lien Notes, 6.00%, 04/01/2022(b) | | | 1,386,000 | | | | 1,432,777 | |
CST Brands, Inc., Sr. Unsec. Gtd. Global Notes, 5.00%, 05/01/2023 | | | 291,000 | | | | 290,273 | |
| | | | | 1,723,050 | |
|
| Forest Products–0.00% | |
Emerald Plantation Holdings Ltd. (Hong Kong), Sr. Sec. Gtd. First Lien Global PIK Notes,
8.00%, 01/30/2020(d)(e) | | | 3,003 | | | | 2,474 | |
Sino-Forest Corp. (Hong Kong), Sr. Unsec. Gtd. Notes, 6.25%, 10/21/2017(b)(c)(e) | | | 40,000 | | | | 200 | |
| | | | | 2,674 | |
|
| Gas Utilities–0.92% | |
Ferrellgas L.P./Ferrellgas Finance Corp., Sr. Unsec. Global Notes, | | | | | | | | |
6.50%, 05/01/2021 | | | 425,000 | | | | 365,500 | |
6.75%, 01/15/2022 | | | 127,000 | | | | 107,315 | |
Sr. Unsec. Gtd. Notes, 6.75%, 06/15/2023(b) | | | 308,000 | | | | 255,640 | |
| | | | | | | | |
| | | Principal Amount | | | Value | |
| Gas Utilities–(continued) | | | | | | | | |
Suburban Propane Partners, L.P./Suburban Energy Finance Corp., Sr. Unsec. Global Notes, 5.50%, 06/01/2024 | | $ | 750,000 | | | $ | 603,750 | |
| | | | | 1,332,205 | |
|
| General Merchandise Stores–0.31% | |
Dollar Tree, Inc., Sr. Unsec. Gtd. Notes, 5.75%, 03/01/2023(b) | | | 434,000 | | | | 452,445 | |
|
| Health Care Equipment–0.38% | |
DJO Finco Inc./DJO Finance LLC/DJO Finance Corp., Sec. Second Lien Notes, 8.13%, 06/15/2021(b) | | | 611,000 | | | | 549,900 | |
|
| Health Care Facilities–5.72% | |
Acadia Healthcare Co., Inc., Sr. Unsec. Gtd. Global Notes, 5.63%, 02/15/2023 | | | 948,000 | | | | 900,600 | |
Amsurg Corp., Sr. Unsec. Gtd. Global Notes, 5.63%, 07/15/2022 | | | 415,000 | | | | 411,888 | |
Community Health Systems, Inc., Sr. Unsec. Gtd. Global Notes, 6.88%, 02/01/2022 | | | 397,202 | | | | 377,838 | |
HCA Holdings, Inc., Sr. Unsec. Notes, 6.25%, 02/15/2021 | | | 344,000 | | | | 363,780 | |
HCA, Inc., | | | | | | | | |
Sr. Sec. Gtd. First Lien Global Notes, 5.88%, 03/15/2022 | | | 801,000 | | | | 848,810 | |
Sr. Sec. Gtd. First Lien Notes, 5.25%, 04/15/2025 | | | 698,000 | | | | 705,852 | |
Sr. Unsec. Gtd. Global Notes, 7.50%, 02/15/2022 | | | 334,000 | | | | 370,740 | |
Sr. Unsec. Gtd. Notes, 5.38%, 02/01/2025 | | | 640,000 | | | | 633,600 | |
5.88%, 02/15/2026 | | | 310,000 | | | | 311,550 | |
HealthSouth Corp., Sr. Unsec. Gtd. Notes, 5.75%, 09/15/2025(b) | | | 248,000 | | | | 233,120 | |
Surgical Care Affiliates, Inc., Sr. Unsec. Gtd. Notes, 6.00%, 04/01/2023(b) | | | 965,000 | | | | 943,287 | |
Tenet Healthcare Corp., Sr. Unsec. Global Notes, | | | | | | | | |
6.75%, 02/01/2020 | | | 360,000 | | | | 345,600 | |
6.75%, 06/15/2023 | | | 749,000 | | | | 690,953 | |
8.13%, 04/01/2022 | | | 1,125,000 | | | | 1,119,375 | |
| | | | | 8,256,993 | |
|
| Health Care Services–0.95% | |
MEDNAX, Inc., Sr. Unsec. Gtd. Notes, 5.25%, 12/01/2023(b) | | | 765,000 | | | | 772,650 | |
MPH Acquisition Holdings LLC, Sr. Unsec. Gtd. Notes, 6.63%, 04/01/2022(b) | | | 600,000 | | | | 604,500 | |
| | | | | 1,377,150 | |
|
| Home Improvement Retail–0.79% | |
Hillman Group Inc. (The), Sr. Unsec. Notes, 6.38%, 07/15/2022(b) | | | 1,365,000 | | | | 1,134,656 | |
|
| Homebuilding–4.43% | |
Ashton Woods USA LLC/Ashton Woods Finance Co., Sr. Unsec. Notes, 6.88%, 02/15/2021(b) | | | 1,502,000 | | | | 1,299,230 | |
See accompanying Notes to Financial Statements which are an integral part of the financial statements.
Invesco V.I. High Yield Fund
| | | | | | | | |
| | | Principal Amount | | | Value | |
| Homebuilding–(continued) | |
AV Homes, Inc., Sr. Unsec. Gtd. Global Notes, 8.50%, 07/01/2019 | | $ | 270,000 | | | $ | 270,000 | |
Beazer Homes USA Inc., Sr. Unsec. Gtd. Global Notes, 7.50%, 09/15/2021 | | | 1,275,000 | | | | 1,174,594 | |
CalAtlantic Group Inc., Sr. Unsec. Gtd. Notes, 5.38%, 10/01/2022 | | | 784,000 | | | | 790,860 | |
K. Hovnanian Enterprises Inc., | | | | | | | | |
Sr. Sec. Gtd. First Lien Notes, 7.25%, 10/15/2020(b) | | | 92,000 | | | | 78,775 | |
Sr. Unsec. Gtd. Notes, 7.00%, 01/15/2019(b) | | | 770,000 | | | | 500,500 | |
8.00%, 11/01/2019(b) | | | 990,000 | | | | 622,462 | |
KB Home, Sr. Unsec. Gtd. Notes, | | | | | | | | |
7.00%, 12/15/2021 | | | 181,000 | | | | 179,190 | |
7.50%, 09/15/2022 | | | 105,000 | | | | 105,131 | |
Lennar Corp., Sr. Unsec. Gtd. Notes, 4.88%, 12/15/2023 | | | 140,000 | | | | 139,825 | |
Meritage Homes Corp., Sr. Unsec. Gtd. Global Notes, | | | | | | | | |
6.00%, 06/01/2025 | | | 405,000 | | | | 405,506 | |
7.15%, 04/15/2020 | | | 270,000 | | | | 285,863 | |
Shea Homes L.P./Shea Homes Funding Corp., Sr. Unsec. Gtd. Notes, 5.88%, 04/01/2023(b) | | | 143,000 | | | | 147,290 | |
Taylor Morrison Communities Inc./ Monarch Communities Inc., Sr. Unsec. Gtd. Notes, 5.88%, 04/15/2023(b) | | | 408,000 | | | | 402,900 | |
| | | | | 6,402,126 | |
|
| Household Products–1.90% | |
Central Garden & Pet Co., Sr. Unsec. Gtd. Notes, 6.13%, 11/15/2023 | | | 207,000 | | | | 210,105 | |
Reynolds Group Issuer Inc./LLC (New Zealand), | | | | | | | | |
Sr. Sec. Gtd. First Lien Global Notes, 5.75%, 10/15/2020 | | | 357,000 | | | | 362,801 | |
Sr. Unsec. Gtd. Global Notes, 8.25%, 02/15/2021 | | | 1,088,000 | | | | 1,056,720 | |
9.88%, 08/15/2019 | | | 100,000 | | | | 100,750 | |
Springs Industries, Inc., Sr. Sec. Global Notes, 6.25%, 06/01/2021 | | | 1,018,000 | | | | 1,014,183 | |
| | | | | 2,744,559 | |
|
| Independent Power Producers & Energy Traders–1.07% | |
AES Corp., Sr. Unsec. Global Notes, 7.38%, 07/01/2021 | | | 544,000 | | | | 554,880 | |
Calpine Corp., | | | | | | | | |
Sr. Sec. Gtd. First Lien Notes, 5.88%, 01/15/2024(b) | | | 73,000 | | | | 75,190 | |
Sr. Unsec. Global Notes, 5.38%, 01/15/2023 | | | 26,000 | | | | 23,270 | |
5.50%, 02/01/2024 | | | 867,000 | | | | 769,462 | |
Red Oak Power LLC, Series A, Sr. Sec. First Lien Ltd. Bonds, 8.54%, 11/30/2019 | | | 111,779 | | | | 116,530 | |
| | | | | 1,539,332 | |
| | | | | | | | |
| | | Principal Amount | | | Value | |
| Industrial Conglomerates–0.46% | |
Unifrax I LLC/Unifrax Holding Co., Sr. Unsec. Gtd. Notes, 7.50%, 02/15/2019 (Acquired 1/31/2013–7/28/2014; Cost $754,288)(b) | | $ | 742,000 | | | $ | 660,380 | |
|
| Industrial Machinery–0.88% | |
Optimas OE Solutions Holding, LLC/Optimas OE Solutions, Inc., Sr. Sec. Notes, 8.63%, 06/01/2021(b) | | | 606,000 | | | | 518,130 | |
Waterjet Holdings, Inc., Sr. Sec. Gtd. Notes, 7.63%, 02/01/2020(b) | | | 755,000 | | | | 750,281 | |
| | | | | 1,268,411 | |
|
| Integrated Telecommunication Services–1.39% | |
Frontier Communications Corp., Sr. Unsec. Notes, | | | | | | | | |
8.88%, 09/15/2020(b) | | | 248,000 | | | | 252,030 | |
11.00%, 09/15/2025(b) | | | 218,000 | | | | 217,728 | |
GCI, Inc., Sr. Unsec. Global Notes, 6.88%, 04/15/2025 | | | 310,000 | | | | 318,912 | |
Telecom Italia S.p.A. (Italy), Sr. Unsec. Notes, 5.30%, 05/30/2024(b) | | | 1,235,000 | | | | 1,225,737 | |
| | | | | 2,014,407 | |
|
| Internet Software & Services–1.63% | |
CyrusOne L.P./CyrusOne Finance Corp., Sr. Unsec. Gtd. Global Notes, 6.38%, 11/15/2022 | | | 930,000 | | | | 962,550 | |
Equinix Inc., Sr. Unsec. Notes, | | | | | | | | |
5.38%, 01/01/2022 | | | 106,000 | | | | 109,710 | |
5.38%, 04/01/2023 | | | 641,000 | | | | 657,025 | |
5.88%, 01/15/2026 | | | 486,000 | | | | 501,795 | |
Equinix, Inc., Sr. Unsec. Notes, 5.75%, 01/01/2025 | | | 125,000 | | | | 128,750 | |
| | | | | 2,359,830 | |
|
| Leisure Facilities–0.17% | |
Cedar Fair L.P./Canada’s Wonderland Co./Magnum Management Corp., Sr. Unsec. Gtd. Global Notes, 5.38%, 06/01/2024 | | | 240,000 | | | | 243,900 | |
|
| Leisure Products–1.11% | |
Party City Holdings Inc., Sr. Unsec. Gtd. Notes, 6.13%, 08/15/2023(b) | | | 459,000 | | | | 446,951 | |
Vista Outdoor Inc., Sr. Unsec. Gtd. Notes, 5.88%, 10/01/2023(b) | | | 1,115,000 | | | | 1,149,844 | |
| | | | | 1,596,795 | |
|
| Managed Health Care–0.22% | |
Molina Healthcare, Inc., Sr. Unsec. Gtd. Notes, 5.38%, 11/15/2022(b) | | | 315,000 | | | | 316,575 | |
|
| Marine–0.84% | |
Navios Maritime Acquisition Corp./Navios Acquisition Finance U.S. Inc., Sr. Sec. Gtd. First Lien Mortgage Notes, 8.13%, 11/15/2021 (Acquired 10/29/2013–7/16/2015; Cost $1,393,645)(b) | | | 1,388,000 | | | | 1,217,970 | |
See accompanying Notes to Financial Statements which are an integral part of the financial statements.
Invesco V.I. High Yield Fund
| | | | | | | | |
| | | Principal Amount | | | Value | |
| Metal & Glass Containers–2.23% | |
Ball Corp., Sr. Unsec. Gtd. Global Notes, 4.38%, 12/15/2020 | | $ | 487,000 | | | $ | 496,740 | |
Berry Plastics Corp., Sec. Gtd. Second Lien Notes, | | | | | | | | |
5.50%, 05/15/2022 | | | 878,000 | | | | 875,805 | |
6.00%, 10/15/2022(b) | | | 371,000 | | | | 379,348 | |
Coveris Holding Corp., Sr. Unsec. Gtd. Notes, 10.00%, 06/01/2018(b) | | | 542,000 | | | | 518,287 | |
Coveris Holdings S.A. (Luxembourg), Sr. Unsec. Gtd. Notes,
7.88%, 11/01/2019(b) | | | 249,000 | | | | 218,498 | |
Owens-Brockway Glass Container, Inc., Sr. Unsec. Gtd. Notes, | | | | | | | | |
5.00%, 01/15/2022(b) | | | 200,000 | | | | 196,750 | |
5.88%, 08/15/2023(b) | | | 209,000 | | | | 213,441 | |
6.38%, 08/15/2025(b) | | | 312,000 | | | | 322,530 | |
| | | | | 3,221,399 | |
|
| Movies & Entertainment–0.19% | |
AMC Entertainment Inc., Sr. Unsec. Gtd. Sub. Global Notes, | | | | | | | | |
5.75%, 06/15/2025 | | | 75,000 | | | | 75,562 | |
5.88%, 02/15/2022 | | | 200,000 | | | | 203,500 | |
| | | | | 279,062 | |
|
| Oil & Gas Equipment & Services–0.24% | |
Bristow Group, Inc., Sr. Unsec. Gtd. Notes, 6.25%, 10/15/2022 | | | 443,000 | | | | 348,863 | |
|
| Oil & Gas Exploration & Production–4.70% | |
Antero Resources Corp., Sr. Unsec. Gtd. Global Notes, | | | | | | | | |
5.38%, 11/01/2021 | | | 339,000 | | | | 272,895 | |
6.00%, 12/01/2020 | | | 250,000 | | | | 211,250 | |
Carrizo Oil & Gas, Inc., | | | | | | | | |
Sr. Unsec. Gtd. Global Notes, 6.25%, 04/15/2023 | | | 220,000 | | | | 181,500 | |
Sr. Unsec. Gtd. Notes, 7.50%, 09/15/2020 | | | 209,000 | | | | 184,443 | |
Chaparral Energy, Inc., Sr. Unsec. Gtd. Global Notes, 9.88%, 10/01/2020 | | | 716,000 | | | | 180,790 | |
Chesapeake Energy Corp., Sec. Gtd. Second Lien Notes, 8.00%,
12/15/2022(b) | | | 440,000 | | | | 215,600 | |
Concho Resources Inc., Sr. Unsec. Gtd. Global Notes, | | | | | | | | |
5.50%, 10/01/2022 | | | 302,000 | | | | 279,350 | |
5.50%, 04/01/2023 | | | 1,045,000 | | | | 964,012 | |
Denbury Resources Inc., Sr. Unsec. Gtd. Sub. Notes, 5.50%, 05/01/2022 | | | 552,000 | | | | 184,920 | |
Diamondback Energy, Inc., Sr. Unsec. Gtd. Global Notes, 7.63%, 10/01/2021 | | | 599,000 | | | | 602,744 | |
Gulfport Energy Corp., Sr. Unsec. Gtd. Global Notes, 6.63%, 05/01/2023 | | | 527,000 | | | | 442,680 | |
Laredo Petroleum, Inc., Sr. Unsec. Gtd. Global Notes, 7.38%, 05/01/2022 | | | 759,000 | | | | 702,075 | |
Parsley Energy LLC/Parsley Finance Corp., Sr. Unsec. Notes, 7.50%, 02/15/2022(b) | | | 509,000 | | | | 491,185 | |
| | | | | | | | |
| | | Principal Amount | | | Value | |
| Oil & Gas Exploration & Production–(continued) | |
QEP Resources Inc., | | | | | | | | |
Sr. Unsec. Global Notes, 5.25%, 05/01/2023 | | $ | 215,000 | | | $ | 153,188 | |
Sr. Unsec. Notes, 5.38%, 10/01/2022 | | | 226,000 | | | | 162,720 | |
RSP Permian, Inc., Sr. Unsec. Gtd. Notes, 6.63%, 10/01/2022(b) | | | 600,000 | | | | 552,000 | |
SM Energy Co., Sr. Unsec. Global Notes, 6.50%, 01/01/2023 | | | 796,000 | | | | 591,030 | |
WPX Energy, Inc., Sr. Unsec. Notes, 7.50%, 08/01/2020 | | | 511,300 | | | | 421,822 | |
| | | | | 6,794,204 | |
|
| Oil & Gas Refining & Marketing–0.56% | |
MPLX LP, Sr. Unsec. Gtd. Notes, 5.50%, 02/15/2023(b) | | | 913,000 | | | | 812,572 | |
|
| Oil & Gas Storage & Transportation–2.13% | |
Energy Transfer Equity, L.P., | | | | | | | | |
Sr. Sec. First Lien Notes, 5.50%, 06/01/2027 | | | 308,000 | | | | 232,540 | |
Sr. Sec. Gtd. First Lien Notes, 7.50%, 10/15/2020 | | | 600,000 | | | | 555,000 | |
Genesis Energy L.P./Genesis Energy Finance Corp., Sr. Unsec. Gtd. Notes, | | | | | | | | |
6.00%, 05/15/2023 | | | 68,000 | | | | 55,080 | |
6.75%, 08/01/2022 | | | 580,000 | | | | 498,800 | |
Targa Resources Partners L.P./Targa Resources Partners Finance Corp., Sr. Unsec. Gtd. Global Bonds, 5.25%, 05/01/2023 | | | 950,000 | | | | 769,500 | |
Teekay Corp. (Bermuda), Sr. Unsec. Global Notes, 8.50%, 01/15/2020 | | | 316,000 | | | | 213,300 | |
Teekay Offshore Partners L.P./Teekay Offshore Finance Corp. (Bermuda), Sr. Unsec. Global Notes, 6.00%, 07/30/2019 | | | 414,000 | | | | 275,310 | |
Tesoro Logistics L.P./Tesoro Logistics Finance Corp., Sr. Unsec. Gtd. Global Notes, 6.13%, 10/15/2021 | | | 500,000 | | | | 480,000 | |
| | | | | 3,079,530 | |
|
| Packaged Foods & Meats–1.25% | |
FAGE Dairy Industry S.A./FAGE USA Dairy Industry, Inc. (Greece), Sr. Unsec. Gtd. Notes, 9.88%, 02/01/2020(b) | | | 720,000 | | | | 750,816 | |
JBS Investments GmbH (Brazil),
Sr. Unsec. Gtd. Notes, 7.25%, 04/03/2024(b) | | | 300,000 | | | | 276,750 | |
REGS, Sr. Unsec. Gtd. Euro Notes, 7.25%, 04/03/2024(b) | | | 230,000 | | | | 209,875 | |
Smithfield Foods Inc., Sr. Unsec. Notes, 6.63%, 08/15/2022 | | | 331,000 | | | | 348,378 | |
WhiteWave Foods Co. (The), Sr. Unsec. Gtd. Notes, 5.38%, 10/01/2022 | | | 203,000 | | | | 214,926 | |
| | | | | 1,800,745 | |
See accompanying Notes to Financial Statements which are an integral part of the financial statements.
Invesco V.I. High Yield Fund
| | | | | | | | |
| | | Principal Amount | | | Value | |
| Paper Packaging–0.41% | |
Graphic Packaging International Inc., Sr. Unsec. Gtd. Notes, | | | | | | | | |
4.75%, 04/15/2021 | | $ | 27,000 | | | $ | 27,675 | |
4.88%, 11/15/2022 | | | 550,000 | | | | 560,313 | |
| | | | | 587,988 | |
|
| Paper Products–1.05% | |
Clearwater Paper Corp., | | | | | | | | |
Sr. Unsec. Gtd. Global Notes, 4.50%, 02/01/2023 | | | 394,000 | | | | 372,330 | |
Sr. Unsec. Gtd. Notes, 5.38%, 02/01/2025(b) | | | 359,000 | | | | 346,435 | |
Mercer International Inc. (Canada), Sr. Unsec. Gtd. Global Notes, 7.00%, 12/01/2019 | | | 471,000 | | | | 473,355 | |
PH Glatfelter Co., Sr. Unsec. Gtd. Global Notes, 5.38%, 10/15/2020 | | | 326,000 | | | | 327,630 | |
| | | | | 1,519,750 | |
|
| Personal Products–1.23% | |
Alphabet Holding Co., Inc., Sr. Unsec. Global PIK Notes,
8.50%, 11/01/2017(d) | | | 1,820,000 | | | | 1,779,050 | |
|
| Pharmaceuticals–2.92% | |
Concordia Healthcare Corp. (Canada), Sr. Unsec. Gtd. Notes, | | | | | | | | |
7.00%, 04/15/2023(b) | | | 833,000 | | | | 726,792 | |
9.50%, 10/21/2022(b) | | | 200,000 | | | | 198,000 | |
Endo Finance LLC/ Endo Ltd./Endo Finco Inc., Sr. Unsec. Gtd. Notes, | | | | | | | | |
6.00%, 07/15/2023(b) | | | 250,000 | | | | 250,000 | |
6.00%, 02/01/2025(b) | | | 200,000 | | | | 198,500 | |
Quintiles Transnational Corp., Sr. Unsec. Gtd. Notes, 4.88%, 05/15/2023(b) | | | 137,000 | | | | 138,370 | |
Valeant Pharmaceuticals International, Inc., Sr. Unsec. Gtd. Notes, | | | | | | | | |
5.50%, 03/01/2023(b) | | | 388,000 | | | | 345,320 | |
5.63%, 12/01/2021(b) | | | 16,000 | | | | 14,880 | |
5.88%, 05/15/2023(b) | | | 200,000 | | | | 180,000 | |
6.13%, 04/15/2025(b) | | | 1,844,000 | | | | 1,659,600 | |
6.75%, 08/15/2018(b) | | | 200,000 | | | | 200,000 | |
REGS, Sr. Unsec. Gtd. Euro Notes, 6.13%, 04/15/2025(b) | | | 335,000 | | | | 299,825 | |
| | | | | 4,211,287 | |
|
| Restaurants–0.44% | |
Carrols Restaurant Group, Inc., Sec. Gtd. Second Lien Global Notes, 8.00%, 05/01/2022 | | | 596,000 | | | | 632,505 | |
|
| Security & Alarm Services–0.21% | |
ADT Corp. (The), Sr. Unsec. Global Notes, 6.25%, 10/15/2021 | | | 292,000 | | | | 308,060 | |
|
| Semiconductor Equipment–0.41% | |
Amkor Technology Inc., Sr. Unsec. Global Notes, 6.38%, 10/01/2022 | | | 603,000 | | | | 589,433 | |
| | | | | | | | |
| | | Principal Amount | | | Value | |
| Semiconductors–0.71% | |
Freescale Semiconductor Inc., Sr. Sec. Gtd. First Lien Notes, 6.00%, 01/15/2022(b) | | $ | 195,000 | | | $ | 204,202 | |
Micron Technology, Inc., Sr. Unsec. Gtd. Global Notes, 5.88%, 02/15/2022 | | | 308,000 | | | | 303,380 | |
NXP B.V./NXP Funding LLC (Netherlands), Sr. Unsec. Gtd. Notes, 5.75%, 03/15/2023(b) | | | 500,000 | | | | 518,750 | |
| | | | | 1,026,332 | |
|
| Specialized Consumer Services–0.76% | |
ServiceMaster Co., LLC (The), Sr. Unsec. Notes, 7.45%, 08/15/2027 | | | 1,086,000 | | | | 1,099,575 | |
|
| Specialized Finance–4.51% | |
AerCap Ireland Capital Ltd./AerCap Global Aviation Trust (Netherlands), Sr. Unsec. Gtd. Global Notes, 4.63%, 10/30/2020 | | | 414,000 | | | | 425,385 | |
Aircastle Ltd., Sr. Unsec. Notes, | | | | | | | | |
5.13%, 03/15/2021 | | | 555,000 | | | | 575,119 | |
5.50%, 02/15/2022 | | | 720,000 | | | | 741,600 | |
CIT Group Inc., Sr. Unsec. Global Notes, | | | | | | | | |
5.00%, 08/15/2022 | | | 531,000 | | | | 542,948 | |
5.00%, 08/01/2023 | | | 760,000 | | | | 775,200 | |
Fly Leasing Ltd. (Ireland), Sr. Unsec. Global Notes, 6.75%, 12/15/2020 | | | 821,000 | | | | 845,630 | |
International Lease Finance Corp., | | | | | | | | |
Sr. Unsec. Global Notes, 5.88%, 08/15/2022 | | | 1,162,000 | | | | 1,252,055 | |
Sr. Unsec. Notes,
8.25%, 12/15/2020 | | | 597,000 | | | | 708,937 | |
MSCI Inc., Sr. Unsec. Gtd. Notes, 5.25%, 11/15/2024(b) | | | 640,000 | | | | 652,800 | |
| | | | | 6,519,674 | |
|
| Specialized REIT’s–1.05% | |
Crown Castle International Corp., | | | | | | | | |
Sr. Unsec. Global Notes, 5.25%, 01/15/2023 | | | 825,000 | | | | 871,406 | |
Sr. Unsec. Notes,
4.88%, 04/15/2022 | | | 613,000 | | | | 638,286 | |
| | | | | 1,509,692 | |
|
| Specialty Chemicals–0.68% | |
Platform Specialty Products Corp., Sr. Unsec. Bonds, 10.38%, 05/01/2021(b) | | | 119,000 | | | | 119,000 | |
PolyOne Corp., Sr. Unsec. Global Notes, 5.25%, 03/15/2023 | | | 880,000 | | | | 864,600 | |
| | | | | 983,600 | |
|
| Steel–0.73% | |
Steel Dynamics, Inc., Sr. Unsec. Gtd. Global Notes, | | | | | | | | |
5.13%, 10/01/2021 | | | 341,000 | | | | 317,556 | |
5.50%, 10/01/2024 | | | 788,000 | | | | 722,990 | |
See accompanying Notes to Financial Statements which are an integral part of the financial statements.
Invesco V.I. High Yield Fund
| | | | | | | | |
| | | Principal Amount | | | Value | |
| Steel–(continued) | |
SunCoke Energy Partners L.P./SunCoke Energy Partners Finance Corp., Sr. Unsec. Gtd. Notes, 7.38%, 02/01/2020(b) | | $ | 31,000 | | | $ | 19,336 | |
| | | | | 1,059,882 | |
|
| Tires & Rubber–0.12% | |
Goodyear Tire & Rubber Co. (The), Sr. Unsec. Gtd. Global Bonds, 5.13%, 11/15/2023 | | | 174,000 | | | | 177,915 | |
|
| Trading Companies & Distributors–0.58% | |
United Rentals North America Inc., | | | | | | | | |
Sr. Unsec. Gtd. Global Notes, 5.50%, 07/15/2025 | | | 41,000 | | | | 40,180 | |
Sr. Unsec. Gtd. Notes, 6.13%, 06/15/2023 | | | 775,000 | | | | 795,344 | |
| | | | | 835,524 | |
|
| Trucking–0.36% | |
OPE KAG Finance Sub Inc., Sr. Unsec. Notes, 7.88%, 07/31/2023(b) | | | 520,000 | | | | 519,350 | |
|
| Wireless Telecommunication Services–6.36% | |
Altice Luxembourg S.A. (Luxembourg), Sr. Unsec. Gtd. Notes, 7.75%, 05/15/2022(b) | | | 1,025,000 | | | | 926,344 | |
REGS, Sr. Unsec. Gtd. Euro Notes, 7.75%, 05/15/2022(b) | | | 500,000 | | | | 452,500 | |
Digicel Group Ltd. (Jamaica), Sr. Unsec. Notes, 8.25%, 09/30/2020(b) | | | 400,000 | | | | 330,000 | |
Digicel Ltd. (Jamaica), | | | | | | | | |
Sr. Unsec. Gtd. Notes, 6.75%, 03/01/2023(b) | | | 500,000 | | | | 420,625 | |
Sr. Unsec. Notes, 6.00%, 04/15/2021(b) | | | 600,000 | | | | 510,750 | |
SBA Communications Corp., Sr. Unsec. Global Notes, 4.88%, 07/15/2022 | | | 1,117,000 | | | | 1,105,830 | |
Sprint Communications Inc., Sr. Unsec. Global Notes, 11.50%, 11/15/2021 | | | 355,000 | | | | 329,263 | |
Sprint Corp., Sr. Unsec. Gtd. Global Notes, | | | | | | | | |
7.63%, 02/15/2025 | | | 919,000 | | | | 680,060 | |
7.88%, 09/15/2023 | | | 865,000 | | | | 650,912 | |
T-Mobile USA, Inc.,
Sr. Unsec. Gtd. Global Bonds, | | | | | | | | |
6.50%, 01/15/2026 | | | 298,000 | | | | 301,353 | |
6.84%, 04/28/2023 | | | 87,000 | | | | 90,371 | |
Sr. Unsec. Gtd. Global Notes, 6.38%, 03/01/2025 | | | 1,132,000 | | | | 1,147,565 | |
6.63%, 04/01/2023 | | | 706,000 | | | | 722,767 | |
Wind Acquisition Finance S.A. (Italy), Sec. Gtd. Second Lien Notes, 7.38%, 04/23/2021(b) | | | 1,395,000 | | | | 1,313,044 | |
REGS, Sr. Sec. Gtd. First Lien Euro Notes, 6.50%, 04/30/2020(b) | | | 200,000 | | | | 210,000 | |
| | | | | | | | 9,191,384 | |
Total U.S. Dollar Denominated Bonds and Notes
(Cost $149,553,211) | | | | 133,315,289 | |
| | | | | | | | |
| | | Principal Amount | | | Value | |
Non-U.S. Dollar Denominated Bonds &
Notes–4.10%(f) | |
| Cable & Satellite–0.63% | |
Virgin Media Secured Finance PLC (United Kingdom),
Sr. Sec. Gtd. First Lien Notes, 4.88%, 01/15/2027(b) | | GBP | 150,000 | | | $ | 203,543 | |
REGS, Sr. Sec. Gtd. First Lien Medium-Term Euro Notes, 5.13%, 01/15/2025(b) | | GBP | 500,000 | | | | 702,064 | |
| | | | | | | | 905,607 | |
|
| Casinos & Gaming–0.26% | |
Gala Electric Casinos PLC (United Kingdom), REGS, Sec. Gtd. Second Lien Euro Notes, 11.50%, 06/01/2019(b) | | GBP | 190,909 | | | | 299,299 | |
Gala Group Finance PLC (United Kingdom), REGS, Sr. Sec. Gtd. First Lien Euro Notes, 8.88%, 09/01/2018(b) | | GBP | 55,314 | | | | 85,385 | |
| | | | | 384,684 | |
|
| Diversified Support Services–0.14% | |
AA Bond Co. Ltd. (United Kingdom), Sec. Ltd. Second Lien Notes, 5.50%, 07/31/2022(b) | | GBP | 150,000 | | | | 210,896 | |
|
| Environmental & Facilities Services–0.03% | |
Waste Italia S.p.A. (Italy), Sr. Sec. Gtd. First Lien Notes, 10.50%, 11/15/2019(b) | | EUR | 100,000 | | | | 42,383 | |
|
| Hotels, Resorts & Cruise Lines–0.40% | |
Thomas Cook Finance PLC (United Kingdom), Sr. Unsec. Gtd. Bonds, 6.75%, 06/15/2021(b) | | EUR | 231,000 | | | | 262,964 | |
Thomas Cook Group PLC (United Kingdom), Sr. Unsec. Gtd. Medium-Term Euro Notes, 7.75%, 06/22/2017 | | GBP | 200,000 | | | | 309,630 | |
| | | | | 572,594 | |
|
| Industrial Machinery–0.08% | |
SIG Combibloc Holdings S.C.A. (Luxembourg), Sr. Unsec. Bonds, 7.75%, 02/15/2023(b) | | EUR | 100,000 | | | | 113,832 | |
|
| Internet Software & Services–0.22% | |
United Group B.V. (Serbia),
REGS, Sr. Sec. Gtd. Euro Notes, 7.88%, 11/15/2020(b) | | EUR | 280,000 | | | | 321,848 | |
|
| Movies & Entertainment–1.35% | |
Entertainment One Ltd. (Canada), Sr. Sec. Gtd. Bonds, 6.88%, 12/15/2022(b) | | GBP | 380,000 | | | | 560,177 | |
Odeon & UCI Finco PLC (United Kingdom),
Sr. Sec. Gtd. First Lien Notes, 9.00%, 08/01/2018(b) | | GBP | 110,000 | | | | 168,967 | |
REGS, Sr. Sec. Gtd. First Lien Medium-Term Euro Notes, 9.00%, 08/01/2018(b) | | GBP | 795,000 | | | | 1,221,171 | |
| | | | | 1,950,315 | |
See accompanying Notes to Financial Statements which are an integral part of the financial statements.
Invesco V.I. High Yield Fund
| | | | | | | | |
| | | Principal Amount | | | Value | |
| Other Diversified Financial Services–0.55% | |
Cabot Financial Luxembourg S.A. (United Kingdom), REGS, Sr. Sec. Gtd. First Lien Euro Notes, 10.38%, 10/01/2019(b) | | GBP | 300,000 | | | $ | 475,241 | |
Financiere Gaillon 8 SAS (France), Sr. Sec. First Lien Notes, 7.00%, 09/30/2019(b) | | EUR | 280,000 | | | | 314,718 | |
| | | | | | | | 789,959 | |
|
| Packaged Foods & Meats–0.44% | |
Hydra Dutch Holdings 2 B.V. (Netherlands), Sr. Sec. Gtd. First Lien Notes, 8.00%, 04/15/2019(b) | | EUR | 226,744 | | | | 253,806 | |
Moy Park (Bondco) PLC (United Kingdom), Sr. Unsec. Gtd. Notes,
6.25%, 05/29/2021(b) | | GBP | 250,000 | | | | 377,184 | |
| | | | | | | | 630,990 | |
Total Non-U.S. Dollar Denominated Bonds & Notes
(Cost $6,307,309) | | | | 5,923,108 | |
|
Variable Rate Senior Loan Interests–1.33%(g) | |
| Packaged Foods & Meats–1.33% | | | | | |
Treehouse Foods Inc., Term Loan, 0.00%, 11/01/2016(h) (Cost $1,920,000) | | | 1,920,000 | | | | 1,920,000 | |
|
U.S. Treasury Bills–0.82%(i)(j) | |
0.00%, 05/26/2016 | | $ | 50,000 | | | | 49,922 | |
0.11%, 05/26/2016 | | | 540,000 | | | | 539,163 | |
0.23%, 05/26/2016 | | | 180,000 | | | | 179,721 | |
0.24%, 05/26/2016 | | | 70,000 | | | | 69,892 | |
0.26%, 05/26/2016 | | | 95,000 | | | | 94,853 | |
0.29%, 05/26/2016 | | | 135,000 | | | | 134,791 | |
0.31%, 05/26/2016 | | | 115,000 | | | | 114,822 | |
Total U.S. Treasury Bills (Cost $1,184,045) | | | | | | | 1,183,164 | |
| | |
| | | Shares | | | | |
Common Stocks & Other Equity Interests–0.54% | |
| Automobile Manufacturers–0.49% | |
General Motors Co.(k) | | | 13,101 | | | | 445,565 | |
General Motors Co.–Wts. expiring 07/10/16(k)(l) | | | 6,025 | | | | 146,889 | |
General Motors Co.–Wts. expiring 07/10/19(k)(l) | | | 6,025 | | | | 98,569 | |
| | | | | | | | |
| | |
Shares | | | Value | |
| Automobile Manufacturers–(continued) | |
Motors Liquidation Co. GUC Trust | | | 1,538 | | | $ | 22,378 | |
| | | | | | | | 713,401 | |
|
| Broadcasting–0.00% | |
Adelphia Communications Corp.(l)(m) | | | 3,280 | | | | 1,230 | |
Adelphia Recovery Trust–Series ACC-1(m) | | | 318,570 | | | | 3 | |
Adelphia Recovery Trust–Series Arahova(m) | | | 109,170 | | | | 219 | |
| | | | | | | | 1,452 | |
|
| Forest Products–0.00% | |
Emerald Plantation Holdings Ltd. (Hong Kong)(e)(l) | | | 6,205 | | | | 1,365 | |
|
| Integrated Telecommunication Services–0.05% | |
Hawaiian Telecom Holdco Inc.(n) | | | 545 | | | | 13,549 | |
Largo Ltd.–Class A (Luxembourg)(n) | | | 17,563 | | | | 5,726 | |
Largo Ltd.–Class B (Luxembourg)(n) | | | 158,069 | | | | 51,534 | |
| | | | | | | | 70,809 | |
|
| Paper Products–0.00% | |
Verso Corp.(l) | | | 2,150 | | | | 43 | |
Total Common Stocks & Other Equity Interests
(Cost $1,782,003) | | | | 787,070 | |
|
Preferred Stock–0.24% | |
| Oil & Gas Exploration & Production–0.24% | |
WPX Energy, Inc., Series A, $3.13, Conv. Pfd.
(Cost $556,500) | | | 11,130 | | | | 349,816 | |
| | |
Money Market Funds–0.31% | | | | | | | | |
Liquid Assets Portfolio–Institutional Class, 0.29%(o) | | | 220,817 | | | | 220,817 | |
Premier Portfolio–Institutional
Class, 0.24%(o) | | | 220,817 | | | | 220,817 | |
Total Money Market Funds (Cost $441,634) | | | | | | | 441,634 | |
TOTAL INVESTMENTS–99.64%
(Cost $161,744,702) | | | | 143,920,081 | |
OTHER ASSETS LESS LIABILITIES–0.36% | | | | | | | 513,519 | |
NET ASSETS–100.00% | | | | | | $ | 144,433,600 | |
Investment Abbreviations:
| | |
| Conv. | | — Convertible |
| EUR | | — Euro |
| GBP | | — British Pound |
| Gtd. | | — Guaranteed |
| PIK | | — Payment in Kind |
| Pfd. | | — Preferred |
| REGS | | — Regulation S |
| REIT | | — Real Estate Investment Trust |
| Sec. | | — Secured |
| Sr. | | — Senior |
| Sub. | | — Subordinated |
| Unsec. | | — Unsecured |
| Wts. | | — Warrants |
See accompanying Notes to Financial Statements which are an integral part of the financial statements.
Invesco V.I. High Yield Fund
Notes to Schedule of Investments:
| (a) | Industry and/or sector classifications used in this report are generally according to the Global Industry Classification Standard, which was developed by and is the exclusive property and a service mark of MSCI Inc. and Standard & Poor’s. |
| (b) | Security purchased or received in a transaction exempt from registration under the Securities Act of 1933, as amended (the “1933 Act”). The security may be resold pursuant to an exemption from registration under the 1933 Act, typically to qualified institutional buyers. The aggregate value of these securities at December 31, 2015 was $66,196,278, which represented 45.83% of the Fund’s Net Assets. |
| (c) | Defaulted security. Currently, the issuer is partially or fully in default with respect to interest payments. The aggregate value of these securities at December 31, 2015 was $200, which represented less than 1% of the Fund’s Net Assets. |
| (d) | All or a portion of this security is Payment-in-Kind. |
| | | | | | | | |
| Issuer | | Cash Rate | | | PIK Rate | |
Alphabet Holding Co., Inc., Sr. Unsec. Global PIK Notes | | | 7.75 | % | | | 8.50 | % |
Emerald Plantation Holdings Ltd., Sr. Sec. Gtd. First Lien Global PIK Note | | | 6.00 | | | | 8.00 | |
| (e) | Acquired as part of the Sino-Forest Corp. reorganization. |
| (f) | Foreign denominated security. Principal amount is denominated in the currency indicated. |
| (g) | Variable rate senior loan interests are, at present, not readily marketable, not registered under the 1933 Act, and may be subject to contractual and legal restrictions on sale. Senior secured corporate loans and senior secured debt securities in the Fund’s portfolio generally have variable rates which adjust to a base, such as the London Inter-Bank Offered Rate (“LIBOR”), on set dates, typically every 30 days but not greater than one year; and/or have interest rates that float at a margin above a widely recognized base lending rate such as the Prime Rate of a designated U.S. bank. |
| (h) | All or a portion of this holding is subject to unfunded loan commitments. Interest rate will be determined at the time of funding. See Note 8. |
| (i) | Security traded on a discount basis. The interest rate shown represents the discount rate at the time of purchase by the Fund. |
| (j) | All or a portion of the value was pledged as collateral to cover margin requirements for open futures contracts and swap agreements. See Note 1M, Note 1N and Note 4. |
| (k) | Acquired as part of the General Motors reorganization. |
| (l) | Non-income producing security. |
| (m) | Acquired as part of the Adelphia Communications bankruptcy reorganization. |
| (n) | Non-income producing security acquired as part of the Hawaiian Telecom bankruptcy reorganization. |
| (o) | The money market fund and the Fund are affiliated by having the same investment adviser. The rate shown is the 7-day SEC standardized yield as of December 31, 2015. |
See accompanying Notes to Financial Statements which are an integral part of the financial statements.
Invesco V.I. High Yield Fund
Statement of Assets and Liabilities
December 31, 2015
Statement of Operations
For the year ended December 31, 2015
| | | | |
Assets: | |
Investments, at value (Cost $161,303,068) | | $ | 143,478,447 | |
Investments in affiliated money market funds, at value and cost | | | 441,634 | |
Total investments, at value (Cost $161,744,702) | | | 143,920,081 | |
Foreign currencies, at value (Cost $222,265) | | | 220,110 | |
Receivable for: | | | | |
Investments sold | | | 3,897 | |
Variation margin — centrally cleared swap agreements | | | 5,561 | |
Fund shares sold | | | 20,367 | |
Dividends and interest | | | 2,384,130 | |
Investment for trustee deferred compensation and retirement plans | | | 74,237 | |
Unrealized appreciation on forward foreign currency contracts outstanding | | | 99,916 | |
Total assets | | | 146,728,299 | |
| |
Liabilities: | | | | |
Payable for: | | | | |
Investments purchased | | | 1,920,000 | |
Fund shares reacquired | | | 80,557 | |
Variation margin — futures | | | 21,375 | |
Accrued fees to affiliates | | | 129,437 | |
Accrued trustees’ and officers’ fees and benefits | | | 95 | |
Accrued other operating expenses | | | 11,266 | |
Trustee deferred compensation and retirement plans | | | 78,561 | |
Unrealized depreciation on forward foreign currency contracts outstanding | | | 53,408 | |
Total liabilities | | | 2,294,699 | |
Net assets applicable to shares outstanding | | $ | 144,433,600 | |
| |
Net assets consist of: | | | | |
Shares of beneficial interest | | $ | 168,278,516 | |
Undistributed net investment income | | | 7,047,286 | |
Undistributed net realized gain (loss) | | | (13,060,075 | ) |
Net unrealized appreciation (depreciation) | | | (17,832,127 | ) |
| | | $ | 144,433,600 | |
|
Net Assets: | |
Series I | | $ | 73,593,661 | |
Series II | | $ | 70,839,939 | |
|
Shares outstanding, $0.001 par value per share,
with an unlimited number of shares authorized: | |
Series I | | | 14,538,583 | |
Series II | | | 14,086,852 | |
Series I: | | | | |
Net asset value per share | | $ | 5.06 | |
Series II: | | | | |
Net asset value per share | | $ | 5.03 | |
| | | | |
Investment income: | |
Interest (net of foreign withholding taxes of $2,309) | | $ | 9,876,410 | |
Dividends | | | 35,857 | |
Dividends from affiliated money market funds | | | 3,661 | |
Total investment income | | | 9,915,928 | |
| |
Expenses: | | | | |
Advisory fees | | | 991,791 | |
Administrative services fees | | | 409,843 | |
Custodian fees | | | 22,748 | |
Distribution fees — Series II | | | 174,561 | |
Transfer agent fees | | | 26,098 | |
Trustees’ and officers’ fees and benefits | | | 21,387 | |
Professional services fees | | | 130,844 | |
Other | | | 27,218 | |
Total expenses | | | 1,804,490 | |
Less: Fees waived | | | (6,380 | ) |
Net expenses | | | 1,798,110 | |
Net investment income | | | 8,117,818 | |
| |
Realized and unrealized gain (loss) from: | | | | |
Net realized gain (loss) from: | | | | |
Investment securities (includes net gains from securities sold to affiliates of $33,818) | | | (6,848,649 | ) |
Foreign currencies | | | (39,207 | ) |
Forward foreign currency contracts | | | 545,358 | |
Futures contracts | | | (44,072 | ) |
Swap agreements | | | 110,861 | |
| | | | (6,275,709 | ) |
Change in net unrealized appreciation (depreciation) of: | | | | |
Investment securities | | | (6,445,118 | ) |
Foreign currencies | | | (1,637 | ) |
Forward foreign currency contracts | | | (45,145 | ) |
Futures contracts | | | 34,435 | |
Swap agreements | | | (51,703 | ) |
| | | | (6,509,168 | ) |
Net realized and unrealized gain (loss) | | | (12,784,877 | ) |
Net increase (decrease) in net assets resulting from operations | | $ | (4,667,059 | ) |
See accompanying Notes to Financial Statements which are an integral part of the financial statements.
Invesco V.I. High Yield Fund
Statement of Changes in Net Assets
For the years ended December 31, 2015 and 2014
| | | | | | | | |
| | | 2015 | | | 2014 | |
Operations: | | | | | |
Net investment income | | $ | 8,117,818 | | | $ | 7,724,559 | |
Net realized gain (loss) | | | (6,275,709 | ) | | | 2,534,012 | |
Change in net unrealized appreciation (depreciation) | | | (6,509,168 | ) | | | (8,227,254 | ) |
Net increase (decrease) in net assets resulting from operations | | | (4,667,059 | ) | | | 2,031,317 | |
| | |
Distributions to shareholders from net investment income: | | | | | | | | |
Series I | | | (4,255,607 | ) | | | (4,795,964 | ) |
Series ll | | | (3,746,705 | ) | | | (2,707,280 | ) |
Total distributions from net investment income | | | (8,002,312 | ) | | | (7,503,244 | ) |
| | |
Share transactions–net: | | | | | | | | |
Series l | | | (14,390,517 | ) | | | (946,144 | ) |
Series ll | | | 17,464,885 | | | | 17,576,271 | |
Net increase in net assets resulting from share transactions | | | 3,074,368 | | | | 16,630,127 | |
Net increase (decrease) in net assets | | | (9,595,003 | ) | | | 11,158,200 | |
| | |
Net assets: | | | | | | | | |
Beginning of year | | | 154,028,603 | | | | 142,870,403 | |
End of year (includes undistributed net investment income of $7,047,286 and $7,223,759, respectively) | | $ | 144,433,600 | | | $ | 154,028,603 | |
Notes to Financial Statements
December 31, 2015
NOTE 1—Significant Accounting Policies
Invesco V.I. High Yield Fund (the “Fund”) is a series portfolio of AIM Variable Insurance Funds (Invesco Variable Insurance Funds) (the “Trust”). The Trust is a Delaware statutory trust registered under the Investment Company Act of 1940, as amended (the “1940 Act”), as an open-end series management investment company consisting of twenty-four separate portfolios, (each constituting a “Fund”). The assets, liabilities and operations of each portfolio are accounted for separately. Information presented in these financial statements pertains only to the Fund. Matters affecting each Fund or class will be voted on exclusively by the shareholders of such Fund or class. Current Securities and Exchange Commission (“SEC”) guidance, however, requires participating insurance companies offering separate accounts to vote shares proportionally in accordance with the instructions of the contract owners whose investments are funded by shares of each Fund or class.
The Fund’s investment objective is total return, comprised of current income and capital appreciation.
The Fund currently offers two classes of shares, Series I and Series II, both of which are offered to insurance company separate accounts funding variable annuity contracts and variable life insurance policies (“variable products”).
The following is a summary of the significant accounting policies followed by the Fund in the preparation of its financial statements.
| A. | Security Valuations — Securities, including restricted securities, are valued according to the following policy. |
Debt obligations (including convertible securities) and unlisted equities are fair valued using an evaluated quote provided by an independent pricing service. Evaluated quotes provided by the pricing service may be determined without exclusive reliance on quoted prices, and may reflect appropriate factors such as institution-size trading in similar groups of securities, developments related to specific securities, dividend rate (for unlisted equities), yield (for debt obligations), quality, type of issue, coupon rate (for debt obligations), maturity (for debt obligations), individual trading characteristics and other market data. Debt obligations are subject to interest rate and credit risks. In addition, all debt obligations involve some risk of default with respect to interest and/or principal payments.
Variable rate senior loan interests are fair valued using an evaluated quote provided by an independent pricing service. Evaluated quotes provided by the pricing service may reflect appropriate factors such as ratings, tranche type, industry, company performance, spread, individual trading characteristics, institution-size trading in similar groups of securities and other market data.
A security listed or traded on an exchange (except convertible securities) is valued at its last sales price or official closing price as of the close of the customary trading session on the exchange where the security is principally traded, or lacking any sales or official closing price on a particular day, the security may be valued at the closing bid price on that day. Securities traded in the over-the-counter market are valued based on prices furnished by independent pricing services or market makers. When such securities are valued by an independent pricing service they may be considered fair valued. Futures contracts are valued at the final settlement price set by an exchange on which they are principally traded. Listed options are valued at the mean between the last bid and asked prices from the exchange on which they are principally traded. Options not listed on an exchange are valued by an independent source at the mean between the last bid and asked prices. For purposes of determining net asset value (“NAV”) per share, futures and option contracts generally are valued 15 minutes after the close of the customary trading session of the New York Stock Exchange (“NYSE”).
Invesco V.I. High Yield Fund
Investments in open-end and closed-end registered investment companies that do not trade on an exchange are valued at the end-of-day net asset value per share. Investments in open-end and closed-end registered investment companies that trade on an exchange are valued at the last sales price or official closing price as of the close of the customary trading session on the exchange where the security is principally traded.
Swap agreements are fair valued using an evaluated quote, if available, provided by an independent pricing service. Evaluated quotes provided by the pricing service are valued based on a model which may include end-of-day net present values, spreads, ratings, industry, company performance and returns of referenced assets.
Foreign securities’ (including foreign exchange contracts) prices are converted into U.S. dollar amounts using the applicable exchange rates as of the close of the NYSE. If market quotations are available and reliable for foreign exchange-traded equity securities, the securities will be valued at the market quotations. Because trading hours for certain foreign securities end before the close of the NYSE, closing market quotations may become unreliable. If between the time trading ends on a particular security and the close of the customary trading session on the NYSE, events occur that the Adviser determines are significant and make the closing price unreliable, the Fund may fair value the security. If the event is likely to have affected the closing price of the security, the security will be valued at fair value in good faith using procedures approved by the Board of Trustees. Adjustments to closing prices to reflect fair value may also be based on a screening process of an independent pricing service to indicate the degree of certainty, based on historical data, that the closing price in the principal market where a foreign security trades is not the current value as of the close of the NYSE. Foreign securities’ prices meeting the approved degree of certainty that the price is not reflective of current value will be priced at the indication of fair value from the independent pricing service. Multiple factors may be considered by the independent pricing service in determining adjustments to reflect fair value and may include information relating to sector indices, American Depositary Receipts and domestic and foreign index futures. Foreign securities may have additional risks including exchange rate changes, potential for sharply devalued currencies and high inflation, political and economic upheaval, the relative lack of issuer information, relatively low market liquidity and the potential lack of strict financial and accounting controls and standards.
Securities for which market prices are not provided by any of the above methods may be valued based upon quotes furnished by independent sources. The last bid price may be used to value equity securities. The mean between the last bid and asked prices is used to value debt obligations, including corporate loans.
Securities for which market quotations are not readily available or became unreliable are valued at fair value as determined in good faith by or under the supervision of the Trust’s officers following procedures approved by the Board of Trustees. Issuer specific events, market trends, bid/asked quotes of brokers and information providers and other market data may be reviewed in the course of making a good faith determination of a security’s fair value.
The Fund may invest in securities that are subject to interest rate risk, meaning the risk that the prices will generally fall as interest rates rise and, conversely, the prices will generally rise as interest rates fall. Specific securities differ in their sensitivity to changes in interest rates depending on their individual characteristics. Changes in interest rates may result in increased market volatility, which may affect the value and/or liquidity of certain Fund investments.
Valuations change in response to many factors including the historical and prospective earnings of the issuer, the value of the issuer’s assets, general economic conditions, interest rates, investor perceptions and market liquidity. Because of the inherent uncertainties of valuation, the values reflected in the financial statements may materially differ from the value received upon actual sale of those investments.
| B. | Securities Transactions and Investment Income — Securities transactions are accounted for on a trade date basis. Realized gains or losses on sales are computed on the basis of specific identification of the securities sold. Interest income (net of withholding tax, if any) is recorded on the accrual basis from settlement date. Dividend income (net of withholding tax, if any) is recorded on the ex-dividend date. Bond premiums and discounts are amortized and/or accreted for financial reporting purposes. |
The Fund may periodically participate in litigation related to Fund investments. As such, the Fund may receive proceeds from litigation settlements. Any proceeds received are included in the Statement of Operations as realized gain (loss) for investments no longer held and as unrealized gain (loss) for investments still held.
Brokerage commissions and mark ups are considered transaction costs and are recorded as an increase to the cost basis of securities purchased and/or a reduction of proceeds on a sale of securities. Such transaction costs are included in the determination of net realized and unrealized gain (loss) from investment securities reported in the Statement of Operations and the Statement of Changes in Net Assets and the net realized and unrealized gains (losses) on securities per share in the Financial Highlights. Transaction costs are included in the calculation of the Fund’s net asset value and, accordingly, they reduce the Fund’s total returns. These transaction costs are not considered operating expenses and are not reflected in net investment income reported in the Statement of Operations and the Statement of Changes in Net Assets, or the net investment income per share and the ratios of expenses and net investment income reported in the Financial Highlights, nor are they limited by any expense limitation arrangements between the Fund and the investment adviser.
The Fund allocates income and realized and unrealized capital gains and losses to a class based on the relative net assets of each class.
| C. | Country Determination — For the purposes of making investment selection decisions and presentation in the Schedule of Investments, the investment adviser may determine the country in which an issuer is located and/or credit risk exposure based on various factors. These factors include the laws of the country under which the issuer is organized, where the issuer maintains a principal office, the country in which the issuer derives 50% or more of its total revenues and the country that has the primary market for the issuer’s securities, as well as other criteria. Among the other criteria that may be evaluated for making this determination are the country in which the issuer maintains 50% or more of its assets, the type of security, financial guarantees and enhancements, the nature of the collateral and the sponsor organization. Country of issuer and/or credit risk exposure has been determined to be the United States of America, unless otherwise noted. |
| D. | Distributions — Distributions from net investment income and net realized capital gain, if any, are generally declared and paid to separate accounts of participating insurance companies annually and recorded on the ex-dividend date. |
| E. | Federal Income Taxes — The Fund intends to comply with the requirements of Subchapter M of the Internal Revenue Code of 1986, as amended (the “Internal Revenue Code”), necessary to qualify as a regulated investment company and to distribute substantially all of the Fund’s taxable earnings to shareholders. As such, the Fund will not be subject to federal income taxes on otherwise taxable income (including net realized capital gain) that is distributed to shareholders. Therefore, no provision for federal income taxes is recorded in the financial statements. |
Invesco V.I. High Yield Fund
The Fund recognizes the tax benefits of uncertain tax positions only when the position is more likely than not to be sustained. Management has analyzed the Fund’s uncertain tax positions and concluded that no liability for unrecognized tax benefits should be recorded related to uncertain tax positions. Management is not aware of any tax positions for which it is reasonably possible that the total amounts of unrecognized tax benefits will change materially in the next 12 months.
The Fund files tax returns in the U.S. Federal jurisdiction and certain other jurisdictions. Generally, the Fund is subject to examinations by such taxing authorities for up to three years after the filing of the return for the tax period.
| F. | Expenses — Fees provided for under the Rule 12b-1 plan of a particular class of the Fund and which are directly attributable to that class are charged to the operations of such class. All other expenses are allocated among the classes based on relative net assets. |
| G. | Accounting Estimates — The preparation of financial statements in conformity with accounting principles generally accepted in the United States of America (“GAAP”) requires management to make estimates and assumptions that affect the reported amounts of assets and liabilities at the date of the financial statements and the reported amounts of revenues and expenses during the reporting period including estimates and assumptions related to taxation. Actual results could differ from those estimates by a significant amount. In addition, the Fund monitors for material events or transactions that may occur or become known after the period-end date and before the date the financial statements are released to print. |
| H. | Indemnifications — Under the Trust’s organizational documents, each Trustee, officer, employee or other agent of the Trust is indemnified against certain liabilities that may arise out of the performance of their duties to the Fund. Additionally, in the normal course of business, the Fund enters into contracts, including the Fund’s servicing agreements, that contain a variety of indemnification clauses. The Fund’s maximum exposure under these arrangements is unknown as this would involve future claims that may be made against the Fund that have not yet occurred. The risk of material loss as a result of such indemnification claims is considered remote. |
| I. | Lower-Rated Securities — The Fund normally invests at least 80% of its net assets in lower-quality debt securities, i.e., “junk bonds”. Investments in lower-rated securities or unrated securities of comparable quality tend to be more sensitive to economic conditions than higher rated securities. Junk bonds involve a greater risk of default by the issuer because such securities are generally unsecured and are often subordinated to other creditors’ claims. |
| J. | Securities Purchased on a When-Issued and Delayed Delivery Basis — The Fund may purchase and sell interests in corporate loans and corporate debt securities and other portfolio securities on a when-issued and delayed delivery basis, with payment and delivery scheduled for a future date. No income accrues to the Fund on such interests or securities in connection with such transactions prior to the date the Fund actually takes delivery of such interests or securities. These transactions are subject to market fluctuations and are subject to the risk that the value at delivery may be more or less than the trade date purchase price. Although the Fund will generally purchase these securities with the intention of acquiring such securities, they may sell such securities prior to the settlement date. |
| K. | Foreign Currency Translations — Foreign currency is valued at the close of the NYSE based on quotations posted by banks and major currency dealers. Portfolio securities and other assets and liabilities denominated in foreign currencies are translated into U.S. dollar amounts at date of valuation. Purchases and sales of portfolio securities (net of foreign taxes withheld on disposition) and income items denominated in foreign currencies are translated into U.S. dollar amounts on the respective dates of such transactions. The Fund does not separately account for the portion of the results of operations resulting from changes in foreign exchange rates on investments and the fluctuations arising from changes in market prices of securities held. The combined results of changes in foreign exchange rates and the fluctuation of market prices on investments (net of estimated foreign tax withholding) are included with the net realized and unrealized gain or loss from investments in the Statement of Operations. Reported net realized foreign currency gains or losses arise from (1) sales of foreign currencies, (2) currency gains or losses realized between the trade and settlement dates on securities transactions, and (3) the difference between the amounts of dividends, interest, and foreign withholding taxes recorded on the Fund’s books and the U.S. dollar equivalent of the amounts actually received or paid. Net unrealized foreign currency gains and losses arise from changes in the fair values of assets and liabilities, other than investments in securities at fiscal period end, resulting from changes in exchange rates. |
The Fund may invest in foreign securities, which may be subject to foreign taxes on income, gains on investments or currency repatriation, a portion of which may be recoverable. Foreign taxes, if any, are recorded based on the tax regulations and rates that exist in the foreign markets in which the Fund invests and are shown in the Statement of Operations.
| L. | Forward Foreign Currency Contracts — The Fund may engage in foreign currency transactions either on a spot (i.e. for prompt delivery and settlement) basis, or through forward foreign currency contracts, to manage or minimize currency or exchange rate risk. |
The Fund may also enter into forward foreign currency contracts for the purchase or sale of a security denominated in a foreign currency in order to “lock in” the U.S. dollar price of that security, or the Fund may also enter into forward foreign currency contracts that do not provide for physical settlement of the two currencies, but instead are settled by a single cash payment calculated as the difference between the agreed upon exchange rate and the spot rate at settlement based upon an agreed upon notional amount (non-deliverable forwards). The Fund will set aside liquid assets in an amount equal to daily mark-to-market obligation for forward foreign currency contracts.
A forward foreign currency contract is an obligation between two parties (“Counterparties”) to purchase or sell a specific currency for an agreed-upon price at a future date. The use of forward foreign currency contracts does not eliminate fluctuations in the price of the underlying securities the Fund owns or intends to acquire but establishes a rate of exchange in advance. Fluctuations in the value of these contracts are measured by the difference in the contract date and reporting date exchange rates and are recorded as unrealized appreciation (depreciation) until the contracts are closed. When the contracts are closed, realized gains (losses) are recorded. Realized and unrealized gains (losses) on the contracts are included in the Statement of Operations. The primary risks associated with forward foreign currency contracts include failure of the Counterparty to meet the terms of the contract and the value of the foreign currency changing unfavorably. These risks may be in excess of the amounts reflected in the Statement of Assets and Liabilities.
| M. | Futures Contracts — The Fund may enter into futures contracts to manage exposure to interest rate, equity and market price movements and/or currency risks. A futures contract is an agreement between Counterparties to purchase or sell a specified underlying security, currency or commodity (or delivery of a cash settlement price, in the case of an index future) for a fixed price at a future date. The Fund currently invests only in exchange-traded futures and they are standardized as to maturity date and underlying financial instrument. Initial margin deposits required upon entering into futures contracts are satisfied by the segregation of specific securities or cash as collateral at the futures commission |
Invesco V.I. High Yield Fund
| | merchant (broker). During the period the futures contracts are open, changes in the value of the contracts are recognized as unrealized gains or losses by recalculating the value of the contracts on a daily basis. Subsequent or variation margin payments are received or made depending upon whether unrealized gains or losses are incurred. These amounts are reflected as receivables or payables on the Statement of Assets and Liabilities. When the contracts are closed or expire, the Fund recognizes a realized gain or loss equal to the difference between the proceeds from, or cost of, the closing transaction and the Fund’s basis in the contract. The net realized gain (loss) and the change in unrealized gain (loss) on futures contracts held during the period is included on the Statement of Operations. The primary risks associated with futures contracts are market risk and the absence of a liquid secondary market. If the Fund were unable to liquidate a futures contract and/or enter into an offsetting closing transaction, the Fund would continue to be subject to market risk with respect to the value of the contracts and continue to be required to maintain the margin deposits on the futures contracts. Futures contracts have minimal Counterparty risk since the exchange’s clearinghouse, as Counterparty to all exchange-traded futures, guarantees the futures against default. Risks may exceed amounts recognized in the Statement of Assets and Liabilities. |
| N. | Swap Agreements — The Fund may enter into various swap transactions, including interest rate, total return, index, currency and credit default swap contracts (“CDS”) for investment purposes or to manage interest rate, currency or credit risk. Such transactions are agreements between Counterparties. A swap agreement may be negotiated bilaterally and traded over-the-counter (“OTC”) between two parties (“uncleared/OTC”) or, in some instances, must be transacted through a future commission merchant (“FCM”) and cleared through a clearinghouse that serves as a central Counterparty (“centrally cleared swap”). These agreements may contain among other conditions, events of default and termination events, and various covenants and representations such as provisions that require the Fund to maintain a pre-determined level of net assets, and/or provide limits regarding the decline of the Fund’s NAV over specific periods of time. If the Fund were to trigger such provisions and have open derivative positions at that time, the Counterparty may be able to terminate such agreement and request immediate payment in an amount equal to the net liability positions, if any. |
Interest rate, total return, index, and currency swap agreements are two-party contracts entered into primarily to exchange the returns (or differentials in rates of returns) earned or realized on particular predetermined investments or instruments. The gross returns to be exchanged or “swapped” between the parties are calculated with respect to a notional amount, i.e., the return on or increase in value of a particular dollar amount invested at a particular interest rate or return of an underlying asset, in a particular foreign currency, or in a “basket” of securities representing a particular index.
In a centrally cleared swap, the Fund’s ultimate Counterparty is a central clearinghouse. The Fund initially will enter into centrally cleared swaps through an executing broker. When a fund enters into a centrally cleared swap, it must deliver to the central Counterparty (via the FCM) an amount referred to as “initial margin.” Initial margin requirements are determined by the central Counterparty, but an FCM may require additional initial margin above the amount required by the central Counterparty. Initial margin deposits required upon entering into centrally cleared swaps are satisfied by cash or securities as collateral at the FCM. Securities deposited as initial margin are designated on the Schedule of Investments and cash deposited is recorded on the Statement of Assets and Liabilities. During the term of a cleared swap agreement, a “variation margin” amount may be required to be paid by the Fund or may be received by the Fund, based on the daily change in price of the underlying reference instrument subject to the swap agreement and is recorded as a receivable or payable for variation margin in the Statement of Assets and Liabilities until the centrally cleared swap is terminated at which time a realized gain or loss is recorded.
A CDS is an agreement between Counterparties to exchange the credit risk of an issuer. A buyer of a CDS is said to buy protection by paying a fixed payment over the life of the agreement and in some situations an upfront payment to the seller of the CDS. If a defined credit event occurs (such as payment default or bankruptcy), the Fund as a protection buyer would cease paying its fixed payment, the Fund would deliver eligible bonds issued by the reference entity to the seller, and the seller would pay the full notional value, or the “par value”, of the referenced obligation to the Fund. A seller of a CDS is said to sell protection and thus would receive a fixed payment over the life of the agreement and an upfront payment, if applicable. If a credit event occurs, the Fund as a protection seller would cease to receive the fixed payment stream, the Fund would pay the buyer “par value” or the full notional value of the referenced obligation, and the Fund would receive the eligible bonds issued by the reference entity. In turn, these bonds may be sold in order to realize a recovery value. Alternatively, the seller of the CDS and its Counterparty may agree to net the notional amount and the market value of the bonds and make a cash payment equal to the difference to the buyer of protection. If no credit event occurs, the Fund receives the fixed payment over the life of the agreement. As the seller, the Fund would effectively add leverage to its portfolio because, in addition to its total net assets, the Fund would be subject to investment exposure on the notional amount of the CDS. In connection with these agreements, cash and securities may be identified as collateral in accordance with the terms of the respective swap agreements to provide assets of value and recourse in the event of default under the swap agreement or bankruptcy/insolvency of a party to the swap agreement. If a Counterparty becomes bankrupt or otherwise fails to perform its obligations due to financial difficulties, the Fund may experience significant delays in obtaining any recovery in a bankruptcy or other reorganization proceeding. The Fund may obtain only limited recovery or may obtain no recovery in such circumstances. The Fund’s maximum risk of loss from Counterparty risk, either as the protection seller or as the protection buyer, is the value of the contract. The risk may be mitigated by having a master netting arrangement between the Fund and the Counterparty and by the designation of collateral by the Counterparty to cover the Fund’s exposure to the Counterparty.
Implied credit spreads represent the current level at which protection could be bought or sold given the terms of the existing CDS contract and serve as an indicator of the current status of the payment/performance risk of the CDS. An implied spread that has widened or increased since entry into the initial contract may indicate a deteriorating credit profile and increased risk of default for the reference entity. A declining or narrowing spread may indicate an improving credit profile or decreased risk of default for the reference entity. Alternatively, credit spreads may increase or decrease reflecting the general tolerance for risk in the credit markets.
An interest rate swap is an agreement between Counterparties pursuant to which the parties exchange a floating rate payment for a fixed rate payment based on a specified notional amount.
Changes in the value of centrally cleared and OTC swap agreements are recognized as unrealized gains (losses) in the Statement of Operations by “marking to market” on a daily basis to reflect the value of the swap agreement at the end of each trading day. Payments received or paid at the beginning of the agreement are reflected as such on the Statement of Assets and Liabilities and may be referred to as upfront payments. The Fund accrues for the fixed payment stream and amortizes upfront payments, if any, on swap agreements on a daily basis with the net amount,
Invesco V.I. High Yield Fund
recorded as a component of realized gain (loss) on the Statement of Operations. A liquidation payment received or made at the termination of a swap agreement is recorded as realized gain (loss) on the Statement of Operations. The Fund segregates liquid securities having a value at least equal to the amount of the potential obligation of a Fund under any swap transaction. Entering into these agreements involves, to varying degrees, lack of liquidity and elements of credit, market, and Counterparty risk in excess of amounts recognized on the Statement of Assets and Liabilities. Such risks involve the possibility that a swap is difficult to sell or liquidate; the Counterparty does not honor its obligations under the agreement and unfavorable interest rates and market fluctuations. It is possible that developments in the swaps market, including potential government regulation, could adversely affect the Fund’s ability to terminate existing swap agreements or to realize amounts to be received under such agreements. A short position in a security poses more risk than holding the same security long. As there is no limit on how much the price of the security can increase, the Fund’s exposure is unlimited.
Notional amounts of each individual credit default swap agreement outstanding as of December 31, 2015 for which the Fund is the seller of protection are disclosed in the open swap agreements table. These potential amounts would be partially offset by any recovery values of the respective referenced obligations, upfront payments received upon entering into the agreement, or net amounts received from the settlement of buy protection credit default swap agreements entered into by the Fund for the same referenced entity or entities.
| O. | Bank Loan Risk — Although the resale, or secondary market for floating rate loans has grown substantially over the past decade, both in overall size and number of market participants, there is no organized exchange or board of trade on which floating rate loans are traded. Instead, the secondary market for floating rate loans is a private, unregulated interdealer or interbank resale market. Such a market may therefore be subject to irregular trading activity, wide bid/ask spreads, and extended trade settlement periods. Similar to other asset classes, bank loan funds may be exposed to counterparty credit risk, or the risk than an entity with which the Fund has unsettled or open transactions may fail to or be unable to perform on its commitments. The Fund manages counterparty credit risk by entering into transactions only with counterparties that it believes have the financial resources to honor their obligations and by monitoring the financial stability of those counterparties. |
| P. | Leverage Risk — Leverage exists when the Fund can lose more than it originally invests because it purchases or sells an instrument or enters into a transaction without investing an amount equal to the full economic exposure of the instrument or transaction. |
| Q. | Other Risks — The Fund invests in corporate loans from U.S. or non-U.S. companies (the “Borrowers”). The investment of the Fund in a corporate loan may take the form of participation interests or assignments. If the Fund purchases a participation interest from a syndicate of lenders (“Lenders”) or one of the participants in the syndicate (“Participant”), one or more of which administers the loan on behalf of all the Lenders (the “Agent Bank”), the Fund would be required to rely on the Lender that sold the participation interest not only for the enforcement of the Fund’s rights against the Borrower but also for the receipt and processing of payments due to the Fund under the corporate loans. As such, the Fund is subject to the credit risk of the Borrower and the Participant. Lenders and Participants interposed between the Fund and a Borrower, together with Agent Banks, are referred to as “Intermediate Participants”. |
| R. | Collateral — To the extent the Fund has designated or segregated a security as collateral and that security is subsequently sold, it is the Fund’s practice to replace such collateral no later than the next business day. |
NOTE 2—Advisory Fees and Other Fees Paid to Affiliates
The Trust has entered into a master investment advisory agreement with Invesco Advisers, Inc. (the “Adviser” or “Invesco”). Under the terms of the investment advisory agreement, the Fund pays an advisory fee to the Adviser based on the annual rate of the Fund’s average daily net assets as follows:
| | | | | | |
| Average Daily Net Assets | | Rate |
First $200 million | | | 0 | .625% | | |
Next $300 million | | | 0 | .55% | | |
Next $500 million | | | 0 | .50% | | |
Over $1 billion | | | 0 | .45% | | |
For the year ended December 31, 2015, the effective advisory fees incurred by the Fund was 0.625%.
Under the terms of a master sub-advisory agreement between the Adviser and each of Invesco Asset Management Deutschland GmbH, Invesco Asset Management Limited, Invesco Asset Management (Japan) Limited, Invesco Hong Kong Limited, Invesco Senior Secured Management, Inc. and Invesco Canada Ltd. (collectively, the “Affiliated Sub-Advisers”) the Adviser, not the Fund, may pay 40% of the fees paid to the Adviser to any such Affiliated Sub-Adviser(s) that provide(s) discretionary investment management services to the Fund based on the percentage of assets allocated to such Affiliated Sub-Adviser(s).
The Adviser has contractually agreed, through at least June 30, 2016, to waive advisory fees and/or reimburse expenses of all shares to the extent necessary to limit total annual fund operating expenses after fee waiver and/or expense reimbursement (excluding certain items discussed below) of Series I shares to 1.50% and Series II shares to 1.75% of average daily net assets. In determining the Adviser’s obligation to waive advisory fees and/or reimburse expenses, the following expenses are not taken into account, and could cause the total annual fund operating expenses after fee waiver and/or expense reimbursement to exceed the numbers reflected above: (1) interest; (2) taxes; (3) dividend expense on short sales; (4) extraordinary or non-routine items, including litigation expenses; and (5) expenses that the Fund has incurred but did not actually pay because of an expense offset arrangement. Unless Invesco continues the fee waiver agreement, it will terminate on June 30, 2016. The fee waiver agreement cannot be terminated during its term. The Adviser did not waive fees and/or reimburse expenses during the period under this expense limitation.
Further, the Adviser has contractually agreed, through at least June 30, 2017, to waive the advisory fee payable by the Fund in an amount equal to 100% of the net advisory fees the Adviser receives from the affiliated money market funds on investments by the Fund of uninvested cash in such affiliated money market funds.
For the year ended December 31, 2015, the Adviser waived advisory fees of $6,380.
The Trust has entered into a master administrative services agreement with Invesco pursuant to which the Fund has agreed to pay Invesco a fee for costs incurred in providing accounting services and fund administrative services to the Fund and to reimburse Invesco for administrative services fees
Invesco V.I. High Yield Fund
paid to insurance companies that have agreed to provide services to the participants of separate accounts. These administrative services provided by the insurance companies may include, among other things: the printing of prospectuses, financial reports and proxy statements and the delivery of the same to existing participants; the maintenance of master accounts; the facilitation of purchases and redemptions requested by the participants; and the servicing of participants’ accounts. Pursuant to such agreement, for the year ended December 31, 2015, Invesco was paid $50,000 for accounting and fund administrative services and reimbursed $359,843 for services provided by insurance companies.
The Trust has entered into a transfer agency and service agreement with Invesco Investment Services, Inc. (“IIS”) pursuant to which the Fund has agreed to pay IIS a fee for providing transfer agency and shareholder services to the Fund and reimburse IIS for certain expenses incurred by IIS in the course of providing such services. For the year ended December 31, 2015, expenses incurred under the agreement are shown in the Statement of Operations as Transfer agent fees.
The Trust has entered into a master distribution agreement with Invesco Distributors, Inc. (“IDI”) to serve as the distributor for the Fund. The Trust has adopted a plan pursuant to Rule 12b-1 under the 1940 Act with respect to the Fund’s Series II shares (the “Plan”). The Fund, pursuant to the Plan, pays IDI compensation at the annual rate of 0.25% of the Fund’s average daily net assets of Series II shares. Of the Plan payments, up to 0.25% of the average daily net assets of the Series II shares may be paid to insurance companies who furnish continuing personal shareholder services to customers who purchase and own Series II shares of the Fund. For the year ended December 31, 2015, expenses incurred under the Plan are detailed in the Statement of Operations as Distribution fees.
Certain officers and trustees of the Trust are officers and directors of the Adviser, IIS and/or IDI.
NOTE 3—Additional Valuation Information
GAAP defines fair value as the price that would be received to sell an asset or paid to transfer a liability in an orderly transaction between market participants at the measurement date, under current market conditions. GAAP establishes a hierarchy that prioritizes the inputs to valuation methods, giving the highest priority to readily available unadjusted quoted prices in an active market for identical assets (Level 1) and the lowest priority to significant unobservable inputs (Level 3), generally when market prices are not readily available or are unreliable. Based on the valuation inputs, the securities or other investments are tiered into one of three levels. Changes in valuation methods may result in transfers in or out of an investment’s assigned level:
| | Level 1 — | Prices are determined using quoted prices in an active market for identical assets. |
| | Level 2 — | Prices are determined using other significant observable inputs. Observable inputs are inputs that other market participants may use in pricing a security. These may include quoted prices for similar securities, interest rates, prepayment speeds, credit risk, yield curves, loss severities, default rates, discount rates, volatilities and others. |
| | Level 3 — | Prices are determined using significant unobservable inputs. In situations where quoted prices or observable inputs are unavailable (for example, when there is little or no market activity for an investment at the end of the period), unobservable inputs may be used. Unobservable inputs reflect the Fund’s own assumptions about the factors market participants would use in determining fair value of the securities or instruments and would be based on the best available information. |
The following is a summary of the tiered valuation input levels, as of December 31, 2015. The level assigned to the securities valuations may not be an indication of the risk or liquidity associated with investing in those securities. Because of the inherent uncertainties of valuation, the values reflected in the financial statements may materially differ from the value received upon actual sale of those investments.
| | | | | | | | | | | | | | | | |
| | | Level 1 | | | Level 2 | | | Level 3 | | | Total | |
Equity Securities | | $ | 1,519,811 | | | $ | 58,709 | | | $ | 0 | | | $ | 1,578,520 | |
Corporate Debt Securities | | | — | | | | 133,315,289 | | | | 0 | | | | 133,315,289 | |
Foreign Debt Securities | | | — | | | | 5,923,108 | | | | — | | | | 5,923,108 | |
Variable Rate Senior Loan Interests | | | — | | | | 1,920,000 | | | | — | | | | 1,920,000 | |
U.S. Treasury Securities | | | — | | | | 1,183,164 | | | | — | | | | 1,183,164 | |
| | | | 1,519,811 | | | | 142,400,270 | | | | 0 | | | | 143,920,081 | |
Forward Foreign Currency Contracts* | | | — | | | | 46,508 | | | | — | | | | 46,508 | |
Futures Contracts* | | | 34,435 | | | | — | | | | — | | | | 34,435 | |
Swap Agreements* | | | — | | | | (81,941 | ) | | | — | | | | (81,941 | ) |
Total Investments | | $ | 1,554,246 | | | $ | 142,364,837 | | | $ | 0 | | | $ | 143,919,083 | |
| * | Unrealized appreciation (depreciation). |
Invesco V.I. High Yield Fund
NOTE 4—Derivative Investments
Value of Derivative Investments at Period-End
The table below summarizes the value of the Fund’s derivative investments, detailed by primary risk exposure, held as of December 31, 2015:
| | | | | | | | |
| | | Value | |
| Risk Exposure/Derivative Type | | Assets | | | Liabilities | |
Credit risk: | | | | | | | | |
Swap agreements(a) | | $ | — | | | $ | (81,941 | ) |
Currency risk: | | | | | | | | |
Forward foreign currency contracts(b) | | | 99,916 | | | | (53,408 | ) |
Interest rate risk: | | | | | | | | |
Futures contracts(c) | | | 34,435 | | | | — | |
Total | | $ | 134,351 | | | $ | (135,349 | ) |
| (a) | Includes cumulative appreciation (depreciation) of centrally cleared swap agreements. Only current day’s variation margin receivable is reported within the Statement of Assets and Liabilities. |
| (b) | Values are disclosed on the Statement of Assets and Liabilities under the captions Unrealized appreciation on forward foreign currency contracts outstanding and Unrealized depreciation on forward foreign currency contracts outstanding. |
| (c) | Includes cumulative appreciation of futures contracts. Only current day’s variation margin receivable (payable) is reported within the Statement of Assets and Liabilities. |
Effect of Derivative Investments for the year ended December 31, 2015
The table below summarizes the gains (losses) on derivative investments, detailed by primary risk exposure, recognized in earnings during the period:
| | | | | | | | | | | | |
| | | Location of Gain (Loss) on
Statement of Operations | |
| | | Forward Foreign
Currency Contracts | | | Futures
Contracts | | | Swap
Agreements | |
Realized Gain (Loss): | | | | | | | | | | | | |
Credit risk | | $ | — | | | $ | — | | | $ | 110,861 | |
Currency risk | | | 545,358 | | | | — | | | | — | |
Interest rate risk | | | — | | | | (44,072 | ) | | | — | |
Change in Net Unrealized Appreciation (Depreciation): | | | | | | | | | | | | |
Credit risk | | $ | — | | | $ | — | | | $ | (51,703 | ) |
Currency risk | | | (45,145 | ) | | | — | | | | — | |
Interest rate risk | | | — | | | | 34,435 | | | | — | |
Total | | $ | 500,213 | | | $ | (9,637 | ) | | $ | 59,158 | |
The table below summarizes the twelve month average notional value of forward foreign currency contracts, the eleven month average notional value of swap agreements and the eight month average notional value of futures contracts outstanding during the period.
| | | | | | | | | | | | |
| | | Forward Foreign
Currency Contracts | | | Futures
Contracts | | | Swap
Agreements | |
Average notional value | | $ | 8,459,494 | | | $ | 10,394,160 | | | $ | 4,228,263 | |
| | | | | | | | | | | | | | | | | | | | | | | | | | |
| Open Forward Foreign Currency Contracts | |
Settlement
Date | | Counterparty | | Contract to | | | Notional
Value | | | Unrealized
Appreciation
(Depreciation) | |
| | | Deliver | | | Receive | | | |
03/11/16 | | Deutsche Bank Securities Inc. | | | GBP | | | | 2,822,272 | | | | USD | | | | 4,250,596 | | | $ | 4,160,946 | | | $ | 89,650 | |
03/11/16 | | Goldman Sachs International | | | EUR | | | | 1,696,586 | | | | USD | | | | 1,798,405 | | | | 1,847,143 | | | | (48,738 | ) |
03/11/16 | | Goldman Sachs International | | | GBP | | | | 346,151 | | | | USD | | | | 519,020 | | | | 510,339 | | | | 8,681 | |
03/11/16 | | Goldman Sachs International | | | USD | | | | 543,530 | | | | EUR | | | | 500,683 | | | | 545,115 | | | | 1,585 | |
03/11/16 | | Goldman Sachs International | | | USD | | | | 170,900 | | | | GBP | | | | 112,750 | | | | 166,230 | | | | (4,670 | ) |
Total Forward Foreign Currency Contracts — Currency Risk | | | $ | 46,508 | |
Currency Abbreviations:
| | |
| EUR | | – Euro |
| GBP | | – British Pound Sterling |
| USD | | – U.S. Dollar |
Invesco V.I. High Yield Fund
| | | | | | | | | | | | | | | | | | | | |
| Open Futures Contracts — Interest Rate Risk | |
| Futures Contracts | | Type of
Contract | | | Number of
Contracts | | | Expiration
Month | | | Notional Value | | | Unrealized
Appreciation | |
U.S. 10 Year Treasury Notes | | | Short | | | | 72 | | | | March-2016 | | | $ | (9,065,250 | ) | | $ | 34,435 | |
| | | | | | | | | | | | | | | | | | | | | | | | | | | | | | |
| Open Centrally Cleared Credit Default Swap Agreements — Credit Risk | |
| Counterparty/Clearinghouse | | Reference Entity | | Buy/Sell Protection | | | (Pay)/Receive Fixed Rate | | | Expiration
Date | | | Implied
Credit
Spread(a) | | | Notional Value | | | Upfront
Payments | | | Unrealized Appreciation (Depreciation) | |
Credit Suisse Securities
(USA) LLC/CME | | Markit CDX North America High Yield Index | | | Sell | | | | 5.00 | % | | | 12/20/20 | | | | 4.71 | % | | $ | 7,570,000 | | | $ | 167,003 | | | $ | (81,941 | ) |
| (a) | Implied credit spreads represent the current level as of December 31, 2015 at which protection could be bought or sold given the terms of the existing credit default swap contract and serve as an indicator of the current status of the payment/performance risk of the credit default swap contract. An implied credit spread that has widened or increased since entry into the initial contract may indicate a deteriorating credit profile and increased risk of default for the reference entity. A declining or narrowing spread may indicate an improving credit profile or decreased risk of default for the reference entity. Alternatively, credit spreads may increase or decrease reflecting the general tolerance for risk in the credit markets generally. |
Abbreviations:
| | |
| CME | | – Chicago Mercantile Exchange |
Offsetting Assets and Liabilities
Accounting Standards Update (“ASU”) No. 2011-11, Disclosures about Offsetting Assets and Liabilities, which was subsequently clarified in Financial Accounting Standards Board ASU 2013-01 “Clarifying the Scope of Disclosures about Offsetting Assets and Liabilities” is intended to enhance disclosures about financial instruments and derivative instruments that are subject to offsetting arrangements on the Statement of Assets and Liabilities and to enable investors to better understand the effect of those arrangements on the Fund’s financial position. In order for an arrangement to be eligible for netting, the Fund must have a basis to conclude that such netting arrangements are legally enforceable. The Fund enters into netting agreements and collateral agreements in an attempt to reduce the Fund’s Counterparty credit risk by providing for a single net settlement with a Counterparty of all financial transactions covered by the agreement in an event of default as defined under such agreement.
The following tables present derivative instruments that are either subject to an enforceable netting agreement or offset by collateral arrangements as of December 31, 2015.
| | | | | | | | | | | | | | | | | | | | |
Counterparty | | Gross amounts
of Recognized
Assets | | | Gross Amounts Not Offset in the
Statement of Assets and Liabilities | | | Net
Amount | |
| | | Financial
Instruments | | | Collateral Received | | |
| | | | Non-Cash | | | Cash | | |
Credit Suisse Securities (USA) LLC(a) | | $ | 167,003 | | | $ | (81,941 | ) | | $ | — | | | $ | — | | | $ | 85,062 | |
Deutsche Bank Securities Inc.(b) | | | 89,650 | | | | — | | | | — | | | | — | | | | 89,650 | |
Goldman Sachs International(b) | | | 10,266 | | | | (10,266 | ) | | | — | | | | — | | | | — | |
Total | | $ | 266,919 | | | $ | (92,207 | ) | | $ | — | | | $ | — | | | $ | 174,712 | |
| | | | | |
| | | | | | | | | | | | | | | | | | | | |
Counterparty | | Gross amounts
of Recognized
Liabilities | | | Gross Amounts Not Offset in the
Statement of Assets and Liabilities | | | Net
Amount | |
| | | Financial
Instruments | | | Collateral Pledged | | |
| | | | Non-Cash | | | Cash | | |
Credit Suisse Securities (USA) LLC(a) | | $ | 81,941 | | | $ | (81,941 | ) | | $ | — | | | $ | — | | | $ | — | |
Goldman Sachs International(b) | | | 53,408 | | | | (10,266 | ) | | | — | | | | — | | | | 43,142 | |
Total | | $ | 135,349 | | | $ | (92,207 | ) | | $ | — | | | $ | — | | | $ | 43,142 | |
| (a) | Swap agreements — centrally cleared Counterparty. Includes cumulative appreciation (depreciation). Only current day’s variation margin receivable is reported within the Statement of Assets and Liabilities. |
| (b) | Forward foreign currency contracts Counterparty. |
NOTE 5—Security Transactions with Affiliated Funds
The Fund is permitted to purchase or sell securities from or to certain other Invesco Funds under specified conditions outlined in procedures adopted by the Board of Trustees of the Trust. The procedures have been designed to ensure that any purchase or sale of securities by the Fund from or to another fund or portfolio that is or could be considered an affiliate by virtue of having a common investment adviser (or affiliated investment advisers), common Trustees and/or common officers complies with Rule 17a-7 of the 1940 Act. Further, as defined under the procedures, each transaction is effected at the current market price. Pursuant to these procedures, for the year ended December 31, 2015, the Fund engaged in securities sales of $2,814,362, which resulted in net realized gains of $33,818.
Invesco V.I. High Yield Fund
NOTE 6—Trustees’ and Officers’ Fees and Benefits
Trustees’ and Officers’ Fees and Benefits include amounts accrued by the Fund to pay remuneration to certain Trustees and Officers of the Fund. Trustees have the option to defer compensation payable by the Fund, and Trustees’ and Officers’ Fees and Benefits also include amounts accrued by the Fund to fund such deferred compensation amounts. Those Trustees who defer compensation have the option to select various Invesco Funds in which their deferral accounts shall be deemed to be invested. Finally, certain current Trustees were eligible to participate in a retirement plan that provided for benefits to be paid upon retirement to Trustees over a period of time based on the number of years of service. The Fund may have certain former Trustees who also participate in a retirement plan and receive benefits under such plan. Trustees’ and Officers’ Fees and Benefits include amounts accrued by the Fund to fund such retirement benefits. Obligations under the deferred compensation and retirement plans represent unsecured claims against the general assets of the Fund.
NOTE 7—Cash Balances
The Fund may borrow for leveraging in an amount up to 5% of the Fund’s total assets (excluding the amount borrowed) at the time the borrowing is made. In doing so, the Fund is permitted to temporarily carry a negative or overdrawn balance in its account with State Street Bank and Trust Company, the custodian bank. Such balances, if any at period end, are shown in the Statement of Assets and Liabilities under the payable caption Amount due custodian. To compensate the custodian bank for such overdrafts, the overdrawn Fund may either (1) leave funds as a compensating balance in the account so the custodian bank can be compensated by earning the additional interest; or (2) compensate by paying the custodian bank at a rate agreed upon by the custodian bank and Invesco, not to exceed the contractually agreed upon rate. The Fund may not purchase additional securities when any borrowings from banks exceed 5% of the Fund’s total assets.
NOTE 8—Unfunded Loan Commitments
As of December 31, 2015, the Fund had unfunded loan commitments, which could be extended at the option of the borrower, pursuant to the following loan agreements with the following borrowers:
| | | | | | | | | | | | |
| Borrower | | Type | | | Principal
Amount | | | Value | |
Treehouse Foods, Inc. | | | Term Loan | | | $ | 1,920,000 | | | $ | 1,920,000 | |
NOTE 9—Distributions to Shareholders and Tax Components of Net Assets
Tax Character of Distributions to Shareholders Paid During the Fiscal Years Ended December 31, 2015 and 2014:
| | | | | | | | |
| | | 2015 | | | 2014 | |
Ordinary income | | $ | 8,002,312 | | | $ | 7,503,244 | |
Tax Components of Net Assets at Period-End:
| | | | |
| | | 2015 | |
Undistributed ordinary income | | $ | 7,126,526 | |
Net unrealized appreciation (depreciation) — investments | | | (18,077,150 | ) |
Net unrealized appreciation (depreciation) — other investments | | | (88,448 | ) |
Temporary book/tax differences | | | (79,240 | ) |
Capital loss carryforward | | | (12,726,604 | ) |
Shares of beneficial interest | | | 168,278,516 | |
Total net assets | | $ | 144,433,600 | |
The difference between book-basis and tax-basis unrealized appreciation (depreciation) is due to differences in the timing of recognition of gains and losses on investments for tax and book purposes. The Fund’s net unrealized appreciation (depreciation) difference is attributable primarily to wash sales.
The temporary book/tax differences are a result of timing differences between book and tax recognition of income and/or expenses. The Fund’s temporary book/tax differences are the result of the trustee deferral of compensation and retirement plan benefits.
Capital loss carryforward is calculated and reported as of a specific date. Results of transactions and other activity after that date may affect the amount of capital loss carryforward actually available for the Fund to utilize. Capital losses generated in years beginning after December 22, 2010 can be carried forward for an unlimited period, whereas previous losses expire in eight tax years. Capital losses with an expiration period may not be used to offset capital gains until all net capital losses without an expiration date have been utilized. Capital loss carryforwards with no expiration date will retain their character as either short-term or long-term capital losses instead of as short-term capital losses as under prior law. The ability to utilize capital loss carryforwards in the future may be limited under the Internal Revenue Code and related regulations based on the results of future transactions.
Invesco V.I. High Yield Fund
The Fund has a capital loss carryforward as of December 31, 2015, which expires as follows:
| | | | | | | | | | | | |
| Capital Loss Carryforward* | |
| Expiration | | Short-Term | | | Long-Term | | | Total | |
December 31, 2016 | | $ | 2,969,049 | | | $ | — | | | $ | 2,969,049 | |
December 31, 2017 | | | 3,028,860 | | | | — | | | | 3,028,860 | |
Not subject to expiration | | | 4,625,679 | | | | 2,103,016 | | | | 6,728,695 | |
| | | $ | 10,623,588 | | | $ | 2,103,016 | | | $ | 12,726,604 | |
| * | Capital loss carryforward as of the date listed above is reduced for limitations, if any, to the extent required by the Internal Revenue Code and may be further limited depending upon a variety of factors, including the realization of net unrealized gains or losses as of the date of any reorganization. |
NOTE 10—Investment Securities
The aggregate amount of investment securities (other than short-term securities, U.S. Treasury obligations and money market funds, if any) purchased and sold by the Fund during the year ended December 31, 2015 was $160,655,661 and $152,080,576, respectively. Cost of investments on a tax basis includes the adjustments for financial reporting purposes as of the most recently completed federal income tax reporting period-end.
| | | | |
| Unrealized Appreciation (Depreciation) of Investment Securities on a Tax Basis | |
Aggregate unrealized appreciation of investment securities | | $ | 529,002 | |
Aggregate unrealized (depreciation) of investment securities | | | (18,606,152 | ) |
Net unrealized appreciation (depreciation) of investment securities | | $ | (18,077,150 | ) |
Cost of investments for tax purposes is $161,997,231.
NOTE 11—Reclassification of Permanent Differences
Primarily as a result of differing book/tax treatment of foreign currency transactions and swap agreements, on December 31, 2015, undistributed net investment income was decreased by $291,979 and undistributed net realized gain (loss) was increased by $291,979. This reclassification had no effect on the net assets of the Fund.
NOTE 12—Share Information
| | | | | | | | | | | | | | | | |
| | | Summary of Share Activity | |
| | | Years ended December 31, | |
| | | 2015(a) | | | 2014 | |
| | | Shares | | | Amount | | | Shares | | | Amount | |
Sold: | | | | | | | | | | | | | | | | |
Series I | | | 8,771,889 | | | $ | 47,952,255 | | | | 8,876,121 | | | $ | 51,313,881 | |
Series II | | | 9,834,516 | | | | 53,843,244 | | | | 4,956,536 | | | | 28,473,807 | |
| | | | |
Issued as reinvestment of dividends: | | | | | | | | | | | | | | | | |
Series I | | | 819,963 | | | | 4,255,608 | | | | 856,422 | | | | 4,795,964 | |
Series II | | | 726,105 | | | | 3,746,705 | | | | 486,047 | | | | 2,707,280 | |
| | | | |
Reacquired: | | | | | | | | | | | | | | | | |
Series I | | | (12,114,611 | ) | | | (66,598,380 | ) | | | (9,955,032 | ) | | | (57,055,989 | ) |
Series II | | | (7,329,220 | ) | | | (40,125,064 | ) | | | (2,419,660 | ) | | | (13,604,816 | ) |
Net increase in share activity | | | 708,642 | | | $ | 3,074,368 | | | | 2,800,434 | | | $ | 16,630,127 | |
| (a) | There are entities that are record owners of more than 5% of the outstanding shares of the Fund and in the aggregate own 69% of the outstanding shares of the Fund. The Fund and the Fund’s principal underwriter or adviser, are parties to participation agreements with these entities whereby these entities sell units of interest in separate accounts funding variable products that are invested in the Fund. The Fund, Invesco and/or Invesco affiliates may make payments to these entities, which are considered to be related to the Fund, for providing services to the Fund, Invesco and/or Invesco affiliates including but not limited to services such as, securities brokerage, third party record keeping and account servicing and administrative services. The Fund has no knowledge as to whether all or any portion of the shares owned of record by these entities are also owned beneficially. |
Invesco V.I. High Yield Fund
NOTE 13—Senior Loan Participation Commitments
The Fund invests in participations, assignments, or acts as a party to the primary lending syndicate of a Senior Loan interest to corporations, partnerships, and other entities. When the Fund purchases a participation of a Senior Loan interest, the Fund typically enters into a contractual agreement with the lender or other third party selling the participation, but not with the borrower directly. As such, the Fund assumes the credit risk of the borrower, selling participant or other persons interpositioned between the Fund and the borrower.
At the year ended December 31, 2015, the following sets forth the selling participants with respect to interest in Senior Loans purchased by the Fund on a participation basis.
| | | | | | | | |
| Selling Participant | | Principal
Amount | | | Value | |
Bank of America, N.A. | | $ | 1,920,000 | | | $ | 1,920,000 | |
NOTE 14—Financial Highlights
The following schedule presents financial highlights for a share of the Fund outstanding throughout the periods indicated.
| | | | | | | | | | | | | | | | | | | | | | | | | | | | | | | | | | | | | | | | | | | | | | | | |
| | | Net asset
value,
beginning
of period | | | Net
investment
income(a) | | | Net gains
(losses)
on securities
(both
realized and
unrealized) | | | Total from
investment
operations | | | Dividends
from net
investment
income | | | Net asset
value, end
of period | | | Total
return(b) | | | Net assets,
end of period
(000’s omitted) | | | Ratio of
expenses
to average
net assets
with fee waivers
and/or expenses
absorbed | | | Ratio of
expenses
to average net
assets without
fee waivers
and/or expenses
absorbed | | | Ratio of net
investment
income
to average
net assets | | | Portfolio
turnover(c) | |
Series I | | | | | | | | | | | | | | | | | | | | | | | | | | | | | | | | | | | | | | | | | | | | | | | | |
Year ended 12/31/15 | | $ | 5.53 | | | $ | 0.29 | | | $ | (0.46 | ) | | $ | (0.17 | ) | | $ | (0.30 | ) | | $ | 5.06 | | | | (3.17 | )% | | $ | 73,594 | | | | 1.03 | %(d) | | | 1.03 | %(d) | | | 5.23 | %(d) | | | 99 | % |
Year ended 12/31/14 | | | 5.70 | | | | 0.29 | | | | (0.19 | ) | | | 0.10 | | | | (0.27 | ) | | | 5.53 | | | | 1.73 | | | | 94,345 | | | | 0.92 | | | | 0.98 | | | | 5.11 | | | | 103 | |
Year ended 12/31/13 | | | 5.61 | | | | 0.33 | | | | 0.05 | | | | 0.38 | | | | (0.29 | ) | | | 5.70 | | | | 7.01 | | | | 98,455 | | | | 0.81 | | | | 1.03 | | | | 5.79 | | | | 74 | |
Year ended 12/31/12 | | | 5.04 | | | | 0.33 | | | | 0.53 | | | | 0.86 | | | | (0.29 | ) | | | 5.61 | | | | 17.17 | | | | 93,529 | | | | 0.79 | | | | 1.04 | | | | 6.10 | | | | 58 | |
Year ended 12/31/11 | | | 5.35 | | | | 0.35 | | | | (0.29 | ) | | | 0.06 | | | | (0.37 | ) | | | 5.04 | | | | 0.96 | | | | 106,557 | | | | 0.83 | | | | 1.06 | | | | 6.84 | | | | 71 | |
Series II | | | | | | | | | | | | | | | | | | | | | | | | | | | | | | | | | | | | | | | | | | | | | | | | |
Year ended 12/31/15 | | | 5.50 | | | | 0.27 | | | | (0.45 | ) | | | (0.18 | ) | | | (0.29 | ) | | | 5.03 | | | | (3.37 | ) | | | 70,840 | | | | 1.28 | (d) | | | 1.28 | (d) | | | 4.98 | (d) | | | 99 | |
Year ended 12/31/14 | | | 5.67 | | | | 0.28 | | | | (0.19 | ) | | | 0.09 | | | | (0.26 | ) | | | 5.50 | | | | 1.59 | | | | 59,683 | | | | 1.17 | | | | 1.23 | | | | 4.86 | | | | 103 | |
Year ended 12/31/13 | | | 5.59 | | | | 0.32 | | | | 0.05 | | | | 0.37 | | | | (0.29 | ) | | | 5.67 | | | | 6.76 | | | | 44,416 | | | | 1.06 | | | | 1.28 | | | | 5.54 | | | | 74 | |
Year ended 12/31/12 | | | 5.03 | | | | 0.32 | | | | 0.52 | | | | 0.84 | | | | (0.28 | ) | | | 5.59 | | | | 16.96 | | | | 21,004 | | | | 1.04 | | | | 1.29 | | | | 5.85 | | | | 58 | |
Year ended 12/31/11 | | | 5.35 | | | | 0.33 | | | | (0.29 | ) | | | 0.04 | | | | (0.36 | ) | | | 5.03 | | | | 0.61 | | | | 5,363 | | | | 1.08 | | | | 1.31 | | | | 6.59 | | | | 71 | |
| (a) | Calculated using average shares outstanding. |
| (b) | Includes adjustments in accordance with accounting principles generally accepted in the United States of America and as such, the net asset value for financial reporting purposes and the returns based upon those net asset values may differ from the net asset value and returns for shareholder transactions. Total returns are not annualized for periods less than one year, if applicable, and do not reflect charges assessed in connection with a variable product, which if included would reduce total returns. |
| (c) | Portfolio turnover is calculated at the fund level and is not annualized for periods less than one year, if applicable. For the period ended December 31, 2013, the portfolio turnover calculation excludes the value of securities purchased of $32,385,318 and sold of $10,521,731 in the effort to realign the Fund’s portfolio holdings after the reorganization of Invesco V.I. High Yield Securities Fund into the Fund. For the period ending December 31, 2011, the portfolio turnover calculation excludes the value of securities purchased of $30,901,742 and sold of $8,109,618 in the effort to realign the Fund’s portfolio holdings after the reorganization of Invesco Van Kampen V.I. High Yield Fund into the Fund. |
| (d) | Ratios are based on average daily net assets (000’s omitted) of $88,862 and $69,824 for Series I and Series II shares, respectively. |
Invesco V.I. High Yield Fund
Report of Independent Registered Public Accounting Firm
To the Board of Trustees of AIM Variable Insurance Funds (Invesco Variable Insurance Funds)
and Shareholders of Invesco V.I. High Yield Fund:
In our opinion, the accompanying statement of assets and liabilities, including the schedule of investments, and the related statements of operations and of changes in net assets and the financial highlights present fairly, in all material respects, the financial position of Invesco V.I. High Yield Fund (one of the funds constituting AIM Variable Insurance Funds (Invesco Variable Insurance Funds), hereafter referred to as the “Fund”) at December 31, 2015, the results of its operations for the year then ended, the changes in its net assets for each of the two years in the period then ended and the financial highlights for each of the five years in the period then ended, in conformity with accounting principles generally accepted in the United States of America. These financial statements and financial highlights (hereafter referred to as “financial statements”) are the responsibility of the Fund’s management. Our responsibility is to express an opinion on these financial statements based on our audits. We conducted our audits of these financial statements in accordance with the standards of the Public Company Accounting Oversight Board (United States). Those standards require that we plan and perform the audit to obtain reasonable assurance about whether the financial statements are free of material misstatement. An audit includes examining, on a test basis, evidence supporting the amounts and disclosures in the financial statements, assessing the accounting principles used and significant estimates made by management, and evaluating the overall financial statement presentation. We believe that our audits, which included confirmation of securities at December 31, 2015 by correspondence with the custodian and brokers, and the application of alternative procedures where confirmation of security purchases have not been received, provide a reasonable basis for our opinion.
PRICEWATERHOUSECOOPERS LLP
Houston, Texas
February 15, 2016
Invesco V.I. High Yield Fund
Calculating your ongoing Fund expenses
Example
As a shareholder of the Fund, you incur ongoing costs, including management fees; distribution and/or service fees (12b-1); and other Fund expenses. This example is intended to help you understand your ongoing costs (in dollars) of investing in the Fund and to compare these costs with ongoing costs of investing in other mutual funds. The example is based on an investment of $1,000 invested at the beginning of the period and held for the entire period July 1, 2015 through December 31, 2015.
The actual and hypothetical expenses in the examples below do not represent the effect of any fees or other expenses assessed in connection with a variable product; if they did, the expenses shown would be higher while the ending account values shown would be lower.
Actual expenses
The table below provides information about actual account values and actual expenses. You may use the information in this table, together with the amount you invested, to estimate the expenses that you paid over the period. Simply divide your account value by $1,000 (for example, an $8,600 account value divided by $1,000 = 8.6), then multiply the result by the number in the table under the heading entitled “Actual Expenses Paid During Period” to estimate the expenses you paid on your account during this period.
Hypothetical example for comparison purposes
The table below also provides information about hypothetical account values and hypothetical expenses based on the Fund’s actual expense ratio and an assumed rate of return of 5% per year before expenses, which is not the Fund’s actual return.
The hypothetical account values and expenses may not be used to estimate the actual ending account balance or expenses you paid for the period. You may use this information to compare the ongoing costs of investing in the Fund and other funds. To do so, compare this 5% hypothetical example with the 5% hypothetical examples that appear in the shareholder reports of the other funds.
Please note that the expenses shown in the table are meant to highlight your ongoing costs. Therefore, the hypothetical information is useful in comparing ongoing costs, and will not help you determine the relative total costs of owning different funds.
| | | | | | | | | | | | | | | | | | | | | | | | |
| Class | | Beginning Account Value (07/01/15) | | | ACTUAL | | | HYPOTHETICAL (5% annual return before expenses) | | | Annualized Expense
Ratio | |
| | | Ending Account Value (12/31/15)1 | | | Expenses Paid During Period2 | | | Ending Account Value (12/31/15) | | | Expenses Paid During Period2 | | |
| Series I | | $ | 1,000.00 | | | $ | 944.40 | | | $ | 4.90 | | | $ | 1,020.16 | | | $ | 5.09 | | | | 1.00 | % |
| Series II | | | 1,000.00 | | | | 944.00 | | | | 6.12 | | | | 1,018.90 | | | | 6.36 | | | | 1.25 | |
| 1 | The actual ending account value is based on the actual total return of the Fund for the period July 1, 2015 through December 31, 2015, after actual expenses and will differ from the hypothetical ending account value which is based on the Fund’s expense ratio and a hypothetical annual return of 5% before expenses. |
| 2 | Expenses are equal to the Fund’s annualized expense ratio as indicated above multiplied by the average account value over the period, multiplied by 184/365 to reflect the most recent fiscal half year. |
Invesco V.I. High Yield Fund
Tax Information
Form 1099-DIV, Form 1042-S and other year–end tax information provide shareholders with actual calendar year amounts that should be included in their tax returns. Shareholders should consult their tax advisors.
The following distribution information is being provided as required by the Internal Revenue Code or to meet a specific state’s requirement.
The Fund designates the following amounts or, if subsequently determined to be different, the maximum amount allowable for its fiscal year ended December 31, 2015:
| | | | |
Federal and State Income Tax | |
Corporate Dividends Received Deduction* | | | 0.92 | % |
U.S. Treasury Obligations* | | | 0.01 | % |
| | * | The above percentages are based on ordinary income dividends paid to shareholders during the Fund’s fiscal year. |
Invesco V.I. High Yield Fund
Trustees and Officers
The address of each trustee and officer is AIM Variable Insurance Funds (Invesco Variable Insurance Funds) (the “Trust”), 11 Greenway Plaza, Suite 1000, Houston, Texas 77046-1173. The trustees serve for the life of the Trust, subject to their earlier death, incapacitation, resignation, retirement or removal as more specifically provided in the Trust’s organizational documents. Each officer serves for a one year term or until their successors are elected and qualified. Column two below includes length of time served with predecessor entities, if any.
| | | | | | | | |
Name, Year of Birth and
Position(s) Held with the Trust | | Trustee and/
or Officer Since | | Principal Occupation(s)
During Past 5 Years | | Number of Funds in Fund Complex Overseen by Trustee | | Other Directorship(s) Held by Trustee During Past 5 Years |
| Interested Persons | | | | | | | | |
| Martin L. Flanagan1 — 1960 Trustee | | 2007 | | Executive Director, Chief Executive Officer and President, Invesco Ltd. (ultimate parent of Invesco and a global investment management firm); Advisor to the Board, Invesco Advisers, Inc. (formerly known as Invesco Institutional (N.A.), Inc.); Trustee, The Invesco Funds; Vice Chair, Investment Company Institute; and Member of Executive Board, SMU Cox School of Business Formerly: Chairman and Chief Executive Officer, Invesco Advisers, Inc. (registered investment adviser); Director, Chairman, Chief Executive Officer and President, IVZ Inc. (holding company), INVESCO Group Services, Inc. (service provider) and Invesco North American Holdings, Inc. (holding company); Director, Chief Executive Officer and President, Invesco Holding Company Limited (parent of Invesco and a global investment management firm); Director, Invesco Ltd.; Chairman, Investment Company Institute and President, Co-Chief Executive Officer, Co-President, Chief Operating Officer and Chief Financial Officer, Franklin Resources, Inc. (global investment management organization) | | 146 | | None |
Philip A. Taylor2 — 1954 Trustee, President and Principal Executive Officer | | 2006 | | Head of North American Retail and Senior Managing Director, Invesco Ltd.; Director, Co-Chairman, Co-President and Co-Chief Executive Officer, Invesco Advisers, Inc. (formerly known as Invesco Institutional (N.A.), Inc.) (registered investment adviser); Director, Chairman, Chief Executive Officer and President, Invesco Management Group, Inc. (formerly known as Invesco Aim Management Group, Inc.) (financial services holding company); Director and Chairman, Invesco Investment Services, Inc. (formerly known as Invesco Aim Investment Services, Inc.) (registered transfer agent) Chief Executive Officer, Invesco Corporate Class Inc. (corporate mutual fund company) Director, Chairman and Chief Executive Officer, Invesco Canada Ltd. (formerly known as Invesco Trimark Ltd./Invesco Trimark Ltèe) (registered investment adviser and registered transfer agent); Trustee, President and Principal Executive Officer, The Invesco Funds (other than AIM Treasurer’s Series Trust (Invesco Treasurer’s Series Trust), Short-Term Investments Trust and Invesco Management Trust); Trustee and Executive Vice President, The Invesco Funds (AIM Treasurer’s Series Trust (Invesco Treasurer’s Series Trust), Short-Term Investments Trust and Invesco Management Trust only); Director, Invesco Investment Advisers LLC (formerly known as Van Kampen Asset Management); Director, Chief Executive Officer and President, Van Kampen Exchange Corp. Formerly: Director and President, INVESCO Funds Group, Inc. (registered investment adviser and registered transfer agent); Director and Chairman, IVZ Distributors, Inc. (formerly known as INVESCO Distributors, Inc.) (registered broker dealer); Director, President and Chairman, Invesco Inc. (holding company), Invesco Canada Holdings Inc. (holding company), Trimark Investments Ltd./Placements Trimark Ltèe and Invesco Financial Services Ltd/Services Financiers Invesco Ltèe; Chief Executive Officer, Invesco Canada Fund Inc (corporate mutual fund company); Director and Chairman, Van Kampen Investor Services Inc.; Director, Chief Executive Officer and President, 1371 Preferred Inc. (holding company) and Van Kampen Investments Inc.; Director and President, AIM GP Canada Inc. (general partner for limited partnerships) and Van Kampen Advisors, Inc.; Director and Chief Executive Officer, Invesco Trimark Dealer Inc. (registered broker dealer); Director, Invesco Distributors, Inc. (formerly known as Invesco Aim Distributors, Inc.) (registered broker dealer); Manager, Invesco PowerShares Capital Management LLC; Director, Chief Executive Officer and President, Invesco Advisers, Inc.; Director, Chairman, Chief Executive Officer and President, Invesco Aim Capital Management, Inc.; President, Invesco Trimark Dealer Inc. and Invesco Trimark Ltd./Invesco Trimark Ltèe; Director and President, AIM Trimark Corporate Class Inc. and AIM Trimark Canada Fund Inc.; Senior Managing Director, Invesco Holding Company Limited; Director and Chairman, Fund Management Company (former registered broker dealer); President and Principal Executive Officer, The Invesco Funds (AIM Treasurer’s Series Trust (Invesco Treasurer’s Series Trust), and Short-Term Investments Trust only); President, AIM Trimark Global Fund Inc. and AIM Trimark Canada Fund Inc | | 146 | | None |
| 1 | Mr. Flanagan is considered an interested person (within the meaning of Section 2(a)(19) of the 1940 Act) of the Trust because he is an officer of the Adviser to the Trust, and an officer and a director of Invesco Ltd., ultimate parent of the Adviser. |
| 2 | Mr. Taylor is considered an interested person (within the meaning of Section 2(a)(19) of the 1940 Act) of the Trust because he is an officer and a director of the Adviser. |
Invesco V.I. High Yield Fund
Trustees and Officers—(continued)
| | | | | | | | |
Name, Year of Birth and
Position(s) Held with the Trust | | Trustee and/
or Officer Since | | Principal Occupation(s)
During Past 5 Years | | Number of Funds in Fund Complex Overseen by Trustee | | Other Directorship(s)
Held by Trustee During Past 5 Years |
| Independent Trustees | | | | | | | | |
Bruce L. Crockett — 1944 Trustee and Chair | | 2003 | | Chairman, Crockett Technologies Associates (technology consulting company) Formerly: Director, Captaris (unified messaging provider); Director, President and Chief Executive Officer, COMSAT Corporation; Chairman, Board of Governors of INTELSAT (international communications company); ACE Limited (insurance company); Independent Directors Council and Investment Company Institute | | 146 | | ALPS (Attorneys Liability Protection Society) (insurance company) and Globe Specialty Metals, Inc. (metallurgical company) |
David C. Arch — 1945 Trustee | | 2010 | | Chairman of Blistex Inc., a consumer health care products manufacturer | | 146 | | Board member of the Illinois Manufacturers’ Association; Member of the Board of Visitors, Institute for the Humanities, University of Michigan |
James T. Bunch — 1942 Trustee | | 2000 | | Managing Member, Grumman Hill Group LLC (family office/private equity investments) Formerly: Chairman of the Board of Trustees, Evans Scholars Foundation and Chairman, Board of Governors, Western Golf Association | | 146 | | Trustee, Evans Scholars Foundation; and Chairman of the Board, Denver Film Society |
Albert R. Dowden — 1941 Trustee | | 2003 | | Director of a number of public and private business corporations, including the Boss Group, Ltd. (private investment and management); Nature’s Sunshine Products, Inc. and Reich & Tang Funds (5 portfolios) (registered investment company) Formerly: Director, Homeowners of America Holding Corporation/Homeowners of America Insurance Company (property casualty company); Director, Continental Energy Services, LLC (oil and gas pipeline service); Director, CompuDyne Corporation (provider of product and services to the public security market) and Director, Annuity and Life Re (Holdings), Ltd. (reinsurance company); Director, President and Chief Executive Officer, Volvo Group North America, Inc.; Senior Vice President, AB Volvo; Director of various public and private corporations; Chairman, DHJ Media, Inc.; Director, Magellan Insurance Company; and Director, The Hertz Corporation, Genmar Corporation (boat manufacturer), National Media Corporation; Advisory Board of Rotary Power International (designer, manufacturer, and seller of rotary power engines); and Chairman, Cortland Trust, Inc. (registered investment company) | | 146 | | Director of: Nature’s Sunshine Products, Inc., Reich & Tang Funds, Homeowners of America Holding Corporation/ Homeowners of America Insurance Company, the Boss Group |
Jack M. Fields — 1952 Trustee | | 2003 | | Chief Executive Officer, Twenty First Century Group, Inc. (government affairs company); Owner and Chief Executive Officer, Dos Angeles Ranch, L.P. (cattle, hunting, corporate entertainment); and Discovery Global Education Fund (non-profit) Formerly: Chief Executive Officer, Texana Timber LP (sustainable forestry company); Director of Cross Timbers Quail Research Ranch (non-profit); and member of the U.S. House of Representatives | | 146 | | Insperity, Inc. (formerly known as Administaff) |
Eli Jones — Trustee | | 2016 | | Professor and Dean, Mays Business School, Texas A&M University Formerly: Professor and Dean, Walton College of Business, University of Arkansas, and E.J. Ourso College of Business, Louisiana State University | | 146 | | Director, Insperity, Inc., (2011-present) and ARVEST Bank (2012-2015) |
Prema Mathai-Davis — 1950 Trustee | | 2003 | | Retired. Formerly: Chief Executive Officer, YWCA of the U.S.A. | | 146 | | None |
Larry Soll — 1942 Trustee | | 1997 | | Retired. Formerly: Chairman, Chief Executive Officer and President, Synergen Corp. (a biotechnology company) | | 146 | | None |
Robert C. Troccoli — Trustee | | 2016 | | Retired. Formerly: Senior Partner, KPMG LLP | | 146 | | None |
Raymond Stickel, Jr. — 1944 Trustee | | 2005 | | Retired. Formerly: Director, Mainstay VP Series Funds, Inc. (25 portfolios) and Partner, Deloitte & Touche | | 146 | | None |
Suzanne H. Woolsey — 1941 Trustee | | 2014 | | Chief Executive Officer of Woolsey Partners LLC | | 146 | | Emeritus Chair of the Board of Trustees of the Institute for Defense Analyses; Trustee of Colorado College; Trustee of California Institute of Technology; Prior to 2014, Director of Fluor Corp.; Prior to 2010, Trustee of the German Marshall Fund of the United States; Prior to 2010 Trustee of the Rocky Mountain Institute |
Invesco V.I. High Yield Fund
Trustees and Officers—(continued)
| | | | | | | | |
Name, Year of Birth and
Position(s) Held with the Trust | | Trustee and/
or Officer Since | | Principal Occupation(s)
During Past 5 Years | | Number of Funds in Fund Complex Overseen by Trustee | | Other Directorship(s)
Held by Trustee During Past 5 Years |
| Other Officers | | | | | | | | |
Russell C. Burk — 1958 Senior Vice President and Senior Officer | | 2005 | | Senior Vice President and Senior Officer, The Invesco Funds | | N/A | | N/A |
John M. Zerr — 1962 Senior Vice President, Chief Legal Officer and Secretary | | 2006 | | Director, Senior Vice President, Secretary and General Counsel, Invesco Management Group, Inc. (formerly known as Invesco Aim Management Group, Inc.) and Van Kampen Exchange Corp.; Senior Vice President, Invesco Advisers, Inc. (formerly known as Invesco Institutional (N.A.), Inc.) (registered investment adviser); Senior Vice President and Secretary, Invesco Distributors, Inc. (formerly known as Invesco Aim Distributors, Inc.); Director, Vice President and Secretary, Invesco Investment Services, Inc. (formerly known as Invesco Aim Investment Services, Inc.); Senior Vice President, Chief Legal Officer and Secretary, The Invesco Funds; Managing Director, Invesco PowerShares Capital Management LLC; Director, Secretary and General Counsel, Invesco Investment Advisers LLC (formerly known as Van Kampen Asset Management); Secretary and General Counsel, Invesco Capital Markets, Inc. (formerly known as Van Kampen Funds Inc.) and Chief Legal Officer, PowerShares Exchange-Traded Fund Trust, PowerShares Exchange-Traded Fund Trust II, PowerShares India Exchange-Traded Fund Trust, PowerShares Actively Managed Exchange-Traded Fund Trust, and PowerShares Actively Managed Exchange-Traded Commodity Fund Trust Formerly: Director, Vice President and Secretary, IVZ Distributors, Inc. (formerly known as INVESCO distributors, Inc.); Director and Vice President, INVESCO Funds Group, Inc.; Director and Vice President, Van Kampen Advisors Inc.; Director, Vice President, Secretary and General Counsel, Van Kampen Investor Services Inc.; Director, Invesco Distributors, Inc. (formerly known as Invesco Aim Distributors, Inc.); Director, Senior Vice President, General Counsel and Secretary, Invesco Aim Advisers, Inc. and Van Kampen Investments Inc.; Director, Vice President and Secretary, Fund Management Company; Director, Senior Vice President, Secretary, General Counsel and Vice President, Invesco Aim Capital Management, Inc.; Chief Operating Officer and General Counsel, Liberty Ridge Capital, Inc. (an investment adviser); Vice President and Secretary, PBHG Funds (an investment company) and PBHG Insurance Series Fund (an investment company); Chief Operating Officer, General Counsel and Secretary, Old Mutual Investment Partners (a broker-dealer); General Counsel and Secretary, Old Mutual Fund Services (an administrator) and Old Mutual Shareholder Services (a shareholder servicing center); Executive Vice President, General Counsel and Secretary, Old Mutual Capital, Inc. (an investment adviser); and Vice President and Secretary, Old Mutual Advisors Funds (an investment company) | | N/A | | N/A |
Sheri Morris — 1964 Vice President, Treasurer and Principal Financial Officer | | 2003 | | Vice President, Treasurer and Principal Financial Officer, The Invesco Funds; Vice President, Invesco Advisers, Inc. (formerly known as Invesco Institutional (N.A.), Inc.) (registered investment adviser); and Vice President, PowerShares Exchange-Traded Fund Trust, PowerShares Exchange-Traded Fund Trust II, PowerShares India Exchange-Traded Fund Trust, PowerShares Actively Managed Exchange-Traded Fund Trust, and PowerShares Actively Managed Exchange-Traded Commodity Fund Trust Formerly: Vice President, Invesco Aim Advisers, Inc., Invesco Aim Capital Management, Inc. and Invesco Aim Private Asset Management, Inc.; Assistant Vice President and Assistant Treasurer, The Invesco Funds and Assistant Vice President, Invesco Advisers, Inc., Invesco Aim Capital Management, Inc. and Invesco Aim Private Asset Management, Inc.; and Treasurer, PowerShares Exchange-Traded Fund Trust, PowerShares Exchange-Traded Fund Trust II, PowerShares India Exchange-Traded Fund Trust and PowerShares Actively Managed Exchange-Traded Fund Trust | | N/A | | N/A |
Invesco V.I. High Yield Fund
Trustees and Officers—(continued)
| | | | | | | | |
Name, Year of Birth and
Position(s) Held with the Trust | | Trustee and/
or Officer Since | | Principal Occupation(s)
During Past 5 Years | | Number of Funds in Fund Complex Overseen by Trustee | | Other Directorship(s)
Held by Trustee During Past 5 Years |
| Other Officers—(continued) | | | | | | | | |
Karen Dunn Kelley — 1960 Vice President | | 2003 | | Senior Managing Director, Investments, Invesco Ltd.; Director, Co-President, Co-Chief Executive Officer, and Co-Chairman, Invesco Advisers, Inc. (formerly known as Invesco Institutional (N.A.), Inc.) (registered investment adviser); Chairman, Invesco Senior Secured Management, Inc.; Senior Vice President, Invesco Management Group, Inc. (formerly known as Invesco Aim Management Group, Inc.); Executive Vice President, Invesco Distributors, Inc. (formerly known as Invesco Aim Distributors, Inc.); Director, Invesco Mortgage Capital Inc. and Invesco Management Company Limited; Vice President, The Invesco Funds (other than AIM Treasurer’s Series Trust (Invesco Treasurer’s Series Trust), Short-Term Investments Trust and Invesco Management Trust); and President and Principal Executive Officer, The Invesco Funds (AIM Treasurer’s Series Trust (Invesco Treasurer’s Series Trust), Short-Term Investments Trust and Invesco Management Trust only) Formerly: Director and President, INVESCO Asset Management (Bermuda) Ltd., Director, INVESCO Global Asset Management Limited and INVESCO Management S.A.; Senior Vice President, Van Kampen Investments Inc. and Invesco Advisers, Inc. (formerly known as Invesco Institutional (N.A.), Inc.) (registered investment adviser); Vice President, Invesco Advisers, Inc. (formerly known as Invesco Institutional (N.A.), Inc.); Director of Cash Management and Senior Vice President, Invesco Advisers, Inc. and Invesco Aim Capital Management, Inc.; Director and President, Fund Management Company; Chief Cash Management Officer, Director of Cash Management, Senior Vice President, and Managing Director, Invesco Aim Capital Management, Inc.; Director of Cash Management, Senior Vice President, and Vice President, Invesco Advisers, Inc. and The Invesco Funds (AIM Treasurer’s Series Trust (Invesco Treasurer’s Series Trust), and Short-Term Investments Trust only) | | N/A | | N/A |
Crissie M. Wisdom — 1969 Anti-Money Laundering Compliance Officer | | 2013 | | Anti-Money Laundering Compliance Officer, Invesco Advisers, Inc. (formerly known as Invesco Institutional (N.A.), Inc.) (registered investment adviser), Invesco Capital Markets, Inc. (formerly known as Van Kampen Funds Inc.), Invesco Distributors, Inc., Invesco Investment Services, Inc., Invesco Management Group, Inc., Van Kampen Exchange Corp., The Invesco Funds, and PowerShares Exchange-Traded Fund Trust, PowerShares Exchange-Traded Fund Trust II, PowerShares India Exchange-Traded Fund Trust, PowerShares Actively Managed Exchange-Traded Fund Trust and PowerShares Actively Managed Exchange-Traded Commodity Fund Trust; Anti-Money Laundering Compliance Officer and Bank Secrecy Act Officer, INVESCO National Trust Company and Invesco Trust Company; and Fraud Prevention Manager and Controls and Risk Analysis Manager for Invesco Investment Services, Inc. | | N/A | | N/A |
Lisa O. Brinkley — 1959 Chief Compliance Officer | | 2015 | | Senior Vice President and Chief Compliance Officer, Invesco Advisers, Inc. (registered investment adviser) (formerly known as Invesco Institutional (N.A., Inc.); and Chief Compliance Officer, The Invesco Funds Formerly: Global Assurance Officer, Invesco Ltd. and Vice President, The Invesco Funds; Chief Compliance Officer, Invesco Distributors, Inc. (formerly known as Invesco Aim Distributors, Inc.), Invesco Investment Services, Inc.(formerly known as Invesco Aim Investment Services, Inc.) and Van Kampen Investor Services Inc.; Senior Vice President, Invesco Management Group, Inc.; Senior Vice President and Chief Compliance Officer, Invesco Advisers, Inc. and The Invesco Funds; Vice President and Chief Compliance Officer, Invesco Aim Capital Management, Inc. and Invesco Distributors, Inc.; Vice President, Invesco Investment Services, Inc. and Fund Management Company | | N/A | | N/A |
The Statement of Additional Information of the Trust includes additional information about the Fund’s Trustees and is available upon request, without charge, by calling 1.800.959.4246. Please refer to the Fund’s prospectus for information on the Fund’s sub-advisers.
| | | | | | |
Office of the Fund 11 Greenway Plaza, Suite 1000 Houston, TX 77046-1173 | | Investment Adviser Invesco Advisers, Inc. 1555 Peachtree Street, N.E. Atlanta, GA 30309 | | Distributor Invesco Distributors, Inc. 11 Greenway Plaza, Suite 1000 Houston, TX 77046-1173 | | Auditors PricewaterhouseCoopers LLP 1000 Louisiana Street, Suite 5800 Houston, TX 77002-5678 |
| | | |
| | | | | | |
Counsel to the Fund Stradley Ronon Stevens & Young, LLP 2005 Market Street, Suite 2600 Philadelphia, PA 19103-7018 | | Counsel to the Independent Trustees Goodwin Procter LLP 901 New York Avenue, N.W. Washington, D.C. 20001 | | Transfer Agent Invesco Investment Services, Inc. 11 Greenway Plaza, Suite 1000 Houston, TX 77046-1173 | | Custodian State Street Bank and Trust Company 225 Franklin Street Boston, MA 02110-2801 |
Invesco V.I. High Yield Fund
| | | | |
| | |

| | Annual Report to Shareholders | | December 31, 2015 |
| | |
| | Invesco V.I. International Growth Fund |

| | |
| | The Fund provides a complete list of its holdings four times in each fiscal year, at the quarter-ends. For the second and fourth quarters, the lists appear in the Fund’s semiannual and annual reports to shareholders. For the first and third quarters, the Fund files the lists with the Securities and Exchange Commission (SEC) on Form N-Q. The Fund’s Form N-Q filings are available on the SEC website, sec.gov. Copies of the Fund’s Forms N-Q may be reviewed and copied at the SEC Public Reference Room in Washington, D.C. You can obtain information on the operation of the Public Reference Room, including information about duplicating fee charges, by calling 202 551 8090 or 800 732 0330, or by electronic request at the following email address: publicinfo@sec.gov. The SEC file numbers for the Fund are 811-07452 and 033-57340. The Fund’s most recent portfolio holdings, as filed on Form N-Q, have also been made available to insurance companies issuing variable annuity contracts and variable life insurance policies (“variable products”) that invest in the Fund. A description of the policies and procedures that the Fund uses to determine how to vote proxies relating to portfolio securities is available without charge, upon request, from our Client Services department at 800 959 4246 or at invesco.com/proxyguidelines. The information is also available on the SEC website, sec.gov. Information regarding how the Fund voted proxies related to its portfolio securities during the most recent 12-month period ended June 30 is available at invesco.com/proxysearch. The information is also available on the SEC website, sec.gov. Invesco Advisers, Inc. is an investment adviser; it provides investment advisory services to individual and institutional clients and does not sell securities. Invesco Distributors, Inc. is the US distributor for Invesco Ltd.’s retail mutual funds, exchange-traded funds and institutional money market funds. Both are wholly owned, indirect subsidiaries of Invesco Ltd. This report must be accompanied or preceded by a currently effective Fund prospectus and variable product prospectus, which contain more complete information, including sales charges and expenses. Investors should read each carefully before investing. Invesco Distributors, Inc. VIIGR-AR-1 NOT FDIC INSURED | MAY LOSE VALUE | NO BANK GUARANTEE |
Management’s Discussion of Fund Performance
Performance summary
For the year ended December 31, 2015, Series I shares of Invesco V.I. International Growth Fund (the Fund), underperformed the Custom Invesco International Growth Index, the Fund’s style-specific benchmark.
Your Fund’s long-term performance appears later in this report.
Fund vs. Indexes
Total returns, 12/31/14 to 12/31/15, excluding variable product issuer charges.
If variable product issuer charges were included, returns would be lower.
| | | | | |
| Series I Shares | | | | -2.34 | % |
| Series II Shares | | | | -2.61 | |
| MSCI All Country World ex-U.S. Index▼ (Broad Market Index)* | | | | -5.66 | |
| MSCI EAFE Index▼ (Former Broad Market Index)* | | | | -0.81 | |
| Custom Invesco International Growth Indexn (Style-Specific Index) | | | | -1.25 | |
| Lipper VUF International Large-Cap Growth Funds Index¿ (Peer Group Index) | | | | -0.69 | |
Source(s): ▼FactSet Research Systems Inc.; nInvesco, FactSet Research Systems Inc.; ¿Lipper Inc.
| * | The Fund has elected to use the MSCI All Country World ex-U.S. Index as its broad market benchmark rather than the MSCI EAFE Index because the MSCI All Country World ex-U.S. Index more closely reflects the performance of the types of securities in which the Fund invests. |
Market conditions and your Fund
Global equity markets faced significant headwinds during the year ended December 31, 2015. Developed markets were generally able to better withstand these headwinds than more fragile emerging markets, many of which faltered.
As the year began, the view that the US Federal Reserve (the Fed) would begin raising rates while other central banks were loosening monetary policy led the US dollar to strengthen against many currencies. At the same time, oil prices continued to decline as increased supply outstripped demand. This had the effect of hurting commodity- and materials-based economies – and companies in related sectors. A colder-than-expected winter in the US and concerns about a possible Greek exit from the eurozone contributed to market uncertainty. During the summer of 2015, China’s surprise devaluation of the renminbi and a significant downturn in its financial markets triggered a massive sell-off in global equity markets, particularly in already-vulnerable
emerging markets. In the fall, markets around the world began to regain their footing, but the impact of a late-year crash in oil prices offset these gains.
The global economy continued to expand, albeit slowly, during 2015. However, that growth became increasingly uneven across developed and emerging economies. Central bank policies also began to diverge as the Fed followed through on its commitment to normalize monetary policy by raising interest rates – even as the European Central Bank extended its asset purchase program and Japan introduced additional quantitative easing. While European equity markets were fairly resilient, or flat, for the year, many emerging markets – particularly China, Brazil and Russia – struggled and ended the year down significantly.
In this environment, we continued to construct the Fund’s portfolio with a bottom-up approach, selecting stocks on an individual basis. During the reporting period, Fund holdings in the information technology, materials and consumer
discretionary sectors outperformed those of the Fund’s style-specific benchmark and were among the strongest contributors to the Fund’s relative performance. An underweight allocation to the weak-performing materials sector was supportive from a relative perspective versus the Fund’s style-specific benchmark. The Fund’s holdings in the energy, financials and industrials sectors, however, underperformed those of the Fund’s style-specific benchmark and were the most significant detractors from the Fund’s relative performance.
On a geographic basis, the Fund’s holdings in Germany and Singapore outperformed those of the Fund’s style-specific benchmark and were among the most significant contributors to Fund performance during the reporting period. Overweight exposure to the UK was supportive from a relative basis as well. The Fund’s holdings in China, Brazil, France and Thailand, however, underperformed those of the Fund’s style-specific benchmark and were among the most significant detractors from relative results. The Fund’s holdings in Japan delivered double-digit gains, outperforming the Fund’s style-specific benchmark. However, a meaningful underweight exposure to Japan relative to the Fund’s style-specific benchmark dragged on Fund performance.
From an individual securities perspective, Sky was one of the most significant contributors to Fund performance during the year. Sky, a British-based, pan-European broadcasting company, reported solid results with revenues and margins beating consensus expectations. The company’s strong management team executed the company’s business plan well and the company’s cost discipline was clearly evident in its latest results. We believe the stock remained attractively valued given potential for good growth over the next three to five years.
| | | | | |
| Portfolio Composition |
| By sector | | | | % of total net assets | |
| | | | | |
| |
| Consumer Discretionary | | | | 23.9 | % |
| Financials | | | | 17.6 | |
| Information Technology | | | | 16.1 | |
| Consumer Staples | | | | 11.5 | |
| Health Care | | | | 9.9 | |
| Industrials | | | | 9.2 | |
| Materials | | | | 3.6 | |
| Energy | | | | 3.5 | |
| Money Market Funds | | | | | |
| Plus Other Assets Less Liabilities | | | | 4.7 | |
| | | | | | | |
| Top 10 Equity Holdings* |
| | % of total net assets |
| | | | | | | |
| | |
| 1. | | Sky PLC | | | | 3.6 | % |
| 2. | | Teva Pharmaceutical Industries Ltd.-ADR | | | | 2.8 | |
| 3. | | RELX PLC | | | | 2.7 | |
| 4. | | WPP PLC | | | | 2.5 | |
| 5. | | British American Tobacco PLC | | | | 2.4 | |
| 6. | | CGI Group Inc.-Class A | | | | 2.3 | |
| 7. | | Deutsche Boerse AG | | | | 2.2 | |
| 8. | | CK Hutchison Holdings Ltd. | | | | 2.2 | |
| 9. | | Avago Technologies Ltd. | | | | 2.2 | |
| 10. | | Japan Tobacco, Inc. | | | | 2.0 | |
| | |
Total Net Assets | | $1.8 billion |
| |
Total Number of Holdings* | | 69 |
The Fund’s holdings are subject to change, and there is no assurance that the Fund will continue to hold any particular security.
*Excluding money market fund holdings.
Data presented here are as of December 31, 2015.
Invesco V.I. International Growth Fund
As noted previously, the Fund’s financials sector exposure was a key area of absolute and relative weakness. The Fund’s emerging market bank stocks, including Brazil-based Banco Bradesco and Thailand-based Kasikornbank, showed particular weakness. Banco Bradesco is one of the largest banking and financial services companies in Brazil. The bank was hurt by deterioration in credit quality, impacting profitability. Further concerns over additional deterioration led us to sell out of the company in the latter part of the reporting period.
As bottom-up investors, our primary focus is on finding high-quality growth companies that are trading at attractive valuations through a process we call earnings, quality and valuation (EQV). Macroeconomic and political movements are not our primary concern and do not drive our stock selection decisions.
Over the reporting period, we continued to look for opportunities to improve the growth potential and quality of the Fund’s portfolio by adding companies based on our EQV outlook for each company. We believe the volatility displayed by the markets during the past year has created long-term opportunities for our shareholders. It’s rare to find a thriving business at a compelling valuation when everything is going right; those valuations typically occur when fear dominates the market. On a stock-by-stock basis, we saw the decline over the past year in broad global equities as a buying opportunity.
For example, the pullback in China allowed us to add a China-based beverage manufacturer, Kweichow Moutai, to the portfolio. Moutai is the premier brand in Chinese spirits and is an integral part of Chinese culture. The business was started during the Qing dynasty hundreds of years ago, and today, the company has a significant share of the high-end spirits market in China. The company has net cash on its books, has high operating margin and was trading at a significant discount to its own history and to global peers. The sell-off in China local shares provided us with an opportunity to initiate a new position in the company.
Additional companies we purchased for the portfolio over the year included (but were not limited to) British retail and commercial bank Lloyds Banking Group, Switzerland-based global luxury consumer goods holding company Cie Financière Richemont, Swiss watch manufacturer Swatch Group and Australian rail freight company Aurizon Holdings.
We trimmed or sold some of the Fund’s holdings with EQV characteristics that were no longer as compelling as when we first initiated Fund positions in them, including (but not limited to) ABB, Adidas, Banco Bradesco, Encana, Hyundai Mobis and Keppel.
As always, regardless of the macroeconomic environment, we remain focused on a bottom-up investment approach of identifying attractive companies that fit our EQV-focused investment process. We continue to look for high-quality growth companies that exhibit the following characteristics: strong organic revenue growth; high returns on capital; pricing power; strong balance sheets; cash generation and reasonable valuations. In addition, we continue to favor companies that are able to consistently generate cash during weak economic environments. We believe that this balanced EQV-focused approach may help deliver attractive returns over the long term.
We thank you for your continued investment in the Invesco V.I. International Growth Fund.
The views and opinions expressed in management’s discussion of Fund performance are those of Invesco Advisers, Inc. These views and opinions are subject to change at any time based on factors such as market and economic conditions. These views and opinions may not be relied upon as investment advice or recommendations, or as an offer for a particular security. The information is not a complete analysis of every aspect of any market, country, industry, security or the Fund. Statements of fact are from sources considered reliable, but Invesco Advisers, Inc. makes no representation or warranty as to their completeness or accuracy. Although historical performance is no guarantee of future results, these insights may help you understand our investment management philosophy.
See important Fund and, if applicable, index disclosures later in this report.
| | |
 | | Clas Olsson Portfolio Manager and Chief Investment Officer of Invesco’s international growth investments team, is |
| lead manager of Invesco V.I. International Growth Fund. He joined Invesco in 1994. Mr. Olsson became a commissioned officer at the Royal Swedish Naval Academy in 1988. He also earned a BBA from The University of Texas at Austin. |
| | |
 | | Brent Bates Chartered Financial Analyst, Portfolio Manager, is manager of Invesco V.I. International Growth |
| Fund. He joined Invesco in 1996. Mr. Bates earned a BBA from Texas A&M University and is a Certified Public Accountant. |
| | |
 | | Matthew Dennis Chartered Financial Analyst, Portfolio Manager, is manager of Invesco V.I. International Growth |
| Fund. He joined Invesco in 2000. Mr. Dennis earned a BA in economics from The University of Texas at Austin and an MS in finance from Texas A&M University. |
| | |
 | | Mark Jason Chartered Financial Analyst, Portfolio Manager, is manager of Invesco V.I. International Growth |
| Fund. He joined Invesco in 2001. Mr. Jason earned a BS in finance and a BS in real estate from California State University, Northridge. |
| | |
 | | Richard Nield Chartered Financial Analyst, Portfolio Manager, is manager of Invesco V.I. International Growth |
| Fund. He joined Invesco in 2000. Mr. Nield earned a Bachelor of Commerce degree in finance and international business from McGill University in Montreal. |
Invesco V.I. International Growth Fund
Your Fund’s Long-Term Performance
Results of a $10,000 Investment – Oldest Share Class(es)
Fund and index data from 12/31/05
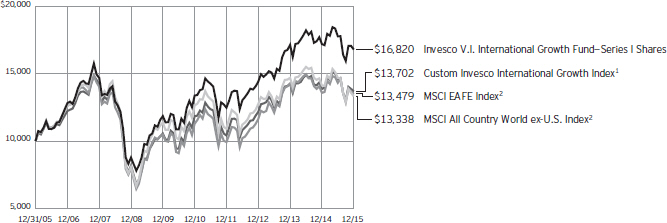
| 1 | Source(s): Invesco, FactSet Research Systems Inc. |
| 2 | Source: FactSet Research Systems Inc. |
Past performance cannot guarantee comparable future results.
The Fund has elected to use the MSCI All Country World ex-U.S. Index as its broad market benchmark rather than the MSCI EAFE Index because the MSCI All
Country World ex-U.S. Index more closely reflects the performance of the types of securities in which the Fund invests. Because this is the first reporting period since we have adopted the new index, SEC guidelines require that we compare
performance to both the old and new indexes.
The Lipper VUF International Large-Cap Growth Funds Index is not shown on the chart as the index does not have 10 years of performance history.
| | | | | |
| Average Annual Total Returns |
As of 12/31/15 | | | | | |
| |
| Series I Shares | | | | | |
| Inception (5/5/93) | | | | 7.12 | % |
| 10 Years | | | | 5.34 | |
| 5 Years | | | | 4.67 | |
| 1 Year | | | | -2.34 | |
| |
| Series II Shares | | | | | |
| Inception (9/19/01) | | | | 7.35 | % |
| 10 Years | | | | 5.07 | |
| 5 Years | | | | 4.40 | |
| 1 Year | | | | -2.61 | |
The performance of the Fund’s Series I and Series II share classes will differ primarily due to different class expenses.
The performance data quoted represent past performance and cannot guarantee comparable future results; current performance may be lower or higher. Please contact your variable product issuer or financial adviser for the most recent month-end variable product performance. Performance figures reflect Fund expenses, reinvested distributions and changes in net asset value. Investment return and
principal value will fluctuate so that you may have a gain or loss when you sell shares.
The net annual Fund operating expense ratio set forth in the most recent Fund prospectus as of the date of this report for Series I and Series II shares was 1.02% and 1.27%, respectively.1 The total annual Fund operating expense ratio set forth in the most recent Fund prospectus as of the date of this report for Series I and Series II shares was 1.03% and 1.28%, respectively. The expense ratios presented above may vary from the expense ratios presented in other sections of this report that are based on expenses incurred during the period covered by this report.
Invesco V.I. International Growth Fund, a series portfolio of AIM Variable Insurance Funds (Invesco Variable Insurance Funds), is currently offered through insurance companies issuing variable products. You cannot purchase shares of the Fund directly. Performance figures given represent the Fund and are not intended to reflect
actual variable product values. They do not reflect sales charges, expenses and fees assessed in connection with a variable product. Sales charges, expenses and fees, which are determined by the variable product issuers, will vary and will lower the total return.
The most recent month-end performance at the Fund level, excluding variable product charges, is available at 800 451 4246. As mentioned above, for the most recent month-end performance including variable product charges, please contact your variable product issuer or financial adviser.
Fund performance reflects any applicable fee waivers and/or expense reimbursements. Had the adviser not waived fees and/or reimbursed expenses currently or in the past, returns would have been lower. See current prospectus for more information.
| 1 | Total annual Fund operating expenses after any contractual fee waivers and/or expense reimbursements by the adviser in effect through at least June 30, 2017. See current prospectus for more information. |
Invesco V.I. International Growth Fund
Invesco V.I. International Growth Fund’s investment objective is long-term growth of capital.
| n | | Unless otherwise stated, information presented in this report is as of December 31, 2015, and is based on total net assets. |
| n | | Unless otherwise noted, all data provided by Invesco. |
| n | | To access your Fund’s reports/prospectus, visit invesco.com/fundreports. |
Principal risks of investing in the Fund
Depositary receipts risk. Depositary receipts involve many of the same risks as those associated with direct investment in foreign securities. In addition, the underlying issuers of certain depositary receipts, particularly unsponsored or unregistered depositary receipts, are under no obligation to distribute shareholder communications to the holders of such receipts or to pass through to them any voting rights with respect to the deposited securities.
Derivatives risk. The value of a derivative instrument depends largely on (and is derived from) the value of an underlying security, currency, commodity, interest rate, index or other asset (each referred to as an underlying asset). In addition to risks relating to the underlying assets, the use of derivatives may include other, possibly greater, risks, including counterparty, leverage and liquidity risks. Counterparty risk is the risk that the counterparty to the derivative contract will default on its obligation to pay the Fund the amount owed or otherwise perform under the derivative contract. Derivatives create leverage risk because they do not require payment up front equal to the economic exposure created by owning the derivative. As a result, an adverse change in the value of the underlying asset could result in the Fund sustaining a loss that is substantially greater than the amount invested in the derivative, which may make the Fund’s returns more volatile and increase the risk of loss. Derivative instruments may also be less liquid than more traditional investments and the Fund may be unable to sell or close out its derivative positions at a desirable time or price. This risk may be more acute under adverse market conditions, during which the Fund may be most in need of liquidating its derivative positions. Derivatives may also be harder to value, less tax efficient and subject to changing government regulation that could impact the Fund’s ability to use certain derivatives or their cost. Also, derivatives used for hedging or to gain or limit exposure to a particular market segment may not provide the expected
benefits, particularly during adverse market conditions.
Developing/emerging markets securities risk. The prices of securities issued by foreign companies and governments located in developing/emerging markets countries may be affected more negatively by inflation, devaluation of their currencies, higher transaction costs, delays in settlement, adverse political developments, the introduction of capital controls, withholding taxes, nationalization of private assets, expropriation, social unrest, war or lack of timely information than those in developed countries.
Foreign securities risk. The Fund’s foreign investments may be affected by changes in a foreign country’s exchange rates, political and social instability, changes in economic or taxation policies, difficulties when enforcing obligations, decreased liquidity, and increased volatility. Foreign companies may be subject to less regulation resulting in less publicly available information about the companies.
Geographic focus risk. From time to time the Fund may invest a substantial amount of its assets in securities of issuers located in a single country or a limited number of countries. If the Fund focuses its investments in this manner, it assumes the risk that economic, political and social conditions in those countries will have a significant impact on its investment performance. The Fund’s investment performance may also be more volatile if it focuses its investments in certain countries, especially emerging markets countries.
Growth investing risk. Growth stocks tend to be more expensive relative to their earnings or assets compared with other types of stock. As a result they tend to be more sensitive to changes in their earnings and can be more volatile.
Investing in the European Union risk. Many countries in the European Union are susceptible to high economic risks associated with high levels of debt, notably due to investments in sovereign debts of European countries such as Greece, Italy and Spain. One or more member states might exit the European Union, placing its currency and banking system in jeopardy. The European Union faces major issues involving its membership, structure, procedures
and policies, including the adoption, abandonment or adjustment of the new constitutional treaty, the European Union’s enlargement to the south and east, and resolution of the European Union’s problematic fiscal and democratic accountability. Efforts of the member states to further unify their economic and monetary policies may increase the potential for the downward movement of one member state’s market to cause a similar effect on other member states’ markets. European countries that are part of the European Economic and Monetary Union may be significantly affected by the tight fiscal and monetary controls that the union seeks to impose on its members.
Management risk. The investment techniques and risk analysis used by the Fund’s portfolio managers may not produce the desired results.
Market risk. The prices of and the income generated by the Fund’s securities may decline in response to, among other things, investor sentiment, general economic and market conditions, regional or global instability, and currency and interest rate fluctuations.
Mid-capitalization risk. Stocks of mid-sized companies tend to be more vulnerable to adverse developments and may have little or no operating history or track record of success, and limited product lines, markets, management and financial resources. The securities of mid-sized companies may be more volatile due to less market interest and less publicly available information about the issuer. They also may be illiquid or restricted as to resale, or may trade less frequently and in smaller volumes, all of which may cause difficulty when establishing or closing a position at a desirable price.
Preferred securities risk. Preferred securities may include provisions that permit the issuer, in its discretion, to defer or omit distributions for a certain period of time. If the Fund owns a security that is deferring or omitting its distributions, the Fund may be required to report the distribution on its tax returns, even though it may not have received this income. Further, preferred securities may lose substantial value due to the omission or deferment of dividend payments.
Invesco V.I. International Growth Fund
About indexes used in this report
The MSCI All Country World Ex-U.S. Index is considered representative of developed and emerging market stock markets, excluding the US. The index is computed using the net return, which withholds applicable taxes for non-resident investors.
The Custom Invesco International Growth Index is composed of the MSCI EAFE® Growth Index through February 28, 2013, and the MSCI All Country World ex-U.S. Growth Index thereafter. The MSCI EAFE® Growth Index is an unmanaged index considered representative of growth stocks of Europe, Australasia and the Far East. The MSCI All Country World ex-U.S. Growth Index is a market capitalization weighted index that includes growth companies in developed and emerging markets throughout the world, excluding the United States. Both MSCI indexes are computed using the net return, which withholds applicable taxes for non-resident investors.
The Lipper VUF International Large-Cap Growth Funds Index is an unmanaged index considered representative of international large-cap growth variable insurance underlying funds tracked by Lipper.
The MSCI EAFE® Index is an unmanaged index considered representative of stocks of Europe, Australasia and the Far East. The index is computed using the net return, which withholds applicable taxes for non-resident investors.
The Fund is not managed to track the performance of any particular index, including the index(es) described here, and consequently, the performance of the Fund may deviate significantly from the performance of the index(es).
A direct investment cannot be made in an index. Unless otherwise indicated, index results include reinvested dividends, and they do not reflect sales charges. Performance of the peer group, if applicable, reflects fund expenses; performance of a market index does not.
Other information
CPA® and Certified Public Accountant® are trademarks owned by the American Institute of Certified Public Accountants.
The returns shown in management’s discussion of Fund performance are based on net asset values calculated for shareholder transactions. Generally accepted accounting principles require adjustments to be made to the net assets of the Fund at period end for financial reporting purposes, and as such, the net asset values for shareholder transactions and the returns based on those net asset values may differ from the net asset values and returns reported in the Financial Highlights. Additionally, the returns and net asset values shown throughout this report are at the Fund level only and do not include variable product issuer charges. If such charges were included, the total returns would be lower.
Industry classifications used in this report are generally according to the Global Industry Classification Standard, which was developed by and is the exclusive property and a service mark of MSCI Inc. and Standard & Poor’s.
Invesco V.I. International Growth Fund
Schedule of Investments
December 31, 2015
| | | | | | | | |
| | | Shares | | | Value | |
Common Stocks & Other Equity Interests–95.26% | |
| Australia–4.74% | |
Amcor Ltd. | | | 3,567,153 | | | $ | 34,707,392 | |
Aurizon Holdings Ltd. | | | 5,389,756 | | | | 17,142,211 | |
Brambles Ltd. | | | 1,833,976 | | | | 15,347,893 | |
CSL Ltd. | | | 221,194 | | | | 16,865,662 | |
| | | | | 84,063,158 | |
|
| Belgium–1.33% | |
Anheuser-Busch InBev SA/NV | | | 190,693 | | | | 23,555,361 | |
|
| Brazil–1.67% | |
BM&FBOVESPA S.A. | | | 7,319,934 | | | | 20,003,006 | |
BRF S.A. | | | 686,948 | | | | 9,608,392 | |
| | | | | 29,611,398 | |
|
| Canada–7.14% | |
Canadian National Railway Co. | | | 259,250 | | | | 14,487,583 | |
Cenovus Energy Inc. | | | 995,591 | | | | 12,587,395 | |
CGI Group Inc.–Class A(a) | | | 1,003,444 | | | | 40,162,408 | |
Fairfax Financial Holdings Ltd. | | | 40,276 | | | | 19,114,769 | |
Great-West Lifeco Inc. | | | 511,843 | | | | 12,768,803 | |
Suncor Energy, Inc. | | | 1,059,019 | | | | 27,329,522 | |
| | | | | 126,450,480 | |
|
| China–4.77% | |
Baidu, Inc.–ADR(a) | | | 137,980 | | | | 26,083,739 | |
Great Wall Motor Co. Ltd.–Class H | | | 14,236,000 | | | | 16,478,411 | |
Industrial & Commercial Bank of China Ltd.–Class H | | | 22,797,000 | | | | 13,653,991 | |
Kweichow Moutai Co., Ltd.–Class A | | | 841,825 | | | | 28,207,705 | |
| | | | | 84,423,846 | |
|
| Denmark–2.82% | |
Carlsberg A/S–Class B | | | 340,927 | | | | 30,141,515 | |
Novo Nordisk A/S–Class B | | | 344,814 | | | | 19,819,031 | |
| | | | | 49,960,546 | |
|
| France–3.25% | |
Publicis Groupe S.A. | | | 508,237 | | | | 33,708,530 | |
Schneider Electric S.E. | | | 420,675 | | | | 23,951,503 | |
| | | | | 57,660,033 | |
|
| Germany–8.27% | |
Allianz S.E. | | | 165,350 | | | | 29,292,694 | |
Deutsche Boerse AG | | | 445,214 | | | | 39,379,438 | |
Deutsche Post AG | | | 583,392 | | | | 16,429,240 | |
ProSiebenSat.1 Media SE | | | 546,294 | | | | 27,633,745 | |
SAP S.E. | | | 424,338 | | | | 33,839,137 | |
| | | | | 146,574,254 | |
|
| Hong Kong–3.27% | |
CK Hutchison Holdings Ltd. | | | 2,926,768 | | | | 39,282,777 | |
Galaxy Entertainment Group Ltd. | | | 5,964,000 | | | | 18,595,284 | |
| | | | | 57,878,061 | |
| | | | | | | | |
| | | Shares | | | Value | |
| Israel–2.78% | |
Teva Pharmaceutical Industries Ltd.–ADR | | | 751,774 | | | $ | 49,346,445 | |
| | |
| Japan–7.85% | | | | | | | | |
Denso Corp. | | | 190,700 | | | | 9,092,458 | |
FANUC Corp. | | | 86,100 | | | | 14,842,886 | |
Japan Tobacco, Inc. | | | 963,700 | | | | 35,384,309 | |
Keyence Corp. | | | 23,000 | | | | 12,623,446 | |
Komatsu Ltd. | | | 856,337 | | | | 13,953,009 | |
Toyota Motor Corp. | | | 372,200 | | | | 22,845,652 | |
Yahoo Japan Corp. | | | 7,460,800 | | | | 30,321,161 | |
| | | | | 139,062,921 | |
|
| Mexico–2.14% | |
Fomento Economico Mexicano, S.A.B. de C.V.–ADR | | | 139,953 | | | | 12,924,659 | |
Grupo Televisa S.A.B.–ADR | | | 917,941 | | | | 24,977,175 | |
| | | | | 37,901,834 | |
|
| Singapore–3.60% | |
Avago Technologies Ltd. | | | 265,505 | | | | 38,538,051 | |
United Overseas Bank Ltd. | | | 1,831,300 | | | | 25,210,030 | |
| | | | | 63,748,081 | |
|
| South Korea–1.40% | |
Samsung Electronics Co., Ltd. | | | 23,236 | | | | 24,759,029 | |
| | |
| Spain–1.23% | | | | | | | | |
Amadeus IT Holding S.A.–Class A | | | 494,195 | | | | 21,761,025 | |
| | |
| Sweden–4.37% | | | | | | | | |
Getinge AB–Class B | | | 669,496 | | | | 17,419,451 | |
Investor AB–Class B | | | 780,666 | | | | 28,715,601 | |
Sandvik AB | | | 925,147 | | | | 8,010,981 | |
Telefonaktiebolaget LM Ericsson–Class B | | | 2,403,568 | | | | 23,277,136 | |
| | | | | 77,423,169 | |
|
| Switzerland–8.72% | |
Cie Financiere Richemont S.A. | | | 179,299 | | | | 12,879,008 | |
Julius Baer Group Ltd. | | | 513,764 | | | | 24,630,519 | |
Novartis AG | | | 144,152 | | | | 12,321,007 | |
Roche Holding AG | | | 119,629 | | | | 32,966,687 | |
Swatch Group AG (The) | | | 33,590 | | | | 11,721,515 | |
Syngenta AG | | | 76,297 | | | | 29,882,008 | |
UBS Group AG | | | 1,564,616 | | | | 30,107,814 | |
| | | | | 154,508,558 | |
|
| Taiwan–1.89% | |
Taiwan Semiconductor Manufacturing Co. Ltd.–ADR | | | 1,468,665 | | | | 33,412,129 | |
|
| Thailand–1.13% | |
Kasikornbank PCL–NVDR | | | 4,820,800 | | | | 20,099,507 | |
See accompanying Notes to Financial Statements which are an integral part of the financial statements.
Invesco V.I. International Growth Fund
| | | | | | | | |
| | | Shares | | | Value | |
| Turkey–0.82% | |
Akbank T.A.S. | | | 6,317,779 | | | $ | 14,514,666 | |
|
| United Kingdom–22.07% | |
Aberdeen Asset Management PLC | | | 3,189,257 | | | | 13,605,977 | |
British American Tobacco PLC | | | 758,208 | | | | 42,108,722 | |
Compass Group PLC | | | 1,808,417 | | | | 31,324,066 | |
Informa PLC | | | 1,872,364 | | | | 16,919,691 | |
Kingfisher PLC | | | 5,147,232 | | | | 24,922,744 | |
Lloyds Banking Group PLC | | | 18,450,778 | | | | 19,874,466 | |
Next PLC | | | 163,524 | | | | 17,529,033 | |
RELX PLC | | | 2,698,992 | | | | 47,318,322 | |
Royal Dutch Shell PLC–Class B | | | 981,695 | | | | 22,415,535 | |
Sky PLC | | | 3,869,284 | | | | 63,302,979 | |
Smith & Nephew PLC | | | 1,472,829 | | | | 26,067,833 | |
Unilever N.V. | | | 506,707 | | | | 21,953,391 | |
| | | | | | | | |
| | | Shares | | | Value | |
| United Kingdom–(continued) | |
WPP PLC | | | 1,896,874 | | | $ | 43,660,221 | |
| | | | | 391,002,980 | |
Total Common Stocks & Other Equity Interests
(Cost $1,339,195,119) | | | | 1,687,717,481 | |
|
Money Market Funds–4.79% | |
Liquid Assets Portfolio–Institutional Class, 0.29%(b) | | | 42,414,237 | | | | 42,414,237 | |
Premier Portfolio–Institutional Class, 0.24%(b) | | | 42,414,236 | | | | 42,414,236 | |
Total Money Market Funds
(Cost $84,828,473) | | | | 84,828,473 | |
TOTAL INVESTMENTS–100.05%
(Cost $1,424,023,592) | | | | 1,772,545,954 | |
OTHER ASSETS LESS LIABILITIES–(0.05)% | | | | (962,718 | ) |
NET ASSETS–100.00% | | | $ | 1,771,583,236 | |
Investment Abbreviations:
| | |
| ADR | | – American Depositary Receipt |
| NVDR | | – Non-Voting Depositary Receipt |
Notes to Schedule of Investments:
| (a) | Non-income producing security. |
| (b) | The money market fund and the Fund are affiliated by having the same investment adviser. The rate shown is the 7-day SEC standardized yield as of December 31, 2015. |
See accompanying Notes to Financial Statements which are an integral part of the financial statements.
Invesco V.I. International Growth Fund
Statement of Assets and Liabilities
December 31, 2015
Statement of Operations
For the year ended December 31, 2015
| | | | |
Assets: | |
Investments, at value (Cost $1,339,195,119) | | $ | 1,687,717,481 | |
Investments in affiliated money market funds, at value and cost | | | 84,828,473 | |
Total investments, at value (Cost $1,424,023,592) | | | 1,772,545,954 | |
Foreign currencies, at value (Cost $2,910,461) | | | 2,893,166 | |
Receivable for: | | | | |
Investments sold | | | 12,366,327 | |
Fund shares sold | | | 1,041,278 | |
Dividends | | | 2,993,972 | |
Investment for trustee deferred compensation and retirement plans | | | 227,946 | |
Other assets | | | 190 | |
Total assets | | | 1,792,068,833 | |
|
Liabilities: | |
Payable for: | | | | |
Investments purchased | | | 17,297,851 | |
Fund shares reacquired | | | 1,038,578 | |
Accrued fees to affiliates | | | 1,840,626 | |
Accrued trustees’ and officers’ fees and benefits | | | 370 | |
Accrued other operating expenses | | | 45,221 | |
Trustee deferred compensation and retirement plans | | | 262,951 | |
Total liabilities | | | 20,485,597 | |
Net assets applicable to shares outstanding | | $ | 1,771,583,236 | |
|
Net assets consist of: | |
Shares of beneficial interest | | $ | 1,479,842,475 | |
Undistributed net investment income | | | 11,241,353 | |
Undistributed net realized gain | | | (67,891,586 | ) |
Net unrealized appreciation | | | 348,390,994 | |
| | | $ | 1,771,583,236 | |
|
Net Assets: | |
Series I | | $ | 601,760,008 | |
Series II | | $ | 1,169,823,228 | |
|
Shares outstanding, $0.001 par value per share,
with an unlimited number of shares authorized: | |
Series I | | | 17,970,104 | |
Series II | | | 35,400,963 | |
Series I: | | | | |
Net asset value per share | | $ | 33.49 | |
Series II: | | | | |
Net asset value per share | | $ | 33.04 | |
| | | | |
Investment income: | |
Dividends (net of foreign withholding taxes of $3,622,920) | | $ | 43,106,401 | |
Dividends from affiliated money market funds | | | 114,567 | |
Total investment income | | | 43,220,968 | |
| |
Expenses: | | | | |
Advisory fees | | | 12,963,212 | |
Administrative services fees | | | 4,851,126 | |
Custodian fees | | | 526,519 | |
Distribution fees — Series II | | | 2,988,396 | |
Transfer agent fees | | | 85,057 | |
Trustees’ and officers’ fees and benefits | | | 53,280 | |
Other | | | 117,984 | |
Total expenses | | | 21,585,574 | |
Less: Fees waived | | | (189,629 | ) |
Net expenses | | | 21,395,945 | |
Net investment income | | | 21,825,023 | |
| |
Realized and unrealized gain (loss) from: | | | | |
Net realized gain from: | | | | |
Investment securities | | | 5,456,428 | |
Foreign currencies | | | 717,638 | |
| | | | 6,174,066 | |
Change in net unrealized appreciation (depreciation) of: | | | | |
Investment securities (net of foreign taxes on holdings of $742,607) | | | (80,677,751 | ) |
Foreign currencies | | | 131,741 | |
| | | | (80,546,010 | ) |
Net realized and unrealized gain (loss) | | | (74,371,944 | ) |
Net increase (decrease) in net assets resulting from operations | | $ | (52,546,921 | ) |
See accompanying Notes to Financial Statements which are an integral part of the financial statements.
Invesco V.I. International Growth Fund
Statement of Changes in Net Assets
For the years ended December 31, 2015 and 2014
| | | | | | | | |
| | | 2015 | | | 2014 | |
Operations: | | | | | |
Net investment income | | $ | 21,825,023 | | | $ | 25,036,827 | |
Net realized gain | | | 6,174,066 | | | | 110,044,435 | |
Change in net unrealized appreciation (depreciation) | | | (80,546,010 | ) | | | (132,352,415 | ) |
Net increase (decrease) in net assets resulting from operations | | | (52,546,921 | ) | | | 2,728,847 | |
| | |
Distributions to shareholders from net investment income: | | | | | | | | |
Series I | | | (9,305,810 | ) | | | (10,756,299 | ) |
Series ll | | | (15,698,757 | ) | | | (15,248,241 | ) |
Total distributions from net investment income | | | (25,004,567 | ) | | | (26,004,540 | ) |
| | |
Share transactions–net: | | | | | | | | |
Series l | | | (22,289,286 | ) | | | (30,328,366 | ) |
Series ll | | | 144,406,516 | | | | 31,387,888 | |
Net increase in net assets resulting from share transactions | | | 122,117,230 | | | | 1,059,522 | |
Net increase (decrease) in net assets | | | 44,565,742 | | | | (22,216,171 | ) |
| | |
Net assets: | | | | | | | | |
Beginning of year | | | 1,727,017,494 | | | | 1,749,233,665 | |
End of year (includes undistributed net investment income of $11,241,353 and $13,673,897, respectively) | | $ | 1,771,583,236 | | | $ | 1,727,017,494 | |
Notes to Financial Statements
December 31, 2015
NOTE 1—Significant Accounting Policies
Invesco V.I. International Growth Fund (the “Fund”) is a series portfolio of AIM Variable Insurance Funds (Invesco Variable Insurance Funds) (the “Trust”). The Trust is a Delaware statutory trust registered under the Investment Company Act of 1940, as amended (the “1940 Act”), as an open-end series management investment company consisting of twenty-four separate portfolios, (each constituting a “Fund”). The assets, liabilities and operations of each portfolio are accounted for separately. Information presented in these financial statements pertains only to the Fund. Matters affecting each Fund or class will be voted on exclusively by the shareholders of such Fund or class. Current Securities and Exchange Commission (“SEC”) guidance, however, requires participating insurance companies offering separate accounts to vote shares proportionally in accordance with the instructions of the contract owners whose investments are funded by shares of each Fund or class.
The Fund’s investment objective is long-term growth of capital.
The Fund currently offers two classes of shares, Series I and Series II, both of which are offered to insurance company separate accounts funding variable annuity contracts and variable life insurance policies (“variable products”).
The following is a summary of the significant accounting policies followed by the Fund in the preparation of its financial statements.
| A. | Security Valuations — Securities, including restricted securities, are valued according to the following policy. |
A security listed or traded on an exchange (except convertible securities) is valued at its last sales price or official closing price as of the close of the customary trading session on the exchange where the security is principally traded, or lacking any sales or official closing price on a particular day, the security may be valued at the closing bid price on that day. Securities traded in the over-the-counter market are valued based on prices furnished by independent pricing services or market makers. When such securities are valued by an independent pricing service they may be considered fair valued. Futures contracts are valued at the final settlement price set by an exchange on which they are principally traded. Listed options are valued at the mean between the last bid and asked prices from the exchange on which they are principally traded. Options not listed on an exchange are valued by an independent source at the mean between the last bid and asked prices. For purposes of determining net asset value (“NAV”) per share, futures and option contracts generally are valued 15 minutes after the close of the customary trading session of the New York Stock Exchange (“NYSE”).
Investments in open-end and closed-end registered investment companies that do not trade on an exchange are valued at the end-of-day net asset value per share. Investments in open-end and closed-end registered investment companies that trade on an exchange are valued at the last sales price or official closing price as of the close of the customary trading session on the exchange where the security is principally traded.
Debt obligations (including convertible securities) and unlisted equities are fair valued using an evaluated quote provided by an independent pricing service. Evaluated quotes provided by the pricing service may be determined without exclusive reliance on quoted prices, and may reflect appropriate factors such as institution-size trading in similar groups of securities, developments related to specific securities, dividend rate (for unlisted equities), yield (for debt obligations), quality, type of issue, coupon rate (for debt obligations), maturity (for debt obligations), individual trading characteristics and other market data. Debt obligations are subject to interest rate and credit risks. In addition, all debt obligations involve some risk of default with respect to interest and/or principal payments.
Invesco V.I. International Growth Fund
Foreign securities’ (including foreign exchange contracts) prices are converted into U.S. dollar amounts using the applicable exchange rates as of the close of the NYSE. If market quotations are available and reliable for foreign exchange-traded equity securities, the securities will be valued at the market quotations. Because trading hours for certain foreign securities end before the close of the NYSE, closing market quotations may become unreliable. If between the time trading ends on a particular security and the close of the customary trading session on the NYSE, events occur that the Adviser determines are significant and make the closing price unreliable, the Fund may fair value the security. If the event is likely to have affected the closing price of the security, the security will be valued at fair value in good faith using procedures approved by the Board of Trustees. Adjustments to closing prices to reflect fair value may also be based on a screening process of an independent pricing service to indicate the degree of certainty, based on historical data, that the closing price in the principal market where a foreign security trades is not the current value as of the close of the NYSE. Foreign securities’ prices meeting the approved degree of certainty that the price is not reflective of current value will be priced at the indication of fair value from the independent pricing service. Multiple factors may be considered by the independent pricing service in determining adjustments to reflect fair value and may include information relating to sector indices, American Depositary Receipts and domestic and foreign index futures. Foreign securities may have additional risks including exchange rate changes, potential for sharply devalued currencies and high inflation, political and economic upheaval, the relative lack of issuer information, relatively low market liquidity and the potential lack of strict financial and accounting controls and standards.
Securities for which market prices are not provided by any of the above methods may be valued based upon quotes furnished by independent sources. The last bid price may be used to value equity securities. The mean between the last bid and asked prices is used to value debt obligations, including corporate loans.
Securities for which market quotations are not readily available or became unreliable are valued at fair value as determined in good faith by or under the supervision of the Trust’s officers following procedures approved by the Board of Trustees. Issuer specific events, market trends, bid/asked quotes of brokers and information providers and other market data may be reviewed in the course of making a good faith determination of a security’s fair value.
The Fund may invest in securities that are subject to interest rate risk, meaning the risk that the prices will generally fall as interest rates rise and, conversely, the prices will generally rise as interest rates fall. Specific securities differ in their sensitivity to changes in interest rates depending on their individual characteristics. Changes in interest rates may result in increased market volatility, which may affect the value and/or liquidity of certain Fund investments.
Valuations change in response to many factors including the historical and prospective earnings of the issuer, the value of the issuer’s assets, general economic conditions, interest rates, investor perceptions and market liquidity. Because of the inherent uncertainties of valuation, the values reflected in the financial statements may materially differ from the value received upon actual sale of those investments.
| B. | Securities Transactions and Investment Income — Securities transactions are accounted for on a trade date basis. Realized gains or losses on sales are computed on the basis of specific identification of the securities sold. Interest income (net of withholding tax, if any) is recorded on the accrual basis from settlement date. Dividend income (net of withholding tax, if any) is recorded on the ex-dividend date. |
The Fund may periodically participate in litigation related to Fund investments. As such, the Fund may receive proceeds from litigation settlements. Any proceeds received are included in the Statement of Operations as realized gain (loss) for investments no longer held and as unrealized gain (loss) for investments still held.
Brokerage commissions and mark ups are considered transaction costs and are recorded as an increase to the cost basis of securities purchased and/or a reduction of proceeds on a sale of securities. Such transaction costs are included in the determination of net realized and unrealized gain (loss) from investment securities reported in the Statement of Operations and the Statement of Changes in Net Assets and the net realized and unrealized gains (losses) on securities per share in the Financial Highlights. Transaction costs are included in the calculation of the Fund’s net asset value and, accordingly, they reduce the Fund’s total returns. These transaction costs are not considered operating expenses and are not reflected in net investment income reported in the Statement of Operations and the Statement of Changes in Net Assets, or the net investment income per share and the ratios of expenses and net investment income reported in the Financial Highlights, nor are they limited by any expense limitation arrangements between the Fund and the investment adviser.
The Fund allocates income and realized and unrealized capital gains and losses to a class based on the relative net assets of each class.
| C. | Country Determination — For the purposes of making investment selection decisions and presentation in the Schedule of Investments, the investment adviser may determine the country in which an issuer is located and/or credit risk exposure based on various factors. These factors include the laws of the country under which the issuer is organized, where the issuer maintains a principal office, the country in which the issuer derives 50% or more of its total revenues and the country that has the primary market for the issuer’s securities, as well as other criteria. Among the other criteria that may be evaluated for making this determination are the country in which the issuer maintains 50% or more of its assets, the type of security, financial guarantees and enhancements, the nature of the collateral and the sponsor organization. Country of issuer and/or credit risk exposure has been determined to be the United States of America, unless otherwise noted. |
| D. | Distributions — Distributions from net investment income and net realized capital gain, if any, are generally declared and paid to separate accounts of participating insurance companies annually and recorded on the ex-dividend date. |
| E. | Federal Income Taxes — The Fund intends to comply with the requirements of Subchapter M of the Internal Revenue Code of 1986, as amended (the “Internal Revenue Code”), necessary to qualify as a regulated investment company and to distribute substantially all of the Fund’s taxable earnings to shareholders. As such, the Fund will not be subject to federal income taxes on otherwise taxable income (including net realized capital gain) that is distributed to shareholders. Therefore, no provision for federal income taxes is recorded in the financial statements. |
The Fund recognizes the tax benefits of uncertain tax positions only when the position is more likely than not to be sustained. Management has analyzed the Fund’s uncertain tax positions and concluded that no liability for unrecognized tax benefits should be recorded related to uncertain tax positions. Management is not aware of any tax positions for which it is reasonably possible that the total amounts of unrecognized tax benefits will change materially in the next 12 months.
The Fund files tax returns in the U.S. Federal jurisdiction and certain other jurisdictions. Generally, the Fund is subject to examinations by such taxing authorities for up to three years after the filing of the return for the tax period.
| F. | Expenses — Fees provided for under the Rule 12b-1 plan of a particular class of the Fund and which are directly attributable to that class are charged to the operations of such class. All other expenses are allocated among the classes based on relative net assets. |
Invesco V.I. International Growth Fund
| G. | Accounting Estimates — The preparation of financial statements in conformity with accounting principles generally accepted in the United States of America (“GAAP”) requires management to make estimates and assumptions that affect the reported amounts of assets and liabilities at the date of the financial statements and the reported amounts of revenues and expenses during the reporting period including estimates and assumptions related to taxation. Actual results could differ from those estimates by a significant amount. In addition, the Fund monitors for material events or transactions that may occur or become known after the period-end date and before the date the financial statements are released to print. |
| H. | Indemnifications — Under the Trust’s organizational documents, each Trustee, officer, employee or other agent of the Trust is indemnified against certain liabilities that may arise out of the performance of their duties to the Fund. Additionally, in the normal course of business, the Fund enters into contracts, including the Fund’s servicing agreements, that contain a variety of indemnification clauses. The Fund’s maximum exposure under these arrangements is unknown as this would involve future claims that may be made against the Fund that have not yet occurred. The risk of material loss as a result of such indemnification claims is considered remote. |
| I. | Foreign Currency Translations — Foreign currency is valued at the close of the NYSE based on quotations posted by banks and major currency dealers. Portfolio securities and other assets and liabilities denominated in foreign currencies are translated into U.S. dollar amounts at date of valuation. Purchases and sales of portfolio securities (net of foreign taxes withheld on disposition) and income items denominated in foreign currencies are translated into U.S. dollar amounts on the respective dates of such transactions. The Fund does not separately account for the portion of the results of operations resulting from changes in foreign exchange rates on investments and the fluctuations arising from changes in market prices of securities held. The combined results of changes in foreign exchange rates and the fluctuation of market prices on investments (net of estimated foreign tax withholding) are included with the net realized and unrealized gain or loss from investments in the Statement of Operations. Reported net realized foreign currency gains or losses arise from (1) sales of foreign currencies, (2) currency gains or losses realized between the trade and settlement dates on securities transactions, and (3) the difference between the amounts of dividends, interest, and foreign withholding taxes recorded on the Fund’s books and the U.S. dollar equivalent of the amounts actually received or paid. Net unrealized foreign currency gains and losses arise from changes in the fair values of assets and liabilities, other than investments in securities at fiscal period end, resulting from changes in exchange rates. |
The Fund may invest in foreign securities, which may be subject to foreign taxes on income, gains on investments or currency repatriation, a portion of which may be recoverable. Foreign taxes, if any, are recorded based on the tax regulations and rates that exist in the foreign markets in which the Fund invests and are shown in the Statement of Operations.
| J. | Forward Foreign Currency Contracts — The Fund may engage in foreign currency transactions either on a spot (i.e. for prompt delivery and settlement) basis, or through forward foreign currency contracts, to manage or minimize currency or exchange rate risk. |
The Fund may also enter into forward foreign currency contracts for the purchase or sale of a security denominated in a foreign currency in order to “lock in” the U.S. dollar price of that security, or the Fund may also enter into forward foreign currency contracts that do not provide for physical settlement of the two currencies, but instead are settled by a single cash payment calculated as the difference between the agreed upon exchange rate and the spot rate at settlement based upon an agreed upon notional amount (non-deliverable forwards). The Fund will set aside liquid assets in an amount equal to daily mark-to-market obligation for forward foreign currency contracts.
A forward foreign currency contract is an obligation between two parties (“Counterparties”) to purchase or sell a specific currency for an agreed-upon price at a future date. The use of forward foreign currency contracts does not eliminate fluctuations in the price of the underlying securities the Fund owns or intends to acquire but establishes a rate of exchange in advance. Fluctuations in the value of these contracts are measured by the difference in the contract date and reporting date exchange rates and are recorded as unrealized appreciation (depreciation) until the contracts are closed. When the contracts are closed, realized gains (losses) are recorded. Realized and unrealized gains (losses) on the contracts are included in the Statement of Operations. The primary risks associated with forward foreign currency contracts include failure of the Counterparty to meet the terms of the contract and the value of the foreign currency changing unfavorably. These risks may be in excess of the amounts reflected in the Statement of Assets and Liabilities.
NOTE 2—Advisory Fees and Other Fees Paid to Affiliates
The Trust has entered into a master investment advisory agreement with Invesco Advisers, Inc. (the “Adviser” or “Invesco”). Under the terms of the investment advisory agreement, the Fund pays an advisory fee to the Adviser based on the annual rate of the Fund’s average daily net assets as follows:
| | | | |
| Average Daily Net Assets | | Rate | |
First $250 million | | | 0.75% | |
Over $250 million | | | 0.70% | |
For the year ended December 31, 2015, the effective advisory fees incurred by the Fund was 0.71%.
Under the terms of a master sub-advisory agreement between the Adviser and each of Invesco Asset Management Deutschland GmbH, Invesco Asset Management Limited, Invesco Asset Management (Japan) Limited, Invesco Hong Kong Limited, Invesco Senior Secured Management, Inc. and Invesco Canada Ltd. (collectively, the “Affiliated Sub-Advisers”) the Adviser, not the Fund, may pay 40% of the fees paid to the Adviser to any such Affiliated Sub-Adviser(s) that provide(s) discretionary investment management services to the Fund based on the percentage of assets allocated to such Affiliated Sub-Adviser(s).
The Adviser has contractually agreed, through at least June 30, 2016, to waive advisory fees and/or reimburse expenses of all shares to the extent necessary to limit total annual fund operating expenses after fee waiver and/or expense reimbursement (excluding certain items discussed below) of Series I shares to 2.25% and Series II shares to 2.50% of average daily net assets. In determining the Adviser’s obligation to waive advisory fees and/or reimburse expenses, the following expenses are not taken into account, and could cause the total annual fund operating expenses after fee waiver and/or expense reimbursement to exceed the numbers reflected above: (1) interest; (2) taxes; (3) dividend expense on short sales; (4) extraordinary or non-routine items, including litigation expenses; and (5) expenses that the Fund has incurred but did not actually pay because of an expense offset arrangement. Unless Invesco continues the fee waiver agreement, it will terminate on June 30, 2016. The fee waiver
Invesco V.I. International Growth Fund
agreement cannot be terminated during its term. The Adviser did not waive fees and/or reimburse expenses during the period under this expense limitation.
Further, the Adviser has contractually agreed, through at least June 30, 2017, to waive the advisory fee payable by the Fund in an amount equal to 100% of the net advisory fees the Adviser receives from the affiliated money market funds on investments by the Fund of uninvested cash in such affiliated money market funds.
For the year ended December 31, 2015, the Adviser waived advisory fees of $189,629.
The Trust has entered into a master administrative services agreement with Invesco pursuant to which the Fund has agreed to pay Invesco a fee for costs incurred in providing accounting services and fund administrative services to the Fund and to reimburse Invesco for administrative services fees paid to insurance companies that have agreed to provide services to the participants of separate accounts. These administrative services provided by the insurance companies may include, among other things: the printing of prospectuses, financial reports and proxy statements and the delivery of the same to existing participants; the maintenance of master accounts; the facilitation of purchases and redemptions requested by the participants; and the servicing of participants’ accounts. Pursuant to such agreement, for the year ended December 31, 2015, Invesco was paid $393,424 for accounting and fund administrative services and reimbursed $4,457,702 for services provided by insurance companies.
The Trust has entered into a transfer agency and service agreement with Invesco Investment Services, Inc. (“IIS”) pursuant to which the Fund has agreed to pay IIS a fee for providing transfer agency and shareholder services to the Fund and reimburse IIS for certain expenses incurred by IIS in the course of providing such services. For the year ended December 31, 2015, expenses incurred under the agreement are shown in the Statement of Operations as Transfer agent fees.
The Trust has entered into a master distribution agreement with Invesco Distributors, Inc. (“IDI”) to serve as the distributor for the Fund. The Trust has adopted a plan pursuant to Rule 12b-1 under the 1940 Act with respect to the Fund’s Series II shares (the “Plan”). The Fund, pursuant to the Plan, pays IDI compensation at the annual rate of 0.25% of the Fund’s average daily net assets of Series II shares. Of the Plan payments, up to 0.25% of the average daily net assets of the Series II shares may be paid to insurance companies who furnish continuing personal shareholder services to customers who purchase and own Series II shares of the Fund. For the year ended December 31, 2015, expenses incurred under the Plan are detailed in the Statement of Operations as Distribution fees.
Certain officers and trustees of the Trust are officers and directors of the Adviser, IIS and/or IDI.
NOTE 3—Additional Valuation Information
GAAP defines fair value as the price that would be received to sell an asset or paid to transfer a liability in an orderly transaction between market participants at the measurement date, under current market conditions. GAAP establishes a hierarchy that prioritizes the inputs to valuation methods, giving the highest priority to readily available unadjusted quoted prices in an active market for identical assets (Level 1) and the lowest priority to significant unobservable inputs (Level 3), generally when market prices are not readily available or are unreliable. Based on the valuation inputs, the securities or other investments are tiered into one of three levels. Changes in valuation methods may result in transfers in or out of an investment’s assigned level:
| | Level 1 — | Prices are determined using quoted prices in an active market for identical assets. |
| | Level 2 — | Prices are determined using other significant observable inputs. Observable inputs are inputs that other market participants may use in pricing a security. These may include quoted prices for similar securities, interest rates, prepayment speeds, credit risk, yield curves, loss severities, default rates, discount rates, volatilities and others. |
| | Level 3 — | Prices are determined using significant unobservable inputs. In situations where quoted prices or observable inputs are unavailable (for example, when there is little or no market activity for an investment at the end of the period), unobservable inputs may be used. Unobservable inputs reflect the Fund’s own assumptions about the factors market participants would use in determining fair value of the securities or instruments and would be based on the best available information. |
The following is a summary of the tiered valuation input levels, as of December 31, 2015. The level assigned to the securities valuations may not be an indication of the risk or liquidity associated with investing in those securities. Because of the inherent uncertainties of valuation, the values reflected in the financial statements may materially differ from the value received upon actual sale of those investments.
During the year ended December 31, 2015, there were transfers from Level 1 to Level 2 of $166,562,665 and from Level 2 to Level 1 of $140,085,544, due to foreign fair value adjustments.
| | | | | | | | | | | | | | | | |
| | | Level 1 | | | Level 2 | | | Level 3 | | | Total | |
Australia | | $ | — | | | $ | 84,063,158 | | | $ | — | | | $ | 84,063,158 | |
Belgium | | | — | | | | 23,555,361 | | | | — | | | | 23,555,361 | |
Brazil | | | 9,608,392 | | | | 20,003,006 | | | | — | | | | 29,611,398 | |
Canada | | | 126,450,480 | | | | — | | | | — | | | | 126,450,480 | |
China | | | 26,083,739 | | | | 58,340,107 | | | | — | | | | 84,423,846 | |
Denmark | | | — | | | | 49,960,546 | | | | — | | | | 49,960,546 | |
France | | | — | | | | 57,660,033 | | | | — | | | | 57,660,033 | |
Germany | | | 73,218,575 | | | | 73,355,679 | | | | — | | | | 146,574,254 | |
Hong Kong | | | — | | | | 57,878,061 | | | | — | | | | 57,878,061 | |
Israel | | | 49,346,445 | | | | — | | | | — | | | | 49,346,445 | |
Japan | | | — | | | | 139,062,921 | | | | — | | | | 139,062,921 | |
Mexico | | | 37,901,834 | | | | — | | | | — | | | | 37,901,834 | |
Singapore | | | 38,538,051 | | | | 25,210,030 | | | | — | | | | 63,748,081 | |
South Korea | | | — | | | | 24,759,029 | | | | — | | | | 24,759,029 | |
Invesco V.I. International Growth Fund
| | | | | | | | | | | | | | | | |
| | | Level 1 | | | Level 2 | | | Level 3 | | | Total | |
Spain | | $ | — | | | $ | 21,761,025 | | | $ | — | | | $ | 21,761,025 | |
Sweden | | | — | | | | 77,423,169 | | | | — | | | | 77,423,169 | |
Switzerland | | | 29,882,008 | | | | 124,626,550 | | | | — | | | | 154,508,558 | |
Taiwan | | | 33,412,129 | | | | — | | | | — | | | | 33,412,129 | |
Thailand | | | — | | | | 20,099,507 | | | | — | | | | 20,099,507 | |
Turkey | | | 14,514,666 | | | | — | | | | — | | | | 14,514,666 | |
United Kingdom | | | 81,724,199 | | | | 309,278,781 | | | | — | | | | 391,002,980 | |
United States | | | 84,828,473 | | | | — | | | | — | | | | 84,828,473 | |
Total Investments | | $ | 605,508,991 | | | $ | 1,167,036,963 | | | $ | — | | | $ | 1,772,545,954 | |
NOTE 4—Trustees’ and Officers’ Fees and Benefits
Trustees’ and Officers’ Fees and Benefits include amounts accrued by the Fund to pay remuneration to certain Trustees and Officers of the Fund. Trustees have the option to defer compensation payable by the Fund, and Trustees’ and Officers’ Fees and Benefits also include amounts accrued by the Fund to fund such deferred compensation amounts. Those Trustees who defer compensation have the option to select various Invesco Funds in which their deferral accounts shall be deemed to be invested. Finally, certain current Trustees were eligible to participate in a retirement plan that provided for benefits to be paid upon retirement to Trustees over a period of time based on the number of years of service. The Fund may have certain former Trustees who also participate in a retirement plan and receive benefits under such plan. Trustees’ and Officers’ Fees and Benefits include amounts accrued by the Fund to fund such retirement benefits. Obligations under the deferred compensation and retirement plans represent unsecured claims against the general assets of the Fund.
NOTE 5—Cash Balances
The Fund is permitted to temporarily carry a negative or overdrawn balance in its account with State Street Bank and Trust Company, the custodian bank. Such balances, if any at period end, are shown in the Statement of Assets and Liabilities under the payable caption Amount due custodian. To compensate the custodian bank for such overdrafts, the overdrawn Fund may either (1) leave funds as a compensating balance in the account so the custodian bank can be compensated by earning the additional interest; or (2) compensate by paying the custodian bank at a rate agreed upon by the custodian bank and Invesco, not to exceed the contractually agreed upon rate.
NOTE 6—Distributions to Shareholders and Tax Components of Net Assets
Tax Character of Distributions to Shareholders Paid During the Fiscal Years Ended December 31, 2015 and 2014:
| | | | | | | | |
| | | 2015 | | | 2014 | |
Ordinary income | | $ | 25,004,567 | | | $ | 26,004,540 | |
Tax Components of Net Assets at Period-End:
| | | | |
| | | 2015 | |
Undistributed ordinary income | | $ | 21,642,362 | |
Net unrealized appreciation — investments | | | 322,164,043 | |
Net unrealized appreciation (depreciation) — other investments | | | (131,368 | ) |
Temporary book/tax differences | | | (277,655 | ) |
Capital loss carryforward | | | (51,656,621 | ) |
Shares of beneficial interest | | | 1,479,842,475 | |
Total net assets | | $ | 1,771,583,236 | |
The difference between book-basis and tax-basis unrealized appreciation (depreciation) is due to differences in the timing of recognition of gains and losses on investments for tax and book purposes. The Fund’s net unrealized appreciation difference is attributable primarily to wash sales and passive foreign investment companies.
The temporary book/tax differences are a result of timing differences between book and tax recognition of income and/or expenses. The Fund’s temporary book/tax differences are the result of the trustee deferral of compensation and retirement plan benefits.
Capital loss carryforward is calculated and reported as of a specific date. Results of transactions and other activity after that date may affect the amount of capital loss carryforward actually available for the Fund to utilize. Capital losses generated in years beginning after December 22, 2010 can be carried forward for an unlimited period, whereas previous losses expire in eight tax years. Capital losses with an expiration period may not be used to offset capital gains until all net capital losses without an expiration date have been utilized. Capital loss carryforwards with no expiration date will retain their character as either short-term or long-term capital losses instead of as short-term capital losses as under prior law. The ability to utilize capital loss carryforwards in the future may be limited under the Internal Revenue Code and related regulations based on the results of future transactions.
Invesco V.I. International Growth Fund
The Fund has a capital loss carryforward as of December 31, 2015, which expires as follows:
| | | | | | | | | | | | |
| Capital Loss Carryforward* | |
| Expiration | | Short-Term | | | Long-Term | | | Total | |
December 31, 2016 | | $ | 3,949,297 | | | $ | — | | | $ | 3,949,297 | |
December 31, 2017 | | | 9,904,769 | | | | — | | | | 9,904,769 | |
December 31, 2018 | | | 37,802,555 | | | | — | | | | 37,802,555 | |
| | | $ | 51,656,621 | | | $ | — | | | $ | 51,656,621 | |
| * | Capital loss carryforward as of the date listed above is reduced for limitations, if any, to the extent required by the Internal Revenue Code and may be further limited depending upon a variety of factors, including the realization of net unrealized gains or losses as of the date of any reorganization. |
NOTE 7—Investment Securities
The aggregate amount of investment securities (other than short-term securities, U.S. Treasury obligations and money market funds, if any) purchased and sold by the Fund during the year ended December 31, 2015 was $530,274,350 and $373,939,938, respectively. Cost of investments on a tax basis includes the adjustments for financial reporting purposes as of the most recently completed federal income tax reporting period-end.
| | | | |
| Unrealized Appreciation (Depreciation) of Investment Securities on a Tax Basis | |
Aggregate unrealized appreciation of investment securities | | $ | 408,821,791 | |
Aggregate unrealized (depreciation) of investment securities | | | (86,657,748 | ) |
Net unrealized appreciation of investment securities | | $ | 322,164,043 | |
Cost of investments for tax purposes is $1,450,381,911.
NOTE 8—Reclassification of Permanent Differences
Primarily as a result of differing book/tax treatment of foreign currency transactions, on December 31, 2015, undistributed net investment income was increased by $747,000 and undistributed net realized gain was decreased by $747,000. This reclassification had no effect on the net assets of the Fund.
NOTE 9—Share Information
| | | | | | | | | | | | | | | | |
| | | Summary of Share Activity | |
| | | Years ended December 31, | |
| | | 2015(a) | | | 2014 | |
| | | Shares | | | Amount | | | Shares | | | Amount | |
Sold: | | | | | | | | | | | | | | | | |
Series I | | | 2,880,432 | | | $ | 101,462,241 | | | | 3,030,640 | | | $ | 108,099,105 | |
Series II | | | 9,692,762 | | | | 342,834,084 | | | | 6,960,184 | | | | 245,055,431 | |
| | | | |
Issued as reinvestment of dividends: | | | | | | | | | | | | | | | | |
Series I | | | 294,235 | | | | 9,253,708 | | | | 304,681 | | | | 10,743,048 | |
Series II | | | 505,433 | | | | 15,698,757 | | | | 437,790 | | | | 15,248,241 | |
| | | | |
Reacquired: | | | | | | | | | | | | | | | | |
Series I | | | (3,775,855 | ) | | | (133,005,235 | ) | | | (4,195,088 | ) | | | (149,170,519 | ) |
Series II | | | (6,163,474 | ) | | | (214,126,325 | ) | | | (6,504,328 | ) | | | (228,915,784 | ) |
Net increase in share activity | | | 3,433,533 | | | $ | 122,117,230 | | | | 33,879 | | | $ | 1,059,522 | |
| (a) | There are entities that are record owners of more than 5% of the outstanding shares of the Fund and in the aggregate own 28% of the outstanding shares of the Fund. The Fund and the Fund’s principal underwriter or adviser, are parties to participation agreements with these entities whereby these entities sell units of interest in separate accounts funding variable products that are invested in the Fund. The Fund, Invesco and/or Invesco affiliates may make payments to these entities, which are considered to be related to the Fund, for providing services to the Fund, Invesco and/or Invesco affiliates including but not limited to services such as, securities brokerage, third party record keeping and account servicing and administrative services. The Fund has no knowledge as to whether all or any portion of the shares owned of record by these entities are also owned beneficially. |
Invesco V.I. International Growth Fund
NOTE 10—Financial Highlights
The following schedule presents financial highlights for a share of the Fund outstanding throughout the periods indicated.
| | | | | | | | | | | | | | | | | | | | | | | | | | | | | | | | | | | | | | | | | | | | | | | | |
| | | Net asset
value,
beginning
of period | | | Net
investment
income(a) | | | Net gains
(losses)
on securities
(both
realized and
unrealized) | | | Total from
investment
operations | | | Dividends
from net
investment
income | | | Net asset
value, end
of period | | | Total
return(b) | | | Net assets,
end of period
(000’s omitted) | | | Ratio of
expenses
to average
net assets
with fee waivers
and/or expenses
absorbed | | | Ratio of
expenses
to average net
assets without
fee waivers
and/or expenses
absorbed | | | Ratio of net
investment
income
to average
net assets | | | Portfolio
turnover(c) | |
Series I | | | | | | | | | | | | | | | | | | | | | | | | | | | | | | | | | | | | | | | | | | | | | | | | |
Year ended 12/31/15 | | $ | 34.87 | | | $ | 0.48 | | | $ | (1.33 | ) | | $ | (0.85 | ) | | $ | (0.53 | ) | | $ | 33.49 | | | | (2.34 | )% | | $ | 601,760 | | | | 1.00 | %(d) | | | 1.01 | %(d) | | | 1.35 | %(d) | | | 22 | % |
Year ended 12/31/14 | | | 35.32 | | | | 0.56 | | | | (0.44 | ) | | | 0.12 | | | | (0.57 | ) | | | 34.87 | | | | 0.33 | | | | 647,530 | | | | 1.01 | | | | 1.02 | | | | 1.58 | | | | 26 | |
Year ended 12/31/13 | | | 30.03 | | | | 0.44 | | | | 5.25 | | | | 5.69 | | | | (0.40 | ) | | | 35.32 | | | | 19.01 | | | | 686,305 | | | | 1.01 | | | | 1.02 | | | | 1.37 | | | | 24 | |
Year ended 12/31/12 | | | 26.37 | | | | 0.35 | | | | 3.73 | | | | 4.08 | | | | (0.42 | ) | | | 30.03 | | | | 15.53 | | | | 591,491 | | | | 1.00 | | | | 1.01 | | | | 1.24 | | | | 24 | |
Year ended 12/31/11 | | | 28.69 | | | | 0.50 | | | | (2.38 | ) | | | (1.88 | ) | | | (0.44 | ) | | | 26.37 | | | | (6.74 | ) | | | 544,143 | | | | 1.02 | | | | 1.03 | | | | 1.75 | | | | 26 | |
Series II | | | | | | | | | | | | | | | | | | | | | | | | | | | | | | | | | | | | | | | | | | | | | | | | |
Year ended 12/31/15 | | | 34.42 | | | | 0.38 | | | | (1.31 | ) | | | (0.93 | ) | | | (0.45 | ) | | | 33.04 | | | | (2.61 | ) | | | 1,169,823 | | | | 1.25 | (d) | | | 1.26 | (d) | | | 1.10 | (d) | | | 22 | |
Year ended 12/31/14 | | | 34.88 | | | | 0.47 | | | | (0.43 | ) | | | 0.04 | | | | (0.50 | ) | | | 34.42 | | | | 0.09 | | | | 1,079,488 | | | | 1.26 | | | | 1.27 | | | | 1.33 | | | | 26 | |
Year ended 12/31/13 | | | 29.68 | | | | 0.36 | | | | 5.18 | | | | 5.54 | | | | (0.34 | ) | | | 34.88 | | | | 18.72 | | | | 1,062,929 | | | | 1.26 | | | | 1.27 | | | | 1.12 | | | | 24 | |
Year ended 12/31/12 | | | 26.08 | | | | 0.28 | | | | 3.69 | | | | 3.97 | | | | (0.37 | ) | | | 29.68 | | | | 15.26 | | | | 827,361 | | | | 1.25 | | | | 1.26 | | | | 0.99 | | | | 24 | |
Year ended 12/31/11 | | | 28.35 | | | | 0.42 | | | | (2.36 | ) | | | (1.94 | ) | | | (0.33 | ) | | | 26.08 | | | | (6.99 | ) | | | 607,269 | | | | 1.27 | | | | 1.28 | | | | 1.50 | | | | 26 | |
| (a) | Calculated using average shares outstanding. |
| (b) | Includes adjustments in accordance with accounting principles generally accepted in the United States of America and as such, the net asset value for financial reporting purposes and the returns based upon those net asset values may differ from the net asset value and returns for shareholder transactions. Total returns are not annualized for periods less than one year, if applicable and do not reflect charges assessed in connection with a variable product, which if included would reduce total returns. |
| (c) | Portfolio turnover is calculated at the fund level and is not annualized for periods less than one year, if applicable. For the period ended December 31, 2011, the portfolio turnover calculation excludes the value of securities purchased of $23,376,285 and sold of $8,831,296 in the effort to realign the Fund’s portfolio holdings after the reorganization of Invesco Van Kampen V.I. International Growth Equity Fund into the Fund. |
| (d) | Ratios are based on average daily net assets (000’s omitted) of $638,672 and $1,195,358 for Series I and Series II, respectively. |
Invesco V.I. International Growth Fund
Report of Independent Registered Public Accounting Firm
To the Board of Trustees of AIM Variable Insurance Funds (Invesco Variable Insurance Funds)
and Shareholders of Invesco V.I. International Growth Fund:
In our opinion, the accompanying statement of assets and liabilities, including the schedule of investments, and the related statements of operations and of changes in net assets and the financial highlights present fairly, in all material respects, the financial position of Invesco V.I. International Growth Fund (one of the funds constituting AIM Variable Insurance Funds (Invesco Variable Insurance Funds), hereafter referred to as the “Fund”) at December 31, 2015, the results of its operations for the year then ended, the changes in its net assets for each of the two years in the period then ended and the financial highlights for each of the five years in the period then ended, in conformity with accounting principles generally accepted in the United States of America. These financial statements and financial highlights (hereafter referred to as “financial statements”) are the responsibility of the Fund’s management. Our responsibility is to express an opinion on these financial statements based on our audits. We conducted our audits of these financial statements in accordance with the standards of the Public Company Accounting Oversight Board (United States). Those standards require that we plan and perform the audit to obtain reasonable assurance about whether the financial statements are free of material misstatement. An audit includes examining, on a test basis, evidence supporting the amounts and disclosures in the financial statements, assessing the accounting principles used and significant estimates made by management, and evaluating the overall financial statement presentation. We believe that our audits, which included confirmation of securities at December 31, 2015 by correspondence with the custodian and brokers, and the application of alternative auditing procedures where confirmations of security purchases have not been received, provide a reasonable basis for our opinion.
PRICEWATERHOUSECOOPERS LLP
Houston, Texas
February 15, 2016
Invesco V.I. International Growth Fund
Calculating your ongoing Fund expenses
Example
As a shareholder of the Fund, you incur ongoing costs, including management fees; distribution and/or service fees (12b-1); and other Fund expenses. This example is intended to help you understand your ongoing costs (in dollars) of investing in the Fund and to compare these costs with ongoing costs of investing in other mutual funds. The example is based on an investment of $1,000 invested at the beginning of the period and held for the entire period July 1, 2015 through December 31, 2015.
The actual and hypothetical expenses in the examples below do not represent the effect of any fees or other expenses assessed in connection with a variable product; if they did, the expenses shown would be higher while the ending account values shown would be lower.
Actual expenses
The table below provides information about actual account values and actual expenses. You may use the information in this table, together with the amount you invested, to estimate the expenses that you paid over the period. Simply divide your account value by $1,000 (for example, an $8,600 account value divided by $1,000 = 8.6), then multiply the result by the number in the table under the heading entitled “Actual Expenses Paid During Period” to estimate the expenses you paid on your account during this period.
Hypothetical example for comparison purposes
The table below also provides information about hypothetical account values and hypothetical expenses based on the Fund’s actual expense ratio and an assumed rate of return of 5% per year before expenses, which is not the Fund’s actual return.
The hypothetical account values and expenses may not be used to estimate the actual ending account balance or expenses you paid for the period. You may use this information to compare the ongoing costs of investing in the Fund and other funds. To do so, compare this 5% hypothetical example with the 5% hypothetical examples that appear in the shareholder reports of the other funds.
Please note that the expenses shown in the table are meant to highlight your ongoing costs. Therefore, the hypothetical information is useful in comparing ongoing costs, and will not help you determine the relative total costs of owning different funds.
| | | | | | | | | | | | | | | | | | | | | | | | |
| Class | | Beginning
Account Value
(07/01/15) | | | ACTUAL | | | HYPOTHETICAL (5% annual return before expenses) | | | Annualized
Expense
Ratio | |
| | | Ending
Account Value
(12/31/15)1 | | | Expenses
Paid During
Period2 | | | Ending
Account Value
(12/31/15) | | | Expenses
Paid During
Period2 | | |
| Series I | | $ | 1,000.00 | | | $ | 944.90 | | | $ | 4.90 | | | $ | 1,020.16 | | | $ | 5.09 | | | | 1.00 | % |
| Series II | | | 1,000.00 | | | | 943.40 | | | | 6.12 | | | | 1,018.90 | | | | 6.36 | | | | 1.25 | |
| 1 | The actual ending account value is based on the actual total return of the Fund for the period July 1, 2015 through December 31, 2015, after actual expenses and will differ from the hypothetical ending account value which is based on the Fund’s expense ratio and a hypothetical annual return of 5% before expenses. |
| 2 | Expenses are equal to the Fund’s annualized expense ratio as indicated above multiplied by the average account value over the period, multiplied by 184/365 to reflect the most recent fiscal half year. |
Invesco V.I. International Growth Fund
Tax Information
Form 1099-DIV, Form 1042-S and other year-end tax information provide shareholders with actual calendar year amounts that should be included in their tax returns. Shareholders should consult their tax advisors.
The following distribution information is being provided as required by the Internal Revenue Code or to meet a specific state’s requirement.
The Fund designates the following amounts or, if subsequently determined to be different, the maximum amount allowable for its fiscal year ended December 31, 2015:
| | | | |
Federal and State Income Tax | |
Corporate Dividends Received Deduction* | | | 0 | % |
U.S. Treasury Obligations* | | | 0 | % |
Foreign Taxes | | $ | 0.0661 | |
Foreign Source Income | | $ | 0.8943 | |
| | * | The above percentages are based on ordinary income dividends paid to shareholders during the Fund’s fiscal year. |
Invesco V.I. International Growth Fund
Trustees and Officers
The address of each trustee and officer is AIM Variable Insurance Funds (Invesco Variable Insurance Funds) (the “Trust”), 11 Greenway Plaza, Suite 1000, Houston, Texas 77046-1173. The trustees serve for the life of the Trust, subject to their earlier death, incapacitation, resignation, retirement or removal as more specifically provided in the Trust’s organizational documents. Each officer serves for a one year term or until their successors are elected and qualified. Column two below includes length of time served with predecessor entities, if any.
| | | | | | | | |
Name, Year of Birth and
Position(s) Held with the Trust | | Trustee and/
or Officer Since | | Principal Occupation(s)
During Past 5 Years | | Number of Funds in Fund Complex Overseen by Trustee | | Other Directorship(s) Held by Trustee During Past 5 Years |
| Interested Persons | | | | | | | | |
| Martin L. Flanagan1 — 1960 Trustee | | 2007 | | Executive Director, Chief Executive Officer and President, Invesco Ltd. (ultimate parent of Invesco and a global investment management firm); Advisor to the Board, Invesco Advisers, Inc. (formerly known as Invesco Institutional (N.A.), Inc.); Trustee, The Invesco Funds; Vice Chair, Investment Company Institute; and Member of Executive Board, SMU Cox School of Business Formerly: Chairman and Chief Executive Officer, Invesco Advisers, Inc. (registered investment adviser); Director, Chairman, Chief Executive Officer and President, IVZ Inc. (holding company), INVESCO Group Services, Inc. (service provider) and Invesco North American Holdings, Inc. (holding company); Director, Chief Executive Officer and President, Invesco Holding Company Limited (parent of Invesco and a global investment management firm); Director, Invesco Ltd.; Chairman, Investment Company Institute and President, Co-Chief Executive Officer, Co-President, Chief Operating Officer and Chief Financial Officer, Franklin Resources, Inc. (global investment management organization) | | 146 | | None |
Philip A. Taylor2 — 1954 Trustee, President and Principal Executive Officer | | 2006 | | Head of North American Retail and Senior Managing Director, Invesco Ltd.; Director, Co-Chairman, Co-President and Co-Chief Executive Officer, Invesco Advisers, Inc. (formerly known as Invesco Institutional (N.A.), Inc.) (registered investment adviser); Director, Chairman, Chief Executive Officer and President, Invesco Management Group, Inc. (formerly known as Invesco Aim Management Group, Inc.) (financial services holding company); Director and Chairman, Invesco Investment Services, Inc. (formerly known as Invesco Aim Investment Services, Inc.) (registered transfer agent) Chief Executive Officer, Invesco Corporate Class Inc. (corporate mutual fund company) Director, Chairman and Chief Executive Officer, Invesco Canada Ltd. (formerly known as Invesco Trimark Ltd./Invesco Trimark Ltèe) (registered investment adviser and registered transfer agent); Trustee, President and Principal Executive Officer, The Invesco Funds (other than AIM Treasurer’s Series Trust (Invesco Treasurer’s Series Trust), Short-Term Investments Trust and Invesco Management Trust); Trustee and Executive Vice President, The Invesco Funds (AIM Treasurer’s Series Trust (Invesco Treasurer’s Series Trust), Short-Term Investments Trust and Invesco Management Trust only); Director, Invesco Investment Advisers LLC (formerly known as Van Kampen Asset Management); Director, Chief Executive Officer and President, Van Kampen Exchange Corp. Formerly: Director and President, INVESCO Funds Group, Inc. (registered investment adviser and registered transfer agent); Director and Chairman, IVZ Distributors, Inc. (formerly known as INVESCO Distributors, Inc.) (registered broker dealer); Director, President and Chairman, Invesco Inc. (holding company), Invesco Canada Holdings Inc. (holding company), Trimark Investments Ltd./Placements Trimark Ltèe and Invesco Financial Services Ltd/Services Financiers Invesco Ltèe; Chief Executive Officer, Invesco Canada Fund Inc (corporate mutual fund company); Director and Chairman, Van Kampen Investor Services Inc.; Director, Chief Executive Officer and President, 1371 Preferred Inc. (holding company) and Van Kampen Investments Inc.; Director and President, AIM GP Canada Inc. (general partner for limited partnerships) and Van Kampen Advisors, Inc.; Director and Chief Executive Officer, Invesco Trimark Dealer Inc. (registered broker dealer); Director, Invesco Distributors, Inc. (formerly known as Invesco Aim Distributors, Inc.) (registered broker dealer); Manager, Invesco PowerShares Capital Management LLC; Director, Chief Executive Officer and President, Invesco Advisers, Inc.; Director, Chairman, Chief Executive Officer and President, Invesco Aim Capital Management, Inc.; President, Invesco Trimark Dealer Inc. and Invesco Trimark Ltd./Invesco Trimark Ltèe; Director and President, AIM Trimark Corporate Class Inc. and AIM Trimark Canada Fund Inc.; Senior Managing Director, Invesco Holding Company Limited; Director and Chairman, Fund Management Company (former registered broker dealer); President and Principal Executive Officer, The Invesco Funds (AIM Treasurer’s Series Trust (Invesco Treasurer’s Series Trust), and Short-Term Investments Trust only); President, AIM Trimark Global Fund Inc. and AIM Trimark Canada Fund Inc | | 146 | | None |
| 1 | Mr. Flanagan is considered an interested person (within the meaning of Section 2(a)(19) of the 1940 Act) of the Trust because he is an officer of the Adviser to the Trust, and an officer and a director of Invesco Ltd., ultimate parent of the Adviser. |
| 2 | Mr. Taylor is considered an interested person (within the meaning of Section 2(a)(19) of the 1940 Act) of the Trust because he is an officer and a director of the Adviser. |
Invesco V.I. International Growth Fund
Trustees and Officers—(continued)
| | | | | | | | |
Name, Year of Birth and
Position(s) Held with the Trust | | Trustee and/
or Officer Since | | Principal Occupation(s)
During Past 5 Years | | Number of Funds in Fund Complex Overseen by Trustee | | Other Directorship(s)
Held by Trustee During Past 5 Years |
| Independent Trustees | | | | | | | | |
Bruce L. Crockett — 1944 Trustee and Chair | | 2003 | | Chairman, Crockett Technologies Associates (technology consulting company) Formerly: Director, Captaris (unified messaging provider); Director, President and Chief Executive Officer, COMSAT Corporation; Chairman, Board of Governors of INTELSAT (international communications company); ACE Limited (insurance company); Independent Directors Council and Investment Company Institute | | 146 | | ALPS (Attorneys Liability Protection Society) (insurance company) and Globe Specialty Metals, Inc. (metallurgical company) |
David C. Arch — 1945 Trustee | | 2010 | | Chairman of Blistex Inc., a consumer health care products manufacturer | | 146 | | Board member of the Illinois Manufacturers’ Association; Member of the Board of Visitors, Institute for the Humanities, University of Michigan |
James T. Bunch — 1942 Trustee | | 2000 | | Managing Member, Grumman Hill Group LLC (family office/private equity investments) Formerly: Chairman of the Board of Trustees, Evans Scholars Foundation and Chairman, Board of Governors, Western Golf Association | | 146 | | Trustee, Evans Scholars Foundation; and Chairman of the Board, Denver Film Society |
Albert R. Dowden — 1941 Trustee | | 2003 | | Director of a number of public and private business corporations, including the Boss Group, Ltd. (private investment and management); Nature’s Sunshine Products, Inc. and Reich & Tang Funds (5 portfolios) (registered investment company) Formerly: Director, Homeowners of America Holding Corporation/Homeowners of America Insurance Company (property casualty company); Director, Continental Energy Services, LLC (oil and gas pipeline service); Director, CompuDyne Corporation (provider of product and services to the public security market) and Director, Annuity and Life Re (Holdings), Ltd. (reinsurance company); Director, President and Chief Executive Officer, Volvo Group North America, Inc.; Senior Vice President, AB Volvo; Director of various public and private corporations; Chairman, DHJ Media, Inc.; Director, Magellan Insurance Company; and Director, The Hertz Corporation, Genmar Corporation (boat manufacturer), National Media Corporation; Advisory Board of Rotary Power International (designer, manufacturer, and seller of rotary power engines); and Chairman, Cortland Trust, Inc. (registered investment company) | | 146 | | Director of: Nature’s Sunshine Products, Inc., Reich & Tang Funds, Homeowners of America Holding Corporation/ Homeowners of America Insurance Company, the Boss Group |
Jack M. Fields — 1952 Trustee | | 2003 | | Chief Executive Officer, Twenty First Century Group, Inc. (government affairs company); Owner and Chief Executive Officer, Dos Angeles Ranch, L.P. (cattle, hunting, corporate entertainment); and Discovery Global Education Fund (non-profit) Formerly: Chief Executive Officer, Texana Timber LP (sustainable forestry company); Director of Cross Timbers Quail Research Ranch (non-profit); and member of the U.S. House of Representatives | | 146 | | Insperity, Inc. (formerly known as Administaff) |
Eli Jones — Trustee | | 2016 | | Professor and Dean, Mays Business School, Texas A&M University Formerly: Professor and Dean, Walton College of Business, University of Arkansas, and E.J. Ourso College of Business, Louisiana State University | | 146 | | Director, Insperity, Inc., (2011-present) and ARVEST Bank (2012-2015) |
Prema Mathai-Davis — 1950 Trustee | | 2003 | | Retired. Formerly: Chief Executive Officer, YWCA of the U.S.A. | | 146 | | None |
Larry Soll — 1942 Trustee | | 1997 | | Retired. Formerly: Chairman, Chief Executive Officer and President, Synergen Corp. (a biotechnology company) | | 146 | | None |
Robert C. Troccoli — Trustee | | 2016 | | Retired. Formerly: Senior Partner, KPMG LLP | | 146 | | None |
Raymond Stickel, Jr. — 1944 Trustee | | 2005 | | Retired. Formerly: Director, Mainstay VP Series Funds, Inc. (25 portfolios) and Partner, Deloitte & Touche | | 146 | | None |
Suzanne H. Woolsey — 1941 Trustee | | 2014 | | Chief Executive Officer of Woolsey Partners LLC | | 146 | | Emeritus Chair of the Board of Trustees of the Institute for Defense Analyses; Trustee of Colorado College; Trustee of California Institute of Technology; Prior to 2014, Director of Fluor Corp.; Prior to 2010, Trustee of the German Marshall Fund of the United States; Prior to 2010 Trustee of the Rocky Mountain Institute |
Invesco V.I. International Growth Fund
Trustees and Officers—(continued)
| | | | | | | | |
Name, Year of Birth and
Position(s) Held with the Trust | | Trustee and/
or Officer Since | | Principal Occupation(s)
During Past 5 Years | | Number of Funds in Fund Complex Overseen by Trustee | | Other Directorship(s)
Held by Trustee During Past 5 Years |
| Other Officers | | | | | | | | |
Russell C. Burk — 1958 Senior Vice President and Senior Officer | | 2005 | | Senior Vice President and Senior Officer, The Invesco Funds | | N/A | | N/A |
John M. Zerr — 1962 Senior Vice President, Chief Legal Officer and Secretary | | 2006 | | Director, Senior Vice President, Secretary and General Counsel, Invesco Management Group, Inc. (formerly known as Invesco Aim Management Group, Inc.) and Van Kampen Exchange Corp.; Senior Vice President, Invesco Advisers, Inc. (formerly known as Invesco Institutional (N.A.), Inc.) (registered investment adviser); Senior Vice President and Secretary, Invesco Distributors, Inc. (formerly known as Invesco Aim Distributors, Inc.); Director, Vice President and Secretary, Invesco Investment Services, Inc. (formerly known as Invesco Aim Investment Services, Inc.); Senior Vice President, Chief Legal Officer and Secretary, The Invesco Funds; Managing Director, Invesco PowerShares Capital Management LLC; Director, Secretary and General Counsel, Invesco Investment Advisers LLC (formerly known as Van Kampen Asset Management); Secretary and General Counsel, Invesco Capital Markets, Inc. (formerly known as Van Kampen Funds Inc.) and Chief Legal Officer, PowerShares Exchange-Traded Fund Trust, PowerShares Exchange-Traded Fund Trust II, PowerShares India Exchange-Traded Fund Trust, PowerShares Actively Managed Exchange-Traded Fund Trust, and PowerShares Actively Managed Exchange-Traded Commodity Fund Trust Formerly: Director, Vice President and Secretary, IVZ Distributors, Inc. (formerly known as INVESCO distributors, Inc.); Director and Vice President, INVESCO Funds Group, Inc.; Director and Vice President, Van Kampen Advisors Inc.; Director, Vice President, Secretary and General Counsel, Van Kampen Investor Services Inc.; Director, Invesco Distributors, Inc. (formerly known as Invesco Aim Distributors, Inc.); Director, Senior Vice President, General Counsel and Secretary, Invesco Aim Advisers, Inc. and Van Kampen Investments Inc.; Director, Vice President and Secretary, Fund Management Company; Director, Senior Vice President, Secretary, General Counsel and Vice President, Invesco Aim Capital Management, Inc.; Chief Operating Officer and General Counsel, Liberty Ridge Capital, Inc. (an investment adviser); Vice President and Secretary, PBHG Funds (an investment company) and PBHG Insurance Series Fund (an investment company); Chief Operating Officer, General Counsel and Secretary, Old Mutual Investment Partners (a broker-dealer); General Counsel and Secretary, Old Mutual Fund Services (an administrator) and Old Mutual Shareholder Services (a shareholder servicing center); Executive Vice President, General Counsel and Secretary, Old Mutual Capital, Inc. (an investment adviser); and Vice President and Secretary, Old Mutual Advisors Funds (an investment company) | | N/A | | N/A |
Sheri Morris — 1964 Vice President, Treasurer and Principal Financial Officer | | 2003 | | Vice President, Treasurer and Principal Financial Officer, The Invesco Funds; Vice President, Invesco Advisers, Inc. (formerly known as Invesco Institutional (N.A.), Inc.) (registered investment adviser); and Vice President, PowerShares Exchange-Traded Fund Trust, PowerShares Exchange-Traded Fund Trust II, PowerShares India Exchange-Traded Fund Trust, PowerShares Actively Managed Exchange-Traded Fund Trust, and PowerShares Actively Managed Exchange-Traded Commodity Fund Trust Formerly: Vice President, Invesco Aim Advisers, Inc., Invesco Aim Capital Management, Inc. and Invesco Aim Private Asset Management, Inc.; Assistant Vice President and Assistant Treasurer, The Invesco Funds and Assistant Vice President, Invesco Advisers, Inc., Invesco Aim Capital Management, Inc. and Invesco Aim Private Asset Management, Inc.; and Treasurer, PowerShares Exchange-Traded Fund Trust, PowerShares Exchange-Traded Fund Trust II, PowerShares India Exchange-Traded Fund Trust and PowerShares Actively Managed Exchange-Traded Fund Trust | | N/A | | N/A |
Invesco V.I. International Growth Fund
Trustees and Officers—(continued)
| | | | | | | | |
Name, Year of Birth and
Position(s) Held with the Trust | | Trustee and/
or Officer Since | | Principal Occupation(s)
During Past 5 Years | | Number of Funds in Fund Complex Overseen by Trustee | | Other Directorship(s)
Held by Trustee During Past 5 Years |
| Other Officers—(continued) | | | | | | | | |
Karen Dunn Kelley — 1960 Vice President | | 2003 | | Senior Managing Director, Investments, Invesco Ltd.; Director, Co-President, Co-Chief Executive Officer, and Co-Chairman, Invesco Advisers, Inc. (formerly known as Invesco Institutional (N.A.), Inc.) (registered investment adviser); Chairman, Invesco Senior Secured Management, Inc.; Senior Vice President, Invesco Management Group, Inc. (formerly known as Invesco Aim Management Group, Inc.); Executive Vice President, Invesco Distributors, Inc. (formerly known as Invesco Aim Distributors, Inc.); Director, Invesco Mortgage Capital Inc. and Invesco Management Company Limited; Vice President, The Invesco Funds (other than AIM Treasurer’s Series Trust (Invesco Treasurer’s Series Trust), Short-Term Investments Trust and Invesco Management Trust); and President and Principal Executive Officer, The Invesco Funds (AIM Treasurer’s Series Trust (Invesco Treasurer’s Series Trust), Short-Term Investments Trust and Invesco Management Trust only) Formerly: Director and President, INVESCO Asset Management (Bermuda) Ltd., Director, INVESCO Global Asset Management Limited and INVESCO Management S.A.; Senior Vice President, Van Kampen Investments Inc. and Invesco Advisers, Inc. (formerly known as Invesco Institutional (N.A.), Inc.) (registered investment adviser); Vice President, Invesco Advisers, Inc. (formerly known as Invesco Institutional (N.A.), Inc.); Director of Cash Management and Senior Vice President, Invesco Advisers, Inc. and Invesco Aim Capital Management, Inc.; Director and President, Fund Management Company; Chief Cash Management Officer, Director of Cash Management, Senior Vice President, and Managing Director, Invesco Aim Capital Management, Inc.; Director of Cash Management, Senior Vice President, and Vice President, Invesco Advisers, Inc. and The Invesco Funds (AIM Treasurer’s Series Trust (Invesco Treasurer’s Series Trust), and Short-Term Investments Trust only) | | N/A | | N/A |
Crissie M. Wisdom — 1969 Anti-Money Laundering Compliance Officer | | 2013 | | Anti-Money Laundering Compliance Officer, Invesco Advisers, Inc. (formerly known as Invesco Institutional (N.A.), Inc.) (registered investment adviser), Invesco Capital Markets, Inc. (formerly known as Van Kampen Funds Inc.), Invesco Distributors, Inc., Invesco Investment Services, Inc., Invesco Management Group, Inc., Van Kampen Exchange Corp., The Invesco Funds, and PowerShares Exchange-Traded Fund Trust, PowerShares Exchange-Traded Fund Trust II, PowerShares India Exchange-Traded Fund Trust, PowerShares Actively Managed Exchange-Traded Fund Trust and PowerShares Actively Managed Exchange-Traded Commodity Fund Trust; Anti-Money Laundering Compliance Officer and Bank Secrecy Act Officer, INVESCO National Trust Company and Invesco Trust Company; and Fraud Prevention Manager and Controls and Risk Analysis Manager for Invesco Investment Services, Inc. | | N/A | | N/A |
Lisa O. Brinkley — 1959 Chief Compliance Officer | | 2015 | | Senior Vice President and Chief Compliance Officer, Invesco Advisers, Inc. (registered investment adviser) (formerly known as Invesco Institutional (N.A., Inc.); and Chief Compliance Officer, The Invesco Funds Formerly: Global Assurance Officer, Invesco Ltd. and Vice President, The Invesco Funds; Chief Compliance Officer, Invesco Distributors, Inc. (formerly known as Invesco Aim Distributors, Inc.), Invesco Investment Services, Inc.(formerly known as Invesco Aim Investment Services, Inc.) and Van Kampen Investor Services Inc.; Senior Vice President, Invesco Management Group, Inc.; Senior Vice President and Chief Compliance Officer, Invesco Advisers, Inc. and The Invesco Funds; Vice President and Chief Compliance Officer, Invesco Aim Capital Management, Inc. and Invesco Distributors, Inc.; Vice President, Invesco Investment Services, Inc. and Fund Management Company | | N/A | | N/A |
The Statement of Additional Information of the Trust includes additional information about the Fund’s Trustees and is available upon request, without charge, by calling 1.800.959.4246. Please refer to the Fund’s prospectus for information on the Fund’s sub-advisers.
| | | | | | |
Office of the Fund 11 Greenway Plaza, Suite 1000 Houston, TX 77046-1173 | | Investment Adviser Invesco Advisers, Inc. 1555 Peachtree Street, N.E. Atlanta, GA 30309 | | Distributor Invesco Distributors, Inc. 11 Greenway Plaza, Suite 1000 Houston, TX 77046-1173 | | Auditors PricewaterhouseCoopers LLP 1000 Louisiana Street, Suite 5800 Houston, TX 77002-5678 |
| | | |
| | | | | | |
Counsel to the Fund Stradley Ronon Stevens & Young, LLP 2005 Market Street, Suite 2600 Philadelphia, PA 19103-7018 | | Counsel to the Independent Trustees Goodwin Procter LLP 901 New York Avenue, N.W. Washington, D.C. 20001 | | Transfer Agent Invesco Investment Services, Inc. 11 Greenway Plaza, Suite 1000 Houston, TX 77046-1173 | | Custodian State Street Bank and Trust Company 225 Franklin Street Boston, MA 02110-2801 |
Invesco V.I. International Growth Fund
| | | | |
| | |

| | Annual Report to Shareholders | | December 31, 2015 |
| | |
| | Invesco V.I. Managed Volatility Fund |

| | |
| | The Fund provides a complete list of its holdings four times in each fiscal year, at the quarter-ends. For the second and fourth quarters, the lists appear in the Fund’s semiannual and annual reports to shareholders. For the first and third quarters, the Fund files the lists with the Securities and Exchange Commission (SEC) on Form N-Q. The Fund’s Form N-Q filings are available on the SEC website, sec.gov. Copies of the Fund’s Forms N-Q may be reviewed and copied at the SEC Public Reference Room in Washington, D.C. You can obtain information on the operation of the Public Reference Room, including information about duplicating fee charges, by calling 202 551 8090 or 800 732 0330, or by electronic request at the following email address: publicinfo@sec.gov. The SEC file numbers for the Fund are 811-07452 and 033-57340. The Fund’s most recent portfolio holdings, as filed on Form N-Q, have also been made available to insurance companies issuing variable annuity contracts and variable life insurance policies (“variable products”) that invest in the Fund. A description of the policies and procedures that the Fund uses to determine how to vote proxies relating to portfolio securities is available without charge, upon request, from our Client Services department at 800 959 4246 or at invesco.com/proxyguidelines. The information is also available on the SEC website, sec.gov. Information regarding how the Fund voted proxies related to its portfolio securities during the most recent 12-month period ended June 30 is available at invesco.com/proxysearch. The information is also available on the SEC website, sec.gov. Invesco Advisers, Inc. is an investment adviser; it provides investment advisory services to individual and institutional clients and does not sell securities. Invesco Distributors, Inc. is the US distributor for Invesco Ltd.’s retail mutual funds, exchange-traded funds and institutional money market funds. Both are wholly owned, indirect subsidiaries of Invesco Ltd. This report must be accompanied or preceded by a currently effective Fund prospectus and variable product prospectus, which contain more complete information, including sales charges and expenses. Investors should read each carefully before investing. Invesco Distributors, Inc. I-VIMGV-AR-1 NOT FDIC INSURED | MAY LOSE VALUE | NO BANK GUARANTEE |
Management’s Discussion of Fund Performance
Performance summary
For the year ended December 31, 2015, Series I shares of Invesco V.I. Managed Volatility Fund (the Fund), outperformed the Russell 1000 Value Index, the Fund’s broad market benchmark.
Your Fund’s long-term performance appears later in this report.
Fund vs. Indexes
Total returns, 12/31/14 to 12/31/15, excluding variable product issuer charges.
If variable product issuer charges were included, returns would be lower.
| | | | | |
| Series I Shares | | | | -2.15 | % |
| Series II Shares | | | | -2.37 | |
| Russell 1000 Value Index▼ (Broad Market Index) | | | | -3.83 | |
| Barclays U.S. Government/Credit Index▼ (Style-Specific Index) | | | | 0.15 | |
| Lipper VUF Mixed-Asset Target Allocation Growth Funds Indexn (Peer Group Index)* | | | | -0.82 | |
| Lipper VUF Equity Income Funds Indexn (Former Peer Group Index)* | | | | -3.77 | |
Source(s): ▼FactSet Research Systems Inc.; nLipper Inc.
| * | During the reporting period, the Fund elected to use the Lipper VUF Mixed-Asset Target Allocation Growth Funds Index as its peer group benchmark rather than the Lipper VUF Equity Income Funds Index because the Lipper VUF Mixed-Asset Target Allocation Growth Funds Index more closely reflects the performance of the types of securities in which the Fund invests. |
Market conditions and your Fund
The US economy continued its modest, but steady growth, during the year ended December 31, 2015 – although the health of individual economic sectors varied dramatically. The headline economic story was a steady decline in already-battered energy markets, as oil prices plummeted when increased supply overwhelmed demand. This decline particularly affected companies with US-based offshore or shale-based resources – companies whose cost to recover oil is higher than many traditional producers. On the other end of the spectrum, the improved position of the US consumer was the more subtle story which drove the US economy forward during the year.
As the year began, economic growth appeared to be stronger in the US than in the rest of the world. US equity markets were recovering from the crash of oil prices initiated by OPEC’s decision to maintain high production despite low
prices and slowing global growth. The view that the US Federal Reserve (the Fed) would begin raising rates while other central banks were loosening monetary policy led the US dollar to strengthen against many currencies. This hurt commodity- and materials-based economies – and companies in related sectors. Additionally, US-based multinational companies faced foreign exchange headwinds. Low interest rates, the increasing availability of credit and an improving employment picture all contributed to higher consumer confidence and consumer spending, which drove US equity markets higher, particularly through the spring, and helped overcome fears that Greece and the eurozone would fail to reach an agreement on a financial bailout plan.
In the summer of 2015, US equity markets moved sharply lower. A significant downturn in China’s financial markets and weak global economic growth led the Fed to delay raising interest rates; this, in turn,
increased investor uncertainty and market volatility. A continued decline in oil prices also contributed to market volatility. In the fall of 2015, however, US markets rallied, the Fed saw enough economic stabilization to finally raise interest rates, and most major US market indexes ended the year barely in positive territory.
For the reporting period, most US equity market indexes delivered muted gains, at best, with value underperforming growth by a large margin, across market-cap. Sector performance within the Russell 1000 Value Index was mainly negative, with the health care, telecommunication services and industrials being the only sectors with positive results.
On the positive side, the Fund’s underweight allocation in the energy sector was a significant contributor to the Fund’s performance relative to the broad market benchmark. The sector was the worst-performing sector during the year, as continued weakness in oil prices drove down stock prices.
Strong stock selection within the information technology sector was also a large contributor to the Fund’s relative returns for the reporting period. Notably, Amdocs, in the software and services industry, was a large driver of performance, posting double-digit returns for the reporting period. Amdocs’ stock price increased when the company reported record revenues in July 2015, after expanding its product suite and renewing major service contracts. In addition, not owning HP helped the Fund’s relative performance, as the company’s stock struggled during the year.
Stock selection in the consumer discretionary sector also added to relative returns. Within the sector, Carnival was a notable contributor, posting returns of over 20% for the reporting period. The cruise line operator reported higher-
| | | | | |
| Portfolio Composition |
| By sector | | | | % of total net assets | |
| | | | | |
| |
| Financials | | | | 28.4 | % |
| Health Care | | | | 14.1 | |
| Information Technology | | | | 13.6 | |
| Consumer Discretionary | | | | 9.0 | |
| Energy | | | | 8.3 | |
| Consumer Staples | | | | 6.8 | |
| Industrials | | | | 6.2 | |
| U.S. Government Securities | | | | 5.3 | |
| Telecommunication Services | | | | 2.8 | |
| Utilities | | | | 1.7 | |
| Materials | | | | 0.5 | |
| Money Market Funds | | | | | |
| Plus Other Assets Less Liabilities | | | | 3.3 | |
| | | | | |
| Top 10 Equity Holdings* |
| | | | % of total net assets | |
| | | | | | | |
| | |
| 1. | | JPMorgan Chase & Co. | | | | 3.2 | % |
| 2. | | Citigroup Inc. | | | | 3.0 | |
| 3. | | General Electric Co. | | | | 2.5 | |
| 4. | | Bank of America Corp. | | | | 1.9 | |
| 5. | | Morgan Stanley | | | | 1.6 | |
| 6. | | Carnival Corp. | | | | 1.3 | |
| 7. | | PNC Financial Services Group, Inc. (The) | | | | 1.3 | |
| 8. | | Citizens Financial Group Inc. | | | | 1.3 | |
| 9. | | Target Corp. | | | | 1.2 | |
| 10. | | Merck & Co., Inc. | | | | 1.2 | |
| | | | | |
| Total Net Assets | | | $ | 53.9 million | |
| |
| Total Number of Holdings* | | | | 266 | |
The Fund’s holdings are subject to change, and there is no assurance that the Fund will continue to hold any particular security.
*Excluding money market fund holdings.
Data presented here are as of December 31, 2015.
Invesco V.I. Managed Volatility Fund
than-expected earnings and raised its outlook for 2016.
On the negative side, stock selection in the health care sector and our allocation to health care stocks detracted from the Fund’s performance relative to the Russell 1000 Value Index. Specifically, an underweight allocation to health care services and not owning names like Cigna were large detractors, as those stocks performed well for the reporting period.
Stock selection in the consumer staples sector also hurt the Fund’s relative performance. Notably, positions in Archer-Daniels-Midland declined during the fourth quarter as investors weighed third-quarter profits that missed analyst expectations and guidance that the company may continue to have a challenging operating environment due to the strong US dollar and depressed ethanol margins.
Stock selection in and an underweight allocation to the industrials sector also dampened the Fund’s relative performance. Tyco International, within the commercial and professional services industry, performed poorly for the reporting period, posting negative double-digit returns. In the fourth quarter, Tyco International met analysts’ earnings expectations; however, revenue numbers fell short due to the impact from foreign currency versus the strong US dollar.
The Fund’s allocation to high-grade bonds and convertible bonds contributed to relative performance versus the Russell 1000 Value Index, as the holdings within traditional and convertible bonds outperformed large value equities, which posted negative returns. The Fund’s fixed income allocation potentially may provide income and capital preservation during equity and market downturns.
Currency forward contracts were used during the reporting period and had a large positive impact on the Fund’s performance relative to its broad market benchmark for the reporting period. This was mainly due to the strength of the US dollar compared to the foreign currencies in which the Fund’s non-US holdings were denominated. We used currency forward contracts for the purpose of hedging currency exposure of non-US-based companies held in the portfolio. Currency forward contracts were used solely for the purpose of hedging and not for speculative purposes or leverage.
As part of our mandate, and to potentially reduce portfolio volatility during a market downturn, we sold short S&P 500 futures contracts
during the reporting period for the purpose of reducing equity exposure in the Fund. S&P 500 futures contracts were used solely for the purpose of reducing volatility and not for speculative purposes. The use of S&P 500 futures contracts had a slight positive impact on the Fund’s performance relative to the Russell 1000 Value Index for the reporting period.
Equity markets experienced continued volatility during the reporting period. Reasons for volatility included political unrest in Eastern Europe, a sluggish Chinese economy and the effects on the global economy of falling oil prices. We believe that market volatility creates opportunities to invest in companies with attractive valuations and strong fundamentals. We believe that ultimately those valuations and fundamentals will be reflected in those companies’ stock prices.
Thank you for your continued investment in Invesco V.I. Managed Volatility Fund and for sharing our long-term investment horizon.
The views and opinions expressed in management’s discussion of Fund performance are those of Invesco Advisers, Inc. These views and opinions are subject to change at any time based on factors such as market and economic conditions. These views and opinions may not be relied upon as investment advice or recommendations, or as an offer for a particular security. The information is not a complete analysis of every aspect of any market, country, industry, security or the Fund. Statements of fact are from sources considered reliable, but Invesco Advisers, Inc. makes no representation or warranty as to their completeness or accuracy. Although historical performance is no guarantee of future results, these insights may help you understand our investment management philosophy.
See important Fund and, if applicable, index disclosures later in this report.
Thomas Bastian
Chartered Financial Analyst, Portfolio Manager, is manager of Invesco V.I. Managed Volatility Fund. He joined Invesco in 2010. Mr. Bastian earned a BA in accounting from St. John’s University and an MBA in finance from University of Michigan.
Chuck Burge
Portfolio Manager, is manager of Invesco V.I. Managed Volatility Fund. He joined Invesco in 2002. Mr. Burge earned a BS in economics from Texas A&M University and an MBA in finance and accounting from Rice University.
Brian Jurkash
Portfolio Manager, is manager of Invesco V.I. Managed Volatility Fund. He joined Invesco in 2000. Mr. Jurkash earned a BBA degree in finance from Stephen F. Austin State University and an MBA in finance from the University of Houston.
Sergio Marcheli
Portfolio Manager, is manager of Invesco V.I. Managed Volatility Fund. He joined Invesco in 2010. Mr. Marcheli earned a BBA from the University of Houston and an MBA from the University of St. Thomas.
Duy Nguyen
Chartered Financial Analyst, Portfolio Manager and Chief Investment Officer of Invesco Solutions, is manager of Invesco V.I. Managed Volatility Fund. He joined Invesco in 2000. Mr. Nguyen earned a BBA from The University of Texas at Austin and an MS from the University of Houston.
James Roeder
Chartered Financial Analyst, Portfolio Manager, is manager of Invesco V.I. Managed Volatility Fund. He joined Invesco in 2010. Mr. Roeder earned a BS in accounting from Clemson University and an MBA in economics and finance from the University of Chicago Booth School of Business.
Matthew Titus
Chartered Financial Analyst, Portfolio Manager, is manager of Invesco V.I. Managed Volatility Fund. He joined the management team effective January 25, 2016, after the close of the reporting period. Mr. Titus earned a bachelor’s degree in accounting and economics from Luther College in Decorah, Iowa, and an MBA from Ohio State University.
Invesco V.I. Managed Volatility Fund
Your Fund’s Long-Term Performance
Results of a $10,000 Investment – Oldest Share Class(es)
Fund and index data from 12/31/05
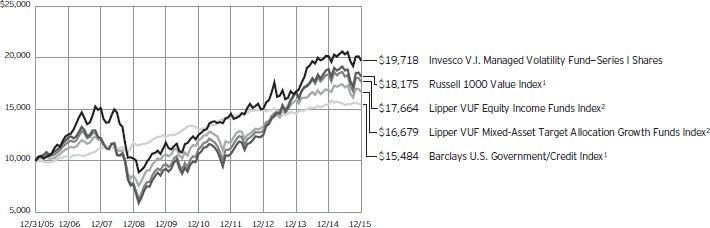
| 1 | Source: FactSet Research Systems Inc. |
Past performance cannot guarantee comparable future results.
During the reporting period, the Fund elected to use the Lipper VUF Mixed-Asset Target Allocation Growth Funds Index as its peer group benchmark rather
than the Lipper VUF Equity Income Funds Index because the Lipper VUF Mixed-Asset Target Allocation Growth Funds Index more closely reflects the performance of the types of securities in which the Fund invests. Because this is
the first reporting period since we have adopted the new index, SEC guidelines require that we compare performance to both the old and new indexes.
| | | | | |
| Average Annual Total Returns |
As of 12/31/15 | | | | | |
| |
| Series I Shares | | | | | |
| Inception (12/30/94) | | | | 7.19 | % |
| 10 Years | | | | 7.03 | |
| 5 Years | | | | 9.53 | |
| 1 Year | | | | -2.15 | |
| |
| Series II Shares | | | | | |
| Inception (4/30/04) | | | | 9.10 | % |
| 10 Years | | | | 6.76 | |
| 5 Years | | | | 9.26 | |
| 1 Year | | | | -2.37 | |
The performance of the Fund’s Series I and Series II share classes will differ primarily due to different class expenses.
The performance data quoted represent past performance and cannot guarantee comparable future results; current performance may be lower or higher. Please contact your variable product issuer or financial adviser for the most recent month-end variable product performance. Performance figures reflect Fund expenses, reinvested distributions and changes in net asset value. Investment return and
principal value will fluctuate so that you may have a gain or loss when you sell shares.
The net annual Fund operating expense ratio set forth in the most recent Fund prospectus as of the date of this report for Series I and Series II shares was 1.10% and 1.35%, respectively.1 The total annual Fund operating expense ratio set forth in the most recent Fund prospectus as of the date of this report for Series I and Series II shares was 1.11% and 1.36%, respectively. The expense ratios presented above may vary from the expense ratios presented in other sections of this report that are based on expenses incurred during the period covered by this report.
Invesco V.I. Managed Volatility Fund, a series portfolio of AIM Variable Insurance Funds (Invesco Variable Insurance Funds), is currently offered through insurance companies issuing variable products. You cannot purchase shares of the Fund directly. Performance figures given represent the Fund and are not intended to reflect
actual variable product values. They do not reflect sales charges, expenses and fees assessed in connection with a variable product. Sales charges, expenses and fees, which are determined by the variable product issuers, will vary and will lower the total return.
The most recent month-end performance at the Fund level, excluding variable product charges, is available at 800 451 4246. As mentioned above, for the most recent month-end performance including variable product charges, please contact your variable product issuer or financial adviser.
Fund performance reflects any applicable fee waivers and/or expense reimbursements. Had the adviser not waived fees and/or reimbursed expenses currently or in the past, returns would have been lower. See current prospectus for more information.
| 1 | Total annual Fund operating expenses after any contractual fee waivers and/or expense reimbursements by the adviser in effect through at least June 30, 2017. See current prospectus for more information. |
Invesco V.I. Managed Volatility Fund
Invesco V.I. Managed Volatility Fund’s investment objective is both capital appreciation and current income while managing portfolio volatility.
| n | | Unless otherwise stated, information presented in this report is as of December 31, 2015, and is based on total net assets. |
| n | | Unless otherwise noted, all data provided by Invesco. |
| n | | To access your Fund’s reports/prospectus, visit invesco.com/fundreports. |
Principal risks of investing in the Fund
Active trading risk. The Fund engages in frequent trading of portfolio securities. Active trading results in added expenses and may result in a lower return.
Call risk. If interest rates fall, it is possible that issuers of debt securities with high interest rates will prepay or call their securities before their maturity dates. In this event, the proceeds from the called securities would likely be reinvested by the Fund in securities bearing the new, lower interest rates, resulting in a possible decline in the Fund’s income and distributions to shareholders.
Convertible securities risk. The Fund may own convertible securities, the value of which may be affected by market interest rates, the risk that the issuer will default, the value of the underlying stock or the right of the issuer to buy back the convertible securities.
Credit risk. The issuer of instruments in which the Fund invests may be unable to meet interest and/or principal payments, thereby causing its instruments to decrease in value and lowering the issuer’s credit rating.
Depositary receipts risk. Depositary receipts involve many of the same risks as those associated with direct investment in foreign securities. In addition, the underlying issuers of certain depositary receipts, particularly unsponsored or unregistered depositary receipts, are under no obligation to distribute shareholder communications to the holders of such receipts or to pass through to them any voting rights with respect to the deposited securities.
Derivatives risk. The value of a derivative instrument depends largely on (and is derived from) the value of an underlying security, currency, commodity, interest rate, index or other asset (each referred to as an underlying asset). In addition to risks relating to the underlying assets, the use of derivatives may include other, possibly greater, risks, including counterparty, leverage and liquidity risks. Counterparty risk is the risk that the counterparty to the derivative contract will default on its obligation to pay the Fund the amount owed or otherwise perform under the derivative contract. Derivatives create leverage risk because
they do not require payment up front equal to the economic exposure created by owning the derivative. As a result, an adverse change in the value of the underlying asset could result in the Fund sustaining a loss that is substantially greater than the amount invested in the derivative, which may make the Fund’s returns more volatile and increase the risk of loss. Derivative instruments may also be less liquid than more traditional investments and the Fund may be unable to sell or close out its derivative positions at a desirable time or price. This risk may be more acute under adverse market conditions, during which the Fund may be most in need of liquidating its derivative positions. Derivatives may also be harder to value, less tax efficient and subject to changing government regulation that could impact the Fund’s ability to use certain derivatives or their cost. Also, derivatives used for hedging or to gain or limit exposure to a particular market segment may not provide the expected benefits, particularly during adverse market conditions.
Foreign securities risk. The Fund’s foreign investments may be affected by changes in a foreign country’s exchange rates, political and social instability, changes in economic or taxation policies, difficulties when enforcing obligations, decreased liquidity, and increased volatility. Foreign companies may be subject to less regulation resulting in less publicly available information about the companies.
Hedging risk. A hedge is an investment made in order to reduce the risk of adverse price movements in a security by taking an offsetting position in a related security (often a derivative, such as an option or a short sale). Hedging may be ineffective due to unexpected changes in the market, changes in the values of the security and related security, or changes in the correlation of the security and related security. For gross currency hedges, there is an additional risk that these transactions create exposure to currencies in which the Fund’s securities are not denominated. Moreover, while hedging can reduce or eliminate losses it can also reduce or eliminate gains.
Income risk. The income you receive from the Fund is based primarily on prevailing
interest rates, which can vary widely over the short- and long-term. If interest rates drop, your income from the Fund may drop as well.
Interest rate risk. Interest rate risk refers to the risk that bond prices generally fall as interest rates rise; conversely, bond prices generally rise as interest rates fall. Specific bonds differ in their sensitivity to changes in interest rates depending on their individual characteristics, including duration.
Management risk. The investment techniques and risk analysis used by the Fund’s portfolio managers may not produce the desired results. In addition, the Fund’s investment strategy to manage volatility may cause the Fund to under-perform the broader markets in which the Fund invests during market rallies. Such underperformance could be significant during sudden or significant market rallies.
Market risk. The prices of and the income generated by the Fund’s securities may decline in response to, among other things, investor sentiment, general economic and market conditions, regional or global instability, and currency and interest rate fluctuations.
Preferred securities risk. Preferred securities may include provisions that permit the issuer, in its discretion, to defer or omit distributions for a certain period of time. If the Fund owns a security that is deferring or omitting its distributions, the Fund may be required to report the distribution on its tax returns, even though it may not have received this income. Further, preferred securities may lose substantial value due to the omission or deferment of dividend payments.
Real estate investment trust (REIT)/real estate risk. Investments in real estate related instruments may be affected by economic, legal, cultural, environmental or technological factors that affect property values, rents or occupancies of real estate related to the Fund’s holdings. Shares of real estate related companies, which tend to be small- and mid-cap companies, may be more volatile and less liquid.
Short sales risk. If the Fund sells short a security that it does not own and the security increases in value, the Fund will pay a higher price to repurchase the security. The more the Fund pays, the more
Invesco V.I. Managed Volatility Fund
it will lose on the transaction, which adversely affects its share price. As there is no limit on how much the price of the security can increase, the Fund’s exposure is unlimited.
Small- and mid-capitalization risks. Stocks of small- and mid-sized companies tend to be more vulnerable to adverse developments and may have little or no operating history or track record of success, and limited product lines, markets, management and financial resources. The securities of small- and mid-sized companies may be more volatile due to less market interest and less publicly available information about the issuer. They also may be illiquid or restricted as to resale, or may trade less frequently and in smaller volumes, all of which may cause difficulty when establishing or closing a position at a desirable price.
Value investing style risk. The Fund emphasizes a value style of investing, which focuses on undervalued companies with characteristics for improved valuations. This style of investing is subject to the risk that the valuations never improve or that the returns on value equity securities are less than returns on other styles of investing or the overall stock market. Value stocks also may decline in price, even though in theory they are already underpriced.
Volatility management risk. The risk that the Adviser’s strategy for managing portfolio volatility may not produce the desired result or that the Adviser is unable to trade certain derivatives effectively or in a timely manner. There can be no guarantee that the Fund will maintain its target volatility level. Additionally, maintenance of the target volatility level will not ensure that the Fund will deliver competitive returns. The use of derivatives in connection with the Fund’s managed volatility strategy may expose the Fund to losses (some of which may be sudden) that it would not have otherwise been exposed to if it had only invested directly in equity and/or fixed income securities. Efforts to manage the Fund’s volatility could limit the Fund’s gains in rising markets and may expose the Fund to costs to which it would otherwise not have been exposed. The Fund’s managed volatility strategy may result in the Fund outperforming the general securities market during periods of flat or negative market
performance, and underperforming the general securities market during periods of positive market performance. The gains and losses of the Fund’s futures positions may not correlate with the Fund’s direct investments in equity securities; as a result, these futures contracts may decline in value at the same time as the Fund’s direct investments in equity securities decline in value. The proprietary and third-party risk models used by the Adviser may perform differently than expected and may negatively affect performance and the ability of the Fund to maintain its volatility at or below its target maximum annual volatility level for various reasons, including errors in using or building the models, technical issues implementing the models and various non-quantitative factors (such as, market or trading system dysfunctions, and investor fear or over-reaction).
Zero coupon securities risk. The value, interest rates, and liquidity of non-cash paying instruments, such as zero coupon and pay-in-kind securities, are subject to greater fluctuation than other types of securities. The higher yields and interest rates on pay-in-kind securities reflect the payment deferral and increased credit risk associated with such instruments and that such investments may represent a higher credit risk than coupon loans. Pay-in-kind securities may have a potential variability in valuations because their continuing accruals require continuing judgments about the collectability of the deferred payments and the value of any associated collateral.
About indexes used in this report
The Russell 1000® Value Index is an unmanaged index considered representative of large-cap value stocks. The Russell 1000 Value Index is a trademark/service mark of the Frank Russell Co. Russell® is a trademark of the Frank Russell Co.
The Barclays U.S. Government/ Credit Index includes treasuries and agencies that represent the government portion of the index, and includes publically issued US corporate and foreign debentures and secured notes that meet specified maturity, liquidity and quality requirements.
The Lipper VUF Mixed-Asset Target Allocation Growth Funds Index is an unmanaged index considered
representative of mixed-asset target allocation growth variable insurance underlying funds tracked by Lipper.
The Lipper VUF Equity Income Funds Index is an unmanaged index considered representative of equity income variable insurance underlying funds tracked by Lipper.
The Fund is not managed to track the performance of any particular index, including the index(es) described here, and consequently, the performance of the Fund may deviate significantly from the performance of the index(es).
A direct investment cannot be made in an index. Unless otherwise indicated, index results include reinvested dividends, and they do not reflect sales charges. Performance of the peer group, if applicable, reflects fund expenses; performance of a market index does not.
Other information
The returns shown in management’s discussion of Fund performance are based on net asset values calculated for shareholder transactions. Generally accepted accounting principles require adjustments to be made to the net assets of the Fund at period end for financial reporting purposes, and as such, the net asset values for shareholder transactions and the returns based on those net asset values may differ from the net asset values and returns reported in the Financial Highlights. Additionally, the returns and net asset values shown throughout this report are at the Fund level only and do not include variable product issuer charges. If such charges were included, the total returns would be lower.
Industry classifications used in this report are generally according to the Global Industry Classification Standard, which was developed by and is the exclusive property and a service mark of MSCI Inc. and Standard & Poor’s.
Invesco V.I. Managed Volatility Fund
Schedule of Investments(a)
December 31, 2015
| | | | | | | | |
| | | Shares | | | Value | |
Common Stocks & Other Equity Interests–65.28% | |
| Aerospace & Defense–0.84% | |
General Dynamics Corp. | | | 3,302 | | | $ | 453,563 | |
|
| Agricultural Products–0.68% | |
Archer-Daniels-Midland Co. | | | 10,010 | | | | 367,167 | |
|
| Application Software–0.61% | |
Citrix Systems, Inc.(b) | | | 4,336 | | | | 328,018 | |
|
| Asset Management & Custody Banks–1.70% | |
Northern Trust Corp. | | | 5,509 | | | | 397,144 | |
State Street Corp. | | | 7,830 | | | | 519,599 | |
| | | | | | | | 916,743 | |
|
| Automobile Manufacturers–0.59% | |
General Motors Co. | | | 9,419 | | | | 320,340 | |
|
| Biotechnology–0.82% | |
Amgen Inc. | | | 2,190 | | | | 355,503 | |
Baxalta Inc. | | | 2,221 | | | | 86,685 | |
| | | | | | | | 442,188 | |
|
| Broadcasting–0.17% | |
CBS Corp.–Class B | | | 1,905 | | | | 89,783 | |
|
| Cable & Satellite–1.55% | |
Comcast Corp.–Class A | | | 8,598 | | | | 485,185 | |
Time Warner Cable Inc. | | | 1,876 | | | | 348,167 | |
| | | | | | | | 833,352 | |
|
| Communications Equipment–2.72% | |
Cisco Systems, Inc. | | | 20,986 | | | | 569,875 | |
Juniper Networks, Inc. | | | 16,047 | | | | 442,897 | |
QUALCOMM, Inc. | | | 9,029 | | | | 451,314 | |
| | | | | | | | 1,464,086 | |
|
| Construction Machinery & Heavy Trucks–0.46% | |
Caterpillar Inc. | | | 3,624 | | | | 246,287 | |
|
| Data Processing & Outsourced Services–0.76% | |
PayPal Holdings, Inc.(b) | | | 11,259 | | | | 407,576 | |
|
| Diversified Banks–8.79% | |
Bank of America Corp. | | | 62,108 | | | | 1,045,278 | |
Citigroup Inc. | | | 31,555 | | | | 1,632,971 | |
Comerica Inc. | | | 7,897 | | | | 330,331 | |
JPMorgan Chase & Co.(c) | | | 26,167 | | | | 1,727,807 | |
| | | | | | | | 4,736,387 | |
|
| Electric Utilities–0.54% | |
FirstEnergy Corp. | | | 9,229 | | | | 292,836 | |
|
| Fertilizers & Agricultural Chemicals–0.44% | |
Mosaic Co. (The) | | | 8,637 | | | | 238,295 | |
|
| Food Distributors–0.54% | |
Sysco Corp. | | | 7,088 | | | | 290,608 | |
| | | | | | | | |
| | | Shares | | | Value | |
| General Merchandise Stores–1.20% | |
Target Corp. | | | 8,906 | | | $ | 646,665 | |
|
| Health Care Equipment–1.61% | |
Baxter International Inc. | | | 9,226 | | | | 351,972 | |
Medtronic PLC | | | 6,701 | | | | 515,441 | |
| | | | | | | | 867,413 | |
|
| Health Care Services–0.57% | |
Express Scripts Holding Co.(b) | | | 3,502 | | | | 306,110 | |
|
| Hotels, Resorts & Cruise Lines–1.32% | |
Carnival Corp. | | | 13,087 | | | | 712,980 | |
|
| Household Products–0.88% | |
Procter & Gamble Co. (The) | | | 5,963 | | | | 473,522 | |
|
| Hypermarkets & Super Centers–1.06% | |
Wal-Mart Stores, Inc. | | | 9,319 | | | | 571,255 | |
|
| Industrial Conglomerates–2.50% | |
General Electric Co. | | | 43,274 | | | | 1,347,985 | |
|
| Industrial Machinery–0.54% | |
Ingersoll-Rand PLC | | | 5,271 | | | | 291,433 | |
|
| Insurance Brokers–2.09% | |
Aon PLC | | | 4,071 | | | | 375,387 | |
Marsh & McLennan Cos., Inc. | | | 7,069 | | | | 391,976 | |
Willis Group Holdings PLC | | | 7,350 | | | | 356,989 | |
| | | | | | | | 1,124,352 | |
|
| Integrated Oil & Gas–3.13% | |
Exxon Mobil Corp. | | | 4,039 | | | | 314,840 | |
Occidental Petroleum Corp. | | | 5,159 | | | | 348,800 | |
Royal Dutch Shell PLC–Class A (United Kingdom) | | | 27,892 | | | | 626,615 | |
TOTAL S.A. (France) | | | 8,844 | | | | 393,875 | |
| | | | | | | | 1,684,130 | |
|
| Integrated Telecommunication Services–1.12% | |
Koninklijke KPN N.V. (Netherlands) | | | 26,771 | | | | 101,088 | |
Orange S.A. (France) | | | 6,004 | | | | 100,725 | |
Telecom Italia S.p.A. (Italy)(b) | | | 56,069 | | | | 70,670 | |
Telefónica, S.A. (Spain) | | | 4,742 | | | | 52,341 | |
Verizon Communications Inc. | | | 6,021 | | | | 278,291 | |
| | | | | | | | 603,115 | |
|
| Internet Software & Services–0.70% | |
eBay Inc.(b) | | | 13,770 | | | | 378,399 | |
|
| Investment Banking & Brokerage–3.05% | |
Charles Schwab Corp. (The) | | | 12,047 | | | | 396,708 | |
Goldman Sachs Group, Inc. (The) | | | 2,149 | | | | 387,314 | |
Morgan Stanley | | | 27,032 | | | | 859,888 | |
| | | | | | | | 1,643,910 | |
See accompanying Notes to Financial Statements which are an integral part of the financial statements.
Invesco V.I. Managed Volatility Fund
| | | | | | | | |
| | | Shares | | | Value | |
| IT Consulting & Other Services–0.43% | |
Amdocs Ltd. | | | 4,238 | | | $ | 231,268 | |
|
| Managed Health Care–0.99% | |
Anthem, Inc. | | | 1,980 | | | | 276,091 | |
UnitedHealth Group Inc. | | | 2,182 | | | | 256,691 | |
| | | | | | | | 532,782 | |
|
| Movies & Entertainment–0.47% | |
Time Warner Inc. | | | 3,931 | | | | 254,218 | |
|
| Multi-Utilities–0.52% | |
PG&E Corp. | | | 5,265 | | | | 280,045 | |
|
| Oil & Gas Equipment & Services–1.24% | |
Baker Hughes Inc. | | | 7,167 | | | | 330,757 | |
Weatherford International PLC(b) | | | 39,910 | | | | 334,845 | |
| | | | | | | | 665,602 | |
|
| Oil & Gas Exploration & Production–2.52% | |
Anadarko Petroleum Corp. | | | 3,228 | | | | 156,816 | |
Apache Corp. | | | 12,524 | | | | 556,942 | |
Canadian Natural Resources Ltd. (Canada) | | | 15,515 | | | | 338,738 | |
Devon Energy Corp. | | | 9,515 | | | | 304,480 | |
| | | | | | | | 1,356,976 | |
|
| Other Diversified Financial Services–0.82% | |
Voya Financial, Inc. | | | 11,987 | | | | 442,440 | |
|
| Packaged Foods & Meats–0.91% | |
Mondelez International, Inc.–Class A | | | 10,900 | | | | 488,756 | |
|
| Pharmaceuticals–5.15% | |
Eli Lilly and Co. | | | 4,992 | | | | 420,626 | |
Merck & Co., Inc. | | | 12,134 | | | | 640,918 | |
Novartis AG (Switzerland) | | | 5,780 | | | | 494,030 | |
Pfizer Inc. | | | 11,361 | | | | 366,733 | |
Sanofi (France) | | | 4,087 | | | | 349,106 | |
Teva Pharmaceutical Industries Ltd.–ADR (Israel) | | | 7,624 | | | | 500,439 | |
| | | | | | | | 2,771,852 | |
|
| Publishing–0.47% | |
Thomson Reuters Corp. | | | 6,705 | | | | 253,881 | |
|
| Railroads–0.60% | |
CSX Corp. | | | 12,503 | | | | 324,453 | |
|
| Regional Banks–4.34% | |
BB&T Corp. | | | 8,345 | | | | 315,524 | |
Citizens Financial Group Inc. | | | 26,278 | | | | 688,221 | |
Fifth Third Bancorp | | | 19,932 | | | | 400,633 | |
First Horizon National Corp. | | | 16,205 | | | | 235,297 | |
PNC Financial Services Group, Inc. (The) | | | 7,316 | | | | 697,288 | |
| | | | | | | | 2,336,963 | |
|
| Security & Alarm Services–0.62% | |
Tyco International PLC | | | 10,522 | | | | 335,546 | |
| | | | | | | | |
| | | Shares | | | Value | |
| Semiconductor Equipment–0.71% | |
Applied Materials, Inc. | | | 20,418 | | | $ | 381,204 | |
|
| Semiconductors–0.90% | |
Intel Corp. | | | 14,086 | | | | 485,263 | |
|
| Specialized Finance–0.43% | |
CME Group Inc.–Class A | | | 2,577 | | | | 233,476 | |
|
| Systems Software–0.93% | |
Microsoft Corp. | | | 9,009 | | | | 499,819 | |
|
| Technology Hardware, Storage & Peripherals–0.64% | |
NetApp, Inc. | | | 12,989 | | | | 344,598 | |
|
| Tobacco–0.96% | |
Philip Morris International Inc. | | | 5,879 | | | | 516,823 | |
|
| Wireless Telecommunication Services–0.65% | |
Vodafone Group PLC–ADR (United Kingdom) | | | 10,765 | | | | 347,279 | |
Total Common Stocks & Other Equity Interests
(Cost $34,867,938) | | | | 35,161,742 | |
| | |
| | | Principal
Amount | | | | |
Bonds and Notes–25.91% | |
| Aerospace & Defense–0.24% | |
Boeing Capital Corp., Sr. Unsec. Notes, 2.13%, 08/15/2016 | | $ | 35,000 | | | | 35,251 | |
L-3 Communications Corp., Sr. Unsec. Gtd. Global Notes, 3.95%, 05/28/2024 | | | 52,000 | | | | 49,475 | |
Lockheed Martin Corp., Sr. Unsec. Global Notes, 2.13%, 09/15/2016 | | | 35,000 | | | | 35,215 | |
Northrop Grumman Corp., Sr. Unsec. Global Notes, 3.85%, 04/15/2045 | | | 10,000 | | | | 8,909 | |
| | | | | | | | 128,850 | |
|
| Airlines–0.16% | |
American Airlines Pass Through Trust, Series 2014-1, Class A, Sr. Sec. First Lien Pass Through Ctfs., 3.70%, 10/01/2026 | | | 23,546 | | | | 23,649 | |
Continental Airlines Pass Through Trust, Series 2009-1, Sr. Sec. First Lien Pass Through Ctfs., 9.00%, 07/08/2016 | | | 17,071 | | | | 17,645 | |
United Airlines Pass Through Trust, Series 2014-2, Class A, Sr. Sec. First Lien Pass Through Ctfs., 3.75%, 09/03/2026 | | | 30,000 | | | | 30,356 | |
Virgin Australia Pass Through Trust (Australia), Series 2013-1, Class A, Sec. Gtd. Pass Through Ctfs., 5.00%, 10/23/2023(d) | | | 14,696 | | | | 15,095 | |
| | | | | | | | 86,745 | |
|
| Apparel Retail–0.03% | |
Ross Stores, Inc., Sr. Unsec. Notes, 3.38%, 09/15/2024 | | | 19,000 | | | | 18,745 | |
See accompanying Notes to Financial Statements which are an integral part of the financial statements.
Invesco V.I. Managed Volatility Fund
| | | | | | | | |
| | | Principal
Amount | | | Value | |
| Apparel, Accessories & Luxury Goods–0.14% | |
Iconix Brand Group Inc., | | | | | | | | |
Sr. Unsec. Sub. Conv. Bonds, 1.50%, 03/15/2018 | | $ | 66,000 | | | $ | 32,670 | |
Sr. Unsec. Sub. Conv. Notes, 2.50%, 06/01/2016 | | | 49,000 | | | | 44,100 | |
| | | | | | | | 76,770 | |
|
| Application Software–0.64% | |
Citrix Systems, Inc., Sr. Unsec. Conv. Bonds, 0.50%, 04/15/2019 | | | 268,000 | | | | 292,790 | |
Nuance Communications, Inc., Sr. Unsec. Conv. Notes, 1.00%, 12/15/2022(d)(e) | | | 51,000 | | | | 49,311 | |
| | | | | | | | 342,101 | |
|
| Asset Management & Custody Banks–0.51% | |
Apollo Management Holdings L.P., Sr. Unsec. Gtd. Notes, 4.00%, 05/30/2024(d) | | | 40,000 | | | | 39,554 | |
Blackstone Holdings Finance Co. LLC, Sr. Unsec. Gtd. Notes,
5.00%, 06/15/2044(d) | | | 150,000 | | | | 153,784 | |
KKR Group Finance Co. III LLC, Sr. Unsec. Gtd. Bonds, 5.13%, 06/01/2044(d) | | | 85,000 | | | | 83,613 | |
| | | | | | | | 276,951 | |
|
| Auto Parts & Equipment–0.28% | |
Johnson Controls, Inc., Sr. Unsec. Notes, 5.50%, 01/15/2016 | | | 150,000 | | | | 150,180 | |
|
| Automobile Manufacturers–0.37% | |
Ford Motor Credit Co. LLC, Sr. Unsec. Global Notes, 4.13%, 08/04/2025 | | | 200,000 | | | | 199,744 | |
|
| Biotechnology–0.72% | |
AbbVie Inc., Sr. Unsec. Global Notes, 4.50%, 05/14/2035 | | | 38,000 | | | | 37,344 | |
Amgen Inc., Sr. Unsec. Notes, 2.30%, 06/15/2016 | | | 35,000 | | | | 35,208 | |
BioMarin Pharmaceutical Inc., Sr. Unsec. Sub. Conv. Notes, 1.50%, 10/15/2020 | | | 115,000 | | | | 154,244 | |
Celgene Corp., Sr. Unsec. Global Notes, | | | | | | | | |
4.63%, 05/15/2044 | | | 100,000 | | | | 94,987 | |
5.00%, 08/15/2045 | | | 9,000 | | | | 9,075 | |
Gilead Sciences, Inc., Sr. Unsec. Global Notes, | | | | | | | | |
3.05%, 12/01/2016 | | | 30,000 | | | | 30,516 | |
4.40%, 12/01/2021 | | | 25,000 | | | | 26,973 | |
| | | | | | | | 388,347 | |
|
| Brewers–0.07% | |
Anheuser-Busch InBev Worldwide Inc. (Belgium), Sr. Unsec. Gtd. Global Notes, 2.88%, 02/15/2016 | | | 40,000 | | | | 40,091 | |
|
| Broadcasting–0.59% | |
Liberty Media Corp., Sr. Unsec. Conv. Bonds, 1.38%, 10/15/2023 | | | 324,000 | | | | 318,938 | |
|
| Cable & Satellite–0.79% | |
CCO Safari II, LLC, Sr. Sec. Gtd. First Lien Notes, 4.46%, 07/23/2022(d) | | | 60,000 | | | | 59,995 | |
| | | | | | | | |
| | | Principal
Amount | | | Value | |
| Cable & Satellite–(continued) | |
Comcast Corp., | | | | | | | | |
Sr. Unsec. Gtd. Global Notes, 5.70%, 05/15/2018 | | $ | 150,000 | | | $ | 164,154 | |
Sr. Unsec. Gtd. Notes, 4.40%, 08/15/2035 | | | 35,000 | | | | 35,479 | |
Cox Communications, Inc., Sr. Unsec. Notes, 8.38%, 03/01/2039(d) | | | 150,000 | | | | 165,253 | |
| | | | | | | | 424,881 | |
|
| Catalog Retail–0.31% | |
Liberty Interactive LLC, Sr. Unsec. Conv. Global Deb., 0.75%, 03/30/2023(e) | | | 81,000 | | | | 122,209 | |
QVC, Inc., Sr. Sec. Gtd. First Lien Global Notes, 5.45%, 08/15/2034 | | | 50,000 | | | | 43,377 | |
| | | | | | | | 165,586 | |
|
| Communications Equipment–0.48% | |
Ciena Corp., Sr. Unsec. Conv. Notes, 4.00%, 12/15/2020(d) | | | 81,000 | | | | 105,604 | |
Viavi Solutions Inc., Sr. Unsec. Conv. Deb., 0.63%, 08/15/2018(e) | | | 165,000 | | | | 155,409 | |
| | | | | | | | 261,013 | |
|
| Consumer Finance–0.03% | |
American Express Co., Unsec. Sub. Global Notes, 3.63%, 12/05/2024 | | | 18,000 | | | | 17,857 | |
|
| Data Processing & Outsourced Services–0.23% | |
Visa Inc., Sr. Unsec. Global Notes, | | | | | | | | |
3.15%, 12/14/2025 | | | 40,000 | | | | 40,152 | |
4.15%, 12/14/2035 | | | 30,000 | | | | 30,384 | |
4.30%, 12/14/2045 | | | 20,000 | | | | 20,353 | |
Xerox Corp., Sr. Unsec. Global Notes, 4.80%, 03/01/2035 | | | 38,000 | | | | 35,273 | |
| | | | | | | | 126,162 | |
|
| Diversified Banks–1.91% | |
Abbey National Treasury Services PLC (United Kingdom), Sr. Unsec. Gtd. Global Notes, 4.00%, 04/27/2016 | | | 115,000 | | | | 116,043 | |
BNP Paribas S.A. (France), Unsec. Sub. Gtd. Medium-Term Notes, 4.25%, 10/15/2024 | | | 200,000 | | | | 198,470 | |
Citigroup Inc., Unsec. Sub. Notes, 4.00%, 08/05/2024 | | | 60,000 | | | | 59,654 | |
HSBC Finance Corp., Sr. Unsec. Global Notes, 5.50%, 01/19/2016 | | | 100,000 | | | | 100,166 | |
JPMorgan Chase & Co.,
Unsec. Sub. Global Notes, 4.25%, 10/01/2027 | | | 15,000 | | | | 14,937 | |
Series V, Jr. Unsec. Sub. Global Notes, 5.00%(f) | | | 150,000 | | | | 143,250 | |
Series X, Jr. Unsec. Sub. Global Notes, 6.10%(f) | | | 60,000 | | | | 60,750 | |
Series Z, Jr. Unsec. Sub. Global Notes, 5.30%(f) | | | 40,000 | | | | 40,050 | |
See accompanying Notes to Financial Statements which are an integral part of the financial statements.
Invesco V.I. Managed Volatility Fund
| | | | | | | | |
| | | Principal
Amount | | | Value | |
| Diversified Banks–(continued) | |
Wells Fargo & Co.,
Sr. Unsec. Medium-Term Notes, 3.55%, 09/29/2025 | | $ | 30,000 | | | $ | 30,282 | |
Sr. Unsec. Notes, 3.90%, 05/01/2045 | | | 75,000 | | | | 68,788 | |
Unsec. Sub. Medium-Term Notes, | | | | | | | | |
4.10%, 06/03/2026 | | | 95,000 | | | | 96,285 | |
4.65%, 11/04/2044 | | | 100,000 | | | | 97,732 | |
| | | | | | | | 1,026,407 | |
|
| Diversified Chemicals–0.08% | |
Eastman Chemical Co., Sr. Unsec. Global Notes, 2.70%, 01/15/2020 | | | 43,000 | | | | 42,589 | |
|
| Diversified Real Estate Activities–0.05% | |
Brookfield Asset Management Inc. (Canada), Sr. Unsec. Notes, 4.00%, 01/15/2025 | | | 25,000 | | | | 24,471 | |
|
| Drug Retail–0.14% | |
CVS Health Corp., Sr. Unsec. Global Bonds, 3.38%, 08/12/2024 | | | 20,000 | | | | 19,808 | |
Walgreens Boots Alliance Inc., Sr. Unsec. Global Notes, | | | | | | | | |
3.30%, 11/18/2021 | | | 32,000 | | | | 31,390 | |
4.50%, 11/18/2034 | | | 24,000 | | | | 21,979 | |
| | | | | | | | 73,177 | |
|
| Electric Utilities–0.08% | |
Georgia Power Co., Sr. Unsec. Notes, 3.00%, 04/15/2016 | | | 45,000 | | | | 45,249 | |
|
| Environmental & Facilities Services–0.04% | |
Waste Management, Inc., Sr. Unsec. Gtd. Global Notes, 3.90%, 03/01/2035 | | | 25,000 | | | | 23,467 | |
|
| Fertilizers & Agricultural Chemicals–0.03% | |
Monsanto Co., Sr. Unsec. Global Notes, 2.13%, 07/15/2019 | | | 15,000 | | | | 14,986 | |
|
| Food Retail–0.10% | |
Kraft Heinz Co. (The), Sr. Unsec. Gtd. Notes, 1.60%, 06/30/2017(d) | | | 56,000 | | | | 55,862 | |
|
| General Merchandise Stores–0.23% | |
Dollar General Corp., Sr. Unsec. Global Notes, 3.25%, 04/15/2023 | | | 20,000 | | | | 19,115 | |
Target Corp., Sr. Unsec. Notes, 5.88%, 07/15/2016 | | | 100,000 | | | | 102,616 | |
| | | | | | | | 121,731 | |
|
| Health Care Distributors–0.17% | |
McKesson Corp., Sr. Unsec. Notes, 3.25%, 03/01/2016 | | | 90,000 | | | | 90,324 | |
|
| Health Care Equipment–1.27% | |
Becton, Dickinson and Co.,
Sr. Unsec. Global Bonds, 4.88%, 05/15/2044 | | | 170,000 | | | | 172,335 | |
Sr. Unsec. Global Notes, 1.75%, 11/08/2016 | | | 15,000 | | | | 15,082 | |
3.88%, 05/15/2024 | | | 165,000 | | | | 167,945 | |
Sr. Unsec. Notes, 2.68%, 12/15/2019 | | | 17,000 | | | | 17,115 | |
| | | | | | | | |
| | | Principal
Amount | | | Value | |
| Health Care Equipment–(continued) | |
Medtronic, Inc., Sr. Unsec. Gtd. Global Notes, | | | | | | | | |
3.15%, 03/15/2022 | | $ | 58,000 | | | $ | 58,707 | |
4.38%, 03/15/2035 | | | 21,000 | | | | 21,270 | |
NuVasive Inc., Sr. Unsec. Conv. Notes, 2.75%, 07/01/2017 | | | 94,000 | | | | 128,721 | |
Wright Medical Group, Inc., Sr. Unsec. Conv. Notes, 2.00%, 02/15/2020(d) | | | 101,000 | | | | 104,977 | |
| | | | | | | | 686,152 | |
|
| Health Care Facilities–0.80% | |
Brookdale Senior Living Inc., Sr. Unsec. Conv. Notes, 2.75%, 06/15/2018 | | | 174,000 | | | | 173,891 | |
HealthSouth Corp., Sr. Unsec. Sub. Conv. Notes, 2.00%, 12/01/2020(e) | | | 235,000 | | | | 254,388 | |
| | | | | | | | 428,279 | |
|
| Health Care REIT’s–0.05% | |
HCP, Inc., Sr. Unsec. Global Notes, 3.88%, 08/15/2024 | | | 25,000 | | | | 24,320 | |
|
| Health Care Services–0.38% | |
Express Scripts Holding Co.,
Sr. Unsec. Gtd. Global Notes, 2.25%, 06/15/2019 | | | 30,000 | | | | 29,810 | |
Sr. Unsec. Gtd. Notes, 3.13%, 05/15/2016 | | | 120,000 | | | | 120,818 | |
Laboratory Corp. of America Holdings, Sr. Unsec. Notes, | | | | | | | | |
3.20%, 02/01/2022 | | | 33,000 | | | | 32,471 | |
4.70%, 02/01/2045 | | | 22,000 | | | | 20,188 | |
| | | | | | | | 203,287 | |
|
| Industrial Machinery–0.04% | |
Valmont Industries, Inc., Sr. Unsec. Gtd. Global Notes, 5.25%, 10/01/2054 | | | 22,000 | | | | 18,815 | |
|
| Integrated Oil & Gas–0.17% | |
Chevron Corp., Sr. Unsec. Global Notes, 1.37%, 03/02/2018 | | | 77,000 | | | | 76,390 | |
Suncor Energy Inc. (Canada), Sr. Unsec. Notes, 3.60%, 12/01/2024 | | | 18,000 | | | | 17,095 | |
| | | | | | | | 93,485 | |
|
| Integrated Telecommunication Services–0.93% | |
AT&T Inc., Sr. Unsec. Global Notes, | | | | | | | | |
3.00%, 06/30/2022 | | | 28,000 | | | | 27,265 | |
3.40%, 05/15/2025 | | | 15,000 | | | | 14,444 | |
4.50%, 05/15/2035 | | | 25,000 | | | | 23,296 | |
DIRECTV Holdings LLC/ DIRECTV Financing Co., Inc., Sr. Unsec. Gtd. Global Notes, 5.15%, 03/15/2042 | | | 150,000 | | | | 140,271 | |
Telefonica Emisiones S.A.U. (Spain), Sr. Unsec. Gtd. Global Notes, 7.05%, 06/20/2036 | | | 150,000 | | | | 182,065 | |
Verizon Communications Inc., Sr. Unsec. Global Notes, 4.40%, 11/01/2034 | | | 120,000 | | | | 112,452 | |
| | | | | | | | 499,793 | |
See accompanying Notes to Financial Statements which are an integral part of the financial statements.
Invesco V.I. Managed Volatility Fund
| | | | | | | | |
| | | Principal
Amount | | | Value | |
| Internet Retail–0.02% | |
Amazon.com, Inc., Sr. Unsec. Global Notes, 4.80%, 12/05/2034 | | $ | 9,000 | | | $ | 9,458 | |
|
| Investment Banking & Brokerage–0.85% | |
Goldman Sachs Group, Inc. (The), Unsec. Sub. Notes, 4.25%, 10/21/2025 | | | 27,000 | | | | 26,860 | |
Jefferies Group LLC, Sr. Unsec. Conv. Deb., 3.88%, 11/01/2017(e) | | | 163,000 | | | | 162,796 | |
Lazard Group LLC, Sr. Unsec. Global Notes, 3.75%, 02/13/2025 | | | 62,000 | | | | 57,307 | |
Morgan Stanley, Sr. Unsec. Medium-Term Global Notes, | | | | | | | | |
2.38%, 07/23/2019 | | | 175,000 | | | | 174,595 | |
4.00%, 07/23/2025 | | | 35,000 | | | | 36,136 | |
| | | | | | | | 457,694 | |
|
| Life & Health Insurance–0.05% | |
MetLife, Inc., Sr. Unsec. Global Notes, 4.60%, 05/13/2046 | | | 25,000 | | | | 25,304 | |
|
| Movies & Entertainment–0.14% | |
Live Nation Entertainment, Inc., Sr. Unsec. Conv. Bonds, 2.50%, 05/15/2019 | | | 61,000 | | | | 62,334 | |
Viacom Inc., Sr. Unsec. Global Deb., 4.85%, 12/15/2034 | | | 19,000 | | | | 15,566 | |
| | | | | | | | 77,900 | |
|
| Multi-Line Insurance–0.66% | |
American Financial Group, Inc., Sr. Unsec. Notes, 9.88%, 06/15/2019 | | | 150,000 | | | | 182,088 | |
American International Group, Inc., Sr. Unsec. Global Notes, | | | | | | | | |
2.30%, 07/16/2019 | | | 20,000 | | | | 19,867 | |
4.38%, 01/15/2055 | | | 40,000 | | | | 34,626 | |
Farmers Exchange Capital III, Unsec. Sub. Notes, 5.45%, 10/15/2054(d) | | | 70,000 | | | | 68,373 | |
Nationwide Financial Services Inc., Sr. Unsec. Notes, 5.30%, 11/18/2044(d) | | | 50,000 | | | | 50,250 | |
| | | | | | | | 355,204 | |
|
| Multi-Utilities–0.33% | |
Enable Midstream Partners, LP, Sr. Unsec. Gtd. Global Notes, 2.40%, 05/15/2019 | | | 200,000 | | | | 180,116 | |
|
| Office REIT’s–0.27% | |
Highwoods Realty L.P., Sr. Unsec. Notes, 3.20%, 06/15/2021 | | | 150,000 | | | | 146,814 | |
|
| Oil & Gas Equipment & Services–0.12% | |
Helix Energy Solutions Group, Inc., Sr. Unsec. Conv. Notes, 3.25%, 03/15/2018(e) | | | 84,000 | | | | 66,623 | |
|
| Oil & Gas Exploration & Production–0.59% | |
Cobalt International Energy Inc., Sr. Unsec. Conv. Notes, 2.63%, 12/01/2019 | | | 129,000 | | | | 73,611 | |
ConocoPhillips Co., Sr. Unsec. Gtd. Global Notes, | | | | | | | | |
2.88%, 11/15/2021 | | | 46,000 | | | | 44,737 | |
4.15%, 11/15/2034 | | | 49,000 | | | | 42,671 | |
| | | | | | | | |
| | | Principal
Amount | | | Value | |
| Oil & Gas Exploration & Production–(continued) | |
Devon Energy Corp., Sr. Unsec. Global Notes, | | | | | | | | |
2.25%, 12/15/2018 | | $ | 25,000 | | | $ | 23,047 | |
3.25%, 05/15/2022 | | | 6,000 | | | | 5,097 | |
Stone Energy Corp., Sr. Unsec. Gtd. Conv. Notes, 1.75%, 03/01/2017 | | | 174,000 | | | | 129,412 | |
| | | | | | | | 318,575 | |
|
| Oil & Gas Storage & Transportation–0.48% | |
Energy Transfer Partners, L.P., Sr. Unsec. Notes, 4.90%, 03/15/2035 | | | 19,000 | | | | 13,852 | |
Enterprise Products Operating LLC, Sr. Unsec. Gtd. Notes, | | | | | | | | |
3.20%, 02/01/2016 | | | 150,000 | | | | 150,051 | |
2.55%, 10/15/2019 | | | 20,000 | | | | 19,180 | |
Kinder Morgan Inc., Sr. Unsec. Gtd. Notes, 5.30%, 12/01/2034 | | | 23,000 | | | | 18,113 | |
Spectra Energy Partners, L.P., Sr. Unsec. Notes, 2.95%, 06/15/2016 | | | 55,000 | | | | 55,246 | |
Williams Partners L.P., Sr. Unsec. Global Notes, 5.10%, 09/15/2045 | | | 2,000 | | | | 1,320 | |
| | | | | | | | 257,762 | |
|
| Other Diversified Financial Services–0.15% | |
Athene Global Funding, Sec. Notes, 2.88%, 10/23/2018(d) | | | 31,000 | | | | 30,511 | |
ERAC USA Finance LLC, Sr. Unsec. Gtd. Notes, 2.35%, 10/15/2019(d) | | | 50,000 | | | | 49,263 | |
| | | | | | | | 79,774 | |
|
| Packaged Foods & Meats–0.72% | |
ConAgra Foods, Inc., Sr. Unsec. Global Notes, 1.30%, 01/25/2016 | | | 30,000 | | | | 30,004 | |
General Mills, Inc., Sr. Unsec. Global Notes, 0.88%, 01/29/2016 | | | 45,000 | | | | 44,996 | |
2.20%, 10/21/2019 | | | 45,000 | | | | 45,173 | |
Grupo Bimbo S.A.B. de C.V. (Mexico), Sr. Unsec. Gtd. Notes,
3.88%, 06/27/2024(d) | | | 200,000 | | | | 194,498 | |
Mead Johnson Nutrition Co., Sr. Unsec. Global Notes, 4.13%, 11/15/2025 | | | 3,000 | | | | 3,027 | |
Mondelez International, Inc., Sr. Unsec. Global Notes, 4.13%, 02/09/2016 | | | 60,000 | | | | 60,165 | |
Tyson Foods, Inc., Sr. Unsec. Gtd. Global Bonds, 4.88%, 08/15/2034 | | | 11,000 | | | | 11,256 | |
| | | | | | | | 389,119 | |
|
| Personal Products–0.19% | |
Unilever Capital Corp. (Netherlands), Sr. Unsec. Gtd. Global Notes, 2.75%, 02/10/2016 | | | 100,000 | | | | 100,210 | |
|
| Pharmaceuticals–1.63% | |
Actavis Funding SCS, Sr. Unsec. Gtd. Global Notes, | | | | | | | | |
1.85%, 03/01/2017 | | | 49,000 | | | | 49,010 | |
4.85%, 06/15/2044 | | | 150,000 | | | | 148,898 | |
See accompanying Notes to Financial Statements which are an integral part of the financial statements.
Invesco V.I. Managed Volatility Fund
| | | | | | | | |
| | | Principal
Amount | | | Value | |
| Pharmaceuticals–(continued) | |
Allergan, Inc., Sr. Unsec. Gtd. Global Notes, 5.75%, 04/01/2016 | | $ | 50,000 | | | $ | 50,551 | |
Bayer US Finance LLC (Germany), Sr. Unsec. Gtd. Notes, 3.00%, 10/08/2021(d) | | | 200,000 | | | | 202,052 | |
Jazz Investments I Ltd., Sr. Unsec. Gtd. Conv. Bonds, 1.88%, 08/15/2021 | | | 76,000 | | | | 79,895 | |
Merck & Co., Inc., Sr. Unsec. Global Notes, 0.70%, 05/18/2016 | | | 100,000 | | | | 100,013 | |
Sanofi (France), Sr. Unsec. Global Notes, 2.63%, 03/29/2016 | | | 145,000 | | | | 145,609 | |
Zoetis Inc., Sr. Unsec. Global Notes, 1.15%, 02/01/2016 | | | 100,000 | | | | 99,995 | |
| | | | | | | | 876,023 | |
|
| Property & Casualty Insurance–0.31% | |
Liberty Mutual Group Inc., Sr. Unsec. Gtd. Bonds, 4.85%, 08/01/2044(d) | | | 100,000 | | | | 94,105 | |
Old Republic International Corp., Sr. Unsec. Conv. Notes, 3.75%, 03/15/2018 | | | 57,000 | | | | 72,461 | |
| | | | | | | | 166,566 | |
|
| Railroads–0.08% | |
Canadian National Railway Co. (Canada), Sr. Unsec. Notes, 5.80%, 06/01/2016 | | | 20,000 | | | | 20,403 | |
Union Pacific Corp., Sr. Unsec. Notes, 4.15%, 01/15/2045 | | | 25,000 | | | | 24,726 | |
| | | | | | | | 45,129 | |
|
| Regional Banks–0.55% | |
BB&T Corp., Series A, Sr. Unsec. Medium-Term Notes, 3.20%, 03/15/2016 | | | 40,000 | | | | 40,106 | |
Fifth Third Bancorp, Sr. Unsec. Notes, 3.63%, 01/25/2016 | | | 140,000 | | | | 140,221 | |
SunTrust Banks, Inc., Sr. Unsec. Notes, 3.60%, 04/15/2016 | | | 115,000 | | | | 115,619 | |
| | | | | | | | 295,946 | |
|
| Renewable Electricity–0.27% | |
Oglethorpe Power Corp., Sr. Sec. First Mortgage Bonds, 4.55%, 06/01/2044 | | | 150,000 | | | | 142,747 | |
|
| Research & Consulting Services–0.04% | |
Verisk Analytics, Inc., Sr. Unsec. Global Notes, 5.50%, 06/15/2045 | | | 25,000 | | | | 23,927 | |
|
| Retail REIT’s–0.28% | |
Realty Income Corp., Sr. Unsec. Notes, 2.00%, 01/31/2018 | | | 150,000 | | | | 150,080 | |
|
| Semiconductor Equipment–0.59% | |
Lam Research Corp.,
Sr. Unsec. Global Notes, 3.80%, 03/15/2025 | | | 35,000 | | | | 33,209 | |
Series B, Sr. Unsec. Conv. Notes, 1.25%, 05/15/2018 | | | 198,000 | | | | 284,501 | |
| | | | | | | | 317,710 | |
|
| Semiconductors–1.78% | |
Microchip Technology Inc., Sr. Unsec. Sub. Conv. Notes, 1.63%, 02/15/2025(d) | | | 94,000 | | | | 93,882 | |
| | | | | | | | |
| | | Principal
Amount | | | Value | |
| Semiconductors–(continued) | |
Micron Technology, Inc., Series G, Sr. Unsec. Conv. Global Bonds, 3.00%, 11/15/2028(e) | | $ | 243,000 | | | $ | 203,209 | |
NVIDIA Corp., Sr. Unsec. Conv. Bonds, 1.00%, 12/01/2018 | | | 297,000 | | | | 496,176 | |
ON Semiconductor Corp., Sr. Unsec. Gtd. Conv. Notes, 1.00%, 12/01/2020(d) | | | 174,000 | | | | 162,907 | |
| | | | | | | | 956,174 | |
|
| Soft Drinks–0.45% | |
Coca-Cola Co. (The), Sr. Unsec. Global Notes, 1.80%, 09/01/2016 | | | 30,000 | | | | 30,190 | |
Dr Pepper Snapple Group, Inc., Sr. Unsec. Gtd. Global Notes, 2.90%, 01/15/2016 | | | 80,000 | | | | 80,042 | |
PepsiCo, Inc., Sr. Unsec. Notes, 2.50%, 05/10/2016 | | | 130,000 | | | | 130,822 | |
| | | | | | | | 241,054 | |
|
| Specialized Finance–0.64% | |
Air Lease Corp., Sr. Unsec. Global Notes, | | | | | | | | |
2.63%, 09/04/2018 | | | 45,000 | | | | 44,609 | |
4.25%, 09/15/2024 | | | 35,000 | | | | 34,453 | |
Aviation Capital Group Corp., Sr. Unsec. Notes, | | | | | | | | |
2.88%, 09/17/2018(d) | | | 35,000 | | | | 34,698 | |
4.88%, 10/01/2025(d) | | | 40,000 | | | | 39,965 | |
Intercontinental Exchange, Inc., Sr. Unsec. Gtd. Global Notes, 3.75%, 12/01/2025 | | | 30,000 | | | | 30,110 | |
Moody’s Corp., Sr. Unsec. Global Notes, 4.88%, 02/15/2024 | | | 150,000 | | | | 160,238 | |
| | | | | | | | 344,073 | |
|
| Specialty Stores–0.06% | |
GNC Holdings, Inc., Sr. Unsec. Gtd. Conv. Notes, 1.50%, 08/15/2020(d) | | | 42,000 | | | | 33,836 | |
|
| Systems Software–0.58% | |
FireEye, Inc., | | | | | | | | |
Series A, Sr. Unsec. Conv. Notes, 1.00%, 06/01/2020(d)(e) | | | 52,000 | | | | 44,492 | |
Series B, Sr. Unsec. Conv. Notes, 1.63%, 06/01/2022(d)(e) | | | 52,000 | | | | 41,958 | |
Microsoft Corp., Sr. Unsec. Global Notes, 3.50%, 02/12/2035 | | | 37,000 | | | | 34,191 | |
NetSuite Inc., Sr. Unsec. Conv. Notes, 0.25%, 06/01/2018 | | | 162,000 | | | | 160,380 | |
Oracle Corp., Sr. Unsec. Global Notes, 4.30%, 07/08/2034 | | | 30,000 | | | | 29,808 | |
| | | | | | | | 310,829 | |
|
| Technology Hardware, Storage & Peripherals–0.86% | |
Apple Inc., Sr. Unsec. Global Notes, 2.15%, 02/09/2022 | | | 39,000 | | | | 38,027 | |
Hewlett Packard Enterprise Co., Sr. Unsec. Gtd. Notes, | | | | | | | | |
2.85%, 10/05/2018(d) | | | 65,000 | | | | 65,006 | |
6.20%, 10/15/2035(d) | | | 35,000 | | | | 33,814 | |
See accompanying Notes to Financial Statements which are an integral part of the financial statements.
Invesco V.I. Managed Volatility Fund
| | | | | | | | |
| | | Principal
Amount | | | Value | |
| Technology Hardware, Storage & Peripherals–(continued) | |
SanDisk Corp., Sr. Unsec. Conv. Bonds, 0.50%, 10/15/2020 | | $ | 237,000 | | | $ | 246,480 | |
Seagate HDD Cayman,
Sr. Unsec. Gtd. Global Bonds, 4.75%, 01/01/2025 | | | 65,000 | | | | 54,438 | |
Sr. Unsec. Gtd. Notes,
5.75%, 12/01/2034(d) | | | 37,000 | | | | 26,455 | |
| | | | | | | | 464,220 | |
|
| Thrifts & Mortgage Finance–0.69% | |
MGIC Investment Corp., Sr. Unsec. Conv. Notes, | | | | | | | | |
5.00%, 05/01/2017 | | | 170,000 | | | | 175,737 | |
2.00%, 04/01/2020 | | | 46,000 | | | | 64,170 | |
Radian Group Inc., Sr. Unsec. Conv. Notes, | | | | | | | | |
3.00%, 11/15/2017 | | | 72,000 | | | | 90,495 | |
2.25%, 03/01/2019 | | | 30,000 | | | | 38,794 | |
| | | | | | | | 369,196 | |
|
| Tobacco–0.12% | |
Philip Morris International Inc.,
Sr. Unsec. Global Bonds, 1.25%, 08/11/2017 | | | 11,000 | | | | 11,018 | |
Sr. Unsec. Global Notes, 2.50%, 05/16/2016 | | | 55,000 | | | | 55,336 | |
| | | | | | | | 66,354 | |
|
| Wireless Telecommunication Services–0.35% | |
Crown Castle Towers LLC, Sr. Sec. Gtd. First Lien Notes, 4.88%, 08/15/2020(d) | | | 178,000 | | | | 190,471 | |
Total Bonds and Notes
(Cost $14,363,539) | | | | 13,954,243 | |
| | | | | | | | |
| | | Principal
Amount | | | Value | |
U.S. Treasury Securities–5.31% | |
| U.S. Treasury Notes–5.31% | |
0.88%, 11/30/2017 | | $ | 2,335,000 | | | $ | 2,328,652 | |
1.25%, 12/15/2018 | | | 235,000 | | | | 234,548 | |
1.63%, 11/30/2020 | | | 274,300 | | | | 272,746 | |
2.00%, 11/30/2022 | | | 21,000 | | | | 20,882 | |
Total U.S. Treasury Securities
(Cost $2,862,135) | | | | 2,856,828 | |
| | |
| | |
Shares | | | | |
Preferred Stocks–0.20% | |
| Asset Management & Custody Banks–0.20% | |
AMG Capital Trust II, $2.58 Jr. Unsec. Gtd. Sub. Conv. Pfd. (Cost $118,793) | | | 1,900 | | | | 107,112 | |
|
Money Market Funds–3.33% | |
Liquid Assets Portfolio–Institutional Class, 0.29%(g) | | | 897,839 | | | | 897,839 | |
Premier Portfolio–Institutional Class, 0.24%(g) | | | 897,839 | | | | 897,839 | |
Total Money Market Funds
(Cost $1,795,678) | | | | 1,795,678 | |
TOTAL INVESTMENTS–100.03%
(Cost $54,008,083) | | | | 53,875,603 | |
OTHER ASSETS LESS LIABILITIES–(0.03)% | | | | (14,856 | ) |
NET ASSETS–100.00% | | | $ | 53,860,747 | |
Investment Abbreviations:
| | |
| ADR | | – American Depositary Receipt |
| Conv. | | – Convertible |
| Ctfs. | | – Certificates |
| Deb. | | – Debentures |
| Gtd. | | – Guaranteed |
| Jr. | | – Junior |
| Pfd. | | – Preferred |
| REIT | | – Real Estate Investment Trust |
| Sec. | | – Secured |
| Sr. | | – Senior |
| Sub. | | – Subordinated |
| Unsec. | | – Unsecured |
Notes to Schedule of Investments:
| (a) | Industry and/or sector classifications used in this report are generally according to the Global Industry Classification Standard, which was developed by and is the exclusive property and a service mark of MSCI Inc. and Standard & Poor’s. |
| (b) | Non-income producing security. |
| (c) | All or a portion of the value was pledged as collateral to cover margin requirements for open futures contracts. See Note 1K and Note 4. |
| (d) | Security purchased or received in a transaction exempt from registration under the Securities Act of 1933, as amended (the “1933 Act”). The security may be resold pursuant to an exemption from registration under the 1933 Act, typically to qualified institutional buyers. The aggregate value of these securities at December 31, 2015 was $2,289,584, which represented 4.25% of the Fund’s Net Assets. |
| (e) | Security has an irrevocable call by the issuer or mandatory put by the holder. Maturity date reflects such call or put. |
| (f) | Perpetual bond with no specified maturity date. |
| (g) | The money market fund and the Fund are affiliated by having the same investment adviser. The rate shown is the 7-day SEC standardized yield as of December 31, 2015. |
See accompanying Notes to Financial Statements which are an integral part of the financial statements.
Invesco V.I. Managed Volatility Fund
Statement of Assets and Liabilities
December 31, 2015
Statement of Operations
For the year ended December 31, 2015
Assets:
| | | | |
Investments, at value (Cost $52,212,405) | | $ | 52,079,925 | |
Investments in affiliated money market funds, at value and cost | | | 1,795,678 | |
Total investments, at value (Cost $54,008,083) | | | 53,875,603 | |
Foreign currencies, at value (Cost $17,470) | | | 17,387 | |
Receivable for: | | | | |
Investments sold | | | 15,074 | |
Variation margin — futures | | | 28,389 | |
Fund shares sold | | | 4,585 | |
Dividends and interest | | | 180,744 | |
Investment for trustee deferred compensation and retirement plans | | | 63,931 | |
Unrealized appreciation on forward foreign currency contracts outstanding | | | 28,890 | |
Other assets | | | 1,529 | |
Total assets | | | 54,216,132 | |
|
Liabilities: | |
Payable for: | | | | |
Investments purchased | | | 11,847 | |
Fund shares reacquired | | | 206,392 | |
Accrued fees to affiliates | | | 35,251 | |
Accrued trustees’ and officers’ fees and benefits | | | 134 | |
Accrued other operating expenses | | | 33,478 | |
Trustee deferred compensation and retirement plans | | | 68,283 | |
Total liabilities | | | 355,385 | |
Net assets applicable to shares outstanding | | $ | 53,860,747 | |
|
Net assets consist of: | |
Shares of beneficial interest | | $ | 51,973,510 | |
Undistributed net investment income | | | 779,551 | |
Undistributed net realized gain | | | 1,212,324 | |
Net unrealized appreciation (depreciation) | | | (104,638 | ) |
| | | $ | 53,860,747 | |
| |
Net Assets: | | | | |
Series I | | $ | 52,360,323 | |
Series II | | $ | 1,500,424 | |
|
Shares outstanding, $0.001 par value per share,
with an unlimited number of shares authorized: | |
Series I | | | 4,600,770 | |
Series II | | | 133,255 | |
Series I: | | | | |
Net asset value per share | | $ | 11.38 | |
Series II: | | | | |
Net asset value per share | | $ | 11.26 | |
| | | | |
Investment income: | |
Dividends (net of foreign withholding taxes of $26,650) | | $ | 963,848 | |
Dividends from affiliated money market funds | | | 2,992 | |
Interest | | | 438,249 | |
Total investment income | | | 1,405,089 | |
| |
Expenses: | | | | |
Advisory fees | | | 392,932 | |
Administrative services fees | | | 202,433 | |
Custodian fees | | | 20,682 | |
Distribution fees — Series II | | | 4,082 | |
Transfer agent fees | | | 19,902 | |
Trustees’ and officers’ fees and benefits | | | 20,285 | |
Professional services fees | | | 42,789 | |
Other | | | 21,437 | |
Total expenses | | | 724,542 | |
Less: Fees waived | | | (12,515 | ) |
Net expenses | | | 712,027 | |
Net investment income | | | 693,062 | |
| |
Realized and unrealized gain (loss) from: | | | | |
Net realized gain (loss) from: | | | | |
Investment securities | | | 1,128,188 | |
Foreign currencies | | | (5,153 | ) |
Forward foreign currency contracts | | | 324,151 | |
Futures contracts | | | 155,499 | |
| | | | 1,602,685 | |
Change in net unrealized appreciation (depreciation) of: | | | | |
Investment securities | | | (3,461,461 | ) |
Foreign currencies | | | 2,131 | |
Forward foreign currency contracts | | | (52,359 | ) |
Futures contracts | | | (224 | ) |
| | | | (3,511,913 | ) |
Net realized and unrealized gain (loss) | | | (1,909,228 | ) |
Net increase (decrease) in net assets resulting from operations | | $ | (1,216,166 | ) |
See accompanying Notes to Financial Statements which are an integral part of the financial statements.
Invesco V.I. Managed Volatility Fund
Statement of Changes in Net Assets
For the years ended December 31, 2015 and 2014
| | | | | | | | |
| | | 2015 | | | 2014 | |
Operations: | | | | | |
Net investment income | | $ | 693,062 | | | $ | 882,573 | |
Net realized gain | | | 1,602,685 | | | | 22,977,439 | |
Change in net unrealized appreciation (depreciation) | | | (3,511,913 | ) | | | (11,008,043 | ) |
Net increase (decrease) in net assets resulting from operations | | | (1,216,166 | ) | | | 12,851,969 | |
| | |
Distributions to shareholders from net investment income: | | | | | | | | |
Series I | | | (883,070 | ) | | | (1,956,705 | ) |
Series ll | | | (18,185 | ) | | | (44,780 | ) |
Total distributions from net investment income | | | (901,255 | ) | | | (2,001,485 | ) |
| | |
Distributions to shareholders from net realized gains: | | | | | | | | |
Series l | | | (22,008,256 | ) | | | (3,200,299 | ) |
Series ll | | | (561,485 | ) | | | (80,119 | ) |
Total distributions from net realized gains | | | (22,569,741 | ) | | | (3,280,418 | ) |
| | |
Share transactions–net: | | | | | | | | |
Series l | | | 5,715,114 | | | | 1,534,064 | |
Series ll | | | 321,994 | | | | (63,252 | ) |
Net increase in net assets resulting from share transactions | | | 6,037,108 | | | | 1,470,812 | |
Net increase (decrease) in net assets | | | (18,650,054 | ) | | | 9,040,878 | |
| | |
Net assets: | | | | | | | | |
Beginning of year | | | 72,510,801 | | | | 63,469,923 | |
End of year (includes undistributed net investment income of $779,551 and $717,068, respectively) | | $ | 53,860,747 | | | $ | 72,510,801 | |
Notes to Financial Statements
December 31, 2015
NOTE 1—Significant Accounting Policies
Invesco V.I. Managed Volatility Fund (the “Fund”) is a series portfolio of AIM Variable Insurance Funds (Invesco Variable Insurance Funds) (the “Trust”). The Trust is a Delaware statutory trust registered under the Investment Company Act of 1940, as amended (the “1940 Act”), as an open-end series management investment company consisting of twenty-four separate portfolios, (each constituting a “Fund”). The assets, liabilities and operations of each portfolio are accounted for separately. Information presented in these financial statements pertains only to the Fund. Matters affecting each Fund or class will be voted on exclusively by the shareholders of such Fund or class. Current Securities and Exchange Commission (“SEC”) guidance, however, requires participating insurance companies offering separate accounts to vote shares proportionally in accordance with the instructions of the contract owners whose investments are funded by shares of each Fund or class.
The Fund’s investment objective is both capital appreciation and current income while managing portfolio volatility.
The Fund currently offers two classes of shares, Series I and Series II, both of which are offered to insurance company separate accounts funding variable annuity contracts and variable life insurance policies (“variable products”).
The following is a summary of the significant accounting policies followed by the Fund in the preparation of its financial statements.
| A. | Security Valuations — Securities, including restricted securities, are valued according to the following policy. |
A security listed or traded on an exchange (except convertible securities) is valued at its last sales price or official closing price as of the close of the customary trading session on the exchange where the security is principally traded, or lacking any sales or official closing price on a particular day, the security may be valued at the closing bid price on that day. Securities traded in the over-the-counter market are valued based on prices furnished by independent pricing services or market makers. When such securities are valued by an independent pricing service they may be considered fair valued. Futures contracts are valued at the final settlement price set by an exchange on which they are principally traded. Listed options are valued at the mean between the last bid and asked prices from the exchange on which they are principally traded. Options not listed on an exchange are valued by an independent source at the mean between the last bid and asked prices. For purposes of determining net asset value (“NAV”) per share, futures and option contracts generally are valued 15 minutes after the close of the customary trading session of the New York Stock Exchange (“NYSE”).
Investments in open-end and closed-end registered investment companies that do not trade on an exchange are valued at the end-of-day net asset value per share. Investments in open-end and closed-end registered investment companies that trade on an exchange are valued at the last sales price or official closing price as of the close of the customary trading session on the exchange where the security is principally traded.
Debt obligations (including convertible securities) and unlisted equities are fair valued using an evaluated quote provided by an independent pricing service. Evaluated quotes provided by the pricing service may be determined without exclusive reliance on quoted prices, and may reflect
Invesco V.I. Managed Volatility Fund
appropriate factors such as institution-size trading in similar groups of securities, developments related to specific securities, dividend rate (for unlisted equities), yield (for debt obligations), quality, type of issue, coupon rate (for debt obligations), maturity (for debt obligations), individual trading characteristics and other market data. Debt obligations are subject to interest rate and credit risks. In addition, all debt obligations involve some risk of default with respect to interest and/or principal payments.
Foreign securities’ (including foreign exchange contracts) prices are converted into U.S. dollar amounts using the applicable exchange rates as of the close of the NYSE. If market quotations are available and reliable for foreign exchange-traded equity securities, the securities will be valued at the market quotations. Because trading hours for certain foreign securities end before the close of the NYSE, closing market quotations may become unreliable. If between the time trading ends on a particular security and the close of the customary trading session on the NYSE, events occur that the Adviser determines are significant and make the closing price unreliable, the Fund may fair value the security. If the event is likely to have affected the closing price of the security, the security will be valued at fair value in good faith using procedures approved by the Board of Trustees. Adjustments to closing prices to reflect fair value may also be based on a screening process of an independent pricing service to indicate the degree of certainty, based on historical data, that the closing price in the principal market where a foreign security trades is not the current value as of the close of the NYSE. Foreign securities’ prices meeting the approved degree of certainty that the price is not reflective of current value will be priced at the indication of fair value from the independent pricing service. Multiple factors may be considered by the independent pricing service in determining adjustments to reflect fair value and may include information relating to sector indices, American Depositary Receipts and domestic and foreign index futures. Foreign securities may have additional risks including exchange rate changes, potential for sharply devalued currencies and high inflation, political and economic upheaval, the relative lack of issuer information, relatively low market liquidity and the potential lack of strict financial and accounting controls and standards.
Securities for which market prices are not provided by any of the above methods may be valued based upon quotes furnished by independent sources. The last bid price may be used to value equity securities. The mean between the last bid and asked prices is used to value debt obligations, including corporate loans.
Securities for which market quotations are not readily available or became unreliable are valued at fair value as determined in good faith by or under the supervision of the Trust’s officers following procedures approved by the Board of Trustees. Issuer specific events, market trends, bid/asked quotes of brokers and information providers and other market data may be reviewed in the course of making a good faith determination of a security’s fair value.
The Fund may invest in securities that are subject to interest rate risk, meaning the risk that the prices will generally fall as interest rates rise and, conversely, the prices will generally rise as interest rates fall. Specific securities differ in their sensitivity to changes in interest rates depending on their individual characteristics. Changes in interest rates may result in increased market volatility, which may affect the value and/or liquidity of certain Fund investments.
Valuations change in response to many factors including the historical and prospective earnings of the issuer, the value of the issuer’s assets, general economic conditions, interest rates, investor perceptions and market liquidity. Because of the inherent uncertainties of valuation, the values reflected in the financial statements may materially differ from the value received upon actual sale of those investments.
| B. | Securities Transactions and Investment Income — Securities transactions are accounted for on a trade date basis. Realized gains or losses on sales are computed on the basis of specific identification of the securities sold. Interest income (net of withholding tax, if any) is recorded on the accrual basis from settlement date. Dividend income (net of withholding tax, if any) is recorded on the ex-dividend date. Bond premiums and discounts are amortized and/or accreted for financial reporting purposes. |
The Fund may periodically participate in litigation related to Fund investments. As such, the Fund may receive proceeds from litigation settlements. Any proceeds received are included in the Statement of Operations as realized gain (loss) for investments no longer held and as unrealized gain (loss) for investments still held.
Brokerage commissions and mark ups are considered transaction costs and are recorded as an increase to the cost basis of securities purchased and/or a reduction of proceeds on a sale of securities. Such transaction costs are included in the determination of net realized and unrealized gain (loss) from investment securities reported in the Statement of Operations and the Statement of Changes in Net Assets and the net realized and unrealized gains (losses) on securities per share in the Financial Highlights. Transaction costs are included in the calculation of the Fund’s net asset value and, accordingly, they reduce the Fund’s total returns. These transaction costs are not considered operating expenses and are not reflected in net investment income reported in the Statement of Operations and the Statement of Changes in Net Assets, or the net investment income per share and the ratios of expenses and net investment income reported in the Financial Highlights, nor are they limited by any expense limitation arrangements between the Fund and the investment adviser.
The Fund allocates income and realized and unrealized capital gains and losses to a class based on the relative net assets of each class.
| C. | Country Determination — For the purposes of making investment selection decisions and presentation in the Schedule of Investments, the investment adviser may determine the country in which an issuer is located and/or credit risk exposure based on various factors. These factors include the laws of the country under which the issuer is organized, where the issuer maintains a principal office, the country in which the issuer derives 50% or more of its total revenues and the country that has the primary market for the issuer’s securities, as well as other criteria. Among the other criteria that may be evaluated for making this determination are the country in which the issuer maintains 50% or more of its assets, the type of security, financial guarantees and enhancements, the nature of the collateral and the sponsor organization. Country of issuer and/or credit risk exposure has been determined to be the United States of America, unless otherwise noted. |
| D. | Distributions — Distributions from net investment income and net realized capital gain, if any, are generally declared and paid to separate accounts of participating insurance companies annually and recorded on the ex-dividend date. |
| E. | Federal Income Taxes — The Fund intends to comply with the requirements of Subchapter M of the Internal Revenue Code of 1986, as amended (the “Internal Revenue Code”), necessary to qualify as a regulated investment company and to distribute substantially all of the Fund’s taxable earnings to shareholders. As such, the Fund will not be subject to federal income taxes on otherwise taxable income (including net realized capital gain) that is distributed to shareholders. Therefore, no provision for federal income taxes is recorded in the financial statements. |
The Fund recognizes the tax benefits of uncertain tax positions only when the position is more likely than not to be sustained. Management has analyzed the Fund’s uncertain tax positions and concluded that no liability for unrecognized tax benefits should be recorded related to uncertain tax positions. Management is not aware of any tax positions for which it is reasonably possible that the total amounts of unrecognized tax benefits will change materially in the next 12 months.
Invesco V.I. Managed Volatility Fund
The Fund files tax returns in the U.S. Federal jurisdiction and certain other jurisdictions. Generally, the Fund is subject to examinations by such taxing authorities for up to three years after the filing of the return for the tax period.
| F. | Expenses — Fees provided for under the Rule 12b-1 plan of a particular class of the Fund and which are directly attributable to that class are charged to the operations of such class. All other expenses are allocated among the classes based on relative net assets. |
| G. | Accounting Estimates — The preparation of financial statements in conformity with accounting principles generally accepted in the United States of America (“GAAP”) requires management to make estimates and assumptions that affect the reported amounts of assets and liabilities at the date of the financial statements and the reported amounts of revenues and expenses during the reporting period including estimates and assumptions related to taxation. Actual results could differ from those estimates by a significant amount. In addition, the Fund monitors for material events or transactions that may occur or become known after the period-end date and before the date the financial statements are released to print. |
| H. | Indemnifications — Under the Trust’s organizational documents, each Trustee, officer, employee or other agent of the Trust is indemnified against certain liabilities that may arise out of the performance of their duties to the Fund. Additionally, in the normal course of business, the Fund enters into contracts, including the Fund’s servicing agreements, that contain a variety of indemnification clauses. The Fund’s maximum exposure under these arrangements is unknown as this would involve future claims that may be made against the Fund that have not yet occurred. The risk of material loss as a result of such indemnification claims is considered remote. |
| I. | Foreign Currency Translations — Foreign currency is valued at the close of the NYSE based on quotations posted by banks and major currency dealers. Portfolio securities and other assets and liabilities denominated in foreign currencies are translated into U.S. dollar amounts at date of valuation. Purchases and sales of portfolio securities (net of foreign taxes withheld on disposition) and income items denominated in foreign currencies are translated into U.S. dollar amounts on the respective dates of such transactions. The Fund does not separately account for the portion of the results of operations resulting from changes in foreign exchange rates on investments and the fluctuations arising from changes in market prices of securities held. The combined results of changes in foreign exchange rates and the fluctuation of market prices on investments (net of estimated foreign tax withholding) are included with the net realized and unrealized gain or loss from investments in the Statement of Operations. Reported net realized foreign currency gains or losses arise from (1) sales of foreign currencies, (2) currency gains or losses realized between the trade and settlement dates on securities transactions, and (3) the difference between the amounts of dividends, interest, and foreign withholding taxes recorded on the Fund’s books and the U.S. dollar equivalent of the amounts actually received or paid. Net unrealized foreign currency gains and losses arise from changes in the fair values of assets and liabilities, other than investments in securities at fiscal period end, resulting from changes in exchange rates. |
The Fund may invest in foreign securities, which may be subject to foreign taxes on income, gains on investments or currency repatriation, a portion of which may be recoverable. Foreign taxes, if any, are recorded based on the tax regulations and rates that exist in the foreign markets in which the Fund invests and are shown in the Statement of Operations.
| J. | Forward Foreign Currency Contracts — The Fund may engage in foreign currency transactions either on a spot (i.e. for prompt delivery and settlement) basis, or through forward foreign currency contracts, to manage or minimize currency or exchange rate risk. |
The Fund may also enter into forward foreign currency contracts for the purchase or sale of a security denominated in a foreign currency in order to “lock in” the U.S. dollar price of that security, or the Fund may also enter into forward foreign currency contracts that do not provide for physical settlement of the two currencies, but instead are settled by a single cash payment calculated as the difference between the agreed upon exchange rate and the spot rate at settlement based upon an agreed upon notional amount (non-deliverable forwards). The Fund will set aside liquid assets in an amount equal to daily mark-to-market obligation for forward foreign currency contracts.
A forward foreign currency contract is an obligation between two parties (“Counterparties”) to purchase or sell a specific currency for an agreed-upon price at a future date. The use of forward foreign currency contracts does not eliminate fluctuations in the price of the underlying securities the Fund owns or intends to acquire but establishes a rate of exchange in advance. Fluctuations in the value of these contracts are measured by the difference in the contract date and reporting date exchange rates and are recorded as unrealized appreciation (depreciation) until the contracts are closed. When the contracts are closed, realized gains (losses) are recorded. Realized and unrealized gains (losses) on the contracts are included in the Statement of Operations. The primary risks associated with forward foreign currency contracts include failure of the Counterparty to meet the terms of the contract and the value of the foreign currency changing unfavorably. These risks may be in excess of the amounts reflected in the Statement of Assets and Liabilities.
| K. | Futures Contracts — The Fund may enter into futures contracts to manage exposure to interest rate, equity and market price movements and/or currency risks. A futures contract is an agreement between two parties (“Counterparties”) to purchase or sell a specified underlying security, currency or commodity (or delivery of a cash settlement price, in the case of an index future) for a fixed price at a future date. The Fund currently invests only in exchange-traded futures and they are standardized as to maturity date and underlying financial instrument. Initial margin deposits required upon entering into futures contracts are satisfied by the segregation of specific securities or cash as collateral at the futures commission merchant (broker). During the period the futures contracts are open, changes in the value of the contracts are recognized as unrealized gains or losses by recalculating the value of the contracts on a daily basis. Subsequent or variation margin payments are received or made depending upon whether unrealized gains or losses are incurred. These amounts are reflected as receivables or payables on the Statement of Assets and Liabilities. When the contracts are closed or expire, the Fund recognizes a realized gain or loss equal to the difference between the proceeds from, or cost of, the closing transaction and the Fund’s basis in the contract. The net realized gain (loss) and the change in unrealized gain (loss) on futures contracts held during the period is included on the Statement of Operations. The primary risks associated with futures contracts are market risk and the absence of a liquid secondary market. If the Fund were unable to liquidate a futures contract and/or enter into an offsetting closing transaction, the Fund would continue to be subject to market risk with respect to the value of the contracts and continue to be required to maintain the margin deposits on the futures contracts. Futures contracts have minimal Counterparty risk since the exchange’s clearinghouse, as Counterparty to all exchange-traded futures, guarantees the futures against default. Risks may exceed amounts recognized in the Statement of Assets and Liabilities. |
| L. | Collateral — To the extent the Fund has designated or segregated a security as collateral and that security is subsequently sold, it is the Fund’s practice to replace such collateral no later than the next business day. This practice does not apply to securities pledged as collateral for securities lending transactions. |
Invesco V.I. Managed Volatility Fund
NOTE 2—Advisory Fees and Other Fees Paid to Affiliates
The Trust has entered into a master investment advisory agreement with Invesco Advisers, Inc. (the “Adviser” or “Invesco”). Under the terms of the investment advisory agreement, the Fund pays an advisory fee to the Adviser based on the annual rate of 0.60% of the Fund’s average daily net assets.
Under the terms of a master sub-advisory agreement between the Adviser and each of Invesco Asset Management Deutschland GmbH, Invesco Asset Management Limited, Invesco Asset Management (Japan) Limited, Invesco Hong Kong Limited, Invesco Senior Secured Management, Inc. and Invesco Canada Ltd. (collectively, the “Affiliated Sub-Advisers”) the Adviser, not the Fund, may pay 40% of the fees paid to the Adviser to any such Affiliated Sub-Adviser(s) that provide(s) discretionary investment management services to the Fund based on the percentage of assets allocated to such Affiliated Sub-Adviser(s).
Effective May 1, 2015, the Adviser has contractually agreed, through at least June 30, 2016, to waive advisory fees and/or reimburse expenses to the extent necessary to limit total annual fund operating expenses after fee waiver and/or expense reimbursement (excluding certain items discussed below) of Series I shares to 2.00% and Series II shares to 2.25% of average daily net assets. Prior to May 1, 2015, the Adviser had contractually agreed to waive advisory fees and/or reimburse expenses to the extent necessary to limit total annual fund operating expenses after fee waiver and/or expense reimbursement (excluding certain items discussed below) of Series I shares to 1.03% and Series II shares to 1.28% of average daily net assets. In determining the Adviser’s obligation to waive advisory fees and/or reimburse expenses, the following expenses are not taken into account, and could cause the total annual fund operating expenses after fee waiver and/or expense reimbursement to exceed the numbers reflected above: (1) interest; (2) taxes; (3) dividend expense on short sales; (4) extraordinary or non-routine items, including litigation expenses; and (5) expenses that the Fund has incurred but did not actually pay because of an expense offset arrangement. Unless Invesco continues the fee waiver agreement, it will terminate on June 30, 2016. The fee waiver agreement cannot be terminated during its term.
Further, the Adviser has contractually agreed, through at least June 30, 2017, to waive the advisory fee payable by the Fund in an amount equal to 100% of the net advisory fees the Adviser receives from the affiliated money market funds on investments by the Fund of uninvested cash in such affiliated money market funds.
For the year ended December 31, 2015, the Adviser waived advisory fees of $12,515.
The Trust has entered into a master administrative services agreement with Invesco pursuant to which the Fund has agreed to pay Invesco a fee for costs incurred in providing accounting services and fund administrative services to the Fund and to reimburse Invesco for administrative services fees paid to insurance companies that have agreed to provide services to the participants of separate accounts. These administrative services provided by the insurance companies may include, among other things: the printing of prospectuses, financial reports and proxy statements and the delivery of the same to existing participants; the maintenance of master accounts; the facilitation of purchases and redemptions requested by the participants; and the servicing of participants’ accounts. Pursuant to such agreement, for the year ended December 31, 2015, Invesco was paid $50,000 for accounting and fund administrative services and reimbursed $152,433 for services provided by insurance companies.
The Trust has entered into a transfer agency and service agreement with Invesco Investment Services, Inc. (“IIS”) pursuant to which the Fund has agreed to pay IIS a fee for providing transfer agency and shareholder services to the Fund and reimburse IIS for certain expenses incurred by IIS in the course of providing such services. For the year ended December 31, 2015, expenses incurred under the agreement are shown in the Statement of Operations as Transfer agent fees.
The Trust has entered into a master distribution agreement with Invesco Distributors, Inc. (“IDI”) to serve as the distributor for the Fund. The Trust has adopted a plan pursuant to Rule 12b-1 under the 1940 Act with respect to the Fund’s Series II shares (the “Plan”). The Fund, pursuant to the Plan, pays IDI compensation at the annual rate of 0.25% of the Fund’s average daily net assets of Series II shares. Of the Plan payments, up to 0.25% of the average daily net assets of the Series II shares may be paid to insurance companies who furnish continuing personal shareholder services to customers who purchase and own Series II shares of the Fund. For the year ended December 31, 2015, expenses incurred under the Plan are detailed in the Statement of Operations as Distribution fees.
For the year ended December 31, 2015, the Fund incurred $241 in brokerage commissions with Invesco Capital Markets, Inc., an affiliate of the Adviser and IDI, for portfolio transactions executed on behalf of the Fund.
Certain officers and trustees of the Trust are officers and directors of the Adviser, IIS and/or IDI.
NOTE 3—Additional Valuation Information
GAAP defines fair value as the price that would be received to sell an asset or paid to transfer a liability in an orderly transaction between market participants at the measurement date, under current market conditions. GAAP establishes a hierarchy that prioritizes the inputs to valuation methods, giving the highest priority to readily available unadjusted quoted prices in an active market for identical assets (Level 1) and the lowest priority to significant unobservable inputs (Level 3), generally when market prices are not readily available or are unreliable. Based on the valuation inputs, the securities or other investments are tiered into one of three levels. Changes in valuation methods may result in transfers in or out of an investment’s assigned level:
| | Level 1 — | Prices are determined using quoted prices in an active market for identical assets. |
| | Level 2 — | Prices are determined using other significant observable inputs. Observable inputs are inputs that other market participants may use in pricing a security. These may include quoted prices for similar securities, interest rates, prepayment speeds, credit risk, yield curves, loss severities, default rates, discount rates, volatilities and others. |
| | Level 3 — | Prices are determined using significant unobservable inputs. In situations where quoted prices or observable inputs are unavailable (for example, when there is little or no market activity for an investment at the end of the period), unobservable inputs may be used. Unobservable inputs reflect the Fund’s own assumptions about the factors market participants would use in determining fair value of the securities or instruments and would be based on the best available information. |
Invesco V.I. Managed Volatility Fund
The following is a summary of the tiered valuation input levels, as of December 31, 2015. The level assigned to the securities valuations may not be an indication of the risk or liquidity associated with investing in those securities. Because of the inherent uncertainties of valuation, the values reflected in the financial statements may materially differ from the value received upon actual sale of those investments.
| | | | | | | | | | | | | | | | |
| | | Level 1 | | | Level 2 | | | Level 3 | | | Total | |
Equity Securities | | $ | 35,118,076 | | | $ | 1,946,456 | | | $ | — | | | $ | 37,064,532 | |
U.S. Treasury Securities | | | — | | | | 2,856,828 | | | | — | | | | 2,856,828 | |
Corporate Debt Securities | | | — | | | | 13,954,243 | | | | — | | | | 13,954,243 | |
| | | | 35,118,076 | | | | 18,757,527 | | | | — | | | | 53,875,603 | |
Forward Foreign Currency Contracts* | | | — | | | | 28,890 | | | | — | | | | 28,890 | |
Futures Contracts* | | | (224 | ) | | | — | | | | — | | | | (224 | ) |
Total Investments | | $ | 35,117,852 | | | $ | 18,786,417 | | | $ | — | | | $ | 53,904,269 | |
| * | Unrealized appreciation (depreciation). |
NOTE 4—Derivative Investments
Value of Derivative Investments at Period-End
The table below summarizes the value of the Fund’s derivative investments, detailed by primary risk exposure, held as of December 31, 2015:
| | | | | | | | |
| | | Value | |
| Risk Exposure/Derivative Type | | Assets | | | Liabilities | |
Currency risk: | | | | | | | | |
Forward foreign currency contracts(a) | | $ | 28,890 | | | $ | — | |
Equity risk: | | | | | | | | |
Futures contracts(b) | | | — | | | | (224 | ) |
Total | | $ | 28,890 | | | $ | (224 | ) |
| (a) | Values are disclosed on the Statement of Assets and Liabilities under the caption Unrealized appreciation on forward foreign currency contracts outstanding. |
| (b) | Includes cumulative appreciation (depreciation) of futures contracts. Only current day’s variation margin receivable is reported within the Statement of Assets and Liabilities. |
Effect of Derivative Investments for the year ended December 31, 2015
The table below summarizes the gains (losses) on derivative investments, detailed by primary risk exposure, recognized in earnings during the period:
| | | | | | | | |
| | | Location of Gain (Loss) on
Statement of Operations | |
| | | Forward Foreign
Currency Contracts | | | Futures
Contracts | |
Realized Gain: | | | | | | | | |
Currency risk | | $ | 324,151 | | | $ | — | |
Equity risk | | | — | | | | 155,499 | |
Change in Net Unrealized Appreciation (Depreciation): | | | | | | | | |
Currency risk | | | (52,359 | ) | | | — | |
Equity risk | | | — | | | | (224 | ) |
Total | | $ | 271,792 | | | $ | 155,275 | |
The table below summarizes the twelve month average notional value of forward foreign currency contracts and the six month average notional value of futures contracts outstanding during the period.
| | | | | | | | |
| | | Forward Foreign
Currency Contracts | | | Futures
Contracts | |
Average notional value | | $ | 4,124,901 | | | $ | 8,909,631 | |
Invesco V.I. Managed Volatility Fund
| | | | | | | | | | | | | | | | | | | | | | | | | | |
| Open Forward Foreign Currency Contracts | |
Settlement Date | | Counterparty | | Contract to | | | Notional
Value | | | Unrealized
Appreciation | |
| | | Deliver | | | Receive | | | |
1/15/16 | | Bank of New York Mellon (The) | | | CAD | | | | 303,940 | | | | USD | | | | 223,641 | | | $ | 219,593 | | | $ | 4,048 | |
1/15/16 | | State Street Bank and Trust Co. | | | CAD | | | | 303,940 | | | | USD | | | | 223,595 | | | | 219,593 | | | | 4,002 | |
1/15/16 | | Bank of New York Mellon (The) | | | CHF | | | | 184,887 | | | | USD | | | | 186,692 | | | | 184,704 | | | | 1,988 | |
1/15/16 | | State Street Bank and Trust Co. | | | CHF | | | | 184,887 | | | | USD | | | | 186,730 | | | | 184,704 | | | | 2,026 | |
1/15/16 | | Bank of New York Mellon (The) | | | EUR | | | | 378,978 | | | | USD | | | | 413,324 | | | | 412,010 | | | | 1,314 | |
1/15/16 | | State Street Bank and Trust Co. | | | EUR | | | | 378,977 | | | | USD | | | | 413,443 | | | | 412,009 | | | | 1,434 | |
1/15/16 | | Bank of New York Mellon (The) | | | GBP | | | | 248,767 | | | | USD | | | | 373,340 | | | | 366,735 | | | | 6,605 | |
1/15/16 | | State Street Bank and Trust Co. | | | GBP | | | | 248,768 | | | | USD | | | | 373,465 | | | | 366,736 | | | | 6,729 | |
1/15/16 | | Bank of New York Mellon (The) | | | ILS | | | | 732,563 | | | | USD | | | | 188,581 | | | | 188,311 | | | | 270 | |
1/15/16 | | State Street Bank and Trust Co. | | | ILS | | | | 732,564 | | | | USD | | | | 188,785 | | | | 188,311 | | | | 474 | |
Total Open Forward Foreign Currency Contracts — Currency Risk | | | | | | | | | | | | | | | | | | | | | | $ | 28,890 | |
Currency Abbreviations:
| | |
| CAD | | – Canadian Dollar |
| CHF | | – Swiss Franc |
| EUR | | – Euro |
| | |
| GBP | | – British Pound Sterling |
| ILS | | – Israeli Shekel |
| USD | | – U.S. Dollar |
| | | | | | | | | | | | | | | | | | | | |
| Open Futures Contracts — Equity Risk | |
| Futures Contracts | | Type of
Contract | | | Number of
Contracts | | | Expiration
Month | | | Notional Value | | | Unrealized
Appreciation
(Depreciation) | |
E-Mini S&P 500 Index | | | Short | | | | 14 | | | | March-2016 | | | $ | (1,424,780 | ) | | $ | (224 | ) |
Offsetting Assets and Liabilities
Accounting Standards Update (“ASU”) No. 2011-11, Disclosures about Offsetting Assets and Liabilities, which was subsequently clarified in Financial Accounting Standards Board ASU 2013-01 “Clarifying the Scope of Disclosures about Offsetting Assets and Liabilities” is intended to enhance disclosures about financial instruments and derivative instruments that are subject to offsetting arrangements on the Statement of Assets and Liabilities and to enable investors to better understand the effect of those arrangements on the Fund’s financial position. In order for an arrangement to be eligible for netting, the Fund must have a basis to conclude that such netting arrangements are legally enforceable. The Fund enters into netting agreements and collateral agreements in an attempt to reduce the Fund’s Counterparty credit risk by providing for a single net settlement with a Counterparty of all financial transactions covered by the agreement in an event of default as defined under such agreement.
The following tables present derivative instruments that are either subject to an enforceable netting agreement or offset by collateral arrangements as of December 31, 2015.
| | | | | | | | | | | | | | | | | | | | |
| | | | | | Gross Amounts Not Offset in the
Statement of Assets and Liabilities | | | | |
| | | Gross amounts
of Recognized Assets | | | Financial
Instruments | | | Collateral Received | | | Net
Amount | |
| Counterparty | | | | Non-Cash | | | Cash | | |
Bank of New York Mellon (The) | | $ | 14,225 | | | $ | — | | | $ | — | | | $ | — | | | $ | 14,225 | |
State Street Bank and Trust Co. | | | 14,665 | | | | — | | | | — | | | | — | | | | 14,665 | |
Total | | $ | 28,890 | | | $ | — | | | $ | — | | | $ | — | | | $ | 28,890 | |
NOTE 5—Trustees’ and Officers’ Fees and Benefits
Trustees’ and Officers’ Fees and Benefits include amounts accrued by the Fund to pay remuneration to certain Trustees and Officers of the Fund. Trustees have the option to defer compensation payable by the Fund, and Trustees’ and Officers’ Fees and Benefits also include amounts accrued by the Fund to fund such deferred compensation amounts. Those Trustees who defer compensation have the option to select various Invesco Funds in which their deferral accounts shall be deemed to be invested. Finally, certain current Trustees were eligible to participate in a retirement plan that provided for benefits to be paid upon retirement to Trustees over a period of time based on the number of years of service. The Fund may have certain former Trustees who also participate in a retirement plan and receive benefits under such plan. Trustees’ and Officers’ Fees and Benefits include amounts accrued by the Fund to fund such retirement benefits. Obligations under the deferred compensation and retirement plans represent unsecured claims against the general assets of the Fund.
Invesco V.I. Managed Volatility Fund
NOTE 6—Cash Balances
The Fund is permitted to temporarily carry a negative or overdrawn balance in its account with State Street Bank and Trust Company, the custodian bank. Such balances, if any at period end, are shown in the Statement of Assets and Liabilities under the payable caption Amount due custodian. To compensate the custodian bank for such overdrafts, the overdrawn Fund may either (1) leave funds as a compensating balance in the account so the custodian bank can be compensated by earning the additional interest; or (2) compensate by paying the custodian bank at a rate agreed upon by the custodian bank and Invesco, not to exceed the contractually agreed upon rate.
NOTE 7—Distributions to Shareholders and Tax Components of Net Assets
Tax Character of Distributions to Shareholders Paid During the Fiscal Years Ended December 31, 2015 and 2014:
| | | | | | | | |
| | | 2015 | | | 2014 | |
Ordinary income | | $ | 2,074,591 | | | $ | 2,001,485 | |
Long-term capital gain | | | 21,396,405 | | | | 3,280,418 | |
Total distributions | | $ | 23,470,996 | | | $ | 5,281,903 | |
Tax Components of Net Assets at Period-End:
| | | | |
| | | 2015 | |
Undistributed ordinary income | | $ | 983,365 | |
Undistributed long-term gain | | | 1,392,683 | |
Net unrealized appreciation (depreciation) — investments | | | (418,713 | ) |
Net unrealized appreciation (depreciation) — other investments | | | (824 | ) |
Temporary book/tax differences | | | (69,274 | ) |
Shares of beneficial interest | | | 51,973,510 | |
Total net assets | | $ | 53,860,747 | |
The difference between book-basis and tax-basis unrealized appreciation (depreciation) is due to differences in the timing of recognition of gains and losses on investments for tax and book purposes. The Fund’s net unrealized appreciation (depreciation) difference is attributable primarily to wash sales and adjustments to contingent payment debt instruments.
The temporary book/tax differences are a result of timing differences between book and tax recognition of income and/or expenses. The Fund’s temporary book/tax differences are the result of the trustee deferral of compensation and retirement plan benefits.
Capital loss carryforward is calculated and reported as of a specific date. Results of transactions and other activity after that date may affect the amount of capital loss carryforward actually available for the Fund to utilize. Capital losses generated in years beginning after December 22, 2010 can be carried forward for an unlimited period, whereas previous losses expire in eight tax years. Capital losses with an expiration period may not be used to offset capital gains until all net capital losses without an expiration date have been utilized. Capital loss carryforwards with no expiration date will retain their character as either short-term or long-term capital losses instead of as short-term capital losses as under prior law. The ability to utilize capital loss carryforwards in the future may be limited under the Internal Revenue Code and related regulations based on the results of future transactions.
The Fund does not have a capital loss carryforward as of December 31, 2015.
NOTE 8—Investment Securities
The aggregate amount of investment securities (other than short-term securities, U.S. Treasury obligations and money market funds, if any) purchased and sold by the Fund during the year ended December 31, 2015 was $16,507,760 and $27,113,903, respectively. During the same period, purchases and sales of U.S. Treasury obligations were $55,540,421 and $58,150,021, respectively. Cost of investments on a tax basis includes the adjustments for financial reporting purposes as of the most recently completed federal income tax reporting period-end.
| | | | |
| Unrealized Appreciation (Depreciation) of Investment Securities on a Tax Basis | |
Aggregate unrealized appreciation of investment securities | | $ | 3,493,489 | |
Aggregate unrealized (depreciation) of investment securities | | | (3,912,202 | ) |
Net unrealized appreciation (depreciation) of investment securities | | $ | (418,713 | ) |
Cost of investments for tax purposes is $54,294,316.
NOTE 9—Reclassification of Permanent Differences
Primarily as a result of differing book/tax treatment of foreign currency transactions and contingent payment debt instrumentals, on December 31, 2015, undistributed net investment income was increased by $270,676 and undistributed net realized gain was decreased by $270,676. This reclassification had no effect on the net assets of the Fund.
Invesco V.I. Managed Volatility Fund
NOTE 10—Share Information
| | | | | | | | | | | | | | | | |
| | | Summary of Share Activity | |
| | | Years ended December 31, | |
| | | 2015(a) | | | 2014 | |
| | | Shares | | | Amount | | | Shares | | | Amount | |
Sold: | | | | | | | | | | | | | | | | |
Series I | | | 281,770 | | | $ | 4,951,536 | | | | 717,540 | | | $ | 13,584,291 | |
Series II | | | 4,400 | | | | 73,277 | | | | 16,173 | | | | 299,184 | |
| | | | |
Issued as reinvestment of dividends: | | | | | | | | | | | | | | | | |
Series I | | | 2,053,034 | | | | 22,891,326 | | | | 276,664 | | | | 5,157,004 | |
Series II | | | 52,506 | | | | 579,670 | | | | 6,744 | | | | 124,899 | |
| | | | |
Reacquired: | | | | | | | | | | | | | | | | |
Series I | | | (1,451,733 | ) | | | (22,127,748 | ) | | | (906,605 | ) | | | (17,207,231 | ) |
Series II | | | (18,649 | ) | | | (330,953 | ) | | | (26,293 | ) | | | (487,335 | ) |
Net increase in share activity | | | 921,328 | | | $ | 6,037,108 | | | | 84,223 | | | $ | 1,470,812 | |
| (a) | There are entities that are record owners of more than 5% of the outstanding shares of the Fund and in the aggregate own 58% of the outstanding shares of the Fund. The Fund and the Fund’s principal underwriter or adviser, are parties to participation agreements with these entities whereby these entities sell units of interest in separate accounts funding variable products that are invested in the Fund. The Fund, Invesco and/or Invesco affiliates may make payments to these entities, which are considered to be related to the Fund, for providing services to the Fund, Invesco and/or Invesco affiliates including but not limited to services such as, securities brokerage, third party record keeping and account servicing and administrative services. The Fund has no knowledge as to whether all or any portion of the shares owned of record by these entities are also owned beneficially. |
NOTE 11—Financial Highlights
The following schedule presents financial highlights for a share of the Fund outstanding throughout the periods indicated.
| | | | | | | | | | | | | | | | | | | | | | | | | | | | | | | | | | | | | | | | | | | | | | | | | | | | | | | | |
| | | Net asset
value,
beginning
of period | | | Net
investment
income(a) | | | Net gains
(losses)
on securities
(both
realized and
unrealized) | | | Total from
investment
operations | | | Dividends
from net
investment
income | | | Distributions
from net
realized
gains | | | Total
distributions | | | Net asset
value, end
of period | | | Total
return(b) | | | Net assets,
end of period
(000’s omitted) | | | Ratio of
expenses to average
net assets
with fee waivers
and/or expenses
absorbed | | | Ratio of
expenses
to average net
assets without
fee waivers
and/or expenses
absorbed | | | Ratio of
net investment
income
to average
net assets | | | Portfolio
turnover(c) | |
Series I | | | | | | | | | | | | | | | | | | | | | |
Year ended 12/31/15 | | $ | 19.02 | | | $ | 0.18 | | | $ | (0.74 | ) | | $ | (0.56 | ) | | $ | (0.27 | ) | | $ | (6.81 | ) | | $ | (7.08 | ) | | $ | 11.38 | | | | (2.15 | )% | | $ | 52,360 | | | | 1.08 | %(d) | | | 1.10 | %(d) | | | 1.07 | %(d) | | | 117 | % |
Year ended 12/31/14 | | | 17.03 | | | | 0.24 | | | | 3.23 | | | | 3.47 | | | | (0.56 | ) | | | (0.92 | ) | | | (1.48 | ) | | | 19.02 | | | | 20.57 | | | | 70,717 | | | | 1.03 | | | | 1.10 | | | | 1.26 | | | | 201 | |
Year ended 12/31/13 | | | 16.20 | | | | 0.47 | | | | 1.25 | | | | 1.72 | | | | (0.52 | ) | | | (0.37 | ) | | | (0.89 | ) | | | 17.03 | | | | 10.76 | | | | 61,806 | | | | 1.07 | | | | 1.08 | | | | 2.73 | | | | 15 | |
Year ended 12/31/12 | | | 16.74 | | | | 0.52 | | | | 0.10 | | | | 0.62 | | | | (0.54 | ) | | | (0.62 | ) | | | (1.16 | ) | | | 16.20 | | | | 3.61 | | | | 64,158 | | | | 0.99 | | | | 1.03 | | | | 3.10 | | | | 3 | |
Year ended 12/31/11 | | | 14.87 | | | | 0.51 | | | | 1.90 | | | | 2.41 | | | | (0.54 | ) | | | — | | | | (0.54 | ) | | | 16.74 | | | | 16.45 | | | | 70,956 | | | | 0.92 | | | | 1.04 | | | | 3.23 | | | | 14 | |
Series II | |
Year ended 12/31/15 | | | 18.88 | | | | 0.13 | | | | (0.72 | ) | | | (0.59 | ) | | | (0.22 | ) | | | (6.81 | ) | | | (7.03 | ) | | | 11.26 | | | | (2.37 | ) | | | 1,500 | | | | 1.33 | (d) | | | 1.35 | (d) | | | 0.82 | (d) | | | 117 | |
Year ended 12/31/14 | | | 16.91 | | | | 0.19 | | | | 3.21 | | | | 3.40 | | | | (0.51 | ) | | | (0.92 | ) | | | (1.43 | ) | | | 18.88 | | | | 20.30 | | | | 1,794 | | | | 1.28 | | | | 1.35 | | | | 1.01 | | | | 201 | |
Year ended 12/31/13 | | | 16.09 | | | | 0.43 | | | | 1.23 | | | | 1.66 | | | | (0.47 | ) | | | (0.37 | ) | | | (0.84 | ) | | | 16.91 | | | | 10.45 | | | | 1,664 | | | | 1.32 | | | | 1.33 | | | | 2.48 | | | | 15 | |
Year ended 12/31/12 | | | 16.63 | | | | 0.47 | | | | 0.10 | | | | 0.57 | | | | (0.49 | ) | | | (0.62 | ) | | | (1.11 | ) | | | 16.09 | | | | 3.34 | | | | 1,637 | | | | 1.24 | | | | 1.28 | | | | 2.85 | | | | 3 | |
Year ended 12/31/11 | | | 14.78 | | | | 0.47 | | | | 1.88 | | | | 2.35 | | | | (0.50 | ) | | | — | | | | (0.50 | ) | | | 16.63 | | | | 16.15 | | | | 1,878 | | | | 1.17 | | | | 1.29 | | | | 2.98 | | | | 14 | |
| (a) | Calculated using average shares outstanding. |
| (b) | Includes adjustments in accordance with accounting principles generally accepted in the United States of America and as such, the net asset value for financial reporting purposes and the returns based upon those net asset values may differ from the net asset value and returns for shareholder transactions. Total returns are not annualized for periods less than one year, if applicable, and do not reflect charges assessed in connection with a variable product, which if included would reduce total returns. |
| (c) | Portfolio turnover is calculated at the fund level and is not annualized for periods less than one year, if applicable. |
| (d) | Ratios are based on average daily net assets (000’s omitted) of $63,856 and $1,633 for Series I and Series II shares, respectively. |
Invesco V.I. Managed Volatility Fund
Report of Independent Registered Public Accounting Firm
To the Board of Trustees of AIM Variable Insurance Funds (Invesco Variable Insurance Funds) and Shareholders of Invesco V.I. Managed Volatility Fund:
In our opinion, the accompanying statement of assets and liabilities, including the schedule of investments, and the related statements of operations and of changes in net assets and the financial highlights present fairly, in all material respects, the financial position of Invesco V.I. Managed Volatility Fund (one of the funds constituting AIM Variable Insurance Funds (Invesco Variable Insurance Funds), hereafter referred to as the “Fund”) at December 31, 2015, the results of its operations for the year then ended, the changes in its net assets for each of the two years in the period then ended and the financial highlights for each of the five years in the period then ended, in conformity with accounting principles generally accepted in the United States of America. These financial statements and financial highlights (hereafter referred to as “financial statements”) are the responsibility of the Fund’s management. Our responsibility is to express an opinion on these financial statements based on our audits. We conducted our audits of these financial statements in accordance with the standards of the Public Company Accounting Oversight Board (United States). Those standards require that we plan and perform the audit to obtain reasonable assurance about whether the financial statements are free of material misstatement. An audit includes examining, on a test basis, evidence supporting the amounts and disclosures in the financial statements, assessing the accounting principles used and significant estimates made by management, and evaluating the overall financial statement presentation. We believe that our audits, which included confirmation of securities at December 31, 2015 by correspondence with the custodian and brokers, and the application of alternative auditing procedures where confirmations of security purchases have not been received, provide a reasonable basis for our opinion.
PRICEWATERHOUSECOOPERS LLP
Houston, Texas
February 15, 2016
Invesco V.I. Managed Volatility Fund
Calculating your ongoing Fund expenses
Example
As a shareholder of the Fund, you incur ongoing costs, including management fees; distribution and/or service fees (12b-1); and other Fund expenses. This example is intended to help you understand your ongoing costs (in dollars) of investing in the Fund and to compare these costs with ongoing costs of investing in other mutual funds. The example is based on an investment of $1,000 invested at the beginning of the period and held for the entire period July 1, 2015 through December 31, 2015.
The actual and hypothetical expenses in the examples below do not represent the effect of any fees or other expenses assessed in connection with a variable product; if they did, the expenses shown would be higher while the ending account values shown would be lower.
Actual expenses
The table below provides information about actual account values and actual expenses. You may use the information in this table, together with the amount you invested, to estimate the expenses that you paid over the period. Simply divide your account value by $1,000 (for example, an $8,600 account value divided by $1,000 = 8.6), then multiply the result by the number in the table under the heading entitled “Actual Expenses Paid During Period” to estimate the expenses you paid on your account during this period.
Hypothetical example for comparison purposes
The table below also provides information about hypothetical account values and hypothetical expenses based on the Fund’s actual expense ratio and an assumed rate of return of 5% per year before expenses, which is not the Fund’s actual return.
The hypothetical account values and expenses may not be used to estimate the actual ending account balance or expenses you paid for the period. You may use this information to compare the ongoing costs of investing in the Fund and other funds. To do so, compare this 5% hypothetical example with the 5% hypothetical examples that appear in the shareholder reports of the other funds.
Please note that the expenses shown in the table are meant to highlight your ongoing costs. Therefore, the hypothetical information is useful in comparing ongoing costs, and will not help you determine the relative total costs of owning different funds.
| | | | | | | | | | | | | | | | | | | | | | | | |
| Class | | Beginning Account Value (07/01/15) | | | ACTUAL | | | HYPOTHETICAL (5% annual return before expenses) | | | Annualized Expense Ratio | |
| | | Ending Account Value (12/31/15)1 | | | Expenses Paid During Period2 | | | Ending Account Value (12/31/15) | | | Expenses Paid During Period2 | | |
| Series I | | $ | 1,000.00 | | | $ | 969.30 | | | $ | 5.56 | | | $ | 1,019.56 | | | $ | 5.70 | | | | 1.12 | % |
| Series II | | | 1,000.00 | | | | 968.10 | | | | 6.80 | | | | 1,018.30 | | | | 6.97 | | | | 1.37 | |
| 1 | The actual ending account value is based on the actual total return of the Fund for the period July 1, 2015 through December 31, 2015, after actual expenses and will differ from the hypothetical ending account value which is based on the Fund’s expense ratio and a hypothetical annual return of 5% before expenses. |
| 2 | Expenses are equal to the Fund’s annualized expense ratio as indicated above multiplied by the average account value over the period, multiplied by 184/365 to reflect the most recent fiscal half year. |
Invesco V.I. Managed Volatility Fund
Tax Information
Form 1099-DIV, Form 1042-S and other year–end tax information provide shareholders with actual calendar year amounts that should be included in their tax returns. Shareholders should consult their tax advisors.
The following distribution information is being provided as required by the Internal Revenue Code or to meet a specific state’s requirement.
The Fund designates the following amounts or, if subsequently determined to be different, the maximum amount allowable for its fiscal year ended December 31, 2015:
| | | | |
Federal and State Income Tax | |
Long-Term Capital Gain Distributions | | $ | 21,396,405 | |
Corporate Dividends Received Deduction* | | | 53.46 | % |
U.S. Treasury Obligations* | | | 3.71 | % |
| | * | The above percentages are based on ordinary income dividends paid to shareholders during the Fund’s fiscal year. |
Invesco V.I. Managed Volatility Fund
Trustees and Officers
The address of each trustee and officer is AIM Variable Insurance Funds (Invesco Variable Insurance Funds) (the “Trust”), 11 Greenway Plaza, Suite 1000, Houston, Texas 77046-1173. The trustees serve for the life of the Trust, subject to their earlier death, incapacitation, resignation, retirement or removal as more specifically provided in the Trust’s organizational documents. Each officer serves for a one year term or until their successors are elected and qualified. Column two below includes length of time served with predecessor entities, if any.
| | | | | | | | |
Name, Year of Birth and
Position(s) Held with the Trust | | Trustee and/
or Officer Since | | Principal Occupation(s)
During Past 5 Years | | Number of Funds in Fund Complex Overseen by Trustee | | Other Directorship(s) Held by Trustee During Past 5 Years |
| Interested Persons | | | | | | | | |
| Martin L. Flanagan1 — 1960 Trustee | | 2007 | | Executive Director, Chief Executive Officer and President, Invesco Ltd. (ultimate parent of Invesco and a global investment management firm); Advisor to the Board, Invesco Advisers, Inc. (formerly known as Invesco Institutional (N.A.), Inc.); Trustee, The Invesco Funds; Vice Chair, Investment Company Institute; and Member of Executive Board, SMU Cox School of Business Formerly: Chairman and Chief Executive Officer, Invesco Advisers, Inc. (registered investment adviser); Director, Chairman, Chief Executive Officer and President, IVZ Inc. (holding company), INVESCO Group Services, Inc. (service provider) and Invesco North American Holdings, Inc. (holding company); Director, Chief Executive Officer and President, Invesco Holding Company Limited (parent of Invesco and a global investment management firm); Director, Invesco Ltd.; Chairman, Investment Company Institute and President, Co-Chief Executive Officer, Co-President, Chief Operating Officer and Chief Financial Officer, Franklin Resources, Inc. (global investment management organization) | | 146 | | None |
Philip A. Taylor2 — 1954 Trustee, President and Principal Executive Officer | | 2006 | | Head of North American Retail and Senior Managing Director, Invesco Ltd.; Director, Co-Chairman, Co-President and Co-Chief Executive Officer, Invesco Advisers, Inc. (formerly known as Invesco Institutional (N.A.), Inc.) (registered investment adviser); Director, Chairman, Chief Executive Officer and President, Invesco Management Group, Inc. (formerly known as Invesco Aim Management Group, Inc.) (financial services holding company); Director and Chairman, Invesco Investment Services, Inc. (formerly known as Invesco Aim Investment Services, Inc.) (registered transfer agent) Chief Executive Officer, Invesco Corporate Class Inc. (corporate mutual fund company) Director, Chairman and Chief Executive Officer, Invesco Canada Ltd. (formerly known as Invesco Trimark Ltd./Invesco Trimark Ltèe) (registered investment adviser and registered transfer agent); Trustee, President and Principal Executive Officer, The Invesco Funds (other than AIM Treasurer’s Series Trust (Invesco Treasurer’s Series Trust), Short-Term Investments Trust and Invesco Management Trust); Trustee and Executive Vice President, The Invesco Funds (AIM Treasurer’s Series Trust (Invesco Treasurer’s Series Trust), Short-Term Investments Trust and Invesco Management Trust only); Director, Invesco Investment Advisers LLC (formerly known as Van Kampen Asset Management); Director, Chief Executive Officer and President, Van Kampen Exchange Corp. Formerly: Director and President, INVESCO Funds Group, Inc. (registered investment adviser and registered transfer agent); Director and Chairman, IVZ Distributors, Inc. (formerly known as INVESCO Distributors, Inc.) (registered broker dealer); Director, President and Chairman, Invesco Inc. (holding company), Invesco Canada Holdings Inc. (holding company), Trimark Investments Ltd./Placements Trimark Ltèe and Invesco Financial Services Ltd/Services Financiers Invesco Ltèe; Chief Executive Officer, Invesco Canada Fund Inc (corporate mutual fund company); Director and Chairman, Van Kampen Investor Services Inc.; Director, Chief Executive Officer and President, 1371 Preferred Inc. (holding company) and Van Kampen Investments Inc.; Director and President, AIM GP Canada Inc. (general partner for limited partnerships) and Van Kampen Advisors, Inc.; Director and Chief Executive Officer, Invesco Trimark Dealer Inc. (registered broker dealer); Director, Invesco Distributors, Inc. (formerly known as Invesco Aim Distributors, Inc.) (registered broker dealer); Manager, Invesco PowerShares Capital Management LLC; Director, Chief Executive Officer and President, Invesco Advisers, Inc.; Director, Chairman, Chief Executive Officer and President, Invesco Aim Capital Management, Inc.; President, Invesco Trimark Dealer Inc. and Invesco Trimark Ltd./Invesco Trimark Ltèe; Director and President, AIM Trimark Corporate Class Inc. and AIM Trimark Canada Fund Inc.; Senior Managing Director, Invesco Holding Company Limited; Director and Chairman, Fund Management Company (former registered broker dealer); President and Principal Executive Officer, The Invesco Funds (AIM Treasurer’s Series Trust (Invesco Treasurer’s Series Trust), and Short-Term Investments Trust only); President, AIM Trimark Global Fund Inc. and AIM Trimark Canada Fund Inc | | 146 | | None |
| 1 | Mr. Flanagan is considered an interested person (within the meaning of Section 2(a)(19) of the 1940 Act) of the Trust because he is an officer of the Adviser to the Trust, and an officer and a director of Invesco Ltd., ultimate parent of the Adviser. |
| 2 | Mr. Taylor is considered an interested person (within the meaning of Section 2(a)(19) of the 1940 Act) of the Trust because he is an officer and a director of the Adviser. |
Invesco V.I. Managed Volatility Fund
Trustees and Officers—(continued)
| | | | | | | | |
Name, Year of Birth and
Position(s) Held with the Trust | | Trustee and/
or Officer Since | | Principal Occupation(s)
During Past 5 Years | | Number of Funds in Fund Complex Overseen by Trustee | | Other Directorship(s)
Held by Trustee During Past 5 Years |
| Independent Trustees | | | | | | | | |
Bruce L. Crockett — 1944 Trustee and Chair | | 2003 | | Chairman, Crockett Technologies Associates (technology consulting company) Formerly: Director, Captaris (unified messaging provider); Director, President and Chief Executive Officer, COMSAT Corporation; Chairman, Board of Governors of INTELSAT (international communications company); ACE Limited (insurance company); Independent Directors Council and Investment Company Institute | | 146 | | ALPS (Attorneys Liability Protection Society) (insurance company) and Globe Specialty Metals, Inc. (metallurgical company) |
David C. Arch — 1945 Trustee | | 2010 | | Chairman of Blistex Inc., a consumer health care products manufacturer | | 146 | | Board member of the Illinois Manufacturers’ Association; Member of the Board of Visitors, Institute for the Humanities, University of Michigan |
James T. Bunch — 1942 Trustee | | 2000 | | Managing Member, Grumman Hill Group LLC (family office/private equity investments) Formerly: Chairman of the Board of Trustees, Evans Scholars Foundation and Chairman, Board of Governors, Western Golf Association | | 146 | | Trustee, Evans Scholars Foundation; and Chairman of the Board, Denver Film Society |
Albert R. Dowden — 1941 Trustee | | 2003 | | Director of a number of public and private business corporations, including the Boss Group, Ltd. (private investment and management); Nature’s Sunshine Products, Inc. and Reich & Tang Funds (5 portfolios) (registered investment company) Formerly: Director, Homeowners of America Holding Corporation/Homeowners of America Insurance Company (property casualty company); Director, Continental Energy Services, LLC (oil and gas pipeline service); Director, CompuDyne Corporation (provider of product and services to the public security market) and Director, Annuity and Life Re (Holdings), Ltd. (reinsurance company); Director, President and Chief Executive Officer, Volvo Group North America, Inc.; Senior Vice President, AB Volvo; Director of various public and private corporations; Chairman, DHJ Media, Inc.; Director, Magellan Insurance Company; and Director, The Hertz Corporation, Genmar Corporation (boat manufacturer), National Media Corporation; Advisory Board of Rotary Power International (designer, manufacturer, and seller of rotary power engines); and Chairman, Cortland Trust, Inc. (registered investment company) | | 146 | | Director of: Nature’s Sunshine Products, Inc., Reich & Tang Funds, Homeowners of America Holding Corporation/ Homeowners of America Insurance Company, the Boss Group |
Jack M. Fields — 1952 Trustee | | 2003 | | Chief Executive Officer, Twenty First Century Group, Inc. (government affairs company); Owner and Chief Executive Officer, Dos Angeles Ranch, L.P. (cattle, hunting, corporate entertainment); and Discovery Global Education Fund (non-profit) Formerly: Chief Executive Officer, Texana Timber LP (sustainable forestry company); Director of Cross Timbers Quail Research Ranch (non-profit); and member of the U.S. House of Representatives | | 146 | | Insperity, Inc. (formerly known as Administaff) |
Eli Jones — Trustee | | 2016 | | Professor and Dean, Mays Business School, Texas A&M University Formerly: Professor and Dean, Walton College of Business, University of Arkansas, and E.J. Ourso College of Business, Louisiana State University | | 146 | | Director, Insperity, Inc., (2011-present) and ARVEST Bank (2012-2015) |
Prema Mathai-Davis — 1950 Trustee | | 2003 | | Retired. Formerly: Chief Executive Officer, YWCA of the U.S.A. | | 146 | | None |
Larry Soll — 1942 Trustee | | 1997 | | Retired. Formerly: Chairman, Chief Executive Officer and President, Synergen Corp. (a biotechnology company) | | 146 | | None |
Robert C. Troccoli — Trustee | | 2016 | | Retired. Formerly: Senior Partner, KPMG LLP | | 146 | | None |
Raymond Stickel, Jr. — 1944 Trustee | | 2005 | | Retired. Formerly: Director, Mainstay VP Series Funds, Inc. (25 portfolios) and Partner, Deloitte & Touche | | 146 | | None |
Suzanne H. Woolsey — 1941 Trustee | | 2014 | | Chief Executive Officer of Woolsey Partners LLC | | 146 | | Emeritus Chair of the Board of Trustees of the Institute for Defense Analyses; Trustee of Colorado College; Trustee of California Institute of Technology; Prior to 2014, Director of Fluor Corp.; Prior to 2010, Trustee of the German Marshall Fund of the United States; Prior to 2010 Trustee of the Rocky Mountain Institute |
Invesco V.I. Managed Volatility Fund
Trustees and Officers—(continued)
| | | | | | | | |
Name, Year of Birth and
Position(s) Held with the Trust | | Trustee and/
or Officer Since | | Principal Occupation(s)
During Past 5 Years | | Number of Funds in Fund Complex Overseen by Trustee | | Other Directorship(s)
Held by Trustee During Past 5 Years |
| Other Officers | | | | | | | | |
Russell C. Burk — 1958 Senior Vice President and Senior Officer | | 2005 | | Senior Vice President and Senior Officer, The Invesco Funds | | N/A | | N/A |
John M. Zerr — 1962 Senior Vice President, Chief Legal Officer and Secretary | | 2006 | | Director, Senior Vice President, Secretary and General Counsel, Invesco Management Group, Inc. (formerly known as Invesco Aim Management Group, Inc.) and Van Kampen Exchange Corp.; Senior Vice President, Invesco Advisers, Inc. (formerly known as Invesco Institutional (N.A.), Inc.) (registered investment adviser); Senior Vice President and Secretary, Invesco Distributors, Inc. (formerly known as Invesco Aim Distributors, Inc.); Director, Vice President and Secretary, Invesco Investment Services, Inc. (formerly known as Invesco Aim Investment Services, Inc.); Senior Vice President, Chief Legal Officer and Secretary, The Invesco Funds; Managing Director, Invesco PowerShares Capital Management LLC; Director, Secretary and General Counsel, Invesco Investment Advisers LLC (formerly known as Van Kampen Asset Management); Secretary and General Counsel, Invesco Capital Markets, Inc. (formerly known as Van Kampen Funds Inc.) and Chief Legal Officer, PowerShares Exchange-Traded Fund Trust, PowerShares Exchange-Traded Fund Trust II, PowerShares India Exchange-Traded Fund Trust, PowerShares Actively Managed Exchange-Traded Fund Trust, and PowerShares Actively Managed Exchange-Traded Commodity Fund Trust Formerly: Director, Vice President and Secretary, IVZ Distributors, Inc. (formerly known as INVESCO distributors, Inc.); Director and Vice President, INVESCO Funds Group, Inc.; Director and Vice President, Van Kampen Advisors Inc.; Director, Vice President, Secretary and General Counsel, Van Kampen Investor Services Inc.; Director, Invesco Distributors, Inc. (formerly known as Invesco Aim Distributors, Inc.); Director, Senior Vice President, General Counsel and Secretary, Invesco Aim Advisers, Inc. and Van Kampen Investments Inc.; Director, Vice President and Secretary, Fund Management Company; Director, Senior Vice President, Secretary, General Counsel and Vice President, Invesco Aim Capital Management, Inc.; Chief Operating Officer and General Counsel, Liberty Ridge Capital, Inc. (an investment adviser); Vice President and Secretary, PBHG Funds (an investment company) and PBHG Insurance Series Fund (an investment company); Chief Operating Officer, General Counsel and Secretary, Old Mutual Investment Partners (a broker-dealer); General Counsel and Secretary, Old Mutual Fund Services (an administrator) and Old Mutual Shareholder Services (a shareholder servicing center); Executive Vice President, General Counsel and Secretary, Old Mutual Capital, Inc. (an investment adviser); and Vice President and Secretary, Old Mutual Advisors Funds (an investment company) | | N/A | | N/A |
Sheri Morris — 1964 Vice President, Treasurer and Principal Financial Officer | | 2003 | | Vice President, Treasurer and Principal Financial Officer, The Invesco Funds; Vice President, Invesco Advisers, Inc. (formerly known as Invesco Institutional (N.A.), Inc.) (registered investment adviser); and Vice President, PowerShares Exchange-Traded Fund Trust, PowerShares Exchange-Traded Fund Trust II, PowerShares India Exchange-Traded Fund Trust, PowerShares Actively Managed Exchange-Traded Fund Trust, and PowerShares Actively Managed Exchange-Traded Commodity Fund Trust Formerly: Vice President, Invesco Aim Advisers, Inc., Invesco Aim Capital Management, Inc. and Invesco Aim Private Asset Management, Inc.; Assistant Vice President and Assistant Treasurer, The Invesco Funds and Assistant Vice President, Invesco Advisers, Inc., Invesco Aim Capital Management, Inc. and Invesco Aim Private Asset Management, Inc.; and Treasurer, PowerShares Exchange-Traded Fund Trust, PowerShares Exchange-Traded Fund Trust II, PowerShares India Exchange-Traded Fund Trust and PowerShares Actively Managed Exchange-Traded Fund Trust | | N/A | | N/A |
Invesco V.I. Managed Volatility Fund
Trustees and Officers—(continued)
| | | | | | | | |
Name, Year of Birth and
Position(s) Held with the Trust | | Trustee and/
or Officer Since | | Principal Occupation(s)
During Past 5 Years | | Number of Funds in Fund Complex Overseen by Trustee | | Other Directorship(s)
Held by Trustee During Past 5 Years |
| Other Officers—(continued) | | | | | | | | |
Karen Dunn Kelley — 1960 Vice President | | 2003 | | Senior Managing Director, Investments, Invesco Ltd.; Director, Co-President, Co-Chief Executive Officer, and Co-Chairman, Invesco Advisers, Inc. (formerly known as Invesco Institutional (N.A.), Inc.) (registered investment adviser); Chairman, Invesco Senior Secured Management, Inc.; Senior Vice President, Invesco Management Group, Inc. (formerly known as Invesco Aim Management Group, Inc.); Executive Vice President, Invesco Distributors, Inc. (formerly known as Invesco Aim Distributors, Inc.); Director, Invesco Mortgage Capital Inc. and Invesco Management Company Limited; Vice President, The Invesco Funds (other than AIM Treasurer’s Series Trust (Invesco Treasurer’s Series Trust), Short-Term Investments Trust and Invesco Management Trust); and President and Principal Executive Officer, The Invesco Funds (AIM Treasurer’s Series Trust (Invesco Treasurer’s Series Trust), Short-Term Investments Trust and Invesco Management Trust only) Formerly: Director and President, INVESCO Asset Management (Bermuda) Ltd., Director, INVESCO Global Asset Management Limited and INVESCO Management S.A.; Senior Vice President, Van Kampen Investments Inc. and Invesco Advisers, Inc. (formerly known as Invesco Institutional (N.A.), Inc.) (registered investment adviser); Vice President, Invesco Advisers, Inc. (formerly known as Invesco Institutional (N.A.), Inc.); Director of Cash Management and Senior Vice President, Invesco Advisers, Inc. and Invesco Aim Capital Management, Inc.; Director and President, Fund Management Company; Chief Cash Management Officer, Director of Cash Management, Senior Vice President, and Managing Director, Invesco Aim Capital Management, Inc.; Director of Cash Management, Senior Vice President, and Vice President, Invesco Advisers, Inc. and The Invesco Funds (AIM Treasurer’s Series Trust (Invesco Treasurer’s Series Trust), and Short-Term Investments Trust only) | | N/A | | N/A |
Crissie M. Wisdom — 1969 Anti-Money Laundering Compliance Officer | | 2013 | | Anti-Money Laundering Compliance Officer, Invesco Advisers, Inc. (formerly known as Invesco Institutional (N.A.), Inc.) (registered investment adviser), Invesco Capital Markets, Inc. (formerly known as Van Kampen Funds Inc.), Invesco Distributors, Inc., Invesco Investment Services, Inc., Invesco Management Group, Inc., Van Kampen Exchange Corp., The Invesco Funds, and PowerShares Exchange-Traded Fund Trust, PowerShares Exchange-Traded Fund Trust II, PowerShares India Exchange-Traded Fund Trust, PowerShares Actively Managed Exchange-Traded Fund Trust and PowerShares Actively Managed Exchange-Traded Commodity Fund Trust; Anti-Money Laundering Compliance Officer and Bank Secrecy Act Officer, INVESCO National Trust Company and Invesco Trust Company; and Fraud Prevention Manager and Controls and Risk Analysis Manager for Invesco Investment Services, Inc. | | N/A | | N/A |
Lisa O. Brinkley — 1959 Chief Compliance Officer | | 2015 | | Senior Vice President and Chief Compliance Officer, Invesco Advisers, Inc. (registered investment adviser) (formerly known as Invesco Institutional (N.A., Inc.); and Chief Compliance Officer, The Invesco Funds Formerly: Global Assurance Officer, Invesco Ltd. and Vice President, The Invesco Funds; Chief Compliance Officer, Invesco Distributors, Inc. (formerly known as Invesco Aim Distributors, Inc.), Invesco Investment Services, Inc.(formerly known as Invesco Aim Investment Services, Inc.) and Van Kampen Investor Services Inc.; Senior Vice President, Invesco Management Group, Inc.; Senior Vice President and Chief Compliance Officer, Invesco Advisers, Inc. and The Invesco Funds; Vice President and Chief Compliance Officer, Invesco Aim Capital Management, Inc. and Invesco Distributors, Inc.; Vice President, Invesco Investment Services, Inc. and Fund Management Company | | N/A | | N/A |
The Statement of Additional Information of the Trust includes additional information about the Fund’s Trustees and is available upon request, without charge, by calling 1.800.959.4246. Please refer to the Fund’s prospectus for information on the Fund’s sub-advisers.
| | | | | | |
Office of the Fund 11 Greenway Plaza, Suite 1000 Houston, TX 77046-1173 | | Investment Adviser Invesco Advisers, Inc. 1555 Peachtree Street, N.E. Atlanta, GA 30309 | | Distributor Invesco Distributors, Inc. 11 Greenway Plaza, Suite 1000 Houston, TX 77046-1173 | | Auditors PricewaterhouseCoopers LLP 1000 Louisiana Street, Suite 5800 Houston, TX 77002-5678 |
| | | |
| | | | | | |
Counsel to the Fund Stradley Ronon Stevens & Young, LLP 2005 Market Street, Suite 2600 Philadelphia, PA 19103-7018 | | Counsel to the Independent Trustees Goodwin Procter LLP 901 New York Avenue, N.W. Washington, D.C. 20001 | | Transfer Agent Invesco Investment Services, Inc. 11 Greenway Plaza, Suite 1000 Houston, TX 77046-1173 | | Custodian State Street Bank and Trust Company 225 Franklin Street Boston, MA 02110-2801 |
Invesco V.I. Managed Volatility Fund
| | | | |
| | |

| | Annual Report to Shareholders | | December 31, 2015 |
| | |
| | Invesco V.I. Mid Cap Core Equity Fund |

| | |
| | The Fund provides a complete list of its holdings four times in each fiscal year, at the quarter-ends. For the second and fourth quarters, the lists appear in the Fund’s semiannual and annual reports to shareholders. For the first and third quarters, the Fund files the lists with the Securities and Exchange Commission (SEC) on Form N-Q. The Fund’s Form N-Q filings are available on the SEC website, sec.gov. Copies of the Fund’s Forms N-Q may be reviewed and copied at the SEC Public Reference Room in Washington, D.C. You can obtain information on the operation of the Public Reference Room, including information about duplicating fee charges, by calling 202 551 8090 or 800 732 0330, or by electronic request at the following email address: publicinfo@sec.gov. The SEC file numbers for the Fund are 811-07452 and 033-57340. The Fund’s most recent portfolio holdings, as filed on Form N-Q, have also been made available to insurance companies issuing variable annuity contracts and variable life insurance policies (“variable products”) that invest in the Fund. A description of the policies and procedures that the Fund uses to determine how to vote proxies relating to portfolio securities is available without charge, upon request, from our Client Services department at 800 959 4246 or at invesco.com/ proxyguidelines. The information is also available on the SEC website, sec.gov. Information regarding how the Fund voted proxies related to its portfolio securities during the most recent 12-month period ended June 30 is available at invesco.com/proxysearch. The information is also available on the SEC website, sec.gov. Invesco Advisers, Inc. is an investment adviser; it provides investment advisory services to individual and institutional clients and does not sell securities. Invesco Distributors, Inc. is the US distributor for Invesco Ltd.’s retail mutual funds, exchange-traded funds and institutional money market funds. Both are wholly owned, indirect subsidiaries of Invesco Ltd. This report must be accompanied or preceded by a currently effective Fund prospectus and variable product prospectus, which contain more complete information, including sales charges and expenses. Investors should read each carefully before investing. Invesco Distributors, Inc. VIMCCE-AR-1 NOT FDIC INSURED | MAY LOSE VALUE | NO BANK GUARANTEE |
Management’s Discussion of Fund Performance
Performance summary
For the year ended December 31, 2015, Series I shares of Invesco V.I. Mid Cap Core Equity Fund (the Fund), underperformed the Russell Midcap Index, the Fund’s style-specific benchmark.
Your Fund’s long-term performance appears later in this report.
Fund vs. Indexes
Total returns, 12/31/14 to 12/31/15, excluding variable product issuer charges.
If variable product issuer charges were included, returns would be lower.
| | | | | |
| Series I Shares | | | | -4.03 | % |
| Series II Shares | | | | -4.28 | |
| S&P 500 Index▼ (Broad Market Index) | | | | 1.38 | |
| Russell Midcap Index▼ (Style-Specific Index) | | | | -2.44 | |
| Lipper VUF Mid-Cap Core Funds Indexn (Peer Group Index) | | | | -4.26 | |
Source(s): ▼FactSet Research Systems Inc.; nLipper Inc.
Market conditions and your Fund
The US economy continued its modest, but steady growth, during the year ended December 31, 2015 – although the health of individual economic sectors varied dramatically. The headline economic story was a steady decline in already-battered energy markets, as oil prices plummeted when increased supply overwhelmed demand. This decline particularly affected companies with US-based offshore or shale-based resources – companies whose cost to recover oil is higher than many traditional producers. On the other end of the spectrum, the improved position of the US consumer was the more subtle story which drove the US economy forward during the year.
As the year began, economic growth appeared to be stronger in the US than in the rest of the world. US equity markets were recovering from the crash of oil prices initiated by OPEC’s decision to maintain high production despite low prices and slowing global growth. The
view that the US Federal Reserve (the Fed) would begin raising rates while other central banks were loosening monetary policy led the US dollar to strengthen against many currencies. This hurt commodity- and materials-based economies – and companies in related sectors. Additionally, US-based multinational companies faced foreign exchange headwinds. Low interest rates, the increasing availability of credit and an improving employment picture all contributed to higher consumer confidence and consumer spending, which drove US equity markets higher, particularly through the spring, and helped overcome fears that Greece and the eurozone would fail to reach an agreement on a financial bailout plan.
In the summer of 2015, US equity markets moved sharply lower. A significant downturn in China’s financial markets and weak global economic growth led the Fed to delay raising interest rates; this, in turn, increased investor uncertainty and market volatility. A continued decline in oil prices also contributed to market volatilty.
In the fall of 2015, however, US markets rallied, the Fed saw enough economic stabilization to finally raise interest rates, and most major US market indexes ended the year barely in positive territory.
During the year, stock selection in the energy, financials and materials sectors benefited Fund performance relative to the style-specific benchmark. The largest detractors from Fund performance included stock selection in the consumer discretionary, health care, industrials and information technology (IT) sectors.
One of the most significant contributors to Fund performance for the year was Salix Pharmaceuticals. Salix received multiple takeover offers before agreeing to be acquired by Valeant Pharmaceuticals (not a Fund holding).
Insurance company Progressive was also a contributor to Fund performance. During the year, the company released a strong earnings report with better-than-expected top-line growth supported by continued gains in market share. This positive outlook boosted the company’s stock price.
The largest detractor from Fund performance relative to the Russell Midcap Index was Kennametal. The industrial machinery specialist struggled due to its exposure to the slumping energy sector. In addition, the company’s exposure to China, particularly in the automotive and coal industries, hurt its stock price.
NetApp posted disappointing results and announced a cautious earnings outlook as the company struggled to find customers for its data-storage products amid a shift to various cloud storage offerings and several next-generation storage competitors.
| | | | | |
| Portfolio Composition |
| By sector | | | | % of total net assets | |
| | | | | |
| |
| Financials | | | | 20.9 | % |
| Information Technology | | | | 16.3 | |
| Industrials | | | | 13.2 | |
| Consumer Discretionary | | | | 10.4 | |
| Health Care | | | | 10.0 | |
| Materials | | | | 5.3 | |
| Consumer Staples | | | | 4.5 | |
| Energy | | | | 4.3 | |
| Utilities | | | | 3.7 | |
| Money Market Funds | | | | | |
| Plus Other Assets Less Liabilities | | | | 11.4 | |
| | | | | | | |
| Top 10 Equity Holdings* |
| | | | | | % of total net assets | |
| | | | | | | |
| | |
| 1. | | Progressive Corp. (The) | | | | 3.1 | % |
| 2. | | First Republic Bank | | | | 3.0 | |
| 3. | | Moody’s Corp. | | | | 2.7 | |
| 4. | | Brown & Brown, Inc. | | | | 2.5 | |
| 5. | | St. James’s Place PLC | | | | 2.3 | |
| 6. | | Amphenol Corp.-Class A | | | | 2.2 | |
| 7. | | Torchmark Corp. | | | | 2.2 | |
| 8. | | Arch Capital Group Ltd. | | | | 2.2 | |
| 9. | | CMS Energy Corp. | | | | 2.1 | |
| 10. | | Stanley Black & Decker Inc. | | | | 2.0 | |
| | | | | |
| Total Net Assets | | | $ | 320.0 million | |
| |
| Total Number of Holdings* | | | | 63 | |
The Fund’s holdings are subject to change, and there is no assurance that the Fund will continue to hold any particular security.
*Excluding money market fund holdings.
Data presented here are as of December 31, 2015.
Invesco V.I. Mid Cap Core Equity Fund
The Fund’s conservative positioning and allocation to cash hurt Fund performance during the year. We have been quite active in deploying cash during periods of market volatility. Though the Fund’s allocation to cash decreased during the year, our position detracted from Fund performance.
During the reporting period, our largest overweight position relative to the Russell Midcap Index was in the IT sector. The Fund also had a slight overweight position in the energy sector. The largest underweight positions were in the consumer discretionary, consumer staples, financials, health care, industrials, materials and utilities sectors.
As always, we are focused on companies that provide an attractive return on invested capital, trade at attractive valuations and have management teams with a long-term perspective. In short, we seek to take advantage of the market’s volatile behavior and short-term focus. We believe our conservative approach should position the Fund to navigate the evolving economic backdrop.
We thank you for your continued investment in Invesco V.I. Mid Cap Core Equity Fund.
The views and opinions expressed in management’s discussion of Fund performance are those of Invesco Advisers, Inc. These views and opinions are subject to change at any time based on factors such as market and economic conditions. These views and opinions may not be relied upon as investment advice or recommendations, or as an offer for a particular security. The information is not a complete analysis of every aspect of any market, country, industry, security or the Fund. Statements of fact are from sources considered reliable, but Invesco Advisers, Inc. makes no representation or warranty as to their completeness or accuracy. Although historical performance is no guarantee of future results, these insights may help you understand our investment management philosophy.
See important Fund and, if applicable, index disclosures later in this report.
| | |
 | | Ronald Sloan Chartered Financial Analyst, Portfolio Manager and Chief Investment Officer of Invesco’s global core |
equity team, is lead manager of Invesco V.I. Mid Cap Core Equity Fund. He joined Invesco in 1998. Mr. Sloan earned a BS in business administration and an MBA from the University of Missouri. |
| |

| | Brian Nelson Chartered Financial Analyst, Portfolio Manager, is manager of Invesco V.I. Mid Cap Core Equity Fund. He |
joined Invesco in 2004. Mr. Nelson earned a BA from the University of California, Santa Barbara. |
|
Assisted by Invesco’s Global Core Equity Team |
Invesco V.I. Mid Cap Core Equity Fund
Your Fund’s Long-Term Performance
Results of a $10,000 Investment – Oldest Share Class(es)
Fund and index data from 12/31/05
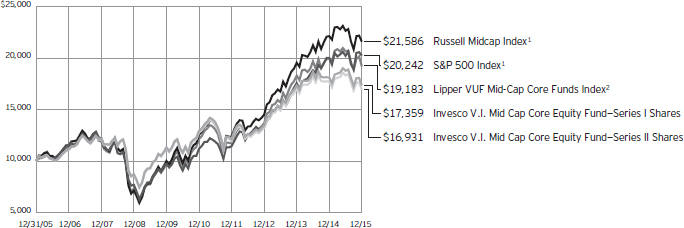
| 1 | Source: FactSet Research Systems Inc. |
Past performance cannot guarantee
comparable future results.
| | | | | |
| Average Annual Total Returns |
As of 12/31/15 | | | | | |
| |
| Series I Shares | | | | | |
| Inception (9/10/01) | | | | 6.86 | % |
| 10 Years | | | | 5.67 | |
| 5 Years | | | | 6.05 | |
| 1 Year | | | | -4.03 | |
| |
| Series II Shares | | | | | |
| Inception (9/10/01) | | | | 6.60 | % |
| 10 Years | | | | 5.41 | |
| 5 Years | | | | 5.79 | |
| 1 Year | | | | -4.28 | |
The performance of the Fund’s Series I and Series II share classes will differ primarily due to different class expenses.
The performance data quoted represent past performance and cannot guarantee comparable future results; current performance may be lower or higher. Please contact your variable product issuer or financial adviser for the most recent month-end variable product performance. Performance figures reflect Fund expenses, reinvested distributions and changes in net asset value. Investment return and
principal value will fluctuate so that you may have a gain or loss when you sell shares.
The net annual Fund operating expense ratio set forth in the most recent Fund prospectus as of the date of this report for Series I and Series II shares was 1.04% and 1.29%, respectively.1 The total annual Fund operating expense ratio set forth in the most recent Fund prospectus as of the date of this report for Series I and Series II shares was 1.07% and 1.32%, respectively. The expense ratios presented above may vary from the expense ratios presented in other sections of this report that are based on expenses incurred during the period covered by this report.
Invesco V.I. Mid Cap Core Equity Fund, a series portfolio of AIM Variable Insurance Funds (Invesco Variable Insurance Funds), is currently offered through insurance companies issuing variable products. You cannot purchase shares of the Fund directly. Performance figures given represent the Fund and are not intended to reflect
actual variable product values. They do not reflect sales charges, expenses and fees assessed in connection with a variable product. Sales charges, expenses and fees, which are determined by the variable product issuers, will vary and will lower the total return.
The most recent month-end performance at the Fund level, excluding variable product charges, is available at 800 451 4246. As mentioned above, for the most recent month-end performance including variable product charges, please contact your variable product issuer or financial adviser.
Fund performance reflects any applicable fee waivers and/or expense reimbursements. Had the adviser not waived fees and/or reimbursed expenses currently or in the past, returns would have been lower. See current prospectus for more information.
| 1 | Total annual Fund operating expenses after any contractual fee waivers and/or expense reimbursements by the adviser in effect through at least June 30, 2017. See current prospectus for more information. |
Invesco V.I. Mid Cap Core Equity Fund
Invesco V.I. Mid Cap Core Equity Fund’s investment objective is long-term growth of capital.
| n | | Unless otherwise stated, information presented in this report is as of December 31, 2015, and is based on total net assets. |
| n | | Unless otherwise noted, all data provided by Invesco. |
| n | | To access your Fund’s reports/prospectus, visit invesco.com/fundreports. |
Principal risks of investing in the Fund
Cash/cash equivalents risk. Holding cash or cash equivalents may negatively affect performance.
Derivatives risk. The value of a derivative instrument depends largely on (and is derived from) the value of an underlying security, currency, commodity, interest rate, index or other asset (each referred to as an underlying asset). In addition to risks relating to the underlying assets, the use of derivatives may include other, possibly greater, risks, including counterparty, leverage and liquidity risks. Counterparty risk is the risk that the counterparty to the derivative contract will default on its obligation to pay the Fund the amount owed or otherwise perform under the derivative contract. Derivatives create leverage risk because they do not require payment up front equal to the economic exposure created by owning the derivative. As a result, an adverse change in the value of the underlying asset could result in the Fund sustaining a loss that is substantially greater than the amount invested in the derivative, which may make the Fund’s returns more volatile and increase the risk of loss. Derivative instruments may also be less liquid than more traditional investments and the Fund may be unable to sell or close out its derivative positions at a desirable time or price. This risk may be more acute under adverse market conditions, during which the Fund may be most in need of liquidating its derivative positions. Derivatives may also be harder to value, less tax efficient and subject to changing government regulation that could impact the Fund’s ability to use certain derivatives or their cost. Also, derivatives used for hedging or to gain or limit exposure to a particular market segment may not provide the expected benefits, particularly during adverse market conditions.
Developing/emerging markets securities risk. The prices of securities issued by foreign companies and governments located in developing/emerging markets countries may be affected more negatively by inflation, devaluation of their currencies, higher transaction costs, delays in settlement, adverse political developments, the introduction of capital controls,
withholding taxes, nationalization of private assets, expropriation, social unrest, war or lack of timely information than those in developed countries.
Foreign securities risk. The Fund’s foreign investments may be affected by changes in a foreign country’s exchange rates, political and social instability, changes in economic or taxation policies, difficulties when enforcing obligations, decreased liquidity, and increased volatility. Foreign companies may be subject to less regulation resulting in less publicly available information about the companies.
Management risk. The investment techniques and risk analysis used by the Fund’s portfolio managers may not produce the desired results.
Market risk. The prices of and the income generated by the Fund’s securities may decline in response to, among other things, investor sentiment, general economic and market conditions, regional or global instability, and currency and interest rate fluctuations.
Small- and mid-capitalization risks. Stocks of small- and mid-sized companies tend to be more vulnerable to adverse developments and may have little or no operating history or track record of success, and limited product lines, markets, management and financial resources. The securities of small- and mid-sized companies may be more volatile due to less market interest and less publicly available information about the issuer. They also may be illiquid or restricted as to resale, or may trade less frequently and in smaller volumes, all of which may cause difficulty when establishing or closing a position at a desirable price.
About indexes used in this report
The S&P 500® Index is an unmanaged index considered representative of the US stock market.
The Russell Midcap® Index is an unmanaged index considered representative of mid-cap stocks. The Russell Midcap Index is a trademark/service mark of the Frank Russell Co. Russell® is a trademark of the Frank Russell Co.
The Lipper VUF Mid-Cap Core Funds Index is an unmanaged index considered representative of mid-cap core variable insurance underlying funds tracked by Lipper.
The Fund is not managed to track the performance of any particular index, including the index(es) described here, and consequently, the performance of the Fund may deviate significantly from the performance of the index(es).
A direct investment cannot be made in an index. Unless otherwise indicated, index results include reinvested dividends, and they do not reflect sales charges. Performance of the peer group, if applicable, reflects fund expenses; performance of a market index does not.
Other information
The returns shown in management’s discussion of Fund performance are based on net asset values calculated for shareholder transactions. Generally accepted accounting principles require adjustments to be made to the net assets of the Fund at period end for financial reporting purposes, and as such, the net asset values for shareholder transactions and the returns based on those net asset values may differ from the net asset values and returns reported in the Financial Highlights. Additionally, the returns and net asset values shown throughout this report are at the Fund level only and do not include variable product issuer charges. If such charges were included, the total returns would be lower.
Industry classifications used in this report are generally according to the Global Industry Classification Standard, which was developed by and is the exclusive property and a service mark of MSCI Inc. and Standard & Poor’s.
Invesco V.I. Mid Cap Core Equity Fund
Schedule of Investments(a)
December 31, 2015
| | | | | | | | |
| | | Shares | | | Value | |
Common Stocks & Other Equity Interests–88.59% | |
| Advertising–1.06% | | | | | | | | |
Publicis Groupe S.A. (France) | | | 51,303 | | | $ | 3,402,642 | |
|
| Aerospace & Defense–0.82% | |
Meggitt PLC (United Kingdom) | | | 474,071 | | | | 2,618,598 | |
|
| Apparel, Accessories & Luxury Goods–1.16% | |
PVH Corp. | | | 50,481 | | | | 3,717,926 | |
|
| Application Software–1.00% | |
Synopsys, Inc.(b) | | | 70,220 | | | | 3,202,734 | |
|
| Asset Management & Custody Banks–1.76% | |
Northern Trust Corp. | | | 77,931 | | | | 5,618,046 | |
|
| Auto Parts & Equipment–1.12% | |
Dana Holding Corp. | | | 259,119 | | | | 3,575,842 | |
|
| Biotechnology–1.35% | |
United Therapeutics Corp.(b) | | | 27,548 | | | | 4,314,292 | |
|
| Brewers–1.30% | |
Molson Coors Brewing Co.–Class B | | | 44,172 | | | | 4,148,634 | |
|
| Communications Equipment–2.50% | |
F5 Networks, Inc.(b) | | | 45,706 | | | | 4,431,654 | |
Juniper Networks, Inc. | | | 129,481 | | | | 3,573,675 | |
| | | | 8,005,329 | |
|
| Computer & Electronics Retail–0.86% | |
GameStop Corp.–Class A | | | 97,761 | | | | 2,741,218 | |
|
| Data Processing & Outsourced Services–1.81% | |
Jack Henry & Associates, Inc. | | | 74,325 | | | | 5,801,810 | |
|
| Electronic Components–2.23% | |
Amphenol Corp.–Class A | | | 136,755 | | | | 7,142,714 | |
|
| Electronic Equipment & Instruments–1.31% | |
FLIR Systems, Inc. | | | 149,207 | | | | 4,188,240 | |
|
| Environmental & Facilities Services–1.54% | |
Republic Services, Inc. | | | 112,300 | | | | 4,940,077 | |
|
| Health Care Distributors–1.78% | |
Cardinal Health, Inc. | | | 63,675 | | | | 5,684,267 | |
|
| Health Care Equipment–2.38% | |
ResMed Inc. | | | 74,034 | | | | 3,974,885 | |
Wright Medical Group N.V.(b) | | | 151,037 | | | | 3,652,075 | |
| | | | 7,626,960 | |
|
| Health Care Facilities–1.43% | |
Community Health Systems Inc.(b) | | | 92,674 | | | | 2,458,641 | |
Tenet Healthcare Corp.(b) | | | 69,661 | | | | 2,110,729 | |
| | | | 4,569,370 | |
| | | | | | | | |
| | | Shares | | | Value | |
| Homebuilding–1.79% | |
D.R. Horton, Inc. | | | 178,392 | | | $ | 5,713,896 | |
|
| Homefurnishing Retail–0.90% | |
Aaron’s, Inc. | | | 128,088 | | | | 2,867,890 | |
|
| Hotels, Resorts & Cruise Lines–1.48% | |
Norwegian Cruise Line Holdings Ltd.(b) | | | 80,898 | | | | 4,740,623 | |
|
| Household Appliances–0.97% | |
Whirlpool Corp. | | | 21,114 | | | | 3,101,013 | |
|
| Industrial Machinery–9.15% | |
Flowserve Corp. | | | 46,211 | | | | 1,944,559 | |
Kennametal Inc. | | | 183,660 | | | | 3,526,272 | |
Lincoln Electric Holdings, Inc. | | | 74,603 | | | | 3,871,149 | |
Nordson Corp. | | | 50,048 | | | | 3,210,579 | |
Parker-Hannifin Corp. | | | 25,044 | | | | 2,428,767 | |
Stanley Black & Decker Inc. | | | 61,012 | | | | 6,511,811 | |
Timken Co. (The) | | | 116,913 | | | | 3,342,543 | |
Xylem, Inc. | | | 122,002 | | | | 4,453,073 | |
| | | | 29,288,753 | |
|
| Insurance Brokers–2.48% | |
Brown & Brown, Inc. | | | 247,235 | | | | 7,936,243 | |
|
| IT Consulting & Other Services–1.04% | |
EPAM Systems, Inc.(b) | | | 42,275 | | | | 3,323,661 | |
|
| Life & Health Insurance–4.54% | |
St. James’s Place PLC (United Kingdom) | | | 501,157 | | | | 7,391,533 | |
Torchmark Corp. | | | 124,804 | | | | 7,133,797 | |
| | | | 14,525,330 | |
|
| Life Sciences Tools & Services–1.52% | |
Agilent Technologies, Inc. | | | 116,560 | | | | 4,873,374 | |
|
| Marine–0.62% | |
Kirby Corp.(b) | | | 37,465 | | | | 1,971,408 | |
|
| Multi-Utilities–3.66% | |
CMS Energy Corp. | | | 185,370 | | | | 6,688,149 | |
WEC Energy Group, Inc. | | | 97,944 | | | | 5,025,507 | |
| | | | 11,713,656 | |
|
| Office REIT’s–1.01% | |
Boston Properties, Inc. | | | 25,439 | | | | 3,244,490 | |
|
| Oil & Gas Equipment & Services–0.99% | |
Core Laboratories N.V. | | | 29,113 | | | | 3,165,748 | |
|
| Oil & Gas Exploration & Production–3.27% | |
Cabot Oil & Gas Corp. | | | 183,971 | | | | 3,254,447 | |
Concho Resources Inc.(b) | | | 41,565 | | | | 3,859,726 | |
Vermilion Energy, Inc. (Canada) | | | 123,219 | | | | 3,348,096 | |
| | | | | | | | 10,462,269 | |
See accompanying Notes to Financial Statements which are an integral part of the financial statements.
Invesco V.I. Mid Cap Core Equity Fund
| | | | | | | | |
| | | Shares | | | Value | |
| Packaged Foods & Meats–3.22% | |
Hain Celestial Group, Inc. (The)(b) | | | 47,693 | | | $ | 1,926,320 | |
JM Smucker Co. (The) | | | 41,281 | | | | 5,091,599 | |
Mead Johnson Nutrition Co. | | | 41,743 | | | | 3,295,610 | |
| | | | | | | | 10,313,529 | |
|
| Paper Packaging–0.73% | |
Packaging Corp. of America | | | 36,944 | | | | 2,329,319 | |
|
| Pharmaceuticals–1.50% | |
Endo International PLC(b) | | | 78,440 | | | | 4,802,097 | |
|
| Property & Casualty Insurance–5.36% | |
Arch Capital Group Ltd.(b) | | | 101,919 | | | | 7,108,850 | |
Progressive Corp. (The) | | | 316,325 | | | | 10,059,135 | |
| | | | | | | | 17,167,985 | |
|
| Regional Banks–3.04% | |
First Republic Bank | | | 147,331 | | | | 9,732,686 | |
|
| Semiconductor Equipment–1.40% | |
Teradyne, Inc. | | | 216,713 | | | | 4,479,458 | |
|
| Semiconductors–3.71% | |
Linear Technology Corp. | | | 146,958 | | | | 6,241,306 | |
Xilinx, Inc. | | | 119,939 | | | | 5,633,535 | |
| | | | | | | | 11,874,841 | |
|
| Specialized Finance–2.67% | |
Moody’s Corp. | | | 85,062 | | | | 8,535,121 | |
| | | | | | | | |
| | | Shares | | | Value | |
| Specialty Chemicals–4.61% | |
Albemarle Corp. | | | 93,037 | | | $ | 5,211,002 | |
International Flavors & Fragrances Inc. | | | 51,197 | | | | 6,125,209 | |
Koninklijke DSM N.V. (Netherlands) | | | 68,006 | | | | 3,403,174 | |
| | | | | | | | 14,739,385 | |
|
| Specialty Stores–1.06% | |
Dick’s Sporting Goods, Inc. | | | 95,598 | | | | 3,379,389 | |
|
| Technology Hardware, Storage & Peripherals–1.33% | |
NetApp, Inc. | | | 160,800 | | | | 4,266,024 | |
|
| Trucking–1.13% | |
Hertz Global Holdings, Inc.(b) | | | 253,255 | | | | 3,603,819 | |
Total Common Stocks & Other Equity Interests (Cost $239,407,582) | | | | 283,450,706 | |
|
Money Market Funds–11.61% | |
Liquid Assets Portfolio–Institutional Class, 0.29%(c) | | | 18,573,375 | | | | 18,573,375 | |
Premier Portfolio–Institutional Class, 0.24%(c) | | | 18,573,376 | | | | 18,573,376 | |
Total Money Market Funds
(Cost $37,146,751) | | | | | | | 37,146,751 | |
TOTAL INVESTMENTS–100.20%
(Cost $276,554,333) | | | | | | | 320,597,457 | |
OTHER ASSETS LESS
LIABILITIES–(0.20)% | | | | | | | (636,784 | ) |
NET ASSETS–100.00% | | | | | | $ | 319,960,673 | |
Investment Abbreviations:
| | |
| REIT | | – Real Estate Investment Trust |
Notes to Schedule of Investments:
| (a) | Industry and/or sector classifications used in this report are generally according to the Global Industry Classification Standard, which was developed by and is the exclusive property and a service mark of MSCI Inc. and Standard & Poor’s. |
| (b) | Non-income producing security. |
| (c) | The money market fund and the Fund are affiliated by having the same investment adviser. The rate shown is the 7-day SEC standardized yield as of December 31, 2015. |
See accompanying Notes to Financial Statements which are an integral part of the financial statements.
Invesco V.I. Mid Cap Core Equity Fund
Statement of Assets and Liabilities
December 31, 2015
Statement of Operations
For the year ended December 31, 2015
| | | | |
Assets: | | | | |
Investments, at value (Cost $239,407,582) | | $ | 283,450,706 | |
Investments in affiliated money market funds, at value and cost | | | 37,146,751 | |
Total investments, at value (Cost $276,554,333) | | | 320,597,457 | |
Foreign currencies, at value (Cost $13,802) | | | 13,700 | |
Receivable for: | | | | |
Fund shares sold | | | 16,277 | |
Dividends | | | 344,557 | |
Investment for trustee deferred compensation and retirement plans | | | 104,692 | |
Total assets | | | 321,076,683 | |
| |
Liabilities: | | | | |
Payable for: | | | | |
Investments purchased | | | 443,885 | |
Fund shares reacquired | | | 257,944 | |
Accrued fees to affiliates | | | 279,572 | |
Accrued trustees’ and officers’ fees and benefits | | | 157 | |
Accrued other operating expenses | | | 14,588 | |
Trustee deferred compensation and retirement plans | | | 119,864 | |
Total liabilities | | | 1,116,010 | |
Net assets applicable to shares outstanding | | $ | 319,960,673 | |
| |
Net assets consist of: | | | | |
Shares of beneficial interest | | $ | 255,170,214 | |
Undistributed net investment income | | | 35,124 | |
Undistributed net realized gain | | | 20,712,185 | |
Net unrealized appreciation | | | 44,043,150 | |
| | | $ | 319,960,673 | |
| |
Net Assets: | | | | |
Series I | | $ | 201,684,981 | |
Series II | | $ | 118,275,692 | |
|
Shares outstanding, $0.001 par value per share,
with an unlimited number of shares authorized: | |
Series I | | | 16,638,905 | |
Series II | | | 9,927,067 | |
Series I: | | | | |
Net asset value per share | | $ | 12.12 | |
Series II: | | | | |
Net asset value per share | | $ | 11.91 | |
| | | | |
Investment income: | | | | |
Dividends (net of foreign withholding taxes of $48,255) | | $ | 4,213,408 | |
Dividends from affiliated money market funds | | | 44,884 | |
Total investment income | | | 4,258,292 | |
| |
Expenses: | | | | |
Advisory fees | | | 2,614,579 | |
Administrative services fees | | | 985,391 | |
Custodian fees | | | 14,805 | |
Distribution fees — Series II | | | 316,137 | |
Transfer agent fees | | | 37,620 | |
Trustees’ and officers’ fees and benefits | | | 27,277 | |
Other | | | 50,358 | |
Total expenses | | | 4,046,167 | |
Less: Fees waived | | | (80,636 | ) |
Net expenses | | | 3,965,531 | |
Net investment income | | | 292,761 | |
| |
Realized and unrealized gain (loss) from: | | | | |
Net realized gain (loss) from: | | | | |
Investment securities | | | 20,871,033 | |
Foreign currencies | | | (60,534 | ) |
| | | | 20,810,499 | |
Change in net unrealized appreciation (depreciation) of: | | | | |
Investment securities | | | (34,095,694 | ) |
Foreign currencies | | | 67 | |
| | | | (34,095,627 | ) |
Net realized and unrealized gain (loss) | | | (13,285,128 | ) |
Net increase (decrease) in net assets resulting from operations | | $ | (12,992,367 | ) |
See accompanying Notes to Financial Statements which are an integral part of the financial statements.
Invesco V.I. Mid Cap Core Equity Fund
Statement of Changes in Net Assets
For the years ended December 31, 2015 and 2014
| | | | | | | | |
| | | 2015 | | | 2014 | |
Operations: | | | | | | | | |
Net investment income | | $ | 292,761 | | | $ | 845,635 | |
Net realized gain | | | 20,810,499 | | | | 32,956,386 | |
Change in net unrealized appreciation (depreciation) | | | (34,095,627 | ) | | | (16,651,461 | ) |
Net increase (decrease) in net assets resulting from operations | | | (12,992,367 | ) | | | 17,150,560 | |
| | |
Distributions to shareholders from net investment income: | | | | | | | | |
Series I | | | (774,992 | ) | | | (103,075 | ) |
Series ll | | | (130,328 | ) | | | — | |
Total distributions from net investment income | | | (905,320 | ) | | | (103,075 | ) |
| | |
Distributions to shareholders from net realized gains: | | | | | | | | |
Series l | | | (20,812,280 | ) | | | (29,565,808 | ) |
Series ll | | | (11,890,260 | ) | | | (14,396,190 | ) |
Total distributions from net realized gains | | | (32,702,540 | ) | | | (43,961,998 | ) |
| | |
Share transactions–net: | | | | | | | | |
Series l | | | (23,442,519 | ) | | | (18,688,127 | ) |
Series ll | | | 7,145,332 | | | | 20,690,882 | |
Net increase (decrease) in net assets resulting from share transactions | | | (16,297,187 | ) | | | 2,002,755 | |
Net increase (decrease) in net assets | | | (62,897,414 | ) | | | (24,911,758 | ) |
| | |
Net assets: | | | | | | | | |
Beginning of year | | | 382,858,087 | | | | 407,769,845 | |
End of year (includes undistributed net investment income of $35,124 and $708,217, respectively) | | $ | 319,960,673 | | | $ | 382,858,087 | |
Notes to Financial Statements
December 31, 2015
NOTE 1—Significant Accounting Policies
Invesco V.I. Mid Cap Core Equity Fund (the “Fund”) is a series portfolio of AIM Variable Insurance Funds (Invesco Variable Insurance Funds) (the “Trust”). The Trust is a Delaware statutory trust registered under the Investment Company Act of 1940, as amended (the “1940 Act”), as an open-end series management investment company consisting of twenty-four separate portfolios, (each constituting a “Fund”). The assets, liabilities and operations of each portfolio are accounted for separately. Information presented in these financial statements pertains only to the Fund. Matters affecting each Fund or class will be voted on exclusively by the shareholders of such Fund or class. Current Securities and Exchange Commission (“SEC”) guidance, however, requires participating insurance companies offering separate accounts to vote shares proportionally in accordance with the instructions of the contract owners whose investments are funded by shares of each Fund or class.
The Fund’s investment objective is long-term growth of capital.
The Fund currently offers two classes of shares, Series I and Series II, both of which are offered to insurance company separate accounts funding variable annuity contracts and variable life insurance policies (“variable products”).
The following is a summary of the significant accounting policies followed by the Fund in the preparation of its financial statements.
| A. | Security Valuations — Securities, including restricted securities, are valued according to the following policy. |
A security listed or traded on an exchange (except convertible securities) is valued at its last sales price or official closing price as of the close of the customary trading session on the exchange where the security is principally traded, or lacking any sales or official closing price on a particular day, the security may be valued at the closing bid price on that day. Securities traded in the over-the-counter market are valued based on prices furnished by independent pricing services or market makers. When such securities are valued by an independent pricing service they may be considered fair valued. Futures contracts are valued at the final settlement price set by an exchange on which they are principally traded. Listed options are valued at the mean between the last bid and asked prices from the exchange on which they are principally traded. Options not listed on an exchange are valued by an independent source at the mean between the last bid and asked prices. For purposes of determining net asset value (“NAV”) per share, futures and option contracts generally are valued 15 minutes after the close of the customary trading session of the New York Stock Exchange (“NYSE”).
Investments in open-end and closed-end registered investment companies that do not trade on an exchange are valued at the end-of-day net asset value per share. Investments in open-end and closed-end registered investment companies that trade on an exchange are valued at the last sales price or official closing price as of the close of the customary trading session on the exchange where the security is principally traded.
Debt obligations (including convertible securities) and unlisted equities are fair valued using an evaluated quote provided by an independent pricing service. Evaluated quotes provided by the pricing service may be determined without exclusive reliance on quoted prices, and may reflect
Invesco V.I. Mid Cap Core Equity Fund
appropriate factors such as institution-size trading in similar groups of securities, developments related to specific securities, dividend rate (for unlisted equities), yield (for debt obligations), quality, type of issue, coupon rate (for debt obligations), maturity (for debt obligations), individual trading characteristics and other market data. Debt obligations are subject to interest rate and credit risks. In addition, all debt obligations involve some risk of default with respect to interest and/or principal payments.
Foreign securities’ (including foreign exchange contracts) prices are converted into U.S. dollar amounts using the applicable exchange rates as of the close of the NYSE. If market quotations are available and reliable for foreign exchange-traded equity securities, the securities will be valued at the market quotations. Because trading hours for certain foreign securities end before the close of the NYSE, closing market quotations may become unreliable. If between the time trading ends on a particular security and the close of the customary trading session on the NYSE, events occur that the Adviser determines are significant and make the closing price unreliable, the Fund may fair value the security. If the event is likely to have affected the closing price of the security, the security will be valued at fair value in good faith using procedures approved by the Board of Trustees. Adjustments to closing prices to reflect fair value may also be based on a screening process of an independent pricing service to indicate the degree of certainty, based on historical data, that the closing price in the principal market where a foreign security trades is not the current value as of the close of the NYSE. Foreign securities’ prices meeting the approved degree of certainty that the price is not reflective of current value will be priced at the indication of fair value from the independent pricing service. Multiple factors may be considered by the independent pricing service in determining adjustments to reflect fair value and may include information relating to sector indices, American Depositary Receipts and domestic and foreign index futures. Foreign securities may have additional risks including exchange rate changes, potential for sharply devalued currencies and high inflation, political and economic upheaval, the relative lack of issuer information, relatively low market liquidity and the potential lack of strict financial and accounting controls and standards.
Securities for which market prices are not provided by any of the above methods may be valued based upon quotes furnished by independent sources. The last bid price may be used to value equity securities. The mean between the last bid and asked prices is used to value debt obligations, including corporate loans.
Securities for which market quotations are not readily available or became unreliable are valued at fair value as determined in good faith by or under the supervision of the Trust’s officers following procedures approved by the Board of Trustees. Issuer specific events, market trends, bid/asked quotes of brokers and information providers and other market data may be reviewed in the course of making a good faith determination of a security’s fair value.
The Fund may invest in securities that are subject to interest rate risk, meaning the risk that the prices will generally fall as interest rates rise and, conversely, the prices will generally rise as interest rates fall. Specific securities differ in their sensitivity to changes in interest rates depending on their individual characteristics. Changes in interest rates may result in increased market volatility, which may affect the value and/or liquidity of certain Fund investments.
Valuations change in response to many factors including the historical and prospective earnings of the issuer, the value of the issuer’s assets, general economic conditions, interest rates, investor perceptions and market liquidity. Because of the inherent uncertainties of valuation, the values reflected in the financial statements may materially differ from the value received upon actual sale of those investments.
| B. | Securities Transactions and Investment Income — Securities transactions are accounted for on a trade date basis. Realized gains or losses on sales are computed on the basis of specific identification of the securities sold. Interest income (net of withholding tax, if any) is recorded on the accrual basis from settlement date. Dividend income (net of withholding tax, if any) is recorded on the ex-dividend date. |
The Fund may periodically participate in litigation related to Fund investments. As such, the Fund may receive proceeds from litigation settlements. Any proceeds received are included in the Statement of Operations as realized gain (loss) for investments no longer held and as unrealized gain (loss) for investments still held.
Brokerage commissions and mark ups are considered transaction costs and are recorded as an increase to the cost basis of securities purchased and/or a reduction of proceeds on a sale of securities. Such transaction costs are included in the determination of net realized and unrealized gain (loss) from investment securities reported in the Statement of Operations and the Statement of Changes in Net Assets and the net realized and unrealized gains (losses) on securities per share in the Financial Highlights. Transaction costs are included in the calculation of the Fund’s net asset value and, accordingly, they reduce the Fund’s total returns. These transaction costs are not considered operating expenses and are not reflected in net investment income reported in the Statement of Operations and the Statement of Changes in Net Assets, or the net investment income per share and the ratios of expenses and net investment income reported in the Financial Highlights, nor are they limited by any expense limitation arrangements between the Fund and the investment adviser.
The Fund allocates income and realized and unrealized capital gains and losses to a class based on the relative net assets of each class.
| C. | Country Determination — For the purposes of making investment selection decisions and presentation in the Schedule of Investments, the investment adviser may determine the country in which an issuer is located and/or credit risk exposure based on various factors. These factors include the laws of the country under which the issuer is organized, where the issuer maintains a principal office, the country in which the issuer derives 50% or more of its total revenues and the country that has the primary market for the issuer’s securities, as well as other criteria. Among the other criteria that may be evaluated for making this determination are the country in which the issuer maintains 50% or more of its assets, the type of security, financial guarantees and enhancements, the nature of the collateral and the sponsor organization. Country of issuer and/or credit risk exposure has been determined to be the United States of America, unless otherwise noted. |
| D. | Distributions — Distributions from net investment income and net realized capital gain, if any, are generally declared and paid to separate accounts of participating insurance companies annually and recorded on the ex-dividend date. |
| E. | Federal Income Taxes — The Fund intends to comply with the requirements of Subchapter M of the Internal Revenue Code of 1986, as amended (the “Internal Revenue Code”), necessary to qualify as a regulated investment company and to distribute substantially all of the Fund’s taxable earnings to shareholders. As such, the Fund will not be subject to federal income taxes on otherwise taxable income (including net realized capital gain) that is distributed to shareholders. Therefore, no provision for federal income taxes is recorded in the financial statements. |
The Fund recognizes the tax benefits of uncertain tax positions only when the position is more likely than not to be sustained. Management has analyzed the Fund’s uncertain tax positions and concluded that no liability for unrecognized tax benefits should be recorded related to uncertain tax positions. Management is not aware of any tax positions for which it is reasonably possible that the total amounts of unrecognized tax benefits will change materially in the next 12 months.
Invesco V.I. Mid Cap Core Equity Fund
The Fund files tax returns in the U.S. Federal jurisdiction and certain other jurisdictions. Generally, the Fund is subject to examinations by such taxing authorities for up to three years after the filing of the return for the tax period.
| F. | Expenses — Fees provided for under the Rule 12b-1 plan of a particular class of the Fund and which are directly attributable to that class are charged to the operations of such class. All other expenses are allocated among the classes based on relative net assets. |
| G. | Accounting Estimates — The preparation of financial statements in conformity with accounting principles generally accepted in the United States of America (“GAAP”) requires management to make estimates and assumptions that affect the reported amounts of assets and liabilities at the date of the financial statements and the reported amounts of revenues and expenses during the reporting period including estimates and assumptions related to taxation. Actual results could differ from those estimates by a significant amount. In addition, the Fund monitors for material events or transactions that may occur or become known after the period-end date and before the date the financial statements are released to print. |
| H. | Indemnifications — Under the Trust’s organizational documents, each Trustee, officer, employee or other agent of the Trust is indemnified against certain liabilities that may arise out of the performance of their duties to the Fund. Additionally, in the normal course of business, the Fund enters into contracts, including the Fund’s servicing agreements, that contain a variety of indemnification clauses. The Fund’s maximum exposure under these arrangements is unknown as this would involve future claims that may be made against the Fund that have not yet occurred. The risk of material loss as a result of such indemnification claims is considered remote. |
| I. | Foreign Currency Translations — Foreign currency is valued at the close of the NYSE based on quotations posted by banks and major currency dealers. Portfolio securities and other assets and liabilities denominated in foreign currencies are translated into U.S. dollar amounts at date of valuation. Purchases and sales of portfolio securities (net of foreign taxes withheld on disposition) and income items denominated in foreign currencies are translated into U.S. dollar amounts on the respective dates of such transactions. The Fund does not separately account for the portion of the results of operations resulting from changes in foreign exchange rates on investments and the fluctuations arising from changes in market prices of securities held. The combined results of changes in foreign exchange rates and the fluctuation of market prices on investments (net of estimated foreign tax withholding) are included with the net realized and unrealized gain or loss from investments in the Statement of Operations. Reported net realized foreign currency gains or losses arise from (1) sales of foreign currencies, (2) currency gains or losses realized between the trade and settlement dates on securities transactions, and (3) the difference between the amounts of dividends, interest, and foreign withholding taxes recorded on the Fund’s books and the U.S. dollar equivalent of the amounts actually received or paid. Net unrealized foreign currency gains and losses arise from changes in the fair values of assets and liabilities, other than investments in securities at fiscal period end, resulting from changes in exchange rates. |
The Fund may invest in foreign securities, which may be subject to foreign taxes on income, gains on investments or currency repatriation, a portion of which may be recoverable. Foreign taxes, if any, are recorded based on the tax regulations and rates that exist in the foreign markets in which the Fund invests and are shown in the Statement of Operations.
| J. | Forward Foreign Currency Contracts — The Fund may engage in foreign currency transactions either on a spot (i.e. for prompt delivery and settlement) basis, or through forward foreign currency contracts, to manage or minimize currency or exchange rate risk. |
The Fund may also enter into forward foreign currency contracts for the purchase or sale of a security denominated in a foreign currency in order to “lock in” the U.S. dollar price of that security, or the Fund may also enter into forward foreign currency contracts that do not provide for physical settlement of the two currencies, but instead are settled by a single cash payment calculated as the difference between the agreed upon exchange rate and the spot rate at settlement based upon an agreed upon notional amount (non-deliverable forwards). The Fund will set aside liquid assets in an amount equal to daily mark-to-market obligation for forward foreign currency contracts.
A forward foreign currency contract is an obligation between two parties (“Counterparties”) to purchase or sell a specific currency for an agreed-upon price at a future date. The use of forward foreign currency contracts does not eliminate fluctuations in the price of the underlying securities the Fund owns or intends to acquire but establishes a rate of exchange in advance. Fluctuations in the value of these contracts are measured by the difference in the contract date and reporting date exchange rates and are recorded as unrealized appreciation (depreciation) until the contracts are closed. When the contracts are closed, realized gains (losses) are recorded. Realized and unrealized gains (losses) on the contracts are included in the Statement of Operations. The primary risks associated with forward foreign currency contracts include failure of the Counterparty to meet the terms of the contract and the value of the foreign currency changing unfavorably. These risks may be in excess of the amounts reflected in the Statement of Assets and Liabilities.
NOTE 2—Advisory Fees and Other Fees Paid to Affiliates
The Trust has entered into a master investment advisory agreement with Invesco Advisers, Inc. (the “Adviser” or “Invesco”). Under the terms of the investment advisory agreement, the Fund pays an advisory fee to the Adviser based on the annual rate of the Fund’s average daily net assets as follows:
| | | | | | |
| Average Daily Net Assets | | Rate |
First $500 million | | | 0 | .725% | | |
Next $500 million | | | 0 | .70% | | |
Next $500 million | | | 0 | .675% | | |
Over $1.5 billion | | | 0 | .65% | | |
For the year ended December 31, 2015, the effective advisory fees incurred by the Fund was 0.725%.
Under the terms of a master sub-advisory agreement between the Adviser and each of Invesco Asset Management Deutschland GmbH, Invesco Asset Management Limited, Invesco Asset Management (Japan) Limited, Invesco Hong Kong Limited, Invesco Senior Secured Management, Inc. and Invesco Canada Ltd. (collectively, the “Affiliated Sub-Advisers”) the Adviser, not the Fund, may pay 40% of the fees paid to the Adviser to any such Affiliated Sub-Adviser(s) that provide(s) discretionary investment management services to the Fund based on the percentage of assets allocated to such Affiliated Sub-Adviser(s).
Invesco V.I. Mid Cap Core Equity Fund
The Adviser has contractually agreed, through at least June 30, 2016, to waive advisory fees and/or reimburse expenses to the extent necessary to limit total annual operating expenses after fee waiver and/or expense reimbursement (excluding certain items discussed below) of Series I shares to 2.00% and Series II shares to 2.25% of average daily net assets. In determining the Adviser’s obligation to waive advisory fees and/or reimburse expenses, the following expenses are not taken into account, and could cause the total annual fund operating expenses after fee waiver and/or expense reimbursement to exceed the numbers reflected above: (1) interest; (2) taxes; (3) dividend expense on short sales; (4) extraordinary or non-routine items, including litigation expenses; and (5) expenses that the Fund has incurred but did not actually pay because of an expense offset arrangement. Unless Invesco continues the fee waiver agreement, it will terminate on June 30, 2016. The fee waiver agreement cannot be terminated during its term. The Adviser did not waive fees and/or reimburse expenses during the period under this expense limitation.
Further, the Adviser has contractually agreed, through at least June 30, 2017, to waive the advisory fee payable by the Fund in an amount equal to 100% of the net advisory fees the Adviser receives from the affiliated money market funds on investments by the Fund of uninvested cash in such affiliated money market funds.
For the year ended December 31, 2015, the Adviser waived advisory fees of $80,636.
The Trust has entered into a master administrative services agreement with Invesco pursuant to which the Fund has agreed to pay Invesco a fee for costs incurred in providing accounting services and fund administrative services to the Fund and to reimburse Invesco for administrative services fees paid to insurance companies that have agreed to provide services to the participants of separate accounts. These administrative services provided by the insurance companies may include, among other things: the printing of prospectuses, financial reports and proxy statements and the delivery of the same to existing participants; the maintenance of master accounts; the facilitation of purchases and redemptions requested by the participants; and the servicing of participants’ accounts. Pursuant to such agreement, for the year ended December 31, 2015, Invesco was paid $87,945 for accounting and fund administrative services and reimbursed $897,446 for services provided by insurance companies.
The Trust has entered into a transfer agency and service agreement with Invesco Investment Services, Inc. (“IIS”) pursuant to which the Fund has agreed to pay IIS a fee for providing transfer agency and shareholder services to the Fund and reimburse IIS for certain expenses incurred by IIS in the course of providing such services. For the year ended December 31, 2015, expenses incurred under the agreement are shown in the Statement of Operations as Transfer agent fees.
The Trust has entered into a master distribution agreement with Invesco Distributors, Inc. (“IDI”) to serve as the distributor for the Fund. The Trust has adopted a plan pursuant to Rule 12b-1 under the 1940 Act with respect to the Fund’s Series II shares (the “Plan”). The Fund, pursuant to the Plan, pays IDI compensation at the annual rate of 0.25% of the Fund’s average daily net assets of Series II shares. Of the Plan payments, up to 0.25% of the average daily net assets of the Series II shares may be paid to insurance companies who furnish continuing personal shareholder services to customers who purchase and own Series II shares of the Fund. For the year ended December 31, 2015, expenses incurred under the Plan are detailed in the Statement of Operations as Distribution fees.
For the year ended December 31, 2015, the Fund incurred $46 in brokerage commissions with Invesco Capital Markets, Inc., an affiliate of the Adviser and IDI, for portfolio transactions executed on behalf of the Fund.
Certain officers and trustees of the Trust are officers and directors of the Adviser, IIS and/or IDI.
NOTE 3—Additional Valuation Information
GAAP defines fair value as the price that would be received to sell an asset or paid to transfer a liability in an orderly transaction between market participants at the measurement date, under current market conditions. GAAP establishes a hierarchy that prioritizes the inputs to valuation methods, giving the highest priority to readily available unadjusted quoted prices in an active market for identical assets (Level 1) and the lowest priority to significant unobservable inputs (Level 3), generally when market prices are not readily available or are unreliable. Based on the valuation inputs, the securities or other investments are tiered into one of three levels. Changes in valuation methods may result in transfers in or out of an investment’s assigned level:
| | Level 1 — | Prices are determined using quoted prices in an active market for identical assets. |
| | Level 2 — | Prices are determined using other significant observable inputs. Observable inputs are inputs that other market participants may use in pricing a security. These may include quoted prices for similar securities, interest rates, prepayment speeds, credit risk, yield curves, loss severities, default rates, discount rates, volatilities and others. |
| | Level 3 — | Prices are determined using significant unobservable inputs. In situations where quoted prices or observable inputs are unavailable (for example, when there is little or no market activity for an investment at the end of the period), unobservable inputs may be used. Unobservable inputs reflect the Fund’s own assumptions about the factors market participants would use in determining fair value of the securities or instruments and would be based on the best available information. |
The following is a summary of the tiered valuation input levels, as of December 31, 2015. The level assigned to the securities valuations may not be an indication of the risk or liquidity associated with investing in those securities. Because of the inherent uncertainties of valuation, the values reflected in the financial statements may materially differ from the value received upon actual sale of those investments.
| | | | | | | | | | | | | | | | |
| | | Level 1 | | | Level 2 | | | Level 3 | | | Total | |
Equity Securities | | $ | 306,400,108 | | | $ | 14,197,349 | | | $ | — | | | $ | 320,597,457 | |
NOTE 4—Security Transactions with Affiliated Funds
The Fund is permitted to purchase or sell securities from or to certain other Invesco Funds under specified conditions outlined in procedures adopted by the Board of Trustees of the Trust. The procedures have been designed to ensure that any purchase or sale of securities by the Fund from or to another fund or portfolio that is or could be considered an affiliate by virtue of having a common investment adviser (or affiliated investment advisers), common Trustees and/or common officers complies with Rule 17a-7 of the 1940 Act. Further, as defined under the procedures, each transaction is effected at the current market price. Pursuant to these procedures, for the year ended December 31, 2015, the Fund engaged in securities purchases of $906,764.
Invesco V.I. Mid Cap Core Equity Fund
NOTE 5—Trustees’ and Officers’ Fees and Benefits
Trustees’ and Officers’ Fees and Benefits include amounts accrued by the Fund to pay remuneration to certain Trustees and Officers of the Fund. Trustees have the option to defer compensation payable by the Fund, and Trustees’ and Officers’ Fees and Benefits also include amounts accrued by the Fund to fund such deferred compensation amounts. Those Trustees who defer compensation have the option to select various Invesco Funds in which their deferral accounts shall be deemed to be invested. Finally, certain current Trustees were eligible to participate in a retirement plan that provided for benefits to be paid upon retirement to Trustees over a period of time based on the number of years of service. The Fund may have certain former Trustees who also participate in a retirement plan and receive benefits under such plan. Trustees’ and Officers’ Fees and Benefits include amounts accrued by the Fund to fund such retirement benefits. Obligations under the deferred compensation and retirement plans represent unsecured claims against the general assets of the Fund.
NOTE 6—Cash Balances
The Fund is permitted to temporarily carry a negative or overdrawn balance in its account with State Street Bank and Trust Company, the custodian bank. Such balances, if any at period end, are shown in the Statement of Assets and Liabilities under the payable caption Amount due custodian. To compensate the custodian bank for such overdrafts, the overdrawn Fund may either (1) leave funds as a compensating balance in the account so the custodian bank can be compensated by earning the additional interest; or (2) compensate by paying the custodian bank at a rate agreed upon by the custodian bank and Invesco, not to exceed the contractually agreed upon rate.
NOTE 7—Distributions to Shareholders and Tax Components of Net Assets
Tax Character of Distributions to Shareholders Paid During the Fiscal Years Ended December 31, 2015 and 2014:
| | | | | | | | |
| | | 2015 | | | 2014 | |
Ordinary income | | $ | 4,519,294 | | | $ | 12,133,140 | |
Long-term capital gain | | | 29,088,566 | | | | 31,931,933 | |
Total distributions | | $ | 33,607,860 | | | $ | 44,065,073 | |
Tax Components of Net Assets at Period-End:
| | | | |
| | | 2015 | |
Undistributed ordinary income | | $ | 4,125,767 | |
Undistributed long-term gain | | | 16,899,277 | |
Net unrealized appreciation — investments | | | 43,891,386 | |
Net unrealized appreciation — other investments | | | 29 | |
Temporary book/tax differences | | | (126,000 | ) |
Shares of beneficial interest | | | 255,170,214 | |
Total net assets | | $ | 319,960,673 | |
The difference between book-basis and tax-basis unrealized appreciation (depreciation) is due to differences in the timing of recognition of gains and losses on investments for tax and book purposes. The Fund’s net unrealized appreciation difference is attributable primarily to wash sales.
The temporary book/tax differences are a result of timing differences between book and tax recognition of income and/or expenses. The Fund’s temporary book/tax differences are the result of the trustee deferral of compensation and retirement plan benefits.
Capital loss carryforward is calculated and reported as of a specific date. Results of transactions and other activity after that date may affect the amount of capital loss carryforward actually available for the Fund to utilize. Capital losses generated in years beginning after December 22, 2010 can be carried forward for an unlimited period, whereas previous losses expire in eight tax years. Capital losses with an expiration period may not be used to offset capital gains until all net capital losses without an expiration date have been utilized. Capital loss carryforwards with no expiration date will retain their character as either short-term or long-term capital losses instead of as short-term capital losses as under prior law. The ability to utilize capital loss carryforwards in the future may be limited under the Internal Revenue Code and related regulations based on the results of future transactions.
The Fund does not have a capital loss carryforward as of December 31, 2015.
NOTE 8—Investment Securities
The aggregate amount of investment securities (other than short-term securities, U.S. Treasury obligations and money market funds, if any) purchased and sold by the Fund during the year ended December 31, 2015 was $134,301,611 and $152,779,855, respectively. Cost of investments on a tax basis includes the adjustments for financial reporting purposes as of the most recently completed federal income tax reporting period-end.
| | | | |
| Unrealized Appreciation (Depreciation) of Investment Securities on a Tax Basis | |
Aggregate unrealized appreciation of investment securities | | $ | 68,618,053 | |
Aggregate unrealized (depreciation) of investment securities | | | (24,726,667 | ) |
Net unrealized appreciation of investment securities | | $ | 43,891,386 | |
Cost of investments for tax purposes is $276,706,071.
Invesco V.I. Mid Cap Core Equity Fund
NOTE 9—Reclassification of Permanent Differences
Primarily as a result of differing book/tax treatment of foreign currency transactions, on December 31, 2015, undistributed net investment income was decreased by $60,534 and undistributed net realized gain was increased by $60,534. This reclassification had no effect on the net assets of the Fund.
NOTE 10—Share Information
| | | | | | | | | | | | | | | | |
| | | Summary of Share Activity | |
| | | Years ended December 31, | |
| | | 2015(a) | | | 2014 | |
| | | Shares | | | Amount | | | Shares | | | Amount | |
Sold: | | | | | | | | | | | | | | | | |
Series I | | | 482,475 | | | $ | 6,548,148 | | | | 728,130 | | | $ | 11,027,954 | |
Series II | | | 1,781,612 | | | | 24,401,427 | | | | 2,443,423 | | | | 36,548,302 | |
| | | | |
Issued as reinvestment of dividends: | | | | | | | | | | | | | | | | |
Series I | | | 1,770,900 | | | | 21,587,272 | | | | 2,092,304 | | | | 29,668,883 | |
Series II | | | 1,002,551 | | | | 12,020,588 | | | | 1,030,508 | | | | 14,396,190 | |
| | | | |
Reacquired: | | | | | | | | | | | | | | | | |
Series I | | | (3,723,891 | ) | | | (51,577,939 | ) | | | (3,914,889 | ) | | | (59,384,964 | ) |
Series II | | | (2,128,890 | ) | | | (29,276,683 | ) | | | (2,042,206 | ) | | | (30,253,610 | ) |
Net increase (decrease) in share activity | | | (815,243 | ) | | $ | (16,297,187 | ) | | | 337,270 | | | $ | 2,002,755 | |
| (a) | There are entities that are record owners of more than 5% of the outstanding shares of the Fund and in the aggregate own 58% of the outstanding shares of the Fund. The Fund and the Fund’s principal underwriter or adviser, are parties to participation agreements with these entities whereby these entities sell units of interest in separate accounts funding variable products that are invested in the Fund. The Fund, Invesco and/or Invesco affiliates may make payments to these entities, which are considered to be related to the Fund, for providing services to the Fund, Invesco and/or Invesco affiliates including but not limited to services such as, securities brokerage, third party record keeping and account servicing and administrative services. The Fund has no knowledge as to whether all or any portion of the shares owned of record by these entities are also owned beneficially. |
NOTE 11—Financial Highlights
The following schedule presents financial highlights for a share of the Fund outstanding throughout the periods indicated.
| | | | | | | | | | | | | | | | | | | | | | | | | | | | | | | | | | | | | | | | | | | | | | | | | | | | | | | | |
| | | Net asset
value,
beginning
of period | | | Net
investment
income
(loss)(a) | | | Net gains
(losses)
on securities
(both
realized and
unrealized) | | | Total from
investment
operations | | | Dividends
from net
investment
income | | | Distributions
from net
realized
gains | | | Total
distributions | | | Net asset
value, end
of period | | | Total
return(b) | | | Net assets,
end of period
(000’s omitted) | | | Ratio of
expenses
to average
net assets
with fee waivers
and/or expenses
absorbed | | | Ratio of
expenses
to average net
assets without
fee waivers
and/or expenses
absorbed | | | Ratio of net
investment
income (loss)
to average
net assets | | | Portfolio
turnover(c) | |
Series I | | | | | | | | | | | | | | | | | | | | | | | | | | | | | | | | | | | | | | | | | | | | | | | | | | | | | | | | |
Year ended 12/31/15 | | $ | 14.06 | | | $ | 0.02 | | | $ | (0.58 | ) | | $ | (0.56 | ) | | $ | (0.05 | ) | | $ | (1.33 | ) | | $ | (1.38 | ) | | $ | 12.12 | | | | (4.03 | )% | | $ | 201,685 | | | | 1.01 | %(d) | | | 1.03 | %(d) | | | 0.17 | %(d) | | | 44 | % |
Year ended 12/31/14 | | | 15.13 | | | | 0.05 | | | | 0.64 | | | | 0.69 | | | | (0.01 | ) | | | (1.75 | ) | | | (1.76 | ) | | | 14.06 | | | | 4.43 | | | | 254,553 | | | | 1.01 | | | | 1.04 | | | | 0.29 | | | | 38 | |
Year ended 12/31/13 | | | 12.71 | | | | 0.01 | | | | 3.59 | | | | 3.60 | | | | (0.11 | ) | | | (1.07 | ) | | | (1.18 | ) | | | 15.13 | | | | 28.81 | | | | 290,550 | | | | 1.01 | | | | 1.04 | | | | 0.09 | | | | 34 | |
Year ended 12/31/12 | | | 11.56 | | | | 0.09 | | | | 1.18 | | | | 1.27 | | | | (0.01 | ) | | | (0.11 | ) | | | (0.12 | ) | | | 12.71 | | | | 10.96 | | | | 286,607 | | | | 1.02 | | | | 1.05 | | | | 0.69 | | | | 59 | |
Year ended 12/31/11 | | | 12.39 | | | | 0.01 | | | | (0.80 | ) | | | (0.79 | ) | | | (0.04 | ) | | | — | | | | (0.04 | ) | | | 11.56 | | | | (6.38 | ) | | | 322,102 | | | | 1.01 | | | | 1.03 | | | | 0.08 | | | | 57 | |
Series II | | | | | | | | | | | | | | | | | | | | | | | | | | | | | | | | | | | | | | | | | | | | | | | | | | | | | | | | |
Year ended 12/31/15 | | | 13.84 | | | | (0.01 | ) | | | (0.57 | ) | | | (0.58 | ) | | | (0.02 | ) | | | (1.33 | ) | | | (1.35 | ) | | | 11.91 | | | | (4.28 | ) | | | 118,276 | | | | 1.26 | (d) | | | 1.28 | (d) | | | (0.08 | )(d) | | | 44 | |
Year ended 12/31/14 | | | 14.95 | | | | 0.01 | | | | 0.63 | | | | 0.64 | | | | — | | | | (1.75 | ) | | | (1.75 | ) | | | 13.84 | | | | 4.17 | | | | 128,305 | | | | 1.26 | | | | 1.29 | | | | 0.04 | | | | 38 | |
Year ended 12/31/13 | | | 12.58 | | | | (0.02 | ) | | | 3.54 | | | | 3.52 | | | | (0.08 | ) | | | (1.07 | ) | | | (1.15 | ) | | | 14.95 | | | | 28.46 | | | | 117,219 | | | | 1.26 | | | | 1.29 | | | | (0.16 | ) | | | 34 | |
Year ended 12/31/12 | | | 11.47 | | | | 0.06 | | | | 1.16 | | | | 1.22 | | | | — | | | | (0.11 | ) | | | (0.11 | ) | | | 12.58 | | | | 10.62 | | | | 90,648 | | | | 1.27 | | | | 1.30 | | | | 0.44 | | | | 59 | |
Year ended 12/31/11 | | | 12.28 | | | | (0.02 | ) | | | (0.78 | ) | | | (0.80 | ) | | | (0.01 | ) | | | — | | | | (0.01 | ) | | | 11.47 | | | | (6.50 | ) | | | 65,196 | | | | 1.26 | | | | 1.28 | | | | (0.17 | ) | | | 57 | |
| (a) | Calculated using average shares outstanding. |
| (b) | Includes adjustments in accordance with accounting principles generally accepted in the United States of America and as such, the net asset value for financial reporting purposes and the returns based upon those net asset values may differ from the net asset value and returns for shareholder transactions. Total returns are not annualized for periods less than one year, if applicable and do not reflect charges assessed in connection with a variable product, which if included would reduce total returns. |
| (c) | Portfolio turnover is calculated at the fund level and is not annualized for periods less than one year, if applicable. |
| (d) | Ratios are based on average daily net assets (000’s omitted) of $234,177 and $126,455 for Series I and Series II shares, respectively. |
Invesco V.I. Mid Cap Core Equity Fund
Report of Independent Registered Public Accounting Firm
To the Board of Trustees of AIM Variable Insurance Funds (Invesco Variable Insurance Funds)
and Shareholders of Invesco V.I. Mid Cap Core Equity Fund:
In our opinion, the accompanying statement of assets and liabilities, including the schedule of investments, and the related statements of operations and of changes in net assets and the financial highlights present fairly, in all material respects, the financial position of Invesco V.I. Mid Cap Core Equity Fund (one of the funds constituting AIM Variable Insurance Funds (Invesco Variable Insurance Funds), hereafter referred to as the “Fund”) at December 31, 2015, the results of its operations for the year then ended, the changes in its net assets for each of the two years in the period then ended and the financial highlights for each of the five years in the period then ended, in conformity with accounting principles generally accepted in the United States of America. These financial statements and financial highlights (hereafter referred to as “financial statements”) are the responsibility of the Fund’s management. Our responsibility is to express an opinion on these financial statements based on our audits. We conducted our audits of these financial statements in accordance with the standards of the Public Company Accounting Oversight Board (United States). Those standards require that we plan and perform the audit to obtain reasonable assurance about whether the financial statements are free of material misstatement. An audit includes examining, on a test basis, evidence supporting the amounts and disclosures in the financial statements, assessing the accounting principles used and significant estimates made by management, and evaluating the overall financial statement presentation. We believe that our audits, which included confirmation of securities at December 31, 2015 by correspondence with the custodian and brokers, and the application of alternative auditing procedures where confirmations of security purchases have not been received, provide a reasonable basis for our opinion.
PRICEWATERHOUSECOOPERS LLP
Houston, Texas
February 15, 2016
Invesco V.I. Mid Cap Core Equity Fund
Calculating your ongoing Fund expenses
Example
As a shareholder of the Fund, you incur ongoing costs, including management fees; distribution and/or service fees (12b-1); and other Fund expenses. This example is intended to help you understand your ongoing costs (in dollars) of investing in the Fund and to compare these costs with ongoing costs of investing in other mutual funds. The example is based on an investment of $1,000 invested at the beginning of the period and held for the entire period July 1, 2015 through December 31, 2015.
The actual and hypothetical expenses in the examples below do not represent the effect of any fees or other expenses assessed in connection with a variable product; if they did, the expenses shown would be higher while the ending account values shown would be lower.
Actual expenses
The table below provides information about actual account values and actual expenses. You may use the information in this table, together with the amount you invested, to estimate the expenses that you paid over the period. Simply divide your account value by $1,000 (for example, an $8,600 account value divided by $1,000 = 8.6), then multiply the result by the number in the table under the heading entitled “Actual Expenses Paid During Period” to estimate the expenses you paid on your account during this period.
Hypothetical example for comparison purposes
The table below also provides information about hypothetical account values and hypothetical expenses based on the Fund’s actual expense ratio and an assumed rate of return of 5% per year before expenses, which is not the Fund’s actual return.
The hypothetical account values and expenses may not be used to estimate the actual ending account balance or expenses you paid for the period. You may use this information to compare the ongoing costs of investing in the Fund and other funds. To do so, compare this 5% hypothetical example with the 5% hypothetical examples that appear in the shareholder reports of the other funds.
Please note that the expenses shown in the table are meant to highlight your ongoing costs. Therefore, the hypothetical information is useful in comparing ongoing costs, and will not help you determine the relative total costs of owning different funds.
| | | | | | | | | | | | | | | | | | | | | | | | |
| Class | | Beginning
Account Value
(07/01/15) | | | ACTUAL | | | HYPOTHETICAL
(5% annual return before
expenses) | | | Annualized
Expense
Ratio | |
| | | Ending
Account Value
(12/31/15)1 | | | Expenses
Paid During
Period2 | | | Ending
Account Value
(12/31/15) | | | Expenses
Paid During
Period2 | | |
Series I | | $ | 1,000.00 | | | $ | 925.50 | | | $ | 4.90 | | | $ | 1,020.11 | | | $ | 5.14 | | | | 1.01 | % |
Series II | | | 1,000.00 | | | | 924.50 | | | | 6.11 | | | | 1,018.85 | | | | 6.41 | | | | 1.26 | |
| 1 | The actual ending account value is based on the actual total return of the Fund for the period July 1, 2015 through December 31, 2015, after actual expenses and will differ from the hypothetical ending account value which is based on the Fund’s expense ratio and a hypothetical annual return of 5% before expenses. |
| 2 | Expenses are equal to the Fund’s annualized expense ratio as indicated above multiplied by the average account value over the period, multiplied by 184/365 to reflect the most recent fiscal half year. |
Invesco V.I. Mid Cap Core Equity Fund
Tax Information
Form 1099-DIV, Form 1042-S and other year–end tax information provide shareholders with actual calendar year amounts that should be included in their tax returns. Shareholders should consult their tax advisors.
The following distribution information is being provided as required by the Internal Revenue Code or to meet a specific state’s requirement.
The Fund designates the following amounts or, if subsequently determined to be different, the maximum amount allowable for its fiscal year ended December 31, 2015:
| | | | |
Federal and State Income Tax | | | |
Long-Term Capital Gain Distributions | | $ | 29,088,566 | |
Corporate Dividends Received Deduction* | | | 99.77 | % |
U.S. Treasury Obligations* | | | 0.00 | % |
| | * | The above percentages are based on ordinary income dividends paid to shareholders during the Fund’s fiscal year. |
Invesco V.I. Mid Cap Core Equity Fund
Trustees and Officers
The address of each trustee and officer is AIM Variable Insurance Funds (Invesco Variable Insurance Funds) (the “Trust”), 11 Greenway Plaza, Suite 1000, Houston, Texas 77046-1173. The trustees serve for the life of the Trust, subject to their earlier death, incapacitation, resignation, retirement or removal as more specifically provided in the Trust’s organizational documents. Each officer serves for a one year term or until their successors are elected and qualified. Column two below includes length of time served with predecessor entities, if any.
| | | | | | | | |
Name, Year of Birth and
Position(s) Held with the Trust | | Trustee and/
or Officer Since | | Principal Occupation(s)
During Past 5 Years | | Number of Funds in Fund Complex Overseen by Trustee | | Other Directorship(s) Held by Trustee During Past 5 Years |
| Interested Persons | | | | | | | | |
| Martin L. Flanagan1 — 1960 Trustee | | 2007 | | Executive Director, Chief Executive Officer and President, Invesco Ltd. (ultimate parent of Invesco and a global investment management firm); Advisor to the Board, Invesco Advisers, Inc. (formerly known as Invesco Institutional (N.A.), Inc.); Trustee, The Invesco Funds; Vice Chair, Investment Company Institute; and Member of Executive Board, SMU Cox School of Business Formerly: Chairman and Chief Executive Officer, Invesco Advisers, Inc. (registered investment adviser); Director, Chairman, Chief Executive Officer and President, IVZ Inc. (holding company), INVESCO Group Services, Inc. (service provider) and Invesco North American Holdings, Inc. (holding company); Director, Chief Executive Officer and President, Invesco Holding Company Limited (parent of Invesco and a global investment management firm); Director, Invesco Ltd.; Chairman, Investment Company Institute and President, Co-Chief Executive Officer, Co-President, Chief Operating Officer and Chief Financial Officer, Franklin Resources, Inc. (global investment management organization) | | 146 | | None |
Philip A. Taylor2 — 1954 Trustee, President and Principal Executive Officer | | 2006 | | Head of North American Retail and Senior Managing Director, Invesco Ltd.; Director, Co-Chairman, Co-President and Co-Chief Executive Officer, Invesco Advisers, Inc. (formerly known as Invesco Institutional (N.A.), Inc.) (registered investment adviser); Director, Chairman, Chief Executive Officer and President, Invesco Management Group, Inc. (formerly known as Invesco Aim Management Group, Inc.) (financial services holding company); Director and Chairman, Invesco Investment Services, Inc. (formerly known as Invesco Aim Investment Services, Inc.) (registered transfer agent) Chief Executive Officer, Invesco Corporate Class Inc. (corporate mutual fund company) Director, Chairman and Chief Executive Officer, Invesco Canada Ltd. (formerly known as Invesco Trimark Ltd./Invesco Trimark Ltèe) (registered investment adviser and registered transfer agent); Trustee, President and Principal Executive Officer, The Invesco Funds (other than AIM Treasurer’s Series Trust (Invesco Treasurer’s Series Trust), Short-Term Investments Trust and Invesco Management Trust); Trustee and Executive Vice President, The Invesco Funds (AIM Treasurer’s Series Trust (Invesco Treasurer’s Series Trust), Short-Term Investments Trust and Invesco Management Trust only); Director, Invesco Investment Advisers LLC (formerly known as Van Kampen Asset Management); Director, Chief Executive Officer and President, Van Kampen Exchange Corp. Formerly: Director and President, INVESCO Funds Group, Inc. (registered investment adviser and registered transfer agent); Director and Chairman, IVZ Distributors, Inc. (formerly known as INVESCO Distributors, Inc.) (registered broker dealer); Director, President and Chairman, Invesco Inc. (holding company), Invesco Canada Holdings Inc. (holding company), Trimark Investments Ltd./Placements Trimark Ltèe and Invesco Financial Services Ltd/Services Financiers Invesco Ltèe; Chief Executive Officer, Invesco Canada Fund Inc (corporate mutual fund company); Director and Chairman, Van Kampen Investor Services Inc.; Director, Chief Executive Officer and President, 1371 Preferred Inc. (holding company) and Van Kampen Investments Inc.; Director and President, AIM GP Canada Inc. (general partner for limited partnerships) and Van Kampen Advisors, Inc.; Director and Chief Executive Officer, Invesco Trimark Dealer Inc. (registered broker dealer); Director, Invesco Distributors, Inc. (formerly known as Invesco Aim Distributors, Inc.) (registered broker dealer); Manager, Invesco PowerShares Capital Management LLC; Director, Chief Executive Officer and President, Invesco Advisers, Inc.; Director, Chairman, Chief Executive Officer and President, Invesco Aim Capital Management, Inc.; President, Invesco Trimark Dealer Inc. and Invesco Trimark Ltd./Invesco Trimark Ltèe; Director and President, AIM Trimark Corporate Class Inc. and AIM Trimark Canada Fund Inc.; Senior Managing Director, Invesco Holding Company Limited; Director and Chairman, Fund Management Company (former registered broker dealer); President and Principal Executive Officer, The Invesco Funds (AIM Treasurer’s Series Trust (Invesco Treasurer’s Series Trust), and Short-Term Investments Trust only); President, AIM Trimark Global Fund Inc. and AIM Trimark Canada Fund Inc | | 146 | | None |
| 1 | Mr. Flanagan is considered an interested person (within the meaning of Section 2(a)(19) of the 1940 Act) of the Trust because he is an officer of the Adviser to the Trust, and an officer and a director of Invesco Ltd., ultimate parent of the Adviser. |
| 2 | Mr. Taylor is considered an interested person (within the meaning of Section 2(a)(19) of the 1940 Act) of the Trust because he is an officer and a director of the Adviser. |
Invesco V.I. Mid Cap Core Equity Fund
Trustees and Officers—(continued)
| | | | | | | | |
Name, Year of Birth and
Position(s) Held with the Trust | | Trustee and/
or Officer Since | | Principal Occupation(s)
During Past 5 Years | | Number of Funds in Fund Complex Overseen by Trustee | | Other Directorship(s)
Held by Trustee During Past 5 Years |
| Independent Trustees | | | | | | | | |
Bruce L. Crockett — 1944 Trustee and Chair | | 2003 | | Chairman, Crockett Technologies Associates (technology consulting company) Formerly: Director, Captaris (unified messaging provider); Director, President and Chief Executive Officer, COMSAT Corporation; Chairman, Board of Governors of INTELSAT (international communications company); ACE Limited (insurance company); Independent Directors Council and Investment Company Institute | | 146 | | ALPS (Attorneys Liability Protection Society) (insurance company) and Globe Specialty Metals, Inc. (metallurgical company) |
David C. Arch — 1945 Trustee | | 2010 | | Chairman of Blistex Inc., a consumer health care products manufacturer | | 146 | | Board member of the Illinois Manufacturers’ Association; Member of the Board of Visitors, Institute for the Humanities, University of Michigan |
James T. Bunch — 1942 Trustee | | 2000 | | Managing Member, Grumman Hill Group LLC (family office/private equity investments) Formerly: Chairman of the Board of Trustees, Evans Scholars Foundation and Chairman, Board of Governors, Western Golf Association | | 146 | | Trustee, Evans Scholars Foundation; and Chairman of the Board, Denver Film Society |
Albert R. Dowden — 1941 Trustee | | 2003 | | Director of a number of public and private business corporations, including the Boss Group, Ltd. (private investment and management); Nature’s Sunshine Products, Inc. and Reich & Tang Funds (5 portfolios) (registered investment company) Formerly: Director, Homeowners of America Holding Corporation/Homeowners of America Insurance Company (property casualty company); Director, Continental Energy Services, LLC (oil and gas pipeline service); Director, CompuDyne Corporation (provider of product and services to the public security market) and Director, Annuity and Life Re (Holdings), Ltd. (reinsurance company); Director, President and Chief Executive Officer, Volvo Group North America, Inc.; Senior Vice President, AB Volvo; Director of various public and private corporations; Chairman, DHJ Media, Inc.; Director, Magellan Insurance Company; and Director, The Hertz Corporation, Genmar Corporation (boat manufacturer), National Media Corporation; Advisory Board of Rotary Power International (designer, manufacturer, and seller of rotary power engines); and Chairman, Cortland Trust, Inc. (registered investment company) | | 146 | | Director of: Nature’s Sunshine Products, Inc., Reich & Tang Funds, Homeowners of America Holding Corporation/ Homeowners of America Insurance Company, the Boss Group |
Jack M. Fields — 1952 Trustee | | 2003 | | Chief Executive Officer, Twenty First Century Group, Inc. (government affairs company); Owner and Chief Executive Officer, Dos Angeles Ranch, L.P. (cattle, hunting, corporate entertainment); and Discovery Global Education Fund (non-profit) Formerly: Chief Executive Officer, Texana Timber LP (sustainable forestry company); Director of Cross Timbers Quail Research Ranch (non-profit); and member of the U.S. House of Representatives | | 146 | | Insperity, Inc. (formerly known as Administaff) |
Eli Jones — Trustee | | 2016 | | Professor and Dean, Mays Business School, Texas A&M University Formerly: Professor and Dean, Walton College of Business, University of Arkansas, and E.J. Ourso College of Business, Louisiana State University | | 146 | | Director, Insperity, Inc., (2011-present) and ARVEST Bank (2012-2015) |
Prema Mathai-Davis — 1950 Trustee | | 2003 | | Retired. Formerly: Chief Executive Officer, YWCA of the U.S.A. | | 146 | | None |
Larry Soll — 1942 Trustee | | 1997 | | Retired. Formerly: Chairman, Chief Executive Officer and President, Synergen Corp. (a biotechnology company) | | 146 | | None |
Robert C. Troccoli — Trustee | | 2016 | | Retired. Formerly: Senior Partner, KPMG LLP | | 146 | | None |
Raymond Stickel, Jr. — 1944 Trustee | | 2005 | | Retired. Formerly: Director, Mainstay VP Series Funds, Inc. (25 portfolios) and Partner, Deloitte & Touche | | 146 | | None |
Suzanne H. Woolsey — 1941 Trustee | | 2014 | | Chief Executive Officer of Woolsey Partners LLC | | 146 | | Emeritus Chair of the Board of Trustees of the Institute for Defense Analyses; Trustee of Colorado College; Trustee of California Institute of Technology; Prior to 2014, Director of Fluor Corp.; Prior to 2010, Trustee of the German Marshall Fund of the United States; Prior to 2010 Trustee of the Rocky Mountain Institute |
Invesco V.I. Mid Cap Core Equity Fund
Trustees and Officers—(continued)
| | | | | | | | |
Name, Year of Birth and
Position(s) Held with the Trust | | Trustee and/
or Officer Since | | Principal Occupation(s)
During Past 5 Years | | Number of Funds in Fund Complex Overseen by Trustee | | Other Directorship(s)
Held by Trustee During Past 5 Years |
| Other Officers | | | | | | | | |
Russell C. Burk — 1958 Senior Vice President and Senior Officer | | 2005 | | Senior Vice President and Senior Officer, The Invesco Funds | | N/A | | N/A |
John M. Zerr — 1962 Senior Vice President, Chief Legal Officer and Secretary | | 2006 | | Director, Senior Vice President, Secretary and General Counsel, Invesco Management Group, Inc. (formerly known as Invesco Aim Management Group, Inc.) and Van Kampen Exchange Corp.; Senior Vice President, Invesco Advisers, Inc. (formerly known as Invesco Institutional (N.A.), Inc.) (registered investment adviser); Senior Vice President and Secretary, Invesco Distributors, Inc. (formerly known as Invesco Aim Distributors, Inc.); Director, Vice President and Secretary, Invesco Investment Services, Inc. (formerly known as Invesco Aim Investment Services, Inc.); Senior Vice President, Chief Legal Officer and Secretary, The Invesco Funds; Managing Director, Invesco PowerShares Capital Management LLC; Director, Secretary and General Counsel, Invesco Investment Advisers LLC (formerly known as Van Kampen Asset Management); Secretary and General Counsel, Invesco Capital Markets, Inc. (formerly known as Van Kampen Funds Inc.) and Chief Legal Officer, PowerShares Exchange-Traded Fund Trust, PowerShares Exchange-Traded Fund Trust II, PowerShares India Exchange-Traded Fund Trust, PowerShares Actively Managed Exchange-Traded Fund Trust, and PowerShares Actively Managed Exchange-Traded Commodity Fund Trust Formerly: Director, Vice President and Secretary, IVZ Distributors, Inc. (formerly known as INVESCO distributors, Inc.); Director and Vice President, INVESCO Funds Group, Inc.; Director and Vice President, Van Kampen Advisors Inc.; Director, Vice President, Secretary and General Counsel, Van Kampen Investor Services Inc.; Director, Invesco Distributors, Inc. (formerly known as Invesco Aim Distributors, Inc.); Director, Senior Vice President, General Counsel and Secretary, Invesco Aim Advisers, Inc. and Van Kampen Investments Inc.; Director, Vice President and Secretary, Fund Management Company; Director, Senior Vice President, Secretary, General Counsel and Vice President, Invesco Aim Capital Management, Inc.; Chief Operating Officer and General Counsel, Liberty Ridge Capital, Inc. (an investment adviser); Vice President and Secretary, PBHG Funds (an investment company) and PBHG Insurance Series Fund (an investment company); Chief Operating Officer, General Counsel and Secretary, Old Mutual Investment Partners (a broker-dealer); General Counsel and Secretary, Old Mutual Fund Services (an administrator) and Old Mutual Shareholder Services (a shareholder servicing center); Executive Vice President, General Counsel and Secretary, Old Mutual Capital, Inc. (an investment adviser); and Vice President and Secretary, Old Mutual Advisors Funds (an investment company) | | N/A | | N/A |
Sheri Morris — 1964 Vice President, Treasurer and Principal Financial Officer | | 2003 | | Vice President, Treasurer and Principal Financial Officer, The Invesco Funds; Vice President, Invesco Advisers, Inc. (formerly known as Invesco Institutional (N.A.), Inc.) (registered investment adviser); and Vice President, PowerShares Exchange-Traded Fund Trust, PowerShares Exchange-Traded Fund Trust II, PowerShares India Exchange-Traded Fund Trust, PowerShares Actively Managed Exchange-Traded Fund Trust, and PowerShares Actively Managed Exchange-Traded Commodity Fund Trust Formerly: Vice President, Invesco Aim Advisers, Inc., Invesco Aim Capital Management, Inc. and Invesco Aim Private Asset Management, Inc.; Assistant Vice President and Assistant Treasurer, The Invesco Funds and Assistant Vice President, Invesco Advisers, Inc., Invesco Aim Capital Management, Inc. and Invesco Aim Private Asset Management, Inc.; and Treasurer, PowerShares Exchange-Traded Fund Trust, PowerShares Exchange-Traded Fund Trust II, PowerShares India Exchange-Traded Fund Trust and PowerShares Actively Managed Exchange-Traded Fund Trust | | N/A | | N/A |
Invesco V.I. Mid Cap Core Equity Fund
Trustees and Officers—(continued)
| | | | | | | | |
Name, Year of Birth and
Position(s) Held with the Trust | | Trustee and/
or Officer Since | | Principal Occupation(s)
During Past 5 Years | | Number of Funds in Fund Complex Overseen by Trustee | | Other Directorship(s)
Held by Trustee During Past 5 Years |
| Other Officers—(continued) | | | | | | | | |
Karen Dunn Kelley — 1960 Vice President | | 2003 | | Senior Managing Director, Investments, Invesco Ltd.; Director, Co-President, Co-Chief Executive Officer, and Co-Chairman, Invesco Advisers, Inc. (formerly known as Invesco Institutional (N.A.), Inc.) (registered investment adviser); Chairman, Invesco Senior Secured Management, Inc.; Senior Vice President, Invesco Management Group, Inc. (formerly known as Invesco Aim Management Group, Inc.); Executive Vice President, Invesco Distributors, Inc. (formerly known as Invesco Aim Distributors, Inc.); Director, Invesco Mortgage Capital Inc. and Invesco Management Company Limited; Vice President, The Invesco Funds (other than AIM Treasurer’s Series Trust (Invesco Treasurer’s Series Trust), Short-Term Investments Trust and Invesco Management Trust); and President and Principal Executive Officer, The Invesco Funds (AIM Treasurer’s Series Trust (Invesco Treasurer’s Series Trust), Short-Term Investments Trust and Invesco Management Trust only) Formerly: Director and President, INVESCO Asset Management (Bermuda) Ltd., Director, INVESCO Global Asset Management Limited and INVESCO Management S.A.; Senior Vice President, Van Kampen Investments Inc. and Invesco Advisers, Inc. (formerly known as Invesco Institutional (N.A.), Inc.) (registered investment adviser); Vice President, Invesco Advisers, Inc. (formerly known as Invesco Institutional (N.A.), Inc.); Director of Cash Management and Senior Vice President, Invesco Advisers, Inc. and Invesco Aim Capital Management, Inc.; Director and President, Fund Management Company; Chief Cash Management Officer, Director of Cash Management, Senior Vice President, and Managing Director, Invesco Aim Capital Management, Inc.; Director of Cash Management, Senior Vice President, and Vice President, Invesco Advisers, Inc. and The Invesco Funds (AIM Treasurer’s Series Trust (Invesco Treasurer’s Series Trust), and Short-Term Investments Trust only) | | N/A | | N/A |
Crissie M. Wisdom — 1969 Anti-Money Laundering Compliance Officer | | 2013 | | Anti-Money Laundering Compliance Officer, Invesco Advisers, Inc. (formerly known as Invesco Institutional (N.A.), Inc.) (registered investment adviser), Invesco Capital Markets, Inc. (formerly known as Van Kampen Funds Inc.), Invesco Distributors, Inc., Invesco Investment Services, Inc., Invesco Management Group, Inc., Van Kampen Exchange Corp., The Invesco Funds, and PowerShares Exchange-Traded Fund Trust, PowerShares Exchange-Traded Fund Trust II, PowerShares India Exchange-Traded Fund Trust, PowerShares Actively Managed Exchange-Traded Fund Trust and PowerShares Actively Managed Exchange-Traded Commodity Fund Trust; Anti-Money Laundering Compliance Officer and Bank Secrecy Act Officer, INVESCO National Trust Company and Invesco Trust Company; and Fraud Prevention Manager and Controls and Risk Analysis Manager for Invesco Investment Services, Inc. | | N/A | | N/A |
Lisa O. Brinkley — 1959 Chief Compliance Officer | | 2015 | | Senior Vice President and Chief Compliance Officer, Invesco Advisers, Inc. (registered investment adviser) (formerly known as Invesco Institutional (N.A., Inc.); and Chief Compliance Officer, The Invesco Funds Formerly: Global Assurance Officer, Invesco Ltd. and Vice President, The Invesco Funds; Chief Compliance Officer, Invesco Distributors, Inc. (formerly known as Invesco Aim Distributors, Inc.), Invesco Investment Services, Inc.(formerly known as Invesco Aim Investment Services, Inc.) and Van Kampen Investor Services Inc.; Senior Vice President, Invesco Management Group, Inc.; Senior Vice President and Chief Compliance Officer, Invesco Advisers, Inc. and The Invesco Funds; Vice President and Chief Compliance Officer, Invesco Aim Capital Management, Inc. and Invesco Distributors, Inc.; Vice President, Invesco Investment Services, Inc. and Fund Management Company | | N/A | | N/A |
The Statement of Additional Information of the Trust includes additional information about the Fund’s Trustees and is available upon request, without charge, by calling 1.800.959.4246. Please refer to the Fund’s prospectus for information on the Fund’s sub-advisers.
| | | | | | |
Office of the Fund 11 Greenway Plaza, Suite 1000 Houston, TX 77046-1173 | | Investment Adviser Invesco Advisers, Inc. 1555 Peachtree Street, N.E. Atlanta, GA 30309 | | Distributor Invesco Distributors, Inc. 11 Greenway Plaza, Suite 1000 Houston, TX 77046-1173 | | Auditors PricewaterhouseCoopers LLP 1000 Louisiana Street, Suite 5800 Houston, TX 77002-5678 |
| | | |
| | | | | | |
Counsel to the Fund Stradley Ronon Stevens & Young, LLP 2005 Market Street, Suite 2600 Philadelphia, PA 19103-7018 | | Counsel to the Independent Trustees Goodwin Procter LLP 901 New York Avenue, N.W. Washington, D.C. 20001 | | Transfer Agent Invesco Investment Services, Inc. 11 Greenway Plaza, Suite 1000 Houston, TX 77046-1173 | | Custodian State Street Bank and Trust Company 225 Franklin Street Boston, MA 02110-2801 |
Invesco V.I. Mid Cap Core Equity Fund
| | | | |
| | |

| | Annual Report to Shareholders | | December 31, 2015 |
| | |
| | Invesco V.I. Mid Cap Growth Fund |

| | |
| | The Fund provides a complete list of its holdings four times in each fiscal year, at the quarter-ends. For the second and fourth quarters, the lists appear in the Fund’s semiannual and annual reports to shareholders. For the first and third quarters, the Fund files the lists with the Securities and Exchange Commission (SEC) on Form N-Q. The Fund’s Form N-Q filings are available on the SEC website, sec.gov. Copies of the Fund’s Forms N-Q may be reviewed and copied at the SEC Public Reference Room in Washington, D.C. You can obtain information on the operation of the Public Reference Room, including information about duplicating fee charges, by calling 202 551 8090 or 800 732 0330, or by electronic request at the following email address: publicinfo@sec.gov. The SEC file numbers for the Fund are 811-07452 and 033-57340. The Fund’s most recent portfolio holdings, as filed on Form N-Q, have also been made available to insurance companies issuing variable annuity contracts and variable life insurance policies (“variable products”) that invest in the Fund. A description of the policies and procedures that the Fund uses to determine how to vote proxies relating to portfolio securities is available without charge, upon request, from our Client Services department at 800 959 4246 or at invesco.com/proxyguidelines. The information is also available on the SEC website, sec.gov. Information regarding how the Fund voted proxies related to its portfolio securities during the most recent 12-month period ended June 30 is available at invesco.com/ proxysearch. The information is also available on the SEC website, sec.gov. Invesco Advisers, Inc. is an investment adviser; it provides investment advisory services to individual and institutional clients and does not sell securities. Invesco Distributors, Inc. is the US distributor for Invesco Ltd.’s retail mutual funds, exchange-traded funds and institutional money market funds. Both are wholly owned, indirect subsidiaries of Invesco Ltd. This report must be accompanied or preceded by a currently effective Fund prospectus and variable product prospectus, which contain more complete information, including sales charges and expenses. Investors should read each carefully before investing. Invesco Distributors, Inc. VK-VIMCG-AR-1 NOT FDIC INSURED | MAY LOSE VALUE | NO BANK GUARANTEE |
Management’s Discussion of Fund Performance
Performance summary
For the year ended December 31, 2015, Series I shares of Invesco V.I. Mid Cap Growth Fund (the Fund) outperformed the Fund’s style-specific benchmark, the Russell Midcap Growth Index.
Your Fund’s long-term performance appears later in this report.
Fund vs. Indexes
Total returns, 12/31/14 to 12/31/15, excluding variable product issuer charges.
If variable product issuer charges were included, returns would be lower.
| | | | | |
| Series I Shares | | | | 1.21 | % |
| Series II Shares | | | | 1.04 | |
| S&P 500 Index▼ (Broad Market Index) | | | | 1.38 | |
| Russell Midcap Growth Index▼ (Style-Specific Index) | | | | -0.20 | |
| Lipper VUF Mid-Cap Growth Funds Index¡ (Peer Group Index) | | | | -0.20 | |
Source(s): ▼FactSet Research Systems Inc.; ¡Lipper Inc.
Market conditions and your Fund
The US economy continued its modest, but steady growth, during the year ended December 31, 2015 – although the health of individual economic sectors varied dramatically. The headline economic story was a steady decline in already-battered energy markets, as oil prices plummeted when increased supply overwhelmed demand. This decline particularly affected companies with US-based offshore or shale-based resources - companies whose cost to recover oil is higher than many traditional producers. On the other end of the spectrum, the improved position of the US consumer was the more subtle story which drove the US economy forward during the year.
As the year began, economic growth appeared to be stronger in the US than in the rest of the world. US equity markets were recovering from the crash of oil prices initiated by OPEC’s decision to maintain high production despite low prices and slowing global growth. The view that the US Federal Reserve (the Fed) would begin raising rates while other central banks were loosening monetary policy led the US dollar to strengthen against many currencies. This hurt commodity-
and materials-based economies – and companies in related sectors. Additionally, US-based multinational companies faced foreign exchange headwinds. Low interest rates, the increasing availability of credit and an improving employment picture all contributed to higher consumer confidence and consumer spending, which drove US equity markets higher, particularly through the spring, and helped overcome fears that Greece and the eurozone would fail to reach an agreement on a financial bailout plan.
In the summer of 2015, US equity markets moved sharply lower. A significant downturn in China’s financial markets and weak global economic growth led the Fed to delay raising interest rates; this, in turn, increased investor uncertainty and market volatility. A continued decline in oil prices also contributed to market volatility. In the fall, however, US markets rallied, the Fed saw enough economic stabilization to finally raise interest rates, and most major US market indexes ended the year barely in positive territory.
In this environment, the Fund managed a positive return that outperformed its style-specific benchmark. Solid outperformance across the consumer
discretionary, industrials and health care sectors was driven primarily by positive stock selection. This more than offset underperformance resulting from stock selection in the financials sector and the Fund’s intentional underweight exposure to the consumer staples sector during the year
The Fund outperformed its style-specific benchmark by the widest margin in the consumer discretionary sector. One of the largest contributors to Fund performance in this sector was Gentherm, which manufactures seat control systems for the automotive industry. The stock began the year recovering from a price drop, as a major customer had issues rolling out a new truck platform. As the customer’s launch progressed and Gentherm released strong earnings results, the stock rebounded and was up sharply. Royal Caribbean also contributed to Fund performance, reporting improving financial results and raising future guidance as the cruise line benefited from low fuel prices and increasing consumer spending. O’Reilly Automotive was also a positive driver of Fund results for the year.
The Fund also outperformed its style-specific benchmark in the industrials sector. AO Smith and Lennox International both reported solid earnings and benefited from improved housing sentiment and orders from homebuilders through the year.
The Fund outperformed its style-specific benchmark in the health care sector as well, and Synageva was the largest overall contributor to Fund performance. Synageva develops ‘orphan’ medications that treat rare life-threatening diseases. The company’s stock appreciated when it was bought by another company for a premium more than double its previous trading price. We sold our position in the company, locking in the gain for our shareholders.
| | | | | |
| Portfolio Composition |
| By sector | | | | % of total net assets | |
| | | | | |
| |
| Consumer Discretionary | | | | 21.9 | % |
| Information Technology | | | | 19.6 | |
| Health Care | | | | 17.4 | |
| Industrials | | | | 14.2 | |
| Financials | | | | 12.7 | |
| Consumer Staples | | | | 5.6 | |
| Materials | | | | 3.7 | |
| Telecommunication Services | | | | 1.8 | |
| Energy | | | | 1.1 | |
| Money Market Funds Plus Other Assets Less Liabilities | | | | 2.0 | |
| | |
| Top 10 Equity Holdings* |
| | % of total net assets |
| | | | | | | |
| | |
| 1. | | Constellation Brands, Inc.-Class A | | | | 2.6 | % |
| 2. | | E*TRADE Financial Corp. | | | | 2.3 | |
| 3. | | Palo Alto Networks, Inc. | | | | 2.2 | |
| 4. | | Intercontinental Exchange, Inc. | | | | 2.2 | |
| 5. | | ServiceNow, Inc. | | | | 2.1 | |
| 6. | | Alexion Pharmaceuticals, Inc. | | | | 2.0 | |
| 7. | | Brunswick Corp. | | | | 1.9 | |
| 8. | | NXP Semiconductors N.V. | | | | 1.9 | |
| 9. | | McGraw Hill Financial, Inc. | | | | 1.9 | |
| 10. | | Signet Jewelers Ltd. | | | | 1.8 | |
| | | | | | | |
Total Net Assets | | | $ | 262.3 million | |
Total Number of Holdings* | | | | 82 | |
The Fund’s holdings are subject to change, and there is no assurance that the Fund will continue to hold any particular security.
*Excluding money market fund holdings.
Data presented here are as of December 31, 2015.
|
Invesco V.I. Mid Cap Growth Fund |
The Fund underperformed its style-specific benchmark by the widest margin in the financials sector. Wisdomtree Investments was a detractor from Fund performance as equity markets pulled back and investment flows slowed overall, turning negative for its lead hedged currency product, and leading to reduced earnings expectations for the company. Realogy Holdings is a real estate brokerage and relocation firm, which also reported some disappointing financial results later in the year that pressured the stock. MGIC Investment, which provides mortgage insurance and related services, was also down during the year despite relatively solid business fundamentals. Investors focused on the potential risk that future private mortgage insurance business would face pricing pressures from public mortgage insurance.
The consumer staples sector was the strongest-performing area of the Fund’s style-specific index during the year. The Fund had a modest but intentional underweight exposure to this relatively expensive area of the market and underperformed as a result. We purchased Hain Celestial Group and Whitewave Foods during the year, and both companies underperformed. However, beverage distributor Constellation Brands was one of the top overall contributors to Fund performance during the year.
As we’ve discussed, the Fund’s performance was positive during the reporting period. However, stocks remain volatile and we caution investors against making investment decisions based on short-term performance.
We thank you for your commitment to Invesco V.I. Mid Cap Growth Fund.
The views and opinions expressed in management’s discussion of Fund performance are those of Invesco Advisers, Inc. These views and opinions are subject to change at any time based on factors such as market and economic conditions. These views and opinions may not be relied upon as investment advice or recommendations, or as an offer for a particular security. The information is not a complete analysis of every aspect of any market, country, industry, security or the Fund. Statements of fact are from sources considered reliable, but Invesco Advisers, Inc. makes no representation or warranty as to their completeness or accuracy. Although historical performance is no guarantee of future results, these insights may help you understand our investment management philosophy.
See important Fund and, if applicable, index disclosures later in this report.
| | |
 | | Jim Leach Chartered Financial Analyst, Portfolio Manager, is manager of Invesco V.I. Mid Cap Growth Fund. He |
| joined Invesco in 2011. Mr. Leach earned a BS in mechanical engineering from the University of California and an MBA from New York University Stern School of Business. |
|
Invesco V.I. Mid Cap Growth Fund |
Your Fund’s Long-Term Performance
Results of a $10,000 Investment – Oldest Share Class(es)
Fund and index data from 12/31/05
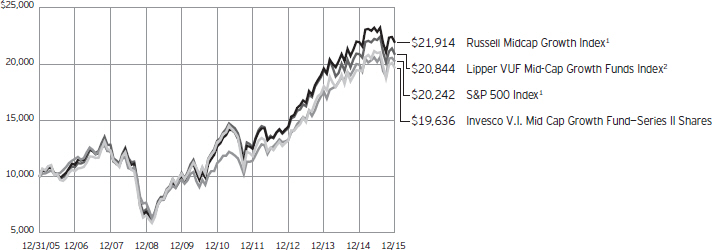
| 1 | Source: FactSet Research Systems Inc. |
Past performance cannot guarantee
comparable future results.
| | | | | |
| Average Annual Total Returns |
As of 12/31/15 | | | | | |
| |
| Series I Shares | | | | | |
| 10 Years | | | | 7.09 | % |
| 5 Years | | | | 8.78 | |
| 1 Year | | | | 1.21 | |
| |
| Series II Shares | | | | | |
| Inception (9/25/00) | | | | 0.51 | % |
| 10 Years | | | | 6.98 | |
| 5 Years | | | | 8.50 | |
| 1 Year | | | | 1.04 | |
Effective June 1, 2010, Class II shares of the predecessor fund, Van Kampen Life Investment Trust Mid Cap Growth Portfolio, advised by Van Kampen Asset Management were reorganized into Series II shares, of Invesco Van Kampen V.I. Mid Cap Growth Fund (renamed Invesco V.I. Mid Cap Growth Fund on April 29, 2013). Returns shown above for Series II shares are blended returns of the predecessor fund and Invesco V.I. Mid Cap Growth Fund. Share class returns will differ from the predecessor fund because of different expenses.
Series I shares incepted on June 1, 2010. Series I share performance shown prior to that date is that of the predecessor fund’s Class II shares and includes the 12b-1 fees applicable to the predecessor fund’s Class II shares.
The performance data quoted represent past performance and cannot guarantee comparable future results; current performance may be lower or higher. Please contact your variable product issuer or financial adviser for the most recent month-end variable product performance. Performance figures reflect Fund expenses, reinvested distributions and changes in net asset value. Investment return and principal value will fluctuate so that you may have a gain or loss when you sell shares.
The total annual Fund operating expense ratio set forth in the most recent Fund prospectus as of the date of this report for Series I and Series II shares was 1.07% and 1.32%, respectively. The expense ratios presented above may vary from the expense ratios presented in other sections of this report that are based on expenses incurred during the period covered by this report.
Invesco V.I. Mid Cap Growth Fund, a series portfolio of AIM Variable Insurance Funds (Invesco Variable Insurance Funds), is currently offered through insurance companies issuing variable products. You cannot purchase shares of the Fund directly. Performance figures given represent
the Fund and are not intended to reflect actual variable product values. They do not reflect sales charges, expenses and fees assessed in connection with a variable product. Sales charges, expenses and fees, which are determined by the variable product issuers, will vary and will lower the total return.
The most recent month-end performance at the Fund level, excluding variable product charges, is available at
800 451 4246. As mentioned above, for the most recent month-end performance including variable product charges, please contact your variable product issuer or financial adviser.
Fund performance reflects any applicable fee waivers and/or expense reimbursements. Had the adviser not waived fees and/or reimbursed expenses currently or in the past, returns would have been lower. See current prospectus for more information.
|
Invesco V.I. Mid Cap Growth Fund |
Invesco V.I. Mid Cap Growth Fund’s investment objective is to seek capital growth.
| n | | Unless otherwise stated, information presented in this report is as of December 31, 2015, and is based on total net assets. |
| n | | Unless otherwise noted, all data provided by Invesco. |
| n | | To access your Fund’s reports/prospectus, visit invesco.com/fundreports. |
Principal risks of investing in the Fund
Developing/emerging markets securities risk. The prices of securities issued by foreign companies and governments located in developing/emerging markets countries may be affected more negatively by inflation, devaluation of their currencies, higher transaction costs, delays in settlement, adverse political developments, the introduction of capital controls, withholding taxes, nationalization of private assets, expropriation, social unrest, war or lack of timely information than those in developed countries.
Foreign securities risk. The Fund’s foreign investments may be affected by changes in a foreign country’s exchange rates, political and social instability, changes in economic or taxation policies, difficulties when enforcing obligations, decreased liquidity, and increased volatility. Foreign companies may be subject to less regulation resulting in less publicly available information about the companies.
Growth investing risk. Growth stocks tend to be more expensive relative to their earnings or assets compared with other types of stock. As a result they tend to be more sensitive to changes in their earnings and can be more volatile.
Management risk. The investment techniques and risk analysis used by the Fund’s portfolio managers may not produce the desired results.
Market risk. The prices of and the income generated by the Fund’s securities may decline in response to, among other things, investor sentiment, general economic and market conditions, regional or global instability, and currency and interest rate fluctuations.
Mid-capitalization risk. Stocks of mid-sized companies tend to be more vulnerable to adverse developments and may have little or no operating history or track record of success, and limited product lines, markets, management and financial resources. The securities of mid-sized companies may be more volatile due to less market interest and less publicly available information about the issuer. They also may be illiquid or restricted as to resale, or may trade less frequently and in smaller volumes, all of which may cause difficulty when establishing or closing a position at a desirable price.
About indexes used in this report
The S&P 500® Index is an unmanaged index considered representative of the US stock market.
The Russell Midcap® Growth Index is an unmanaged index considered representative of mid-cap growth stocks. The Russell Midcap Growth Index is a trademark/service mark of the Frank Russell Co. Russell® is a trademark of the Frank Russell Co.
The Lipper VUF Mid-Cap Growth Funds Index is an unmanaged index considered representative of mid-cap growth variable insurance underlying funds tracked by Lipper.
The Fund is not managed to track the performance of any particular index, including the index(es) described here, and consequently, the performance of the Fund may deviate significantly from the performance of the index(es).
A direct investment cannot be made in an index. Unless otherwise indicated, index results include reinvested dividends, and they do not reflect sales charges. Performance of the peer group, if applicable, reflects fund expenses; performance of a market index does not.
Other information
The returns shown in management’s discussion of Fund performance are based on net asset values calculated for shareholder transactions. Generally accepted accounting principles require adjustments to be made to the net assets of the Fund at period end for financial reporting purposes, and as such, the net asset values for shareholder transactions and the returns based on those net asset values may differ from the net asset values and returns reported in the Financial Highlights. Additionally, the returns and net asset values shown throughout this report are at the Fund level only and do not include variable product issuer charges. If such charges were included, the total returns would be lower.
Industry classifications used in this report are generally according to the Global Industry Classification Standard, which was developed by and is the exclusive property and a service mark of MSCI Inc. and Standard & Poor’s.
|
Invesco V.I. Mid Cap Growth Fund |
Schedule of Investments(a)
December 31, 2015
| | | | | | | | |
| | | Shares | | | Value | |
Common Stocks & Other Equity Interests–98.00% | |
| Airlines–2.24% | |
Southwest Airlines Co. | | | 67,674 | | | $ | 2,914,042 | |
United Continental Holdings Inc.(b) | | | 51,826 | | | | 2,969,630 | |
| | | | | | | | 5,883,672 | |
|
| Apparel Retail–1.17% | |
L Brands, Inc. | | | 31,984 | | | | 3,064,707 | |
|
| Apparel, Accessories & Luxury Goods–0.71% | |
Under Armour, Inc.–Class A(b) | | | 23,023 | | | | 1,855,884 | |
|
| Application Software–4.13% | |
Cadence Design Systems, Inc.(b) | | | 182,002 | | | | 3,787,461 | |
Mobileye N.V.(b)(c) | | | 75,160 | | | | 3,177,765 | |
SolarWinds, Inc.(b) | | | 35,971 | | | | 2,118,692 | |
Tyler Technologies, Inc.(b) | | | 10,013 | | | | 1,745,466 | |
| | | | | | | | 10,829,384 | |
|
| Asset Management & Custody Banks–0.79% | |
WisdomTree Investments, Inc. | | | 132,933 | | | | 2,084,389 | |
|
| Auto Parts & Equipment–1.09% | |
Gentherm Inc.(b) | | | 60,242 | | | | 2,855,471 | |
|
| Automobile Manufacturers–1.10% | |
Tesla Motors, Inc.(b) | | | 12,022 | | | | 2,885,400 | |
|
| Automotive Retail–2.33% | |
Advance Auto Parts, Inc. | | | 16,903 | | | | 2,544,071 | |
O’Reilly Automotive, Inc.(b) | | | 14,093 | | | | 3,571,448 | |
| | | | | | | | 6,115,519 | |
|
| Biotechnology–4.65% | |
Alexion Pharmaceuticals, Inc.(b) | | | 27,925 | | | | 5,326,694 | |
BioMarin Pharmaceutical Inc.(b) | | | 37,552 | | | | 3,933,948 | |
Medivation Inc.(b) | | | 60,475 | | | | 2,923,361 | |
| | | | | | | | 12,184,003 | |
|
| Building Products–4.44% | |
A.O. Smith Corp. | | | 54,067 | | | | 4,142,073 | |
Allegion PLC | | | 26,511 | | | | 1,747,605 | |
Lennox International Inc. | | | 25,714 | | | | 3,211,678 | |
Owens Corning | | | 53,828 | | | | 2,531,531 | |
| | | | | | | | 11,632,887 | |
|
| Communications Equipment–2.24% | |
Palo Alto Networks, Inc.(b) | | | 33,422 | | | | 5,886,951 | |
|
| Construction Machinery & Heavy Trucks–0.64% | |
WABCO Holdings Inc.(b) | | | 16,486 | | | | 1,685,858 | |
|
| Construction Materials–0.50% | |
Vulcan Materials Co. | | | 13,722 | | | | 1,303,178 | |
|
| Consumer Electronics–1.44% | |
Harman International Industries, Inc. | | | 40,115 | | | | 3,779,234 | |
| | | | | | | | |
| | | Shares | | | Value | |
| Data Processing & Outsourced Services–1.60% | |
Alliance Data Systems Corp.(b) | | | 7,996 | | | $ | 2,211,454 | |
Fidelity National Information Services, Inc. | | | 32,924 | | | | 1,995,194 | |
| | | | | | | | 4,206,648 | |
|
| Distillers & Vintners–2.61% | |
Constellation Brands, Inc.–Class A | | | 48,019 | | | | 6,839,826 | |
|
| Diversified Support Services–1.33% | |
KAR Auction Services Inc. | | | 94,139 | | | | 3,485,967 | |
|
| Electrical Components & Equipment–1.00% | |
Acuity Brands, Inc. | | | 11,162 | | | | 2,609,676 | |
|
| Electronic Components–1.60% | |
Amphenol Corp.–Class A | | | 80,337 | | | | 4,196,002 | |
|
| Footwear–0.77% | |
Skechers U.S.A., Inc.–Class A(b) | | | 66,925 | | | | 2,021,804 | |
|
| General Merchandise Stores–1.37% | |
Burlington Stores, Inc.(b) | | | 83,898 | | | | 3,599,224 | |
|
| Health Care Equipment–4.01% | |
Boston Scientific Corp.(b) | | | 227,841 | | | | 4,201,388 | |
DexCom Inc.(b) | | | 29,325 | | | | 2,401,717 | |
Hologic, Inc.(b) | | | 101,269 | | | | 3,918,098 | |
| | | | | | | | 10,521,203 | |
|
| Health Care Facilities–1.70% | |
Universal Health Services, Inc.–Class B | | | 12,901 | | | | 1,541,541 | |
VCA, Inc.(b) | | | 52,879 | | | | 2,908,345 | |
| | | | | | | | 4,449,886 | |
|
| Health Care Services–0.81% | |
Team Health Holdings, Inc.(b) | | | 48,430 | | | | 2,125,593 | |
|
| Health Care Supplies–0.72% | |
Penumbra, Inc.(b) | | | 35,049 | | | | 1,885,987 | |
|
| Hotels, Resorts & Cruise Lines–1.41% | |
Royal Caribbean Cruises Ltd. | | | 36,659 | | | | 3,710,257 | |
|
| Household Appliances–0.76% | |
Whirlpool Corp. | | | 13,509 | | | | 1,984,067 | |
|
| Housewares & Specialties–1.67% | |
Jarden Corp.(b) | | | 76,611 | | | | 4,376,020 | |
|
| Industrial Conglomerates–1.51% | |
Carlisle Cos. Inc. | | | 44,564 | | | | 3,952,381 | |
|
| Industrial Machinery–1.72% | |
Stanley Black & Decker Inc. | | | 42,308 | | | | 4,515,533 | |
|
| Internet Software & Services–2.19% | |
Akamai Technologies, Inc.(b) | | | 17,956 | | | | 945,024 | |
CoStar Group Inc.(b) | | | 7,566 | | | | 1,563,817 | |
See accompanying Notes to Financial Statements which are an integral part of the financial statements.
Invesco V.I. Mid Cap Growth Fund
| | | | | | | | |
| | | Shares | | | Value | |
| Internet Software & Services–(continued) | |
LinkedIn Corp.–Class A(b) | | | 14,363 | | | $ | 3,232,824 | |
| | | | | | | | 5,741,665 | |
|
| Investment Banking & Brokerage–3.64% | |
E*TRADE Financial Corp.(b) | | | 200,178 | | | | 5,933,276 | |
Lazard Ltd.–Class A | | | 80,349 | | | | 3,616,508 | |
| | | | | | | | 9,549,784 | |
|
| IT Consulting & Other Services–0.86% | |
Gartner, Inc.(b) | | | 24,972 | | | | 2,264,960 | |
|
| Leisure Products–1.89% | |
Brunswick Corp. | | | 98,347 | | | | 4,967,507 | |
|
| Life Sciences Tools & Services–2.51% | |
Illumina, Inc.(b) | | | 15,110 | | | | 2,900,289 | |
VWR Corp.(b) | | | 130,218 | | | | 3,686,472 | |
| | | | | | | | 6,586,761 | |
|
| Managed Health Care–1.41% | |
Centene Corp.(b) | | | 56,351 | | | | 3,708,459 | |
|
| Metal & Glass Containers–1.25% | |
Berry Plastics Group Inc.(b) | | | 90,353 | | | | 3,268,972 | |
|
| Movies & Entertainment–1.44% | |
Cinemark Holdings, Inc. | | | 113,212 | | | | 3,784,677 | |
|
| Oil & Gas Exploration & Production–1.12% | |
Concho Resources Inc.(b) | | | 11,195 | | | | 1,039,568 | |
Diamondback Energy Inc.(b) | | | 15,310 | | | | 1,024,239 | |
EQT Corp. | | | 16,759 | | | | 873,646 | |
| | | | | | | | 2,937,453 | |
|
| Packaged Foods & Meats–1.36% | |
Hain Celestial Group, Inc. (The)(b) | | | 40,599 | | | | 1,639,793 | |
WhiteWave Foods Co. (The)(b) | | | 49,791 | | | | 1,937,368 | |
| | | | | | | | 3,577,161 | |
|
| Pharmaceuticals–1.61% | |
Pacira Pharmaceuticals, Inc.(b) | | | 54,984 | | | | 4,222,221 | |
|
| Real Estate Services–0.49% | |
Realogy Holdings Corp.(b) | | | 35,233 | | | | 1,291,994 | |
|
| Regional Banks–1.17% | |
SVB Financial Group(b) | | | 25,861 | | | | 3,074,873 | |
|
| Research & Consulting Services–0.86% | |
IHS Inc.–Class A(b) | | | 19,098 | | | | 2,261,776 | |
|
| Restaurants–1.27% | |
Domino’s Pizza, Inc. | | | 30,006 | | | | 3,338,168 | |
|
| Semiconductors–4.24% | |
Cavium Inc.(b) | | | 66,596 | | | | 4,376,023 | |
NXP Semiconductors N.V. (Netherlands)(b) | | | 58,142 | | | | 4,898,464 | |
Qorvo, Inc.(b) | | | 36,161 | | | | 1,840,595 | |
| | | | | | | | 11,115,082 | |
| | | | | | | | |
| | | Shares | | | Value | |
| Soft Drinks–1.66% | |
Monster Beverage Corp.(b) | | | 29,160 | | | $ | 4,343,674 | |
|
| Specialized Finance–4.07% | |
Intercontinental Exchange, Inc. | | | 22,603 | | | | 5,792,245 | |
McGraw Hill Financial, Inc. | | | 49,427 | | | | 4,872,513 | |
| | | | | | | | 10,664,758 | |
|
| Specialized REIT’s–1.32% | |
Equinix, Inc. | | | 11,487 | | | | 3,473,669 | |
|
| Specialty Chemicals–1.93% | |
PPG Industries, Inc. | | | 33,539 | | | | 3,314,324 | |
Valspar Corp. (The) | | | 21,087 | | | | 1,749,167 | |
| | | | | | | | 5,063,491 | |
|
| Specialty Stores–3.46% | |
Signet Jewelers Ltd. | | | 39,032 | | | | 4,827,868 | |
Tractor Supply Co. | | | 49,759 | | | | 4,254,395 | |
| | | | | | | | 9,082,263 | |
|
| Systems Software–2.14% | |
ServiceNow, Inc.(b) | | | 64,867 | | | | 5,614,888 | |
|
| Technology Hardware, Storage & Peripherals–0.55% | |
Western Digital Corp. | | | 24,195 | | | | 1,452,910 | |
|
| Thrifts & Mortgage Finance–1.23% | |
MGIC Investment Corp.(b) | | | 364,272 | | | | 3,216,522 | |
|
| Trucking–0.47% | |
Old Dominion Freight Line, Inc.(b) | | | 20,747 | | | | 1,225,525 | |
|
| Wireless Telecommunication Services–1.80% | |
SBA Communications Corp.–Class A(b) | | | 44,841 | | | | 4,711,444 | |
Total Common Stocks & Other Equity Interests
(Cost $205,161,561) | | | | 257,067,268 | |
| |
Money Market Funds–2.11% | | | | | |
Liquid Assets Portfolio–Institutional Class, 0.29%(d) | | | 2,767,197 | | | | 2,767,197 | |
Premier Portfolio–Institutional Class, 0.24%(d) | | | 2,767,197 | | | | 2,767,197 | |
Total Money Market Funds
(Cost $5,534,394) | | | | 5,534,394 | |
TOTAL INVESTMENTS (excluding investments purchased with cash collateral from securities on loan)–100.11%
(Cost $210,695,955) | | | | 262,601,662 | |
| |
Investments Purchased with Cash Collateral from Securities on Loan | | | | | |
Money Market Funds–0.11% | |
Liquid Assets Portfolio–Institutional Class, 0.29%
(Cost $284,415)(d)(e) | | | 284,415 | | | | 284,415 | |
TOTAL INVESTMENTS–100.22%
(Cost $210,980,370) | | | | 262,886,077 | |
OTHER ASSETS LESS LIABILITIES–(0.22)% | | | | (569,693 | ) |
NET ASSETS–100.00% | | | $ | 262,316,384 | |
See accompanying Notes to Financial Statements which are an integral part of the financial statements.
Invesco V.I. Mid Cap Growth Fund
Investment Abbreviations:
| | |
| REIT | | – Real Estate Investment Trust |
Notes to Schedule of Investments:
| (a) | Industry and/or sector classifications used in this report are generally according to the Global Industry Classification Standard, which was developed by and is the exclusive property and a service mark of MSCI Inc. and Standard & Poor’s. |
| (b) | Non-income producing security. |
| (c) | All or a portion of this security was out on loan at December 31, 2015. |
| (d) | The money market fund and the Fund are affiliated by having the same investment adviser. The rate shown is the 7-day SEC standardized yield as of December 31, 2015. |
| (e) | The security has been segregated to satisfy the commitment to return the cash collateral received in securities lending transactions upon the borrower’s return of the securities loaned. See Note 1I. |
See accompanying Notes to Financial Statements which are an integral part of the financial statements.
Invesco V.I. Mid Cap Growth Fund
Statement of Assets and Liabilities
December 31, 2015
Statement of Operations
For the year ended December 31, 2015
| | | | |
Assets: | |
Investments, at value (Cost $205,161,561)* | | $ | 257,067,268 | |
Investments in affiliated money market funds, at value and cost | | | 5,818,809 | |
Total investments, at value (Cost $210,980,370) | | | 262,886,077 | |
Receivable for: | | | | |
Investments sold | | | 261,668 | |
Fund shares sold | | | 104,599 | |
Dividends | | | 87,791 | |
Investment for trustee deferred compensation and retirement plans | | | 108,933 | |
Other assets | | | 18,052 | |
Total assets | | | 263,467,120 | |
|
Liabilities: | |
Payable for: | | | | |
Investments purchased | | | 281,569 | |
Fund shares reacquired | | | 181,869 | |
Collateral upon return of securities loaned | | | 284,415 | |
Accrued fees to affiliates | | | 261,203 | |
Accrued trustees’ and officers’ fees and benefits | | | 151 | |
Accrued other operating expenses | | | 20,906 | |
Trustee deferred compensation and retirement plans | | | 120,623 | |
Total liabilities | | | 1,150,736 | |
Net assets applicable to shares outstanding | | $ | 262,316,384 | |
|
Net assets consist of: | |
Shares of beneficial interest | | $ | 186,872,935 | |
Undistributed net investment income (loss) | | | (124,407 | ) |
Undistributed net realized gain | | | 23,662,149 | |
Net unrealized appreciation | | | 51,905,707 | |
| | | $ | 262,316,384 | |
|
Net Assets: | |
Series I | | $ | 103,632,031 | |
Series II | | $ | 158,684,353 | |
|
Shares outstanding, $0.001 par value per share,
with an unlimited number of shares authorized: | |
Series I | | | 19,254,110 | |
Series II | | | 29,765,414 | |
Series I: | | | | |
Net asset value per share | | $ | 5.38 | |
Series II: | | | | |
Net asset value per share | | $ | 5.33 | |
| * | At December 31, 2015, securities with an aggregate value of $283,276 were on loan to brokers. |
| | | | |
Investment income: | |
Dividends | | $ | 2,027,511 | |
Dividends from affiliated money market funds (includes securities lending income of $16,787) | | | 23,305 | |
Total investment income | | | 2,050,816 | |
| |
Expenses: | | | | |
Advisory fees | | | 2,094,819 | |
Administrative services fees | | | 741,761 | |
Custodian fees | | | 13,175 | |
Distribution fees — Series II | | | 418,748 | |
Transfer agent fees | | | 51,503 | |
Trustees’ and officers’ fees and benefits | | | 25,228 | |
Other | | | 56,785 | |
Total expenses | | | 3,402,019 | |
Less: Fees waived | | | (10,480 | ) |
Net expenses | | | 3,391,539 | |
Net investment income (loss) | | | (1,340,723 | ) |
| |
Realized and unrealized gain (loss) from: | | | | |
Net realized gain from investment securities | | | 27,134,624 | |
Change in net unrealized appreciation (depreciation) of investment securities | | | (22,951,719 | ) |
Net realized and unrealized gain | | | 4,182,905 | |
Net increase in net assets resulting from operations | | $ | 2,842,182 | |
See accompanying Notes to Financial Statements which are an integral part of the financial statements.
Invesco V.I. Mid Cap Growth Fund
Statement of Changes in Net Assets
For the years ended December 31, 2015 and 2014
| | | | | | | | |
| | | 2015 | | | 2014 | |
Operations: | | | | | | | | |
Net investment income (loss) | | $ | (1,340,723 | ) | | $ | (1,399,535 | ) |
Net realized gain | | | 27,134,624 | | | | 36,941,281 | |
Change in net unrealized appreciation (depreciation) | | | (22,951,719 | ) | | | (15,377,922 | ) |
Net increase in net assets resulting from operations | | | 2,842,182 | | | | 20,163,824 | |
| | |
Distributions to shareholders from net realized gains: | | | | | | | | |
Series l | | | (8,511,702 | ) | | | — | |
Series ll | | | (12,748,108 | ) | | | — | |
Total distributions from net realized gains | | | (21,259,810 | ) | | | — | |
| | |
Share transactions–net: | | | | | | | | |
Series l | | | 4,687,810 | | | | (17,038,304 | ) |
Series ll | | | 7,356,724 | | | | (22,232,293 | ) |
Net increase (decrease) in net assets resulting from share transactions | | | 12,044,534 | | | | (39,270,597 | ) |
Net increase (decrease) in net assets | | | (6,373,094 | ) | | | (19,106,773 | ) |
| | |
Net assets: | | | | | | | | |
Beginning of year | | | 268,689,478 | | | | 287,796,251 | |
End of year (includes undistributed net investment income (loss) of $(124,407) and $(121,602), respectively) | | $ | 262,316,384 | | | $ | 268,689,478 | |
Notes to Financial Statements
December 31, 2015
NOTE 1—Significant Accounting Policies
Invesco V.I. Mid Cap Growth Fund (the “Fund”) is a series portfolio of AIM Variable Insurance Funds (Invesco Variable Insurance Funds) (the “Trust”). The Trust is a Delaware statutory trust registered under the Investment Company Act of 1940, as amended (the “1940 Act”), as an open-end series management investment company consisting of twenty-four separate portfolios, (each constituting a “Fund”). The assets, liabilities and operations of each portfolio are accounted for separately. Information presented in these financial statements pertains only to the Fund. Matters affecting each Fund or class will be voted on exclusively by the shareholders of such Fund or class. Current Securities and Exchange Commission (“SEC”) guidance, however, requires participating insurance companies offering separate accounts to vote shares proportionally in accordance with the instructions of the contract owners whose investments are funded by shares of each Fund or class.
The Fund’s investment objective is to seek capital growth.
The Fund currently offers two classes of shares, Series I and Series II, both of which are offered to insurance company separate accounts funding variable annuity contracts and variable life insurance policies (“variable products”).
The following is a summary of the significant accounting policies followed by the Fund in the preparation of its financial statements.
| A. | Security Valuations — Securities, including restricted securities, are valued according to the following policy. |
A security listed or traded on an exchange (except convertible securities) is valued at its last sales price or official closing price as of the close of the customary trading session on the exchange where the security is principally traded, or lacking any sales or official closing price on a particular day, the security may be valued at the closing bid price on that day. Securities traded in the over-the-counter market are valued based on prices furnished by independent pricing services or market makers. When such securities are valued by an independent pricing service they may be considered fair valued. Futures contracts are valued at the final settlement price set by an exchange on which they are principally traded. Listed options are valued at the mean between the last bid and asked prices from the exchange on which they are principally traded. Options not listed on an exchange are valued by an independent source at the mean between the last bid and asked prices. For purposes of determining net asset value (“NAV”) per share, futures and option contracts generally are valued 15 minutes after the close of the customary trading session of the New York Stock Exchange (“NYSE”).
Investments in open-end and closed-end registered investment companies that do not trade on an exchange are valued at the end-of-day net asset value per share. Investments in open-end and closed-end registered investment companies that trade on an exchange are valued at the last sales price or official closing price as of the close of the customary trading session on the exchange where the security is principally traded.
Debt obligations (including convertible securities) and unlisted equities are fair valued using an evaluated quote provided by an independent pricing service. Evaluated quotes provided by the pricing service may be determined without exclusive reliance on quoted prices, and may reflect appropriate factors such as institution-size trading in similar groups of securities, developments related to specific securities, dividend rate (for unlisted equities), yield (for debt obligations), quality, type of issue, coupon rate (for debt obligations), maturity (for debt obligations), individual trading characteristics and other market data. Debt obligations are subject to interest rate and credit risks. In addition, all debt obligations involve some risk of default with respect to interest and/or principal payments.
Invesco V.I. Mid Cap Growth Fund
Foreign securities’ (including foreign exchange contracts) prices are converted into U.S. dollar amounts using the applicable exchange rates as of the close of the NYSE. If market quotations are available and reliable for foreign exchange-traded equity securities, the securities will be valued at the market quotations. Because trading hours for certain foreign securities end before the close of the NYSE, closing market quotations may become unreliable. If between the time trading ends on a particular security and the close of the customary trading session on the NYSE, events occur that the Adviser determines are significant and make the closing price unreliable, the Fund may fair value the security. If the event is likely to have affected the closing price of the security, the security will be valued at fair value in good faith using procedures approved by the Board of Trustees. Adjustments to closing prices to reflect fair value may also be based on a screening process of an independent pricing service to indicate the degree of certainty, based on historical data, that the closing price in the principal market where a foreign security trades is not the current value as of the close of the NYSE. Foreign securities’ prices meeting the approved degree of certainty that the price is not reflective of current value will be priced at the indication of fair value from the independent pricing service. Multiple factors may be considered by the independent pricing service in determining adjustments to reflect fair value and may include information relating to sector indices, American Depositary Receipts and domestic and foreign index futures. Foreign securities may have additional risks including exchange rate changes, potential for sharply devalued currencies and high inflation, political and economic upheaval, the relative lack of issuer information, relatively low market liquidity and the potential lack of strict financial and accounting controls and standards.
Securities for which market prices are not provided by any of the above methods may be valued based upon quotes furnished by independent sources. The last bid price may be used to value equity securities. The mean between the last bid and asked prices is used to value debt obligations, including corporate loans.
Securities for which market quotations are not readily available or became unreliable are valued at fair value as determined in good faith by or under the supervision of the Trust’s officers following procedures approved by the Board of Trustees. Issuer specific events, market trends, bid/asked quotes of brokers and information providers and other market data may be reviewed in the course of making a good faith determination of a security’s fair value.
The Fund may invest in securities that are subject to interest rate risk, meaning the risk that the prices will generally fall as interest rates rise and, conversely, the prices will generally rise as interest rates fall. Specific securities differ in their sensitivity to changes in interest rates depending on their individual characteristics. Changes in interest rates may result in increased market volatility, which may affect the value and/or liquidity of certain Fund investments.
Valuations change in response to many factors including the historical and prospective earnings of the issuer, the value of the issuer’s assets, general economic conditions, interest rates, investor perceptions and market liquidity. Because of the inherent uncertainties of valuation, the values reflected in the financial statements may materially differ from the value received upon actual sale of those investments.
| B. | Securities Transactions and Investment Income — Securities transactions are accounted for on a trade date basis. Realized gains or losses on sales are computed on the basis of specific identification of the securities sold. Interest income (net of withholding tax, if any) is recorded on the accrual basis from settlement date. Dividend income (net of withholding tax, if any) is recorded on the ex-dividend date. |
The Fund may periodically participate in litigation related to Fund investments. As such, the Fund may receive proceeds from litigation settlements. Any proceeds received are included in the Statement of Operations as realized gain (loss) for investments no longer held and as unrealized gain (loss) for investments still held.
Brokerage commissions and mark ups are considered transaction costs and are recorded as an increase to the cost basis of securities purchased and/or a reduction of proceeds on a sale of securities. Such transaction costs are included in the determination of net realized and unrealized gain (loss) from investment securities reported in the Statement of Operations and the Statement of Changes in Net Assets and the net realized and unrealized gains (losses) on securities per share in the Financial Highlights. Transaction costs are included in the calculation of the Fund’s net asset value and, accordingly, they reduce the Fund’s total returns. These transaction costs are not considered operating expenses and are not reflected in net investment income reported in the Statement of Operations and the Statement of Changes in Net Assets, or the net investment income per share and the ratios of expenses and net investment income reported in the Financial Highlights, nor are they limited by any expense limitation arrangements between the Fund and the investment adviser.
The Fund allocates income and realized and unrealized capital gains and losses to a class based on the relative net assets of each class.
| C. | Country Determination — For the purposes of making investment selection decisions and presentation in the Schedule of Investments, the investment adviser may determine the country in which an issuer is located and/or credit risk exposure based on various factors. These factors include the laws of the country under which the issuer is organized, where the issuer maintains a principal office, the country in which the issuer derives 50% or more of its total revenues and the country that has the primary market for the issuer’s securities, as well as other criteria. Among the other criteria that may be evaluated for making this determination are the country in which the issuer maintains 50% or more of its assets, the type of security, financial guarantees and enhancements, the nature of the collateral and the sponsor organization. Country of issuer and/or credit risk exposure has been determined to be the United States of America, unless otherwise noted. |
| D. | Distributions — Distributions from net investment income and net realized capital gain, if any, are generally declared and paid to separate accounts of participating insurance companies annually and recorded on the ex-dividend date. |
| E. | Federal Income Taxes — The Fund intends to comply with the requirements of Subchapter M of the Internal Revenue Code of 1986, as amended (the “Internal Revenue Code”), necessary to qualify as a regulated investment company and to distribute substantially all of the Fund’s taxable earnings to shareholders. As such, the Fund will not be subject to federal income taxes on otherwise taxable income (including net realized capital gain) that is distributed to shareholders. Therefore, no provision for federal income taxes is recorded in the financial statements. |
The Fund recognizes the tax benefits of uncertain tax positions only when the position is more likely than not to be sustained. Management has analyzed the Fund’s uncertain tax positions and concluded that no liability for unrecognized tax benefits should be recorded related to uncertain tax positions. Management is not aware of any tax positions for which it is reasonably possible that the total amounts of unrecognized tax benefits will change materially in the next 12 months.
The Fund files tax returns in the U.S. Federal jurisdiction and certain other jurisdictions. Generally, the Fund is subject to examinations by such taxing authorities for up to three years after the filing of the return for the tax period.
| F. | Expenses — Fees provided for under the Rule 12b-1 plan of a particular class of the Fund and which are directly attributable to that class are charged to the operations of such class. All other expenses are allocated among the classes based on relative net assets. |
Invesco V.I. Mid Cap Growth Fund
| G. | Accounting Estimates — The preparation of financial statements in conformity with accounting principles generally accepted in the United States of America (“GAAP”) requires management to make estimates and assumptions that affect the reported amounts of assets and liabilities at the date of the financial statements and the reported amounts of revenues and expenses during the reporting period including estimates and assumptions related to taxation. Actual results could differ from those estimates by a significant amount. In addition, the Fund monitors for material events or transactions that may occur or become known after the period-end date and before the date the financial statements are released to print. |
| H. | Indemnifications — Under the Trust’s organizational documents, each Trustee, officer, employee or other agent of the Trust is indemnified against certain liabilities that may arise out of the performance of their duties to the Fund. Additionally, in the normal course of business, the Fund enters into contracts, including the Fund’s servicing agreements, that contain a variety of indemnification clauses. The Fund’s maximum exposure under these arrangements is unknown as this would involve future claims that may be made against the Fund that have not yet occurred. The risk of material loss as a result of such indemnification claims is considered remote. |
| I. | Securities Lending — The Fund may lend portfolio securities having a market value up to one-third of the Fund’s total assets. Such loans are secured by collateral equal to no less than the market value of the loaned securities determined daily by the securities lending provider. Such collateral will be cash or debt securities issued or guaranteed by the U.S. Government or any of its sponsored agencies. Cash collateral received in connection with these loans is invested in short-term money market instruments or affiliated money market funds and is shown as such on the Schedule of Investments. The Fund bears the risk of loss with respect to the investment of collateral. It is the Fund’s policy to obtain additional collateral from or return excess collateral to the borrower by the end of the next business day, following the valuation date of the securities loaned. Therefore, the value of the collateral held may be temporarily less than the value of the securities on loan. When loaning securities, the Fund retains certain benefits of owning the securities, including the economic equivalent of dividends or interest generated by the security. Lending securities entails a risk of loss to the Fund if, and to the extent that, the market value of the securities loaned were to increase and the borrower did not increase the collateral accordingly, and the borrower failed to return the securities. The securities loaned are subject to termination at the option of the borrower or the Fund. Upon termination, the borrower will return to the Fund the securities loaned and the Fund will return the collateral. Upon the failure of the borrower to return the securities, collateral may be liquidated and the securities may be purchased on the open market to replace the loaned securities. The Fund could experience delays and costs in gaining access to the collateral and the securities may lose value during the delay which could result in potential losses to the Fund. Some of these losses may be indemnified by the lending agent. The Fund bears the risk of any deficiency in the amount of the collateral available for return to the borrower due to any loss on the collateral invested. Dividends received on cash collateral investments for securities lending transactions, which are net of compensation to counterparties, are included in Dividends from affiliated money market funds on the Statement of Operations. The aggregate value of securities out on loan, if any, is shown as a footnote on the Statement of Assets and Liabilities. |
NOTE 2—Advisory Fees and Other Fees Paid to Affiliates
The Trust has entered into a master investment advisory agreement with Invesco Advisers, Inc. (the “Adviser” or “Invesco”). Under the terms of the investment advisory agreement, the Fund pays an advisory fee to the Adviser based on the annual rate of the Fund’s average daily net assets as follows:
| | | | |
| Average Daily Net Assets | | Rate | |
First $500 million | | | 0.75% | |
Next $500 million | | | 0.70% | |
Over $1 billion | | | 0.65% | |
For the year ended December 31, 2015, the effective advisory fees incurred by the Fund was 0.75%.
Under the terms of a master sub-advisory agreement between the Adviser and each of Invesco Asset Management Deutschland GmbH, Invesco Asset Management Limited, Invesco Asset Management (Japan) Limited, Invesco Hong Kong Limited, Invesco Senior Secured Management, Inc. and Invesco Canada Ltd. (collectively, the “Affiliated Sub-Advisers”) the Adviser, not the Fund, may pay 40% of the fees paid to the Adviser to any such Affiliated Sub-Adviser(s) that provide(s) discretionary investment management services to the Fund based on the percentage of assets allocated to such Affiliated Sub-Adviser(s).
The Adviser has contractually agreed, through at least June 30, 2016, to waive advisory fees and/or reimburse expenses of all shares to the extent necessary to limit total annual fund operating expenses after fee waiver and/or expense reimbursement (excluding certain items discussed below) of Series I shares to 2.00% and Series II shares to 2.25% of average daily net assets. In determining the Adviser’s obligation to waive advisory fees and/or reimburse expenses, the following expenses are not taken into account, and could cause the total annual fund operating expenses after fee waiver and/or expense reimbursement to exceed the numbers reflected above: (1) interest; (2) taxes; (3) dividend expense on short sales; (4) extraordinary or non-routine items, including litigation expenses; and (5) expenses that the Fund has incurred but did not actually pay because of an expense offset arrangement. Unless Invesco continues the fee waiver agreement, it will terminate on June 30, 2016. The fee waiver agreement cannot be terminated during its term. The Adviser did not waive fees and/or reimburse expenses during the period under this expense limitation.
Further, the Adviser has contractually agreed, through at least June 30, 2017, to waive the advisory fee payable by the Fund in an amount equal to 100% of the net advisory fees the Adviser receives from the affiliated money market funds on investments by the Fund of uninvested cash (excluding investments of cash collateral from securities lending) in such affiliated money market funds.
For the year ended December 31, 2015, the Adviser waived advisory fees of $10,480.
The Trust has entered into a master administrative services agreement with Invesco pursuant to which the Fund has agreed to pay Invesco a fee for costs incurred in providing accounting services and fund administrative services to the Fund and to reimburse Invesco for administrative services fees paid to insurance companies that have agreed to provide services to the participants of separate accounts. These administrative services provided by the insurance companies may include, among other things: the printing of prospectuses, financial reports and proxy statements and the delivery of the same to existing participants; the maintenance of master accounts; the facilitation of purchases and redemptions requested by the participants;
Invesco V.I. Mid Cap Growth Fund
and the servicing of participants’ accounts. Pursuant to such agreement, for the year ended December 31, 2015, Invesco was paid $69,241 for accounting and fund administrative services and reimbursed $672,520 for services provided by insurance companies.
The Trust has entered into a transfer agency and service agreement with Invesco Investment Services, Inc. (“IIS”) pursuant to which the Fund has agreed to pay IIS a fee for providing transfer agency and shareholder services to the Fund and reimburse IIS for certain expenses incurred by IIS in the course of providing such services. For the year ended December 31, 2015, expenses incurred under the agreement are shown in the Statement of Operations as Transfer agent fees.
The Trust has entered into a master distribution agreement with Invesco Distributors, Inc. (“IDI”) to serve as the distributor for the Fund. The Trust has adopted a plan pursuant to Rule 12b-1 under the 1940 Act with respect to the Fund’s Series II shares (the “Plan”). The Fund, pursuant to the Plan, pays IDI compensation at the annual rate of 0.25% of the Fund’s average daily net assets of Series II shares. Of the Plan payments, up to 0.25% of the average daily net assets of the Series II shares may be paid to insurance companies who furnish continuing personal shareholder services to customers who purchase and own Series II shares of the Fund. For the year ended December 31, 2015, expenses incurred under the Plan are detailed in the Statement of Operations as Distribution fees.
For the year ended December 31, 2015, the Fund incurred $1,688 in brokerage commissions with Invesco Capital Markets, Inc., an affiliate of the Adviser and IDI, for portfolio transactions executed on behalf of the Fund.
Certain officers and trustees of the Trust are officers and directors of the Adviser, IIS and/or IDI.
NOTE 3—Additional Valuation Information
GAAP defines fair value as the price that would be received to sell an asset or paid to transfer a liability in an orderly transaction between market participants at the measurement date, under current market conditions. GAAP establishes a hierarchy that prioritizes the inputs to valuation methods, giving the highest priority to readily available unadjusted quoted prices in an active market for identical assets (Level 1) and the lowest priority to significant unobservable inputs (Level 3), generally when market prices are not readily available or are unreliable. Based on the valuation inputs, the securities or other investments are tiered into one of three levels. Changes in valuation methods may result in transfers in or out of an investment’s assigned level:
| | Level 1 — | Prices are determined using quoted prices in an active market for identical assets. |
| | Level 2 — | Prices are determined using other significant observable inputs. Observable inputs are inputs that other market participants may use in pricing a security. These may include quoted prices for similar securities, interest rates, prepayment speeds, credit risk, yield curves, loss severities, default rates, discount rates, volatilities and others. |
| | Level 3 — | Prices are determined using significant unobservable inputs. In situations where quoted prices or observable inputs are unavailable (for example, when there is little or no market activity for an investment at the end of the period), unobservable inputs may be used. Unobservable inputs reflect the Fund’s own assumptions about the factors market participants would use in determining fair value of the securities or instruments and would be based on the best available information. |
As of December 31, 2015, all of the securities in this Fund were valued based on Level 1 inputs (see the Schedule of Investments for security categories). The level assigned to the securities valuations may not be an indication of the risk or liquidity associated with investing in those securities. Because of the inherent uncertainties of valuation, the values reflected in the financial statements may materially differ from the value received upon actual sale of those investments.
NOTE 4—Trustees’ and Officers’ Fees and Benefits
Trustees’ and Officers’ Fees and Benefits include amounts accrued by the Fund to pay remuneration to certain Trustees and Officers of the Fund. Trustees have the option to defer compensation payable by the Fund, and Trustees’ and Officers’ Fees and Benefits also include amounts accrued by the Fund to fund such deferred compensation amounts. Those Trustees who defer compensation have the option to select various Invesco Funds in which their deferral accounts shall be deemed to be invested. Finally, certain current Trustees were eligible to participate in a retirement plan that provided for benefits to be paid upon retirement to Trustees over a period of time based on the number of years of service. The Fund may have certain former Trustees who also participate in a retirement plan and receive benefits under such plan. Trustees’ and Officers’ Fees and Benefits include amounts accrued by the Fund to fund such retirement benefits. Obligations under the deferred compensation and retirement plans represent unsecured claims against the general assets of the Fund.
NOTE 5—Cash Balances
The Fund is permitted to temporarily carry a negative or overdrawn balance in its account with State Street Bank and Trust Company, the custodian bank. Such balances, if any at period end, are shown in the Statement of Assets and Liabilities under the payable caption Amount due custodian. To compensate the custodian bank for such overdrafts, the overdrawn Fund may either (1) leave funds as a compensating balance in the account so the custodian bank can be compensated by earning the additional interest; or (2) compensate by paying the custodian bank at a rate agreed upon by the custodian bank and Invesco, not to exceed the contractually agreed upon rate.
Invesco V.I. Mid Cap Growth Fund
NOTE 6—Distributions to Shareholders and Tax Components of Net Assets
Tax Character of Distributions to Shareholders Paid During the Fiscal Years Ended December 31, 2015 and 2014:
| | | | | | | | |
| | | 2015 | | | 2014 | |
Long-term capital gain | | $ | 21,259,810 | | | $ | — | |
Tax Components of Net Assets at Period-End:
| | | | |
| | | 2015 | |
Undistributed long-term gain | | $ | 24,259,663 | |
Net unrealized appreciation — investments | | | 51,308,351 | |
Temporary book/tax differences | | | (124,565 | ) |
Shares of beneficial interest | | | 186,872,935 | |
Total net assets | | $ | 262,316,384 | |
The difference between book-basis and tax-basis unrealized appreciation (depreciation) is due to differences in the timing of recognition of gains and losses on investments for tax and book purposes. The Fund’s net unrealized appreciation difference is attributable primarily to wash sales.
The temporary book/tax differences are a result of timing differences between book and tax recognition of income and/or expenses. The Fund’s temporary book/tax differences are the result of the trustee deferral of compensation and retirement plan benefits.
Capital loss carryforward is calculated and reported as of a specific date. Results of transactions and other activity after that date may affect the amount of capital loss carryforward actually available for the Fund to utilize. Capital losses generated in years beginning after December 22, 2010 can be carried forward for an unlimited period, whereas previous losses expire in eight tax years. Capital losses with an expiration period may not be used to offset capital gains until all net capital losses without an expiration date have been utilized. Capital loss carryforwards with no expiration date will retain their character as either short-term or long-term capital losses instead of as short-term capital losses as under prior law. The ability to utilize capital loss carryforwards in the future may be limited under the Internal Revenue Code and related regulations based on the results of future transactions.
The Fund does not have a capital loss carryforward as of December 31, 2015.
NOTE 7—Investment Securities
The aggregate amount of investment securities (other than short-term securities, U.S. Treasury obligations and money market funds, if any) purchased and sold by the Fund during the year ended December 31, 2015 was $168,405,958 and $179,342,363, respectively. Cost of investments on a tax basis includes the adjustments for financial reporting purposes as of the most recently completed federal income tax reporting period-end.
| | | | |
| Unrealized Appreciation (Depreciation) of Investment Securities on a Tax Basis | |
Aggregate unrealized appreciation of investment securities | | $ | 60,644,999 | |
Aggregate unrealized (depreciation) of investment securities | | | (9,336,648 | ) |
Net unrealized appreciation of investment securities | | $ | 51,308,351 | |
Cost of investments for tax purposes is $211,577,726.
NOTE 8—Reclassification of Permanent Differences
Primarily as a result of differing book/tax treatment of net operating losses, on December 31, 2015, undistributed net investment income (loss) was increased by $1,337,918, undistributed net realized gain was decreased by $926 and shares of beneficial interest was decreased by $1,336,992. This reclassification had no effect on the net assets of the Fund.
Invesco V.I. Mid Cap Growth Fund
NOTE 9—Share Information
| | | | | | | | | | | | | | | | |
| | | Summary of Share Activity | |
| | | Years ended December 31, | |
| | | 2015(a) | | | 2014 | |
| | | Shares | | | Amount | | | Shares | | | Amount | |
Sold: | | | | | | | | | | | | | | | | |
Series I | | | 3,619,346 | | | $ | 21,736,576 | | | | 2,719,313 | | | $ | 15,046,775 | |
Series II | | | 6,398,975 | | | | 37,748,394 | | | | 3,222,420 | | | | 17,657,513 | |
| | | | |
Issued as reinvestment of dividends: | | | | | | | | | | | | | | | | |
Series I | | | 1,612,065 | | | | 8,511,702 | | | | — | | | | — | |
Series II | | | 2,437,497 | | | | 12,748,108 | | | | — | | | | — | |
| | | | |
Reacquired: | | | | | | | | | | | | | | | | |
Series I | | | (4,381,375 | ) | | | (25,560,468 | ) | | | (5,866,476 | ) | | | (32,085,079 | ) |
Series II | | | (7,323,786 | ) | | | (43,139,778 | ) | | | (7,324,414 | ) | | | (39,889,806 | ) |
Net increase (decrease) in share activity | | | 2,362,722 | | | $ | 12,044,534 | | | | (7,249,157 | ) | | $ | (39,270,597 | ) |
| (a) | There are entities that are record owners of more than 5% of the outstanding shares of the Fund and in the aggregate own 52% of the outstanding shares of the Fund. The Fund and the Fund’s principal underwriter or adviser, are parties to participation agreements with these entities whereby these entities sell units of interest in separate accounts funding variable products that are invested in the Fund. The Fund, Invesco and/or Invesco affiliates may make payments to these entities, which are considered to be related to the Fund, for providing services to the Fund, Invesco and/or Invesco affiliates including but not limited to services such as, securities brokerage, third party record keeping and account servicing and administrative services. The Fund has no knowledge as to whether all or any portion of the shares owned of record by these entities are also owned beneficially. |
NOTE 10—Financial Highlights
The following schedule presents financial highlights for a share of the Fund outstanding throughout the periods indicated.
| | | | | | | | | | | | | | | | | | | | | | | | | | | | | | | | | | | | | | | | | | | | | | | | | | | | | | | | | | | | | | | | | | | | | | |
| | | Net asset
value,
beginning
of period | | Net
investment
income
(loss)(a) | | Net gains
(losses)
on securities
(both
realized and
unrealized) | | Total from
investment
operations | | Dividends
from net
investment
income | | Distributions
from net
realized
gains | | Total
distributions | | Net asset
value, end
of period | | Total
return(b) | | Net assets,
end of period
(000’s omitted) | | Ratio of
expenses
to average
net assets
with fee waivers
and/or expenses
absorbed | | Ratio of
expenses
to average net
assets without
fee waivers
and/or expenses
absorbed | | Ratio of net
investment
income (loss)
to average
net assets | | Portfolio
turnover(c) |
Series I | | | | | | | | | | | | | | | | | | | | | | | | | | | | | | | | | | | | | | | | | | | | | | | | | | | | | | | | | | | | | | | | | | | | | | |
Year ended 12/31/15 | | | $ | 5.78 | | | | $ | (0.02 | ) | | | $ | 0.08 | | | | $ | 0.06 | | | | $ | — | | | | $ | (0.46 | ) | | | $ | (0.46 | ) | | | $ | 5.38 | | | | | 1.21 | % | | | $ | 103,632 | | | | | 1.07 | %(d) | | | | 1.07 | %(d) | | | | (0.33 | )%(d) | | | | 62 | % |
Year ended 12/31/14 | | | | 5.35 | | | | | (0.02 | ) | | | | 0.45 | | | | | 0.43 | | | | | — | | | | | — | | | | | — | | | | | 5.78 | | | | | 8.04 | | | | | 106,390 | | | | | 1.07 | | | | | 1.07 | | | | | (0.36 | ) | | | | 71 | |
Year ended 12/31/13 | | | | 3.92 | | | | | (0.02 | ) | | | | 1.47 | | | | | 1.45 | | | | | (0.02 | ) | | | | — | | | | | (0.02 | ) | | | | 5.35 | | | | | 37.01 | | | | | 115,319 | | | | | 1.08 | | | | | 1.08 | | | | | (0.41 | ) | | | | 76 | |
Year ended 12/31/12 | | | | 3.69 | | | | | 0.02 | (e) | | | | 0.41 | | | | | 0.43 | | | | | — | | | | | (0.20 | ) | | | | (0.20 | ) | | | | 3.92 | | | | | 11.60 | | | | | 88,091 | | | | | 1.06 | | | | | 1.12 | | | | | 0.54 | (e) | | | | 92 | |
Year ended 12/31/11 | | | | 4.05 | | | | | (0.01 | ) | | | | (0.35 | ) | | | | (0.36 | ) | | | | — | | | | | — | | | | | — | | | | | 3.69 | | | | | (8.89 | ) | | | | 11 | | | | | 1.00 | | | | | 1.14 | | | | | (0.36 | ) | | | | 137 | |
Series II | | | | | | | | | | | | | | | | | | | | | | | | | | | | | | | | | | | | | | | | | | | | | | | | | | | | | | | | | | | | | | | | | | | | | | |
Year ended 12/31/15 | | | | 5.74 | | | | | (0.03 | ) | | | | 0.08 | | | | | 0.05 | | | | | — | | | | | (0.46 | ) | | | | (0.46 | ) | | | | 5.33 | | | | | 1.04 | | | | | 158,684 | | | | | 1.32 | (d) | | | | 1.32 | (d) | | | | (0.58 | )(d) | | | | 62 | |
Year ended 12/31/14 | | | | 5.33 | | | | | (0.03 | ) | | | | 0.44 | | | | | 0.41 | | | | | — | | | | | — | | | | | — | | | | | 5.74 | | | | | 7.69 | | | | | 162,299 | | | | | 1.32 | | | | | 1.32 | | | | | (0.61 | ) | | | | 71 | |
Year ended 12/31/13 | | | | 3.91 | | | | | (0.03 | ) | | | | 1.46 | | | | | 1.43 | | | | | (0.01 | ) | | | | — | | | | | (0.01 | ) | | | | 5.33 | | | | | 36.60 | | | | | 172,478 | | | | | 1.33 | | | | | 1.33 | | | | | (0.66 | ) | | | | 76 | |
Year ended 12/31/12 | | | | 3.68 | | | | | 0.01 | (e) | | | | 0.42 | | | | | 0.43 | | | | | — | | | | | (0.20 | ) | | | | (0.20 | ) | | | | 3.91 | | | | | 11.63 | | | | | 143,588 | | | | | 1.31 | | | | | 1.37 | | | | | 0.29 | (e) | | | | 92 | |
Year ended 12/31/11 | | | | 4.06 | | | | | (0.02 | ) | | | | (0.36 | ) | | | | (0.38 | ) | | | | — | | | | | — | | | | | — | | | | | 3.68 | | | | | (9.36 | ) | | | | 65,080 | | | | | 1.25 | | | | | 1.39 | | | | | (0.61 | ) | | | | 137 | |
| (a) | Calculated using average shares outstanding. |
| (b) | Includes adjustments in accordance with accounting principles generally accepted in the United States of America and as such, the net asset value for financial reporting purposes and the returns based upon those net asset values may differ from the net asset value and returns for shareholder transactions. Total returns are not annualized for periods less than one year, if applicable, and do not reflect charges assessed in connection with a variable product, which if included would reduce total returns. |
| (c) | Portfolio turnover is calculated at the fund level and is not annualized for periods less than one year, if applicable. For the year ended December 31, 2012, the portfolio turnover calculation excludes the value of securities purchased of $158,450,343 and sold of $99,449,268 in the effort to realign the Fund’s portfolio holdings after the reorganization of Invesco V.I. Capital Development Fund into the Fund. |
| (d) | Ratios are based on average daily net assets (000’s omitted) of $111,810 and $167,499 for Series I and Series II shares, respectively. |
| (e) | Net investment income (loss) per share and the ratio of net investment income (loss) to average net assets includes special cash dividends received of $3.92 per share owned of Aveta Inc. on August 16, 2012. Net investment income (loss) per share and the ratio of net investment income (loss) to average net assets excluding the special dividend are $0.01 and 0.28% and $0.00 and 0.03% for Series I and Series II shares, respectively. |
Invesco V.I. Mid Cap Growth Fund
Report of Independent Registered Public Accounting Firm
To the Board of Trustees of AIM Variable Insurance Funds (Invesco Variable Insurance Funds)
and Shareholders of Invesco V.I. Mid Cap Growth Fund:
In our opinion, the accompanying statement of assets and liabilities, including the schedule of investments, and the related statements of operations and of changes in net assets and the financial highlights present fairly, in all material respects, the financial position of Invesco V.I. Mid Cap Growth Fund (one of the funds constituting AIM Variable Insurance Funds (Invesco Variable Insurance Funds), hereafter referred to as the “Fund”) at December 31, 2015, the results of its operations for the year then ended, the changes in its net assets for each of the two years in the period then ended and the financial highlights for each of the five years in the period then ended, in conformity with accounting principles generally accepted in the United States of America. These financial statements and financial highlights (hereafter referred to as “financial statements”) are the responsibility of the Fund’s management. Our responsibility is to express an opinion on these financial statements based on our audits. We conducted our audits of these financial statements in accordance with the standards of the Public Company Accounting Oversight Board (United States). Those standards require that we plan and perform the audit to obtain reasonable assurance about whether the financial statements are free of material misstatement. An audit includes examining, on a test basis, evidence supporting the amounts and disclosures in the financial statements, assessing the accounting principles used and significant estimates made by management, and evaluating the overall financial statement presentation. We believe that our audits, which included confirmation of securities at December 31, 2015 by correspondence with the custodian and brokers, and the application of alternative auditing procedures where confirmations of security purchases have not been received, provide a reasonable basis for our opinion.
PRICEWATERHOUSECOOPERS LLP
Houston, Texas
February 15, 2016
Invesco V.I. Mid Cap Growth Fund
Calculating your ongoing Fund expenses
Example
As a shareholder of the Fund, you incur ongoing costs, including management fees; distribution and/or service fees (12b-1); and other Fund expenses. This example is intended to help you understand your ongoing costs (in dollars) of investing in the Fund and to compare these costs with ongoing costs of investing in other mutual funds. The example is based on an investment of $1,000 invested at the beginning of the period and held for the entire period July 1, 2015 through December 31, 2015.
The actual and hypothetical expenses in the examples below do not represent the effect of any fees or other expenses assessed in connection with a variable product; if they did, the expenses shown would be higher while the ending account values shown would be lower.
Actual expenses
The table below provides information about actual account values and actual expenses. You may use the information in this table, together with the amount you invested, to estimate the expenses that you paid over the period. Simply divide your account value by $1,000 (for example, an $8,600 account value divided by $1,000 = 8.6), then multiply the result by the number in the table under the heading entitled “Actual Expenses Paid During Period” to estimate the expenses you paid on your account during this period.
Hypothetical example for comparison purposes
The table below also provides information about hypothetical account values and hypothetical expenses based on the Fund’s actual expense ratio and an assumed rate of return of 5% per year before expenses, which is not the Fund’s actual return.
The hypothetical account values and expenses may not be used to estimate the actual ending account balance or expenses you paid for the period. You may use this information to compare the ongoing costs of investing in the Fund and other funds. To do so, compare this 5% hypothetical example with the 5% hypothetical examples that appear in the shareholder reports of the other funds.
Please note that the expenses shown in the table are meant to highlight your ongoing costs. Therefore, the hypothetical information is useful in comparing ongoing costs, and will not help you determine the relative total costs of owning different funds.
| | | | | | | | | | | | | | | | | | | | | | | | |
| Class | | Beginning
Account Value
(07/01/15) | | | ACTUAL | | | HYPOTHETICAL (5% annual return before
expenses) | | | Annualized
Expense
Ratio | |
| | | Ending
Account Value
(12/31/15)1 | | | Expenses
Paid During
Period2 | | | Ending
Account Value
(12/31/15) | | | Expenses
Paid During
Period2 | | |
Series I | | $ | 1,000.00 | | | $ | 936.00 | | | $ | 5.22 | | | $ | 1,019.81 | | | $ | 5.45 | | | | 1.07 | % |
Series II | | | 1,000.00 | | | | 935.50 | | | | 6.44 | | | | 1,018.55 | | | | 6.72 | | | | 1.32 | |
| 1 | The actual ending account value is based on the actual total return of the Fund for the period July 1, 2015 through December 31, 2015, after actual expenses and will differ from the hypothetical ending account value which is based on the Fund’s expense ratio and a hypothetical annual return of 5% before expenses. |
| 2 | Expenses are equal to the Fund’s annualized expense ratio as indicated above multiplied by the average account value over the period, multiplied by 184/365 to reflect the most recent fiscal half year. |
Invesco V.I. Mid Cap Growth Fund
Tax Information
Form 1099-DIV, Form 1042-S and other year-end tax information provide shareholders with actual calendar year amounts that should be included in their tax returns. Shareholders should consult their tax advisors.
The following distribution information is being provided as required by the Internal Revenue Code or to meet a specific state’s requirement.
The Fund designates the following amounts or, if subsequently determined to be different, the maximum amount allowable for its fiscal year ended December 31, 2015:
| | | | |
Federal and State Income Tax | |
Long-Term Capital Gain Distributions | | $ | 21,259,810 | |
Corporate Dividends Received Deduction* | | | 0.00 | % |
U.S. Treasury Obligations* | | | 0.00 | % |
| | * | The above percentages are based on ordinary income dividends paid to shareholders during the Fund’s fiscal year. |
Invesco V.I. Mid Cap Growth Fund
Trustees and Officers
The address of each trustee and officer is AIM Variable Insurance Funds (Invesco Variable Insurance Funds) (the “Trust”), 11 Greenway Plaza, Suite 1000, Houston, Texas 77046-1173. The trustees serve for the life of the Trust, subject to their earlier death, incapacitation, resignation, retirement or removal as more specifically provided in the Trust’s organizational documents. Each officer serves for a one year term or until their successors are elected and qualified. Column two below includes length of time served with predecessor entities, if any.
| | | | | | | | |
Name, Year of Birth and
Position(s) Held with the Trust | | Trustee and/
or Officer Since | | Principal Occupation(s)
During Past 5 Years | | Number of Funds in Fund Complex Overseen by Trustee | | Other Directorship(s) Held by Trustee During Past 5 Years |
| Interested Persons | | | | | | | | |
| Martin L. Flanagan1 — 1960 Trustee | | 2007 | | Executive Director, Chief Executive Officer and President, Invesco Ltd. (ultimate parent of Invesco and a global investment management firm); Advisor to the Board, Invesco Advisers, Inc. (formerly known as Invesco Institutional (N.A.), Inc.); Trustee, The Invesco Funds; Vice Chair, Investment Company Institute; and Member of Executive Board, SMU Cox School of Business Formerly: Chairman and Chief Executive Officer, Invesco Advisers, Inc. (registered investment adviser); Director, Chairman, Chief Executive Officer and President, IVZ Inc. (holding company), INVESCO Group Services, Inc. (service provider) and Invesco North American Holdings, Inc. (holding company); Director, Chief Executive Officer and President, Invesco Holding Company Limited (parent of Invesco and a global investment management firm); Director, Invesco Ltd.; Chairman, Investment Company Institute and President, Co-Chief Executive Officer, Co-President, Chief Operating Officer and Chief Financial Officer, Franklin Resources, Inc. (global investment management organization) | | 146 | | None |
Philip A. Taylor2 — 1954 Trustee, President and Principal Executive Officer | | 2006 | | Head of North American Retail and Senior Managing Director, Invesco Ltd.; Director, Co-Chairman, Co-President and Co-Chief Executive Officer, Invesco Advisers, Inc. (formerly known as Invesco Institutional (N.A.), Inc.) (registered investment adviser); Director, Chairman, Chief Executive Officer and President, Invesco Management Group, Inc. (formerly known as Invesco Aim Management Group, Inc.) (financial services holding company); Director and Chairman, Invesco Investment Services, Inc. (formerly known as Invesco Aim Investment Services, Inc.) (registered transfer agent) Chief Executive Officer, Invesco Corporate Class Inc. (corporate mutual fund company) Director, Chairman and Chief Executive Officer, Invesco Canada Ltd. (formerly known as Invesco Trimark Ltd./Invesco Trimark Ltèe) (registered investment adviser and registered transfer agent); Trustee, President and Principal Executive Officer, The Invesco Funds (other than AIM Treasurer’s Series Trust (Invesco Treasurer’s Series Trust), Short-Term Investments Trust and Invesco Management Trust); Trustee and Executive Vice President, The Invesco Funds (AIM Treasurer’s Series Trust (Invesco Treasurer’s Series Trust), Short-Term Investments Trust and Invesco Management Trust only); Director, Invesco Investment Advisers LLC (formerly known as Van Kampen Asset Management); Director, Chief Executive Officer and President, Van Kampen Exchange Corp. Formerly: Director and President, INVESCO Funds Group, Inc. (registered investment adviser and registered transfer agent); Director and Chairman, IVZ Distributors, Inc. (formerly known as INVESCO Distributors, Inc.) (registered broker dealer); Director, President and Chairman, Invesco Inc. (holding company), Invesco Canada Holdings Inc. (holding company), Trimark Investments Ltd./Placements Trimark Ltèe and Invesco Financial Services Ltd/Services Financiers Invesco Ltèe; Chief Executive Officer, Invesco Canada Fund Inc (corporate mutual fund company); Director and Chairman, Van Kampen Investor Services Inc.; Director, Chief Executive Officer and President, 1371 Preferred Inc. (holding company) and Van Kampen Investments Inc.; Director and President, AIM GP Canada Inc. (general partner for limited partnerships) and Van Kampen Advisors, Inc.; Director and Chief Executive Officer, Invesco Trimark Dealer Inc. (registered broker dealer); Director, Invesco Distributors, Inc. (formerly known as Invesco Aim Distributors, Inc.) (registered broker dealer); Manager, Invesco PowerShares Capital Management LLC; Director, Chief Executive Officer and President, Invesco Advisers, Inc.; Director, Chairman, Chief Executive Officer and President, Invesco Aim Capital Management, Inc.; President, Invesco Trimark Dealer Inc. and Invesco Trimark Ltd./Invesco Trimark Ltèe; Director and President, AIM Trimark Corporate Class Inc. and AIM Trimark Canada Fund Inc.; Senior Managing Director, Invesco Holding Company Limited; Director and Chairman, Fund Management Company (former registered broker dealer); President and Principal Executive Officer, The Invesco Funds (AIM Treasurer’s Series Trust (Invesco Treasurer’s Series Trust), and Short-Term Investments Trust only); President, AIM Trimark Global Fund Inc. and AIM Trimark Canada Fund Inc | | 146 | | None |
| 1 | Mr. Flanagan is considered an interested person (within the meaning of Section 2(a)(19) of the 1940 Act) of the Trust because he is an officer of the Adviser to the Trust, and an officer and a director of Invesco Ltd., ultimate parent of the Adviser. |
| 2 | Mr. Taylor is considered an interested person (within the meaning of Section 2(a)(19) of the 1940 Act) of the Trust because he is an officer and a director of the Adviser. |
Invesco V.I. Mid Cap Growth Fund
Trustees and Officers—(continued)
| | | | | | | | |
Name, Year of Birth and
Position(s) Held with the Trust | | Trustee and/
or Officer Since | | Principal Occupation(s)
During Past 5 Years | | Number of Funds in Fund Complex Overseen by Trustee | | Other Directorship(s)
Held by Trustee During Past 5 Years |
| Independent Trustees | | | | | | | | |
Bruce L. Crockett — 1944 Trustee and Chair | | 2003 | | Chairman, Crockett Technologies Associates (technology consulting company) Formerly: Director, Captaris (unified messaging provider); Director, President and Chief Executive Officer, COMSAT Corporation; Chairman, Board of Governors of INTELSAT (international communications company); ACE Limited (insurance company); Independent Directors Council and Investment Company Institute | | 146 | | ALPS (Attorneys Liability Protection Society) (insurance company) and Globe Specialty Metals, Inc. (metallurgical company) |
David C. Arch — 1945 Trustee | | 2010 | | Chairman of Blistex Inc., a consumer health care products manufacturer | | 146 | | Board member of the Illinois Manufacturers’ Association; Member of the Board of Visitors, Institute for the Humanities, University of Michigan |
James T. Bunch — 1942 Trustee | | 2000 | | Managing Member, Grumman Hill Group LLC (family office/private equity investments) Formerly: Chairman of the Board of Trustees, Evans Scholars Foundation and Chairman, Board of Governors, Western Golf Association | | 146 | | Trustee, Evans Scholars Foundation; and Chairman of the Board, Denver Film Society |
Albert R. Dowden — 1941 Trustee | | 2003 | | Director of a number of public and private business corporations, including the Boss Group, Ltd. (private investment and management); Nature’s Sunshine Products, Inc. and Reich & Tang Funds (5 portfolios) (registered investment company) Formerly: Director, Homeowners of America Holding Corporation/Homeowners of America Insurance Company (property casualty company); Director, Continental Energy Services, LLC (oil and gas pipeline service); Director, CompuDyne Corporation (provider of product and services to the public security market) and Director, Annuity and Life Re (Holdings), Ltd. (reinsurance company); Director, President and Chief Executive Officer, Volvo Group North America, Inc.; Senior Vice President, AB Volvo; Director of various public and private corporations; Chairman, DHJ Media, Inc.; Director, Magellan Insurance Company; and Director, The Hertz Corporation, Genmar Corporation (boat manufacturer), National Media Corporation; Advisory Board of Rotary Power International (designer, manufacturer, and seller of rotary power engines); and Chairman, Cortland Trust, Inc. (registered investment company) | | 146 | | Director of: Nature’s Sunshine Products, Inc., Reich & Tang Funds, Homeowners of America Holding Corporation/ Homeowners of America Insurance Company, the Boss Group |
Jack M. Fields — 1952 Trustee | | 2003 | | Chief Executive Officer, Twenty First Century Group, Inc. (government affairs company); Owner and Chief Executive Officer, Dos Angeles Ranch, L.P. (cattle, hunting, corporate entertainment); and Discovery Global Education Fund (non-profit) Formerly: Chief Executive Officer, Texana Timber LP (sustainable forestry company); Director of Cross Timbers Quail Research Ranch (non-profit); and member of the U.S. House of Representatives | | 146 | | Insperity, Inc. (formerly known as Administaff) |
Eli Jones — Trustee | | 2016 | | Professor and Dean, Mays Business School, Texas A&M University Formerly: Professor and Dean, Walton College of Business, University of Arkansas, and E.J. Ourso College of Business, Louisiana State University | | 146 | | Director, Insperity, Inc., (2011-present) and ARVEST Bank (2012-2015) |
Prema Mathai-Davis — 1950 Trustee | | 2003 | | Retired. Formerly: Chief Executive Officer, YWCA of the U.S.A. | | 146 | | None |
Larry Soll — 1942 Trustee | | 1997 | | Retired. Formerly: Chairman, Chief Executive Officer and President, Synergen Corp. (a biotechnology company) | | 146 | | None |
Robert C. Troccoli — Trustee | | 2016 | | Retired. Formerly: Senior Partner, KPMG LLP | | 146 | | None |
Raymond Stickel, Jr. — 1944 Trustee | | 2005 | | Retired. Formerly: Director, Mainstay VP Series Funds, Inc. (25 portfolios) and Partner, Deloitte & Touche | | 146 | | None |
Suzanne H. Woolsey — 1941 Trustee | | 2014 | | Chief Executive Officer of Woolsey Partners LLC | | 146 | | Emeritus Chair of the Board of Trustees of the Institute for Defense Analyses; Trustee of Colorado College; Trustee of California Institute of Technology; Prior to 2014, Director of Fluor Corp.; Prior to 2010, Trustee of the German Marshall Fund of the United States; Prior to 2010 Trustee of the Rocky Mountain Institute |
Invesco V.I. Mid Cap Growth Fund
Trustees and Officers—(continued)
| | | | | | | | |
Name, Year of Birth and
Position(s) Held with the Trust | | Trustee and/
or Officer Since | | Principal Occupation(s)
During Past 5 Years | | Number of Funds in Fund Complex Overseen by Trustee | | Other Directorship(s)
Held by Trustee During Past 5 Years |
| Other Officers | | | | | | | | |
Russell C. Burk — 1958 Senior Vice President and Senior Officer | | 2005 | | Senior Vice President and Senior Officer, The Invesco Funds | | N/A | | N/A |
John M. Zerr — 1962 Senior Vice President, Chief Legal Officer and Secretary | | 2006 | | Director, Senior Vice President, Secretary and General Counsel, Invesco Management Group, Inc. (formerly known as Invesco Aim Management Group, Inc.) and Van Kampen Exchange Corp.; Senior Vice President, Invesco Advisers, Inc. (formerly known as Invesco Institutional (N.A.), Inc.) (registered investment adviser); Senior Vice President and Secretary, Invesco Distributors, Inc. (formerly known as Invesco Aim Distributors, Inc.); Director, Vice President and Secretary, Invesco Investment Services, Inc. (formerly known as Invesco Aim Investment Services, Inc.); Senior Vice President, Chief Legal Officer and Secretary, The Invesco Funds; Managing Director, Invesco PowerShares Capital Management LLC; Director, Secretary and General Counsel, Invesco Investment Advisers LLC (formerly known as Van Kampen Asset Management); Secretary and General Counsel, Invesco Capital Markets, Inc. (formerly known as Van Kampen Funds Inc.) and Chief Legal Officer, PowerShares Exchange-Traded Fund Trust, PowerShares Exchange-Traded Fund Trust II, PowerShares India Exchange-Traded Fund Trust, PowerShares Actively Managed Exchange-Traded Fund Trust, and PowerShares Actively Managed Exchange-Traded Commodity Fund Trust Formerly: Director, Vice President and Secretary, IVZ Distributors, Inc. (formerly known as INVESCO distributors, Inc.); Director and Vice President, INVESCO Funds Group, Inc.; Director and Vice President, Van Kampen Advisors Inc.; Director, Vice President, Secretary and General Counsel, Van Kampen Investor Services Inc.; Director, Invesco Distributors, Inc. (formerly known as Invesco Aim Distributors, Inc.); Director, Senior Vice President, General Counsel and Secretary, Invesco Aim Advisers, Inc. and Van Kampen Investments Inc.; Director, Vice President and Secretary, Fund Management Company; Director, Senior Vice President, Secretary, General Counsel and Vice President, Invesco Aim Capital Management, Inc.; Chief Operating Officer and General Counsel, Liberty Ridge Capital, Inc. (an investment adviser); Vice President and Secretary, PBHG Funds (an investment company) and PBHG Insurance Series Fund (an investment company); Chief Operating Officer, General Counsel and Secretary, Old Mutual Investment Partners (a broker-dealer); General Counsel and Secretary, Old Mutual Fund Services (an administrator) and Old Mutual Shareholder Services (a shareholder servicing center); Executive Vice President, General Counsel and Secretary, Old Mutual Capital, Inc. (an investment adviser); and Vice President and Secretary, Old Mutual Advisors Funds (an investment company) | | N/A | | N/A |
Sheri Morris — 1964 Vice President, Treasurer and Principal Financial Officer | | 2003 | | Vice President, Treasurer and Principal Financial Officer, The Invesco Funds; Vice President, Invesco Advisers, Inc. (formerly known as Invesco Institutional (N.A.), Inc.) (registered investment adviser); and Vice President, PowerShares Exchange-Traded Fund Trust, PowerShares Exchange-Traded Fund Trust II, PowerShares India Exchange-Traded Fund Trust, PowerShares Actively Managed Exchange-Traded Fund Trust, and PowerShares Actively Managed Exchange-Traded Commodity Fund Trust Formerly: Vice President, Invesco Aim Advisers, Inc., Invesco Aim Capital Management, Inc. and Invesco Aim Private Asset Management, Inc.; Assistant Vice President and Assistant Treasurer, The Invesco Funds and Assistant Vice President, Invesco Advisers, Inc., Invesco Aim Capital Management, Inc. and Invesco Aim Private Asset Management, Inc.; and Treasurer, PowerShares Exchange-Traded Fund Trust, PowerShares Exchange-Traded Fund Trust II, PowerShares India Exchange-Traded Fund Trust and PowerShares Actively Managed Exchange-Traded Fund Trust | | N/A | | N/A |
Invesco V.I. Mid Cap Growth Fund
Trustees and Officers—(continued)
| | | | | | | | |
Name, Year of Birth and
Position(s) Held with the Trust | | Trustee and/
or Officer Since | | Principal Occupation(s)
During Past 5 Years | | Number of Funds in Fund Complex Overseen by Trustee | | Other Directorship(s)
Held by Trustee During Past 5 Years |
| Other Officers—(continued) | | | | | | | | |
Karen Dunn Kelley — 1960 Vice President | | 2003 | | Senior Managing Director, Investments, Invesco Ltd.; Director, Co-President, Co-Chief Executive Officer, and Co-Chairman, Invesco Advisers, Inc. (formerly known as Invesco Institutional (N.A.), Inc.) (registered investment adviser); Chairman, Invesco Senior Secured Management, Inc.; Senior Vice President, Invesco Management Group, Inc. (formerly known as Invesco Aim Management Group, Inc.); Executive Vice President, Invesco Distributors, Inc. (formerly known as Invesco Aim Distributors, Inc.); Director, Invesco Mortgage Capital Inc. and Invesco Management Company Limited; Vice President, The Invesco Funds (other than AIM Treasurer’s Series Trust (Invesco Treasurer’s Series Trust), Short-Term Investments Trust and Invesco Management Trust); and President and Principal Executive Officer, The Invesco Funds (AIM Treasurer’s Series Trust (Invesco Treasurer’s Series Trust), Short-Term Investments Trust and Invesco Management Trust only) Formerly: Director and President, INVESCO Asset Management (Bermuda) Ltd., Director, INVESCO Global Asset Management Limited and INVESCO Management S.A.; Senior Vice President, Van Kampen Investments Inc. and Invesco Advisers, Inc. (formerly known as Invesco Institutional (N.A.), Inc.) (registered investment adviser); Vice President, Invesco Advisers, Inc. (formerly known as Invesco Institutional (N.A.), Inc.); Director of Cash Management and Senior Vice President, Invesco Advisers, Inc. and Invesco Aim Capital Management, Inc.; Director and President, Fund Management Company; Chief Cash Management Officer, Director of Cash Management, Senior Vice President, and Managing Director, Invesco Aim Capital Management, Inc.; Director of Cash Management, Senior Vice President, and Vice President, Invesco Advisers, Inc. and The Invesco Funds (AIM Treasurer’s Series Trust (Invesco Treasurer’s Series Trust), and Short-Term Investments Trust only) | | N/A | | N/A |
Crissie M. Wisdom — 1969 Anti-Money Laundering Compliance Officer | | 2013 | | Anti-Money Laundering Compliance Officer, Invesco Advisers, Inc. (formerly known as Invesco Institutional (N.A.), Inc.) (registered investment adviser), Invesco Capital Markets, Inc. (formerly known as Van Kampen Funds Inc.), Invesco Distributors, Inc., Invesco Investment Services, Inc., Invesco Management Group, Inc., Van Kampen Exchange Corp., The Invesco Funds, and PowerShares Exchange-Traded Fund Trust, PowerShares Exchange-Traded Fund Trust II, PowerShares India Exchange-Traded Fund Trust, PowerShares Actively Managed Exchange-Traded Fund Trust and PowerShares Actively Managed Exchange-Traded Commodity Fund Trust; Anti-Money Laundering Compliance Officer and Bank Secrecy Act Officer, INVESCO National Trust Company and Invesco Trust Company; and Fraud Prevention Manager and Controls and Risk Analysis Manager for Invesco Investment Services, Inc. | | N/A | | N/A |
Lisa O. Brinkley — 1959 Chief Compliance Officer | | 2015 | | Senior Vice President and Chief Compliance Officer, Invesco Advisers, Inc. (registered investment adviser) (formerly known as Invesco Institutional (N.A., Inc.); and Chief Compliance Officer, The Invesco Funds Formerly: Global Assurance Officer, Invesco Ltd. and Vice President, The Invesco Funds; Chief Compliance Officer, Invesco Distributors, Inc. (formerly known as Invesco Aim Distributors, Inc.), Invesco Investment Services, Inc.(formerly known as Invesco Aim Investment Services, Inc.) and Van Kampen Investor Services Inc.; Senior Vice President, Invesco Management Group, Inc.; Senior Vice President and Chief Compliance Officer, Invesco Advisers, Inc. and The Invesco Funds; Vice President and Chief Compliance Officer, Invesco Aim Capital Management, Inc. and Invesco Distributors, Inc.; Vice President, Invesco Investment Services, Inc. and Fund Management Company | | N/A | | N/A |
The Statement of Additional Information of the Trust includes additional information about the Fund’s Trustees and is available upon request, without charge, by calling 1.800.959.4246. Please refer to the Fund’s prospectus for information on the Fund’s sub-advisers.
| | | | | | |
Office of the Fund 11 Greenway Plaza, Suite 1000 Houston, TX 77046-1173 | | Investment Adviser Invesco Advisers, Inc. 1555 Peachtree Street, N.E. Atlanta, GA 30309 | | Distributor Invesco Distributors, Inc. 11 Greenway Plaza, Suite 1000 Houston, TX 77046-1173 | | Auditors PricewaterhouseCoopers LLP 1000 Louisiana Street, Suite 5800 Houston, TX 77002-5678 |
| | | |
| | | | | | |
Counsel to the Fund Stradley Ronon Stevens & Young, LLP 2005 Market Street, Suite 2600 Philadelphia, PA 19103-7018 | | Counsel to the Independent Trustees Goodwin Procter LLP 901 New York Avenue, N.W. Washington, D.C. 20001 | | Transfer Agent Invesco Investment Services, Inc. 11 Greenway Plaza, Suite 1000 Houston, TX 77046-1173 | | Custodian State Street Bank and Trust Company 225 Franklin Street Boston, MA 02110-2801 |
Invesco V.I. Mid Cap Growth Fund
| | | | |
| | |
 | | Annual Report to Shareholders | | December 31, 2015 |
| | |
| | Invesco V.I. Money Market Fund |

| | |
| | The Fund provides a complete list of its holdings four times in each fiscal year, at the quarter-ends. For the second and fourth quarters, the lists appear in the Fund’s semiannual and annual reports to shareholders. For the first and third quarters, the Fund files the lists with the Securities and Exchange Commission (SEC) on Form N-Q. The Fund’s Form N-Q filings are available on the SEC website, sec.gov. Copies of the Fund’s Forms N-Q may be reviewed and copied at the SEC Public Reference Room in Washington, D.C. You can obtain information on the operation of the Public Reference Room, including information about duplicating fee charges, by calling 202 551 8090 or 800 732 0330, or by electronic request at the following email address: publicinfo@sec.gov. The SEC file numbers for the Fund are 811-07452 and 033-57340. The Fund’s most recent portfolio holdings, as filed on Form N-Q, have also been made available to insurance companies issuing variable annuity contracts and variable life insurance policies (“variable products”) that invest in the Fund. A description of the policies and procedures that the Fund uses to determine how to vote proxies relating to portfolio securities is available without charge, upon request, from our Client Services department at 800 959 4246 or at invesco.com/proxyguidelines. The information is also available on the SEC website, sec.gov. Information regarding how the Fund voted proxies related to its portfolio securities during the most recent 12-month period ended June 30 is available at invesco.com/ proxysearch. The information is also available on the SEC website, sec.gov. Invesco Advisers, Inc. is an investment adviser; it provides investment advisory services to individual and institutional clients and does not sell securities. Invesco Distributors, Inc. is the US distributor for Invesco Ltd.’s retail mutual funds, exchange-traded funds and institutional money market funds. Both are wholly owned, indirect subsidiaries of Invesco Ltd. This report must be accompanied or preceded by a currently effective Fund prospectus and variable product prospectus, which contain more complete information, including sales charges and expenses. Investors should read each carefully before investing. Invesco Distributors, Inc. VIMKT-AR-1 NOT FDIC INSURED | MAY LOSE VALUE | NO BANK GUARANTEE |
Management’s Discussion
Fund information
This annual report for Invesco V.I. Money Market Fund (the Fund) covers the year ended December 31, 2015.
As of December 31, 2015, the Fund’s net assets totaled $761.7 million. As of the same date, the Fund’s weighted average maturity was 11 days and the Fund’s weighted average life was 21 days.
Weighted average maturity (WAM) is an average of the maturities of all securities held in the portfolio, weighted by each security’s percentage of net assets. The days to maturity for WAM is the lower of the stated maturity date or next interest rate reset date. WAM reflects how a portfolio would react to interest rate changes.
Weighted average life (WAL) is an average of all the maturities of all securities held in the portfolio, weighted by each security’s percentage of net assets. The days to maturity for WAL is the lower of the stated maturity date or next demand feature date. WAL reflects how a portfolio would react to deteriorating credit (widening spreads) or tightening liquidity conditions.
Market conditions affecting money market funds
The two biggest developments affecting money market funds and the money market fund industry in 2015 were the US Federal Reserve’s (the Fed) interest rate hike and the blossoming impact of money market fund reform.
Money market investors cheered in December when the Fed raised its federal funds target rate for the first time since 2006, before the financial crisis in 2008. The Fed raised this key rate from a range of zero to 0.25% to a range of 0.25% to 0.50%.1
Moderate economic growth, improvement in employment and the need to remove “emergency accommodation” were the primary reasons for the Fed’s action. More rate hikes are expected, but at a slower pace than past Fed regimes. Inflation running below the Fed’s target and economic weakness overseas could be reasons for the Fed to temper future interest rate hikes.
In July 2014, the US Securities and Exchange Commission announced new money market fund reforms. These reforms, intended to further strengthen the resiliency of money market funds during times of economic stress, will take effect fully on October 14, 2016. These new regulations are expected to influence the shape of the money market fund industry for years to come.
To date, the most significant impact of money market reform on money market funds has been the shift from prime funds
to government funds. Many money market funds, including Invesco V.I. Money Market Fund, have announced their intentions to convert to government money market funds. Under the new rules, government money market funds will be permitted to transact at a stable, or constant, net asset value of $1.00 per share and must invest at least 99.5% of their assets in cash, US government securities (as defined under federal securities laws), and/ or repurchase agreements collateralized by US government securities.
As fund companies adjust their fund preferences in advance of the October 2016 final implementation date, large amounts of assets have moved into government funds from other types of money market funds. We expect additional flows into government funds in 2016. These flows are likely to keep government funds’ yields suppressed relative to prime funds’ yields. Following the Fed’s December rate hike, we started to see some divergence on yields of prime and government funds.
A prospectus supplement was filed and distributed to contract owners on November 3, 2015, describing the details of the conversion of Invesco V.I. Money Market Fund. At the close of the reporting period, the Fund remained a prime money market fund; it will change its name and investment strategy to qualify as, and begin operating as, a government money market fund effective on or about April 29, 2016, after the close of the reporting period.
| 1 | Source: US Federal Reserve |
The views and opinions expressed in management’s discussion of Fund performance are those of Invesco Advisers, Inc. These views and opinions are subject to change at any time based on factors such as market and economic conditions. These views and opinions may not be relied upon as investment advice or recommendations, or as an offer for a particular security. The information is not a complete analysis of every aspect of any market, country, industry, security or the Fund. Statements of fact are from sources considered reliable, but Invesco Advisers, Inc. makes no representation or warranty as to their completeness or accuracy. Although historical performance is no guarantee of future results, these insights may help you understand our investment management philosophy.
See important Fund and, if applicable, index disclosures later in this report.
Team managed by Invesco Advisers, Inc.
An investment in the Fund is not insured or guaranteed by the Federal Deposit Insurance Corporation or any other government agency. Although the Fund seeks to preserve the value of your investment at $1.00 per share, you may lose money by investing in the Fund.
| | | | | |
| Portfolio Composition by Maturity |
In days, as of 12/31/15 | | | | % of total net assets | |
| |
1 - 7 | | | | 49.4 | % |
8 - 30 | | | | 26.0 | |
31 - 60 | | | | 13.1 | |
61 - 90 | | | | 10.0 | |
91 - 180 | | | | 0.7 | |
181+ | | | | 0.8 | |
The number of days to maturity of each holding is determined in accordance with the provisions of Rule 2a-7 of the Investment Company Act of 1940.
Invesco V.I. Money Market Fund
Invesco V.I. Money Market Fund’s investment objective is to provide current income consistent with preservation of capital and liquidity.
| n | | Unless otherwise stated, information presented in this report is as of December 31, 2015, and is based on total net assets. |
| n | | Unless otherwise noted, all data provided by Invesco. |
| n | | To access your Fund’s reports/prospectus, visit invesco.com/fundreports. |
Principal risks of investing in the Fund
Banking and financial services industry focus risk. From time to time, the Fund may invest more than 25% of its assets in unsecured bank instruments, including but not limited to certificates of deposit and time deposits. To the extent the Fund focuses its investments in these instruments or invests in securities issued or guaranteed by companies in the banking and financial services industries, the Fund’s performance will depend on the overall condition of those industries and the individual banks and financial institutions in which the Fund invests. Financial services companies may be dependent on the supply of short-term financing. The value of bank instruments and securities of issuers in the banking and financial services industry can be affected by and sensitive to changes in government regulation and interest rates and to economic downturns in the United States and abroad. The risk of holding bank instruments is also directly tied to the risk of insolvency or bankruptcy of the issuing banks, which risk may be higher for larger or more complex financial institutions that combine traditional, commercial and investment banking.
Cash/cash equivalents risk. Holding cash or cash equivalents may negatively affect performance.
Counterparty risk. Counterparty risk is the risk that the other party to the contract will not fulfill its contractual obligations, which may cause losses or additional costs to the Fund.
Credit risk. The issuer of instruments in which the Fund invests may be unable to meet interest and/or principal payments, thereby causing its instruments to decrease in value and lowering the issuer’s credit rating.
Foreign credit exposure risk. US dollar-denominated securities carrying foreign credit exposure may be affected by unfavorable political, economic or governmental developments that could affect payments of principal and interest.
Foreign securities risk. The Fund’s foreign investments may be adversely affected by political and social instability, changes in economic or taxation policies, difficulties when enforcing obligations; decreased liquidity, and increased volatility. Foreign companies may be subject to less regulation resulting in less publicly available information about the companies.
Interest rate risk. Interest rate risk refers to the risk that bond prices generally fall as interest rates rise; conversely, bond prices generally rise as interest rates fall. Specific bonds differ in their sensitivity to changes in interest rates depending on their individual characteristics, including duration.
Liquidity risk. The Fund may hold illiquid securities that it is unable to sell at the preferred time or price and could lose its entire investment in such securities. Liquidity is also the risk that a Fund may not be able to pay redemption proceeds within an allowable amount of time.
Management risk. The investment techniques and risk analysis used by the Fund’s portfolio managers may not produce the desired results.
Market risk. The prices of and the income generated by the Fund’s securities may decline in response to, among other things, investor sentiment, general economic and market conditions, regional or global instability, and interest rate fluctuations.
Money market fund risk. Although the Fund seeks to preserve the value of your investment at $1.00 per share, you may lose money by investing in the Fund. The share price of money market funds can fall below the $1.00 share price. You should not rely on or expect the Fund’s adviser or its affiliates to enter into support agreements or take other actions to maintain the Fund’s $1.00 share price. The credit quality of the Fund’s holdings can change rapidly in certain markets, and the default of a single holding could have an adverse impact on the Fund’s share price. The Fund’s share price can
also be negatively affected during periods of high redemption pressures and/or illiquid markets. Furthermore amendments to money market fund regulations that could impact the Fund’s operations and possibly negatively impact its return.
Reinvestment risk. Reinvestment risk is the risk that a bond’s cash flows (coupon income and principal repayment) will be reinvested at an interest rate below that on the original bond.
Repurchase agreement risk. The Fund is subject to the risk that the counterparty may default on its obligation to repurchase the underlying instruments collateralizing the repurchase agreement, which may cause the Fund to lose money. These risks are magnified to the extent that a repurchase agreement is secured by securities other than cash or US government securities.
US government obligations risk. The Fund may invest in obligations issued by US government agencies and instrumentalities that may receive varying levels of support from the government, which could affect the Fund’s ability to recover should they default.
Variable-rate demand notes risk. The absence of an active secondary market for certain variable and floating rate notes could make it difficult to dispose of the instruments, and the Fund could suffer a loss if the issuer defaults during periods in which the Fund is not entitled to exercise its demand rights.
Yield risk. The Fund’s yield will vary as the short-term securities in its portfolio mature or are sold and the proceeds are reinvested in other securities. Additionally, inflation may outpace and diminish investment returns over time.
Invesco V.I. Money Market Fund
Schedule of Investments
December 31, 2015
| | | | | | | | | | | | | | | | |
| | | Interest
Rate | | | Maturity
Date | | | Principal
Amount
(000) | | |
Value | |
Commercial Paper–53.25%(a) | |
| Asset-Backed Securities–Consumer Receivables–6.68% | |
Barton Capital S.A.(b) | | | 0.20 | % | | | 01/04/2016 | | | $ | 10,000 | | | $ | 9,999,833 | |
Barton Capital S.A.(b) | | | 0.50 | % | | | 02/17/2016 | | | | 6,000 | | | | 5,996,083 | |
Old Line Funding, LLC(b)(c) | | | 0.44 | % | | | 03/01/2016 | | | | 10,000 | | | | 10,000,000 | |
Old Line Funding, LLC(b)(c) | | | 0.45 | % | | | 03/04/2016 | | | | 5,000 | | | | 5,000,000 | |
Old Line Funding, LLC(b)(c) | | | 0.54 | % | | | 02/16/2016 | | | | 10,000 | | | | 10,000,000 | |
Old Line Funding, LLC(b)(c) | | | 0.61 | % | | | 02/22/2016 | | | | 3,200 | | | | 3,200,000 | |
Thunder Bay Funding, LLC(b)(c) | | | 0.44 | % | | | 03/01/2016 | | | | 1,700 | | | | 1,700,000 | |
Thunder Bay Funding, LLC(b) | | | 0.50 | % | | | 03/21/2016 | | | | 5,000 | | | | 4,994,445 | |
| | | | | | | | | | | | | | | | 50,890,361 | |
|
| Asset-Backed Securities–Fully Supported–2.02% | |
Fairway Finance Co., LLC (CEP–Bank of Montreal)(b)(c)(d) | | | 0.39 | % | | | 01/06/2016 | | | | 1,000 | | | | 1,000,000 | |
Kells Funding LLC (CEP–FMS Wertmanagement)(b)(d) | | | 0.39 | % | | | 01/07/2016 | | | | 2,600 | | | | 2,599,831 | |
Kells Funding LLC (CEP–FMS Wertmanagement)(b)(d) | | | 0.40 | % | | | 01/07/2016 | | | | 2,800 | | | | 2,799,813 | |
Kells Funding LLC (CEP–FMS Wertmanagement)(b)(d) | | | 0.40 | % | | | 02/23/2016 | | | | 4,000 | | | | 3,997,645 | |
Kells Funding LLC (CEP–FMS Wertmanagement)(b)(d) | | | 0.43 | % | | | 03/14/2016 | | | | 5,000 | | | | 4,995,640 | |
| | | | | | | | | | | | | | | | 15,392,929 | |
|
| Asset-Backed Securities–Fully Supported Bank–19.18% | |
Cedar Springs Capital Co. (CEP–UBS AG)(b)(d) | | | 0.53 | % | | | 02/19/2016 | | | | 4,118 | | | | 4,115,029 | |
Collateralized Commercial Paper Co., LLC (CEP–JPMorgan Securities LLC)(c) | | | 0.48 | % | | | 02/10/2016 | | | | 2,500 | | | | 2,500,000 | |
Collateralized Commercial Paper II Co., LLC (CEP–JPMorgan Securities LLC)(b)(c) | | | 0.44 | % | | | 03/01/2016 | | | | 10,000 | | | | 10,000,000 | |
Collateralized Commercial Paper II Co., LLC (CEP–JPMorgan Securities LLC)(b)(c) | | | 0.46 | % | | | 01/08/2016 | | | | 3,500 | | | | 3,500,000 | |
Lexington Parker Capital Co., LLC (Multi–CEP’s)(b)(d) | | | 0.31 | % | | | 01/08/2016 | | | | 30,000 | | | | 29,998,192 | |
Lexington Parker Capital Co., LLC (Multi–CEP’s)(b)(d) | | | 0.32 | % | | | 01/05/2016 | | | | 5,000 | | | | 4,999,822 | |
Liberty Street Funding LLC (CEP–Bank of Nova Scotia)(b)(d) | | | 0.35 | % | | | 01/08/2016 | | | | 15,000 | | | | 14,998,987 | |
LMA Americas LLC (CEP–Credit Agricole Corporate & Investment Bank)(b)(d) | | | 0.40 | % | | | 01/05/2016 | | | | 25,000 | | | | 24,998,889 | |
Manhattan Asset Funding Co., LLC (CEP–Sumitomo Mitsui Banking Corp.)(b)(d) | | | 0.50 | % | | | 02/12/2016 | | | | 6,000 | | | | 5,996,500 | |
Regency Markets No. 1 LLC (CEP–HSBC Bank PLC)(b)(d) | | | 0.42 | % | | | 01/08/2016 | | | | 20,000 | | | | 19,998,367 | |
Victory Receivables Corp. (CEP–Bank of Tokyo-Mitsubishi UFJ, Ltd. (The))(b)(d) | | | 0.30 | % | | | 01/08/2016 | | | | 25,000 | | | | 24,998,542 | |
| | | | | | | | | | | | | | | | 146,104,328 | |
|
| Asset-Backed Securities–Multi-Purpose–3.94% | |
Nieuw Amsterdam Receivables Corp.(b)(d) | | | 0.20 | % | | | 01/07/2016 | | | | 5,000 | | | | 4,999,833 | |
Nieuw Amsterdam Receivables Corp.(b)(d) | | | 0.29 | % | | | 01/05/2016 | | | | 25,000 | | | | 24,999,195 | |
| | | | | | | | | | | | | | | | 29,999,028 | |
|
| Consumer Finance–1.44% | |
BMW US Capital LLC(b)(d) | | | 0.36 | % | | | 01/08/2016 | | | | 6,000 | | | | 5,999,580 | |
Toyota Motor Credit Corp.(d) | | | 0.32 | % | | | 01/29/2016 | | | | 5,000 | | | | 4,998,775 | |
| | | | | | | | | | | | | | | | 10,998,355 | |
|
| Diversified Banks–12.56% | |
Commonwealth Bank of Australia(b)(c)(d) | | | 0.42 | % | | | 03/04/2016 | | | | 15,000 | | | | 15,000,000 | |
Commonwealth Bank of Australia(b)(c)(d) | | | 0.44 | % | | | 03/07/2016 | | | | 5,000 | | | | 5,000,000 | |
Commonwealth Bank of Australia(b)(c)(d) | | | 0.53 | % | | | 05/13/2016 | | | | 5,000 | | | | 4,999,792 | |
ING (US) Funding LLC(d) | | | 0.38 | % | | | 01/19/2016 | | | | 10,000 | | | | 9,998,100 | |
National Australia Bank Ltd.(b)(c)(d) | | | 0.47 | % | | | 01/29/2016 | | | | 5,000 | | | | 5,000,000 | |
See accompanying Notes to Financial Statements which are an integral part of the financial statements.
Invesco V.I. Money Market Fund
| | | | | | | | | | | | | | | | |
| | | Interest
Rate | | | Maturity
Date | | | Principal
Amount
(000) | | |
Value | |
| Diversified Banks–(continued) | |
Nordea Bank AB(b)(d) | | | 0.35 | % | | | 01/05/2016 | | | $ | 3,200 | | | $ | 3,199,876 | |
Nordea Bank AB(b)(d) | | | 0.38 | % | | | 02/17/2016 | | | | 2,500 | | | | 2,498,760 | |
Societe Generale S.A.(b)(d) | | | 0.38 | % | | | 01/05/2016 | | | | 30,000 | | | | 29,998,733 | |
United Overseas Bank Ltd.(b)(d) | | | 0.42 | % | | | 01/12/2016 | | | | 20,000 | | | | 19,997,433 | |
| | | | | | | | | | | | | | | | 95,692,694 | |
|
| Integrated Oil & Gas–1.45% | |
Exxon Mobil Corp. | | | 0.34 | % | | | 01/08/2016 | | | | 11,000 | | | | 10,999,273 | |
|
| Regional Banks–3.62% | |
Banque et Caisse d’Epargne de l’Etat(d) | | | 0.42 | % | | | 01/12/2016 | | | | 2,600 | | | | 2,599,666 | |
Landesbank Hessen-Thueringen Girozentrale(b)(d) | | | 0.20 | % | | | 01/04/2016 | | | | 15,000 | | | | 14,999,750 | |
Landesbank Hessen-Thueringen Girozentrale(b)(d) | | | 0.42 | % | | | 01/26/2016 | | | | 10,000 | | | | 9,997,084 | |
| | | | | | | | | | | | | | | | 27,596,500 | |
|
| Specialized Finance–2.36% | |
Caisse des Depots et Consignations(b)(d) | | | 0.49 | % | | | 01/14/2016 | | | | 15,000 | | | | 14,997,346 | |
Nederlandse Waterschapsbank N.V.(b)(d) | | | 0.35 | % | | | 01/04/2016 | | | | 3,000 | | | | 2,999,912 | |
| | | | | | | | | | | | | | | | 17,997,258 | |
Total Commercial Paper (Cost $405,670,726) | | | | | | | | | | | | | | | 405,670,726 | |
|
Certificates of Deposit–12.19% | |
Bank of Montreal(d) | | | 0.44 | % | | | 03/22/2016 | | | | 2,700 | | | | 2,700,000 | |
Bank of Nova Scotia(c)(d) | | | 0.43 | % | | | 03/09/2016 | | | | 1,600 | | | | 1,600,000 | |
Bank of Nova Scotia(c)(d) | | | 0.45 | % | | | 09/30/2016 | | | | 700 | | | | 700,000 | |
Canadian Imperial Bank of Commerce(c)(d) | | | 0.43 | % | | | 01/08/2016 | | | | 2,000 | | | | 2,000,000 | |
China Construction Bank Corp.(d) | | | 0.42 | % | | | 01/04/2016 | | | | 10,000 | | | | 10,000,000 | |
Mitsubishi UFJ Trust & Banking Corp.(c)(d) | | | 0.62 | % | | | 01/27/2016 | | | | 1,900 | | | | 1,900,000 | |
Norinchukin Bank (The)(d) | | | 0.42 | % | | | 02/02/2016 | | | | 20,000 | | | | 20,000,000 | |
Rabobank Nederland(c)(d) | | | 0.41 | % | | | 02/04/2016 | | | | 10,000 | | | | 10,000,000 | |
Royal Bank of Canada(c)(d) | | | 0.44 | % | | | 02/08/2016 | | | | 2,000 | | | | 2,000,000 | |
Royal Bank of Canada(c)(d) | | | 0.48 | % | | | 10/03/2016 | | | | 2,000 | | | | 2,000,000 | |
Standard Chartered Bank(c)(d) | | | 0.48 | % | | | 03/08/2016 | | | | 15,000 | | | | 15,000,000 | |
Standard Chartered Bank(c)(d) | | | 0.49 | % | | | 01/15/2016 | | | | 5,000 | | | | 5,000,000 | |
Standard Chartered Bank(d) | | | 0.65 | % | | | 02/26/2016 | | | | 3,900 | | | | 3,901,261 | |
Sumitomo Mitsui Trust Bank Ltd.(d) | | | 0.30 | % | | | 01/04/2016 | | | | 3,000 | | | | 3,000,000 | |
Sumitomo Mitsui Trust Bank Ltd.(d) | | | 0.30 | % | | | 01/04/2016 | | | | 3,300 | | | | 3,300,000 | |
Toronto-Dominion Bank (The)(c)(d) | | | 0.55 | % | | | 01/20/2016 | | | | 9,750 | | | | 9,750,000 | |
Total Certificates of Deposit (Cost $92,851,261) | | | | | | | | | | | | | | | 92,851,261 | |
|
Variable Rate Demand Notes–3.19%(e) | |
| Credit Enhanced–3.19% | |
Benjamin Rose Institute (The) (Kethley House); Series 2005, VRD Taxable Notes (LOC–JPMorgan Chase Bank, N.A.)(f) | | | 0.43 | % | | | 12/01/2028 | | | | 3,310 | | | | 3,310,000 | |
Cleveland (City of) & Cuyahoga (County of), Ohio Port Authority (Carnegie/96th Research Building LLC); Series 2003, VRD RB (LOC–PNC Bank, N.A.)(f) | | | 0.01 | % | | | 01/01/2033 | | | | 3,500 | | | | 3,500,000 | |
Collier (County of), Florida Industrial Development Authority (Allete, Inc.); Series 2006, Ref. VRD IDR (LOC–Wells Fargo Bank, N.A.)(f)(g) | | | 0.05 | % | | | 10/01/2025 | | | | 1,000 | | | | 1,000,000 | |
Gary Chicago International Airport Authority (Gary Jet Center); Series 2011, VRD Multi–Modal Special Purpose Facility RB (LOC–BMO Harris Bank, N.A.)(f)(g) | | | 0.10 | % | | | 05/01/2036 | | | | 7,145 | | | | 7,145,000 | |
Hamilton (County of), Ohio (Children’s Hospital Medical Center); Series 1997 A, VRD Hospital Facilities RB (LOC–PNC Bank, N.A.)(f) | | | 0.01 | % | | | 05/15/2017 | | | | 400 | | | | 400,000 | |
Keep Memory Alive; Series 2013, VRD Taxable Bonds (LOC–PNC Bank, N.A.)(f) | | | 0.38 | % | | | 05/01/2037 | | | | 3,620 | | | | 3,620,000 | |
See accompanying Notes to Financial Statements which are an integral part of the financial statements.
Invesco V.I. Money Market Fund
| | | | | | | | | | | | | | | | |
| | | Interest
Rate | | | Maturity
Date | | | Principal
Amount
(000) | | |
Value | |
| Credit Enhanced–(continued) | |
M3 Realty, LLC; Series 2007, VRD RN (LOC–General Electric Capital Corp.)(b)(f) | | | 0.49 | % | | | 01/01/2033 | | | $ | 2,060 | | | $ | 2,060,000 | |
Massachusetts (State of) Development Finance Agency (Milton Academy); Series 2009 B, VRD Taxable RB (LOC–TD Bank, N.A.)(f) | | | 0.38 | % | | | 03/01/2039 | | | | 1,000 | | | | 1,000,000 | |
Ogden (City of), Utah Redevelopment Agency; Series 2009 B-1, Ref. VRD Taxable RB (LOC–Wells Fargo Bank, N.A.)(f) | | | 0.42 | % | | | 12/01/2027 | | | | 2,085 | | | | 2,085,000 | |
Rock Island (County of), Illinois Metropolitan Airport Authority (Quad City International Airport Air Freight); Series 1998 A, VRD Priority RB (LOC–U.S. Bank, N.A.)(f)(g) | | | 0.20 | % | | | 12/01/2018 | | | | 145 | | | | 145,000 | |
Total Variable Rate Demand Notes (Cost $24,265,000) | | | | | | | | | | | | | | | 24,265,000 | |
|
U.S. Government Sponsored Agency Securities–0.66% | |
| Overseas Private Investment Corp. (OPIC)–0.66% | |
Unsec. Gtd. VRD Bonds(e) (Cost $5,000,000) | | | 0.33 | % | | | 09/15/2020 | | | | 5,000 | | | | 5,000,000 | |
|
Notes–0.39% | |
Wells Fargo Bank, N.A., Unsec. Medium-Term Floating Rate Notes(c) (Cost $3,000,000) | | | 0.74 | % | | | 10/29/2016 | | | | 3,000 | | | | 3,000,000 | |
TOTAL INVESTMENTS (excluding Repurchase Agreements)–69.68% (Cost $530,786,987) | | | | | | | | | | | | | | | 530,786,987 | |
| | | | |
| | | | | | | | | Repurchase
Amount | | | | |
Repurchase Agreements–29.80%(h) | | | | | | | | | | | | | | | | |
Bank of Nova Scotia (The), joint agreement dated 12/31/2015, aggregate maturing value of $200,006,889 (collateralized by U.S. Treasury obligations valued at $204,000,000; 1.75%-6.50%, 03/31/2018-11/01/2045) | | | 0.31 | % | | | 01/04/2016 | | | | 38,001,309 | | | | 38,000,000 | |
Bank of Nova Scotia (The), joint agreement dated 12/31/2015, aggregate maturing value of $300,009,667 (collateralized by U.S. Treasury obligations valued at $306,000,095; 0%-8.88%, 01/31/2016-05/15/2045) | | | 0.29 | % | | | 01/04/2016 | | | | 38,001,224 | | | | 38,000,000 | |
BNP Paribas Securities Corp., joint agreement dated 12/31/2015, aggregate maturing value of $300,009,667 (collateralized by U.S. Treasury obligations valued at $306,000,089; 0.18%-8.88%, 07/31/2016-08/15/2043) | | | 0.29 | % | | | 01/04/2016 | | | | 38,001,224 | | | | 38,000,000 | |
Citigroup Global Markets Inc., joint agreement dated 12/31/2015, aggregate maturing value of $250,009,444 (collateralized by U.S. government sponsored agency obligations valued at $255,000,928; 0%-6.21%, 01/07/2016-06/05/2036) | | | 0.34 | % | | | 01/04/2016 | | | | 38,001,436 | | | | 38,000,000 | |
Citigroup Global Markets Inc., open agreement dated 12/03/2015, maturing value of $5,041,569 (collateralized by a foreign corporate obligation valued at $5,500,000; 0.46%, 12/02/2041)(i) | | | 0.82 | % | | | — | | | | — | | | | 5,000,000 | |
Mitsubishi UFJ Securities (USA) Inc., joint agreement dated 12/31/2015, aggregate maturing value of $200,006,889 (collateralized by domestic agency mortgage-backed securities valued at $204,000,000; 2.09%-5.00%, 06/01/2024-10/01/2045) | | | 0.31 | % | | | 01/04/2016 | | | | 38,001,309 | | | | 38,000,000 | |
RBC Capital Markets Corp., term agreement dated 12/30/2015, maturing value of $20,000,000 (collateralized by domestic agency mortgage-backed securities and domestic non-agency asset-backed securities valued at $20,441,061; 0.48%-6.45%, 11/25/2035-02/20/2045)(d) | | | 1.17 | % | | | 02/26/2016 | | | | 20,019,705 | | | | 20,000,000 | |
Wells Fargo Securities, LLC, joint agreement dated 12/31/2015, aggregate maturing value of $600,023,333 (collateralized by a domestic agency mortgage-backed security valued at $612,000,000; 3.50%, 06/01/2045) | | | 0.35 | % | | | 01/04/2016 | | | | 12,042,649 | | | | 12,042,181 | |
Total Repurchase Agreements (Cost $227,042,181) | | | | | | | | | | | | | | | 227,042,181 | |
TOTAL INVESTMENTS(j)(k)–99.48% (Cost $757,829,168) | | | | | | | | | | | | | | | 757,829,168 | |
OTHER ASSETS LESS LIABILITIES–0.52% | | | | | | | | | | | | | | | 3,968,725 | |
NET ASSETS–100.00% | | | | | | | | | | | | | | $ | 761,797,893 | |
Investment Abbreviations:
| | |
| CEP | | – Credit Enhancement Provider |
| IDR | | – Industrial Development Revenue Bonds |
| Gtd. | | – Guaranteed |
| LOC | | – Letter of Credit |
| RB | | – Revenue Bonds |
| Ref. | | – Refunding |
| RN | | – Revenue Notes |
| Unsec. | | – Unsecured |
| VRD | | – Variable Rate Demand |
See accompanying Notes to Financial Statements which are an integral part of the financial statements.
Invesco V.I. Money Market Fund
Notes to Schedule of Investments:
| (a) | Security may be traded on a discount basis. The interest rate shown represents the discount rate at the time of purchase by the Fund. |
| (b) | Security purchased or received in a transaction exempt from registration under the Securities Act of 1933, as amended (the “1933 Act”). The security may be resold pursuant to an exemption from registration under the 1933 Act, typically to qualified institutional buyers. The aggregate value of these securities at December 31, 2015 was $376,634,912, which represented 49.44% of the Fund’s Net Assets. |
| (c) | Interest or dividend rate is redetermined periodically. Rate shown is the rate in effect on December 31, 2015. |
| (d) | The security is credit guaranteed, enhanced or has credit risk by a foreign entity. The foreign credit exposure to countries other than the United States of America (as a percentage of net assets) is summarized as follows: France: 9.2%; Japan: 8.4%; Canada: 7.5%; Netherlands: 7.0%; Denmark: 6.0%; Great Britain: 5.8%; Switzerland: 5.1%; other countries less than 5% each: 8.9%. |
| (e) | Demand security payable upon demand by the Fund at specified time intervals no greater than thirteen months. Interest rate is redetermined periodically. Rate shown is the rate in effect on December 31, 2015. |
| (f) | Principal and interest payments are fully enhanced by a letter of credit from the bank listed or a predecessor bank, branch or subsidiary. |
| (g) | Security subject to the alternative minimum tax. |
| (h) | Principal amount equals value at period-end. See Note 1I. |
| (i) | Either party may terminate the agreement upon demand. Interest rates, principal amount and collateral are redetermined daily. |
| (j) | Also represents cost for federal income tax purposes. |
| (k) | This table provides a listing of those entities that have either issued, guaranteed, backed or otherwise enhanced the credit quality of more than 5% of the securities held in the portfolio. In instances where the entity has guaranteed, backed or otherwise enhanced the credit quality of a security, it is not primarily responsible for the issuer’s obligations but may be called upon to satisfy the issuer’s obligations. |
| | | | |
| Entity | | Percentage | |
Societe Generale S.A. | | | 6.1 | % |
See accompanying Notes to Financial Statements which are an integral part of the financial statements.
Invesco V.I. Money Market Fund
Statement of Assets and Liabilities
December 31, 2015
Statement of Operations
For the year ended December 31, 2015
| | | | |
Assets: | |
Investments, excluding repurchase agreements, at value and cost | | $ | 530,786,987 | |
Repurchase agreements, at value and cost | | | 227,042,181 | |
Total investments, at value and cost | | | 757,829,168 | |
Receivable for: | | | | |
Investments sold | | | 25,000 | |
Fund shares sold | | | 4,554,344 | |
Interest | | | 82,289 | |
Fund expenses absorbed | | | 39,895 | |
Investment for trustee deferred compensation and retirement plans | | | 50,448 | |
Total assets | | | 762,581,144 | |
| |
Liabilities: | | | | |
Payable for: | | | | |
Fund shares reacquired | | | 505,269 | |
Dividends | | | 139 | |
Accrued fees to affiliates | | | 202,197 | |
Accrued trustees’ and officers’ fees and benefits | | | 124 | |
Accrued other operating expenses | | | 17,268 | |
Trustee deferred compensation and retirement plans | | | 58,254 | |
Total liabilities | | | 783,251 | |
Net assets applicable to shares outstanding | | $ | 761,797,893 | |
| |
Net assets consist of: | | | | |
Shares of beneficial interest | | $ | 761,803,456 | |
Undistributed net investment income | | | (11,145 | ) |
Undistributed net realized gain | | | 5,582 | |
| | | $ | 761,797,893 | |
|
Net Assets: | |
Series I | | $ | 737,857,912 | |
Series II | | $ | 23,939,981 | |
|
Shares outstanding, $0.001 par value per share,
with an unlimited number of shares authorized: | |
Series I | | | 737,850,853 | |
Series II | | | 23,939,741 | |
Series I: | | | | |
Net asset value per share | | $ | 1.00 | |
Series II: | | | | |
Net asset value per share | | $ | 1.00 | |
| | | | |
Investment income: | |
Interest | | $ | 1,460,635 | |
| |
Expenses: | | | | |
Advisory fees | | | 2,403,103 | |
Administrative services fees | | | 802,709 | |
Custodian fees | | | 16,348 | |
Distribution fees — Series II | | | 51,199 | |
Transfer agent fees | | | 14,010 | |
Trustees’ and officers’ fees and benefits | | | 28,699 | |
Other | | | 83,579 | |
Total expenses | | | 3,399,647 | |
Less: Fees waived and expenses reimbursed | | | (2,010,656 | ) |
Net expenses | | | 1,388,991 | |
Net investment income | | | 71,644 | |
Net realized gain from investment securities | | | 5,582 | |
Net increase in net assets resulting from operations | | $ | 77,226 | |
See accompanying Notes to Financial Statements which are an integral part of the financial statements.
Invesco V.I. Money Market Fund
Statement of Changes in Net Assets
For the years ended December 31, 2015 and 2014
| | | | | | | | |
| | | 2015 | | | 2014 | |
Operations: | | | | | |
Net investment income | | $ | 71,644 | | | $ | 69,709 | |
Net realized gain | | | 5,582 | | | | 1,738 | |
Net increase in net assets resulting from operations | | | 77,226 | | | | 71,447 | |
| | |
Distributions to shareholders from net investment income: | | | | | | | | |
Series I | | | (69,408 | ) | | | (67,296 | ) |
Series ll | | | (2,236 | ) | | | (2,413 | ) |
Total distributions from net investment income | | | (71,644 | ) | | | (69,709 | ) |
| | |
Share transactions–net: | | | | | | | | |
Series l | | | 131,299,685 | | | | 184,059,944 | |
Series ll | | | 6,443,746 | | | | 1,613,097 | |
Net increase in net assets resulting from share transactions | | | 137,743,431 | | | | 185,673,041 | |
Net increase in net assets | | | 137,749,013 | | | | 185,674,779 | |
| | |
Net assets: | | | | | | | | |
Beginning of year | | | 624,048,880 | | | | 438,374,101 | |
End of year (includes undistributed net investment income of $(11,145) and $(9,539), respectively) | | $ | 761,797,893 | | | $ | 624,048,880 | |
Notes to Financial Statements
December 31, 2015
NOTE 1—Significant Accounting Policies
Invesco V.I. Money Market Fund (the “Fund”) is a series portfolio of AIM Variable Insurance Funds (Invesco Variable Insurance Funds) (the “Trust”). The Trust is a Delaware statutory trust registered under the Investment Company Act of 1940, as amended (the “1940 Act”), as an open-end series management investment company consisting of twenty-four separate portfolios, (each constituting a “Fund”). The assets, liabilities and operations of each portfolio are accounted for separately. Information presented in these financial statements pertains only to the Fund. Matters affecting each Fund or class will be voted on exclusively by the shareholders of such Fund or class. Current Securities and Exchange Commission (“SEC”) guidance, however, requires participating insurance companies offering separate accounts to vote shares proportionally in accordance with the instructions of the contract owners whose investments are funded by shares of each Fund or class.
The Fund’s investment objective is to provide current income consistent with preservation of capital and liquidity.
The Fund currently offers two classes of shares, Series I and Series II, both of which are offered to insurance company separate accounts funding variable annuity contracts and variable life insurance policies (“variable products”).
The following is a summary of the significant accounting policies followed by the Fund in the preparation of its financial statements.
| A. | Security Valuations — The Fund’s securities are recorded on the basis of amortized cost which approximates value as permitted by Rule 2a-7 under the 1940 Act. This method values a security at its cost on the date of purchase and, thereafter, assumes a constant amortization to maturity of any premiums or accretion of any discounts. |
Because of the inherent uncertainties of valuation, the values reflected in the financial statements may materially differ from the value received upon actual sale of those investments.
The Fund may invest in securities that are subject to interest rate risk, meaning the risk that the prices will generally fall as interest rates rise and, conversely, the prices will generally rise as interest rates fall. Specific securities differ in their sensitivity to changes in interest rates depending on their individual characteristics. Changes in interest rates may result in increased market volatility, which may affect the value and/or liquidity of certain Fund investments.
| B. | Securities Transactions and Investment Income — Securities transactions are accounted for on a trade date basis. Realized gains or losses on sales are computed on the basis of specific identification of the securities sold. Interest income (net of withholding tax, if any), adjusted for amortization of premiums and accretion of discounts on investments, is recorded on the accrual basis from settlement date. Paydown gains and losses on mortgage and asset-backed securities are recorded as adjustments to interest income. |
The Fund may periodically participate in litigation related to Fund investments. As such, the Fund may receive proceeds from litigation settlements. Any proceeds received are included in the Statement of Operations as realized gain (loss) for investments no longer held and as unrealized gain (loss) for investments still held.
Brokerage commissions and mark ups are considered transaction costs and are recorded as an increase to the cost basis of securities purchased and/or a reduction of proceeds on a sale of securities. Such transaction costs are included in the determination of net realized gain (loss) from investment securities reported in the Statement of Operations and the Statement of Changes in Net Assets and the net realized gains (losses) on securities per share in the Financial Highlights. Transaction costs are included in the calculation of the Fund’s net asset value and, accordingly, they reduce the Fund’s total returns. These transaction costs are not considered operating expenses and are not reflected in net
Invesco V.I. Money Market Fund
investment income reported in the Statement of Operations and the Statement of Changes in Net Assets, or the net investment income per share and the ratios of expenses and net investment income reported in the Financial Highlights, nor are they limited by any expense limitation arrangements between the Fund and the investment adviser.
The Fund allocates realized and unrealized capital gains and losses to a class based on the relative net assets of each class. The Fund allocates income to a class based on the relative value of the settled shares of each class.
| C. | Country Determination — For the purposes of making investment selection decisions and presentation in the Schedule of Investments, the investment adviser may determine the country in which an issuer is located and/or credit risk exposure based on various factors. These factors include the laws of the country under which the issuer is organized, where the issuer maintains a principal office, the country in which the issuer derives 50% or more of its total revenues and the country that has the primary market for the issuer’s securities, as well as other criteria. Among the other criteria that may be evaluated for making this determination are the country in which the issuer maintains 50% or more of its assets, the type of security, financial guarantees and enhancements, the nature of the collateral and the sponsor organization. Country of issuer and/or credit risk exposure has been determined to be the United States of America, unless otherwise noted. |
| D. | Distributions — Distributions from net investment income, if any, are declared and paid monthly to separate accounts of participating insurance companies. Distributions from net realized gain, if any, are generally declared and paid annually and recorded on the ex-dividend date. |
| E. | Federal Income Taxes — The Fund intends to comply with the requirements of Subchapter M of the Internal Revenue Code of 1986, as amended (the “Internal Revenue Code”), necessary to qualify as a regulated investment company and to distribute substantially all of the Fund’s taxable earnings to shareholders. As such, the Fund will not be subject to federal income taxes on otherwise taxable income (including net realized capital gain) that is distributed to shareholders. Therefore, no provision for federal income taxes is recorded in the financial statements. |
The Fund recognizes the tax benefits of uncertain tax positions only when the position is more likely than not to be sustained. Management has analyzed the Fund’s uncertain tax positions and concluded that no liability for unrecognized tax benefits should be recorded related to uncertain tax positions. Management is not aware of any tax positions for which it is reasonably possible that the total amounts of unrecognized tax benefits will change materially in the next 12 months.
The Fund files tax returns in the U.S. Federal jurisdiction and certain other jurisdictions. Generally, the Fund is subject to examinations by such taxing authorities for up to three years after the filing of the return for the tax period.
| F. | Expenses — Fees provided for under the Rule 12b-1 plan of a particular class of the Fund and which are directly attributable to that class are charged to the operations of such class. All other expenses are allocated among the classes based on relative net assets. |
| G. | Accounting Estimates — The preparation of financial statements in conformity with accounting principles generally accepted in the United States of America (“GAAP”) requires management to make estimates and assumptions that affect the reported amounts of assets and liabilities at the date of the financial statements and the reported amounts of revenues and expenses during the reporting period including estimates and assumptions related to taxation. Actual results could differ from those estimates by a significant amount. In addition, the Fund monitors for material events or transactions that may occur or become known after the period-end date and before the date the financial statements are released to print. |
| H. | Indemnifications — Under the Trust’s organizational documents, each Trustee, officer, employee or other agent of the Trust is indemnified against certain liabilities that may arise out of the performance of their duties to the Fund. Additionally, in the normal course of business, the Fund enters into contracts, including the Fund’s servicing agreements, that contain a variety of indemnification clauses. The Fund’s maximum exposure under these arrangements is unknown as this would involve future claims that may be made against the Fund that have not yet occurred. The risk of material loss as a result of such indemnification claims is considered remote. |
| I. | Repurchase Agreements — The Fund may enter into repurchase agreements. Collateral on repurchase agreements, including the Fund’s pro-rata interest in joint repurchase agreements, is taken into possession by the Fund upon entering into the repurchase agreement. Collateral consisting of U.S. Government Securities and U.S. Government Sponsored Agency Securities is marked to market daily to ensure its market value is at least 102% of the sales price of the repurchase agreement. Collateral consisting of non-government securities is marked to market daily to ensure its market value is at least 105% of the sales price of the repurchase agreement. The investments in some repurchase agreements, pursuant to procedures approved by the Board of Trustees, are through participation with other mutual funds, private accounts and certain non-registered investment companies managed by the investment advisor or its affiliates (“Joint repurchase agreements”). The principal amount of the repurchase agreement is equal to the value at period-end. If the seller of a repurchase agreement fails to repurchase the security in accordance with the terms of the agreement, the Fund might incur expenses in enforcing its rights, and could experience losses, including a decline in the value of the collateral and loss of income. |
NOTE 2—Advisory Fees and Other Fees Paid to Affiliates
The Trust has entered into a master investment advisory agreement with Invesco Advisers, Inc. (the “Adviser” or “Invesco”). Under the terms of the investment advisory agreement, the Fund pays an advisory fee to the Adviser based on the annual rate of the Fund’s average daily net assets as follows:
| | | | | | |
| Average Daily Net Assets | | Rate |
First $250 million | | | 0 | .40% | | |
Over $250 million | | | 0 | .35% | | |
For the year ended December 31, 2015, the effective advisory fees incurred by the Fund was 0.37%.
Under the terms of a master sub-advisory agreement between the Adviser and each of Invesco Asset Management Deutschland GmbH, Invesco Asset Management Limited, Invesco Asset Management (Japan) Limited, Invesco Hong Kong Limited, Invesco Senior Secured Management, Inc. and Invesco Canada Ltd. (collectively, the “Affiliated Sub-Advisers”) the Adviser, not the Fund, may pay 40% of the fees paid to the Adviser to any such Affiliated Sub-Adviser(s) that provide(s) discretionary investment management services to the Fund based on the percentage of assets allocated to such Affiliated Sub-Adviser(s).
The Adviser has contractually agreed, through at least June 30, 2016, to waive advisory fees and/or reimburse expenses to the extent necessary to limit total annual operating expenses after fee waivers and/or expense reimbursements (excluding certain items discussed below) of Series I shares to 1.50% and Series II shares to 1.75% of average daily net assets. In determining the Adviser’s obligation to waive advisory fees and/or reimburse
Invesco V.I. Money Market Fund
expenses, the following expenses are not taken into account, and could cause the total annual operating expenses after fee waivers and/or expense reimbursements to exceed the numbers reflected above: (1) interest; (2) taxes; (3) dividend expense on short sales; (4) extraordinary or non-routine items, including litigation expenses; and (5) expenses that the Fund has incurred but did not actually pay because of an expense offset arrangement. Unless Invesco continues the fee waiver agreement, it will terminate on June 30, 2016. The fee waiver agreement cannot be terminated during its term. The Adviser did not waive fees and/or reimburse expenses during the period under this expense limitation.
The Adviser and/or Invesco Distributors, Inc., (“IDI”) voluntarily agreed to waive fees and/or reimburse expenses in order to increase the Fund’s yield. Voluntary fee waivers and/or reimbursements may be modified at any time upon consultation with the Board of Trustees without further notice to investors.
For the year ended December 31, 2015, Invesco voluntarily waived advisory fees of $1,959,457 and reimbursed class level expenses of $51,199 for Series II shares in order to increase the Fund’s yield.
The Trust has entered into a master administrative services agreement with Invesco pursuant to which the Fund has agreed to pay Invesco a fee for costs incurred in providing accounting services and fund administrative services to the Fund and to reimburse Invesco for administrative services fees paid to insurance companies that have agreed to provide services to the participants of separate accounts. These administrative services provided by the insurance companies may include, among other things: the printing of prospectuses, financial reports and proxy statements and the delivery of the same to existing participants; the maintenance of master accounts; the facilitation of purchases and redemptions requested by the participants; and the servicing of participants’ accounts. Pursuant to such agreement, for the year ended December 31, 2015, Invesco was paid $154,704 for accounting and fund administrative services and reimbursed $648,005 for services provided by insurance companies.
The Trust has entered into a transfer agency and service agreement with Invesco Investment Services, Inc. (“IIS”) pursuant to which the Fund has agreed to pay IIS a fee for providing transfer agency and shareholder services to the Fund and reimburse IIS for certain expenses incurred by IIS in the course of providing such services. For the year ended December 31, 2015, expenses incurred under the agreement are shown in the Statement of Operations as Transfer agent fees.
The Trust has entered into a master distribution agreement with IDI to serve as the distributor for the Fund. The Trust has adopted a plan pursuant to Rule 12b-1 under the 1940 Act with respect to the Fund’s Series II shares (the “Plan”). The Fund, pursuant to the Plan, pays IDI compensation at the annual rate of 0.25% of the Fund’s average daily net assets of Series II shares. Of the Plan payments, up to 0.25% of the average daily net assets of the Series II shares may be paid to insurance companies who furnish continuing personal shareholder services to customers who purchase and own Series II shares of the Fund. For the year ended December 31, 2015, expenses incurred under the Plan are detailed in the Statement of Operations as Distribution fees.
Certain officers and trustees of the Trust are officers and directors of the Adviser, IIS and/or IDI.
NOTE 3—Additional Valuation Information
GAAP defines fair value as the price that would be received to sell an asset or paid to transfer a liability in an orderly transaction between market participants at the measurement date, under current market conditions. GAAP establishes a hierarchy that prioritizes the inputs to valuation methods, giving the highest priority to readily available unadjusted quoted prices in an active market for identical assets (Level 1) and the lowest priority to significant unobservable inputs (Level 3), generally when market prices are not readily available or are unreliable. Based on the valuation inputs, the securities or other investments are tiered into one of three levels. Changes in valuation methods may result in transfers in or out of an investment’s assigned level:
| | Level 1 — | Prices are determined using quoted prices in an active market for identical assets. |
| | Level 2 — | Prices are determined using other significant observable inputs. Observable inputs are inputs that other market participants may use in pricing a security. These may include quoted prices for similar securities, interest rates, prepayment speeds, credit risk, yield curves, loss severities, default rates, discount rates, volatilities and others. |
| | Level 3 — | Prices are determined using significant unobservable inputs. In situations where quoted prices or observable inputs are unavailable (for example, when there is little or no market activity for an investment at the end of the period), unobservable inputs may be used. Unobservable inputs reflect the Fund’s own assumptions about the factors market participants would use in determining fair value of the securities or instruments and would be based on the best available information. |
As of December 31, 2015, all of the securities in this Fund were valued based on Level 2 inputs (see the Schedule of Investments for security categories). The level assigned to the securities valuations may not be an indication of the risk or liquidity associated with investing in those securities. Because of the inherent uncertainties of valuation, the values reflected in the financial statements may materially differ from the value received upon actual sale of those investments.
NOTE 4—Security Transactions with Affiliated Funds
The Fund is permitted to purchase or sell securities from or to certain other Invesco Funds under specified conditions outlined in procedures adopted by the Board of Trustees of the Trust. The procedures have been designed to ensure that any purchase or sale of securities by the Fund from or to another fund or portfolio that is or could be considered an affiliate by virtue of having a common investment adviser (or affiliated investment advisers), common Trustees and/or common officers complies with Rule 17a-7 of the 1940 Act. Further, as defined under the procedures, each transaction is effected at the current market price. Pursuant to these procedures, for the year ended December 31, 2015, the Fund engaged in securities purchases of $1,700,142 and securities sales of $2,200,252, which resulted in net realized gains (losses) of $0.
Invesco V.I. Money Market Fund
NOTE 5—Trustees’ and Officers’ Fees and Benefits
Trustees’ and Officers’ Fees and Benefits include amounts accrued by the Fund to pay remuneration to certain Trustees and Officers of the Fund. Trustees have the option to defer compensation payable by the Fund, and Trustees’ and Officers’ Fees and Benefits also include amounts accrued by the Fund to fund such deferred compensation amounts. Those Trustees who defer compensation have the option to select various Invesco Funds in which their deferral accounts shall be deemed to be invested. Finally, certain current Trustees were eligible to participate in a retirement plan that provided for benefits to be paid upon retirement to Trustees over a period of time based on the number of years of service. The Fund may have certain former Trustees who also participate in a retirement plan and receive benefits under such plan. Trustees’ and Officers’ Fees and Benefits include amounts accrued by the Fund to fund such retirement benefits. Obligations under the deferred compensation and retirement plans represent unsecured claims against the general assets of the Fund.
NOTE 6—Cash Balances
The Fund is permitted to temporarily carry a negative or overdrawn balance in its account with The Bank of New York Mellon, the custodian bank. Such balances, if any at period end, are shown in the Statement of Assets and Liabilities under the payable caption Amount due custodian. To compensate the custodian bank for such overdrafts, the overdrawn Fund may either (1) leave funds as a compensating balance in the account so the custodian bank can be compensated by earning the additional interest; or (2) compensate by paying the custodian bank at a rate agreed upon by the custodian bank and Invesco, not to exceed the contractually agreed upon rate.
NOTE 7—Distributions to Shareholders and Tax Components of Net Assets
Tax Character of Distributions to Shareholders Paid During the Fiscal Years Ended December 31, 2015 and 2014:
| | | | | | | | |
| | | 2015 | | | 2014 | |
Ordinary income | | $ | 71,644 | | | $ | 69,709 | |
Tax Components of Net Assets at Period-End:
| | | | |
| | | 2015 | |
Undistributed ordinary income | | $ | 54,420 | |
Temporary book/tax differences | | | (59,983 | ) |
Shares of beneficial interest | | | 761,803,456 | |
Total net assets | | $ | 761,797,893 | |
The temporary book/tax differences are a result of timing differences between book and tax recognition of income and/or expenses. The Fund’s temporary book/tax differences are the result of the trustee deferral of compensation and retirement plan benefits.
Capital loss carryforward is calculated and reported as of a specific date. Results of transactions and other activity after that date may affect the amount of capital loss carryforward actually available for the Fund to utilize. Capital losses generated in years beginning after December 22, 2010 can be carried forward for an unlimited period, whereas previous losses expire in eight tax years. Capital losses with an expiration period may not be used to offset capital gains until all net capital losses without an expiration date have been utilized. Capital loss carryforwards with no expiration date will retain their character as either short-term or long-term capital losses instead of as short-term capital losses as under prior law. The ability to utilize capital loss carryforwards in the future may be limited under the Internal Revenue Code and related regulations based on the results of future transactions.
The Fund does not have a capital loss carryforward as of December 31, 2015.
NOTE 8—Reclassification of Permanent Differences
Primarily as a result of differing book/tax treatment of taxable income, on December 31, 2015, undistributed net investment income was decreased by $1,606, undistributed net realized gain was decreased by $291 and shares of beneficial interest was increased by $1,897. This reclassification had no effect on the net assets of the Fund.
Invesco V.I. Money Market Fund
NOTE 9—Share Information
| | | | | | | | | | | | | | | | |
| | | Summary of Share Activity | |
| | | Years ended December 31, | |
| | | 2015(a) | | | 2014 | |
| | | Shares | | | Amount | | | Shares | | | Amount | |
Sold: | | | | | | | | | | | | | | | | |
Series I | | | 1,241,321,035 | | | $ | 1,241,321,035 | | | | 1,289,451,981 | | | $ | 1,289,451,981 | |
Series II | | | 34,663,428 | | | | 34,663,428 | | | | 40,068,335 | | | | 40,068,335 | |
| | | | |
Issued as reinvestment of dividends: | | | | | | | | | | | | | | | | |
Series I | | | 67,722 | | | | 67,722 | | | | 64,806 | | | | 64,806 | |
Series II | | | 2,236 | | | | 2,236 | | | | 2,413 | | | | 2,413 | |
| | | | |
Reacquired: | | | | | | | | | | | | | | | | |
Series I | | | (1,110,089,072 | ) | | | (1,110,089,072 | ) | | | (1,105,456,843 | ) | | | (1,105,456,843 | ) |
Series II | | | (28,221,918 | ) | | | (28,221,918 | ) | | | (38,457,651 | ) | | | (38,457,651 | ) |
Net increase in share activity | | | 137,743,431 | | | $ | 137,743,431 | | | | 185,673,041 | | | $ | 185,673,041 | |
| (a) | There are entities that are record owners of more than 5% of the outstanding shares of the Fund and in the aggregate own 95% of the outstanding shares of the Fund. The Fund and the Fund’s principal underwriter or adviser, are parties to participation agreements with these entities whereby these entities sell units of interest in separate accounts funding variable products that are invested in the Fund. The Fund, Invesco and/or Invesco affiliates may make payments to these entities, which are considered to be related to the Fund, for providing services to the Fund, Invesco and/or Invesco affiliates including but not limited to services such as, securities brokerage, third party record keeping and account servicing and administrative services. The Fund has no knowledge as to whether all or any portion of the shares owned of record by these entities are also owned beneficially. |
NOTE 10—Financial Highlights
The following schedule presents financial highlights for a share of the Fund outstanding throughout the periods indicated.
| | | | | | | | | | | | | | | | | | | | | | | | | | | | | | | | | | | | | | | | | | | | | | | | | | | | | | | |
| | | Net asset
value,
beginning
of period | | Net
investment
income(a) | | Net realized
gains
(losses) on
securities | | Total from
investment
operations | | Dividends
from net
investment
income | | Net asset
value, end
of period | | Total
return(b) | | Net assets,
end of period
(000’s omitted) | | Ratio of
expenses
to average
net assets
with fee waivers
and/or expenses
absorbed | | Ratio of
expenses
to average net
assets without
fee waivers
and/or expenses
absorbed | | Ratio of net
investment
income
to average
net assets |
Series I | | | | | | | | | | | | | | | | | | | | | | | | | | | | | | | | | | | | | | | | | | | | | | | | | | | | | | | |
Year ended 12/31/15 | | | $ | 1.00 | | | | $ | 0.00 | | | | $ | 0.00 | | | | $ | 0.00 | | | | $ | (0.00 | ) | | | $ | 1.00 | | | | | 0.01 | % | | | $ | 737,858 | | | | | 0.21 | %(c) | | | | 0.51 | %(c) | | | | 0.01 | %(c) |
Year ended 12/31/14 | | | | 1.00 | | | | | 0.00 | | | | | 0.00 | | | | | 0.00 | | | | | (0.00 | ) | | | | 1.00 | | | | | 0.01 | | | | | 606,553 | | | | | 0.16 | | | | | 0.50 | | | | | 0.01 | |
Year ended 12/31/13 | | | | 1.00 | | | | | 0.00 | | | | | (0.00 | ) | | | | 0.00 | | | | | (0.00 | ) | | | | 1.00 | | | | | 0.03 | | | | | 422,491 | | | | | 0.16 | | | | | 0.70 | | | | | 0.03 | |
Year ended 12/31/12 | | | | 1.00 | | | | | 0.00 | | | | | 0.00 | | | | | 0.00 | | | | | (0.00 | ) | | | | 1.00 | | | | | 0.03 | | | | | 156,931 | | | | | 0.23 | | | | | 0.54 | | | | | 0.03 | |
Year ended 12/31/11 | | | | 1.00 | | | | | 0.00 | | | | | — | | | | | 0.00 | | | | | (0.00 | ) | | | | 1.00 | | | | | 0.05 | | | | | 198,533 | | | | | 0.17 | | | | | 0.57 | | | | | 0.05 | |
Series II | | | | | | | | | | | | | | | | | | | | | | | | | | | | | | | | | | | | | | | | | | | | | | | | | | | | | | | |
Year ended 12/31/15 | | | | 1.00 | | | | | 0.00 | | | | | 0.00 | | | | | 0.00 | | | | | (0.00 | ) | | | | 1.00 | | | | | 0.01 | | | | | 23,940 | | | | | 0.21 | (c) | | | | 0.76 | (c) | | | | 0.01 | (c) |
Year ended 12/31/14 | | | | 1.00 | | | | | 0.00 | | | | | 0.00 | | | | | 0.00 | | | | | (0.00 | ) | | | | 1.00 | | | | | 0.01 | | | | | 17,496 | | | | | 0.16 | | | | | 0.75 | | | | | 0.01 | |
Year ended 12/31/13 | | | | 1.00 | | | | | 0.00 | | | | | (0.00 | ) | | | | 0.00 | | | | | (0.00 | ) | | | | 1.00 | | | | | 0.03 | | | | | 15,883 | | | | | 0.16 | | | | | 0.95 | | | | | 0.03 | |
Year ended 12/31/12 | | | | 1.00 | | | | | 0.00 | | | | | 0.00 | | | | | 0.00 | | | | | (0.00 | ) | | | | 1.00 | | | | | 0.03 | | | | | 746 | | | | | 0.23 | | | | | 0.79 | | | | | 0.03 | |
Year ended 12/31/11 | | | | 1.00 | | | | | 0.00 | | | | | — | | | | | 0.00 | | | | | (0.00 | ) | | | | 1.00 | | | | | 0.05 | | | | | 1,022 | | | | | 0.17 | | | | | 0.82 | | | | | 0.05 | |
| (a) | Calculated using average shares outstanding. |
| (b) | Includes adjustments in accordance with accounting principles generally accepted in the United States of America. Total returns are not annualized for periods less than one year, if applicable and do not reflect charges assessed in connection with a variable product, which if included would reduce total returns. |
| (c) | Ratios are based on average daily net assets (000’s omitted) of $630,407 and $20,480 for Series I and Series II shares, respectively. |
NOTE 11–Significant Event
On September 17, 2015, the Board of Trustees approved changes to the Fund’s investment strategies that reposition the Fund as a government money market fund, including changing the Fund’s name to Invesco V.I. Government Money Market Fund. These approved changes were made in connection with the U.S. Securities and Exchange Commission amendments to Rule 2a-7 under the Investment Company Act of 1940, as amended, which governs money market funds and defines government money market funds. The Fund will change from a prime money market fund to a government money market fund. The Fund will invest at least 99.5% of its total assets in cash, government securities and repurchase agreements collateralized by cash or government securities. These changes are scheduled to take effect on or about April 29, 2016.
Invesco V.I. Money Market Fund
Report of Independent Registered Public Accounting Firm
To the Board of Trustees of AIM Variable Insurance Funds (Invesco Variable Insurance Funds)
and Shareholders of Invesco V.I. Money Market Fund:
In our opinion, the accompanying statement of assets and liabilities, including the schedule of investments, and the related statements of operations and of changes in net assets and the financial highlights present fairly, in all material respects, the financial position of Invesco V.I. Money Market Fund (one of the funds constituting AIM Variable Insurance Funds (Invesco Variable Insurance Funds), hereafter referred to as the “Fund”) at December 31, 2015, the results of its operations for the year then ended, the changes in its net assets for each of the two years in the period then ended and the financial highlights for each of the five years in the period then ended, in conformity with accounting principles generally accepted in the United States of America. These financial statements and financial highlights (hereafter referred to as “financial statements”) are the responsibility of the Fund’s management. Our responsibility is to express an opinion on these financial statements based on our audits. We conducted our audits of these financial statements in accordance with the standards of the Public Company Accounting Oversight Board (United States). Those standards require that we plan and perform the audit to obtain reasonable assurance about whether the financial statements are free of material misstatement. An audit includes examining, on a test basis, evidence supporting the amounts and disclosures in the financial statements, assessing the accounting principles used and significant estimates made by management, and evaluating the overall financial statement presentation. We believe that our audits, which included confirmation of securities at December 31, 2015 by correspondence with the custodian and brokers, provide a reasonable basis for our opinion.
PRICEWATERHOUSECOOPERS LLP
Houston, Texas
February 15, 2016
Invesco V.I. Money Market Fund
Calculating your ongoing Fund expenses
Example
As a shareholder of the Fund, you incur ongoing costs, including management fees; distribution and/or service fees (12b-1); and other Fund expenses. This example is intended to help you understand your ongoing costs (in dollars) of investing in the Fund and to compare these costs with ongoing costs of investing in other mutual funds. The example is based on an investment of $1,000 invested at the beginning of the period and held for the entire period July 1, 2015 through December 31, 2015.
The actual and hypothetical expenses in the examples below do not represent the effect of any fees or other expenses assessed in connection with a variable product; if they did, the expenses shown would be higher while the ending account values shown would be lower.
Actual expenses
The table below provides information about actual account values and actual expenses. You may use the information in this table, together with the amount you invested, to estimate the expenses that you paid over the period. Simply divide your account value by $1,000 (for example, an $8,600 account value divided by $1,000 = 8.6), then multiply the result by the number in the table under the heading entitled “Actual Expenses Paid During Period” to estimate the expenses you paid on your account during this period.
Hypothetical example for comparison purposes
The table below also provides information about hypothetical account values and hypothetical expenses based on the Fund’s actual expense ratio and an assumed rate of return of 5% per year before expenses, which is not the Fund’s actual return.
The hypothetical account values and expenses may not be used to estimate the actual ending account balance or expenses you paid for the period. You may use this information to compare the ongoing costs of investing in the Fund and other funds. To do so, compare this 5% hypothetical example with the 5% hypothetical examples that appear in the shareholder reports of the other funds.
Please note that the expenses shown in the table are meant to highlight your ongoing costs. Therefore, the hypothetical information is useful in comparing ongoing costs, and will not help you determine the relative total costs of owning different funds.
| | | | | | | | | | | | | | | | | | | | | | | | |
| Class | | Beginning
Account Value
(07/01/15) | | | ACTUAL | | | HYPOTHETICAL (5% annual return before
expenses) | | | Annualized
Expense
Ratio | |
| | | Ending
Account Value
(12/31/15)1 | | | Expenses
Paid During
Period2 | | | Ending
Account Value
(12/31/15) | | | Expenses
Paid During
Period2 | | |
| Series I | | $ | 1,000.00 | | | $ | 1,000.10 | | | $ | 1.16 | | | $ | 1,024.05 | | | $ | 1.17 | | | | 0.23 | % |
| Series II | | | 1,000.00 | | | | 1,000.10 | | | | 1.16 | | | | 1,024.05 | | | | 1.17 | | | | 0.23 | |
| 1 | The actual ending account value is based on the actual total return of the Fund for the period July 1, 2015 through December 31, 2015, after actual expenses and will differ from the hypothetical ending account value which is based on the Fund’s expense ratio and a hypothetical annual return of 5% before expenses. |
| 2 | Expenses are equal to the Fund’s annualized expense ratio as indicated above multiplied by the average account value over the period, multiplied by 184/365 to reflect the most recent fiscal half year. |
Invesco V.I. Money Market Fund
Tax Information
Form 1099-DIV, Form 1042-S and other year–end tax information provide shareholders with actual calendar year amounts that should be included in their tax returns. Shareholders should consult their tax advisors.
The following distribution information is being provided as required by the Internal Revenue Code or to meet a specific state’s requirement.
The Fund designates the following amounts or, if subsequently determined to be different, the maximum amount allowable for its fiscal year ended December 31, 2015:
| | | | |
Federal and State Income Tax | |
Corporate Dividends Received Deduction* | | | 0.00 | % |
U.S. Treasury Obligations* | | | 0.00 | % |
| | * | The above percentages are based on ordinary income dividends paid to shareholders during the Fund’s fiscal year. |
Invesco V.I. Money Market Fund
Trustees and Officers
The address of each trustee and officer is AIM Variable Insurance Funds (Invesco Variable Insurance Funds) (the “Trust”), 11 Greenway Plaza, Suite 1000, Houston, Texas 77046-1173. The trustees serve for the life of the Trust, subject to their earlier death, incapacitation, resignation, retirement or removal as more specifically provided in the Trust’s organizational documents. Each officer serves for a one year term or until their successors are elected and qualified. Column two below includes length of time served with predecessor entities, if any.
| | | | | | | | |
Name, Year of Birth and
Position(s) Held with the Trust | | Trustee and/
or Officer Since | | Principal Occupation(s)
During Past 5 Years | | Number of Funds in Fund Complex Overseen by Trustee | | Other Directorship(s) Held by Trustee During Past 5 Years |
| Interested Persons | | | | | | | | |
| Martin L. Flanagan1 — 1960 Trustee | | 2007 | | Executive Director, Chief Executive Officer and President, Invesco Ltd. (ultimate parent of Invesco and a global investment management firm); Advisor to the Board, Invesco Advisers, Inc. (formerly known as Invesco Institutional (N.A.), Inc.); Trustee, The Invesco Funds; Vice Chair, Investment Company Institute; and Member of Executive Board, SMU Cox School of Business Formerly: Chairman and Chief Executive Officer, Invesco Advisers, Inc. (registered investment adviser); Director, Chairman, Chief Executive Officer and President, IVZ Inc. (holding company), INVESCO Group Services, Inc. (service provider) and Invesco North American Holdings, Inc. (holding company); Director, Chief Executive Officer and President, Invesco Holding Company Limited (parent of Invesco and a global investment management firm); Director, Invesco Ltd.; Chairman, Investment Company Institute and President, Co-Chief Executive Officer, Co-President, Chief Operating Officer and Chief Financial Officer, Franklin Resources, Inc. (global investment management organization) | | 146 | | None |
Philip A. Taylor2 — 1954 Trustee, President and Principal Executive Officer | | 2006 | | Head of North American Retail and Senior Managing Director, Invesco Ltd.; Director, Co-Chairman, Co-President and Co-Chief Executive Officer, Invesco Advisers, Inc. (formerly known as Invesco Institutional (N.A.), Inc.) (registered investment adviser); Director, Chairman, Chief Executive Officer and President, Invesco Management Group, Inc. (formerly known as Invesco Aim Management Group, Inc.) (financial services holding company); Director and Chairman, Invesco Investment Services, Inc. (formerly known as Invesco Aim Investment Services, Inc.) (registered transfer agent) Chief Executive Officer, Invesco Corporate Class Inc. (corporate mutual fund company) Director, Chairman and Chief Executive Officer, Invesco Canada Ltd. (formerly known as Invesco Trimark Ltd./Invesco Trimark Ltèe) (registered investment adviser and registered transfer agent); Trustee, President and Principal Executive Officer, The Invesco Funds (other than AIM Treasurer’s Series Trust (Invesco Treasurer’s Series Trust), Short-Term Investments Trust and Invesco Management Trust); Trustee and Executive Vice President, The Invesco Funds (AIM Treasurer’s Series Trust (Invesco Treasurer’s Series Trust), Short-Term Investments Trust and Invesco Management Trust only); Director, Invesco Investment Advisers LLC (formerly known as Van Kampen Asset Management); Director, Chief Executive Officer and President, Van Kampen Exchange Corp. Formerly: Director and President, INVESCO Funds Group, Inc. (registered investment adviser and registered transfer agent); Director and Chairman, IVZ Distributors, Inc. (formerly known as INVESCO Distributors, Inc.) (registered broker dealer); Director, President and Chairman, Invesco Inc. (holding company), Invesco Canada Holdings Inc. (holding company), Trimark Investments Ltd./Placements Trimark Ltèe and Invesco Financial Services Ltd/Services Financiers Invesco Ltèe; Chief Executive Officer, Invesco Canada Fund Inc (corporate mutual fund company); Director and Chairman, Van Kampen Investor Services Inc.; Director, Chief Executive Officer and President, 1371 Preferred Inc. (holding company) and Van Kampen Investments Inc.; Director and President, AIM GP Canada Inc. (general partner for limited partnerships) and Van Kampen Advisors, Inc.; Director and Chief Executive Officer, Invesco Trimark Dealer Inc. (registered broker dealer); Director, Invesco Distributors, Inc. (formerly known as Invesco Aim Distributors, Inc.) (registered broker dealer); Manager, Invesco PowerShares Capital Management LLC; Director, Chief Executive Officer and President, Invesco Advisers, Inc.; Director, Chairman, Chief Executive Officer and President, Invesco Aim Capital Management, Inc.; President, Invesco Trimark Dealer Inc. and Invesco Trimark Ltd./Invesco Trimark Ltèe; Director and President, AIM Trimark Corporate Class Inc. and AIM Trimark Canada Fund Inc.; Senior Managing Director, Invesco Holding Company Limited; Director and Chairman, Fund Management Company (former registered broker dealer); President and Principal Executive Officer, The Invesco Funds (AIM Treasurer’s Series Trust (Invesco Treasurer’s Series Trust), and Short-Term Investments Trust only); President, AIM Trimark Global Fund Inc. and AIM Trimark Canada Fund Inc | | 146 | | None |
| 1 | Mr. Flanagan is considered an interested person (within the meaning of Section 2(a)(19) of the 1940 Act) of the Trust because he is an officer of the Adviser to the Trust, and an officer and a director of Invesco Ltd., ultimate parent of the Adviser. |
| 2 | Mr. Taylor is considered an interested person (within the meaning of Section 2(a)(19) of the 1940 Act) of the Trust because he is an officer and a director of the Adviser. |
Invesco V.I. Money Market Fund
Trustees and Officers—(continued)
| | | | | | | | |
Name, Year of Birth and
Position(s) Held with the Trust | | Trustee and/
or Officer Since | | Principal Occupation(s)
During Past 5 Years | | Number of Funds in Fund Complex Overseen by Trustee | | Other Directorship(s)
Held by Trustee During Past 5 Years |
| Independent Trustees | | | | | | | | |
Bruce L. Crockett — 1944 Trustee and Chair | | 2003 | | Chairman, Crockett Technologies Associates (technology consulting company) Formerly: Director, Captaris (unified messaging provider); Director, President and Chief Executive Officer, COMSAT Corporation; Chairman, Board of Governors of INTELSAT (international communications company); ACE Limited (insurance company); Independent Directors Council and Investment Company Institute | | 146 | | ALPS (Attorneys Liability Protection Society) (insurance company) and Globe Specialty Metals, Inc. (metallurgical company) |
David C. Arch — 1945 Trustee | | 2010 | | Chairman of Blistex Inc., a consumer health care products manufacturer | | 146 | | Board member of the Illinois Manufacturers’ Association; Member of the Board of Visitors, Institute for the Humanities, University of Michigan |
James T. Bunch — 1942 Trustee | | 2000 | | Managing Member, Grumman Hill Group LLC (family office/private equity investments) Formerly: Chairman of the Board of Trustees, Evans Scholars Foundation and Chairman, Board of Governors, Western Golf Association | | 146 | | Trustee, Evans Scholars Foundation; and Chairman of the Board, Denver Film Society |
Albert R. Dowden — 1941 Trustee | | 2003 | | Director of a number of public and private business corporations, including the Boss Group, Ltd. (private investment and management); Nature’s Sunshine Products, Inc. and Reich & Tang Funds (5 portfolios) (registered investment company) Formerly: Director, Homeowners of America Holding Corporation/Homeowners of America Insurance Company (property casualty company); Director, Continental Energy Services, LLC (oil and gas pipeline service); Director, CompuDyne Corporation (provider of product and services to the public security market) and Director, Annuity and Life Re (Holdings), Ltd. (reinsurance company); Director, President and Chief Executive Officer, Volvo Group North America, Inc.; Senior Vice President, AB Volvo; Director of various public and private corporations; Chairman, DHJ Media, Inc.; Director, Magellan Insurance Company; and Director, The Hertz Corporation, Genmar Corporation (boat manufacturer), National Media Corporation; Advisory Board of Rotary Power International (designer, manufacturer, and seller of rotary power engines); and Chairman, Cortland Trust, Inc. (registered investment company) | | 146 | | Director of: Nature’s Sunshine Products, Inc., Reich & Tang Funds, Homeowners of America Holding Corporation/ Homeowners of America Insurance Company, the Boss Group |
Jack M. Fields — 1952 Trustee | | 2003 | | Chief Executive Officer, Twenty First Century Group, Inc. (government affairs company); Owner and Chief Executive Officer, Dos Angeles Ranch, L.P. (cattle, hunting, corporate entertainment); and Discovery Global Education Fund (non-profit) Formerly: Chief Executive Officer, Texana Timber LP (sustainable forestry company); Director of Cross Timbers Quail Research Ranch (non-profit); and member of the U.S. House of Representatives | | 146 | | Insperity, Inc. (formerly known as Administaff) |
Eli Jones — Trustee | | 2016 | | Professor and Dean, Mays Business School, Texas A&M University Formerly: Professor and Dean, Walton College of Business, University of Arkansas, and E.J. Ourso College of Business, Louisiana State University | | 146 | | Director, Insperity, Inc., (2011-present) and ARVEST Bank (2012-2015) |
Prema Mathai-Davis — 1950 Trustee | | 2003 | | Retired. Formerly: Chief Executive Officer, YWCA of the U.S.A. | | 146 | | None |
Larry Soll — 1942 Trustee | | 1997 | | Retired. Formerly: Chairman, Chief Executive Officer and President, Synergen Corp. (a biotechnology company) | | 146 | | None |
Robert C. Troccoli — Trustee | | 2016 | | Retired. Formerly: Senior Partner, KPMG LLP | | 146 | | None |
Raymond Stickel, Jr. — 1944 Trustee | | 2005 | | Retired. Formerly: Director, Mainstay VP Series Funds, Inc. (25 portfolios) and Partner, Deloitte & Touche | | 146 | | None |
Suzanne H. Woolsey — 1941 Trustee | | 2014 | | Chief Executive Officer of Woolsey Partners LLC | | 146 | | Emeritus Chair of the Board of Trustees of the Institute for Defense Analyses; Trustee of Colorado College; Trustee of California Institute of Technology; Prior to 2014, Director of Fluor Corp.; Prior to 2010, Trustee of the German Marshall Fund of the United States; Prior to 2010 Trustee of the Rocky Mountain Institute |
Invesco V.I. Money Market Fund
Trustees and Officers—(continued)
| | | | | | | | |
Name, Year of Birth and
Position(s) Held with the Trust | | Trustee and/
or Officer Since | | Principal Occupation(s)
During Past 5 Years | | Number of Funds in Fund Complex Overseen by Trustee | | Other Directorship(s)
Held by Trustee During Past 5 Years |
| Other Officers | | | | | | | | |
Russell C. Burk — 1958 Senior Vice President and Senior Officer | | 2005 | | Senior Vice President and Senior Officer, The Invesco Funds | | N/A | | N/A |
John M. Zerr — 1962 Senior Vice President, Chief Legal Officer and Secretary | | 2006 | | Director, Senior Vice President, Secretary and General Counsel, Invesco Management Group, Inc. (formerly known as Invesco Aim Management Group, Inc.) and Van Kampen Exchange Corp.; Senior Vice President, Invesco Advisers, Inc. (formerly known as Invesco Institutional (N.A.), Inc.) (registered investment adviser); Senior Vice President and Secretary, Invesco Distributors, Inc. (formerly known as Invesco Aim Distributors, Inc.); Director, Vice President and Secretary, Invesco Investment Services, Inc. (formerly known as Invesco Aim Investment Services, Inc.); Senior Vice President, Chief Legal Officer and Secretary, The Invesco Funds; Managing Director, Invesco PowerShares Capital Management LLC; Director, Secretary and General Counsel, Invesco Investment Advisers LLC (formerly known as Van Kampen Asset Management); Secretary and General Counsel, Invesco Capital Markets, Inc. (formerly known as Van Kampen Funds Inc.) and Chief Legal Officer, PowerShares Exchange-Traded Fund Trust, PowerShares Exchange-Traded Fund Trust II, PowerShares India Exchange-Traded Fund Trust, PowerShares Actively Managed Exchange-Traded Fund Trust, and PowerShares Actively Managed Exchange-Traded Commodity Fund Trust Formerly: Director, Vice President and Secretary, IVZ Distributors, Inc. (formerly known as INVESCO distributors, Inc.); Director and Vice President, INVESCO Funds Group, Inc.; Director and Vice President, Van Kampen Advisors Inc.; Director, Vice President, Secretary and General Counsel, Van Kampen Investor Services Inc.; Director, Invesco Distributors, Inc. (formerly known as Invesco Aim Distributors, Inc.); Director, Senior Vice President, General Counsel and Secretary, Invesco Aim Advisers, Inc. and Van Kampen Investments Inc.; Director, Vice President and Secretary, Fund Management Company; Director, Senior Vice President, Secretary, General Counsel and Vice President, Invesco Aim Capital Management, Inc.; Chief Operating Officer and General Counsel, Liberty Ridge Capital, Inc. (an investment adviser); Vice President and Secretary, PBHG Funds (an investment company) and PBHG Insurance Series Fund (an investment company); Chief Operating Officer, General Counsel and Secretary, Old Mutual Investment Partners (a broker-dealer); General Counsel and Secretary, Old Mutual Fund Services (an administrator) and Old Mutual Shareholder Services (a shareholder servicing center); Executive Vice President, General Counsel and Secretary, Old Mutual Capital, Inc. (an investment adviser); and Vice President and Secretary, Old Mutual Advisors Funds (an investment company) | | N/A | | N/A |
Sheri Morris — 1964 Vice President, Treasurer and Principal Financial Officer | | 2003 | | Vice President, Treasurer and Principal Financial Officer, The Invesco Funds; Vice President, Invesco Advisers, Inc. (formerly known as Invesco Institutional (N.A.), Inc.) (registered investment adviser); and Vice President, PowerShares Exchange-Traded Fund Trust, PowerShares Exchange-Traded Fund Trust II, PowerShares India Exchange-Traded Fund Trust, PowerShares Actively Managed Exchange-Traded Fund Trust, and PowerShares Actively Managed Exchange-Traded Commodity Fund Trust Formerly: Vice President, Invesco Aim Advisers, Inc., Invesco Aim Capital Management, Inc. and Invesco Aim Private Asset Management, Inc.; Assistant Vice President and Assistant Treasurer, The Invesco Funds and Assistant Vice President, Invesco Advisers, Inc., Invesco Aim Capital Management, Inc. and Invesco Aim Private Asset Management, Inc.; and Treasurer, PowerShares Exchange-Traded Fund Trust, PowerShares Exchange-Traded Fund Trust II, PowerShares India Exchange-Traded Fund Trust and PowerShares Actively Managed Exchange-Traded Fund Trust | | N/A | | N/A |
Invesco V.I. Money Market Fund
Trustees and Officers—(continued)
| | | | | | | | |
Name, Year of Birth and
Position(s) Held with the Trust | | Trustee and/
or Officer Since | | Principal Occupation(s)
During Past 5 Years | | Number of Funds in Fund Complex Overseen by Trustee | | Other Directorship(s)
Held by Trustee During Past 5 Years |
| Other Officers—(continued) | | | | | | | | |
Karen Dunn Kelley — 1960 Vice President | | 2003 | | Senior Managing Director, Investments, Invesco Ltd.; Director, Co-President, Co-Chief Executive Officer, and Co-Chairman, Invesco Advisers, Inc. (formerly known as Invesco Institutional (N.A.), Inc.) (registered investment adviser); Chairman, Invesco Senior Secured Management, Inc.; Senior Vice President, Invesco Management Group, Inc. (formerly known as Invesco Aim Management Group, Inc.); Executive Vice President, Invesco Distributors, Inc. (formerly known as Invesco Aim Distributors, Inc.); Director, Invesco Mortgage Capital Inc. and Invesco Management Company Limited; Vice President, The Invesco Funds (other than AIM Treasurer’s Series Trust (Invesco Treasurer’s Series Trust), Short-Term Investments Trust and Invesco Management Trust); and President and Principal Executive Officer, The Invesco Funds (AIM Treasurer’s Series Trust (Invesco Treasurer’s Series Trust), Short-Term Investments Trust and Invesco Management Trust only) Formerly: Director and President, INVESCO Asset Management (Bermuda) Ltd., Director, INVESCO Global Asset Management Limited and INVESCO Management S.A.; Senior Vice President, Van Kampen Investments Inc. and Invesco Advisers, Inc. (formerly known as Invesco Institutional (N.A.), Inc.) (registered investment adviser); Vice President, Invesco Advisers, Inc. (formerly known as Invesco Institutional (N.A.), Inc.); Director of Cash Management and Senior Vice President, Invesco Advisers, Inc. and Invesco Aim Capital Management, Inc.; Director and President, Fund Management Company; Chief Cash Management Officer, Director of Cash Management, Senior Vice President, and Managing Director, Invesco Aim Capital Management, Inc.; Director of Cash Management, Senior Vice President, and Vice President, Invesco Advisers, Inc. and The Invesco Funds (AIM Treasurer’s Series Trust (Invesco Treasurer’s Series Trust), and Short-Term Investments Trust only) | | N/A | | N/A |
Crissie M. Wisdom — 1969 Anti-Money Laundering Compliance Officer | | 2013 | | Anti-Money Laundering Compliance Officer, Invesco Advisers, Inc. (formerly known as Invesco Institutional (N.A.), Inc.) (registered investment adviser), Invesco Capital Markets, Inc. (formerly known as Van Kampen Funds Inc.), Invesco Distributors, Inc., Invesco Investment Services, Inc., Invesco Management Group, Inc., Van Kampen Exchange Corp., The Invesco Funds, and PowerShares Exchange-Traded Fund Trust, PowerShares Exchange-Traded Fund Trust II, PowerShares India Exchange-Traded Fund Trust, PowerShares Actively Managed Exchange-Traded Fund Trust and PowerShares Actively Managed Exchange-Traded Commodity Fund Trust; Anti-Money Laundering Compliance Officer and Bank Secrecy Act Officer, INVESCO National Trust Company and Invesco Trust Company; and Fraud Prevention Manager and Controls and Risk Analysis Manager for Invesco Investment Services, Inc. | | N/A | | N/A |
Lisa O. Brinkley — 1959 Chief Compliance Officer | | 2015 | | Senior Vice President and Chief Compliance Officer, Invesco Advisers, Inc. (registered investment adviser) (formerly known as Invesco Institutional (N.A., Inc.); and Chief Compliance Officer, The Invesco Funds Formerly: Global Assurance Officer, Invesco Ltd. and Vice President, The Invesco Funds; Chief Compliance Officer, Invesco Distributors, Inc. (formerly known as Invesco Aim Distributors, Inc.), Invesco Investment Services, Inc.(formerly known as Invesco Aim Investment Services, Inc.) and Van Kampen Investor Services Inc.; Senior Vice President, Invesco Management Group, Inc.; Senior Vice President and Chief Compliance Officer, Invesco Advisers, Inc. and The Invesco Funds; Vice President and Chief Compliance Officer, Invesco Aim Capital Management, Inc. and Invesco Distributors, Inc.; Vice President, Invesco Investment Services, Inc. and Fund Management Company | | N/A | | N/A |
The Statement of Additional Information of the Trust includes additional information about the Fund’s Trustees and is available upon request, without charge, by calling 1.800.959.4246. Please refer to the Fund’s prospectus for information on the Fund’s sub-advisers.
| | | | | | |
Office of the Fund 11 Greenway Plaza, Suite 1000 Houston, TX 77046-1173 | | Investment Adviser Invesco Advisers, Inc. 1555 Peachtree Street, N.E. Atlanta, GA 30309 | | Distributor Invesco Distributors, Inc. 11 Greenway Plaza, Suite 1000 Houston, TX 77046-1173 | | Auditors PricewaterhouseCoopers LLP 1000 Louisiana Street, Suite 5800 Houston, TX 77002-5678 |
| | | |
| | | | | | |
Counsel to the Fund Stradley Ronon Stevens & Young, LLP 2005 Market Street, Suite 2600 Philadelphia, PA 19103-7018 | | Counsel to the Independent Trustees Goodwin Procter LLP 901 New York Avenue, N.W. Washington, D.C. 20001 | | Transfer Agent Invesco Investment Services, Inc. 11 Greenway Plaza, Suite 1000 Houston, TX 77046-1173 | | Custodian State Street Bank and Trust Company 225 Franklin Street Boston, MA 02110-2801 |
Invesco V.I. Money Market Fund
| | | | |
| | |

| | Annual Report to Shareholders | | December 31, 2015 |
| | |
| | Invesco V.I. S&P 500 Index Fund |

| | |
| | The Fund provides a complete list of its holdings four times in each fiscal year, at the quarter-ends. For the second and fourth quarters, the lists appear in the Fund’s semiannual and annual reports to shareholders. For the first and third quarters, the Fund files the lists with the Securities and Exchange Commission (SEC) on Form N-Q. The Fund’s Form N-Q filings are available on the SEC website, sec.gov. Copies of the Fund’s Forms N-Q may be reviewed and copied at the SEC Public Reference Room in Washington, D.C. You can obtain information on the operation of the Public Reference Room, including information about duplicating fee charges, by calling 202 551 8090 or 800 732 0330, or by electronic request at the following email address: publicinfo@sec.gov. The SEC file numbers for the Fund are 811-07452 and 033-57340. The Fund’s most recent portfolio holdings, as filed on Form N-Q, have also been made available to insurance companies issuing variable annuity contracts and variable life insurance policies (“variable products”) that invest in the Fund. A description of the policies and procedures that the Fund uses to determine how to vote proxies relating to portfolio securities is available without charge, upon request, from our Client Services department at 800 959 4246 or at invesco.com/proxyguidelines. The information is also available on the SEC website, sec.gov. Information regarding how the Fund voted proxies related to its portfolio securities during the most recent 12-month period ended June 30 is available at invesco.com/ proxysearch. The information is also available on the SEC website, sec.gov. Invesco Advisers, Inc. is an investment adviser; it provides investment advisory services to individual and institutional clients and does not sell securities. Invesco Distributors, Inc. is the US distributor for Invesco Ltd.’s retail mutual funds, exchange-traded funds and institutional money market funds. Both are wholly owned, indirect subsidiaries of Invesco Ltd. This report must be accompanied or preceded by a currently effective Fund prospectus and variable product prospectus, which contain more complete information, including sales charges and expenses. Investors should read each carefully before investing. Invesco Distributors, Inc. MS-VISPI-AR-1 NOT FDIC INSURED | MAY LOSE VALUE | NO BANK GUARANTEE |
Management’s Discussion of Fund Performance
Performance summary
For the year ended December 31, 2015, Series I shares of Invesco V.I. S&P 500 Index Fund (the Fund) underperformed the Fund’s broad market/style-specific index, the S&P 500 Index.
Your Fund’s long-term performance appears later in this report.
Fund vs. Indexes
Total returns, 12/31/14 to 12/31/15, excluding variable product issuer charges.
If variable product issuer charges were included, returns would be lower.
| | | | | |
| Series I Shares | | | | 1.03 | % |
| Series II Shares | | | | 0.78 | |
| S&P 500 Index▼ (Broad Market/Style-Specific Index) | | | | 1.38 | |
| Lipper VUF S&P 500 Funds Indexn (Peer Group Index) | | | | 1.08 | |
Source(s): ▼FactSet Research Systems Inc., nLipper Inc.
Market conditions and your Fund
The US economy continued its modest, but steady growth, during the year ended December 31, 2015 – although the health of individual economic sectors varied dramatically. The headline economic story was a steady decline in already-battered energy markets, as oil prices plummeted when increased supply overwhelmed demand. This decline particularly affected companies with US-based offshore or shale-based resources – companies whose cost to recover oil is higher than many traditional producers. On the other end of the spectrum, the improved position of the US consumer was the more subtle story which drove the US economy forward during the year.
As the year began, economic growth appeared to be stronger in the US than in the rest of the world. US equity markets were recovering from the crash of oil prices initiated by OPEC’s decision to maintain high production despite low prices and slowing global growth. The view that the US Federal Reserve (the Fed) would begin raising rates while other central banks were loosening monetary
policy led the US dollar to strengthen against many currencies. This hurt commodity- and materials-based economies – and companies in related sectors. Additionally, US-based multinational companies faced foreign exchange headwinds. Low interest rates, the increasing availability of credit and an improving employment picture all contributed to higher consumer confidence and consumer spending, which drove US equity markets higher, particularly through the spring, and helped overcome fears that Greece and the eurozone would fail to reach an agreement on a financial bailout plan.
In the summer of 2015, US equity markets moved sharply lower. A significant downturn in China’s financial markets and weak global economic growth led the Fed to delay raising interest rates; this, in turn, increased investor uncertainty and market volatility. A continued decline in oil prices also contributed to market volatility. In the fall, however, US markets rallied, the Fed saw enough economic stabilization to finally raise interest rates, and most major US market indexes ended the year barely in positive territory.
Invesco V.I. S&P 500 Index Fund invests in stocks in approximately the same proportion as they are represented in the S&P 500 Index. During the reporting period, the sectors that contributed the most to overall Fund performance were consumer discretionary and Information technology. The energy, financials and materials sectors detracted the most from Fund performance.
Consumer discretionary holdings were some of the largest contributors to the Fund’s performance during the reporting period. Within this sector, Amazon.com posted earnings high above analyst estimates toward the end of the year due to the company’s growing streaming business.
Microsoft was also a top contributor for the year. Microsoft announced increased earnings growth during its fiscal year. The growth was a result of its profitable cloud computing business and the successful launch of Windows 10.
Alphabet, formerly Google, also contributed to Fund results over the reporting period. The firm added to absolute Fund performance due to impressive earnings results throughout the year.
Many Fund holdings in the energy sector struggled due to the decrease in oil prices from oversupply during the year. Three of the top detractors in this sector were Exxon Mobil, Kinder Morgan and Chevron.
Another top detractor from Fund performance was Qualcomm. The telecommunications company faced increased competition when two of its competitors, Broadcom and Avago Technologies, merged.
Please note, the Fund’s strategy is principally implemented through equity investments, but may also use S&P 500
| | | | | |
| Portfolio Composition |
| By sector | | | | % of total net assets | |
| | | | | |
| |
| Information Technology | | | | 20.0 | % |
| Financials | | | | 16.0 | |
| Health Care | | | | 14.7 | |
| Consumer Discretionary | | | | 12.5 | |
| Consumer Staples | | | | 9.7 | |
| Industrials | | | | 9.7 | |
| Energy | | | | 6.3 | |
| Utilities | | | | 2.9 | |
| Materials | | | | 2.7 | |
| Telecommunication Services | | | | 2.3 | |
| Money Market Funds | | | | | |
Plus Other Assets Less Liabilities | | | | 3.2 | |
| | |
| Top 10 Equity Holdings* |
| | % of total net assets |
| | | | | | | |
| | |
| 1. | | Apple Inc. | | | | 3.2 | % |
| 2. | | Microsoft Corp. | | | | 2.4 | |
| 3. | | Exxon Mobil Corp. | | | | 1.8 | |
| 4. | | General Electric Co. | | | | 1.6 | |
| 5. | | Johnson & Johnson | | | | 1.5 | |
| 6. | | Amazon.com, Inc. | | | | 1.4 | |
| 7. | | Wells Fargo & Co. | | | | 1.4 | |
| 8. | | Berkshire Hathaway Inc.-Class B | | | | 1.3 | |
| 9. | | JPMorgan Chase & Co. | | | | 1.3 | |
| 10. | | Facebook Inc.-Class A | | | | 1.3 | |
| | | | | | | |
Total Net Assets | | | $ | 93.9 million | |
Total Number of Holdings* | | | | 505 | |
The Fund’s holdings are subject to change, and there is no assurance that the Fund will continue to hold any particular security.
*Excluding money market fund holdings.
Data presented here are as of December 31, 2015.
Invesco V.I. S&P 500 Index Fund
futures contracts, a derivative instrument, to gain exposure to the equity market. During the reporting period, the Fund invested in S&P 500 futures contracts, which generated a negative return and was a slight detractor from Fund performance. Derivatives can be a cost-effective way to gain exposure to asset classes. However, derivatives may amplify traditional investment risks through the creation of leverage and may be less liquid than traditional securities.
We welcome new investors who joined the Fund during the year and thank all of our shareholders for your investment in Invesco V.I. S&P 500 Index Fund.
The views and opinions expressed in management’s discussion of Fund performance are those of Invesco Advisers, Inc. These views and opinions are subject to change at any time based on factors such as market and economic conditions. These views and opinions may not be relied upon as investment advice or recommendations, or as an offer for a particular security. The information is not a complete analysis of every aspect of any market, country, industry, security or the Fund. Statements of fact are from sources considered reliable, but Invesco Advisers, Inc. makes no representation or warranty as to their completeness or accuracy. Although historical performance is no guarantee of future results, these insights may help you understand our investment management philosophy.
See important Fund and, if applicable, index disclosures later in this report.
| | |
 | | Anthony Munchak Chartered Financial Analyst, Portfolio Manager, is manager of Invesco V.I. S&P 500 |
Index Fund. He joined Invesco in 2000. Mr. Munchak earned a BS and an MS in finance from Boston College and an MBA from Bentley College. |
| |

| | Glen Murphy Chartered Financial Analyst, Portfolio Manager, is manager of Invesco V.I. S&P 500 |
Index Fund. He joined Invesco in 1995. Mr. Murphy earned a BA in business administration from the University of Massachusetts Amherst and an MS in finance from Boston College. |
| |

| | Francis Orlando Chartered Financial Analyst, Portfolio Manager, is manager of Invesco V.I. S&P 500 |
Index Fund. He joined Invesco in 1987. Mr. Orlando earned a BA in business administration from Merrimack College and an MBA from Boston University. |
| |

| | Daniel Tsai Chartered Financial Analyst, Portfolio Manager, is manager of Invesco V.I. S&P 500 |
Index Fund. He joined Invesco in 2000. Mr. Tsai earned a BS in mechanical engineering from National Taiwan University, an MS in mechanical engineering from the University of Michigan and an MS in computer science from Wayne State University. |
| |

| | Anne Unflat Portfolio Manager, is manager of Invesco V.I. S&P 500 Index Fund. She joined Invesco in |
1988. Ms. Unflat earned a BA in economics from Queens College and an MBA in finance from St. John’s University. |
Invesco V.I. S&P 500 Index Fund
Your Fund’s Long-Term Performance
Results of a $10,000 Investment – Oldest Share Class(es)
Fund and index data from 12/31/05
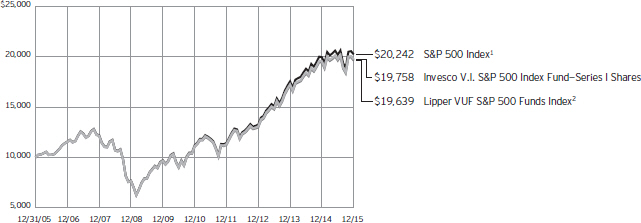
| 1 | Source: FactSet Research Systems Inc. |
Past performance cannot guarantee
comparable future results.
| | | | | |
| Average Annual Total Returns |
As of 12/31/15 | | | | | |
| |
| Series I Shares | | | | | |
| Inception (5/18/98) | | | | 5.17 | % |
| 10 Years | | | | 7.05 | |
| 5 Years | | | | 12.21 | |
| 1 Year | | | | 1.03 | |
| |
| Series II Shares | | | | | |
| Inception (6/5/00) | | | | 3.57 | % |
| 10 Years | | | | 6.77 | |
| 5 Years | | | | 11.92 | |
| 1 Year | | | | 0.78 | |
Effective June 1, 2010, Class X and Class Y shares of the predecessor fund, Morgan Stanley Variable Investment S&P 500 Index Portfolio advised by Morgan Stanley Investment Advisors Inc. were reorganized into Series I and Series II shares, respectively, of Invesco V.I. S&P 500 Index Fund. Returns shown above for Series I and Series II shares are blended returns of the predecessor fund and Invesco V.I. S&P 500 Index Fund. Share class returns will differ from the predecessor fund because of different expenses.
The performance data quoted represent past performance and cannot guarantee comparable future results; current performance may be lower or higher. Please contact your variable product issuer or financial adviser for the most recent month-end variable product performance. Performance figures reflect Fund expenses, reinvested distributions and changes in net asset value. Investment return and principal value will fluctuate so that you may have a gain or loss when you sell shares.
The total annual Fund operating expense ratio set forth in the most recent Fund prospectus as of the date of this report for Series I and Series II shares was 0.41% and 0.66%, respectively. The expense ratios presented above may vary from the expense ratios presented in other sections of this report that are based on expenses incurred during the period covered by this report.
Invesco V.I. S&P 500 Index Fund, a series portfolio of AIM Variable Insurance Funds (Invesco Variable Insurance
Funds), is currently offered through insurance companies issuing variable products. You cannot purchase shares of the Fund directly. Performance figures given represent the Fund and are not intended to reflect actual variable product values. They do not reflect sales charges, expenses and fees assessed in connection with a variable product. Sales charges, expenses and fees, which are determined by the variable product issuers, will vary and will lower the total return.
The most recent month-end performance at the Fund level, excluding variable product charges, is available at 800 451 4246. As mentioned above, for the most recent month-end performance including variable product charges, please contact your variable product issuer or financial adviser.
Fund performance reflects any applicable fee waivers and/or expense reimbursements. Had the adviser not waived fees and/or reimbursed expenses currently or in the past, returns would have been lower. See current prospectus for more information.
Invesco V.I. S&P 500 Index Fund
Invesco V.I. S&P 500 Index Fund’s investment objective is to provide investment results that, before expenses, correspond to the total return (i.e., the combination of capital changes and income) of the Standard & Poor’s® 500 Composite Stock Price Index.
| n | | Unless otherwise stated, information presented in this report is as of December 31, 2015, and is based on total net assets. |
| n | | Unless otherwise noted, all data provided by Invesco. |
| n | | To access your Fund’s reports/prospectus, visit invesco.com/fundreports. |
Principal risks of investing in the Fund
Depositary receipts risk. Depositary receipts involve many of the same risks as those associated with direct investment in foreign securities. In addition, the underlying issuers of certain depositary receipts, particularly unsponsored or unregistered depositary receipts, are under no obligation to distribute shareholder communications to the holders of such receipts or to pass through to them any voting rights with respect to the deposited securities.
Derivatives risk. The value of a derivative instrument depends largely on (and is derived from) the value of an underlying security, currency, commodity, interest rate, index or other asset (each referred to as an underlying asset). In addition to risks relating to the underlying assets, the use of derivatives may include other, possibly greater, risks, including counterparty, leverage and liquidity risks. Counterparty risk is the risk that the counterparty to the derivative contract will default on its obligation to pay the Fund the amount owed or otherwise perform under the derivative contract. Derivatives create leverage risk because they do not require payment up front equal to the economic exposure created by owning the derivative. As a result, an adverse change in the value of the underlying asset could result in the Fund sustaining a loss that is substantially greater than the amount invested in the derivative, which may make the Fund’s returns more volatile and increase the risk of loss. Derivative instruments may also be less liquid than more traditional investments and the Fund may be unable to sell or close out its derivative positions at a desirable time or price. This risk may be more acute under adverse market conditions, during which the Fund may be most in need of liquidating its derivative positions. Derivatives may also be harder to value, less tax efficient and subject to changing government regulation that could impact the Fund’s ability to use certain derivatives or their cost. Also, derivatives used for hedging or to gain or limit exposure to a particular market segment may not provide the expected benefits, particularly during adverse market conditions.
Developing/emerging markets securities risk. The prices of securities issued by foreign companies and governments located in developing/emerging markets countries may be affected more negatively by inflation, devaluation of their currencies, higher transaction costs, delays in settlement, adverse political developments, the introduction of capital controls, withholding taxes, nationalization of private assets, expropriation, social unrest, war or lack of timely information than those in developed countries.
Foreign securities risk. The Fund’s foreign investments may be affected by changes in a foreign country’s exchange rates, political and social instability, changes in economic or taxation policies, difficulties when enforcing obligations, decreased liquidity, and increased volatility. Foreign companies may be subject to less regulation resulting in less publicly available information about the companies.
Indexing risk. The Fund is operated as a passively managed index fund. As such, the adverse performance of a particular stock ordinarily will not result in the elimination of the stock from the Fund’s portfolio. The Fund will remain invested in common stocks even when stock prices are generally falling. Ordinarily, the Adviser will not sell the Fund’s portfolio securities except to reflect additions or deletions of the stocks that comprise the S&P 500 Index, or as may be necessary to raise cash to pay Fund shareholders who sell Fund shares. The Fund’s ability to correlate its performance, before expenses, with the S&P 500 Index may be affected by, among other things, changes in securities markets, the manner in which the S&P 500 Index is calculated and the timing of purchases and sales, and also depends to some extent on the size of the Fund’s portfolio, the size of cash flows into and out of the Fund and differences between how and when the Fund and the Index are valued.
Management risk. The investment techniques and risk analysis used by the Fund’s portfolio managers may not produce the desired results.
Market risk. The prices of and the income generated by the Fund’s securities may decline in response to, among other things, investor sentiment, general economic
and market conditions, regional or global instability, and currency and interest rate fluctuations.
About indexes used in this report
The S&P 500® Index is an unmanaged index considered representative of the US stock market.
The Lipper VUF S&P 500 Funds Index is an unmanaged index considered representative of S&P 500 variable insurance underlying funds tracked by Lipper.
A direct investment cannot be made in an index. Unless otherwise indicated, index results include reinvested dividends, and they do not reflect sales charges. Performance of the peer group, if applicable, reflects fund expenses; performance of a market index does not.
Other information
The returns shown in management’s discussion of Fund performance are based on net asset values calculated for shareholder transactions. Generally accepted accounting principles require adjustments to be made to the net assets of the Fund at period end for financial reporting purposes, and as such, the net asset values for shareholder transactions and the returns based on those net asset values may differ from the net asset values and returns reported in the Financial Highlights. Additionally, the returns and net asset values shown throughout this report are at the Fund level only and do not include variable product issuer charges. If such charges were included, the total returns would be lower.
Industry classifications used in this report are generally according to the Global Industry Classification Standard, which was developed by and is the exclusive property and a service mark of MSCI Inc. and Standard & Poor’s.
|
| Invesco V.I. S&P 500 Index Fund |
Schedule of Investments(a)
December 31, 2015
| | | | | | | | |
| | | Shares | | | Value | |
Common Stocks & Other Equity Interests–96.79% | |
| Advertising–0.15% | |
Interpublic Group of Cos., Inc. (The) | | | 2,061 | | | $ | 47,980 | |
Omnicom Group Inc. | | | 1,229 | | | | 92,986 | |
| | | | | | | | 140,966 | |
|
| Aerospace & Defense–2.62% | |
Boeing Co. (The) | | | 3,196 | | | | 462,110 | |
General Dynamics Corp. | | | 1,507 | | | | 207,002 | |
Honeywell International Inc. | | | 3,911 | | | | 405,062 | |
L-3 Communications Holdings, Inc. | | | 405 | | | | 48,402 | |
Lockheed Martin Corp. | | | 1,340 | | | | 290,981 | |
Northrop Grumman Corp. | | | 925 | | | | 174,649 | |
Precision Castparts Corp. | | | 695 | | | | 161,247 | |
Raytheon Co. | | | 1,527 | | | | 190,157 | |
Rockwell Collins, Inc. | | | 665 | | | | 61,379 | |
Textron Inc. | | | 1,396 | | | | 58,646 | |
United Technologies Corp. | | | 4,178 | | | | 401,380 | |
| | | | | | | | 2,461,015 | |
|
| Agricultural & Farm Machinery–0.13% | |
Deere & Co. | | | 1,572 | | | | 119,896 | |
|
| Agricultural Products–0.12% | |
Archer-Daniels-Midland Co. | | | 3,028 | | | | 111,067 | |
|
| Air Freight & Logistics–0.67% | |
C.H. Robinson Worldwide, Inc. | | | 715 | | | | 44,344 | |
Expeditors International of Washington, Inc. | | | 962 | | | | 43,386 | |
FedEx Corp. | | | 1,332 | | | | 198,455 | |
United Parcel Service, Inc.–Class B | | | 3,533 | | | | 339,981 | |
| | | | | | | | 626,166 | |
|
| Airlines–0.63% | |
American Airlines Group Inc. | | | 3,199 | | | | 135,478 | |
Delta Air Lines, Inc. | | | 3,991 | | | | 202,304 | |
Southwest Airlines Co. | | | 3,301 | | | | 142,141 | |
United Continental Holdings Inc.(b) | | | 1,904 | | | | 109,099 | |
| | | | | | | | 589,022 | |
|
| Alternative Carriers–0.08% | |
Level 3 Communications, Inc.(b) | | | 1,453 | | | | 78,985 | |
|
| Aluminum–0.07% | |
Alcoa Inc. | | | 6,693 | | | | 66,060 | |
|
| Apparel Retail–0.55% | |
Gap, Inc. (The) | | | 1,162 | | | | 28,701 | |
L Brands, Inc. | | | 1,295 | | | | 124,087 | |
Ross Stores, Inc. | | | 2,056 | | | | 110,633 | |
TJX Cos., Inc. (The) | | | 3,401 | | | | 241,165 | |
Urban Outfitters, Inc.(b) | | | 401 | | | | 9,123 | |
| | | | | | | | 513,709 | |
| | | | | | | | |
| | | Shares | | | Value | |
| Apparel, Accessories & Luxury Goods–0.42% | |
Coach, Inc. | | | 1,390 | | | $ | 45,495 | |
Fossil Group, Inc.(b) | | | 208 | | | | 7,604 | |
Hanesbrands, Inc. | | | 1,988 | | | | 58,507 | |
Michael Kors Holdings Ltd.(b) | | | 933 | | | | 37,376 | |
PVH Corp. | | | 416 | | | | 30,638 | |
Ralph Lauren Corp. | | | 301 | | | | 33,556 | |
Under Armour, Inc. –Class A(b) | | | 907 | | | | 73,113 | |
VF Corp. | | | 1,730 | | | | 107,693 | |
| | | | | | | | 393,982 | |
|
| Application Software–0.79% | |
Adobe Systems Inc.(b) | | | 2,532 | | | | 237,856 | |
Autodesk, Inc.(b) | | | 1,145 | | | | 69,765 | |
Citrix Systems, Inc.(b) | | | 780 | | | | 59,007 | |
Intuit Inc. | | | 1,339 | | | | 129,214 | |
salesforce.com, inc.(b) | | | 3,168 | | | | 248,371 | |
| | | | | | | | 744,213 | |
|
| Asset Management & Custody Banks–1.13% | |
Affiliated Managers Group, Inc.(b) | | | 275 | | | | 43,934 | |
Ameriprise Financial, Inc. | | | 883 | | | | 93,969 | |
Bank of New York Mellon Corp. (The) | | | 5,547 | | | | 228,648 | |
BlackRock, Inc. | | | 640 | | | | 217,933 | |
Franklin Resources, Inc. | | | 1,922 | | | | 70,768 | |
Invesco Ltd.(c) | | | 2,167 | | | | 72,551 | |
Legg Mason, Inc. | | | 553 | | | | 21,694 | |
Northern Trust Corp. | | | 1,103 | | | | 79,515 | |
State Street Corp. | | | 2,058 | | | | 136,569 | |
T. Rowe Price Group Inc. | | | 1,274 | | | | 91,078 | |
| | | | | | | | 1,056,659 | |
|
| Auto Parts & Equipment–0.32% | |
BorgWarner, Inc. | | | 1,138 | | | | 49,196 | |
Delphi Automotive PLC (United Kingdom) | | | 1,421 | | | | 121,822 | |
Johnson Controls, Inc. | | | 3,299 | | | | 130,278 | |
| | | | | | | | 301,296 | |
|
| Automobile Manufacturers–0.56% | |
Ford Motor Co. | | | 19,787 | | | | 278,799 | |
General Motors Co. | | | 7,171 | | | | 243,886 | |
| | | | | | | | 522,685 | |
|
| Automotive Retail–0.40% | |
Advance Auto Parts, Inc. | | | 368 | | | | 55,388 | |
AutoNation, Inc.(b) | | | 387 | | | | 23,088 | |
AutoZone, Inc.(b) | | | 155 | | | | 114,996 | |
CarMax, Inc.(b) | | | 1,028 | | | | 55,481 | |
O’Reilly Automotive, Inc.(b) | | | 501 | | | | 126,964 | |
| | | | | | | | 375,917 | |
|
| Biotechnology–3.59% | |
AbbVie Inc. | | | 8,299 | | | | 491,633 | |
Alexion Pharmaceuticals, Inc.(b) | | | 1,140 | | | | 217,455 | |
See accompanying Notes to Financial Statements which are an integral part of the financial statements.
Invesco V.I. S&P 500 Index Fund
| | | | | | | | |
| | | Shares | | | Value | |
| Biotechnology–(continued) | |
Amgen Inc. | | | 3,825 | | | $ | 620,912 | |
Baxalta Inc. | | | 2,738 | | | | 106,864 | |
Biogen Inc.(b) | | | 1,131 | | | | 346,482 | |
Celgene Corp.(b) | | | 3,988 | | | | 477,603 | |
Gilead Sciences, Inc. | | | 7,315 | | | | 740,205 | |
Regeneron Pharmaceuticals, Inc.(b) | | | 393 | | | | 213,348 | |
Vertex Pharmaceuticals Inc.(b) | | | 1,246 | | | | 156,784 | |
| | | | | | | | 3,371,286 | |
|
| Brewers–0.08% | |
Molson Coors Brewing Co.–Class B | | | 803 | | | | 75,418 | |
|
| Broadcasting–0.23% | |
CBS Corp.–Class B | | | 2,201 | | | | 103,733 | |
Discovery Communications, Inc.–Class A(b) | | | 750 | | | | 20,010 | |
Discovery Communications, Inc.–Class C(b) | | | 1,300 | | | | 32,786 | |
Scripps Networks Interactive Inc.–Class A | | | 489 | | | | 26,998 | |
TEGNA Inc. | | | 1,124 | | | | 28,684 | |
| | | | | | | | 212,211 | |
|
| Building Products–0.09% | |
Allegion PLC | | | 481 | | | | 31,707 | |
Masco Corp. | | | 1,726 | | | | 48,846 | |
| | | | | | | | 80,553 | |
|
| Cable & Satellite–1.07% | |
Cablevision Systems Corp.–Class A | | | 1,109 | | | | 35,377 | |
Comcast Corp.–Class A | | | 12,396 | | | | 699,506 | |
Time Warner Cable Inc. | | | 1,437 | | | | 266,693 | |
| | | | | | | | 1,001,576 | |
|
| Casinos & Gaming–0.03% | |
Wynn Resorts Ltd. | | | 420 | | | | 29,060 | |
|
| Coal & Consumable Fuels–0.01% | |
CONSOL Energy Inc. | | | 1,119 | | | | 8,840 | |
|
| Commodity Chemicals–0.17% | |
LyondellBasell Industries N.V.–Class A | | | 1,824 | | | | 158,506 | |
|
| Communications Equipment–1.36% | |
Cisco Systems, Inc. | | | 25,770 | | | | 699,784 | |
F5 Networks, Inc.(b) | | | 361 | | | | 35,003 | |
Harris Corp. | | | 631 | | | | 54,834 | |
Juniper Networks, Inc. | | | 1,801 | | | | 49,708 | |
Motorola Solutions, Inc. | | | 810 | | | | 55,444 | |
QUALCOMM, Inc. | | | 7,630 | | | | 381,385 | |
| | | | | | | | 1,276,158 | |
|
| Computer & Electronics Retail–0.07% | |
Best Buy Co., Inc. | | | 1,512 | | | | 46,040 | |
GameStop Corp.–Class A | | | 550 | | | | 15,422 | |
| | | | | | | | 61,462 | |
|
| Construction & Engineering–0.08% | |
Fluor Corp. | | | 730 | | | | 34,471 | |
Jacobs Engineering Group, Inc.(b) | | | 621 | | | | 26,051 | |
| | | | | | | | |
| | | Shares | | | Value | |
| Construction & Engineering–(continued) | |
Quanta Services, Inc.(b) | | | 810 | | | $ | 16,402 | |
| | | | | | | | 76,924 | |
|
| Construction Machinery & Heavy Trucks–0.38% | |
Caterpillar Inc. | | | 2,955 | | | | 200,822 | |
Cummins Inc. | | | 843 | | | | 74,192 | |
PACCAR Inc. | | | 1,785 | | | | 84,609 | |
| | | | | | | | 359,623 | |
|
| Construction Materials–0.12% | |
Martin Marietta Materials, Inc. | | | 337 | | | | 46,027 | |
Vulcan Materials Co. | | | 667 | | | | 63,345 | |
| | | | | | | | 109,372 | |
|
| Consumer Electronics–0.06% | |
Garmin Ltd. | | | 621 | | | | 23,082 | |
Harman International Industries, Inc. | | | 366 | | | | 34,481 | |
| | | | | | | | 57,563 | |
|
| Consumer Finance–0.81% | |
American Express Co. | | | 4,247 | | | | 295,379 | |
Capital One Financial Corp. | | | 2,700 | | | | 194,886 | |
Discover Financial Services | | | 2,170 | | | | 116,355 | |
Navient Corp. | | | 1,886 | | | | 21,595 | |
Synchrony Financial(b) | | | 4,205 | | | | 127,874 | |
| | | | | | | | 756,089 | |
|
| Data Processing & Outsourced Services–2.30% | |
Alliance Data Systems Corp.(b) | | | 312 | | | | 86,290 | |
Automatic Data Processing, Inc. | | | 2,349 | | | | 199,007 | |
Fidelity National Information Services, Inc. | | | 1,407 | | | | 85,264 | |
Fiserv, Inc.(b) | | | 1,159 | | | | 106,002 | |
MasterCard, Inc.–Class A | | | 5,034 | | | | 490,110 | |
Paychex, Inc. | | | 1,621 | | | | 85,735 | |
PayPal Holdings, Inc.(b) | | | 5,643 | | | | 204,277 | |
Total System Services, Inc. | | | 845 | | | | 42,081 | |
Visa Inc.–Class A | | | 9,880 | | | | 766,194 | |
Western Union Co. (The) | | | 2,556 | | | | 45,778 | |
Xerox Corp. | | | 4,830 | | | | 51,343 | |
| | | | | | | | 2,162,081 | |
|
| Department Stores–0.15% | |
Kohl’s Corp. | | | 963 | | | | 45,868 | |
Macy’s, Inc. | | | 1,595 | | | | 55,793 | |
Nordstrom, Inc. | | | 690 | | | | 34,369 | |
| | | | | | | | 136,030 | |
|
| Distillers & Vintners–0.19% | |
Brown-Forman Corp.–Class B | | | 515 | | | | 51,129 | |
Constellation Brands, Inc.–Class A | | | 878 | | | | 125,063 | |
| | | | | | | | 176,192 | |
|
| Distributors–0.07% | |
Genuine Parts Co. | | | 765 | | | | 65,706 | |
See accompanying Notes to Financial Statements which are an integral part of the financial statements.
Invesco V.I. S&P 500 Index Fund
| | | | | | | | |
| | | Shares | | | Value | |
| Diversified Banks–4.88% | |
Bank of America Corp. | | | 52,877 | | | $ | 889,920 | |
Citigroup Inc. | | | 15,123 | | | | 782,615 | |
Comerica Inc. | | | 895 | | | | 37,438 | |
JPMorgan Chase & Co. | | | 18,687 | | | | 1,233,903 | |
U.S. Bancorp | | | 8,351 | | | | 356,337 | |
Wells Fargo & Co. | | | 23,580 | | | | 1,281,809 | |
| | | | | | | | 4,582,022 | |
|
| Diversified Chemicals–0.68% | |
Dow Chemical Co. (The) | | | 5,708 | | | | 293,848 | |
E. I. du Pont de Nemours and Co. | | | 4,449 | | | | 296,303 | |
Eastman Chemical Co. | | | 749 | | | | 50,565 | |
| | | | | | | | 640,716 | |
|
| Diversified Metals & Mining–0.04% | |
Freeport-McMoRan Inc. | | | 5,867 | | | | 39,720 | |
|
| Diversified Support Services–0.04% | |
Cintas Corp. | | | 450 | | | | 40,972 | |
|
| Drug Retail–0.99% | |
CVS Health Corp. | | | 5,621 | | | | 549,565 | |
Walgreens Boots Alliance, Inc. | | | 4,421 | | | | 376,470 | |
| | | | | | | | 926,035 | |
|
| Electric Utilities–1.67% | |
American Electric Power Co., Inc. | | | 2,491 | | | | 145,151 | |
Duke Energy Corp. | | | 3,493 | | | | 249,365 | |
Edison International | | | 1,639 | | | | 97,045 | |
Entergy Corp. | | | 903 | | | | 61,729 | |
Eversource Energy | | | 1,598 | | | | 81,610 | |
Exelon Corp. | | | 4,668 | | | | 129,631 | |
FirstEnergy Corp. | | | 2,123 | | | | 67,363 | |
NextEra Energy, Inc. | | | 2,337 | | | | 242,791 | |
Pepco Holdings, Inc. | | | 1,278 | | | | 33,241 | |
Pinnacle West Capital Corp. | | | 557 | | | | 35,915 | |
PPL Corp. | | | 3,409 | | | | 116,349 | |
Southern Co. (The) | | | 4,614 | | | | 215,889 | |
Xcel Energy, Inc. | | | 2,576 | | | | 92,504 | |
| | | | | | | | 1,568,583 | |
|
| Electrical Components & Equipment–0.44% | |
AMETEK, Inc. | | | 1,215 | | | | 65,112 | |
Eaton Corp. PLC(b) | | | 2,350 | | | | 122,294 | |
Emerson Electric Co. | | | 3,314 | | | | 158,508 | |
Rockwell Automation, Inc. | | | 677 | | | | 69,467 | |
| | | | | | | | 415,381 | |
|
| Electronic Components–0.20% | |
Amphenol Corp.–Class A | | | 1,554 | | | | 81,166 | |
Corning Inc. | | | 6,005 | | | | 109,771 | |
| | | | | | | | 190,937 | |
|
| Electronic Equipment & Instruments–0.02% | |
FLIR Systems, Inc. | | | 705 | | | | 19,789 | |
| | | | | | | | |
| | | Shares | | | Value | |
| Electronic Manufacturing Services–0.14% | |
TE Connectivity Ltd. (Switzerland) | | | 1,960 | | | $ | 126,636 | |
|
| Environmental & Facilities Services–0.23% | |
Republic Services, Inc. | | | 1,213 | | | | 53,360 | |
Stericycle, Inc.(b) | | | 427 | | | | 51,496 | |
Waste Management, Inc. | | | 2,121 | | | | 113,198 | |
| | | | | | | | 218,054 | |
|
| Fertilizers & Agricultural Chemicals–0.36% | |
CF Industries Holdings, Inc. | | | 1,184 | | | | 48,319 | |
FMC Corp. | | | 671 | | | | 26,256 | |
Monsanto Co. | | | 2,232 | | | | 219,897 | |
Mosaic Co. (The) | | | 1,700 | | | | 46,903 | |
| | | | | | | | 341,375 | |
|
| Food Distributors–0.12% | |
Sysco Corp. | | | 2,664 | | | | 109,224 | |
|
| Food Retail–0.28% | |
Kroger Co. (The) | | | 4,941 | | | | 206,682 | |
Whole Foods Market, Inc. | | | 1,731 | | | | 57,989 | |
| | | | | | | | 264,671 | |
|
| Footwear–0.46% | |
NIKE, Inc.–Class B | | | 6,838 | | | | 427,375 | |
|
| Gas Utilities–0.04% | |
AGL Resources Inc. | | | 618 | | | | 39,435 | |
|
| General Merchandise Stores–0.45% | |
Dollar General Corp. | | | 1,476 | | | | 106,080 | |
Dollar Tree, Inc.(b) | | | 1,183 | | | | 91,366 | |
Target Corp. | | | 3,126 | | | | 226,979 | |
| | | | | | | | 424,425 | |
|
| Gold–0.05% | |
Newmont Mining Corp. | | | 2,715 | | | | 48,843 | |
|
| Health Care Distributors–0.61% | |
AmerisourceBergen Corp. | | | 991 | | | | 102,776 | |
Cardinal Health, Inc. | | | 1,669 | | | | 148,992 | |
Henry Schein, Inc.(b) | | | 420 | | | | 66,440 | |
McKesson Corp. | | | 1,171 | | | | 230,956 | |
Patterson Cos. Inc. | | | 441 | | | | 19,938 | |
| | | | | | | | 569,102 | |
|
| Health Care Equipment–2.04% | |
Abbott Laboratories | | | 7,572 | | | | 340,059 | |
Baxter International Inc. | | | 2,776 | | | | 105,905 | |
Becton, Dickinson and Co. | | | 1,069 | | | | 164,722 | |
Boston Scientific Corp.(b) | | | 6,849 | | | | 126,296 | |
C.R. Bard, Inc. | | | 373 | | | | 70,661 | |
Edwards Lifesciences Corp.(b) | | | 1,094 | | | | 86,404 | |
Intuitive Surgical, Inc.(b) | | | 189 | | | | 103,224 | |
Medtronic PLC | | | 7,134 | | | | 548,747 | |
St. Jude Medical, Inc. | | | 1,434 | | | | 88,578 | |
Stryker Corp. | | | 1,594 | | | | 148,146 | |
Varian Medical Systems, Inc.(b) | | | 502 | | | | 40,562 | |
See accompanying Notes to Financial Statements which are an integral part of the financial statements.
Invesco V.I. S&P 500 Index Fund
| | | | | | | | |
| | | Shares | | | Value | |
| Health Care Equipment–(continued) | |
Zimmer Biomet Holdings, Inc. | | | 868 | | | $ | 89,048 | |
| | | | | | | | 1,912,352 | |
|
| Health Care Facilities–0.19% | |
HCA Holdings, Inc.(b) | | | 1,592 | | | | 107,667 | |
Tenet Healthcare Corp.(b) | | | 499 | | | | 15,120 | |
Universal Health Services, Inc.–Class B | | | 458 | | | | 54,726 | |
| | | | | | | | 177,513 | |
|
| Health Care REIT’s–0.33% | |
HCP, Inc. | | | 2,360 | | | | 90,247 | |
Ventas, Inc. | | | 1,689 | | | | 95,310 | |
Welltower Inc. | | | 1,795 | | | | 122,114 | |
| | | | | | | | 307,671 | |
|
| Health Care Services–0.51% | |
DaVita HealthCare Partners Inc.(b) | | | 845 | | | | 58,905 | |
Express Scripts Holding Co.(b) | | | 3,432 | | | | 299,991 | |
Laboratory Corp. of America Holdings(b) | | | 513 | | | | 63,427 | |
Quest Diagnostics Inc. | | | 722 | | | | 51,363 | |
| | | | | | | | 473,686 | |
|
| Health Care Supplies–0.05% | |
DENTSPLY International Inc. | | | 720 | | | | 43,812 | |
|
| Health Care Technology–0.10% | |
Cerner Corp.(b) | | | 1,540 | | | | 92,662 | |
|
| Home Entertainment Software–0.22% | |
Activision Blizzard, Inc. | | | 2,561 | | | | 99,136 | |
Electronic Arts Inc.(b) | | | 1,577 | | | | 108,372 | |
| | | | | | | | 207,508 | |
|
| Home Furnishings–0.10% | |
Leggett & Platt, Inc. | | | 710 | | | | 29,834 | |
Mohawk Industries, Inc.(b) | | | 320 | | | | 60,605 | |
| | | | | | | | 90,439 | |
|
| Home Improvement Retail–1.28% | |
Home Depot, Inc. (The) | | | 6,436 | | | | 851,161 | |
Lowe’s Cos., Inc. | | | 4,645 | | | | 353,206 | |
| | | | | | | | 1,204,367 | |
|
| Homebuilding–0.13% | |
D.R. Horton, Inc. | | | 1,646 | | | | 52,721 | |
Lennar Corp.–Class A | | | 908 | | | | 44,410 | |
PulteGroup Inc. | | | 1,591 | | | | 28,352 | |
| | | | | | | | 125,483 | |
|
| Homefurnishing Retail–0.04% | |
Bed Bath & Beyond Inc.(b) | | | 861 | | | | 41,543 | |
|
| Hotel and Resort REIT’s–0.06% | |
Host Hotels & Resorts Inc. | | | 3,794 | | | | 58,200 | |
|
| Hotels, Resorts & Cruise Lines–0.41% | |
Carnival Corp. | | | 2,335 | | | | 127,211 | |
Marriott International Inc.–Class A | | | 978 | | | | 65,565 | |
Royal Caribbean Cruises Ltd. | | | 865 | | | | 87,547 | |
| | | | | | | | |
| | | Shares | | | Value | |
| Hotels, Resorts & Cruise Lines–(continued) | |
Starwood Hotels & Resorts Worldwide, Inc. | | | 859 | | | $ | 59,511 | |
Wyndham Worldwide Corp. | | | 589 | | | | 42,791 | |
| | | | | | | | 382,625 | |
|
| Household Appliances–0.06% | |
Whirlpool Corp. | | | 395 | | | | 58,014 | |
|
| Household Products–1.89% | |
Church & Dwight Co., Inc. | | | 665 | | | | 56,445 | |
Clorox Co. (The) | | | 655 | | | | 83,074 | |
Colgate-Palmolive Co. | | | 4,540 | | | | 302,455 | |
Kimberly-Clark Corp. | | | 1,841 | | | | 234,359 | |
Procter & Gamble Co. (The) | | | 13,810 | | | | 1,096,652 | |
| | | | | | | | 1,772,985 | |
|
| Housewares & Specialties–0.06% | |
Newell Rubbermaid Inc. | | | 1,351 | | | | 59,552 | |
|
| Human Resource & Employment Services–0.03% | |
Robert Half International, Inc. | | | 678 | | | | 31,961 | |
|
| Hypermarkets & Super Centers–0.90% | |
Costco Wholesale Corp. | | | 2,220 | | | | 358,530 | |
Wal-Mart Stores, Inc. | | | 7,961 | | | | 488,009 | |
| | | | | | | | 846,539 | |
|
| Independent Power Producers & Energy Traders–0.05% | |
AES Corp. (The) | | | 3,418 | | | | 32,710 | |
NRG Energy, Inc. | | | 1,551 | | | | 18,256 | |
| | | | | | | | 50,966 | |
|
| Industrial Conglomerates–2.49% | |
3M Co. | | | 3,125 | | | | 470,750 | |
Danaher Corp. | | | 3,026 | | | | 281,055 | |
General Electric Co.(d) | | | 47,912 | | | | 1,492,459 | |
Roper Technologies, Inc. | | | 511 | | | | 96,982 | |
| | | | | | | | 2,341,246 | |
|
| Industrial Gases–0.34% | |
Air Products and Chemicals, Inc. | | | 983 | | | | 127,898 | |
Airgas, Inc. | | | 329 | | | | 45,507 | |
Praxair, Inc. | | | 1,450 | | | | 148,480 | |
| | | | | | | | 321,885 | |
|
| Industrial Machinery–0.62% | |
Dover Corp. | | | 788 | | | | 48,312 | |
Flowserve Corp. | | | 672 | | | | 28,278 | |
Illinois Tool Works Inc. | | | 1,661 | | | | 153,941 | |
Ingersoll-Rand PLC | | | 1,331 | | | | 73,591 | |
Parker-Hannifin Corp. | | | 697 | | | | 67,595 | |
Pentair PLC (United Kingdom) | | | 903 | | | | 44,726 | |
Snap-on Inc. | | | 293 | | | | 50,229 | |
Stanley Black & Decker Inc. | | | 759 | | | | 81,008 | |
Xylem, Inc. | | | 934 | | | | 34,091 | |
| | | | | | | | 581,771 | |
|
| Industrial REIT’s–0.12% | |
Prologis, Inc. | | | 2,661 | | | | 114,210 | |
See accompanying Notes to Financial Statements which are an integral part of the financial statements.
Invesco V.I. S&P 500 Index Fund
| | | | | | | | |
| | | Shares | | | Value | |
| Insurance Brokers–0.29% | |
Aon PLC | | | 1,389 | | | $ | 128,080 | |
Marsh & McLennan Cos., Inc. | | | 2,647 | | | | 146,776 | |
| | | | | | | | 274,856 | |
|
| Integrated Oil & Gas–2.95% | |
Chevron Corp. | | | 9,553 | | | | 859,388 | |
Exxon Mobil Corp. | | | 21,140 | | | | 1,647,863 | |
Occidental Petroleum Corp. | | | 3,876 | | | | 262,056 | |
| | | | | | | | 2,769,307 | |
|
| Integrated Telecommunication Services–2.27% | |
AT&T Inc. | | | 31,231 | | | | 1,074,659 | |
CenturyLink Inc. | | | 2,805 | | | | 70,574 | |
Frontier Communications Corp. | | | 5,906 | | | | 27,581 | |
Verizon Communications Inc. | | | 20,656 | | | | 954,720 | |
| | | | | | | | 2,127,534 | |
|
| Internet Retail–2.14% | |
Amazon.com, Inc.(b) | | | 1,950 | | | | 1,317,986 | |
Expedia, Inc. | | | 597 | | | | 74,207 | |
Netflix Inc.(b) | | | 2,169 | | | | 248,090 | |
Priceline Group Inc. (The)(b) | | | 252 | | | | 321,287 | |
TripAdvisor Inc.(b) | | | 576 | | | | 49,104 | |
| | | | | | | | 2,010,674 | |
|
| Internet Software & Services–4.15% | |
Akamai Technologies, Inc.(b) | | | 898 | | | | 47,262 | |
Alphabet Inc.–Class A(b) | | | 1,478 | | | | 1,149,899 | |
Alphabet Inc.–Class C(b) | | | 1,507 | | | | 1,143,632 | |
eBay Inc.(b) | | | 5,607 | | | | 154,080 | |
Facebook Inc.–Class A(b) | | | 11,525 | | | | 1,206,206 | |
VeriSign, Inc.(b) | | | 503 | | | | 43,942 | |
Yahoo! Inc.(b) | | | 4,391 | | | | 146,045 | |
| | | | | | | | 3,891,066 | |
|
| Investment Banking & Brokerage–0.91% | |
Charles Schwab Corp. (The) | | | 6,082 | | | | 200,280 | |
E*TRADE Financial Corp.(b) | | | 1,458 | | | | 43,215 | |
Goldman Sachs Group, Inc. (The) | | | 2,013 | | | | 362,803 | |
Morgan Stanley | | | 7,685 | | | | 244,460 | |
| | | | | | | | 850,758 | |
|
| IT Consulting & Other Services–1.26% | |
Accenture PLC–Class A | | | 3,171 | | | | 331,370 | |
Cognizant Technology Solutions Corp.–Class A(b) | | | 3,071 | | | | 184,321 | |
CSRA Inc. | | | 692 | | | | 20,760 | |
International Business Machines Corp. | | | 4,530 | | | | 623,419 | |
Teradata Corp.(b) | | | 674 | | | | 17,807 | |
| | | | | | | | 1,177,677 | |
|
| Leisure Products–0.09% | |
Hasbro, Inc. | | | 563 | | | | 37,924 | |
Mattel, Inc. | | | 1,731 | | | | 47,031 | |
| | | | | | | | 84,955 | |
| | | | | | | | |
| | | Shares | | | Value | |
| Life & Health Insurance–0.84% | |
Aflac, Inc. | | | 2,166 | | | $ | 129,743 | |
Lincoln National Corp. | | | 1,273 | | | | 63,981 | |
MetLife, Inc. | | | 5,642 | | | | 272,001 | |
Principal Financial Group, Inc. | | | 1,378 | | | | 61,983 | |
Prudential Financial, Inc. | | | 2,279 | | | | 185,533 | |
Torchmark Corp. | | | 586 | | | | 33,496 | |
Unum Group | | | 1,255 | | | | 41,779 | |
| | | | | | | | 788,516 | |
|
| Life Sciences Tools & Services–0.63% | |
Agilent Technologies, Inc. | | | 1,676 | | | | 70,074 | |
Illumina, Inc.(b) | | | 742 | | | | 142,423 | |
PerkinElmer, Inc. | | | 569 | | | | 30,481 | |
Thermo Fisher Scientific, Inc. | | | 2,026 | | | | 287,388 | |
Waters Corp.(b) | | | 416 | | | | 55,985 | |
| | | | | | | | 586,351 | |
|
| Managed Health Care–1.35% | |
Aetna Inc. | | | 1,769 | | | | 191,264 | |
Anthem, Inc. | | | 1,319 | | | | 183,922 | |
Cigna Corp. | | | 1,307 | | | | 191,253 | |
Humana Inc. | | | 747 | | | | 133,347 | |
UnitedHealth Group Inc. | | | 4,838 | | | | 569,142 | |
| | | | | | | | 1,268,928 | |
|
| Metal & Glass Containers–0.07% | |
Ball Corp. | | | 693 | | | | 50,402 | |
Owens-Illinois, Inc.(b) | | | 791 | | | | 13,779 | |
| | | | | | | | 64,181 | |
|
| Motorcycle Manufacturers–0.05% | |
Harley-Davidson, Inc. | | | 973 | | | | 44,164 | |
|
| Movies & Entertainment–1.46% | |
Time Warner Inc. | | | 4,058 | | | | 262,431 | |
Twenty-First Century Fox, Inc.–Class A | | | 5,942 | | | | 161,385 | |
Twenty-First Century Fox, Inc.–Class B | | | 2,175 | | | | 59,225 | |
Viacom Inc.–Class B | | | 1,752 | | | | 72,112 | |
Walt Disney Co. (The) | | | 7,720 | | | | 811,218 | |
| | | | | | | | 1,366,371 | |
|
| Multi–Line Insurance–0.60% | |
American International Group, Inc. | | | 6,279 | | | | 389,110 | |
Assurant, Inc. | | | 341 | | | | 27,464 | |
Hartford Financial Services Group, Inc. (The) | | | 2,092 | | | | 90,918 | |
Loews Corp. | | | 1,420 | | | | 54,528 | |
| | | | | | | | 562,020 | |
|
| Multi–Sector Holdings–1.37% | |
Berkshire Hathaway Inc.–Class B(b) | | | 9,510 | | | | 1,255,700 | |
Leucadia National Corp. | | | 1,725 | | | | 29,998 | |
| | | | | | | | 1,285,698 | |
|
| Multi-Utilities–1.11% | |
Ameren Corp. | | | 1,220 | | | | 52,741 | |
CenterPoint Energy, Inc. | | | 2,218 | | | | 40,722 | |
See accompanying Notes to Financial Statements which are an integral part of the financial statements.
Invesco V.I. S&P 500 Index Fund
| | | | | | | | |
| | | Shares | | | Value | |
| Multi-Utilities–(continued) | |
CMS Energy Corp. | | | 1,388 | | | $ | 50,079 | |
Consolidated Edison, Inc. | | | 1,487 | | | | 95,570 | |
Dominion Resources, Inc. | | | 3,021 | | | | 204,340 | |
DTE Energy Co. | | | 902 | | | | 72,331 | |
NiSource Inc. | | | 1,573 | | | | 30,689 | |
PG&E Corp. | | | 2,489 | | | | 132,390 | |
Public Service Enterprise Group Inc. | | | 2,545 | | | | 98,466 | |
SCANA Corp. | | | 719 | | | | 43,492 | |
Sempra Energy | | | 1,187 | | | | 111,590 | |
TECO Energy, Inc. | | | 1,210 | | | | 32,247 | |
WEC Energy Group, Inc. | | | 1,586 | | | | 81,378 | |
| | | | | | | | 1,046,035 | |
|
| Office REIT’s–0.26% | |
Boston Properties, Inc. | | | 779 | | | | 99,354 | |
SL Green Realty Corp. | | | 501 | | | | 56,603 | |
Vornado Realty Trust | | | 893 | | | | 89,264 | |
| | | | | | | | 245,221 | |
|
| Office Services & Supplies–0.02% | |
Pitney Bowes Inc. | | | 1,018 | | | | 21,022 | |
|
| Oil & Gas Drilling–0.08% | |
Diamond Offshore Drilling, Inc. | | | 346 | | | | 7,300 | |
Ensco PLC–Class A | | | 1,241 | | | | 19,099 | |
Helmerich & Payne, Inc. | | | 554 | | | | 29,667 | |
Transocean Ltd. | | | 1,784 | | | | 22,086 | |
| | | | | | | | 78,152 | |
|
| Oil & Gas Equipment & Services–0.91% | |
Baker Hughes Inc. | | | 2,213 | | | | 102,130 | |
Cameron International Corp.(b) | | | 963 | | | | 60,861 | |
FMC Technologies, Inc.(b) | | | 1,161 | | | | 33,681 | |
Halliburton Co. | | | 4,344 | | | | 147,870 | |
National Oilwell Varco Inc. | | | 1,906 | | | | 63,832 | |
Schlumberger Ltd. | | | 6,389 | | | | 445,633 | |
| | | | | | | | 854,007 | |
|
| Oil & Gas Exploration & Production–1.32% | |
Anadarko Petroleum Corp. | | | 2,579 | | | | 125,288 | |
Apache Corp. | | | 1,897 | | | | 84,360 | |
Cabot Oil & Gas Corp. | | | 2,081 | | | | 36,813 | |
Chesapeake Energy Corp. | | | 2,668 | | | | 12,006 | |
Cimarex Energy Co. | | | 471 | | | | 42,098 | |
ConocoPhillips | | | 6,267 | | | | 292,606 | |
Devon Energy Corp. | | | 1,944 | | | | 62,208 | |
EOG Resources, Inc. | | | 2,790 | | | | 197,504 | |
EQT Corp. | | | 766 | | | | 39,932 | |
Hess Corp. | | | 1,229 | | | | 59,582 | |
Marathon Oil Corp. | | | 3,480 | | | | 43,813 | |
Murphy Oil Corp. | | | 841 | | | | 18,881 | |
Newfield Exploration Co.(b) | | | 819 | | | | 26,667 | |
Noble Energy, Inc. | | | 2,153 | | | | 70,898 | |
Pioneer Natural Resources Co. | | | 751 | | | | 94,160 | |
| | | | | | | | |
| | | Shares | | | Value | |
| Oil & Gas Exploration & Production–(continued) | |
Range Resources Corp. | | | 858 | | | $ | 21,115 | |
Southwestern Energy Co.(b) | | | 1,994 | | | | 14,177 | |
| | | | | | | | 1,242,108 | |
|
| Oil & Gas Refining & Marketing–0.61% | |
Marathon Petroleum Corp. | | | 2,704 | | | | 140,175 | |
Phillips 66 | | | 2,415 | | | | 197,547 | |
Tesoro Corp. | | | 610 | | | | 64,276 | |
Valero Energy Corp. | | | 2,444 | | | | 172,815 | |
| | | | | | | | 574,813 | |
|
| Oil & Gas Storage & Transportation–0.40% | |
Columbia Pipeline Group, Inc. | | | 1,974 | | | | 39,480 | |
Kinder Morgan Inc. | | | 9,289 | | | | 138,592 | |
ONEOK, Inc. | | | 1,075 | | | | 26,509 | |
Spectra Energy Corp. | | | 3,407 | | | | 81,564 | |
Williams Cos., Inc. (The) | | | 3,441 | | | | 88,434 | |
| | | | | | | | 374,579 | |
|
| Packaged Foods & Meats–1.54% | |
Campbell Soup Co. | | | 911 | | | | 47,873 | |
ConAgra Foods, Inc. | | | 2,178 | | | | 91,825 | |
General Mills, Inc. | | | 3,020 | | | | 174,133 | |
Hershey Co. (The) | | | 738 | | | | 65,881 | |
Hormel Foods Corp. | | | 678 | | | | 53,616 | |
JM Smucker Co. (The) | | | 602 | | | | 74,251 | |
Kellogg Co. | | | 1,283 | | | | 92,722 | |
Keurig Green Mountain Inc. | | | 595 | | | | 53,538 | |
Kraft Heinz Co. (The) | | | 3,018 | | | | 219,590 | |
McCormick & Co., Inc. | | | 584 | | | | 49,967 | |
Mead Johnson Nutrition Co. | | | 1,000 | | | | 78,950 | |
Mondelez International, Inc.–Class A | | | 8,067 | | | | 361,724 | |
Tyson Foods, Inc.–Class A | | | 1,500 | | | | 79,995 | |
| | | | | | | | 1,444,065 | |
|
| Paper Packaging–0.14% | |
Avery Dennison Corp. | | | 457 | | | | 28,636 | |
Sealed Air Corp. | | | 1,001 | | | | 44,644 | |
WestRock Co. | | | 1,311 | | | | 59,808 | |
| | | | | | | | 133,088 | |
|
| Paper Products–0.09% | |
International Paper Co. | | | 2,127 | | | | 80,188 | |
|
| Personal Products–0.11% | |
Estee Lauder Cos. Inc. (The)–Class A | | | 1,138 | | | | 100,212 | |
|
| Pharmaceuticals–5.61% | |
Allergan PLC(b) | | | 2,000 | | | | 625,000 | |
Bristol-Myers Squibb Co. | | | 8,469 | | | | 582,583 | |
Eli Lilly and Co. | | | 4,954 | | | | 417,424 | |
Endo International PLC(b) | | | 1,050 | | | | 64,281 | |
Johnson & Johnson | | | 14,054 | | | | 1,443,627 | |
Mallinckrodt PLC(b) | | | 588 | | | | 43,882 | |
Merck & Co., Inc. | | | 14,182 | | | | 749,093 | |
Mylan N.V.(b) | | | 2,097 | | | | 113,385 | |
See accompanying Notes to Financial Statements which are an integral part of the financial statements.
Invesco V.I. S&P 500 Index Fund
| | | | | | | | |
| | | Shares | | | Value | |
| Pharmaceuticals–(continued) | |
Perrigo Co. PLC | | | 742 | | | $ | 107,367 | |
Pfizer Inc. | | | 31,338 | | | | 1,011,591 | |
Zoetis Inc. | | | 2,315 | | | | 110,935 | |
| | | | | | | | 5,269,168 | |
|
| Property & Casualty Insurance–0.89% | |
ACE Ltd. | | | 1,644 | | | | 192,101 | |
Allstate Corp. (The) | | | 1,965 | | | | 122,007 | |
Chubb Corp. (The) | | | 1,152 | | | | 152,801 | |
Cincinnati Financial Corp. | | | 744 | | | | 44,023 | |
Progressive Corp. (The) | | | 2,955 | | | | 93,969 | |
Travelers Cos., Inc. (The) | | | 1,543 | | | | 174,143 | |
XL Group PLC | | | 1,510 | | | | 59,162 | |
| | | | | | | | 838,206 | |
|
| Publishing–0.04% | |
News Corp.–Class A | | | 1,921 | | | | 25,665 | |
News Corp.–Class B | | | 543 | | | | 7,580 | |
| | | | | | | | 33,245 | |
|
| Railroads–0.68% | |
CSX Corp. | | | 4,971 | | | | 128,997 | |
Kansas City Southern | | | 556 | | | | 41,517 | |
Norfolk Southern Corp. | | | 1,519 | | | | 128,492 | |
Union Pacific Corp. | | | 4,336 | | | | 339,075 | |
| | | | | | | | 638,081 | |
|
| Real Estate Services–0.05% | |
CBRE Group, Inc.–Class A(b) | | | 1,461 | | | | 50,521 | |
|
| Regional Banks–0.96% | |
BB&T Corp. | | | 3,959 | | | | 149,690 | |
Fifth Third Bancorp | | | 4,075 | | | | 81,907 | |
Huntington Bancshares Inc. | | | 4,067 | | | | 44,981 | |
KeyCorp | | | 4,268 | | | | 56,295 | |
M&T Bank Corp. | | | 805 | | | | 97,550 | |
People’s United Financial Inc. | | | 1,586 | | | | 25,614 | |
PNC Financial Services Group, Inc. (The) | | | 2,577 | | | | 245,614 | |
Regions Financial Corp. | | | 6,645 | | | | 63,792 | |
SunTrust Banks, Inc. | | | 2,597 | | | | 111,255 | |
Zions Bancorp. | | | 1,047 | | | | 28,583 | |
| | | | | | | | 905,281 | |
|
| Research & Consulting Services–0.25% | |
Dun & Bradstreet Corp. (The) | | | 189 | | | | 19,643 | |
Equifax Inc. | | | 598 | | | | 66,599 | |
Nielsen Holdings PLC | | | 1,857 | | | | 86,536 | |
Verisk Analytics, Inc.–Class A(b) | | | 782 | | | | 60,120 | |
| | | | | | | | 232,898 | |
|
| Residential REIT’s–0.42% | |
Apartment Investment & Management Co.–Class A | | | 786 | | | | 31,464 | |
AvalonBay Communities, Inc. | | | 694 | | | | 127,786 | |
Equity Residential | | | 1,848 | | | | 150,778 | |
Essex Property Trust, Inc. | | | 335 | | | | 80,202 | |
| | | | | | | | 390,230 | |
| | | | | | | | |
| | | Shares | | | Value | |
| Restaurants–1.36% | |
Chipotle Mexican Grill, Inc.(b) | | | 157 | | | $ | 75,336 | |
Darden Restaurants, Inc. | | | 574 | | | | 36,529 | |
McDonald’s Corp. | | | 4,661 | | | | 550,651 | |
Starbucks Corp. | | | 7,537 | | | | 452,446 | |
Yum! Brands, Inc. | | | 2,189 | | | | 159,907 | |
| | | | | | | | 1,274,869 | |
|
| Retail REIT’s–0.60% | |
General Growth Properties, Inc. | | | 2,948 | | | | 80,215 | |
Kimco Realty Corp. | | | 2,089 | | | | 55,275 | |
Macerich Co. (The) | | | 678 | | | | 54,708 | |
Realty Income Corp. | | | 1,270 | | | | 65,570 | |
Simon Property Group, Inc. | | | 1,570 | | | | 305,271 | |
| | | | | | | | 561,039 | |
|
| Security & Alarm Services–0.10% | |
ADT Corp. (The) | | | 836 | | | | 27,571 | |
Tyco International PLC | | | 2,118 | | | | 67,543 | |
| | | | | | | | 95,114 | |
|
| Semiconductor Equipment–0.24% | |
Applied Materials, Inc. | | | 5,832 | | | | 108,884 | |
KLA-Tencor Corp. | | | 804 | | | | 55,757 | |
Lam Research Corp. | | | 796 | | | | 63,218 | |
| | | | | | | | 227,859 | |
|
| Semiconductors–2.14% | |
Analog Devices, Inc. | | | 1,577 | | | | 87,240 | |
Avago Technologies Ltd. (Singapore) | | | 1,330 | | | | 193,049 | |
Broadcom Corp.–Class A | | | 2,836 | | | | 163,977 | |
First Solar, Inc.(b) | | | 389 | | | | 25,670 | |
Intel Corp. | | | 23,956 | | | | 825,284 | |
Linear Technology Corp. | | | 1,204 | | | | 51,134 | |
Microchip Technology Inc. | | | 1,030 | | | | 47,936 | |
Micron Technology, Inc.(b) | | | 5,522 | | | | 78,192 | |
NVIDIA Corp. | | | 2,582 | | | | 85,103 | |
Qorvo, Inc.(b) | | | 717 | | | | 36,495 | |
Skyworks Solutions, Inc. | | | 961 | | | | 73,834 | |
Texas Instruments Inc. | | | 5,149 | | | | 282,217 | |
Xilinx, Inc. | | | 1,301 | | | | 61,108 | |
| | | | | | | | 2,011,239 | |
|
| Soft Drinks–1.97% | |
Coca-Cola Co. (The) | | | 19,869 | | | | 853,572 | |
Coca-Cola Enterprises, Inc. | | | 1,078 | | | | 53,081 | |
Dr Pepper Snapple Group, Inc. | | | 964 | | | | 89,845 | |
Monster Beverage Corp.(b) | | | 766 | | | | 114,103 | |
PepsiCo, Inc. | | | 7,395 | | | | 738,909 | |
| | | | | | | | 1,849,510 | |
|
| Specialized Consumer Services–0.04% | |
H&R Block, Inc. | | | 1,196 | | | | 39,839 | |
|
| Specialized Finance–0.61% | |
CME Group Inc.–Class A | | | 1,716 | | | | 155,470 | |
Intercontinental Exchange, Inc. | | | 603 | | | | 154,525 | |
See accompanying Notes to Financial Statements which are an integral part of the financial statements.
Invesco V.I. S&P 500 Index Fund
| | | | | | | | |
| | | Shares | | | Value | |
| Specialized Finance–(continued) | |
McGraw Hill Financial, Inc. | | | 1,377 | | | $ | 135,745 | |
Moody’s Corp. | | | 878 | | | | 88,098 | |
Nasdaq, Inc. | | | 595 | | | | 34,611 | |
| | | | | | | | 568,449 | |
|
| Specialized REIT’s–0.83% | |
American Tower Corp. | | | 2,150 | | | | 208,442 | |
Crown Castle International Corp. | | | 1,693 | | | | 146,360 | |
Equinix, Inc. | | | 314 | | | | 94,954 | |
Iron Mountain Inc. | | | 965 | | | | 26,065 | |
Plum Creek Timber Co., Inc. | | | 881 | | | | 42,041 | |
Public Storage | | | 746 | | | | 184,784 | |
Weyerhaeuser Co. | | | 2,605 | | | | 78,098 | |
| | | | | | | | 780,744 | |
|
| Specialty Chemicals–0.47% | |
Ecolab Inc. | | | 1,348 | | | | 154,184 | |
International Flavors & Fragrances Inc. | | | 406 | | | | 48,574 | |
PPG Industries, Inc. | | | 1,367 | | | | 135,087 | |
Sherwin-Williams Co. (The) | | | 398 | | | | 103,321 | |
| | | | | | | | 441,166 | |
|
| Specialty Stores–0.19% | |
Signet Jewelers Ltd. | | | 403 | | | | 49,847 | |
Staples, Inc. | | | 3,259 | | | | 30,863 | |
Tiffany & Co. | | | 565 | | | | 43,104 | |
Tractor Supply Co. | | | 686 | | | | 58,653 | |
| | | | | | | | 182,467 | |
|
| Steel–0.07% | |
Nucor Corp. | | | 1,605 | | | | 64,681 | |
|
| Systems Software–3.24% | |
CA, Inc. | | | 1,592 | | | | 45,467 | |
Microsoft Corp. | | | 40,552 | | | | 2,249,825 | |
Oracle Corp. | | | 16,253 | | | | 593,722 | |
Red Hat, Inc.(b) | | | 922 | | | | 76,351 | |
Symantec Corp. | | | 3,409 | | | | 71,589 | |
| | | | | | | | 3,036,954 | |
|
| Technology Hardware, Storage & Peripherals–3.97% | |
Apple Inc. | | | 28,304 | | | | 2,979,279 | |
EMC Corp. | | | 9,842 | | | | 252,743 | |
| | | | | | | | |
| | | Shares | | | Value | |
| Technology Hardware, Storage & Peripherals–(continued) | |
Hewlett Packard Enterprise Co. | | | 9,090 | | | $ | 138,168 | |
HP Inc. | | | 9,194 | | | | 108,857 | |
NetApp, Inc. | | | 1,513 | | | | 40,140 | |
SanDisk Corp. | | | 1,018 | | | | 77,358 | |
Seagate Technology PLC | | | 1,522 | | | | 55,796 | |
Western Digital Corp. | | | 1,161 | | | | 69,718 | |
| | | | | | | | 3,722,059 | |
|
| Tires & Rubber–0.05% | |
Goodyear Tire & Rubber Co. (The) | | | 1,357 | | | | 44,333 | |
|
| Tobacco–1.56% | |
Altria Group, Inc. | | | 9,952 | | | | 579,306 | |
Philip Morris International Inc. | | | 7,864 | | | | 691,324 | |
Reynolds American Inc. | | | 4,207 | | | | 194,153 | |
| | | | | | | | 1,464,783 | |
|
| Trading Companies & Distributors–0.16% | |
Fastenal Co. | | | 1,467 | | | | 59,883 | |
United Rentals, Inc.(b) | | | 471 | | | | 34,166 | |
W.W. Grainger, Inc. | | | 293 | | | | 59,359 | |
| | | | | | | | 153,408 | |
|
| Trucking–0.05% | |
J.B. Hunt Transport Services, Inc. | | | 459 | | | | 33,672 | |
Ryder System, Inc. | | | 268 | | | | 15,231 | |
| | | | | | | | 48,903 | |
Total Common Stocks & Other Equity Interests
(Cost $36,243,722) | | | | 90,838,165 | |
|
Money Market Funds–3.16% | |
Liquid Assets Portfolio–Institutional Class, 0.29%(e) | | | 1,485,439 | | | | 1,485,439 | |
Premier Portfolio–Institutional
Class, 0.24%(e) | | | 1,485,438 | | | | 1,485,438 | |
Total Money Market Funds
(Cost $2,970,877) | | | | 2,970,877 | |
TOTAL INVESTMENTS–99.95%
(Cost $39,214,599) | | | | 93,809,042 | |
OTHER ASSETS LESS LIABILITIES–0.05% | | | | 45,510 | |
NET ASSETS–100.00% | | | $ | 93,854,552 | |
Investment Abbreviations:
| | |
| REIT | | – Real Estate Investment Trust |
Notes to Schedule of Investments:
| (a) | Industry and/or sector classifications used in this report are generally according to the Global Industry Classification Standard, which was developed by and is the exclusive property and a service mark of MSCI Inc. and Standard & Poor’s. |
| (b) | Non-income producing security. |
| (c) | The Fund’s Adviser is a subsidiary of Invesco Ltd. and therefore, Invesco Ltd. is considered to be affiliated with the Fund. See Note 5. |
| (d) | All or a portion of the value was pledged as collateral to cover margin requirements for open futures contracts. See Note 1I and Note 4. |
| (e) | The money market fund and the Fund are affiliated by having the same investment adviser. The rate shown is the 7-day SEC standardized yield as of December 31, 2015. |
See accompanying Notes to Financial Statements which are an integral part of the financial statements.
Invesco V.I. S&P 500 Index Fund
Statement of Assets and Liabilities
December 31, 2015
Statement of Operations
For the year ended December 31, 2015
| | | | |
Assets: | | | | |
Investments, at value (Cost $36,190,801) | | $ | 90,765,614 | |
Investments in affiliates, at value (Cost $3,023,798) | | | 3,043,428 | |
Total investments, at value (Cost $39,214,599) | | | 93,809,042 | |
Cash | | | 83,838 | |
Receivable for: | | | | |
Dividends | | | 121,687 | |
Investment for trustee deferred compensation and retirement plans | | | 28,221 | |
Total assets | | | 94,042,788 | |
|
Liabilities: | |
Payable for: | | | | |
Investments purchased | | | 11,787 | |
Fund shares reacquired | | | 17,902 | |
Variation margin — futures | | | 29,195 | |
Accrued fees to affiliates | | | 61,022 | |
Accrued trustees’ and officers’ fees and benefits | | | 182 | |
Accrued other operating expenses | | | 31,639 | |
Trustee deferred compensation and retirement plans | | | 36,509 | |
Total liabilities | | | 188,236 | |
Net assets applicable to shares outstanding | | $ | 93,854,552 | |
|
Net assets consist of: | |
Shares of beneficial interest | | $ | 34,868,281 | |
Undistributed net investment income | | | 1,310,966 | |
Undistributed net realized gain | | | 3,089,352 | |
Net unrealized appreciation | | | 54,585,953 | |
| | | $ | 93,854,552 | |
|
Net Assets: | |
Series I | | $ | 35,586,351 | |
Series II | | $ | 58,268,201 | |
|
Shares outstanding, $0.001 par value per share,
with an unlimited number of shares authorized: | |
Series I | | | 2,146,732 | |
Series II | | | 3,532,791 | |
Series I: | | | | |
Net asset value per share | | $ | 16.58 | |
Series II: | | | | |
Net asset value per share | | $ | 16.49 | |
| | | | |
Investment income: | |
Dividends (net of foreign withholding taxes of $421) | | $ | 2,001,639 | |
Dividends from affiliates | | | 3,963 | |
Total investment income | | | 2,005,602 | |
| |
Expenses: | | | | |
Advisory fees | | | 116,351 | |
Administrative services fees | | | 155,747 | |
Custodian fees | | | 21,345 | |
Distribution fees — Series II | | | 150,944 | |
Transfer agent fees | | | 4,734 | |
Trustees’ and officers’ fees and benefits | | | 21,304 | |
Professional services fees | | | 38,462 | |
Other | | | 38,660 | |
Total expenses | | | 547,547 | |
Less: Fees waived | | | (2,616 | ) |
Net expenses | | | 544,931 | |
Net investment income | | | 1,460,671 | |
| |
Realized and unrealized gain (loss) from: | | | | |
Net realized gain from: | | | | |
Investment securities | | | 6,892,841 | |
Futures contracts | | | 80,837 | |
| | | | 6,973,678 | |
Change in net unrealized appreciation (depreciation) of: | | | | |
Investment securities | | | (7,732,563 | ) |
Futures contracts | | | (1,051 | ) |
| | | | (7,733,614 | ) |
Net realized and unrealized gain (loss) | | | (759,936 | ) |
Net increase in net assets resulting from operations | | $ | 700,735 | |
See accompanying Notes to Financial Statements which are an integral part of the financial statements.
Invesco V.I. S&P 500 Index Fund
Statement of Changes in Net Assets
For the years ended December 31, 2015 and 2014
| | | | | | | | |
| | | 2015 | | | 2014 | |
Operations: | | | | | |
Net investment income | | $ | 1,460,671 | | | $ | 1,465,688 | |
Net realized gain | | | 6,973,678 | | | | 9,118,184 | |
Change in net unrealized appreciation (depreciation) | | | (7,733,614 | ) | | | 1,654,178 | |
Net increase in net assets resulting from operations | | | 700,735 | | | | 12,238,050 | |
| | |
Distributions to shareholders from net investment income: | | | | | | | | |
Series I | | | (638,662 | ) | | | (686,694 | ) |
Series ll | | | (862,269 | ) | | | (1,015,390 | ) |
Total distributions from net investment income | | | (1,500,931 | ) | | | (1,702,084 | ) |
| | |
Distributions to shareholders from net realized gains: | | | | | | | | |
Series l | | | (3,192,162 | ) | | | — | |
Series ll | | | (5,107,570 | ) | | | — | |
Total distributions from net realized gains | | | (8,299,732 | ) | | | — | |
| | |
Share transactions–net: | | | | | | | | |
Series l | | | 1,353,111 | | | | (3,051,108 | ) |
Series ll | | | 249,473 | | | | (10,779,798 | ) |
Net increase (decrease) in net assets resulting from share transactions | | | 1,602,584 | | | | (13,830,906 | ) |
Net increase (decrease) in net assets | | | (7,497,344 | ) | | | (3,294,940 | ) |
| | |
Net assets: | | | | | | | | |
Beginning of year | | | 101,351,896 | | | | 104,646,836 | |
End of year (includes undistributed net investment income of $1,310,966 and $1,302,221, respectively) | | $ | 93,854,552 | | | $ | 101,351,896 | |
Notes to Financial Statements
December 31, 2015
NOTE 1—Significant Accounting Policies
Invesco V.I. S&P 500 Index Fund (the “Fund”) is a series portfolio of AIM Variable Insurance Funds (Invesco Variable Insurance Funds) (the “Trust”). The Trust is a Delaware statutory trust registered under the Investment Company Act of 1940, as amended (the “1940 Act”), as an open-end series management investment company consisting of twenty-four separate portfolios, (each constituting a “Fund”). The assets, liabilities and operations of each portfolio are accounted for separately. Information presented in these financial statements pertains only to the Fund. Matters affecting each Fund or class will be voted on exclusively by the shareholders of such Fund or class. Current Securities and Exchange Commission (“SEC”) guidance, however, requires participating insurance companies offering separate accounts to vote shares proportionally in accordance with the instructions of the contract owners whose investments are funded by shares of each Fund or class.
The Fund’s investment objective is to provide investment results that, before expenses, correspond to the total return (i.e., the combination of capital changes and income) of the Standard & Poor’s 500® Composite Stock Price Index.
The Fund currently offers two classes of shares, Series I and Series II, both of which are offered to insurance company separate accounts funding variable annuity contracts and variable life insurance policies (“variable products”).
The following is a summary of the significant accounting policies followed by the Fund in the preparation of its financial statements.
| A. | Security Valuations — Securities, including restricted securities, are valued according to the following policy. |
A security listed or traded on an exchange (except convertible securities) is valued at its last sales price or official closing price as of the close of the customary trading session on the exchange where the security is principally traded, or lacking any sales or official closing price on a particular day, the security may be valued at the closing bid price on that day. Securities traded in the over-the-counter market are valued based on prices furnished by independent pricing services or market makers. When such securities are valued by an independent pricing service they may be considered fair valued. Futures contracts are valued at the final settlement price set by an exchange on which they are principally traded. Listed options are valued at the mean between the last bid and asked prices from the exchange on which they are principally traded. Options not listed on an exchange are valued by an independent source at the mean between the last bid and asked prices. For purposes of determining net asset value (“NAV”) per share, futures and option contracts generally are valued 15 minutes after the close of the customary trading session of the New York Stock Exchange (“NYSE”).
Investments in open-end and closed-end registered investment companies that do not trade on an exchange are valued at the end-of-day net asset value per share. Investments in open-end and closed-end registered investment companies that trade on an exchange are valued at the last sales price or official closing price as of the close of the customary trading session on the exchange where the security is principally traded.
Invesco V.I. S&P 500 Index Fund
Debt obligations (including convertible securities) and unlisted equities are fair valued using an evaluated quote provided by an independent pricing service. Evaluated quotes provided by the pricing service may be determined without exclusive reliance on quoted prices, and may reflect appropriate factors such as institution-size trading in similar groups of securities, developments related to specific securities, dividend rate (for unlisted equities), yield (for debt obligations), quality, type of issue, coupon rate (for debt obligations), maturity (for debt obligations), individual trading characteristics and other market data. Debt obligations are subject to interest rate and credit risks. In addition, all debt obligations involve some risk of default with respect to interest and/or principal payments.
Foreign securities’ (including foreign exchange contracts) prices are converted into U.S. dollar amounts using the applicable exchange rates as of the close of the NYSE. If market quotations are available and reliable for foreign exchange-traded equity securities, the securities will be valued at the market quotations. Because trading hours for certain foreign securities end before the close of the NYSE, closing market quotations may become unreliable. If between the time trading ends on a particular security and the close of the customary trading session on the NYSE, events occur that the Adviser determines are significant and make the closing price unreliable, the Fund may fair value the security. If the event is likely to have affected the closing price of the security, the security will be valued at fair value in good faith using procedures approved by the Board of Trustees. Adjustments to closing prices to reflect fair value may also be based on a screening process of an independent pricing service to indicate the degree of certainty, based on historical data, that the closing price in the principal market where a foreign security trades is not the current value as of the close of the NYSE. Foreign securities’ prices meeting the approved degree of certainty that the price is not reflective of current value will be priced at the indication of fair value from the independent pricing service. Multiple factors may be considered by the independent pricing service in determining adjustments to reflect fair value and may include information relating to sector indices, American Depositary Receipts and domestic and foreign index futures. Foreign securities may have additional risks including exchange rate changes, potential for sharply devalued currencies and high inflation, political and economic upheaval, the relative lack of issuer information, relatively low market liquidity and the potential lack of strict financial and accounting controls and standards.
Securities for which market prices are not provided by any of the above methods may be valued based upon quotes furnished by independent sources. The last bid price may be used to value equity securities. The mean between the last bid and asked prices is used to value debt obligations, including corporate loans.
Securities for which market quotations are not readily available or became unreliable are valued at fair value as determined in good faith by or under the supervision of the Trust’s officers following procedures approved by the Board of Trustees. Issuer specific events, market trends, bid/asked quotes of brokers and information providers and other market data may be reviewed in the course of making a good faith determination of a security’s fair value.
The Fund may invest in securities that are subject to interest rate risk, meaning the risk that the prices will generally fall as interest rates rise and, conversely, the prices will generally rise as interest rates fall. Specific securities differ in their sensitivity to changes in interest rates depending on their individual characteristics. Changes in interest rates may result in increased market volatility, which may affect the value and/or liquidity of certain Fund investments.
Valuations change in response to many factors including the historical and prospective earnings of the issuer, the value of the issuer’s assets, general economic conditions, interest rates, investor perceptions and market liquidity. Because of the inherent uncertainties of valuation, the values reflected in the financial statements may materially differ from the value received upon actual sale of those investments.
| B. | Securities Transactions and Investment Income — Securities transactions are accounted for on a trade date basis. Realized gains or losses on sales are computed on the basis of specific identification of the securities sold. Interest income (net of withholding tax, if any) is recorded on the accrual basis from settlement date. Dividend income (net of withholding tax, if any) is recorded on the ex-dividend date. |
The Fund may periodically participate in litigation related to Fund investments. As such, the Fund may receive proceeds from litigation settlements. Any proceeds received are included in the Statement of Operations as realized gain (loss) for investments no longer held and as unrealized gain (loss) for investments still held.
Brokerage commissions and mark ups are considered transaction costs and are recorded as an increase to the cost basis of securities purchased and/or a reduction of proceeds on a sale of securities. Such transaction costs are included in the determination of net realized and unrealized gain (loss) from investment securities reported in the Statement of Operations and the Statement of Changes in Net Assets and the net realized and unrealized gains (losses) on securities per share in the Financial Highlights. Transaction costs are included in the calculation of the Fund’s net asset value and, accordingly, they reduce the Fund’s total returns. These transaction costs are not considered operating expenses and are not reflected in net investment income reported in the Statement of Operations and the Statement of Changes in Net Assets, or the net investment income per share and the ratios of expenses and net investment income reported in the Financial Highlights, nor are they limited by any expense limitation arrangements between the Fund and the investment adviser.
The Fund allocates income and realized and unrealized capital gains and losses to a class based on the relative net assets of each class.
| C. | Country Determination — For the purposes of making investment selection decisions and presentation in the Schedule of Investments, the investment adviser may determine the country in which an issuer is located and/or credit risk exposure based on various factors. These factors include the laws of the country under which the issuer is organized, where the issuer maintains a principal office, the country in which the issuer derives 50% or more of its total revenues and the country that has the primary market for the issuer’s securities, as well as other criteria. Among the other criteria that may be evaluated for making this determination are the country in which the issuer maintains 50% or more of its assets, the type of security, financial guarantees and enhancements, the nature of the collateral and the sponsor organization. Country of issuer and/or credit risk exposure has been determined to be the United States of America, unless otherwise noted. |
| D. | Distributions — Distributions from net investment income and net realized capital gain, if any, are generally declared and paid to separate accounts of participating insurance companies annually and recorded on the ex-dividend date. |
| E. | Federal Income Taxes — The Fund intends to comply with the requirements of Subchapter M of the Internal Revenue Code of 1986, as amended (the “Internal Revenue Code”), necessary to qualify as a regulated investment company and to distribute substantially all of the Fund’s taxable earnings to shareholders. As such, the Fund will not be subject to federal income taxes on otherwise taxable income (including net realized capital gain) that is distributed to shareholders. Therefore, no provision for federal income taxes is recorded in the financial statements. |
The Fund recognizes the tax benefits of uncertain tax positions only when the position is more likely than not to be sustained. Management has analyzed the Fund’s uncertain tax positions and concluded that no liability for unrecognized tax benefits should be recorded related to uncertain
Invesco V.I. S&P 500 Index Fund
tax positions. Management is not aware of any tax positions for which it is reasonably possible that the total amounts of unrecognized tax benefits will change materially in the next 12 months.
The Fund files tax returns in the U.S. Federal jurisdiction and certain other jurisdictions. Generally, the Fund is subject to examinations by such taxing authorities for up to three years after the filing of the return for the tax period.
| F. | Expenses — Fees provided for under the Rule 12b-1 plan of a particular class of the Fund and which are directly attributable to that class are charged to the operations of such class. All other expenses are allocated among the classes based on relative net assets. |
| G. | Accounting Estimates — The preparation of financial statements in conformity with accounting principles generally accepted in the United States of America (“GAAP”) requires management to make estimates and assumptions that affect the reported amounts of assets and liabilities at the date of the financial statements and the reported amounts of revenues and expenses during the reporting period including estimates and assumptions related to taxation. Actual results could differ from those estimates by a significant amount. In addition, the Fund monitors for material events or transactions that may occur or become known after the period-end date and before the date the financial statements are released to print. |
| H. | Indemnifications — Under the Trust’s organizational documents, each Trustee, officer, employee or other agent of the Trust is indemnified against certain liabilities that may arise out of the performance of their duties to the Fund. Additionally, in the normal course of business, the Fund enters into contracts, including the Fund’s servicing agreements, that contain a variety of indemnification clauses. The Fund’s maximum exposure under these arrangements is unknown as this would involve future claims that may be made against the Fund that have not yet occurred. The risk of material loss as a result of such indemnification claims is considered remote. |
| I. | Futures Contracts — The Fund may enter into futures contracts to manage exposure to interest rate, equity and market price movements and/or currency risks. A futures contract is an agreement between two parties (“Counterparties”) to purchase or sell a specified underlying security, currency or commodity (or delivery of a cash settlement price, in the case of an index future) for a fixed price at a future date. The Fund currently invests only in exchange-traded futures and they are standardized as to maturity date and underlying financial instrument. Initial margin deposits required upon entering into futures contracts are satisfied by the segregation of specific securities or cash as collateral at the futures commission merchant (broker). During the period the futures contracts are open, changes in the value of the contracts are recognized as unrealized gains or losses by recalculating the value of the contracts on a daily basis. Subsequent or variation margin payments are received or made depending upon whether unrealized gains or losses are incurred. These amounts are reflected as receivables or payables on the Statement of Assets and Liabilities. When the contracts are closed or expire, the Fund recognizes a realized gain or loss equal to the difference between the proceeds from, or cost of, the closing transaction and the Fund’s basis in the contract. The net realized gain (loss) and the change in unrealized gain (loss) on futures contracts held during the period is included on the Statement of Operations. The primary risks associated with futures contracts are market risk and the absence of a liquid secondary market. If the Fund were unable to liquidate a futures contract and/or enter into an offsetting closing transaction, the Fund would continue to be subject to market risk with respect to the value of the contracts and continue to be required to maintain the margin deposits on the futures contracts. Futures contracts have minimal Counterparty risk since the exchange’s clearinghouse, as Counterparty to all exchange-traded futures, guarantees the futures against default. Risks may exceed amounts recognized in the Statement of Assets and Liabilities. |
| J. | Collateral — To the extent the Fund has designated or segregated a security as collateral and that security is subsequently sold, it is the Fund’s practice to replace such collateral no later than the next business day. |
NOTE 2—Advisory Fees and Other Fees Paid to Affiliates
The Trust has entered into a master investment advisory agreement with Invesco Advisers, Inc. (the “Adviser” or “Invesco”). Under the terms of the investment advisory agreement, the Fund pays an advisory fee to the Adviser based on the annual rate of the Fund’s average daily net assets as follows:
| | | | | | |
| Average Daily Net Assets | | Rate |
First $2 billion | | | 0 | .12% | | |
Over $2 billion | | | 0 | .10% | | |
For the year ended December 31, 2015, the effective advisory fees incurred by the Fund was 0.12%.
Under the terms of a master sub-advisory agreement between the Adviser and each of Invesco Asset Management Deutschland GmbH, Invesco Asset Management Limited, Invesco Asset Management (Japan) Limited, Invesco Hong Kong Limited, Invesco Senior Secured Management, Inc. and Invesco Canada Ltd. (collectively, the “Affiliated Sub-Advisers”) the Adviser, not the Fund, may pay 40% of the fees paid to the Adviser to any such Affiliated Sub-Adviser(s) that provide(s) discretionary investment management services to the Fund based on the percentage of assets allocated to such Affiliated Sub-Adviser(s).
The Adviser has contractually agreed, through at least June 30, 2016, to waive advisory fees and/or reimburse expenses of all shares to the extent necessary to limit total annual fund operating expenses after fee waiver and/or expense reimbursement (excluding certain items discussed below) of Series I shares to 2.00% and Series II shares to 2.25% of average daily net assets. In determining the Adviser’s obligation to waive advisory fees and/or reimburse expenses, the following expenses are not taken into account, and could cause the total annual fund operating expenses after fee waiver and/or expense reimbursement to exceed the numbers reflected above: (1) interest; (2) taxes; (3) dividend expense on short sales; (4) extraordinary or non-routine items, including litigation expenses; and (5) expenses that the Fund has incurred but did not actually pay because of an expense offset arrangement. Unless Invesco continues the fee waiver agreement, it will terminate on June 30, 2016. The fee waiver agreement cannot be terminated during its term. The Adviser did not waive fees and/or reimburse expenses during the period under this expense limitation.
Further, the Adviser has contractually agreed, through at least June 30, 2017, to waive the advisory fee payable by the Fund in an amount equal to 100% of the net advisory fees the Adviser receives from the affiliated money market funds on investments by the Fund of uninvested cash in such affiliated money market funds.
For the year ended December 31, 2015, the Adviser waived advisory fees of $2,616.
Invesco V.I. S&P 500 Index Fund
The Trust has entered into a master administrative services agreement with Invesco pursuant to which the Fund has agreed to pay Invesco a fee for costs incurred in providing accounting services and fund administrative services to the Fund and to reimburse Invesco for administrative services fees paid to insurance companies that have agreed to provide services to the participants of separate accounts. These administrative services provided by the insurance companies may include, among other things: the printing of prospectuses, financial reports and proxy statements and the delivery of the same to existing participants; the maintenance of master accounts; the facilitation of purchases and redemptions requested by the participants; and the servicing of participants’ accounts. Pursuant to such agreement, for the year ended December 31, 2015, Invesco was paid $50,000 for accounting and fund administrative services and reimbursed $105,747 for services provided by insurance companies.
The Trust has entered into a transfer agency and service agreement with Invesco Investment Services, Inc. (“IIS”) pursuant to which the Fund has agreed to pay IIS a fee for providing transfer agency and shareholder services to the Fund and reimburse IIS for certain expenses incurred by IIS in the course of providing such services. For the year ended December 31, 2015, expenses incurred under the agreement are shown in the Statement of Operations as Transfer agent fees.
The Trust has entered into a master distribution agreement with Invesco Distributors, Inc. (“IDI”) to serve as the distributor for the Fund. The Trust has adopted a plan pursuant to Rule 12b-1 under the 1940 Act with respect to the Fund’s Series II shares (the “Plan”). The Fund, pursuant to the Plan, pays IDI compensation at the annual rate of 0.25% of the Fund’s average daily net assets of Series II shares. Of the Plan payments, up to 0.25% of the average daily net assets of the Series II shares may be paid to insurance companies who furnish continuing personal shareholder services to customers who purchase and own Series II shares of the Fund. For the year ended December 31, 2015, expenses incurred under the Plan are detailed in the Statement of Operations as Distribution fees.
Certain officers and trustees of the Trust are officers and directors of the Adviser, IIS and/or IDI.
NOTE 3—Additional Valuation Information
GAAP defines fair value as the price that would be received to sell an asset or paid to transfer a liability in an orderly transaction between market participants at the measurement date, under current market conditions. GAAP establishes a hierarchy that prioritizes the inputs to valuation methods, giving the highest priority to readily available unadjusted quoted prices in an active market for identical assets (Level 1) and the lowest priority to significant unobservable inputs (Level 3), generally when market prices are not readily available or are unreliable. Based on the valuation inputs, the securities or other investments are tiered into one of three levels. Changes in valuation methods may result in transfers in or out of an investment’s assigned level:
| | Level 1 — | Prices are determined using quoted prices in an active market for identical assets. |
| | Level 2 — | Prices are determined using other significant observable inputs. Observable inputs are inputs that other market participants may use in pricing a security. These may include quoted prices for similar securities, interest rates, prepayment speeds, credit risk, yield curves, loss severities, default rates, discount rates, volatilities and others. |
| | Level 3 — | Prices are determined using significant unobservable inputs. In situations where quoted prices or observable inputs are unavailable (for example, when there is little or no market activity for an investment at the end of the period), unobservable inputs may be used. Unobservable inputs reflect the Fund’s own assumptions about the factors market participants would use in determining fair value of the securities or instruments and would be based on the best available information. |
The following is a summary of the tiered valuation input levels, as of December 31, 2015. The level assigned to the securities valuations may not be an indication of the risk or liquidity associated with investing in those securities. Because of the inherent uncertainties of valuation, the values reflected in the financial statements may materially differ from the value received upon actual sale of those investments.
| | | | | | | | | | | | | | | | |
| | | Level 1 | | | Level 2 | | | Level 3 | | | Total | |
Equity Securities | | $ | 93,809,042 | | | $ | — | | | $ | — | | | $ | 93,809,042 | |
Futures Contracts* | | | (8,490 | ) | | | — | | | | — | | | | (8,490 | ) |
Total Investments | | $ | 93,800,552 | | | $ | — | | | $ | — | | | $ | 93,800,552 | |
| * | Unrealized appreciation (depreciation). |
NOTE 4—Derivative Investments
Value of Derivative Investments at Period-End
The table below summarizes the value of the Fund’s derivative investments, detailed by primary risk exposure, held as of December 31, 2015:
| | | | | | | | |
| | | Value | |
| Risk Exposure/Derivative Type | | Assets | | | Liabilities | |
Equity risk: | | | | | | | | |
Futures contracts(a) | | $ | — | | | $ | (8,490 | ) |
| (a) | Includes cumulative appreciation (depreciation) of futures contracts. Only current day’s variation margin receivable (payable) is reported within the Statement of Assets and Liabilities. |
Invesco V.I. S&P 500 Index Fund
Effect of Derivative Investments for the year ended December 31, 2015
The table below summarizes the gains (losses) on derivative investments, detailed by primary risk exposure, recognized in earnings during the period:
| | | | |
| | | Location of Gain (Loss) on
Statement of Operations | |
| | | Futures Contracts | |
Realized Gain: | | | | |
Equity risk | | $ | 80,837 | |
Change in Net Unrealized Appreciation (Depreciation): | | | | |
Equity risk | | | (1,051 | ) |
Total | | $ | 79,786 | |
The table below summarizes the average notional value of futures contracts outstanding during the period.
| | | | |
| | | Futures Contracts | |
Average notional value | | $ | 1,626,488 | |
| | | | | | | | | | | | | | | | | | | | |
| Open Futures Contracts — Equity Risk | |
| Futures Contracts | | Type of
Contract | | | Number of Contracts | | | Expiration Month | | | Notional Value | | | Unrealized
Appreciation
(Depreciation) | |
E-Mini S&P 500 Index | | | Long | | | | 30 | | | | March-2016 | | | $ | 3,053,100 | | | $ | (8,490 | ) |
NOTE 5—Investments in Affiliates
The Fund’s Adviser is a subsidiary of Invesco Ltd. and therefore, Invesco Ltd. is considered to be affiliated with the Fund. The following is a summary of the transactions in, and earnings from, investments in Invesco Ltd. for the year ended December 31, 2015.
| | | | | | | | | | | | | | | | | | | | | | | | | | | | |
| | | Value 12/31/14 | | | Purchases
at Cost | | | Proceeds
from Sales | | | Change in
Unrealized
Appreciation
(Depreciation) | | | Realized
Gain | | | Value 12/31/15 | | | Dividend
Income | |
Invesco Ltd. | | $ | 94,729 | | | $ | 1,938 | | | $ | (10,449 | ) | | $ | (16,257 | ) | | $ | 2,590 | | | $ | 72,551 | | | $ | 2,383 | |
NOTE 6—Trustees’ and Officers’ Fees and Benefits
Trustees’ and Officers’ Fees and Benefits include amounts accrued by the Fund to pay remuneration to certain Trustees and Officers of the Fund. Trustees have the option to defer compensation payable by the Fund, and Trustees’ and Officers’ Fees and Benefits also include amounts accrued by the Fund to fund such deferred compensation amounts. Those Trustees who defer compensation have the option to select various Invesco Funds in which their deferral accounts shall be deemed to be invested. Finally, certain current Trustees were eligible to participate in a retirement plan that provided for benefits to be paid upon retirement to Trustees over a period of time based on the number of years of service. The Fund may have certain former Trustees who also participate in a retirement plan and receive benefits under such plan. Trustees’ and Officers’ Fees and Benefits include amounts accrued by the Fund to fund such retirement benefits. Obligations under the deferred compensation and retirement plans represent unsecured claims against the general assets of the Fund.
NOTE 7—Cash Balances
The Fund is permitted to temporarily carry a negative or overdrawn balance in its account with State Street Bank and Trust Company, the custodian bank. Such balances, if any at period end, are shown in the Statement of Assets and Liabilities under the payable caption Amount due custodian. To compensate the custodian bank for such overdrafts, the overdrawn Fund may either (1) leave funds as a compensating balance in the account so the custodian bank can be compensated by earning the additional interest; or (2) compensate by paying the custodian bank at a rate agreed upon by the custodian bank and Invesco, not to exceed the contractually agreed upon rate.
Invesco V.I. S&P 500 Index Fund
NOTE 8—Distributions to Shareholders and Tax Components of Net Assets
Tax Character of Distributions to Shareholders Paid During the Fiscal Years Ended December 31, 2015 and 2014:
| | | | | | | | |
| | | 2015 | | | 2014 | |
Ordinary income | | $ | 1,500,931 | | | $ | 1,702,084 | |
Long-term capital gain | | | 8,299,732 | | | | — | |
Total distributions | | $ | 9,800,663 | | | $ | 1,702,084 | |
Tax Components of Net Assets at Period-End:
| | | | |
| | | 2015 | |
Undistributed ordinary income | | $ | 1,388,007 | |
Undistributed long-term gain | | | 6,677,843 | |
Net unrealized appreciation — investments | | | 50,957,499 | |
Temporary book/tax differences | | | (37,078 | ) |
Shares of beneficial interest | | | 34,868,281 | |
Total net assets | | $ | 93,854,552 | |
The difference between book-basis and tax-basis unrealized appreciation (depreciation) is due to differences in the timing of recognition of gains and losses on investments for tax and book purposes. The Fund’s net unrealized appreciation difference is attributable primarily to wash sales.
The temporary book/tax differences are a result of timing differences between book and tax recognition of income and/or expenses. The Fund’s temporary book/tax differences are the result of the trustee deferral of compensation and retirement plan benefits.
Capital loss carryforward is calculated and reported as of a specific date. Results of transactions and other activity after that date may affect the amount of capital loss carryforward actually available for the Fund to utilize. Capital losses generated in years beginning after December 22, 2010 can be carried forward for an unlimited period, whereas previous losses expire in eight tax years. Capital losses with an expiration period may not be used to offset capital gains until all net capital losses without an expiration date have been utilized. Capital loss carryforwards with no expiration date will retain their character as either short-term or long-term capital losses instead of as short-term capital losses as under prior law. The ability to utilize capital loss carryforwards in the future may be limited under the Internal Revenue Code and related regulations based on the results of future transactions.
The Fund does not have a capital loss carryforward as of December 31, 2015.
NOTE 9—Investment Securities
The aggregate amount of investment securities (other than short-term securities, U.S. Treasury obligations and money market funds, if any) purchased and sold by the Fund during the year ended December 31, 2015 was $6,407,800 and $15,327,928, respectively. Cost of investments on a tax basis includes the adjustments for financial reporting purposes as of the most recently completed federal income tax reporting period-end.
| | | | |
| Unrealized Appreciation (Depreciation) of Investment Securities on a Tax Basis | |
Aggregate unrealized appreciation of investment securities | | $ | 52,126,769 | |
Aggregate unrealized (depreciation) of investment securities | | | (1,169,270 | ) |
Net unrealized appreciation of investment securities | | $ | 50,957,499 | |
Cost of investments for tax purposes is $42,851,543.
NOTE 10—Reclassification of Permanent Differences
Primarily as a result of differing book/tax treatment of income related to corporate actions, on December 31, 2015, undistributed net investment income was increased by $49,005 and undistributed net realized gain was decreased by $49,005. This reclassification had no effect on the net assets of the Fund.
Invesco V.I. S&P 500 Index Fund
NOTE 11—Share Information
| | | | | | | | | | | | | | | | |
| | | Summary of Share Activity | |
| | | Years ended December 31, | |
| | | 2015(a) | | | 2014 | |
| | | Shares | | | Amount | | | Shares | | | Amount | |
Sold: | | | | | | | | | | | | | | | | |
Series I` | | | 198,942 | | | $ | 3,658,032 | | | | 94,973 | | | $ | 1,667,562 | |
Series II | | | 829,156 | | | | 14,909,372 | | | | 336,901 | | | | 5,906,132 | |
| | | | |
Issued as reinvestment of dividends: | | | | | | | | | | | | | | | | |
Series I | | | 245,490 | | | | 3,829,645 | | | | 39,005 | | | | 686,494 | |
Series II | | | 384,407 | | | | 5,969,839 | | | | 57,956 | | | | 1,015,390 | |
| | | | |
Reacquired: | | | | | | | | | | | | | | | | |
Series I | | | (332,597 | ) | | | (6,134,566 | ) | | | (310,830 | ) | | | (5,405,164 | ) |
Series II | | | (1,135,870 | ) | | | (20,629,738 | ) | | | (1,029,367 | ) | | | (17,701,320 | ) |
Net increase (decrease) in share activity | | | 189,528 | | | $ | 1,602,584 | | | | (811,362 | ) | | $ | (13,830,906 | ) |
| (a) | There are entities that are record owners of more than 5% of the outstanding shares of the Fund and in the aggregate own 92% of the outstanding shares of the Fund. The Fund and the Fund’s principal underwriter or adviser, are parties to participation agreements with these entities whereby these entities sell units of interest in separate accounts funding variable products that are invested in the Fund. The Fund, Invesco and/or Invesco affiliates may make payments to these entities, which are considered to be related to the Fund, for providing services to the Fund, Invesco and/or Invesco affiliates including but not limited to services such as, securities brokerage, third party record keeping and account servicing and administrative services. The Fund has no knowledge as to whether all or any portion of the shares owned of record by these entities are also owned beneficially. |
NOTE 12—Financial Highlights
The following schedule presents financial highlights for a share of the Fund outstanding throughout the periods indicated.
| | | | | | | | | | | | | | | | | | | | | | | | | | | | | | | | | | | | | | | | | | | | | | | | | | | | | | | | |
| | | Net asset
value,
beginning
of period | | | Net
investment
income(a) | | | Net gains
(losses)
on securities
(both
realized and
unrealized) | | | Total from
investment
operations | | | Dividends
from net
investment
income | | | Distributions
from net
realized
gains | | | Total
Distributions | | | Net asset
value, end
of period | | | Total
return(b) | | | Net assets,
end of period
(000’s omitted) | | | Ratio of
expenses
to average
net assets
with fee waivers
and/or expenses
absorbed | | | Ratio of
expenses
to average net
assets without
fee waivers
and/or expenses
absorbed | | | Ratio of net
investment
income
to average
net assets | | | Portfolio
turnover(c) | |
Series I | | | | | | | | | | | | | | | | | | | | | |
Year ended 12/31/15 | | $ | 18.52 | | | $ | 0.30 | | | $ | (0.24 | ) | | $ | 0.06 | | | $ | (0.33 | ) | | $ | (1.67 | ) | | $ | (2.00 | ) | | $ | 16.58 | | | | 1.03 | % | | $ | 35,586 | | | | 0.41 | %(d) | | | 0.41 | %(d) | | | 1.66 | %(d) | | | 7 | % |
Year ended 12/31/14 | | | 16.66 | | | | 0.28 | | | | 1.92 | | | | 2.20 | | | | (0.34 | ) | | | — | | | | (0.34 | ) | | | 18.52 | | | | 13.32 | | | | 37,685 | | | | 0.41 | | | | 0.41 | | | | 1.62 | | | | 3 | |
Year ended 12/31/13 | | | 12.89 | | | | 0.24 | | | | 3.84 | | | | 4.08 | | | | (0.31 | ) | | | — | | | | (0.31 | ) | | | 16.66 | | | | 31.91 | | | | 36,853 | | | | 0.41 | | | | 0.41 | | | | 1.63 | | | | 4 | |
Year ended 12/31/12 | | | 11.36 | | | | 0.25 | | | | 1.54 | | | | 1.79 | | | | (0.26 | ) | | | — | | | | (0.26 | ) | | | 12.89 | | | | 15.77 | | | | 32,634 | | | | 0.33 | | | | 0.39 | | | | 1.97 | | | | 4 | |
Year ended 12/31/11 | | | 11.42 | | | | 0.21 | | | | (0.04 | ) | | | 0.17 | | | | (0.23 | ) | | | — | | | | (0.23 | ) | | | 11.36 | | | | 1.76 | | | | 32,889 | | | | 0.28 | | | | 0.31 | | | | 1.81 | | | | 4 | |
Series II | |
Year ended 12/31/15 | | | 18.43 | | | | 0.25 | | | | (0.24 | ) | | | 0.01 | | | | (0.28 | ) | | | (1.67 | ) | | | (1.95 | ) | | | 16.49 | | | | 0.72 | | | | 58,268 | | | | 0.66 | (d) | | | 0.66 | (d) | | | 1.41 | (d) | | | 7 | |
Year ended 12/31/14 | | | 16.58 | | | | 0.24 | | | | 1.90 | | | | 2.14 | | | | (0.29 | ) | | | — | | | | (0.29 | ) | | | 18.43 | | | | 13.02 | | | | 63,667 | | | | 0.66 | | | | 0.66 | | | | 1.37 | | | | 3 | |
Year ended 12/31/13 | | | 12.83 | | | | 0.20 | | | | 3.82 | | | | 4.02 | | | | (0.27 | ) | | | — | | | | (0.27 | ) | | | 16.58 | | | | 31.55 | | | | 67,793 | | | | 0.66 | | | | 0.66 | | | | 1.38 | | | | 4 | |
Year ended 12/31/12 | | | 11.30 | | | | 0.22 | | | | 1.54 | | | | 1.76 | | | | (0.23 | ) | | | — | | | | (0.23 | ) | | | 12.83 | | | | 15.52 | | | | 64,657 | | | | 0.58 | | | | 0.64 | | | | 1.72 | | | | 4 | |
Year ended 12/31/11 | | | 11.35 | | | | 0.18 | | | | (0.03 | ) | | | 0.15 | | | | (0.20 | ) | | | — | | | | (0.20 | ) | | | 11.30 | | | | 1.53 | | | | 67,378 | | | | 0.53 | | | | 0.56 | | | | 1.56 | | | | 4 | |
| (a) | Calculated using average shares outstanding. |
| (b) | Includes adjustments in accordance with accounting principles generally accepted in the United States of America and as such, the net asset value for financial reporting purposes and the returns based upon those net asset values may differ from the net asset value and returns for shareholder transactions. Total returns are not annualized for periods less than one year, if applicable, and do not reflect charges assessed in connection with a variable product, which if included would reduce total returns. |
| (c) | Portfolio turnover is calculated at the fund level and is not annualized for periods less than one year, if applicable. |
| (d) | Ratios are based on average daily net assets (000’s omitted) of $36,581 and $60,378 for Series I and Series II shares, respectively. |
Invesco V.I. S&P 500 Index Fund
Report of Independent Registered Public Accounting Firm
To the Board of Trustees of AIM Variable Insurance Funds (Invesco Variable Insurance Funds)
and Shareholders of Invesco V.I. S&P 500 Index Fund:
In our opinion, the accompanying statement of assets and liabilities, including the schedule of investments, and the related statements of operations and of changes in net assets and the financial highlights present fairly, in all material respects, the financial position of Invesco V.I. S&P 500 Index Fund (one of the funds constituting AIM Variable Insurance Funds (Invesco Variable Insurance Funds), hereafter referred to as the “Fund”) at December 31, 2015, the results of its operations for the year then ended, the changes in its net assets for each of the two years in the period then ended and the financial highlights for each of the five years in the period then ended, in conformity with accounting principles generally accepted in the United States of America. These financial statements and financial highlights (hereafter referred to as “financial statements”) are the responsibility of the Fund’s management. Our responsibility is to express an opinion on these financial statements based on our audits. We conducted our audits of these financial statements in accordance with the standards of the Public Company Accounting Oversight Board (United States). Those standards require that we plan and perform the audit to obtain reasonable assurance about whether the financial statements are free of material misstatement. An audit includes examining, on a test basis, evidence supporting the amounts and disclosures in the financial statements, assessing the accounting principles used and significant estimates made by management, and evaluating the overall financial statement presentation. We believe that our audits, which included confirmation of securities at December 31, 2015 by correspondence with the custodian and brokers, and the application of alternative auditing procedures where confirmations of security purchases have not been received, provide a reasonable basis for our opinion.
PRICEWATERHOUSECOOPERS LLP
Houston, Texas
February 15, 2016
Invesco V.I. S&P 500 Index Fund
Calculating your ongoing Fund expenses
Example
As a shareholder of the Fund, you incur ongoing costs, including management fees; distribution and/or service fees (12b-1); and other Fund expenses. This example is intended to help you understand your ongoing costs (in dollars) of investing in the Fund and to compare these costs with ongoing costs of investing in other mutual funds. The example is based on an investment of $1,000 invested at the beginning of the period and held for the entire period July 1, 2015 through December 31, 2015.
The actual and hypothetical expenses in the examples below do not represent the effect of any fees or other expenses assessed in connection with a variable product; if they did, the expenses shown would be higher while the ending account values shown would be lower.
Actual expenses
The table below provides information about actual account values and actual expenses. You may use the information in this table, together with the amount you invested, to estimate the expenses that you paid over the period. Simply divide your account value by $1,000 (for example, an $8,600 account value divided by $1,000 = 8.6), then multiply the result by the number in the table under the heading entitled “Actual Expenses Paid During Period” to estimate the expenses you paid on your account during this period.
Hypothetical example for comparison purposes
The table below also provides information about hypothetical account values and hypothetical expenses based on the Fund’s actual expense ratio and an assumed rate of return of 5% per year before expenses, which is not the Fund’s actual return.
The hypothetical account values and expenses may not be used to estimate the actual ending account balance or expenses you paid for the period. You may use this information to compare the ongoing costs of investing in the Fund and other funds. To do so, compare this 5% hypothetical example with the 5% hypothetical examples that appear in the shareholder reports of the other funds.
Please note that the expenses shown in the table are meant to highlight your ongoing costs. Therefore, the hypothetical information is useful in comparing ongoing costs, and will not help you determine the relative total costs of owning different funds.
| | | | | | | | | | | | | | | | | | | | | | | | |
| Class | | Beginning
Account Value
(07/01/15) | | | ACTUAL | | | HYPOTHETICAL (5% annual return before expenses) | | | Annualized
Expense Ratio | |
| | | Ending
Account Value
(12/31/15)1 | | | Expenses
Paid During
Period2 | | | Ending
Account Value
(12/31/15) | | | Expenses
Paid During
Period2 | | |
| Series I | | $ | 1,000.00 | | | $ | 999.50 | | | $ | 2.12 | | | $ | 1,023.09 | | | $ | 2.14 | | | | 0.42 | % |
| Series II | | | 1,000.00 | | | | 997.50 | | | | 3.37 | | | | 1,021.83 | | | | 3.41 | | | | 0.67 | |
| 1 | The actual ending account value is based on the actual total return of the Fund for the period July 1, 2015 through December 31, 2015, after actual expenses and will differ from the hypothetical ending account value which is based on the Fund’s expense ratio and a hypothetical annual return of 5% before expenses. |
| 2 | Expenses are equal to the Fund’s annualized expense ratio as indicated above multiplied by the average account value over the period, multiplied by 184/365 to reflect the most recent fiscal half year. |
Invesco V.I. S&P 500 Index Fund
Tax Information
Form 1099-DIV, Form 1042-S and other year–end tax information provide shareholders with actual calendar year amounts that should be included in their tax returns. Shareholders should consult their tax advisors.
The following distribution information is being provided as required by the Internal Revenue Code or to meet a specific state’s requirement.
The Fund designates the following amounts or, if subsequently determined to be different, the maximum amount allowable for its fiscal year ended December 31, 2015:
| | | | |
Federal and State Income Tax | |
Long-Term Capital Gain Distributions | | $ | 8,299,732 | |
Corporate Dividends Received Deduction* | | | 100.00 | % |
U.S. Treasury Obligations* | | | 0.00 | % |
| | * | The above percentages are based on ordinary income dividends paid to shareholders during the Fund’s fiscal year. |
Invesco V.I. S&P 500 Index Fund
Trustees and Officers
The address of each trustee and officer is AIM Variable Insurance Funds (Invesco Variable Insurance Funds) (the “Trust”), 11 Greenway Plaza, Suite 1000, Houston, Texas 77046-1173. The trustees serve for the life of the Trust, subject to their earlier death, incapacitation, resignation, retirement or removal as more specifically provided in the Trust’s organizational documents. Each officer serves for a one year term or until their successors are elected and qualified. Column two below includes length of time served with predecessor entities, if any.
| | | | | | | | |
Name, Year of Birth and
Position(s) Held with the Trust | | Trustee and/
or Officer Since | | Principal Occupation(s)
During Past 5 Years | | Number of Funds in Fund Complex Overseen by Trustee | | Other Directorship(s) Held by Trustee During Past 5 Years |
| Interested Persons | | | | | | | | |
| Martin L. Flanagan1 — 1960 Trustee | | 2007 | | Executive Director, Chief Executive Officer and President, Invesco Ltd. (ultimate parent of Invesco and a global investment management firm); Advisor to the Board, Invesco Advisers, Inc. (formerly known as Invesco Institutional (N.A.), Inc.); Trustee, The Invesco Funds; Vice Chair, Investment Company Institute; and Member of Executive Board, SMU Cox School of Business Formerly: Chairman and Chief Executive Officer, Invesco Advisers, Inc. (registered investment adviser); Director, Chairman, Chief Executive Officer and President, IVZ Inc. (holding company), INVESCO Group Services, Inc. (service provider) and Invesco North American Holdings, Inc. (holding company); Director, Chief Executive Officer and President, Invesco Holding Company Limited (parent of Invesco and a global investment management firm); Director, Invesco Ltd.; Chairman, Investment Company Institute and President, Co-Chief Executive Officer, Co-President, Chief Operating Officer and Chief Financial Officer, Franklin Resources, Inc. (global investment management organization) | | 146 | | None |
Philip A. Taylor2 — 1954 Trustee, President and Principal Executive Officer | | 2006 | | Head of North American Retail and Senior Managing Director, Invesco Ltd.; Director, Co-Chairman, Co-President and Co-Chief Executive Officer, Invesco Advisers, Inc. (formerly known as Invesco Institutional (N.A.), Inc.) (registered investment adviser); Director, Chairman, Chief Executive Officer and President, Invesco Management Group, Inc. (formerly known as Invesco Aim Management Group, Inc.) (financial services holding company); Director and Chairman, Invesco Investment Services, Inc. (formerly known as Invesco Aim Investment Services, Inc.) (registered transfer agent) Chief Executive Officer, Invesco Corporate Class Inc. (corporate mutual fund company) Director, Chairman and Chief Executive Officer, Invesco Canada Ltd. (formerly known as Invesco Trimark Ltd./Invesco Trimark Ltèe) (registered investment adviser and registered transfer agent); Trustee, President and Principal Executive Officer, The Invesco Funds (other than AIM Treasurer’s Series Trust (Invesco Treasurer’s Series Trust), Short-Term Investments Trust and Invesco Management Trust); Trustee and Executive Vice President, The Invesco Funds (AIM Treasurer’s Series Trust (Invesco Treasurer’s Series Trust), Short-Term Investments Trust and Invesco Management Trust only); Director, Invesco Investment Advisers LLC (formerly known as Van Kampen Asset Management); Director, Chief Executive Officer and President, Van Kampen Exchange Corp. Formerly: Director and President, INVESCO Funds Group, Inc. (registered investment adviser and registered transfer agent); Director and Chairman, IVZ Distributors, Inc. (formerly known as INVESCO Distributors, Inc.) (registered broker dealer); Director, President and Chairman, Invesco Inc. (holding company), Invesco Canada Holdings Inc. (holding company), Trimark Investments Ltd./Placements Trimark Ltèe and Invesco Financial Services Ltd/Services Financiers Invesco Ltèe; Chief Executive Officer, Invesco Canada Fund Inc (corporate mutual fund company); Director and Chairman, Van Kampen Investor Services Inc.; Director, Chief Executive Officer and President, 1371 Preferred Inc. (holding company) and Van Kampen Investments Inc.; Director and President, AIM GP Canada Inc. (general partner for limited partnerships) and Van Kampen Advisors, Inc.; Director and Chief Executive Officer, Invesco Trimark Dealer Inc. (registered broker dealer); Director, Invesco Distributors, Inc. (formerly known as Invesco Aim Distributors, Inc.) (registered broker dealer); Manager, Invesco PowerShares Capital Management LLC; Director, Chief Executive Officer and President, Invesco Advisers, Inc.; Director, Chairman, Chief Executive Officer and President, Invesco Aim Capital Management, Inc.; President, Invesco Trimark Dealer Inc. and Invesco Trimark Ltd./Invesco Trimark Ltèe; Director and President, AIM Trimark Corporate Class Inc. and AIM Trimark Canada Fund Inc.; Senior Managing Director, Invesco Holding Company Limited; Director and Chairman, Fund Management Company (former registered broker dealer); President and Principal Executive Officer, The Invesco Funds (AIM Treasurer’s Series Trust (Invesco Treasurer’s Series Trust), and Short-Term Investments Trust only); President, AIM Trimark Global Fund Inc. and AIM Trimark Canada Fund Inc | | 146 | | None |
| 1 | Mr. Flanagan is considered an interested person (within the meaning of Section 2(a)(19) of the 1940 Act) of the Trust because he is an officer of the Adviser to the Trust, and an officer and a director of Invesco Ltd., ultimate parent of the Adviser. |
| 2 | Mr. Taylor is considered an interested person (within the meaning of Section 2(a)(19) of the 1940 Act) of the Trust because he is an officer and a director of the Adviser. |
Invesco V.I. S&P 500 Index Fund
Trustees and Officers—(continued)
| | | | | | | | |
Name, Year of Birth and
Position(s) Held with the Trust | | Trustee and/
or Officer Since | | Principal Occupation(s)
During Past 5 Years | | Number of Funds in Fund Complex Overseen by Trustee | | Other Directorship(s)
Held by Trustee During Past 5 Years |
| Independent Trustees | | | | | | | | |
Bruce L. Crockett — 1944 Trustee and Chair | | 2003 | | Chairman, Crockett Technologies Associates (technology consulting company) Formerly: Director, Captaris (unified messaging provider); Director, President and Chief Executive Officer, COMSAT Corporation; Chairman, Board of Governors of INTELSAT (international communications company); ACE Limited (insurance company); Independent Directors Council and Investment Company Institute | | 146 | | ALPS (Attorneys Liability Protection Society) (insurance company) and Globe Specialty Metals, Inc. (metallurgical company) |
David C. Arch — 1945 Trustee | | 2010 | | Chairman of Blistex Inc., a consumer health care products manufacturer | | 146 | | Board member of the Illinois Manufacturers’ Association; Member of the Board of Visitors, Institute for the Humanities, University of Michigan |
James T. Bunch — 1942 Trustee | | 2000 | | Managing Member, Grumman Hill Group LLC (family office/private equity investments) Formerly: Chairman of the Board of Trustees, Evans Scholars Foundation and Chairman, Board of Governors, Western Golf Association | | 146 | | Trustee, Evans Scholars Foundation; and Chairman of the Board, Denver Film Society |
Albert R. Dowden — 1941 Trustee | | 2003 | | Director of a number of public and private business corporations, including the Boss Group, Ltd. (private investment and management); Nature’s Sunshine Products, Inc. and Reich & Tang Funds (5 portfolios) (registered investment company) Formerly: Director, Homeowners of America Holding Corporation/Homeowners of America Insurance Company (property casualty company); Director, Continental Energy Services, LLC (oil and gas pipeline service); Director, CompuDyne Corporation (provider of product and services to the public security market) and Director, Annuity and Life Re (Holdings), Ltd. (reinsurance company); Director, President and Chief Executive Officer, Volvo Group North America, Inc.; Senior Vice President, AB Volvo; Director of various public and private corporations; Chairman, DHJ Media, Inc.; Director, Magellan Insurance Company; and Director, The Hertz Corporation, Genmar Corporation (boat manufacturer), National Media Corporation; Advisory Board of Rotary Power International (designer, manufacturer, and seller of rotary power engines); and Chairman, Cortland Trust, Inc. (registered investment company) | | 146 | | Director of: Nature’s Sunshine Products, Inc., Reich & Tang Funds, Homeowners of America Holding Corporation/ Homeowners of America Insurance Company, the Boss Group |
Jack M. Fields — 1952 Trustee | | 2003 | | Chief Executive Officer, Twenty First Century Group, Inc. (government affairs company); Owner and Chief Executive Officer, Dos Angeles Ranch, L.P. (cattle, hunting, corporate entertainment); and Discovery Global Education Fund (non-profit) Formerly: Chief Executive Officer, Texana Timber LP (sustainable forestry company); Director of Cross Timbers Quail Research Ranch (non-profit); and member of the U.S. House of Representatives | | 146 | | Insperity, Inc. (formerly known as Administaff) |
Eli Jones — Trustee | | 2016 | | Professor and Dean, Mays Business School, Texas A&M University Formerly: Professor and Dean, Walton College of Business, University of Arkansas, and E.J. Ourso College of Business, Louisiana State University | | 146 | | Director, Insperity, Inc., (2011-present) and ARVEST Bank (2012-2015) |
Prema Mathai-Davis — 1950 Trustee | | 2003 | | Retired. Formerly: Chief Executive Officer, YWCA of the U.S.A. | | 146 | | None |
Larry Soll — 1942 Trustee | | 1997 | | Retired. Formerly: Chairman, Chief Executive Officer and President, Synergen Corp. (a biotechnology company) | | 146 | | None |
Robert C. Troccoli — Trustee | | 2016 | | Retired. Formerly: Senior Partner, KPMG LLP | | 146 | | None |
Raymond Stickel, Jr. — 1944 Trustee | | 2005 | | Retired. Formerly: Director, Mainstay VP Series Funds, Inc. (25 portfolios) and Partner, Deloitte & Touche | | 146 | | None |
Suzanne H. Woolsey — 1941 Trustee | | 2014 | | Chief Executive Officer of Woolsey Partners LLC | | 146 | | Emeritus Chair of the Board of Trustees of the Institute for Defense Analyses; Trustee of Colorado College; Trustee of California Institute of Technology; Prior to 2014, Director of Fluor Corp.; Prior to 2010, Trustee of the German Marshall Fund of the United States; Prior to 2010 Trustee of the Rocky Mountain Institute |
Invesco V.I. S&P 500 Index Fund
Trustees and Officers—(continued)
| | | | | | | | |
Name, Year of Birth and
Position(s) Held with the Trust | | Trustee and/
or Officer Since | | Principal Occupation(s)
During Past 5 Years | | Number of Funds in Fund Complex Overseen by Trustee | | Other Directorship(s)
Held by Trustee During Past 5 Years |
| Other Officers | | | | | | | | |
Russell C. Burk — 1958 Senior Vice President and Senior Officer | | 2005 | | Senior Vice President and Senior Officer, The Invesco Funds | | N/A | | N/A |
John M. Zerr — 1962 Senior Vice President, Chief Legal Officer and Secretary | | 2006 | | Director, Senior Vice President, Secretary and General Counsel, Invesco Management Group, Inc. (formerly known as Invesco Aim Management Group, Inc.) and Van Kampen Exchange Corp.; Senior Vice President, Invesco Advisers, Inc. (formerly known as Invesco Institutional (N.A.), Inc.) (registered investment adviser); Senior Vice President and Secretary, Invesco Distributors, Inc. (formerly known as Invesco Aim Distributors, Inc.); Director, Vice President and Secretary, Invesco Investment Services, Inc. (formerly known as Invesco Aim Investment Services, Inc.); Senior Vice President, Chief Legal Officer and Secretary, The Invesco Funds; Managing Director, Invesco PowerShares Capital Management LLC; Director, Secretary and General Counsel, Invesco Investment Advisers LLC (formerly known as Van Kampen Asset Management); Secretary and General Counsel, Invesco Capital Markets, Inc. (formerly known as Van Kampen Funds Inc.) and Chief Legal Officer, PowerShares Exchange-Traded Fund Trust, PowerShares Exchange-Traded Fund Trust II, PowerShares India Exchange-Traded Fund Trust, PowerShares Actively Managed Exchange-Traded Fund Trust, and PowerShares Actively Managed Exchange-Traded Commodity Fund Trust Formerly: Director, Vice President and Secretary, IVZ Distributors, Inc. (formerly known as INVESCO distributors, Inc.); Director and Vice President, INVESCO Funds Group, Inc.; Director and Vice President, Van Kampen Advisors Inc.; Director, Vice President, Secretary and General Counsel, Van Kampen Investor Services Inc.; Director, Invesco Distributors, Inc. (formerly known as Invesco Aim Distributors, Inc.); Director, Senior Vice President, General Counsel and Secretary, Invesco Aim Advisers, Inc. and Van Kampen Investments Inc.; Director, Vice President and Secretary, Fund Management Company; Director, Senior Vice President, Secretary, General Counsel and Vice President, Invesco Aim Capital Management, Inc.; Chief Operating Officer and General Counsel, Liberty Ridge Capital, Inc. (an investment adviser); Vice President and Secretary, PBHG Funds (an investment company) and PBHG Insurance Series Fund (an investment company); Chief Operating Officer, General Counsel and Secretary, Old Mutual Investment Partners (a broker-dealer); General Counsel and Secretary, Old Mutual Fund Services (an administrator) and Old Mutual Shareholder Services (a shareholder servicing center); Executive Vice President, General Counsel and Secretary, Old Mutual Capital, Inc. (an investment adviser); and Vice President and Secretary, Old Mutual Advisors Funds (an investment company) | | N/A | | N/A |
Sheri Morris — 1964 Vice President, Treasurer and Principal Financial Officer | | 2003 | | Vice President, Treasurer and Principal Financial Officer, The Invesco Funds; Vice President, Invesco Advisers, Inc. (formerly known as Invesco Institutional (N.A.), Inc.) (registered investment adviser); and Vice President, PowerShares Exchange-Traded Fund Trust, PowerShares Exchange-Traded Fund Trust II, PowerShares India Exchange-Traded Fund Trust, PowerShares Actively Managed Exchange-Traded Fund Trust, and PowerShares Actively Managed Exchange-Traded Commodity Fund Trust Formerly: Vice President, Invesco Aim Advisers, Inc., Invesco Aim Capital Management, Inc. and Invesco Aim Private Asset Management, Inc.; Assistant Vice President and Assistant Treasurer, The Invesco Funds and Assistant Vice President, Invesco Advisers, Inc., Invesco Aim Capital Management, Inc. and Invesco Aim Private Asset Management, Inc.; and Treasurer, PowerShares Exchange-Traded Fund Trust, PowerShares Exchange-Traded Fund Trust II, PowerShares India Exchange-Traded Fund Trust and PowerShares Actively Managed Exchange-Traded Fund Trust | | N/A | | N/A |
Invesco V.I. S&P 500 Index Fund
Trustees and Officers—(continued)
| | | | | | | | |
Name, Year of Birth and
Position(s) Held with the Trust | | Trustee and/
or Officer Since | | Principal Occupation(s)
During Past 5 Years | | Number of Funds in Fund Complex Overseen by Trustee | | Other Directorship(s)
Held by Trustee During Past 5 Years |
| Other Officers—(continued) | | | | | | | | |
Karen Dunn Kelley — 1960 Vice President | | 2003 | | Senior Managing Director, Investments, Invesco Ltd.; Director, Co-President, Co-Chief Executive Officer, and Co-Chairman, Invesco Advisers, Inc. (formerly known as Invesco Institutional (N.A.), Inc.) (registered investment adviser); Chairman, Invesco Senior Secured Management, Inc.; Senior Vice President, Invesco Management Group, Inc. (formerly known as Invesco Aim Management Group, Inc.); Executive Vice President, Invesco Distributors, Inc. (formerly known as Invesco Aim Distributors, Inc.); Director, Invesco Mortgage Capital Inc. and Invesco Management Company Limited; Vice President, The Invesco Funds (other than AIM Treasurer’s Series Trust (Invesco Treasurer’s Series Trust), Short-Term Investments Trust and Invesco Management Trust); and President and Principal Executive Officer, The Invesco Funds (AIM Treasurer’s Series Trust (Invesco Treasurer’s Series Trust), Short-Term Investments Trust and Invesco Management Trust only) Formerly: Director and President, INVESCO Asset Management (Bermuda) Ltd., Director, INVESCO Global Asset Management Limited and INVESCO Management S.A.; Senior Vice President, Van Kampen Investments Inc. and Invesco Advisers, Inc. (formerly known as Invesco Institutional (N.A.), Inc.) (registered investment adviser); Vice President, Invesco Advisers, Inc. (formerly known as Invesco Institutional (N.A.), Inc.); Director of Cash Management and Senior Vice President, Invesco Advisers, Inc. and Invesco Aim Capital Management, Inc.; Director and President, Fund Management Company; Chief Cash Management Officer, Director of Cash Management, Senior Vice President, and Managing Director, Invesco Aim Capital Management, Inc.; Director of Cash Management, Senior Vice President, and Vice President, Invesco Advisers, Inc. and The Invesco Funds (AIM Treasurer’s Series Trust (Invesco Treasurer’s Series Trust), and Short-Term Investments Trust only) | | N/A | | N/A |
Crissie M. Wisdom — 1969 Anti-Money Laundering Compliance Officer | | 2013 | | Anti-Money Laundering Compliance Officer, Invesco Advisers, Inc. (formerly known as Invesco Institutional (N.A.), Inc.) (registered investment adviser), Invesco Capital Markets, Inc. (formerly known as Van Kampen Funds Inc.), Invesco Distributors, Inc., Invesco Investment Services, Inc., Invesco Management Group, Inc., Van Kampen Exchange Corp., The Invesco Funds, and PowerShares Exchange-Traded Fund Trust, PowerShares Exchange-Traded Fund Trust II, PowerShares India Exchange-Traded Fund Trust, PowerShares Actively Managed Exchange-Traded Fund Trust and PowerShares Actively Managed Exchange-Traded Commodity Fund Trust; Anti-Money Laundering Compliance Officer and Bank Secrecy Act Officer, INVESCO National Trust Company and Invesco Trust Company; and Fraud Prevention Manager and Controls and Risk Analysis Manager for Invesco Investment Services, Inc. | | N/A | | N/A |
Lisa O. Brinkley — 1959 Chief Compliance Officer | | 2015 | | Senior Vice President and Chief Compliance Officer, Invesco Advisers, Inc. (registered investment adviser) (formerly known as Invesco Institutional (N.A., Inc.); and Chief Compliance Officer, The Invesco Funds Formerly: Global Assurance Officer, Invesco Ltd. and Vice President, The Invesco Funds; Chief Compliance Officer, Invesco Distributors, Inc. (formerly known as Invesco Aim Distributors, Inc.), Invesco Investment Services, Inc.(formerly known as Invesco Aim Investment Services, Inc.) and Van Kampen Investor Services Inc.; Senior Vice President, Invesco Management Group, Inc.; Senior Vice President and Chief Compliance Officer, Invesco Advisers, Inc. and The Invesco Funds; Vice President and Chief Compliance Officer, Invesco Aim Capital Management, Inc. and Invesco Distributors, Inc.; Vice President, Invesco Investment Services, Inc. and Fund Management Company | | N/A | | N/A |
The Statement of Additional Information of the Trust includes additional information about the Fund’s Trustees and is available upon request, without charge, by calling 1.800.959.4246. Please refer to the Fund’s prospectus for information on the Fund’s sub-advisers.
| | | | | | |
Office of the Fund 11 Greenway Plaza, Suite 1000 Houston, TX 77046-1173 | | Investment Adviser Invesco Advisers, Inc. 1555 Peachtree Street, N.E. Atlanta, GA 30309 | | Distributor Invesco Distributors, Inc. 11 Greenway Plaza, Suite 1000 Houston, TX 77046-1173 | | Auditors PricewaterhouseCoopers LLP 1000 Louisiana Street, Suite 5800 Houston, TX 77002-5678 |
| | | |
| | | | | | |
Counsel to the Fund Stradley Ronon Stevens & Young, LLP 2005 Market Street, Suite 2600 Philadelphia, PA 19103-7018 | | Counsel to the Independent Trustees Goodwin Procter LLP 901 New York Avenue, N.W. Washington, D.C. 20001 | | Transfer Agent Invesco Investment Services, Inc. 11 Greenway Plaza, Suite 1000 Houston, TX 77046-1173 | | Custodian State Street Bank and Trust Company 225 Franklin Street Boston, MA 02110-2801 |
Invesco V.I. S&P 500 Index Fund
| | | | |
| | |

| | Annual Report to Shareholders | | December 31, 2015 |
| | |
| | Invesco V.I. Small Cap Equity Fund |

| | |
| | The Fund provides a complete list of its holdings four times in each fiscal year, at the quarter-ends. For the second and fourth quarters, the lists appear in the Fund’s semiannual and annual reports to shareholders. For the first and third quarters, the Fund files the lists with the Securities and Exchange Commission (SEC) on Form N-Q. The Fund’s Form N-Q filings are available on the SEC website, sec.gov. Copies of the Fund’s Forms N-Q may be reviewed and copied at the SEC Public Reference Room in Washington, D.C. You can obtain information on the operation of the Public Reference Room, including information about duplicating fee charges, by calling 202 551 8090 or 800 732 0330, or by electronic request at the following email address: publicinfo@sec.gov. The SEC file numbers for the Fund are 811-07452 and 033-57340. The Fund’s most recent portfolio holdings, as filed on Form N-Q, have also been made available to insurance companies issuing variable annuity contracts and variable life insurance policies (“variable products”) that invest in the Fund. A description of the policies and procedures that the Fund uses to determine how to vote proxies relating to portfolio securities is available without charge, upon request, from our Client Services department at 800 959 4246 or at invesco.com/proxyguidelines. The information is also available on the SEC website, sec.gov. Information regarding how the Fund voted proxies related to its portfolio securities during the most recent 12-month period ended June 30 is available at invesco.com/proxysearch. The information is also available on the SEC website, sec.gov. Invesco Advisers, Inc. is an investment adviser; it provides investment advisory services to individual and institutional clients and does not sell securities. Invesco Distributors, Inc. is the US distributor for Invesco Ltd.’s retail mutual funds, exchange-traded funds and institutional money market funds. Both are wholly owned, indirect subsidiaries of Invesco Ltd. This report must be accompanied or preceded by a currently effective Fund prospectus and variable product prospectus, which contain more complete information, including sales charges and expenses. Investors should read each carefully before investing. Invesco Distributors, Inc. VISCE-AR-1 NOT FDIC INSURED | MAY LOSE VALUE | NO BANK GUARANTEE |
Management’s Discussion of Fund Performance
Performance summary
For the year ended December 31, 2015, Series I shares of Invesco V.I. Small Cap Equity Fund (the Fund) underperformed the Fund’s style-specific index, the Russell 2000 Index.
Your Fund’s long-term performance appears later in this report.
Fund vs. Indexes
Total returns, 12/31/14 to 12/31/15, excluding variable product issuer charges.
If variable product issuer charges were included, returns would be lower.
| | | | | |
| Series I Shares | | | | -5.52 | % |
| Series II Shares | | | | -5.74 | |
| S&P 500 Index▼ (Broad Market Index) | | | | 1.38 | |
| Russell 2000 Index▼ (Style-Specific Index) | | | | -4.41 | |
| Lipper VUF Small-Cap Core Fund Indexn (Peer Group Index) | | | | -4.43 | |
Source(s): ▼FactSet Research Systems Inc.; nLipper Inc.
Market conditions and your Fund
The US economy continued its modest, but steady growth, during the year ended December 31, 2015 – although the health of individual economic sectors varied dramatically. The headline economic story was a steady decline in already-battered energy markets, as oil prices plummeted when increased supply overwhelmed demand. This decline particularly affected companies with US-based offshore or shale-based resources – companies whose cost to recover oil is higher than many traditional producers. On the other end of the spectrum, the improved position of the US consumer was the more subtle story which drove the US economy forward during the year.
As the year began, economic growth appeared to be stronger in the US than in the rest of the world. US equity markets were recovering from the crash of oil prices initiated by OPEC’s decision to maintain high production despite low prices and slowing global growth. The view that the US Federal Reserve (the Fed) would begin raising rates while other central banks were loosening monetary policy led the US dollar to strengthen
against many currencies. This hurt commodity- and materials-based economies – and companies in related sectors. Additionally, US-based multinational companies faced foreign exchange headwinds. Low interest rates, the increasing availability of credit and an improving employment picture all contributed to higher consumer confidence and consumer spending, which drove US equity markets higher, particularly through the spring, and helped overcome fears that Greece and the eurozone would fail to reach an agreement on a financial bailout plan.
In the summer of 2015, US equity markets moved sharply lower. A significant downturn in China’s financial markets and weak global economic growth led the Fed to delay raising interest rates; this, in turn, increased investor uncertainty and market volatility. A continued decline in oil prices also contributed to market volatility. In the fall, however, US markets rallied, the Fed saw enough economic stabilization to finally raise interest rates, and most major US market indexes ended the year barely in positive territory.
Within this environment, small-cap stocks underperformed large-cap stocks,
and the Fund turned in a negative return, modestly trailing its style-specific benchmark. The Fund outperformed its style-specific benchmark in several sectors due to positive stock selection decisions in the financials, consumer discretionary, materials and industrials sectors. These contributions were offset by underperformance in the health care, information technology (IT) and energy sectors.
The Fund outperformed its style-specific benchmark by the widest margin in the financials sector, driven by stock selection. Stancorp Financial Group is a life insurance company the Fund held, which was acquired during the year for a substantial premium. During the year, we sold our position in Stancorp locking in the gain for our shareholders. Western Alliance Bancorp was another contributor to Fund performance. In addition to reporting solid loan growth and financial results, Western Alliance completed the acquisition of another bank several months sooner than expected. E*TRADE was another contributor to Fund performance which received regulatory approval to reduce its capital reserves, allowing the company to deploy excess capital to reduce higher cost loans and improve returns.
The consumer discretionary sector was another area of relative strength versus the Fund’s style-specific benchmark. Sonic was a solid contributor to Fund performance as the company reported increased sales and profitability through the year. The rollout of new digital menu boards helped drive additional sales for the company, while simultaneously improving efficiency of service. In May, brand name retailer Ann Taylor was acquired by another company for a significant premium. We sold our position in Ann Taylor, recognizing a gain for our shareholders.
| | | | | |
| Portfolio Composition |
| By sector | | | | % of total net assets | |
| | | | | |
| |
| Financials | | | | 25.2 | % |
| Information Technology | | | | 18.8 | |
| Industrials | | | | 15.9 | |
| Consumer Discretionary | | | | 13.3 | |
| Health Care | | | | 13.1 | |
| Materials | | | | 5.8 | |
| Energy | | | | 3.1 | |
| Consumer Staples | | | | 2.0 | |
| Telecommunication Services | | | | 1.0 | |
| Utilities | | | | 0.9 | |
| Money Market Funds | | | | | |
| Plus Other Assets Less Liabilities | | | | 0.9 | |
| | |
| Top 10 Equity Holdings* |
| | % of total net assets |
| | | | | | | |
| | |
| 1. | | Dycom Industries, Inc. | | | | 1.9 | % |
| 2. | | E*TRADE Financial Corp. | | | | 1.5 | |
| 3. | | Western Alliance Bancorp | | | | 1.5 | |
| 4. | | Graphic Packaging Holding Co. | | | | 1.5 | |
| 5. | | Vail Resorts, Inc. | | | | 1.4 | |
| 6. | | Bank of the Ozarks, Inc. | | | | 1.4 | |
| 7. | | Waste Connections, Inc. | | | | 1.3 | |
| 8. | | Cray, Inc. | | | | 1.3 | |
| 9. | | Apogee Enterprises, Inc. | | | | 1.3 | |
| 10. | | Sonic Corp. | | | | 1.3 | |
| | | | | | | |
Total Net Assets | | | $ | 295.0 million | |
Total Number of Holdings* | | | | 102 | |
The Fund’s holdings are subject to change, and there is no assurance that the Fund will continue to hold any particular security.
*Excluding money market fund holdings.
Data presented here are as of December 31, 2015.
Invesco V.I. Small Cap Equity Fund
The Fund also outperformed in the materials sector where Fund holdings held up better than those in the style-specific index. Fund holding Sensient Technologies was an example of this and one of only a few small-cap materials stocks to post a positive return during the year.
The area of greatest challenge for the Fund was the health care sector. Many small-cap biotechnology companies do not have an FDA-approved drug yet to generate revenue, so their stock price movements are very volatile depending on the outcome of their drug’s trial-results, which are impossible to forecast. The Fund targets high quality companies, so in order to prudently manage these volatile stocks, we set very high hurdles before investing in biotechnology, which often leads us to a modest underweight position versus the Fund’s style-specific index. During the past year, biotechnology stocks outperformed and our underweight exposure to that group hurt relative performance. Certain Fund holdings did underperform, including hospital company Community Health Systems. Concerns arose later in the year surrounding the company’s debt levels and the slowing trend of utilization benefits it realized from the Affordable Care Act.
The Fund also underperformed in the IT sector. We purchased security company Barracuda Networks during the year, but its stock price pulled back significantly as the European portion of its business reported flat growth and dragged growth expectations for the entire company. Finisar was another detractor from Fund performance and we sold the position during the year.
Throughout the year, energy stocks struggled as oil prices remained under pressure. Despite a reduction in North American supply growth and expectations of a more balanced supply-demand dynamic, unexpected new oil supply came on the market from OPEC, thus pushing out a recovery. As commodity prices tumbled, energy was the worst-performing sector of the style-specific index by a wide margin. The Fund’s modest overweight exposure to this weak sector hurt performance, as did certain sector holdings, including Helix Energy Solutions.
Fund positioning did not change dramatically during the year, and is based on a disciplined investment process, which keeps the portfolio diversified across industry groups and uses rigorous fundamental research to identify attractive individual stocks.
Thank you for your commitment to Invesco V.I. Small Cap Equity Fund and for sharing our long-term investment horizon.
The views and opinions expressed in management’s discussion of Fund performance are those of Invesco Advisers, Inc. These views and opinions are subject to change at any time based on factors such as market and economic conditions. These views and opinions may not be relied upon as investment advice or recommendations, or as an offer for a particular security. The information is not a complete analysis of every aspect of any market, country, industry, security or the Fund. Statements of fact are from sources considered reliable, but Invesco Advisers, Inc. makes no representation or warranty as to their completeness or accuracy. Although historical performance is no guarantee of future results, these insights may help you understand our investment management philosophy.
See important Fund and, if applicable, index disclosures later in this report.
| | |
 | | Juliet Ellis Chartered Financial Analyst, Portfolio Manager and chief investment officer of |
Invesco’s domestic growth investments team, is lead manager of Invesco V.I. Small Cap Equity Fund. She joined Invesco in 2004. Ms. Ellis earned a BA in economics and political science from Indiana University. |
| |

| | Juan Hartsfield Chartered Financial Analyst, Portfolio Manager, is manager of Invesco V.I. Small Cap |
Equity Fund. He joined Invesco in 2004. Mr. Hartsfield earned a BS in petroleum engineering from The University of Texas at Austin and an MBA from the University of Michigan. |
|
Invesco V.I. Small Cap Equity Fund |
Your Fund’s Long-Term Performance
Results of a $10,000 Investment – Oldest Share Class(es)
Fund and index data from 12/31/05
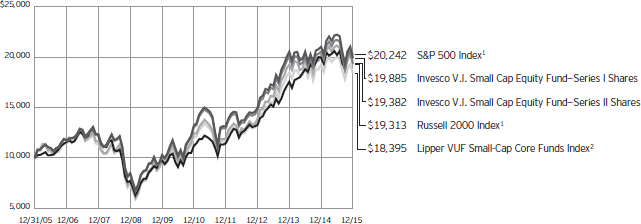
| 1 | Source: FactSet Research Systems Inc. |
Past performance cannot guarantee comparable future results.
| | | | | |
| Average Annual Total Returns |
As of 12/31/15 | | | | | |
| |
| Series I Shares | | | | | |
| Inception (8/29/03) | | | | 8.32 | % |
| 10 Years | | | | 7.12 | |
| 5 Years | | | | 8.49 | |
| 1 Year | | | | -5.52 | |
| |
| Series II Shares | | | | | |
| Inception (8/29/03) | | | | 8.06 | % |
| 10 Years | | | | 6.84 | |
| 5 Years | | | | 8.22 | |
| 1 Year | | | | -5.74 | |
The performance of the Fund’s Series I and Series II share classes will differ primarily due to different class expenses.
The performance data quoted represent past performance and cannot guarantee comparable future results; current performance may be lower or higher. Please contact your variable product issuer or financial adviser for the most recent month-end
variable product performance. Performance figures reflect Fund expenses, reinvested distributions and changes in net asset value. Investment return and principal value will fluctuate so that you may have a gain or loss when you sell shares.
The total annual Fund operating expense ratio set forth in the most recent Fund prospectus as of the date of this report for Series I and Series II shares was 1.05% and 1.30%, respectively. The expense ratios presented above may vary from the expense ratios presented in other sections of this report that are based on expenses incurred during the period covered by this report.
Invesco V.I. Small Cap Equity Fund, a series portfolio of AIM Variable Insurance Funds (Invesco Variable Insurance Funds), is currently offered through insurance companies issuing variable products. You cannot purchase shares of the Fund directly.
Performance figures given represent the Fund and are not intended to reflect actual variable product values. They do not reflect sales charges, expenses and fees assessed in connection with a variable product. Sales charges, expenses and fees, which are determined by the variable product issuers, will vary and will lower the total return.
The most recent month-end performance at the Fund level, excluding variable product charges, is available at 800 451 4246. As mentioned above, for the most recent month-end performance including variable product charges, please contact your variable product issuer or financial adviser.
Fund performance reflects any applicable fee waivers and/or expense reimbursements. Had the adviser not waived fees and/or reimbursed expenses currently or in the past, returns would have been lower. See current prospectus for more information.
Invesco V.I. Small Cap Equity Fund
Invesco V.I. Small Cap Equity Fund’s investment objective is long-term growth of capital.
| n | | Unless otherwise stated, information presented in this report is as of December 31, 2015, and is based on total net assets. |
| n | | Unless otherwise noted, all data provided by Invesco. |
| n | | To access your Fund’s reports/prospectus, visit invesco.com/fundreports. |
Principal risks of investing in the Fund
Foreign securities risk. The Fund’s foreign investments may be affected by changes in a foreign country’s exchange rates, political and social instability, changes in economic or taxation policies, difficulties when enforcing obligations, decreased liquidity, and increased volatility. Foreign companies may be subject to less regulation resulting in less publicly available information about the companies.
Management risk. The investment techniques and risk analysis used by the Fund’s portfolio managers may not produce the desired results.
Market risk. The prices of and the income generated by the Fund’s securities may decline in response to, among other things, investor sentiment, general economic and market conditions, regional or global instability, and currency and interest rate fluctuations.
Small- and mid-capitalization risks. Stocks of small- and mid-sized companies tend to be more vulnerable to adverse developments and may have little or no operating history or track record of success, and limited product lines, markets, management and financial resources. The securities of small- and mid-sized companies may be more volatile due to less market interest and less publicly available information about the issuer. They also may be illiquid or restricted as to resale, or may trade less frequently and in smaller volumes, all of which may cause difficulty when establishing or closing a position at a desirable price.
About indexes used in this report
The S&P 500® Index is an unmanaged index considered representative of the US stock market.
The Russell 2000® Index is an unmanaged index considered representative of small-cap stocks. The Russell 2000 Index is a trademark/service mark of the Frank Russell Co. Russell® is a trademark of the Frank Russell Co.
The Lipper VUF Small-Cap Core Funds Index is an unmanaged index considered representative of small-cap core variable insurance underlying funds tracked by Lipper.
The Fund is not managed to track the performance of any particular index, including the index(es) described here, and consequently, the performance of the Fund may deviate significantly from the performance of the index(es).
A direct investment cannot be made in an index. Unless otherwise indicated, index results include reinvested dividends, and they do not reflect sales charges. Performance of the peer group, if applicable, reflects fund expenses; performance of a market index does not.
Other information
The returns shown in management’s discussion of Fund performance are based on net asset values calculated for shareholder transactions. Generally accepted accounting principles require adjustments to be made to the net assets of the Fund at period end for financial reporting purposes, and as such, the net asset values for shareholder transactions and the returns based on those net asset values may differ from the net asset values and returns reported in the Financial Highlights. Additionally, the returns and net asset values shown throughout this report are at the Fund level only and do not include variable product issuer charges. If such charges were included, the total returns would be lower.
Industry classifications used in this report are generally according to the Global Industry Classification Standard, which was developed by and is the exclusive property and a service mark of MSCI Inc. and Standard & Poor’s.
|
Invesco V.I. Small Cap Equity Fund |
Schedule of Investments(a)
December 31, 2015
| | | | | | | | |
| | | Shares | | | Value | |
Common Stocks & Other Equity Interests–99.13% | |
| Air Freight & Logistics–0.88% | |
Forward Air Corp. | | | 60,467 | | | $ | 2,600,686 | |
|
| Alternative Carriers–0.98% | |
Iridium Communications Inc.(b)(c) | | | 343,837 | | | | 2,891,669 | |
|
| Apparel, Accessories & Luxury Goods–1.02% | |
Columbia Sportswear Co. | | | 61,499 | | | | 2,998,691 | |
|
| Application Software–4.66% | |
Blackbaud, Inc. | | | 50,760 | | | | 3,343,054 | |
Bottomline Technologies (de), Inc.(c) | | | 90,520 | | | | 2,691,160 | |
MicroStrategy Inc.–Class A(c) | | | 14,312 | | | | 2,565,998 | |
SS&C Technologies Holdings, Inc. | | | 43,011 | | | | 2,936,361 | |
Verint Systems Inc.(c) | | | 54,476 | | | | 2,209,546 | |
| | | | | | | | 13,746,119 | |
|
| Asset Management & Custody Banks–1.11% | |
Janus Capital Group Inc. | | | 232,858 | | | | 3,280,969 | |
|
| Biotechnology–0.83% | |
AMAG Pharmaceuticals, Inc.(c) | | | 47,029 | | | | 1,419,805 | |
Retrophin, Inc.(c) | | | 52,941 | | | | 1,021,232 | |
| | | | | | | | 2,441,037 | |
|
| Broadcasting–1.12% | |
Nexstar Broadcasting Group, Inc.–Class A | | | 56,150 | | | | 3,296,005 | |
|
| Building Products–2.20% | |
Apogee Enterprises, Inc. | | | 86,582 | | | | 3,767,183 | |
Trex Co., Inc.(c) | | | 71,421 | | | | 2,716,855 | |
| | | | | | | | 6,484,038 | |
|
| Casinos & Gaming–1.12% | |
Boyd Gaming Corp.(c) | | | 165,732 | | | | 3,293,095 | |
|
| Communications Equipment–1.10% | |
ARRIS Group Inc.(c) | | | 106,474 | | | | 3,254,910 | |
|
| Construction & Engineering–2.74% | |
Dycom Industries, Inc.(c) | | | 81,384 | | | | 5,693,625 | |
Primoris Services Corp. | | | 107,885 | | | | 2,376,706 | |
| | | | | | | | 8,070,331 | |
|
| Construction Materials–0.76% | |
Eagle Materials Inc. | | | 36,952 | | | | 2,233,009 | |
|
| Data Processing & Outsourced Services–1.89% | |
DST Systems, Inc. | | | 22,025 | | | | 2,512,172 | |
Jack Henry & Associates, Inc. | | | 39,339 | | | | 3,070,802 | |
| | | | | | | | 5,582,974 | |
|
| Diversified REIT’s–0.98% | |
Cousins Properties, Inc. | | | 305,300 | | | | 2,878,979 | |
| | | | | | | | |
| | | Shares | | | Value | |
| Diversified Support Services–0.85% | |
Mobile Mini, Inc. | | | 80,424 | | | $ | 2,503,599 | |
|
| Electrical Components & Equipment–1.10% | |
EnerSys | | | 58,017 | | | | 3,244,891 | |
|
| Electronic Components–0.63% | |
Belden Inc. | | | 39,214 | | | | 1,869,723 | |
|
| Environmental & Facilities Services–2.06% | |
Team, Inc.(c) | | | 68,768 | | | | 2,197,825 | |
Waste Connections, Inc. | | | 68,999 | | | | 3,886,024 | |
| | | | | | | | 6,083,849 | |
|
| Gas Utilities–0.86% | |
UGI Corp. | | | 75,464 | | | | 2,547,665 | |
|
| Health Care Equipment–4.18% | |
Analogic Corp. | | | 38,246 | | | | 3,159,120 | |
Globus Medical, Inc.–Class A(c) | | | 127,681 | | | | 3,552,085 | |
Hill-Rom Holdings, Inc. | | | 68,310 | | | | 3,282,979 | |
Wright Medical Group N.V.(c) | | | 97,294 | | | | 2,352,569 | |
| | | | | | | | 12,346,753 | |
|
| Health Care Facilities–1.35% | |
Community Health Systems Inc.(c) | | | 37,606 | | | | 997,687 | |
LifePoint Health, Inc.(c) | | | 40,821 | | | | 2,996,262 | |
| | | | | | | | 3,993,949 | |
|
| Health Care Services–0.80% | |
Team Health Holdings, Inc.(c) | | | 53,500 | | | | 2,348,115 | |
|
| Health Care Supplies–1.17% | |
Alere, Inc.(c) | | | 88,334 | | | | 3,452,976 | |
|
| Health Care Technology–0.59% | |
HMS Holdings Corp.(c) | | | 140,062 | | | | 1,728,365 | |
|
| Home Entertainment Software–1.06% | |
Take-Two Interactive Software, Inc.(c) | | | 89,874 | | | | 3,131,210 | |
|
| Home Furnishings–0.88% | |
La-Z-Boy Inc. | | | 105,742 | | | | 2,582,220 | |
|
| Homebuilding–0.57% | |
Beazer Homes USA, Inc.(c) | | | 146,656 | | | | 1,685,077 | |
|
| Household Appliances–1.21% | |
Helen of Troy Ltd.(c) | | | 37,806 | | | | 3,563,215 | |
|
| Industrial Machinery–1.98% | |
Albany International Corp.–Class A | | | 85,768 | | | | 3,134,821 | |
Watts Water Technologies, Inc.–Class A | | | 54,690 | | | | 2,716,452 | |
| | | | | | | | 5,851,273 | |
|
| Investment Banking & Brokerage–2.55% | |
E*TRADE Financial Corp.(c) | | | 153,417 | | | | 4,547,280 | |
See accompanying Notes to Financial Statements which are an integral part of the financial statements.
Invesco V.I. Small Cap Equity Fund
| | | | | | | | |
| | | Shares | | | Value | |
| Investment Banking & Brokerage–(continued) | |
Evercore Partners Inc.–Class A | | | 55,143 | | | $ | 2,981,582 | |
| | | | | | | | 7,528,862 | |
|
| IT Consulting & Other Services–1.29% | |
CACI International Inc.–Class A(c) | | | 9,579 | | | | 888,740 | |
Luxoft Holding, Inc.(c) | | | 37,638 | | | | 2,903,019 | |
| | | | | | | | 3,791,759 | |
|
| Leisure Facilities–1.40% | |
Vail Resorts, Inc. | | | 32,170 | | | | 4,117,438 | |
|
| Life & Health Insurance–1.10% | |
CNO Financial Group, Inc. | | | 169,707 | | | | 3,239,707 | |
|
| Life Sciences Tools & Services–2.21% | |
Affymetrix, Inc.(c) | | | 348,351 | | | | 3,514,862 | |
Bio-Techne Corp. | | | 33,391 | | | | 3,005,190 | |
| | | | | | | | 6,520,052 | |
|
| Multi-Line Insurance–1.79% | |
American Financial Group, Inc. | | | 51,861 | | | | 3,738,141 | |
Horace Mann Educators Corp. | | | 46,701 | | | | 1,549,539 | |
| | | | | | | | 5,287,680 | |
|
| Office Services & Supplies–0.91% | |
Pitney Bowes Inc. | | | 129,984 | | | | 2,684,170 | |
|
| Oil & Gas Drilling–0.48% | |
Precision Drilling Corp. (Canada) | | | 361,334 | | | | 1,423,656 | |
|
| Oil & Gas Equipment & Services–0.85% | |
Forum Energy Technologies Inc.(c) | | | 152,841 | | | | 1,904,399 | |
Helix Energy Solutions Group Inc.(c) | | | 113,277 | | | | 595,837 | |
| | | | | | | | 2,500,236 | |
|
| Oil & Gas Exploration & Production–0.87% | |
Newfield Exploration Co.(c) | | | 79,159 | | | | 2,577,417 | |
|
| Oil & Gas Storage & Transportation–0.89% | |
Scorpio Tankers Inc. (Monaco) | | | 327,702 | | | | 2,628,170 | |
|
| Packaged Foods & Meats–2.01% | |
Pinnacle Foods Inc. | | | 84,968 | | | | 3,607,741 | |
TreeHouse Foods, Inc.(c) | | | 29,570 | | | | 2,320,062 | |
| | | | | | | | 5,927,803 | |
|
| Paper Packaging–1.48% | |
Graphic Packaging Holding Co. | | | 340,720 | | | | 4,371,438 | |
|
| Pharmaceuticals–2.00% | |
Impax Laboratories, Inc.(c) | | | 77,877 | | | | 3,330,020 | |
Phibro Animal Health Corp.–Class A | | | 85,690 | | | | 2,581,840 | |
| | | | | | | | 5,911,860 | |
|
| Property & Casualty Insurance–1.05% | |
Hanover Insurance Group Inc. (The) | | | 37,997 | | | | 3,090,676 | |
|
| Real Estate Services–2.01% | |
Jones Lang LaSalle Inc. | | | 19,055 | | | | 3,046,132 | |
| | | | | | | | |
| | | Shares | | | Value | |
| Real Estate Services–(continued) | |
Kennedy-Wilson Holdings Inc. | | | 120,372 | | | $ | 2,898,558 | |
| | | | | | | | 5,944,690 | |
|
| Regional Banks–12.63% | |
Bank of the Ozarks, Inc. | | | 80,778 | | | | 3,995,280 | |
BankUnited, Inc. | | | 94,878 | | | | 3,421,301 | |
East West Bancorp, Inc. | | | 86,027 | | | | 3,575,282 | |
Glacier Bancorp, Inc. | | | 115,950 | | | | 3,076,154 | |
IBERIABANK Corp. | | | 46,117 | | | | 2,539,663 | |
PacWest Bancorp | | | 66,480 | | | | 2,865,288 | |
Pinnacle Financial Partners, Inc. | | | 55,655 | | | | 2,858,441 | |
PrivateBancorp, Inc. | | | 90,506 | | | | 3,712,556 | |
Synovus Financial Corp. | | | 112,466 | | | | 3,641,649 | |
Webster Financial Corp. | | | 82,290 | | | | 3,060,365 | |
Western Alliance Bancorp(c) | | | 126,204 | | | | 4,525,675 | |
| | | | | | | | 37,271,654 | |
|
| Restaurants–4.06% | |
Cracker Barrel Old Country Store, Inc.(b) | | | 23,055 | | | | 2,924,065 | |
Papa John’s International, Inc. | | | 48,971 | | | | 2,736,010 | |
Red Robin Gourmet Burgers Inc.(c) | | | 41,474 | | | | 2,560,605 | |
Sonic Corp. | | | 116,378 | | | | 3,760,173 | |
| | | | | | | | 11,980,853 | |
|
| Semiconductor Equipment–2.03% | |
Entegris Inc.(c) | | | 229,752 | | | | 3,048,809 | |
Tessera Technologies Inc. | | | 98,329 | | | | 2,950,853 | |
| | | | | | | | 5,999,662 | |
|
| Semiconductors–3.03% | |
Fairchild Semiconductor International, Inc.(c) | | | 155,563 | | | | 3,221,710 | |
Intersil Corp.–Class A | | | 209,595 | | | | 2,674,432 | |
Microsemi Corp.(c) | | | 93,203 | | | | 3,037,486 | |
| | | | | | | | 8,933,628 | |
|
| Specialized REIT’s–2.00% | |
CubeSmart | | | 122,593 | | | | 3,753,798 | |
Geo Group Inc. (The) | | | 74,185 | | | | 2,144,688 | |
| | | | | | | | 5,898,486 | |
|
| Specialty Chemicals–2.86% | |
Minerals Technologies Inc. | | | 53,247 | | | | 2,441,907 | |
PolyOne Corp. | | | 83,410 | | | | 2,649,102 | |
Sensient Technologies Corp. | | | 53,124 | | | | 3,337,250 | |
| | | | | | | | 8,428,259 | |
|
| Specialty Stores–1.91% | |
GNC Holdings, Inc.–Class A | | | 84,620 | | | | 2,624,912 | |
Michaels Cos., Inc. (The)(c) | | | 136,623 | | | | 3,020,735 | |
| | | | | | | | 5,645,647 | |
|
| Steel–0.76% | |
Haynes International, Inc. | | | 60,789 | | | | 2,230,348 | |
|
| Systems Software–0.72% | |
Barracuda Networks, Inc.(c) | | | 113,202 | | | | 2,114,613 | |
See accompanying Notes to Financial Statements which are an integral part of the financial statements.
Invesco V.I. Small Cap Equity Fund
| | | | | | | | |
| | | Shares | | | Value | |
| Technology Distributors–1.12% | |
Tech Data Corp.(c) | | | 49,921 | | | $ | 3,313,756 | |
|
| Technology Hardware, Storage & Peripherals–1.28% | |
Cray, Inc.(c) | | | 116,127 | | | | 3,768,321 | |
|
| Trucking–3.16% | |
Celadon Group, Inc. | | | 126,724 | | | | 1,253,301 | |
Heartland Express, Inc. | | | 130,310 | | | | 2,217,876 | |
Landstar System, Inc. | | | 46,402 | | | | 2,721,477 | |
Old Dominion Freight Line, Inc.(c) | | | 53,142 | | | | 3,139,098 | |
| | | | | | | | 9,331,752 | |
Total Common Stocks & Other Equity Interests
(Cost $256,552,175) | | | | 292,447,985 | |
|
Money Market Funds–0.69% | |
Liquid Assets Portfolio–Institutional Class, 0.29%(d) | | | 1,022,372 | | | | 1,022,372 | |
Premier Portfolio–Institutional Class, 0.24%(d) | | | 1,022,371 | | | | 1,022,371 | |
Total Money Market Funds
(Cost $2,044,743) | | | | 2,044,743 | |
TOTAL INVESTMENTS (excluding investments purchased with cash collateral from securities on loan)–99.82% (Cost $258,596,918) | | | | 294,492,728 | |
| | | | | | | | |
| | | Shares | | | Value | |
Investments Purchased with Cash Collateral from Securities on Loan | | | | | |
Money Market Funds–1.51% | |
Liquid Assets Portfolio–Institutional Class, 0.29% (Cost $4,465,960)(d)(e) | | | 4,465,960 | | | $ | 4,465,960 | |
TOTAL INVESTMENTS–101.33%
(Cost $263,062,878) | | | | 298,958,688 | |
OTHER ASSETS LESS LIABILITIES–(1.33)% | | | | (3,937,381 | ) |
NET ASSETS–100.00% | | | $ | 295,021,307 | |
Investment Abbreviations:
| | |
| REIT | | – Real Estate Investment Trust |
Notes to Schedule of Investments:
| (a) | Industry and/or sector classifications used in this report are generally according to the Global Industry Classification Standard, which was developed by and is the exclusive property and a service mark of MSCI Inc. and Standard & Poor’s. |
| (b) | All or a portion of this security was out on loan at December 31, 2015. |
| (c) | Non-income producing security. |
| (d) | The money market fund and the Fund are affiliated by having the same investment adviser. The rate shown is the 7-day SEC standardized yield as of December 31, 2015. |
| (e) | The security has been segregated to satisfy the commitment to return the cash collateral received in securities lending transactions upon the borrower’s return of the securities loaned. See Note 1I. |
See accompanying Notes to Financial Statements which are an integral part of the financial statements.
Invesco V.I. Small Cap Equity Fund
Statement of Assets and Liabilities
December 31, 2015
Statement of Operations
For the year ended December 31, 2015
| | | | |
Assets: | |
Investments, at value (Cost $256,552,175)* | | $ | 292,447,985 | |
Investments in affiliated money market funds, at value and cost | | | 6,510,703 | |
Total investments, at value (Cost $263,062,878) | | | 298,958,688 | |
Receivable for: | | | | |
Investments sold | | | 980,034 | |
Fund shares sold | | | 111,786 | |
Dividends | | | 180,341 | |
Investment for trustee deferred compensation and retirement plans | | | 68,199 | |
Total assets | | | 300,299,048 | |
| |
Liabilities: | | | | |
Payable for: | | | | |
Investments purchased | | | 216,715 | |
Fund shares reacquired | | | 222,966 | |
Collateral upon return of securities loaned | | | 4,465,960 | |
Accrued fees to affiliates | | | 271,813 | |
Accrued trustees’ and officers’ fees and benefits | | | 155 | |
Accrued other operating expenses | | | 22,675 | |
Trustee deferred compensation and retirement plans | | | 77,457 | |
Total liabilities | | | 5,277,741 | |
Net assets applicable to shares outstanding | | $ | 295,021,307 | |
| |
Net assets consist of: | | | | |
Shares of beneficial interest | | $ | 237,716,021 | |
Undistributed net investment income (loss) | | | (70,038 | ) |
Undistributed net realized gain | | | 21,479,514 | |
Net unrealized appreciation | | | 35,895,810 | |
| | | $ | 295,021,307 | |
|
Net Assets: | |
Series I | | $ | 166,406,982 | |
Series II | | $ | 128,614,325 | |
|
Shares outstanding, $0.001 par value per share,
with an unlimited number of shares authorized: | |
Series I | | | 9,434,480 | |
Series II | | | 7,583,628 | |
Series I: | | | | |
Net asset value per share | | $ | 17.64 | |
Series II: | | | | |
Net asset value per share | | $ | 16.96 | |
| * | At December 31, 2015, securities with an aggregate value of $4,349,574 were on loan to brokers. |
| | | | |
Investment income: | |
Dividends (net of foreign withholding taxes of $8,148) | | $ | 3,373,360 | |
Dividends from affiliated money market funds (includes securities lending income of $157,255) | | | 161,520 | |
Total investment income | | | 3,534,880 | |
| |
Expenses: | | | | |
Advisory fees | | | 2,480,121 | |
Administrative services fees | | | 890,580 | |
Custodian fees | | | 14,784 | |
Distribution fees — Series II | | | 361,310 | |
Transfer agent fees | | | 33,205 | |
Trustees’ and officers’ fees and benefits | | | 23,180 | |
Other | | | 45,890 | |
Total expenses | | | 3,849,070 | |
Less: Fees waived | | | (7,011 | ) |
Net expenses | | | 3,842,059 | |
Net investment income (loss) | | | (307,179 | ) |
| |
Realized and unrealized gain (loss) from: | | | | |
Net realized gain from investment securities (includes net gains from securities sold to affiliates of $1,384,758) | | | 22,151,222 | |
Change in net unrealized appreciation (depreciation) of investment securities | | | (39,686,407 | ) |
Net realized and unrealized gain (loss) | | | (17,535,185 | ) |
Net increase (decrease) in net assets resulting from operations | | $ | (17,842,364 | ) |
See accompanying Notes to Financial Statements which are an integral part of the financial statements.
Invesco V.I. Small Cap Equity Fund
Statement of Changes in Net Assets
For the years ended December 31, 2015 and 2014
| | | | | | | | |
| | | 2015 | | | 2014 | |
Operations: | | | | | |
Net investment income (loss) | | $ | (307,179 | ) | | $ | (956,866 | ) |
Net realized gain | | | 22,151,222 | | | | 64,529,783 | |
Change in net unrealized appreciation (depreciation) | | | (39,686,407 | ) | | | (57,506,374 | ) |
Net increase (decrease) in net assets resulting from operations | | | (17,842,364 | ) | | | 6,066,543 | |
| | |
Distributions to shareholders from net realized gains: | | | | | | | | |
Series l | | | (36,411,380 | ) | | | (18,790,735 | ) |
Series ll | | | (27,998,152 | ) | | | (12,734,891 | ) |
Total distributions from net realized gains | | | (64,409,532 | ) | | | (31,525,626 | ) |
| | |
Share transactions–net: | | | | | | | | |
Series l | | | 8,405,839 | | | | (42,863,057 | ) |
Series ll | | | 19,398,854 | | | | 21,003,451 | |
Net increase (decrease) in net assets resulting from share transactions | | | 27,804,693 | | | | (21,859,606 | ) |
Net increase (decrease) in net assets | | | (54,447,203 | ) | | | (47,318,689 | ) |
| | |
Net assets: | | | | | | | | |
Beginning of year | | | 349,468,510 | | | | 396,787,199 | |
End of year (includes undistributed net investment income (loss) of $(70,038) and $(75,503), respectively) | | $ | 295,021,307 | | | $ | 349,468,510 | |
Notes to Financial Statements
December 31, 2015
NOTE 1—Significant Accounting Policies
Invesco V.I. Small Cap Equity Fund (the “Fund”) is a series portfolio of AIM Variable Insurance Funds (Invesco Variable Insurance Funds) (the “Trust”). The Trust is a Delaware statutory trust registered under the Investment Company Act of 1940, as amended (the “1940 Act”), as an open-end series management investment company consisting of twenty-four separate portfolios, (each constituting a “Fund”). The assets, liabilities and operations of each portfolio are accounted for separately. Information presented in these financial statements pertains only to the Fund. Matters affecting each Fund or class will be voted on exclusively by the shareholders of such Fund or class. Current Securities and Exchange Commission (“SEC”) guidance, however, requires participating insurance companies offering separate accounts to vote shares proportionally in accordance with the instructions of the contract owners whose investments are funded by shares of each Fund or class.
The Fund’s investment objective is long-term growth of capital.
The Fund currently offers two classes of shares, Series I and Series II, both of which are offered to insurance company separate accounts funding variable annuity contracts and variable life insurance policies (“variable products”).
The following is a summary of the significant accounting policies followed by the Fund in the preparation of its financial statements.
| A. | Security Valuations — Securities, including restricted securities, are valued according to the following policy. |
A security listed or traded on an exchange (except convertible securities) is valued at its last sales price or official closing price as of the close of the customary trading session on the exchange where the security is principally traded, or lacking any sales or official closing price on a particular day, the security may be valued at the closing bid price on that day. Securities traded in the over-the-counter market are valued based on prices furnished by independent pricing services or market makers. When such securities are valued by an independent pricing service they may be considered fair valued. Futures contracts are valued at the final settlement price set by an exchange on which they are principally traded. Listed options are valued at the mean between the last bid and asked prices from the exchange on which they are principally traded. Options not listed on an exchange are valued by an independent source at the mean between the last bid and asked prices. For purposes of determining net asset value (“NAV”) per share, futures and option contracts generally are valued 15 minutes after the close of the customary trading session of the New York Stock Exchange (“NYSE”).
Investments in open-end and closed-end registered investment companies that do not trade on an exchange are valued at the end-of-day net asset value per share. Investments in open-end and closed-end registered investment companies that trade on an exchange are valued at the last sales price or official closing price as of the close of the customary trading session on the exchange where the security is principally traded.
Debt obligations (including convertible securities) and unlisted equities are fair valued using an evaluated quote provided by an independent pricing service. Evaluated quotes provided by the pricing service may be determined without exclusive reliance on quoted prices, and may reflect appropriate factors such as institution-size trading in similar groups of securities, developments related to specific securities, dividend rate (for unlisted equities), yield (for debt obligations), quality, type of issue, coupon rate (for debt obligations), maturity (for debt obligations), individual trading characteristics and other market data. Debt obligations are subject to interest rate and credit risks. In addition, all debt obligations involve some risk of default with respect to interest and/or principal payments.
Invesco V.I. Small Cap Equity Fund
Foreign securities’ (including foreign exchange contracts) prices are converted into U.S. dollar amounts using the applicable exchange rates as of the close of the NYSE. If market quotations are available and reliable for foreign exchange-traded equity securities, the securities will be valued at the market quotations. Because trading hours for certain foreign securities end before the close of the NYSE, closing market quotations may become unreliable. If between the time trading ends on a particular security and the close of the customary trading session on the NYSE, events occur that the Adviser determines are significant and make the closing price unreliable, the Fund may fair value the security. If the event is likely to have affected the closing price of the security, the security will be valued at fair value in good faith using procedures approved by the Board of Trustees. Adjustments to closing prices to reflect fair value may also be based on a screening process of an independent pricing service to indicate the degree of certainty, based on historical data, that the closing price in the principal market where a foreign security trades is not the current value as of the close of the NYSE. Foreign securities’ prices meeting the approved degree of certainty that the price is not reflective of current value will be priced at the indication of fair value from the independent pricing service. Multiple factors may be considered by the independent pricing service in determining adjustments to reflect fair value and may include information relating to sector indices, American Depositary Receipts and domestic and foreign index futures. Foreign securities may have additional risks including exchange rate changes, potential for sharply devalued currencies and high inflation, political and economic upheaval, the relative lack of issuer information, relatively low market liquidity and the potential lack of strict financial and accounting controls and standards.
Securities for which market prices are not provided by any of the above methods may be valued based upon quotes furnished by independent sources. The last bid price may be used to value equity securities. The mean between the last bid and asked prices is used to value debt obligations, including corporate loans.
Securities for which market quotations are not readily available or became unreliable are valued at fair value as determined in good faith by or under the supervision of the Trust’s officers following procedures approved by the Board of Trustees. Issuer specific events, market trends, bid/asked quotes of brokers and information providers and other market data may be reviewed in the course of making a good faith determination of a security’s fair value.
The Fund may invest in securities that are subject to interest rate risk, meaning the risk that the prices will generally fall as interest rates rise and, conversely, the prices will generally rise as interest rates fall. Specific securities differ in their sensitivity to changes in interest rates depending on their individual characteristics. Changes in interest rates may result in increased market volatility, which may affect the value and/or liquidity of certain Fund investments.
Valuations change in response to many factors including the historical and prospective earnings of the issuer, the value of the issuer’s assets, general economic conditions, interest rates, investor perceptions and market liquidity. Because of the inherent uncertainties of valuation, the values reflected in the financial statements may materially differ from the value received upon actual sale of those investments.
| B. | Securities Transactions and Investment Income — Securities transactions are accounted for on a trade date basis. Realized gains or losses on sales are computed on the basis of specific identification of the securities sold. Interest income (net of withholding tax, if any) is recorded on the accrual basis from settlement date. Dividend income (net of withholding tax, if any) is recorded on the ex-dividend date. |
The Fund may periodically participate in litigation related to Fund investments. As such, the Fund may receive proceeds from litigation settlements. Any proceeds received are included in the Statement of Operations as realized gain (loss) for investments no longer held and as unrealized gain (loss) for investments still held.
Brokerage commissions and mark ups are considered transaction costs and are recorded as an increase to the cost basis of securities purchased and/or a reduction of proceeds on a sale of securities. Such transaction costs are included in the determination of net realized and unrealized gain (loss) from investment securities reported in the Statement of Operations and the Statement of Changes in Net Assets and the net realized and unrealized gains (losses) on securities per share in the Financial Highlights. Transaction costs are included in the calculation of the Fund’s net asset value and, accordingly, they reduce the Fund’s total returns. These transaction costs are not considered operating expenses and are not reflected in net investment income reported in the Statement of Operations and the Statement of Changes in Net Assets, or the net investment income per share and the ratios of expenses and net investment income reported in the Financial Highlights, nor are they limited by any expense limitation arrangements between the Fund and the investment adviser.
The Fund allocates income and realized and unrealized capital gains and losses to a class based on the relative net assets of each class.
| C. | Country Determination — For the purposes of making investment selection decisions and presentation in the Schedule of Investments, the investment adviser may determine the country in which an issuer is located and/or credit risk exposure based on various factors. These factors include the laws of the country under which the issuer is organized, where the issuer maintains a principal office, the country in which the issuer derives 50% or more of its total revenues and the country that has the primary market for the issuer’s securities, as well as other criteria. Among the other criteria that may be evaluated for making this determination are the country in which the issuer maintains 50% or more of its assets, the type of security, financial guarantees and enhancements, the nature of the collateral and the sponsor organization. Country of issuer and/or credit risk exposure has been determined to be the United States of America, unless otherwise noted. |
| D. | Distributions — Distributions from net investment income and net realized capital gain, if any, are generally declared and paid to separate accounts of participating insurance companies annually and recorded on the ex-dividend date. |
| E. | Federal Income Taxes — The Fund intends to comply with the requirements of Subchapter M of the Internal Revenue Code of 1986, as amended (the “Internal Revenue Code”), necessary to qualify as a regulated investment company and to distribute substantially all of the Fund’s taxable earnings to shareholders. As such, the Fund will not be subject to federal income taxes on otherwise taxable income (including net realized capital gain) that is distributed to shareholders. Therefore, no provision for federal income taxes is recorded in the financial statements. |
The Fund recognizes the tax benefits of uncertain tax positions only when the position is more likely than not to be sustained. Management has analyzed the Fund’s uncertain tax positions and concluded that no liability for unrecognized tax benefits should be recorded related to uncertain tax positions. Management is not aware of any tax positions for which it is reasonably possible that the total amounts of unrecognized tax benefits will change materially in the next 12 months.
The Fund files tax returns in the U.S. Federal jurisdiction and certain other jurisdictions. Generally, the Fund is subject to examinations by such taxing authorities for up to three years after the filing of the return for the tax period.
| F. | Expenses — Fees provided for under the Rule 12b-1 plan of a particular class of the Fund and which are directly attributable to that class are charged to the operations of such class. All other expenses are allocated among the classes based on relative net assets. |
Invesco V.I. Small Cap Equity Fund
| G. | Accounting Estimates — The preparation of financial statements in conformity with accounting principles generally accepted in the United States of America (“GAAP”) requires management to make estimates and assumptions that affect the reported amounts of assets and liabilities at the date of the financial statements and the reported amounts of revenues and expenses during the reporting period including estimates and assumptions related to taxation. Actual results could differ from those estimates by a significant amount. In addition, the Fund monitors for material events or transactions that may occur or become known after the period-end date and before the date the financial statements are released to print. |
| H. | Indemnifications — Under the Trust’s organizational documents, each Trustee, officer, employee or other agent of the Trust is indemnified against certain liabilities that may arise out of the performance of their duties to the Fund. Additionally, in the normal course of business, the Fund enters into contracts, including the Fund’s servicing agreements, that contain a variety of indemnification clauses. The Fund’s maximum exposure under these arrangements is unknown as this would involve future claims that may be made against the Fund that have not yet occurred. The risk of material loss as a result of such indemnification claims is considered remote. |
| I. | Securities Lending — The Fund may lend portfolio securities having a market value up to one-third of the Fund’s total assets. Such loans are secured by collateral equal to no less than the market value of the loaned securities determined daily by the securities lending provider. Such collateral will be cash or debt securities issued or guaranteed by the U.S. Government or any of its sponsored agencies. Cash collateral received in connection with these loans is invested in short-term money market instruments or affiliated money market funds and is shown as such on the Schedule of Investments. The Fund bears the risk of loss with respect to the investment of collateral. It is the Fund’s policy to obtain additional collateral from or return excess collateral to the borrower by the end of the next business day, following the valuation date of the securities loaned. Therefore, the value of the collateral held may be temporarily less than the value of the securities on loan. When loaning securities, the Fund retains certain benefits of owning the securities, including the economic equivalent of dividends or interest generated by the security. Lending securities entails a risk of loss to the Fund if, and to the extent that, the market value of the securities loaned were to increase and the borrower did not increase the collateral accordingly, and the borrower failed to return the securities. The securities loaned are subject to termination at the option of the borrower or the Fund. Upon termination, the borrower will return to the Fund the securities loaned and the Fund will return the collateral. Upon the failure of the borrower to return the securities, collateral may be liquidated and the securities may be purchased on the open market to replace the loaned securities. The Fund could experience delays and costs in gaining access to the collateral and the securities may lose value during the delay which could result in potential losses to the Fund. Some of these losses may be indemnified by the lending agent. The Fund bears the risk of any deficiency in the amount of the collateral available for return to the borrower due to any loss on the collateral invested. Dividends received on cash collateral investments for securities lending transactions, which are net of compensation to counterparties, are included in Dividends from affiliated money market funds on the Statement of Operations. The aggregate value of securities out on loan, if any, is shown as a footnote on the Statement of Assets and Liabilities. |
NOTE 2—Advisory Fees and Other Fees Paid to Affiliates
The Trust has entered into a master investment advisory agreement with Invesco Advisers, Inc. (the “Adviser” or “Invesco”). Under the terms of the investment advisory agreement, the Fund pays an advisory fee to the Adviser based on the annual rate of the Fund’s average daily net assets as follows:
| | | | | | |
| Average Daily Net Assets | | Rate |
First $250 million | | | 0 | .745% | | |
Next $250 million | | | 0 | .73% | | |
Next $500 million | | | 0 | .715% | | |
Next $1.5 billion | | | 0 | .70% | | |
Next $2.5 billion | | | 0 | .685% | | |
Next $2.5 billion | | | 0 | .67% | | |
Next $2.5 billion | | | 0 | .655% | | |
Over $10 billion | | | 0 | .64% | | |
For the year ended December 31, 2015, the effective advisory fees incurred by the Fund was 0.74%.
Under the terms of a master sub-advisory agreement between the Adviser and each of Invesco Asset Management Deutschland GmbH, Invesco Asset Management Limited, Invesco Asset Management (Japan) Limited, Invesco Hong Kong Limited, Invesco Senior Secured Management, Inc. and Invesco Canada Ltd. (collectively, the “Affiliated Sub-Advisers”) the Adviser, not the Fund, may pay 40% of the fees paid to the Adviser to any such Affiliated Sub-Adviser(s) that provide(s) discretionary investment management services to the Fund based on the percentage of assets allocated to such Affiliated Sub-Adviser(s).
The Adviser has contractually agreed, through at least June 30, 2016, to waive advisory fees and/or reimburse expenses to the extent necessary to limit total annual fund operating expenses after fee waiver and/or expense reimbursement (excluding certain items discussed below) of Series I shares to 2.00% and Series II shares to 2.25% of average daily net assets. In determining the Adviser’s obligation to waive advisory fees and/or reimburse expenses, the following expenses are not taken into account, and could cause the total annual fund operating expenses after fee waiver and/or expense reimbursement to exceed the numbers reflected above: (1) interest; (2) taxes; (3) dividend expense on short sales; (4) extraordinary or non-routine items, including litigation expenses; and (5) expenses that the Fund has incurred but did not actually pay because of an expense offset arrangement. Unless Invesco continues the fee waiver agreement, it will terminate on June 30, 2016. The fee waiver agreement cannot be terminated during its term. The Adviser did not waive fees and/or reimburse expenses during the period under this expense limitation.
Further, the Adviser has contractually agreed, through at least June 30, 2017, to waive the advisory fee payable by the Fund in an amount equal to 100% of the net advisory fees the Adviser receives from the affiliated money market funds on investments by the Fund of uninvested cash (excluding investments of cash collateral from securities lending) in such affiliated money market funds.
For the year ended December 31, 2015, the Adviser waived advisory fees of $7,011.
Invesco V.I. Small Cap Equity Fund
The Trust has entered into a master administrative services agreement with Invesco pursuant to which the Fund has agreed to pay Invesco a fee for costs incurred in providing accounting services and fund administrative services to the Fund and to reimburse Invesco for administrative services fees paid to insurance companies that have agreed to provide services to the participants of separate accounts. These administrative services provided by the insurance companies may include, among other things: the printing of prospectuses, financial reports and proxy statements and the delivery of the same to existing participants; the maintenance of master accounts; the facilitation of purchases and redemptions requested by the participants; and the servicing of participants’ accounts. Pursuant to such agreement, for the year ended December 31, 2015, Invesco was paid $81,959 for accounting and fund administrative services and reimbursed $808,621 for services provided by insurance companies.
The Trust has entered into a transfer agency and service agreement with Invesco Investment Services, Inc. (“IIS”) pursuant to which the Fund has agreed to pay IIS a fee for providing transfer agency and shareholder services to the Fund and reimburse IIS for certain expenses incurred by IIS in the course of providing such services. For the year ended December 31, 2015, expenses incurred under the agreement are shown in the Statement of Operations as Transfer agent fees.
The Trust has entered into a master distribution agreement with Invesco Distributors, Inc. (“IDI”) to serve as the distributor for the Fund. The Trust has adopted a plan pursuant to Rule 12b-1 under the 1940 Act with respect to the Fund’s Series II shares (the “Plan”). The Fund, pursuant to the Plan, pays IDI compensation at the annual rate of 0.25% of the Fund’s average daily net assets of Series II shares. Of the Plan payments, up to 0.25% of the average daily net assets of the Series II shares may be paid to insurance companies who furnish continuing personal shareholder services to customers who purchase and own Series II shares of the Fund. For the year ended December 31, 2015, expenses incurred under the Plan are detailed in the Statement of Operations as Distribution fees.
Certain officers and trustees of the Trust are officers and directors of the Adviser, IIS and/or IDI.
NOTE 3—Additional Valuation Information
GAAP defines fair value as the price that would be received to sell an asset or paid to transfer a liability in an orderly transaction between market participants at the measurement date, under current market conditions. GAAP establishes a hierarchy that prioritizes the inputs to valuation methods, giving the highest priority to readily available unadjusted quoted prices in an active market for identical assets (Level 1) and the lowest priority to significant unobservable inputs (Level 3), generally when market prices are not readily available or are unreliable. Based on the valuation inputs, the securities or other investments are tiered into one of three levels. Changes in valuation methods may result in transfers in or out of an investment’s assigned level:
| | Level 1 — | Prices are determined using quoted prices in an active market for identical assets. |
| | Level 2 — | Prices are determined using other significant observable inputs. Observable inputs are inputs that other market participants may use in pricing a security. These may include quoted prices for similar securities, interest rates, prepayment speeds, credit risk, yield curves, loss severities, default rates, discount rates, volatilities and others. |
| | Level 3 — | Prices are determined using significant unobservable inputs. In situations where quoted prices or observable inputs are unavailable (for example, when there is little or no market activity for an investment at the end of the period), unobservable inputs may be used. Unobservable inputs reflect the Fund’s own assumptions about the factors market participants would use in determining fair value of the securities or instruments and would be based on the best available information. |
As of December 31, 2015, all of the securities in this Fund were valued based on Level 1 inputs (see the Schedule of Investments for security categories). The level assigned to the securities valuations may not be an indication of the risk or liquidity associated with investing in those securities. Because of the inherent uncertainties of valuation, the values reflected in the financial statements may materially differ from the value received upon actual sale of those investments.
NOTE 4—Security Transactions with Affiliated Funds
The Fund is permitted to purchase or sell securities from or to certain other Invesco Funds under specified conditions outlined in procedures adopted by the Board of Trustees of the Trust. The procedures have been designed to ensure that any purchase or sale of securities by the Fund from or to another fund or portfolio that is or could be considered an affiliate by virtue of having a common investment adviser (or affiliated investment advisers), common Trustees and/or common officers complies with Rule 17a-7 of the 1940 Act. Further, as defined under the procedures, each transaction is effected at the current market price. Pursuant to these procedures, for the year ended December 31, 2015, the Fund engaged in securities purchases of $747,536 and securities sales of $8,444,331, which resulted in net realized gains of $1,384,758.
NOTE 5—Trustees’ and Officers’ Fees and Benefits
Trustees’ and Officers’ Fees and Benefits include amounts accrued by the Fund to pay remuneration to certain Trustees and Officers of the Fund. Trustees have the option to defer compensation payable by the Fund, and Trustees’ and Officers’ Fees and Benefits also include amounts accrued by the Fund to fund such deferred compensation amounts. Those Trustees who defer compensation have the option to select various Invesco Funds in which their deferral accounts shall be deemed to be invested. Finally, certain current Trustees were eligible to participate in a retirement plan that provided for benefits to be paid upon retirement to Trustees over a period of time based on the number of years of service. The Fund may have certain former Trustees who also participate in a retirement plan and receive benefits under such plan. Trustees’ and Officers’ Fees and Benefits include amounts accrued by the Fund to fund such retirement benefits. Obligations under the deferred compensation and retirement plans represent unsecured claims against the general assets of the Fund.
NOTE 6—Cash Balances
The Fund is permitted to temporarily carry a negative or overdrawn balance in its account with State Street Bank and Trust Company, the custodian bank. Such balances, if any at period end, are shown in the Statement of Assets and Liabilities under the payable caption Amount due custodian. To compensate the custodian bank for such overdrafts, the overdrawn Fund may either (1) leave funds as a compensating balance in the account so the custodian bank can be compensated by earning the additional interest; or (2) compensate by paying the custodian bank at a rate agreed upon by the custodian bank and Invesco, not to exceed the contractually agreed upon rate.
Invesco V.I. Small Cap Equity Fund
NOTE 7—Distributions to Shareholders and Tax Components of Net Assets
Tax Character of Distributions to Shareholders Paid During the Fiscal Years Ended December 31, 2015 and 2014:
| | | | | | | | |
| | | 2015 | | | 2014 | |
Ordinary income | | $ | — | | | $ | 1,316,012 | |
Long-term capital gain | | | 64,409,532 | | | | 30,209,614 | |
Total distributions | | $ | 64,409,532 | | | $ | 31,525,626 | |
Tax Components of Net Assets at Period-End:
| | | | |
| | | 2015 | |
Undistributed ordinary income | | $ | 1,089,692 | |
Undistributed long-term gain | | | 20,587,498 | |
Net unrealized appreciation — investments | | | 35,708,030 | |
Temporary book/tax differences | | | (79,934 | ) |
Shares of beneficial interest | | | 237,716,021 | |
Total net assets | | $ | 295,021,307 | |
The difference between book-basis and tax-basis unrealized appreciation (depreciation) is due to differences in the timing of recognition of gains and losses on investments for tax and book purposes. The Fund’s net unrealized appreciation difference is attributable primarily to wash sales.
The temporary book/tax differences are a result of timing differences between book and tax recognition of income and/or expenses. The Fund’s temporary book/tax differences are the result of the trustee deferral of compensation and retirement plan benefits.
Capital loss carryforward is calculated and reported as of a specific date. Results of transactions and other activity after that date may affect the amount of capital loss carryforward actually available for the Fund to utilize. Capital losses generated in years beginning after December 22, 2010 can be carried forward for an unlimited period, whereas previous losses expire in eight tax years. Capital losses with an expiration period may not be used to offset capital gains until all net capital losses without an expiration date have been utilized. Capital loss carryforwards with no expiration date will retain their character as either short-term or long-term capital losses instead of as short-term capital losses as under prior law. The ability to utilize capital loss carryforwards in the future may be limited under the Internal Revenue Code and related regulations based on the results of future transactions.
The Fund does not have a capital loss carryforward as of December 31, 2015.
NOTE 8—Investment Securities
The aggregate amount of investment securities (other than short-term securities, U.S. Treasury obligations and money market funds, if any) purchased and sold by the Fund during the year ended December 31, 2015 was $101,499,908 and $136,881,123, respectively. Cost of investments on a tax basis includes the adjustments for financial reporting purposes as of the most recently completed federal income tax reporting period-end.
| | | | |
| Unrealized Appreciation of Investment Securities on a Tax Basis | |
Aggregate unrealized appreciation of investment securities | | $ | 60,738,056 | |
Aggregate unrealized (depreciation) of investment securities | | | (25,030,026 | ) |
Net unrealized appreciation of investment securities | | $ | 35,708,030 | |
Cost of investments for tax purposes is $263,250,658.
NOTE 9—Reclassification of Permanent Differences
Primarily as a result of differing book/tax treatment of Real Estate Investment Trust distributions and net operating losses, on December 31, 2015, undistributed net investment income (loss) was increased by $312,644 and undistributed net realized gain was decreased by $312,644. This reclassification had no effect on the net assets of the Fund.
Invesco V.I. Small Cap Equity Fund
NOTE 10—Share Information
| | | | | | | | | | | | | | | | |
| | | Summary of Share Activity | |
| | | Years ended December 31, | |
| | | 2015(a) | | | 2014 | |
| | | Shares | | | Amount | | | Shares | | | Amount | |
Sold: | | | | | | | | | | | | | | | | |
Series I | | | 1,161,619 | | | $ | 25,722,497 | | | | 1,165,408 | | | $ | 28,150,006 | |
Series II | | | 1,002,522 | | | | 22,174,509 | | | | 1,811,699 | | | | 42,473,210 | |
| | | | |
Issued as reinvestment of dividends: | | | | | | | | | | | | | | | | |
Series I | | | 2,050,190 | | | | 36,411,380 | | | | 855,680 | | | | 18,790,735 | |
Series II | | | 1,638,277 | | | | 27,998,152 | | | | 596,203 | | | | 12,734,891 | |
| | | | |
Reacquired: | | | | | | | | | | | | | | | | |
Series I | | | (2,406,303 | ) | | | (53,728,038 | ) | | | (3,700,234 | ) | | | (89,803,798 | ) |
Series II | | | (1,391,179 | ) | | | (30,773,807 | ) | | | (1,486,845 | ) | | | (34,204,650 | ) |
Net increase (decrease) in share activity | | | 2,055,126 | | | $ | 27,804,693 | | | | (758,089 | ) | | $ | (21,859,606 | ) |
| (a) | There are entities that are record owners of more than 5% of the outstanding shares of the Fund and in the aggregate own 62% of the outstanding shares of the Fund. The Fund and the Fund’s principal underwriter or adviser, are parties to participation agreements with these entities whereby these entities sell units of interest in separate accounts funding variable products that are invested in the Fund. The Fund, Invesco and/or Invesco affiliates may make payments to these entities, which are considered to be related to the Fund, for providing services to the Fund, Invesco and/or Invesco affiliates including but not limited to services such as, securities brokerage, third party record keeping and account servicing and administrative services. The Fund has no knowledge as to whether all or any portion of the shares owned of record by these entities are also owned beneficially. |
NOTE 11—Financial Highlights
The following schedule presents financial highlights for a share of the Fund outstanding throughout the periods indicated.
| | | | | | | | | | | | | | | | | | | | | | | | | | | | | | | | | | | | | | | | | | | | | | | | | | | | | | | | |
| | | Net asset
value,
beginning
of period | | | Net
investment
income
(loss)(a) | | | Net gains
(losses)
on securities
(both
realized and
unrealized) | | | Total from
investment
operations | | | Dividends
from net
investment
income | | | Distributions
from net
realized
gains | | | Total
distributions | | | Net asset
value, end
of period | | | Total
return(b) | | | Net assets,
end of period
(000’s omitted) | | | Ratio of
expenses
to average
net assets
with feewaivers
and/or expenses
absorbed | | | Ratio of
expenses
to average net
assets without
fee waivers
and/or expenses
absorbed | | | Ratio of net
investment
income (loss)
to average
net assets | | | Portfolio
turnover(c) | |
Series I | |
Year ended 12/31/15 | | $ | 23.64 | | | $ | 0.00 | | | $ | (1.27 | ) | | $ | (1.27 | ) | | $ | — | | | $ | (4.73 | ) | | $ | (4.73 | ) | | $ | 17.64 | | | | (5.52 | )% | | $ | 166,407 | | | | 1.04 | %(d) | | | 1.04 | %(d) | | | 0.02 | %(d) | | | 31 | % |
Year ended 12/31/14 | | | 25.44 | | | | (0.04 | ) | | | 0.47 | | | | 0.43 | | | | — | | | | (2.23 | ) | | | (2.23 | ) | | | 23.64 | | | | 2.36 | | | | 203,963 | | | | 1.05 | | | | 1.05 | | | | (0.17 | ) | | | 45 | |
Year ended 12/31/13 | | | 18.69 | | | | (0.04 | ) | | | 7.02 | | | | 6.98 | | | | (0.00 | ) | | | (0.23 | ) | | | (0.23 | ) | | | 25.44 | | | | 37.47 | | | | 262,261 | | | | 1.05 | | | | 1.05 | | | | (0.17 | ) | | | 35 | |
Year ended 12/31/12 | | | 16.41 | | | | 0.01 | | | | 2.27 | | | | 2.28 | | | | — | | | | — | | | | — | | | | 18.69 | | | | 13.89 | | | | 205,566 | | | | 1.06 | | | | 1.06 | | | | 0.05 | | | | 36 | |
Year ended 12/31/11 | | | 16.53 | | | | (0.05 | ) | | | (0.07 | ) | | | (0.12 | ) | | | — | | | | — | | | | — | | | | 16.41 | | | | (0.73 | ) | | | 217,287 | | | | 1.06 | | | | 1.06 | | | | (0.27 | ) | | | 61 | |
Series II | | | | | | | | | | | | | | | | | | | | | | | | | | | | | | | | | | | | | | | | | | | | | | | | | | | | | | | | |
Year ended 12/31/15 | | | 22.97 | | | | (0.05 | ) | | | (1.23 | ) | | | (1.28 | ) | | | — | | | | (4.73 | ) | | | (4.73 | ) | | | 16.96 | | | | (5.74 | ) | | | 128,614 | | | | 1.29 | (d) | | | 1.29 | (d) | | | (0.23 | )(d) | | | 31 | |
Year ended 12/31/14 | | | 24.85 | | | | (0.10 | ) | | | 0.45 | | | | 0.35 | | | | — | | | | (2.23 | ) | | | (2.23 | ) | | | 22.97 | | | | 2.08 | | | | 145,505 | | | | 1.30 | | | | 1.30 | | | | (0.42 | ) | | | 45 | |
Year ended 12/31/13 | | | 18.31 | | | | (0.09 | ) | | | 6.86 | | | | 6.77 | | | | — | | | | (0.23 | ) | | | (0.23 | ) | | | 24.85 | | | | 37.08 | | | | 134,526 | | | | 1.30 | | | | 1.30 | | | | (0.42 | ) | | | 35 | |
Year ended 12/31/12 | | | 16.11 | | | | (0.03 | ) | | | 2.23 | | | | 2.20 | | | | — | | | | — | | | | — | | | | 18.31 | | | | 13.66 | | | | 83,096 | | | | 1.31 | | | | 1.31 | | | | (0.20 | ) | | | 36 | |
Year ended 12/31/11 | | | 16.27 | | | | (0.09 | ) | | | (0.07 | ) | | | (0.16 | ) | | | — | | | | — | | | | — | | | | 16.11 | | | | (0.98 | ) | | | 54,691 | | | | 1.31 | | | | 1.31 | | | | (0.52 | ) | | | 61 | |
| (a) | Calculated using average shares outstanding. |
| (b) | Includes adjustments in accordance with accounting principles generally accepted in the United States of America and as such, the net asset value for financial reporting purposes and the returns based upon those net asset values may differ from the net asset value and returns for shareholder transactions. Total returns are not annualized for periods less than one year, if applicable and do not reflect charges assessed in connection with a variable product, which if included would reduce total returns. |
| (c) | Portfolio turnover is calculated at the fund level and is not annualized for periods less than one year, if applicable. |
| (d) | Ratios are based on average daily net assets (000’s omitted) of $190,082 and $144,524 for Series I and Series II shares, respectively. |
Invesco V.I. Small Cap Equity Fund
Report of Independent Registered Public Accounting Firm
To the Board of Trustees of AIM Variable Insurance Funds (Invesco Variable Insurance Funds)
and Shareholders of Invesco V.I. Small Cap Equity Fund:
In our opinion, the accompanying statement of assets and liabilities, including the schedule of investments, and the related statements of operations and of changes in net assets and the financial highlights present fairly, in all material respects, the financial position of Invesco V.I. Small Cap Equity Fund (one of the funds constituting AIM Variable Insurance Funds (Invesco Variable Insurance Funds), hereafter referred to as the “Fund”) at December 31, 2015, the results of its operations for the year then ended, the changes in its net assets for each of the two years in the period then ended and the financial highlights for each of the five years in the period then ended, in conformity with accounting principles generally accepted in the United States of America. These financial statements and financial highlights (hereafter referred to as “financial statements”) are the responsibility of the Fund’s management. Our responsibility is to express an opinion on these financial statements based on our audits. We conducted our audits of these financial statements in accordance with the standards of the Public Company Accounting Oversight Board (United States). Those standards require that we plan and perform the audit to obtain reasonable assurance about whether the financial statements are free of material misstatement. An audit includes examining, on a test basis, evidence supporting the amounts and disclosures in the financial statements, assessing the accounting principles used and significant estimates made by management, and evaluating the overall financial statement presentation. We believe that our audits, which included confirmation of securities at December 31, 2015 by correspondence with the custodian and brokers, and the application of alternative auditing procedures where confirmations of security purchases have not been received, provide a reasonable basis for our opinion.
PRICEWATERHOUSECOOPERS LLP
Houston, Texas
February 15, 2016
Invesco V.I. Small Cap Equity Fund
Calculating your ongoing Fund expenses
Example
As a shareholder of the Fund, you incur ongoing costs, including management fees; distribution and/or service fees (12b-1); and other Fund expenses. This example is intended to help you understand your ongoing costs (in dollars) of investing in the Fund and to compare these costs with ongoing costs of investing in other mutual funds. The example is based on an investment of $1,000 invested at the beginning of the period and held for the entire period July 1, 2015 through December 31, 2015.
The actual and hypothetical expenses in the examples below do not represent the effect of any fees or other expenses assessed in connection with a variable product; if they did, the expenses shown would be higher while the ending account values shown would be lower.
Actual expenses
The table below provides information about actual account values and actual expenses. You may use the information in this table, together with the amount you invested, to estimate the expenses that you paid over the period. Simply divide your account value by $1,000 (for example, an $8,600 account value divided by $1,000 = 8.6), then multiply the result by the number in the table under the heading entitled “Actual Expenses Paid During Period” to estimate the expenses you paid on your account during this period.
Hypothetical example for comparison purposes
The table below also provides information about hypothetical account values and hypothetical expenses based on the Fund’s actual expense ratio and an assumed rate of return of 5% per year before expenses, which is not the Fund’s actual return.
The hypothetical account values and expenses may not be used to estimate the actual ending account balance or expenses you paid for the period. You may use this information to compare the ongoing costs of investing in the Fund and other funds. To do so, compare this 5% hypothetical example with the 5% hypothetical examples that appear in the shareholder reports of the other funds.
Please note that the expenses shown in the table are meant to highlight your ongoing costs. Therefore, the hypothetical information is useful in comparing ongoing costs, and will not help you determine the relative total costs of owning different funds.
| | | | | | | | | | | | | | | | | | | | | | | | |
| Class | | Beginning
Account Value
(07/01/15) | | | ACTUAL | | | HYPOTHETICAL
(5% annual return before
expenses) | | | Annualized
Expense
Ratio | |
| | | Ending
Account Value
(12/31/15)1 | | | Expenses
Paid During
Period2 | | | Ending
Account Value
(12/31/15) | | | Expenses
Paid During
Period2 | | |
Series I | | $ | 1,000.00 | | | $ | 893.80 | | | $ | 5.01 | | | $ | 1,019.91 | | | $ | 5.35 | | | | 1.05 | % |
Series II | | | 1,000.00 | | | | 892.50 | | | | 6.20 | | | | 1,018.65 | | | | 6.61 | | | | 1.30 | |
| 1 | The actual ending account value is based on the actual total return of the Fund for the period July 1, 2015 through December 31, 2015, after actual expenses and will differ from the hypothetical ending account value which is based on the Fund’s expense ratio and a hypothetical annual return of 5% before expenses. |
| 2 | Expenses are equal to the Fund’s annualized expense ratio as indicated above multiplied by the average account value over the period, multiplied by 184/365 to reflect the most recent fiscal half year. |
Invesco V.I. Small Cap Equity Fund
Tax Information
Form 1099-DIV, Form 1042-S and other year–end tax information provide shareholders with actual calendar year amounts that should be included in their tax returns. Shareholders should consult their tax advisors.
The following distribution information is being provided as required by the Internal Revenue Code or to meet a specific state’s requirement.
The Fund designates the following amounts or, if subsequently determined to be different, the maximum amount allowable for its fiscal year ended December 31, 2015:
| | | | |
Federal and State Income Tax | |
Long-Term Capital Gain Distributions | | $ | 64,409,532 | |
Corporate Dividends Received Deduction* | | | 0 | % |
U.S. Treasury Obligations* | | | 0 | % |
| | * | The above percentages are based on ordinary income dividends paid to shareholders during the Fund’s fiscal year. |
Invesco V.I. Small Cap Equity Fund
Trustees and Officers
The address of each trustee and officer is AIM Variable Insurance Funds (Invesco Variable Insurance Funds) (the “Trust”), 11 Greenway Plaza, Suite 1000, Houston, Texas 77046-1173. The trustees serve for the life of the Trust, subject to their earlier death, incapacitation, resignation, retirement or removal as more specifically provided in the Trust’s organizational documents. Each officer serves for a one year term or until their successors are elected and qualified. Column two below includes length of time served with predecessor entities, if any.
| | | | | | | | |
Name, Year of Birth and
Position(s) Held with the Trust | | Trustee and/
or Officer Since | | Principal Occupation(s)
During Past 5 Years | | Number of Funds in Fund Complex Overseen by Trustee | | Other Directorship(s) Held by Trustee During Past 5 Years |
| Interested Persons | | | | | | | | |
| Martin L. Flanagan1 — 1960 Trustee | | 2007 | | Executive Director, Chief Executive Officer and President, Invesco Ltd. (ultimate parent of Invesco and a global investment management firm); Advisor to the Board, Invesco Advisers, Inc. (formerly known as Invesco Institutional (N.A.), Inc.); Trustee, The Invesco Funds; Vice Chair, Investment Company Institute; and Member of Executive Board, SMU Cox School of Business Formerly: Chairman and Chief Executive Officer, Invesco Advisers, Inc. (registered investment adviser); Director, Chairman, Chief Executive Officer and President, IVZ Inc. (holding company), INVESCO Group Services, Inc. (service provider) and Invesco North American Holdings, Inc. (holding company); Director, Chief Executive Officer and President, Invesco Holding Company Limited (parent of Invesco and a global investment management firm); Director, Invesco Ltd.; Chairman, Investment Company Institute and President, Co-Chief Executive Officer, Co-President, Chief Operating Officer and Chief Financial Officer, Franklin Resources, Inc. (global investment management organization) | | 146 | | None |
Philip A. Taylor2 — 1954 Trustee, President and Principal Executive Officer | | 2006 | | Head of North American Retail and Senior Managing Director, Invesco Ltd.; Director, Co-Chairman, Co-President and Co-Chief Executive Officer, Invesco Advisers, Inc. (formerly known as Invesco Institutional (N.A.), Inc.) (registered investment adviser); Director, Chairman, Chief Executive Officer and President, Invesco Management Group, Inc. (formerly known as Invesco Aim Management Group, Inc.) (financial services holding company); Director and Chairman, Invesco Investment Services, Inc. (formerly known as Invesco Aim Investment Services, Inc.) (registered transfer agent) Chief Executive Officer, Invesco Corporate Class Inc. (corporate mutual fund company) Director, Chairman and Chief Executive Officer, Invesco Canada Ltd. (formerly known as Invesco Trimark Ltd./Invesco Trimark Ltèe) (registered investment adviser and registered transfer agent); Trustee, President and Principal Executive Officer, The Invesco Funds (other than AIM Treasurer’s Series Trust (Invesco Treasurer’s Series Trust), Short-Term Investments Trust and Invesco Management Trust); Trustee and Executive Vice President, The Invesco Funds (AIM Treasurer’s Series Trust (Invesco Treasurer’s Series Trust), Short-Term Investments Trust and Invesco Management Trust only); Director, Invesco Investment Advisers LLC (formerly known as Van Kampen Asset Management); Director, Chief Executive Officer and President, Van Kampen Exchange Corp. Formerly: Director and President, INVESCO Funds Group, Inc. (registered investment adviser and registered transfer agent); Director and Chairman, IVZ Distributors, Inc. (formerly known as INVESCO Distributors, Inc.) (registered broker dealer); Director, President and Chairman, Invesco Inc. (holding company), Invesco Canada Holdings Inc. (holding company), Trimark Investments Ltd./Placements Trimark Ltèe and Invesco Financial Services Ltd/Services Financiers Invesco Ltèe; Chief Executive Officer, Invesco Canada Fund Inc (corporate mutual fund company); Director and Chairman, Van Kampen Investor Services Inc.; Director, Chief Executive Officer and President, 1371 Preferred Inc. (holding company) and Van Kampen Investments Inc.; Director and President, AIM GP Canada Inc. (general partner for limited partnerships) and Van Kampen Advisors, Inc.; Director and Chief Executive Officer, Invesco Trimark Dealer Inc. (registered broker dealer); Director, Invesco Distributors, Inc. (formerly known as Invesco Aim Distributors, Inc.) (registered broker dealer); Manager, Invesco PowerShares Capital Management LLC; Director, Chief Executive Officer and President, Invesco Advisers, Inc.; Director, Chairman, Chief Executive Officer and President, Invesco Aim Capital Management, Inc.; President, Invesco Trimark Dealer Inc. and Invesco Trimark Ltd./Invesco Trimark Ltèe; Director and President, AIM Trimark Corporate Class Inc. and AIM Trimark Canada Fund Inc.; Senior Managing Director, Invesco Holding Company Limited; Director and Chairman, Fund Management Company (former registered broker dealer); President and Principal Executive Officer, The Invesco Funds (AIM Treasurer’s Series Trust (Invesco Treasurer’s Series Trust), and Short-Term Investments Trust only); President, AIM Trimark Global Fund Inc. and AIM Trimark Canada Fund Inc | | 146 | | None |
| 1 | Mr. Flanagan is considered an interested person (within the meaning of Section 2(a)(19) of the 1940 Act) of the Trust because he is an officer of the Adviser to the Trust, and an officer and a director of Invesco Ltd., ultimate parent of the Adviser. |
| 2 | Mr. Taylor is considered an interested person (within the meaning of Section 2(a)(19) of the 1940 Act) of the Trust because he is an officer and a director of the Adviser. |
Invesco V.I. Small Cap Equity Fund
Trustees and Officers—(continued)
| | | | | | | | |
Name, Year of Birth and
Position(s) Held with the Trust | | Trustee and/
or Officer Since | | Principal Occupation(s)
During Past 5 Years | | Number of Funds in Fund Complex Overseen by Trustee | | Other Directorship(s)
Held by Trustee During Past 5 Years |
| Independent Trustees | | | | | | | | |
Bruce L. Crockett — 1944 Trustee and Chair | | 2003 | | Chairman, Crockett Technologies Associates (technology consulting company) Formerly: Director, Captaris (unified messaging provider); Director, President and Chief Executive Officer, COMSAT Corporation; Chairman, Board of Governors of INTELSAT (international communications company); ACE Limited (insurance company); Independent Directors Council and Investment Company Institute | | 146 | | ALPS (Attorneys Liability Protection Society) (insurance company) and Globe Specialty Metals, Inc. (metallurgical company) |
David C. Arch — 1945 Trustee | | 2010 | | Chairman of Blistex Inc., a consumer health care products manufacturer | | 146 | | Board member of the Illinois Manufacturers’ Association; Member of the Board of Visitors, Institute for the Humanities, University of Michigan |
James T. Bunch — 1942 Trustee | | 2000 | | Managing Member, Grumman Hill Group LLC (family office/private equity investments) Formerly: Chairman of the Board of Trustees, Evans Scholars Foundation and Chairman, Board of Governors, Western Golf Association | | 146 | | Trustee, Evans Scholars Foundation; and Chairman of the Board, Denver Film Society |
Albert R. Dowden — 1941 Trustee | | 2003 | | Director of a number of public and private business corporations, including the Boss Group, Ltd. (private investment and management); Nature’s Sunshine Products, Inc. and Reich & Tang Funds (5 portfolios) (registered investment company) Formerly: Director, Homeowners of America Holding Corporation/Homeowners of America Insurance Company (property casualty company); Director, Continental Energy Services, LLC (oil and gas pipeline service); Director, CompuDyne Corporation (provider of product and services to the public security market) and Director, Annuity and Life Re (Holdings), Ltd. (reinsurance company); Director, President and Chief Executive Officer, Volvo Group North America, Inc.; Senior Vice President, AB Volvo; Director of various public and private corporations; Chairman, DHJ Media, Inc.; Director, Magellan Insurance Company; and Director, The Hertz Corporation, Genmar Corporation (boat manufacturer), National Media Corporation; Advisory Board of Rotary Power International (designer, manufacturer, and seller of rotary power engines); and Chairman, Cortland Trust, Inc. (registered investment company) | | 146 | | Director of: Nature’s Sunshine Products, Inc., Reich & Tang Funds, Homeowners of America Holding Corporation/ Homeowners of America Insurance Company, the Boss Group |
Jack M. Fields — 1952 Trustee | | 2003 | | Chief Executive Officer, Twenty First Century Group, Inc. (government affairs company); Owner and Chief Executive Officer, Dos Angeles Ranch, L.P. (cattle, hunting, corporate entertainment); and Discovery Global Education Fund (non-profit) Formerly: Chief Executive Officer, Texana Timber LP (sustainable forestry company); Director of Cross Timbers Quail Research Ranch (non-profit); and member of the U.S. House of Representatives | | 146 | | Insperity, Inc. (formerly known as Administaff) |
Eli Jones — Trustee | | 2016 | | Professor and Dean, Mays Business School, Texas A&M University Formerly: Professor and Dean, Walton College of Business, University of Arkansas, and E.J. Ourso College of Business, Louisiana State University | | 146 | | Director, Insperity, Inc., (2011-present) and ARVEST Bank (2012-2015) |
Prema Mathai-Davis — 1950 Trustee | | 2003 | | Retired. Formerly: Chief Executive Officer, YWCA of the U.S.A. | | 146 | | None |
Larry Soll — 1942 Trustee | | 1997 | | Retired. Formerly: Chairman, Chief Executive Officer and President, Synergen Corp. (a biotechnology company) | | 146 | | None |
Robert C. Troccoli — Trustee | | 2016 | | Retired. Formerly: Senior Partner, KPMG LLP | | 146 | | None |
Raymond Stickel, Jr. — 1944 Trustee | | 2005 | | Retired. Formerly: Director, Mainstay VP Series Funds, Inc. (25 portfolios) and Partner, Deloitte & Touche | | 146 | | None |
Suzanne H. Woolsey — 1941 Trustee | | 2014 | | Chief Executive Officer of Woolsey Partners LLC | | 146 | | Emeritus Chair of the Board of Trustees of the Institute for Defense Analyses; Trustee of Colorado College; Trustee of California Institute of Technology; Prior to 2014, Director of Fluor Corp.; Prior to 2010, Trustee of the German Marshall Fund of the United States; Prior to 2010 Trustee of the Rocky Mountain Institute |
Invesco V.I. Small Cap Equity Fund
Trustees and Officers—(continued)
| | | | | | | | |
Name, Year of Birth and
Position(s) Held with the Trust | | Trustee and/
or Officer Since | | Principal Occupation(s)
During Past 5 Years | | Number of Funds in Fund Complex Overseen by Trustee | | Other Directorship(s)
Held by Trustee During Past 5 Years |
| Other Officers | | | | | | | | |
Russell C. Burk — 1958 Senior Vice President and Senior Officer | | 2005 | | Senior Vice President and Senior Officer, The Invesco Funds | | N/A | | N/A |
John M. Zerr — 1962 Senior Vice President, Chief Legal Officer and Secretary | | 2006 | | Director, Senior Vice President, Secretary and General Counsel, Invesco Management Group, Inc. (formerly known as Invesco Aim Management Group, Inc.) and Van Kampen Exchange Corp.; Senior Vice President, Invesco Advisers, Inc. (formerly known as Invesco Institutional (N.A.), Inc.) (registered investment adviser); Senior Vice President and Secretary, Invesco Distributors, Inc. (formerly known as Invesco Aim Distributors, Inc.); Director, Vice President and Secretary, Invesco Investment Services, Inc. (formerly known as Invesco Aim Investment Services, Inc.); Senior Vice President, Chief Legal Officer and Secretary, The Invesco Funds; Managing Director, Invesco PowerShares Capital Management LLC; Director, Secretary and General Counsel, Invesco Investment Advisers LLC (formerly known as Van Kampen Asset Management); Secretary and General Counsel, Invesco Capital Markets, Inc. (formerly known as Van Kampen Funds Inc.) and Chief Legal Officer, PowerShares Exchange-Traded Fund Trust, PowerShares Exchange-Traded Fund Trust II, PowerShares India Exchange-Traded Fund Trust, PowerShares Actively Managed Exchange-Traded Fund Trust, and PowerShares Actively Managed Exchange-Traded Commodity Fund Trust Formerly: Director, Vice President and Secretary, IVZ Distributors, Inc. (formerly known as INVESCO distributors, Inc.); Director and Vice President, INVESCO Funds Group, Inc.; Director and Vice President, Van Kampen Advisors Inc.; Director, Vice President, Secretary and General Counsel, Van Kampen Investor Services Inc.; Director, Invesco Distributors, Inc. (formerly known as Invesco Aim Distributors, Inc.); Director, Senior Vice President, General Counsel and Secretary, Invesco Aim Advisers, Inc. and Van Kampen Investments Inc.; Director, Vice President and Secretary, Fund Management Company; Director, Senior Vice President, Secretary, General Counsel and Vice President, Invesco Aim Capital Management, Inc.; Chief Operating Officer and General Counsel, Liberty Ridge Capital, Inc. (an investment adviser); Vice President and Secretary, PBHG Funds (an investment company) and PBHG Insurance Series Fund (an investment company); Chief Operating Officer, General Counsel and Secretary, Old Mutual Investment Partners (a broker-dealer); General Counsel and Secretary, Old Mutual Fund Services (an administrator) and Old Mutual Shareholder Services (a shareholder servicing center); Executive Vice President, General Counsel and Secretary, Old Mutual Capital, Inc. (an investment adviser); and Vice President and Secretary, Old Mutual Advisors Funds (an investment company) | | N/A | | N/A |
Sheri Morris — 1964 Vice President, Treasurer and Principal Financial Officer | | 2003 | | Vice President, Treasurer and Principal Financial Officer, The Invesco Funds; Vice President, Invesco Advisers, Inc. (formerly known as Invesco Institutional (N.A.), Inc.) (registered investment adviser); and Vice President, PowerShares Exchange-Traded Fund Trust, PowerShares Exchange-Traded Fund Trust II, PowerShares India Exchange-Traded Fund Trust, PowerShares Actively Managed Exchange-Traded Fund Trust, and PowerShares Actively Managed Exchange-Traded Commodity Fund Trust Formerly: Vice President, Invesco Aim Advisers, Inc., Invesco Aim Capital Management, Inc. and Invesco Aim Private Asset Management, Inc.; Assistant Vice President and Assistant Treasurer, The Invesco Funds and Assistant Vice President, Invesco Advisers, Inc., Invesco Aim Capital Management, Inc. and Invesco Aim Private Asset Management, Inc.; and Treasurer, PowerShares Exchange-Traded Fund Trust, PowerShares Exchange-Traded Fund Trust II, PowerShares India Exchange-Traded Fund Trust and PowerShares Actively Managed Exchange-Traded Fund Trust | | N/A | | N/A |
Invesco V.I. Small Cap Equity Fund
Trustees and Officers—(continued)
| | | | | | | | |
Name, Year of Birth and
Position(s) Held with the Trust | | Trustee and/
or Officer Since | | Principal Occupation(s)
During Past 5 Years | | Number of Funds in Fund Complex Overseen by Trustee | | Other Directorship(s)
Held by Trustee During Past 5 Years |
| Other Officers—(continued) | | | | | | | | |
Karen Dunn Kelley — 1960 Vice President | | 2003 | | Senior Managing Director, Investments, Invesco Ltd.; Director, Co-President, Co-Chief Executive Officer, and Co-Chairman, Invesco Advisers, Inc. (formerly known as Invesco Institutional (N.A.), Inc.) (registered investment adviser); Chairman, Invesco Senior Secured Management, Inc.; Senior Vice President, Invesco Management Group, Inc. (formerly known as Invesco Aim Management Group, Inc.); Executive Vice President, Invesco Distributors, Inc. (formerly known as Invesco Aim Distributors, Inc.); Director, Invesco Mortgage Capital Inc. and Invesco Management Company Limited; Vice President, The Invesco Funds (other than AIM Treasurer’s Series Trust (Invesco Treasurer’s Series Trust), Short-Term Investments Trust and Invesco Management Trust); and President and Principal Executive Officer, The Invesco Funds (AIM Treasurer’s Series Trust (Invesco Treasurer’s Series Trust), Short-Term Investments Trust and Invesco Management Trust only) Formerly: Director and President, INVESCO Asset Management (Bermuda) Ltd., Director, INVESCO Global Asset Management Limited and INVESCO Management S.A.; Senior Vice President, Van Kampen Investments Inc. and Invesco Advisers, Inc. (formerly known as Invesco Institutional (N.A.), Inc.) (registered investment adviser); Vice President, Invesco Advisers, Inc. (formerly known as Invesco Institutional (N.A.), Inc.); Director of Cash Management and Senior Vice President, Invesco Advisers, Inc. and Invesco Aim Capital Management, Inc.; Director and President, Fund Management Company; Chief Cash Management Officer, Director of Cash Management, Senior Vice President, and Managing Director, Invesco Aim Capital Management, Inc.; Director of Cash Management, Senior Vice President, and Vice President, Invesco Advisers, Inc. and The Invesco Funds (AIM Treasurer’s Series Trust (Invesco Treasurer’s Series Trust), and Short-Term Investments Trust only) | | N/A | | N/A |
Crissie M. Wisdom — 1969 Anti-Money Laundering Compliance Officer | | 2013 | | Anti-Money Laundering Compliance Officer, Invesco Advisers, Inc. (formerly known as Invesco Institutional (N.A.), Inc.) (registered investment adviser), Invesco Capital Markets, Inc. (formerly known as Van Kampen Funds Inc.), Invesco Distributors, Inc., Invesco Investment Services, Inc., Invesco Management Group, Inc., Van Kampen Exchange Corp., The Invesco Funds, and PowerShares Exchange-Traded Fund Trust, PowerShares Exchange-Traded Fund Trust II, PowerShares India Exchange-Traded Fund Trust, PowerShares Actively Managed Exchange-Traded Fund Trust and PowerShares Actively Managed Exchange-Traded Commodity Fund Trust; Anti-Money Laundering Compliance Officer and Bank Secrecy Act Officer, INVESCO National Trust Company and Invesco Trust Company; and Fraud Prevention Manager and Controls and Risk Analysis Manager for Invesco Investment Services, Inc. | | N/A | | N/A |
Lisa O. Brinkley — 1959 Chief Compliance Officer | | 2015 | | Senior Vice President and Chief Compliance Officer, Invesco Advisers, Inc. (registered investment adviser) (formerly known as Invesco Institutional (N.A., Inc.); and Chief Compliance Officer, The Invesco Funds Formerly: Global Assurance Officer, Invesco Ltd. and Vice President, The Invesco Funds; Chief Compliance Officer, Invesco Distributors, Inc. (formerly known as Invesco Aim Distributors, Inc.), Invesco Investment Services, Inc.(formerly known as Invesco Aim Investment Services, Inc.) and Van Kampen Investor Services Inc.; Senior Vice President, Invesco Management Group, Inc.; Senior Vice President and Chief Compliance Officer, Invesco Advisers, Inc. and The Invesco Funds; Vice President and Chief Compliance Officer, Invesco Aim Capital Management, Inc. and Invesco Distributors, Inc.; Vice President, Invesco Investment Services, Inc. and Fund Management Company | | N/A | | N/A |
The Statement of Additional Information of the Trust includes additional information about the Fund’s Trustees and is available upon request, without charge, by calling 1.800.959.4246. Please refer to the Fund’s prospectus for information on the Fund’s sub-advisers.
| | | | | | |
Office of the Fund 11 Greenway Plaza, Suite 1000 Houston, TX 77046-1173 | | Investment Adviser Invesco Advisers, Inc. 1555 Peachtree Street, N.E. Atlanta, GA 30309 | | Distributor Invesco Distributors, Inc. 11 Greenway Plaza, Suite 1000 Houston, TX 77046-1173 | | Auditors PricewaterhouseCoopers LLP 1000 Louisiana Street, Suite 5800 Houston, TX 77002-5678 |
| | | |
| | | | | | |
Counsel to the Fund Stradley Ronon Stevens & Young, LLP 2005 Market Street, Suite 2600 Philadelphia, PA 19103-7018 | | Counsel to the Independent Trustees Goodwin Procter LLP 901 New York Avenue, N.W. Washington, D.C. 20001 | | Transfer Agent Invesco Investment Services, Inc. 11 Greenway Plaza, Suite 1000 Houston, TX 77046-1173 | | Custodian State Street Bank and Trust Company 225 Franklin Street Boston, MA 02110-2801 |
Invesco V.I. Small Cap Equity Fund
| | | | |
| | |
 | | Annual Report to Shareholders | | December 31, 2015 |
| | |
| | Invesco V.I. Technology Fund |

| | |
| | The Fund provides a complete list of its holdings four times in each fiscal year, at the quarter-ends. For the second and fourth quarters, the lists appear in the Fund’s semiannual and annual reports to shareholders. For the first and third quarters, the Fund files the lists with the Securities and Exchange Commission (SEC) on Form N-Q. The Fund’s Form N-Q filings are available on the SEC website, sec.gov. Copies of the Fund’s Forms N-Q may be reviewed and copied at the SEC Public Reference Room in Washington, D.C. You can obtain information on the operation of the Public Reference Room, including information about duplicating fee charges, by calling 202 551 8090 or 800 732 0330, or by electronic request at the following email address: publicinfo@sec.gov. The SEC file numbers for the Fund are 811-07452 and 033-57340. The Fund’s most recent portfolio holdings, as filed on Form N-Q, have also been made available to insurance companies issuing variable annuity contracts and variable life insurance policies (“variable products”) that invest in the Fund. A description of the policies and procedures that the Fund uses to determine how to vote proxies relating to portfolio securities is available without charge, upon request, from our Client Services department at 800 959 4246 or at invesco.com/proxyguidelines. The information is also available on the SEC website, sec.gov. Information regarding how the Fund voted proxies related to its portfolio securities during the most recent 12-month period ended June 30 is available at invesco.com/ proxysearch. The information is also available on the SEC website, sec.gov. Invesco Advisers, Inc. is an investment adviser; it provides investment advisory services to individual and institutional clients and does not sell securities. Invesco Distributors, Inc. is the US distributor for Invesco Ltd.’s retail mutual funds, exchange-traded funds and institutional money market funds. Both are wholly owned, indirect subsidiaries of Invesco Ltd. This report must be accompanied or preceded by a currently effective Fund prospectus and variable product prospectus, which contain more complete information, including sales charges and expenses. Investors should read each carefully before investing. Invesco Distributors, Inc. I-VITEC-AR-1 NOT FDIC INSURED | MAY LOSE VALUE | NO BANK GUARANTEE |
Management’s Discussion of Fund Performance
Performance summary
For the year ended December 31, 2015, Series I shares of Invesco V.I. Technology Fund (the Fund) outperformed The BofA Merrill Lynch 100 Technology Index, the Fund’s style-specific benchmark.
Your Fund’s long-term performance appears later in this report.
Fund vs. Indexes
Total returns, 12/31/14 to 12/31/15, excluding variable product issuer charges.
If variable product issuer charges were included, returns would be lower.
| | | | | |
| Series I Shares | | | | 6.82 | % |
| Series II Shares | | | | 6.56 | |
| S&P 500 Index▼ (Broad Market Index) | | | | 1.38 | |
| The BofA Merrill Lynch 100 Technology Indexn (Style-Specific Index) | | | | 3.67 | |
| Lipper VUF Science & Technology Funds Classification Average¿ (Peer Group) | | | | 5.77 | |
Source(s): ▼FactSet Research Systems Inc.; nBloomberg LP; ¿Lipper Inc.
Market conditions and your Fund
The US economy continued its modest, but steady growth, during the year ended December 31, 2015 – although the health of individual economic sectors varied dramatically. The headline economic story was a steady decline in already-battered energy markets, as oil prices plummeted when increased supply overwhelmed demand. This decline particularly affected companies with US-based offshore or shale-based resources – companies whose cost to recover oil is higher than many traditional producers. On the other end of the spectrum, the improved position of the US consumer was the more subtle story which drove the US economy forward during the year.
As the year began, economic growth appeared to be stronger in the US than in the rest of the world. US equity markets were recovering from the crash of oil prices initiated by OPEC’s decision to maintain high production despite low prices and slowing global growth. The view that the US Federal Reserve (the Fed) would begin raising rates while other central banks were loosening monetary policy led the US dollar to strengthen against many currencies. This hurt commodity- and materials-based economies
– and companies in related sectors. Additionally, US-based multinational companies faced foreign exchange headwinds. Low interest rates, the increasing availability of credit and an improving employment picture all contributed to higher consumer confidence and consumer spending, which drove US equity markets higher, particularly through the spring, and helped overcome fears that Greece and the eurozone would fail to reach an agreement on a financial bailout plan.
In the summer of 2015, US equity markets moved sharply lower. A significant downturn in China’s financial markets and weak global economic growth led the Fed to delay raising interest rates; this, in turn, increased investor uncertainty and market volatility. A continued decline in oil prices also contributed to market volatility. In the fall, however, US markets rallied, the Fed saw enough economic stabilization to finally raise interest rates, and most major US market indexes ended the year barely in positive territory.
The technology sector posted positive returns and was one of the top-performing sectors within the S&P 500 Index during the year. In this market environment, the Fund produced positive returns and outperformed its style-specific benchmark.
The most significant contributors to the Fund’s outperformance were overweight exposure to the retail industry, as well as stock selection in the technology hardware and equipment and software and services industries. Overweight exposure to the pharmaceuticals and biotechnology industries also contributed to the Fund’s relative performance. However, some of the outperformance in these industries was offset by underperformance in the semiconductor and semiconductor equipment industry. Overweight exposure to the media and consumer durables industries detracted from relative performance as well.
From an individual securities perspective, the leading contributor to Fund performance was Amazon.com. The company reported expanding profitability in major business segments, and the stock was up more than 100% during the year. Another top contributor to Fund performance was our high-conviction holding Facebook. Throughout the year, the company reported increased usage, increased migration to mobile devices, and increased video usage, which also led to increased video advertising revenue. In addition, the company reduced guidance for its future expenses. Google and the restructured holding company it launched during the year, Alphabet, contributed to the Fund’s performance versus its style-specific benchmark. During the year, a new chief financial officer enhanced communication with investors and stressed cost discipline for the company. This responsible messaging combined with strength in its YouTube and mobile-search businesses led the company’s stock higher. We sold our position in Google during the reporting period.
The most significant individual detractor from Fund performance during the year was Monitise. The company provides mobile banking, payments and commerce networks primarily for financial
| | | | | |
| Portfolio Composition |
| By sector | | | | % of total net assets | |
| | | | | |
| |
| Information Technology | | | | 53.0 | % |
| Health Care | | | | 25.5 | |
| Consumer Discretionary | | | | 15.2 | |
| Financials | | | | 2.1 | |
| Industrials | | | | 1.6 | |
| Telecommunication Services | | | | 1.4 | |
| Money Market Funds | | | | | |
| Plus Other Assets Less Liabilities | | | | 1.2 | |
| | | | | |
| Top 10 Equity Holdings* |
| | | | % of total net assets | |
| | | | | | | |
| | |
| 1. | | Apple Inc. | | | | 7.6 | % |
| 2. | | Alphabet Inc.-Class A | | | | 6.0 | |
| 3. | | Facebook Inc.-Class A | | | | 5.8 | |
| 4. | | Amazon.com, Inc. | | | | 5.0 | |
| 5. | | Alkermes PLC | | | | 3.6 | |
| 6. | | MasterCard, Inc.-Class A | | | | 3.5 | |
| 7. | | Celgene Corp. | | | | 3.2 | |
| 8. | | salesforce.com, inc. | | | | 3.1 | |
| 9. | | Gilead Sciences, Inc. | | | | 3.0 | |
| 10. | | ServiceNow, Inc. | | | | 3.0 | |
| | |
| Total Net Assets | | $53.9 million |
| |
| Total Number of Holdings* | | 43 |
The Fund’s holdings are subject to change, and there is no assurance that the Fund will continue to hold any particular security.
*Excluding money market fund holdings.
Data presented here are as of December 31, 2015.
Invesco V.I. Technology Fund
institutions. Monitise experienced a decline in revenues during the year as it changed business models – going from a license-based model requiring upfront payment, to a subscription-based model where payments are spread over time. We sold our position in Monitise during the reporting period. Dish Network was also a significant detractor from Fund performance during the year. Dish was a significant holding in the Fund based on its significant wireless spectrum assets; however, the stock pulled back as the potential catalysts to unlock spectrum value seemed to move further into the future and the pay television business was weak. Sprint was a notable detractor from Fund performance as well. The company generally improved its subscriber and network metrics through the year. However, investors focused on financing, considering the company’s relatively high debt levels and available cash flow within a skittish high yield financing environment, and the stock pulled back as a result.
During the year, the Fund was biased toward growth technology, including bio-pharmaceuticals, and away from mature technology. The Fund emphasizes innovation, transformative technology and opportunities which we expect to take market share from mature companies, including the game-changing technologies of mobile, security, cloud and biopharmaceuticals. We remain optimistic about technology spending given strong corporate balance sheets and companies’ need to invest in more robust security solutions and for future growth. In our opinion, the increased pace of health care innovation will continue to drive attractive long-term growth rates due to successful mapping of the human genome and recent productivity improvements, both of which have fostered faster and more effective targeting of promising therapeutics. We attempt to harness multiyear secular trends, which may benefit long-term investors regardless of near-term economic strength.
We thank you for your commitment to Invesco V.I. Technology Fund.
The views and opinions expressed in management’s discussion of Fund performance are those of Invesco Advisers, Inc. These views and opinions are subject to change at any time based on factors such as market and economic conditions. These views and opinions may not be relied upon as investment advice or recommendations, or as an offer for a particular security. The information is not a complete analysis of every aspect of any market, country, industry, security or the Fund. Statements of fact are from sources considered reliable, but Invesco Advisers, Inc. makes no representation or warranty as to their completeness or accuracy. Although historical performance is no guarantee of future results, these insights may help you understand our investment management philosophy.
See important Fund and, if applicable, index disclosures later in this report.
| | |
 | | Erik Voss Chartered Financial Analyst, Portfolio Manager, is lead manager of Invesco V.I. Technology Fund. He |
| joined Invesco in 2010. Mr. Voss earned a BS in mathematics and an MS in finance from the University of Wisconsin. |
| |
 | | Janet Luby Chartered Financial Analyst, Portfolio Manager, is manager of Invesco V.I. Technology Fund. She joined |
| Invesco in 2011. Ms. Luby earned a BBA in finance from Texas A&M University. She is also a Certified Public Accountant. |
Invesco V.I. Technology Fund
Your Fund’s Long-Term Performance
Results of a $10,000 Investment – Oldest Share Class(es)
Fund and index data from 12/31/05
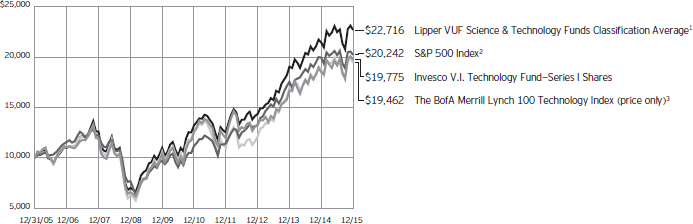
| 2 | Source: FactSet Research Systems Inc. |
Past performance cannot guarantee comparable future results.
| | | | | |
| Average Annual Total Returns |
As of 12/31/15 | | | | | |
| |
| Series I Shares | | | | | |
| Inception (5/20/97) | | | | 5.11 | % |
| 10 Years | | | | 7.06 | |
| 5 Years | | | | 9.42 | |
| 1 Year | | | | 6.82 | |
| |
| Series II Shares | | | | | |
| Inception (4/30/04) | | | | 6.97 | % |
| 10 Years | | | | 6.79 | |
| 5 Years | | | | 9.15 | |
| 1 Year | | | | 6.56 | |
The performance of the Fund’s Series I and Series II share classes will differ primarily due to different class expenses.
The performance data quoted represent past performance and cannot guarantee comparable future results; current performance may be lower or higher. Please contact your variable product issuer or financial adviser for the most recent month-end variable product performance. Performance figures reflect Fund expenses, reinvested distributions and changes in net asset value. Investment return and principal value will fluctuate so that you may have a gain or loss when you sell shares.
The total annual Fund operating expense ratio set forth in the most recent Fund prospectus as of the date of this report for Series I and Series II shares was 1.16% and 1.41%, respectively. The expense ratios presented above may vary from the expense ratios presented in other sections of this report that are based on expenses incurred during the period covered by this report.
Invesco V.I. Technology Fund, a series portfolio of AIM Variable Insurance Funds (Invesco Variable Insurance Funds), is currently offered through insurance companies issuing variable products. You cannot purchase shares of the Fund directly. Performance figures given represent the Fund and are not intended to reflect actual variable product values. They do not reflect sales charges, expenses and fees assessed in connection with a variable product. Sales charges, expenses and fees, which are determined by the variable product issuers, will vary and will lower the total return.
The most recent month-end performance at the Fund level, excluding variable product charges, is available at 800 451 4246. As mentioned above,
for the most recent month-end performance including variable product charges, please contact your variable product issuer or financial adviser.
Fund performance reflects any applicable fee waivers and/or expense reimbursements. Had the adviser not waived fees and/or reimbursed expenses currently or in the past, returns would have been lower. See current prospectus for more information.
Invesco V.I. Technology Fund
Invesco V.I. Technology Fund’s investment objective is long-term growth of capital.
| n | | Unless otherwise stated, information presented in this report is as of December 31, 2015, and is based on total net assets. |
| n | | Unless otherwise noted, all data provided by Invesco. |
| n | | To access your Fund’s reports/prospectus, visit invesco.com/fundreports. |
Principal risks of investing in the Fund
Depositary receipts risk. Depositary receipts involve many of the same risks as those associated with direct investment in foreign securities. In addition, the underlying issuers of certain depositary receipts, particularly unsponsored or unregistered depositary receipts, are under no obligation to distribute shareholder communications to the holders of such receipts or to pass through to them any voting rights with respect to the deposited securities.
Derivatives risk. The value of a derivative instrument depends largely on (and is derived from) the value of an underlying security, currency, commodity, interest rate, index or other asset (each referred to as an underlying asset). In addition to risks relating to the underlying assets, the use of derivatives may include other, possibly greater, risks, including counterparty, leverage and liquidity risks. Counterparty risk is the risk that the counterparty to the derivative contract will default on its obligation to pay the Fund the amount owed or otherwise perform under the derivative contract. Derivatives create leverage risk because they do not require payment up front equal to the economic exposure created by owning the derivative. As a result, an adverse change in the value of the underlying asset could result in the Fund sustaining a loss that is substantially greater than the amount invested in the derivative, which may make the Fund’s returns more volatile and increase the risk of loss. Derivative instruments may also be less liquid than more traditional investments and the Fund may be unable to sell or close out its derivative positions at a desirable time or price. This risk may be more acute under adverse market conditions, during which the Fund may be most in need of liquidating its derivative positions. Derivatives may also be harder to value, less tax efficient and subject to changing government regulation that could impact the Fund’s ability to use certain derivatives or their cost. Also, derivatives used for hedging or to gain or limit exposure to a particular market segment may not provide the expected benefits, particularly during adverse market conditions.
Developing/emerging markets securities risk. The prices of securities issued by foreign companies and governments located
in developing/emerging markets countries may be affected more negatively by inflation, devaluation of their currencies, higher transaction costs, delays in settlement, adverse political developments, the introduction of capital controls, withholding taxes, nationalization of private assets, expropriation, social unrest, war or lack of timely information than those in developed countries.
Foreign securities risk. The Fund’s foreign investments may be affected by changes in a foreign country’s exchange rates, political and social instability, changes in economic or taxation policies, difficulties when enforcing obligations, decreased liquidity, and increased volatility. Foreign companies may be subject to less regulation resulting in less publicly available information about the companies.
Growth investing risk. Growth stocks tend to be more expensive relative to their earnings or assets compared with other types of stock. As a result they tend to be more sensitive to changes in their earnings and can be more volatile.
Management risk. The investment techniques and risk analysis used by the Fund’s portfolio managers may not produce the desired results.
Market risk. The prices of and the income generated by the Fund’s securities may decline in response to, among other things, investor sentiment, general economic and market conditions, regional or global instability, and currency and interest rate fluctuations.
Mid-capitalization risk. Stocks of mid-sized companies tend to be more vulnerable to adverse developments and may have little or no operating history or track record of success, and limited product lines, markets, management and financial resources. The securities of mid-sized companies may be more volatile due to less market interest and less publicly available information about the issuer. They also may be illiquid or restricted as to resale, or may trade less frequently and in smaller volumes, all of which may cause difficulty when establishing or closing a position at a desirable price.
Technology sector risk. The Fund will concentrate its investments in the securities of issuers primarily engaged in technology-related industries. Many products and services offered in technology-related industries are subject to rapid obsolescence, which may lower the value of the issuers in this sector.
About indexes used in this report
The S&P 500® Index is an unmanaged index considered representative of the US stock market.
The BofA Merrill Lynch 100 Technology Index is an unmanaged, price-only, equal-dollar-weighted index of 100 stocks designed to measure the performance of a cross section of large, actively traded technology stocks and American Depositary Receipts.
The Lipper VUF Science & Technology Funds Classification Average represents an average of all variable insurance underlying funds in the Lipper Science & Technology Funds classification.
The Fund is not managed to track the performance of any particular index, including the index(es) described here, and consequently, the performance of the Fund may deviate significantly from the performance of the index(es).
A direct investment cannot be made in an index. Unless otherwise indicated, index results include reinvested dividends, and they do not reflect sales charges. Performance of the peer group, if applicable, reflects fund expenses; performance of a market index does not.
Other information
CPA® and Certified Public Accountant® are trademarks owned by the American Institute of Certified Public Accountants.
The returns shown in management’s discussion of Fund performance are based on net asset values calculated for shareholder transactions. Generally accepted accounting principles require adjustments to be made to the net assets of the Fund at period end for financial reporting purposes, and as such, the net asset values for shareholder transactions and the returns based on those net asset values may differ from the net asset values and returns reported in the Financial Highlights. Additionally, the returns and net asset values shown throughout this report are at the Fund level only and do not include variable product issuer charges. If such charges were included, the total returns would be lower.
Industry classifications used in this report are generally according to the Global Industry Classification Standard, which was developed by and is the exclusive property and a service mark of MSCI Inc. and Standard & Poor’s.
Invesco V.I. Technology Fund
Schedule of Investments(a)
December 31, 2015
| | | | | | | | |
| | | Shares | | | Value | |
Common Stocks & Other Equity Interests–98.77% | |
| Aerospace & Defense–1.56% | |
Raytheon Co. | | | 14,452 | | | $ | 1,799,708 | |
|
| Application Software–3.55% | |
Autodesk, Inc.(b) | | | 9,496 | | | | 578,591 | |
salesforce.com, inc.(b) | | | 44,892 | | | | 3,519,533 | |
| | | | | | | | 4,098,124 | |
|
| Biotechnology–15.87% | |
Alexion Pharmaceuticals, Inc.(b) | | | 6,289 | | | | 1,199,627 | |
Alkermes PLC(b) | | | 52,825 | | | | 4,193,249 | |
Amgen Inc. | | | 17,374 | | | | 2,820,321 | |
Biogen Inc.(b) | | | 3,569 | | | | 1,093,363 | |
Celgene Corp.(b) | | | 30,765 | | | | 3,684,416 | |
Gilead Sciences, Inc. | | | 34,402 | | | | 3,481,138 | |
Vertex Pharmaceuticals Inc.(b) | | | 14,489 | | | | 1,823,151 | |
| | | | | | | | 18,295,265 | |
|
| Cable & Satellite–2.92% | |
DISH Network Corp.–Class A(b) | | | 52,679 | | | | 3,012,185 | |
Time Warner Cable Inc. | | | 1,915 | | | | 355,405 | |
| | | | | | | | 3,367,590 | |
|
| Communications Equipment–1.97% | |
Palo Alto Networks, Inc.(b) | | | 12,867 | | | | 2,266,393 | |
|
| Consumer Electronics–3.57% | |
Harman International Industries, Inc. | | | 27,882 | | | | 2,626,763 | |
Sony Corp. (Japan) | | | 60,900 | | | | 1,491,952 | |
| | | | | | | | 4,118,715 | |
|
| Data Processing & Outsourced Services–6.76% | |
First Data Corp.–Class A(b) | | | 57,407 | | | | 919,660 | |
MasterCard, Inc.–Class A | | | 41,017 | | | | 3,993,415 | |
Visa Inc.–Class A | | | 37,073 | | | | 2,875,011 | |
| | | | | | | | 7,788,086 | |
|
| Health Care Equipment–1.75% | |
Medtronic PLC | | | 26,189 | | | | 2,014,458 | |
|
| Home Entertainment Software–2.23% | |
Activision Blizzard, Inc. | | | 38,520 | | | | 1,491,109 | |
Electronic Arts Inc.(b) | | | 15,791 | | | | 1,085,158 | |
| | | | | | | | 2,576,267 | |
|
| Internet Retail–8.74% | |
Amazon.com, Inc.(b) | | | 8,490 | | | | 5,738,306 | |
Netflix Inc.(b) | | | 20,102 | | | | 2,299,267 | |
Priceline Group Inc. (The)(b) | | | 1,600 | | | | 2,039,920 | |
| | | | | | | | 10,077,493 | |
|
| Internet Software & Services–16.21% | |
Alibaba Group Holding Ltd.–ADR (China)(b) | | | 11,551 | | | | 938,750 | |
Alphabet Inc.–Class A(b) | | | 8,873 | | | | 6,903,283 | |
| | | | | | | | |
| | | Shares | | | Value | |
| Internet Software & Services–(continued) | |
Alphabet Inc.–Class C(b) | | | 3,278 | | | $ | 2,487,608 | |
Facebook Inc.–Class A(b) | | | 64,080 | | | | 6,706,613 | |
LinkedIn Corp.–Class A(b) | | | 7,367 | | | | 1,658,164 | |
| | | | | | | | 18,694,418 | |
|
| Investment Banking & Brokerage–2.10% | |
Charles Schwab Corp. (The) | | | 73,543 | | | | 2,421,771 | |
|
| Life Sciences Tools & Services–2.10% | |
Thermo Fisher Scientific, Inc. | | | 17,095 | | | | 2,424,926 | |
|
| Pharmaceuticals–5.77% | |
Allergan PLC(b) | | | 6,054 | | | | 1,891,875 | |
Bristol-Myers Squibb Co. | | | 34,863 | | | | 2,398,226 | |
Eli Lilly and Co. | | | 27,991 | | | | 2,358,521 | |
| | | | | | | | 6,648,622 | |
|
| Semiconductors–7.64% | |
Avago Technologies Ltd. (Singapore) | | | 18,098 | | | | 2,626,925 | |
NXP Semiconductors N.V. (Netherlands)(b) | | | 38,265 | | | | 3,223,826 | |
ON Semiconductor Corp.(b) | | | 104,360 | | | | 1,022,728 | |
Skyworks Solutions, Inc. | | | 25,165 | | | | 1,933,427 | |
| | | | | | | | 8,806,906 | |
|
| Systems Software–7.00% | |
Check Point Software Technologies Ltd. (Israel)(b)(c) | | | 28,528 | | | | 2,321,609 | |
Microsoft Corp. | | | 41,094 | | | | 2,279,895 | |
ServiceNow, Inc.(b) | | | 40,062 | | | | 3,467,767 | |
| | | | | | | | 8,069,271 | |
|
| Technology Hardware, Storage & Peripherals–7.63% | |
Apple Inc. | | | 83,597 | | | | 8,799,420 | |
|
| Wireless Telecommunication Services–1.40% | |
Sprint Corp.(b) | | | 445,288 | | | | 1,611,943 | |
Total Common Stocks & Other Equity Interests
(Cost $78,520,384) | | | | 113,879,376 | |
|
Money Market Funds–1.45% | |
Liquid Assets Portfolio–Institutional Class, 0.29%(d) | | | 837,426 | | | | 837,426 | |
Premier Portfolio–Institutional Class, 0.24%(d) | | | 837,426 | | | | 837,426 | |
Total Money Market Funds
(Cost $1,674,852) | | | | 1,674,852 | |
TOTAL INVESTMENTS (excluding investments purchased with cash collateral from securities on loan)–100.22%
(Cost $80,195,236) | | | | 115,554,228 | |
See accompanying Notes to Financial Statements which are an integral part of the financial statements.
Invesco V.I. Technology Fund
| | | | | | | | |
| | | Shares | | | Value | |
Investments Purchased with Cash Collateral from Securities on Loan | | | | | |
Money Market Funds–0.18% | |
Liquid Assets Portfolio–Institutional Class, 0.29%
(Cost $204,475)(d)(e) | | | 204,475 | | | $ | 204,475 | |
TOTAL INVESTMENTS–100.40%
(Cost $80,399,711) | | | | 115,758,703 | |
OTHER ASSETS LESS LIABILITIES–(0.40)% | | | | (458,667 | ) |
NET ASSETS–100.00% | | | $ | 115,300,036 | |
Investment Abbreviations:
| | |
| ADR | | – American Depositary Receipt |
Notes to Schedule of Investments:
| (a) | Industry and/or sector classifications used in this report are generally according to the Global Industry Classification Standard, which was developed by and is the exclusive property and a service mark of MSCI Inc. and Standard & Poor’s. |
| (b) | Non-income producing security. |
| (c) | All or a portion of this security was out on loan at December 31, 2015. |
| (d) | The money market fund and the Fund are affiliated by having the same investment adviser. The rate shown is the 7-day SEC standardized yield as of December 31, 2015. |
| (e) | The security has been segregated to satisfy the commitment to return the cash collateral received in securities lending transactions upon the borrower’s return of the securities loaned. See Note 1I. |
See accompanying Notes to Financial Statements which are an integral part of the financial statements.
Invesco V.I. Technology Fund
Statement of Assets and Liabilities
December 31, 2015
Statement of Operations
For the year ended December 31, 2015
| | | | |
Assets: | |
Investments, at value (Cost $78,520,384)* | | $ | 113,879,376 | |
Investments in affiliated money market funds, at value and cost | | | 1,879,327 | |
Total investments, at value (Cost $80,399,711) | | | 115,758,703 | |
Foreign currencies, at value (Cost $4,343) | | | 4,448 | |
Receivable for: | | | | |
Fund shares sold | | | 20,116 | |
Dividends | | | 26,735 | |
Investment for trustee deferred compensation and retirement plans | | | 60,035 | |
Total assets | | | 115,870,037 | |
|
Liabilities: | |
Payable for: | | | | |
Fund shares reacquired | | | 189,162 | |
Collateral upon return of securities loaned | | | 204,475 | |
Accrued fees to affiliates | | | 79,164 | |
Accrued trustees’ and officers’ fees and benefits | | | 138 | |
Accrued other operating expenses | | | 31,095 | |
Trustee deferred compensation and retirement plans | | | 65,967 | |
Total liabilities | | | 570,001 | |
Net assets applicable to shares outstanding | | $ | 115,300,036 | |
|
Net assets consist of: | |
Shares of beneficial interest | | $ | 75,793,874 | |
Undistributed net investment income (loss) | | | (67,397 | ) |
Undistributed net realized gain | | | 4,214,462 | |
Net unrealized appreciation | | | 35,359,097 | |
| | | $ | 115,300,036 | |
|
Net Assets: | |
Series I | | $ | 107,256,843 | |
Series II | | $ | 8,043,193 | |
|
Shares outstanding, $0.001 par value per share,
with an unlimited number of shares authorized: | |
Series I | | | 5,695,780 | |
Series II | | | 444,003 | |
Series I: | | | | |
Net asset value per share | | $ | 18.83 | |
Series II: | | | | |
Net asset value per share | | $ | 18.12 | |
| * | At December 31, 2015, securities with an aggregate value of $197,509 were on loan to brokers. |
| | | | |
Investment income: | |
Dividends (net of foreign withholding taxes of $493) | | $ | 673,734 | |
Dividends from affiliated money market funds (includes securities lending income of $19,269) | | | 21,416 | |
Total investment income | | | 695,150 | |
| |
Expenses: | | | | |
Advisory fees | | | 840,697 | |
Administrative services fees | | | 325,604 | |
Custodian fees | | | 9,800 | |
Distribution fees — Series II | | | 16,973 | |
Transfer agent fees | | | 29,021 | |
Trustees’ and officers’ fees and benefits | | | 21,134 | |
Other | | | 57,836 | |
Total expenses | | | 1,301,065 | |
Less: Fees waived | | | (3,599 | ) |
Net expenses | | | 1,297,466 | |
Net investment income (loss) | | | (602,316 | ) |
| |
Realized and unrealized gain from: | | | | |
Net realized gain from: | | | | |
Investment securities | | | 4,387,691 | |
Foreign currencies | | | 1,711 | |
| | | | 4,389,402 | |
Change in net unrealized appreciation of: | | | | |
Investment securities | | | 3,448,992 | |
Foreign currencies | | | 126 | |
| | | | 3,449,118 | |
Net realized and unrealized gain | | | 7,838,520 | |
Net increase in net assets resulting from operations | | $ | 7,236,204 | |
See accompanying Notes to Financial Statements which are an integral part of the financial statements.
Invesco V.I. Technology Fund
Statement of Changes in Net Assets
For the years ended December 31, 2015 and 2014
| | | | | | | | |
| | | 2015 | | | 2014 | |
Operations: | | | | | | | | |
Net investment income (loss) | | $ | (602,316 | ) | | $ | (704,068 | ) |
Net realized gain | | | 4,389,402 | | | | 9,611,503 | |
Change in net unrealized appreciation | | | 3,449,118 | | | | 2,192,830 | |
Net increase in net assets resulting from operations | | | 7,236,204 | | | | 11,100,265 | |
| | |
Distributions to shareholders from net realized gains: | | | | | | | | |
Series l | | | (10,432,483 | ) | | | (8,529,977 | ) |
Series ll | | | (803,764 | ) | | | (353,110 | ) |
Total distributions from net realized gains | | | (11,236,247 | ) | | | (8,883,087 | ) |
| | |
Share transactions–net: | | | | | | | | |
Series l | | | 6,278,886 | | | | (755,417 | ) |
Series ll | | | 3,689,985 | | | | 1,518,646 | |
Net increase in net assets resulting from share transactions | | | 9,968,871 | | | | 763,229 | |
Net increase in net assets | | | 5,968,828 | | | | 2,980,407 | |
| | |
Net assets: | | | | | | | | |
Beginning of year | | | 109,331,208 | | | | 106,350,801 | |
End of year (includes undistributed net investment income (loss) of $(67,397) and $(65,409), respectively) | | $ | 115,300,036 | | | $ | 109,331,208 | |
Notes to Financial Statements
December 31, 2015
NOTE 1—Significant Accounting Policies
Invesco V.I. Technology Fund (the “Fund”) is a series portfolio of AIM Variable Insurance Funds (Invesco Variable Insurance Funds) (the “Trust”). The Trust is a Delaware statutory trust registered under the Investment Company Act of 1940, as amended (the “1940 Act”), as an open-end series management investment company consisting of twenty-four separate portfolios, (each constituting a “Fund”). The assets, liabilities and operations of each portfolio are accounted for separately. Information presented in these financial statements pertains only to the Fund. Matters affecting each Fund or class will be voted on exclusively by the shareholders of such Fund or class. Current Securities and Exchange Commission (“SEC”) guidance, however, requires participating insurance companies offering separate accounts to vote shares proportionally in accordance with the instructions of the contract owners whose investments are funded by shares of each Fund or class.
The Fund’s investment objective is long-term growth of capital.
The Fund currently offers two classes of shares, Series I and Series II, both of which are offered to insurance company separate accounts funding variable annuity contracts and variable life insurance policies (“variable products”).
The following is a summary of the significant accounting policies followed by the Fund in the preparation of its financial statements.
| A. | Security Valuations — Securities, including restricted securities, are valued according to the following policy. |
A security listed or traded on an exchange (except convertible securities) is valued at its last sales price or official closing price as of the close of the customary trading session on the exchange where the security is principally traded, or lacking any sales or official closing price on a particular day, the security may be valued at the closing bid price on that day. Securities traded in the over-the-counter market are valued based on prices furnished by independent pricing services or market makers. When such securities are valued by an independent pricing service they may be considered fair valued. Futures contracts are valued at the final settlement price set by an exchange on which they are principally traded. Listed options are valued at the mean between the last bid and asked prices from the exchange on which they are principally traded. Options not listed on an exchange are valued by an independent source at the mean between the last bid and asked prices. For purposes of determining net asset value (“NAV”) per share, futures and option contracts generally are valued 15 minutes after the close of the customary trading session of the New York Stock Exchange (“NYSE”).
Investments in open-end and closed-end registered investment companies that do not trade on an exchange are valued at the end-of-day net asset value per share. Investments in open-end and closed-end registered investment companies that trade on an exchange are valued at the last sales price or official closing price as of the close of the customary trading session on the exchange where the security is principally traded.
Debt obligations (including convertible securities) and unlisted equities are fair valued using an evaluated quote provided by an independent pricing service. Evaluated quotes provided by the pricing service may be determined without exclusive reliance on quoted prices, and may reflect appropriate factors such as institution-size trading in similar groups of securities, developments related to specific securities, dividend rate (for unlisted equities), yield (for debt obligations), quality, type of issue, coupon rate (for debt obligations), maturity (for debt obligations), individual trading characteristics and other market data. Debt obligations are subject to interest rate and credit risks. In addition, all debt obligations involve some risk of default with respect to interest and/or principal payments.
Invesco V.I. Technology Fund
Foreign securities’ (including foreign exchange contracts) prices are converted into U.S. dollar amounts using the applicable exchange rates as of the close of the NYSE. If market quotations are available and reliable for foreign exchange-traded equity securities, the securities will be valued at the market quotations. Because trading hours for certain foreign securities end before the close of the NYSE, closing market quotations may become unreliable. If between the time trading ends on a particular security and the close of the customary trading session on the NYSE, events occur that the Adviser determines are significant and make the closing price unreliable, the Fund may fair value the security. If the event is likely to have affected the closing price of the security, the security will be valued at fair value in good faith using procedures approved by the Board of Trustees. Adjustments to closing prices to reflect fair value may also be based on a screening process of an independent pricing service to indicate the degree of certainty, based on historical data, that the closing price in the principal market where a foreign security trades is not the current value as of the close of the NYSE. Foreign securities’ prices meeting the approved degree of certainty that the price is not reflective of current value will be priced at the indication of fair value from the independent pricing service. Multiple factors may be considered by the independent pricing service in determining adjustments to reflect fair value and may include information relating to sector indices, American Depositary Receipts and domestic and foreign index futures. Foreign securities may have additional risks including exchange rate changes, potential for sharply devalued currencies and high inflation, political and economic upheaval, the relative lack of issuer information, relatively low market liquidity and the potential lack of strict financial and accounting controls and standards.
Securities for which market prices are not provided by any of the above methods may be valued based upon quotes furnished by independent sources. The last bid price may be used to value equity securities. The mean between the last bid and asked prices is used to value debt obligations, including corporate loans.
Securities for which market quotations are not readily available or became unreliable are valued at fair value as determined in good faith by or under the supervision of the Trust’s officers following procedures approved by the Board of Trustees. Issuer specific events, market trends, bid/asked quotes of brokers and information providers and other market data may be reviewed in the course of making a good faith determination of a security’s fair value.
The Fund may invest in securities that are subject to interest rate risk, meaning the risk that the prices will generally fall as interest rates rise and, conversely, the prices will generally rise as interest rates fall. Specific securities differ in their sensitivity to changes in interest rates depending on their individual characteristics. Changes in interest rates may result in increased market volatility, which may affect the value and/or liquidity of certain Fund investments.
Valuations change in response to many factors including the historical and prospective earnings of the issuer, the value of the issuer’s assets, general economic conditions, interest rates, investor perceptions and market liquidity. Because of the inherent uncertainties of valuation, the values reflected in the financial statements may materially differ from the value received upon actual sale of those investments.
| B. | Securities Transactions and Investment Income — Securities transactions are accounted for on a trade date basis. Realized gains or losses on sales are computed on the basis of specific identification of the securities sold. Interest income (net of withholding tax, if any) is recorded on the accrual basis from settlement date. Dividend income (net of withholding tax, if any) is recorded on the ex-dividend date. |
The Fund may periodically participate in litigation related to Fund investments. As such, the Fund may receive proceeds from litigation settlements. Any proceeds received are included in the Statement of Operations as realized gain (loss) for investments no longer held and as unrealized gain (loss) for investments still held.
Brokerage commissions and mark ups are considered transaction costs and are recorded as an increase to the cost basis of securities purchased and/or a reduction of proceeds on a sale of securities. Such transaction costs are included in the determination of net realized and unrealized gain (loss) from investment securities reported in the Statement of Operations and the Statement of Changes in Net Assets and the net realized and unrealized gains (losses) on securities per share in the Financial Highlights. Transaction costs are included in the calculation of the Fund’s net asset value and, accordingly, they reduce the Fund’s total returns. These transaction costs are not considered operating expenses and are not reflected in net investment income reported in the Statement of Operations and the Statement of Changes in Net Assets, or the net investment income per share and the ratios of expenses and net investment income reported in the Financial Highlights, nor are they limited by any expense limitation arrangements between the Fund and the investment adviser.
The Fund allocates income and realized and unrealized capital gains and losses to a class based on the relative net assets of each class.
| C. | Country Determination — For the purposes of making investment selection decisions and presentation in the Schedule of Investments, the investment adviser may determine the country in which an issuer is located and/or credit risk exposure based on various factors. These factors include the laws of the country under which the issuer is organized, where the issuer maintains a principal office, the country in which the issuer derives 50% or more of its total revenues and the country that has the primary market for the issuer’s securities, as well as other criteria. Among the other criteria that may be evaluated for making this determination are the country in which the issuer maintains 50% or more of its assets, the type of security, financial guarantees and enhancements, the nature of the collateral and the sponsor organization. Country of issuer and/or credit risk exposure has been determined to be the United States of America, unless otherwise noted. |
| D. | Distributions — Distributions from net investment income and net realized capital gain, if any, are generally declared and paid to separate accounts of participating insurance companies annually and recorded on the ex-dividend date. |
| E. | Federal Income Taxes — The Fund intends to comply with the requirements of Subchapter M of the Internal Revenue Code of 1986, as amended (the “Internal Revenue Code”), necessary to qualify as a regulated investment company and to distribute substantially all of the Fund’s taxable earnings to shareholders. As such, the Fund will not be subject to federal income taxes on otherwise taxable income (including net realized capital gain) that is distributed to shareholders. Therefore, no provision for federal income taxes is recorded in the financial statements. |
The Fund recognizes the tax benefits of uncertain tax positions only when the position is more likely than not to be sustained. Management has analyzed the Fund’s uncertain tax positions and concluded that no liability for unrecognized tax benefits should be recorded related to uncertain tax positions. Management is not aware of any tax positions for which it is reasonably possible that the total amounts of unrecognized tax benefits will change materially in the next 12 months.
The Fund files tax returns in the U.S. Federal jurisdiction and certain other jurisdictions. Generally, the Fund is subject to examinations by such taxing authorities for up to three years after the filing of the return for the tax period.
| F. | Expenses — Fees provided for under the Rule 12b-1 plan of a particular class of the Fund and which are directly attributable to that class are charged to the operations of such class. All other expenses are allocated among the classes based on relative net assets. |
Invesco V.I. Technology Fund
| G. | Accounting Estimates — The preparation of financial statements in conformity with accounting principles generally accepted in the United States of America (“GAAP”) requires management to make estimates and assumptions that affect the reported amounts of assets and liabilities at the date of the financial statements and the reported amounts of revenues and expenses during the reporting period including estimates and assumptions related to taxation. Actual results could differ from those estimates by a significant amount. In addition, the Fund monitors for material events or transactions that may occur or become known after the period-end date and before the date the financial statements are released to print. |
| H. | Indemnifications — Under the Trust’s organizational documents, each Trustee, officer, employee or other agent of the Trust is indemnified against certain liabilities that may arise out of the performance of their duties to the Fund. Additionally, in the normal course of business, the Fund enters into contracts, including the Fund’s servicing agreements, that contain a variety of indemnification clauses. The Fund’s maximum exposure under these arrangements is unknown as this would involve future claims that may be made against the Fund that have not yet occurred. The risk of material loss as a result of such indemnification claims is considered remote. |
| I. | Securities Lending — The Fund may lend portfolio securities having a market value up to one-third of the Fund’s total assets. Such loans are secured by collateral equal to no less than the market value of the loaned securities determined daily by the securities lending provider. Such collateral will be cash or debt securities issued or guaranteed by the U.S. Government or any of its sponsored agencies. Cash collateral received in connection with these loans is invested in short-term money market instruments or affiliated money market funds and is shown as such on the Schedule of Investments. The Fund bears the risk of loss with respect to the investment of collateral. It is the Fund’s policy to obtain additional collateral from or return excess collateral to the borrower by the end of the next business day, following the valuation date of the securities loaned. Therefore, the value of the collateral held may be temporarily less than the value of the securities on loan. When loaning securities, the Fund retains certain benefits of owning the securities, including the economic equivalent of dividends or interest generated by the security. Lending securities entails a risk of loss to the Fund if, and to the extent that, the market value of the securities loaned were to increase and the borrower did not increase the collateral accordingly, and the borrower failed to return the securities. The securities loaned are subject to termination at the option of the borrower or the Fund. Upon termination, the borrower will return to the Fund the securities loaned and the Fund will return the collateral. Upon the failure of the borrower to return the securities, collateral may be liquidated and the securities may be purchased on the open market to replace the loaned securities. The Fund could experience delays and costs in gaining access to the collateral and the securities may lose value during the delay which could result in potential losses to the Fund. Some of these losses may be indemnified by the lending agent. The Fund bears the risk of any deficiency in the amount of the collateral available for return to the borrower due to any loss on the collateral invested. Dividends received on cash collateral investments for securities lending transactions, which are net of compensation to counterparties, are included in Dividends from affiliated money market funds on the Statement of Operations. The aggregate value of securities out on loan, if any, is shown as a footnote on the Statement of Assets and Liabilities. |
| J. | Foreign Currency Translations — Foreign currency is valued at the close of the NYSE based on quotations posted by banks and major currency dealers. Portfolio securities and other assets and liabilities denominated in foreign currencies are translated into U.S. dollar amounts at date of valuation. Purchases and sales of portfolio securities (net of foreign taxes withheld on disposition) and income items denominated in foreign currencies are translated into U.S. dollar amounts on the respective dates of such transactions. The Fund does not separately account for the portion of the results of operations resulting from changes in foreign exchange rates on investments and the fluctuations arising from changes in market prices of securities held. The combined results of changes in foreign exchange rates and the fluctuation of market prices on investments (net of estimated foreign tax withholding) are included with the net realized and unrealized gain or loss from investments in the Statement of Operations. Reported net realized foreign currency gains or losses arise from (1) sales of foreign currencies, (2) currency gains or losses realized between the trade and settlement dates on securities transactions, and (3) the difference between the amounts of dividends, interest, and foreign withholding taxes recorded on the Fund’s books and the U.S. dollar equivalent of the amounts actually received or paid. Net unrealized foreign currency gains and losses arise from changes in the fair values of assets and liabilities, other than investments in securities at fiscal period end, resulting from changes in exchange rates. |
The Fund may invest in foreign securities, which may be subject to foreign taxes on income, gains on investments or currency repatriation, a portion of which may be recoverable. Foreign taxes, if any, are recorded based on the tax regulations and rates that exist in the foreign markets in which the Fund invests and are shown in the Statement of Operations.
| K. | Forward Foreign Currency Contracts — The Fund may engage in foreign currency transactions either on a spot (i.e. for prompt delivery and settlement) basis, or through forward foreign currency contracts, to manage or minimize currency or exchange rate risk. |
The Fund may also enter into forward foreign currency contracts for the purchase or sale of a security denominated in a foreign currency in order to “lock in” the U.S. dollar price of that security, or the Fund may also enter into forward foreign currency contracts that do not provide for physical settlement of the two currencies, but instead are settled by a single cash payment calculated as the difference between the agreed upon exchange rate and the spot rate at settlement based upon an agreed upon notional amount (non-deliverable forwards). The Fund will set aside liquid assets in an amount equal to daily mark-to-market obligation for forward foreign currency contracts.
A forward foreign currency contract is an obligation between two parties (“Counterparties”) to purchase or sell a specific currency for an agreed-upon price at a future date. The use of forward foreign currency contracts does not eliminate fluctuations in the price of the underlying securities the Fund owns or intends to acquire but establishes a rate of exchange in advance. Fluctuations in the value of these contracts are measured by the difference in the contract date and reporting date exchange rates and are recorded as unrealized appreciation (depreciation) until the contracts are closed. When the contracts are closed, realized gains (losses) are recorded. Realized and unrealized gains (losses) on the contracts are included in the Statement of Operations. The primary risks associated with forward foreign currency contracts include failure of the Counterparty to meet the terms of the contract and the value of the foreign currency changing unfavorably. These risks may be in excess of the amounts reflected in the Statement of Assets and Liabilities.
| L. | Other Risks — The Fund’s investments are concentrated in a comparatively narrow segment of the economy, which may make the Fund more volatile. |
Many products and services offered in technology-related industries are subject to rapid obsolescence, which may lower the value of the issuers in this sector.
Invesco V.I. Technology Fund
NOTE 2—Advisory Fees and Other Fees Paid to Affiliates
The Trust has entered into a master investment advisory agreement with Invesco Advisers, Inc. (the “Adviser” or “Invesco”). Under the terms of the investment advisory agreement, the Fund pays an advisory fee to the Adviser based on the annual rate of the Fund’s average daily net assets as follows:
| | | | | | |
| Average Daily Net Assets | | Rate |
First $250 million | | | 0 | .75% | | |
Next $250 million | | | 0 | .74% | | |
Next $500 million | | | 0 | .73% | | |
Next $1.5 billion | | | 0 | .72% | | |
Next $2.5 billion | | | 0 | .71% | | |
Next $2.5 billion | | | 0 | .70% | | |
Next $2.5 billion | | | 0 | .69% | | |
Over $10 billion | | | 0 | .68% | | |
For the year ended December 31, 2015, the effective advisory fees incurred by the Fund was 0.75%.
Under the terms of a master sub-advisory agreement between the Adviser and each of Invesco Asset Management Deutschland GmbH, Invesco Asset Management Limited, Invesco Asset Management (Japan) Limited, Invesco Hong Kong Limited, Invesco Senior Secured Management, Inc. and Invesco Canada Ltd. (collectively, the “Affiliated Sub-Advisers”) the Adviser, not the Fund, may pay 40% of the fees paid to the Adviser to any such Affiliated Sub-Adviser(s) that provide(s) discretionary investment management services to the Fund based on the percentage of assets allocated to such Affiliated Sub-Adviser(s).
The Adviser has contractually agreed, through at least June 30, 2016, to waive advisory fees and/or reimburse expenses to the extent necessary to limit total annual fund operating expenses after fee waiver and/or expense reimbursement (excluding certain items discussed below) of Series I shares to 2.00% and Series II shares to 2.25% of average daily net assets. In determining the Adviser’s obligation to waive advisory fees and/or reimburse expenses, the following expenses are not taken into account, and could cause the total annual fund operating expenses after fee waiver and/or expense reimbursement to exceed the numbers reflected above: (1) interest; (2) taxes; (3) dividend expense on short sales; (4) extraordinary or non-routine items, including litigation expenses; and (5) expenses that the Fund has incurred but did not actually pay because of an expense offset arrangement. Unless Invesco continues the fee waiver agreement, it will terminate on June 30, 2016. The fee waiver agreement cannot be terminated during its term. The Adviser did not waive fees and/or reimburse expenses during the period under this expense limitation.
Further, the Adviser has contractually agreed, through at least June 30, 2017, to waive the advisory fee payable by the Fund in an amount equal to 100% of the net advisory fees the Adviser receives from the affiliated money market funds on investments by the Fund of uninvested cash in such affiliated money market funds.
For the year ended December 31, 2015, the Adviser waived advisory fees of $3,599.
The Trust has entered into a master administrative services agreement with Invesco pursuant to which the Fund has agreed to pay Invesco a fee for costs incurred in providing accounting services and fund administrative services to the Fund and to reimburse Invesco for administrative services fees paid to insurance companies that have agreed to provide services to the participants of separate accounts. These administrative services provided by the insurance companies may include, among other things: the printing of prospectuses, financial reports and proxy statements and the delivery of the same to existing participants; the maintenance of master accounts; the facilitation of purchases and redemptions requested by the participants; and the servicing of participants’ accounts. Pursuant to such agreement, for the year ended December 31, 2015, Invesco was paid $50,000 for accounting and fund administrative services and reimbursed $275,604 for services provided by insurance companies.
The Trust has entered into a transfer agency and service agreement with Invesco Investment Services, Inc. (“IIS”) pursuant to which the Fund has agreed to pay IIS a fee for providing transfer agency and shareholder services to the Fund and reimburse IIS for certain expenses incurred by IIS in the course of providing such services. For the year ended December 31, 2015, expenses incurred under the agreement are shown in the Statement of Operations as Transfer agent fees.
The Trust has entered into a master distribution agreement with Invesco Distributors, Inc. (“IDI”) to serve as the distributor for the Fund. The Trust has adopted a plan pursuant to Rule 12b-1 under the 1940 Act with respect to the Fund’s Series II shares (the “Plan”). The Fund, pursuant to the Plan, pays IDI compensation at the annual rate of 0.25% of the Fund’s average daily net assets of Series II shares. Of the Plan payments, up to 0.25% of the average daily net assets of the Series II shares may be paid to insurance companies who furnish continuing personal shareholder services to customers who purchase and own Series II shares of the Fund. For the year ended December 31, 2015, expenses incurred under the Plan are detailed in the Statement of Operations as Distribution fees.
For the year ended December 31, 2015, the Fund incurred $2,363 in brokerage commissions with Invesco Capital Markets, Inc., an affiliate of the Adviser and IDI, for portfolio transactions executed on behalf of the Fund.
Certain officers and trustees of the Trust are officers and directors of the Adviser, IIS and/or IDI.
Invesco V.I. Technology Fund
NOTE 3—Additional Valuation Information
GAAP defines fair value as the price that would be received to sell an asset or paid to transfer a liability in an orderly transaction between market participants at the measurement date, under current market conditions. GAAP establishes a hierarchy that prioritizes the inputs to valuation methods, giving the highest priority to readily available unadjusted quoted prices in an active market for identical assets (Level 1) and the lowest priority to significant unobservable inputs (Level 3), generally when market prices are not readily available or are unreliable. Based on the valuation inputs, the securities or other investments are tiered into one of three levels. Changes in valuation methods may result in transfers in or out of an investment’s assigned level:
| | Level 1 — | Prices are determined using quoted prices in an active market for identical assets. |
| | Level 2 — | Prices are determined using other significant observable inputs. Observable inputs are inputs that other market participants may use in pricing a security. These may include quoted prices for similar securities, interest rates, prepayment speeds, credit risk, yield curves, loss severities, default rates, discount rates, volatilities and others. |
| | Level 3 — | Prices are determined using significant unobservable inputs. In situations where quoted prices or observable inputs are unavailable (for example, when there is little or no market activity for an investment at the end of the period), unobservable inputs may be used. Unobservable inputs reflect the Fund’s own assumptions about the factors market participants would use in determining fair value of the securities or instruments and would be based on the best available information. |
The following is a summary of the tiered valuation input levels, as of December 31, 2015. The level assigned to the securities valuations may not be an indication of the risk or liquidity associated with investing in those securities. Because of the inherent uncertainties of valuation, the values reflected in the financial statements may materially differ from the value received upon actual sale of those investments.
| | | | | | | | | | | | | | | | |
| | | Level 1 | | | Level 2 | | | Level 3 | | | Total | |
Equity Securities | | $ | 114,266,751 | | | $ | 1,491,952 | | | $ | — | | | $ | 115,758,703 | |
NOTE 4—Trustees’ and Officers’ Fees and Benefits
Trustees’ and Officers’ Fees and Benefits include amounts accrued by the Fund to pay remuneration to certain Trustees and Officers of the Fund. Trustees have the option to defer compensation payable by the Fund, and Trustees’ and Officers’ Fees and Benefits also include amounts accrued by the Fund to fund such deferred compensation amounts. Those Trustees who defer compensation have the option to select various Invesco Funds in which their deferral accounts shall be deemed to be invested. Finally, certain current Trustees were eligible to participate in a retirement plan that provided for benefits to be paid upon retirement to Trustees over a period of time based on the number of years of service. The Fund may have certain former Trustees who also participate in a retirement plan and receive benefits under such plan. Trustees’ and Officers’ Fees and Benefits include amounts accrued by the Fund to fund such retirement benefits. Obligations under the deferred compensation and retirement plans represent unsecured claims against the general assets of the Fund.
NOTE 5—Cash Balances
The Fund is permitted to temporarily carry a negative or overdrawn balance in its account with State Street Bank and Trust Company, the custodian bank. Such balances, if any at period end, are shown in the Statement of Assets and Liabilities under the payable caption Amount due custodian. To compensate the custodian bank for such overdrafts, the overdrawn Fund may either (1) leave funds as a compensating balance in the account so the custodian bank can be compensated by earning the additional interest; or (2) compensate by paying the custodian bank at a rate agreed upon by the custodian bank and Invesco, not to exceed the contractually agreed upon rate.
NOTE 6—Distributions to Shareholders and Tax Components of Net Assets
Tax Character of Distributions to Shareholders Paid During the Fiscal Years Ended December 31, 2015 and 2014:
| | | | | | | | |
| | | 2015 | | | 2014 | |
Ordinary income | | $ | 44,845 | | | $ | 364,534 | |
Long-term capital gain | | | 11,191,402 | | | | 8,518,553 | |
Total distributions | | $ | 11,236,247 | | | $ | 8,883,087 | |
Tax Components of Net Assets at Period-End:
| | | | |
| | | 2015 | |
Undistributed long-term gain | | $ | 4,375,897 | |
Net unrealized appreciation — investments | | | 35,197,557 | |
Net unrealized appreciation — other investments | | | 105 | |
Temporary book/tax differences | | | (67,397 | ) |
Shares of beneficial interest | | | 75,793,874 | |
Total net assets | | $ | 115,300,036 | |
The difference between book-basis and tax-basis unrealized appreciation is due to differences in the timing of recognition of gains and losses on investments for tax and book purposes. The Fund’s net unrealized appreciation difference is attributable primarily to wash sales.
The temporary book/tax differences are a result of timing differences between book and tax recognition of income and/or expenses. The Fund’s temporary book/tax differences are the result of the trustee deferral of compensation and retirement plan benefits.
Invesco V.I. Technology Fund
Capital loss carryforward is calculated and reported as of a specific date. Results of transactions and other activity after that date may affect the amount of capital loss carryforward actually available for the Fund to utilize. Capital losses generated in years beginning after December 22, 2010 can be carried forward for an unlimited period, whereas previous losses expire in eight tax years. Capital losses with an expiration period may not be used to offset capital gains until all net capital losses without an expiration date have been utilized. Capital loss carryforwards with no expiration date will retain their character as either short-term or long-term capital losses instead of as short-term capital losses as under prior law. The ability to utilize capital loss carryforwards in the future may be limited under the Internal Revenue Code and related regulations based on the results of future transactions.
The Fund does not have a capital loss carryforward as of December 31, 2015.
NOTE 7—Investment Securities
The aggregate amount of investment securities (other than short-term securities, U.S. Treasury obligations and money market funds, if any) purchased and sold by the Fund during the year ended December 31, 2015 was $66,207,260 and $67,537,674, respectively. Cost of investments on a tax basis includes the adjustments for financial reporting purposes as of the most recently completed federal income tax reporting period-end.
| | | | |
| Unrealized Appreciation (Depreciation) of Investment Securities on a Tax Basis | |
Aggregate unrealized appreciation of investment securities | | $ | 37,734,697 | |
Aggregate unrealized (depreciation) of investment securities | | | (2,537,140 | ) |
Net unrealized appreciation of investment securities | | $ | 35,197,557 | |
Cost of investments for tax purposes is $80,561,146.
NOTE 8—Reclassification of Permanent Differences
Primarily as a result of differing book/tax treatment of net operating losses, on December 31, 2015, undistributed net investment income (loss) was increased by $600,328, undistributed net realized gain was decreased by $3,798 and shares of beneficial interest was decreased by $596,530. This reclassification had no effect on the net assets of the Fund.
NOTE 9—Share Information
| | | | | | | | | | | | | | | | |
| | | Summary of Share Activity | |
| | | Years ended December 31, | |
| | | 2015(a) | | | 2014 | |
| | | Shares | | | Amount | | | Shares | | | Amount | |
Sold: | | | | | | | | | | | | | | | | |
Series I | | | 937,510 | | | $ | 18,643,275 | | | | 661,326 | | | $ | 13,151,750 | |
Series II | | | 169,083 | | | | 3,299,652 | | | | 100,308 | | | | 1,917,074 | |
| | | | |
Issued as reinvestment of dividends: | | | | | | | | | | | | | | | | |
Series I | | | 596,483 | | | | 10,432,483 | | | | 450,844 | | | | 8,529,977 | |
Series II | | | 47,730 | | | | 803,764 | | | | 19,264 | | | | 353,110 | |
| | | | |
Reacquired: | | | | | | | | | | | | | | | | |
Series I | | | (1,131,990 | ) | | | (22,796,872 | ) | | | (1,131,140 | ) | | | (22,437,144 | ) |
Series II | | | (22,460 | ) | | | (413,431 | ) | | | (39,211 | ) | | | (751,538 | ) |
Net increase in share activity | | | 596,356 | | | $ | 9,968,871 | | | | 61,391 | | | $ | 763,229 | |
| (a) | There are entities that are record owners of more than 5% of the outstanding shares of the Fund and in the aggregate own 64% of the outstanding shares of the Fund. The Fund and the Fund’s principal underwriter or adviser, are parties to participation agreements with these entities whereby these entities sell units of interest in separate accounts funding variable products that are invested in the Fund. The Fund, Invesco and/or Invesco affiliates may make payments to these entities, which are considered to be related to the Fund, for providing services to the Fund, Invesco and/or Invesco affiliates including but not limited to services such as, securities brokerage, third party record keeping and account servicing and administrative services. The Fund has no knowledge as to whether all or any portion of the shares owned of record by these entities are also owned beneficially. |
Invesco V.I. Technology Fund
NOTE 10—Financial Highlights
The following schedule presents financial highlights for a share of the Fund outstanding throughout the periods indicated.
| | | | | | | | | | | | | | | | | | | | | | | | | | | | | | | | | | | | | | | | | | | | | | | | | | | | | | | | | | | | | | | | | | | | | | |
| | | Net asset
value,
beginning
of period | | Net
investment income
(loss)(a) | | Net gains (losses)
on securities (both realized and
unrealized) | | Total from investment operations | | Dividends from net investment
income | | Distributions from net realized
gains | | Total distributions | | Net asset value, end
of period | | Total return(b) | | Net assets, end of period
(000’s omitted) | | Ratio of expenses to average
net assets
with fee waivers
and/or expenses
absorbed | | Ratio of expenses to average net assets without
fee waivers and/or expenses absorbed | | Ratio of net investment income (loss)
to average
net assets | | Portfolio turnover(c) |
Series I | | | | | | | | | | | | | | | | | | | | | | | | | | | | | | | | | | | | | | | | | | | | | | | | | | | | | | | | | | | | | | | | | | | | | | |
Year ended 12/31/15 | | | $ | 19.75 | | | | $ | (0.11 | ) | | | $ | 1.29 | | | | $ | 1.18 | | | | $ | — | | | | $ | (2.10 | ) | | | $ | (2.10 | ) | | | $ | 18.83 | | | | | 6.82 | % | | | $ | 107,257 | | | | | 1.15 | %(d) | | | | 1.15 | %(d) | | | | (0.53 | )%(d) | | | | 61 | % |
Year ended 12/31/14 | | | | 19.42 | | | | | (0.13 | ) | | | | 2.20 | | | | | 2.07 | | | | | — | | | | | (1.74 | ) | | | | (1.74 | ) | | | | 19.75 | | | | | 11.05 | | | | | 104,556 | | | | | 1.16 | | | | | 1.16 | | | | | (0.65 | ) | | | | 77 | |
Year ended 12/31/13 | | | | 16.87 | | | | | (0.07 | ) | | | | 4.19 | | | | | 4.12 | | | | | — | | | | | (1.57 | ) | | | | (1.57 | ) | | | | 19.42 | | | | | 25.14 | | | | | 103,151 | | | | | 1.17 | | | | | 1.17 | | | | | (0.40 | ) | | | | 45 | |
Year ended 12/31/12 | | | | 15.16 | | | | | (0.07 | ) | | | | 1.78 | | | | | 1.71 | | | | | — | | | | | — | | | | | — | | | | | 16.87 | | | | | 11.28 | | | | | 95,371 | | | | | 1.16 | | | | | 1.16 | | | | | (0.42 | ) | | | | 42 | |
Year ended 12/31/11 | | | | 16.00 | | | | | (0.10 | ) | | | | (0.71 | ) | | | | (0.81 | ) | | | | (0.03 | ) | | | | – | | | | | (0.03 | ) | | | | 15.16 | | | | | (5.05 | ) | | | | 100,579 | | | | | 1.12 | | | | | 1.12 | | | | | (0.62 | ) | | | | 41 | |
Series II | | | | | | | | | | | | | | | | | | | | | | | | | | | | | | | | | | | | | | | | | | | | | | | | | | | | | | | | | | | | | | | | | | | | | | |
Year ended 12/31/15 | | | | 19.13 | | | | | (0.15 | ) | | | | 1.24 | | | | | 1.09 | | | | | — | | | | | (2.10 | ) | | | | (2.10 | ) | | | | 18.12 | | | | | 6.56 | | | | | 8,043 | | | | | 1.40 | (d) | | | | 1.40 | (d) | | | | (0.78 | )(d) | | | | 61 | |
Year ended 12/31/14 | | | | 18.90 | | | | | (0.17 | ) | | | | 2.14 | | | | | 1.97 | | | | | — | | | | | (1.74 | ) | | | | (1.74 | ) | | | | 19.13 | | | | | 10.82 | | | | | 4,775 | | | | | 1.41 | | | | | 1.41 | | | | | (0.90 | ) | | | | 77 | |
Year ended 12/31/13 | | | | 16.50 | | | | | (0.12 | ) | | | | 4.09 | | | | | 3.97 | | | | | — | | | | | (1.57 | ) | | | | (1.57 | ) | | | | 18.90 | | | | | 24.79 | | | | | 3,200 | | | | | 1.42 | | | | | 1.42 | | | | | (0.65 | ) | | | | 45 | |
Year ended 12/31/12 | | | | 14.86 | | | | | (0.11 | ) | | | | 1.75 | | | | | 1.64 | | | | | — | | | | | — | | | | | — | | | | | 16.50 | | | | | 11.04 | | | | | 2,118 | | | | | 1.41 | | | | | 1.41 | | | | | (0.67 | ) | | | | 42 | |
Year ended 12/31/11 | | | | 15.71 | | | | | (0.14 | ) | | | | (0.70 | ) | | | | (0.84 | ) | | | | (0.01 | ) | | | | — | | | | | (0.01 | ) | | | | 14.86 | | | | | (5.32 | ) | | | | 1,613 | | | | | 1.37 | | | | | 1.37 | | | | | (0.87 | ) | | | | 41 | |
| (a) | Calculated using average shares outstanding. |
| (b) | Includes adjustments in accordance with accounting principles generally accepted in the United States of America and as such, the net asset value for financial reporting purposes and the returns based upon those net asset values may differ from the net asset value and returns for shareholder transactions. Total returns are not annualized for periods less than one year, if applicable and do not reflect charges assessed in connection with a variable product, which if included would reduce total returns. |
| (c) | Portfolio turnover is calculated at the fund level and is not annualized for periods less than one year, if applicable. |
| (d) | Ratios are based on average daily net assets (000’s omitted) of $105,304 and $6,789 for Series I and Series II shares, respectively. |
Invesco V.I. Technology Fund
Report of Independent Registered Public Accounting Firm
To the Board of Trustees of AIM Variable Insurance Funds (Invesco Variable Insurance Funds)
and Shareholders of Invesco V.I. Technology Fund:
In our opinion, the accompanying statement of assets and liabilities, including the schedule of investments, and the related statements of operations and of changes in net assets and the financial highlights present fairly, in all material respects, the financial position of Invesco V.I. Technology Fund (one of the funds constituting AIM Variable Insurance Funds (Invesco Variable Insurance Funds), hereafter referred to as the “Fund”) at December 31, 2015, the results of its operations for the year then ended, the changes in its net assets for each of the two years in the period then ended and the financial highlights for each of the five years in the period then ended, in conformity with accounting principles generally accepted in the United States of America. These financial statements and financial highlights (hereafter referred to as “financial statements”) are the responsibility of the Fund’s management. Our responsibility is to express an opinion on these financial statements based on our audits. We conducted our audits of these financial statements in accordance with the standards of the Public Company Accounting Oversight Board (United States). Those standards require that we plan and perform the audit to obtain reasonable assurance about whether the financial statements are free of material misstatement. An audit includes examining, on a test basis, evidence supporting the amounts and disclosures in the financial statements, assessing the accounting principles used and significant estimates made by management, and evaluating the overall financial statement presentation. We believe that our audits, which included confirmation of securities at December 31, 2015 by correspondence with the custodian and brokers, provide a reasonable basis for our opinion.
PRICEWATERHOUSECOOPERS LLP
Houston, Texas
February 15, 2016
Invesco V.I. Technology Fund
Calculating your ongoing Fund expenses
Example
As a shareholder of the Fund, you incur ongoing costs, including management fees; distribution and/or service fees (12b-1); and other Fund expenses. This example is intended to help you understand your ongoing costs (in dollars) of investing in the Fund and to compare these costs with ongoing costs of investing in other mutual funds. The example is based on an investment of $1,000 invested at the beginning of the period and held for the entire period July 1, 2015 through December 31, 2015.
The actual and hypothetical expenses in the examples below do not represent the effect of any fees or other expenses assessed in connection with a variable product; if they did, the expenses shown would be higher while the ending account values shown would be lower.
Actual expenses
The table below provides information about actual account values and actual expenses. You may use the information in this table, together with the amount you invested, to estimate the expenses that you paid over the period. Simply divide your account value by $1,000 (for example, an $8,600 account value divided by $1,000 = 8.6), then multiply the result by the number in the table under the heading entitled “Actual Expenses Paid During Period” to estimate the expenses you paid on your account during this period.
Hypothetical example for comparison purposes
The table below also provides information about hypothetical account values and hypothetical expenses based on the Fund’s actual expense ratio and an assumed rate of return of 5% per year before expenses, which is not the Fund’s actual return.
The hypothetical account values and expenses may not be used to estimate the actual ending account balance or expenses you paid for the period. You may use this information to compare the ongoing costs of investing in the Fund and other funds. To do so, compare this 5% hypothetical example with the 5% hypothetical examples that appear in the shareholder reports of the other funds.
Please note that the expenses shown in the table are meant to highlight your ongoing costs. Therefore, the hypothetical information is useful in comparing ongoing costs, and will not help you determine the relative total costs of owning different funds.
| | | | | | | | | | | | | | | | | | | | | | | | |
| Class | | Beginning
Account Value
(07/01/15) | | | ACTUAL | | | HYPOTHETICAL (5% annual return before expenses) | | | Annualized
Expense
Ratio | |
| | | Ending
Account Value
(12/31/15)1 | | | Expenses
Paid During
Period2 | | | Ending
Account Value
(12/31/15) | | | Expenses
Paid During
Period2 | | |
| Series I | | $ | 1,000.00 | | | $ | 1,030.10 | | | $ | 5.88 | | | $ | 1,019.41 | | | $ | 5.85 | | | | 1.15 | % |
| Series II | | | 1,000.00 | | | | 1,029.50 | | | | 7.16 | | | | 1,018.15 | | | | 7.12 | | | | 1.40 | |
| 1 | The actual ending account value is based on the actual total return of the Fund for the period July 1, 2015 through December 31, 2015, after actual expenses and will differ from the hypothetical ending account value which is based on the Fund’s expense ratio and a hypothetical annual return of 5% before expenses. |
| 2 | Expenses are equal to the Fund’s annualized expense ratio as indicated above multiplied by the average account value over the period, multiplied by 184/365 to reflect the most recent fiscal half year. |
Invesco V.I. Technology Fund
Tax Information
Form 1099-DIV, Form 1042-S and other year–end tax information provide shareholders with actual calendar year amounts that should be included in their tax returns. Shareholders should consult their tax advisors.
The following distribution information is being provided as required by the Internal Revenue Code or to meet a specific state’s requirement.
The Fund designates the following amounts or, if subsequently determined to be different, the maximum amount allowable for its fiscal year ended December 31, 2015:
| | | | |
Federal and State Income Tax | |
Long-Term Capital Gain Distributions | | $ | 11,191,402 | |
Corporate Dividends Received Deduction* | | | 95.41 | % |
U.S. Treasury Obligations* | | | 0.00 | % |
| | * | The above percentages are based on ordinary income dividends paid to shareholders during the Fund’s fiscal year. |
Invesco V.I. Technology Fund
Trustees and Officers
The address of each trustee and officer is AIM Variable Insurance Funds (Invesco Variable Insurance Funds) (the “Trust”), 11 Greenway Plaza, Suite 1000, Houston, Texas 77046-1173. The trustees serve for the life of the Trust, subject to their earlier death, incapacitation, resignation, retirement or removal as more specifically provided in the Trust’s organizational documents. Each officer serves for a one year term or until their successors are elected and qualified. Column two below includes length of time served with predecessor entities, if any.
| | | | | | | | |
Name, Year of Birth and
Position(s) Held with the Trust | | Trustee and/
or Officer Since | | Principal Occupation(s)
During Past 5 Years | | Number of Funds in Fund Complex Overseen by Trustee | | Other Directorship(s) Held by Trustee During Past 5 Years |
| Interested Persons | | | | | | | | |
| Martin L. Flanagan1 — 1960 Trustee | | 2007 | | Executive Director, Chief Executive Officer and President, Invesco Ltd. (ultimate parent of Invesco and a global investment management firm); Advisor to the Board, Invesco Advisers, Inc. (formerly known as Invesco Institutional (N.A.), Inc.); Trustee, The Invesco Funds; Vice Chair, Investment Company Institute; and Member of Executive Board, SMU Cox School of Business Formerly: Chairman and Chief Executive Officer, Invesco Advisers, Inc. (registered investment adviser); Director, Chairman, Chief Executive Officer and President, IVZ Inc. (holding company), INVESCO Group Services, Inc. (service provider) and Invesco North American Holdings, Inc. (holding company); Director, Chief Executive Officer and President, Invesco Holding Company Limited (parent of Invesco and a global investment management firm); Director, Invesco Ltd.; Chairman, Investment Company Institute and President, Co-Chief Executive Officer, Co-President, Chief Operating Officer and Chief Financial Officer, Franklin Resources, Inc. (global investment management organization) | | 146 | | None |
Philip A. Taylor2 — 1954 Trustee, President and Principal Executive Officer | | 2006 | | Head of North American Retail and Senior Managing Director, Invesco Ltd.; Director, Co-Chairman, Co-President and Co-Chief Executive Officer, Invesco Advisers, Inc. (formerly known as Invesco Institutional (N.A.), Inc.) (registered investment adviser); Director, Chairman, Chief Executive Officer and President, Invesco Management Group, Inc. (formerly known as Invesco Aim Management Group, Inc.) (financial services holding company); Director and Chairman, Invesco Investment Services, Inc. (formerly known as Invesco Aim Investment Services, Inc.) (registered transfer agent) Chief Executive Officer, Invesco Corporate Class Inc. (corporate mutual fund company) Director, Chairman and Chief Executive Officer, Invesco Canada Ltd. (formerly known as Invesco Trimark Ltd./Invesco Trimark Ltèe) (registered investment adviser and registered transfer agent); Trustee, President and Principal Executive Officer, The Invesco Funds (other than AIM Treasurer’s Series Trust (Invesco Treasurer’s Series Trust), Short-Term Investments Trust and Invesco Management Trust); Trustee and Executive Vice President, The Invesco Funds (AIM Treasurer’s Series Trust (Invesco Treasurer’s Series Trust), Short-Term Investments Trust and Invesco Management Trust only); Director, Invesco Investment Advisers LLC (formerly known as Van Kampen Asset Management); Director, Chief Executive Officer and President, Van Kampen Exchange Corp. Formerly: Director and President, INVESCO Funds Group, Inc. (registered investment adviser and registered transfer agent); Director and Chairman, IVZ Distributors, Inc. (formerly known as INVESCO Distributors, Inc.) (registered broker dealer); Director, President and Chairman, Invesco Inc. (holding company), Invesco Canada Holdings Inc. (holding company), Trimark Investments Ltd./Placements Trimark Ltèe and Invesco Financial Services Ltd/Services Financiers Invesco Ltèe; Chief Executive Officer, Invesco Canada Fund Inc (corporate mutual fund company); Director and Chairman, Van Kampen Investor Services Inc.; Director, Chief Executive Officer and President, 1371 Preferred Inc. (holding company) and Van Kampen Investments Inc.; Director and President, AIM GP Canada Inc. (general partner for limited partnerships) and Van Kampen Advisors, Inc.; Director and Chief Executive Officer, Invesco Trimark Dealer Inc. (registered broker dealer); Director, Invesco Distributors, Inc. (formerly known as Invesco Aim Distributors, Inc.) (registered broker dealer); Manager, Invesco PowerShares Capital Management LLC; Director, Chief Executive Officer and President, Invesco Advisers, Inc.; Director, Chairman, Chief Executive Officer and President, Invesco Aim Capital Management, Inc.; President, Invesco Trimark Dealer Inc. and Invesco Trimark Ltd./Invesco Trimark Ltèe; Director and President, AIM Trimark Corporate Class Inc. and AIM Trimark Canada Fund Inc.; Senior Managing Director, Invesco Holding Company Limited; Director and Chairman, Fund Management Company (former registered broker dealer); President and Principal Executive Officer, The Invesco Funds (AIM Treasurer’s Series Trust (Invesco Treasurer’s Series Trust), and Short-Term Investments Trust only); President, AIM Trimark Global Fund Inc. and AIM Trimark Canada Fund Inc | | 146 | | None |
| 1 | Mr. Flanagan is considered an interested person (within the meaning of Section 2(a)(19) of the 1940 Act) of the Trust because he is an officer of the Adviser to the Trust, and an officer and a director of Invesco Ltd., ultimate parent of the Adviser. |
| 2 | Mr. Taylor is considered an interested person (within the meaning of Section 2(a)(19) of the 1940 Act) of the Trust because he is an officer and a director of the Adviser. |
Invesco V.I. Technology Fund
Trustees and Officers—(continued)
| | | | | | | | |
Name, Year of Birth and
Position(s) Held with the Trust | | Trustee and/
or Officer Since | | Principal Occupation(s)
During Past 5 Years | | Number of Funds in Fund Complex Overseen by Trustee | | Other Directorship(s)
Held by Trustee During Past 5 Years |
| Independent Trustees | | | | | | | | |
Bruce L. Crockett — 1944 Trustee and Chair | | 2003 | | Chairman, Crockett Technologies Associates (technology consulting company) Formerly: Director, Captaris (unified messaging provider); Director, President and Chief Executive Officer, COMSAT Corporation; Chairman, Board of Governors of INTELSAT (international communications company); ACE Limited (insurance company); Independent Directors Council and Investment Company Institute | | 146 | | ALPS (Attorneys Liability Protection Society) (insurance company) and Globe Specialty Metals, Inc. (metallurgical company) |
David C. Arch — 1945 Trustee | | 2010 | | Chairman of Blistex Inc., a consumer health care products manufacturer | | 146 | | Board member of the Illinois Manufacturers’ Association; Member of the Board of Visitors, Institute for the Humanities, University of Michigan |
James T. Bunch — 1942 Trustee | | 2000 | | Managing Member, Grumman Hill Group LLC (family office/private equity investments) Formerly: Chairman of the Board of Trustees, Evans Scholars Foundation and Chairman, Board of Governors, Western Golf Association | | 146 | | Trustee, Evans Scholars Foundation; and Chairman of the Board, Denver Film Society |
Albert R. Dowden — 1941 Trustee | | 2003 | | Director of a number of public and private business corporations, including the Boss Group, Ltd. (private investment and management); Nature’s Sunshine Products, Inc. and Reich & Tang Funds (5 portfolios) (registered investment company) Formerly: Director, Homeowners of America Holding Corporation/Homeowners of America Insurance Company (property casualty company); Director, Continental Energy Services, LLC (oil and gas pipeline service); Director, CompuDyne Corporation (provider of product and services to the public security market) and Director, Annuity and Life Re (Holdings), Ltd. (reinsurance company); Director, President and Chief Executive Officer, Volvo Group North America, Inc.; Senior Vice President, AB Volvo; Director of various public and private corporations; Chairman, DHJ Media, Inc.; Director, Magellan Insurance Company; and Director, The Hertz Corporation, Genmar Corporation (boat manufacturer), National Media Corporation; Advisory Board of Rotary Power International (designer, manufacturer, and seller of rotary power engines); and Chairman, Cortland Trust, Inc. (registered investment company) | | 146 | | Director of: Nature’s Sunshine Products, Inc., Reich & Tang Funds, Homeowners of America Holding Corporation/ Homeowners of America Insurance Company, the Boss Group |
Jack M. Fields — 1952 Trustee | | 2003 | | Chief Executive Officer, Twenty First Century Group, Inc. (government affairs company); Owner and Chief Executive Officer, Dos Angeles Ranch, L.P. (cattle, hunting, corporate entertainment); and Discovery Global Education Fund (non-profit) Formerly: Chief Executive Officer, Texana Timber LP (sustainable forestry company); Director of Cross Timbers Quail Research Ranch (non-profit); and member of the U.S. House of Representatives | | 146 | | Insperity, Inc. (formerly known as Administaff) |
Eli Jones — Trustee | | 2016 | | Professor and Dean, Mays Business School, Texas A&M University Formerly: Professor and Dean, Walton College of Business, University of Arkansas, and E.J. Ourso College of Business, Louisiana State University | | 146 | | Director, Insperity, Inc., (2011-present) and ARVEST Bank (2012-2015) |
Prema Mathai-Davis — 1950 Trustee | | 2003 | | Retired. Formerly: Chief Executive Officer, YWCA of the U.S.A. | | 146 | | None |
Larry Soll — 1942 Trustee | | 1997 | | Retired. Formerly: Chairman, Chief Executive Officer and President, Synergen Corp. (a biotechnology company) | | 146 | | None |
Robert C. Troccoli — Trustee | | 2016 | | Retired. Formerly: Senior Partner, KPMG LLP | | 146 | | None |
Raymond Stickel, Jr. — 1944 Trustee | | 2005 | | Retired. Formerly: Director, Mainstay VP Series Funds, Inc. (25 portfolios) and Partner, Deloitte & Touche | | 146 | | None |
Suzanne H. Woolsey — 1941 Trustee | | 2014 | | Chief Executive Officer of Woolsey Partners LLC | | 146 | | Emeritus Chair of the Board of Trustees of the Institute for Defense Analyses; Trustee of Colorado College; Trustee of California Institute of Technology; Prior to 2014, Director of Fluor Corp.; Prior to 2010, Trustee of the German Marshall Fund of the United States; Prior to 2010 Trustee of the Rocky Mountain Institute |
Invesco V.I. Technology Fund
Trustees and Officers—(continued)
| | | | | | | | |
Name, Year of Birth and
Position(s) Held with the Trust | | Trustee and/
or Officer Since | | Principal Occupation(s)
During Past 5 Years | | Number of Funds in Fund Complex Overseen by Trustee | | Other Directorship(s)
Held by Trustee During Past 5 Years |
| Other Officers | | | | | | | | |
Russell C. Burk — 1958 Senior Vice President and Senior Officer | | 2005 | | Senior Vice President and Senior Officer, The Invesco Funds | | N/A | | N/A |
John M. Zerr — 1962 Senior Vice President, Chief Legal Officer and Secretary | | 2006 | | Director, Senior Vice President, Secretary and General Counsel, Invesco Management Group, Inc. (formerly known as Invesco Aim Management Group, Inc.) and Van Kampen Exchange Corp.; Senior Vice President, Invesco Advisers, Inc. (formerly known as Invesco Institutional (N.A.), Inc.) (registered investment adviser); Senior Vice President and Secretary, Invesco Distributors, Inc. (formerly known as Invesco Aim Distributors, Inc.); Director, Vice President and Secretary, Invesco Investment Services, Inc. (formerly known as Invesco Aim Investment Services, Inc.); Senior Vice President, Chief Legal Officer and Secretary, The Invesco Funds; Managing Director, Invesco PowerShares Capital Management LLC; Director, Secretary and General Counsel, Invesco Investment Advisers LLC (formerly known as Van Kampen Asset Management); Secretary and General Counsel, Invesco Capital Markets, Inc. (formerly known as Van Kampen Funds Inc.) and Chief Legal Officer, PowerShares Exchange-Traded Fund Trust, PowerShares Exchange-Traded Fund Trust II, PowerShares India Exchange-Traded Fund Trust, PowerShares Actively Managed Exchange-Traded Fund Trust, and PowerShares Actively Managed Exchange-Traded Commodity Fund Trust Formerly: Director, Vice President and Secretary, IVZ Distributors, Inc. (formerly known as INVESCO distributors, Inc.); Director and Vice President, INVESCO Funds Group, Inc.; Director and Vice President, Van Kampen Advisors Inc.; Director, Vice President, Secretary and General Counsel, Van Kampen Investor Services Inc.; Director, Invesco Distributors, Inc. (formerly known as Invesco Aim Distributors, Inc.); Director, Senior Vice President, General Counsel and Secretary, Invesco Aim Advisers, Inc. and Van Kampen Investments Inc.; Director, Vice President and Secretary, Fund Management Company; Director, Senior Vice President, Secretary, General Counsel and Vice President, Invesco Aim Capital Management, Inc.; Chief Operating Officer and General Counsel, Liberty Ridge Capital, Inc. (an investment adviser); Vice President and Secretary, PBHG Funds (an investment company) and PBHG Insurance Series Fund (an investment company); Chief Operating Officer, General Counsel and Secretary, Old Mutual Investment Partners (a broker-dealer); General Counsel and Secretary, Old Mutual Fund Services (an administrator) and Old Mutual Shareholder Services (a shareholder servicing center); Executive Vice President, General Counsel and Secretary, Old Mutual Capital, Inc. (an investment adviser); and Vice President and Secretary, Old Mutual Advisors Funds (an investment company) | | N/A | | N/A |
Sheri Morris — 1964 Vice President, Treasurer and Principal Financial Officer | | 2003 | | Vice President, Treasurer and Principal Financial Officer, The Invesco Funds; Vice President, Invesco Advisers, Inc. (formerly known as Invesco Institutional (N.A.), Inc.) (registered investment adviser); and Vice President, PowerShares Exchange-Traded Fund Trust, PowerShares Exchange-Traded Fund Trust II, PowerShares India Exchange-Traded Fund Trust, PowerShares Actively Managed Exchange-Traded Fund Trust, and PowerShares Actively Managed Exchange-Traded Commodity Fund Trust Formerly: Vice President, Invesco Aim Advisers, Inc., Invesco Aim Capital Management, Inc. and Invesco Aim Private Asset Management, Inc.; Assistant Vice President and Assistant Treasurer, The Invesco Funds and Assistant Vice President, Invesco Advisers, Inc., Invesco Aim Capital Management, Inc. and Invesco Aim Private Asset Management, Inc.; and Treasurer, PowerShares Exchange-Traded Fund Trust, PowerShares Exchange-Traded Fund Trust II, PowerShares India Exchange-Traded Fund Trust and PowerShares Actively Managed Exchange-Traded Fund Trust | | N/A | | N/A |
Invesco V.I. Technology Fund
Trustees and Officers—(continued)
| | | | | | | | |
Name, Year of Birth and
Position(s) Held with the Trust | | Trustee and/
or Officer Since | | Principal Occupation(s)
During Past 5 Years | | Number of Funds in Fund Complex Overseen by Trustee | | Other Directorship(s)
Held by Trustee During Past 5 Years |
| Other Officers—(continued) | | | | | | | | |
Karen Dunn Kelley — 1960 Vice President | | 2003 | | Senior Managing Director, Investments, Invesco Ltd.; Director, Co-President, Co-Chief Executive Officer, and Co-Chairman, Invesco Advisers, Inc. (formerly known as Invesco Institutional (N.A.), Inc.) (registered investment adviser); Chairman, Invesco Senior Secured Management, Inc.; Senior Vice President, Invesco Management Group, Inc. (formerly known as Invesco Aim Management Group, Inc.); Executive Vice President, Invesco Distributors, Inc. (formerly known as Invesco Aim Distributors, Inc.); Director, Invesco Mortgage Capital Inc. and Invesco Management Company Limited; Vice President, The Invesco Funds (other than AIM Treasurer’s Series Trust (Invesco Treasurer’s Series Trust), Short-Term Investments Trust and Invesco Management Trust); and President and Principal Executive Officer, The Invesco Funds (AIM Treasurer’s Series Trust (Invesco Treasurer’s Series Trust), Short-Term Investments Trust and Invesco Management Trust only) Formerly: Director and President, INVESCO Asset Management (Bermuda) Ltd., Director, INVESCO Global Asset Management Limited and INVESCO Management S.A.; Senior Vice President, Van Kampen Investments Inc. and Invesco Advisers, Inc. (formerly known as Invesco Institutional (N.A.), Inc.) (registered investment adviser); Vice President, Invesco Advisers, Inc. (formerly known as Invesco Institutional (N.A.), Inc.); Director of Cash Management and Senior Vice President, Invesco Advisers, Inc. and Invesco Aim Capital Management, Inc.; Director and President, Fund Management Company; Chief Cash Management Officer, Director of Cash Management, Senior Vice President, and Managing Director, Invesco Aim Capital Management, Inc.; Director of Cash Management, Senior Vice President, and Vice President, Invesco Advisers, Inc. and The Invesco Funds (AIM Treasurer’s Series Trust (Invesco Treasurer’s Series Trust), and Short-Term Investments Trust only) | | N/A | | N/A |
Crissie M. Wisdom — 1969 Anti-Money Laundering Compliance Officer | | 2013 | | Anti-Money Laundering Compliance Officer, Invesco Advisers, Inc. (formerly known as Invesco Institutional (N.A.), Inc.) (registered investment adviser), Invesco Capital Markets, Inc. (formerly known as Van Kampen Funds Inc.), Invesco Distributors, Inc., Invesco Investment Services, Inc., Invesco Management Group, Inc., Van Kampen Exchange Corp., The Invesco Funds, and PowerShares Exchange-Traded Fund Trust, PowerShares Exchange-Traded Fund Trust II, PowerShares India Exchange-Traded Fund Trust, PowerShares Actively Managed Exchange-Traded Fund Trust and PowerShares Actively Managed Exchange-Traded Commodity Fund Trust; Anti-Money Laundering Compliance Officer and Bank Secrecy Act Officer, INVESCO National Trust Company and Invesco Trust Company; and Fraud Prevention Manager and Controls and Risk Analysis Manager for Invesco Investment Services, Inc. | | N/A | | N/A |
Lisa O. Brinkley — 1959 Chief Compliance Officer | | 2015 | | Senior Vice President and Chief Compliance Officer, Invesco Advisers, Inc. (registered investment adviser) (formerly known as Invesco Institutional (N.A., Inc.); and Chief Compliance Officer, The Invesco Funds Formerly: Global Assurance Officer, Invesco Ltd. and Vice President, The Invesco Funds; Chief Compliance Officer, Invesco Distributors, Inc. (formerly known as Invesco Aim Distributors, Inc.), Invesco Investment Services, Inc.(formerly known as Invesco Aim Investment Services, Inc.) and Van Kampen Investor Services Inc.; Senior Vice President, Invesco Management Group, Inc.; Senior Vice President and Chief Compliance Officer, Invesco Advisers, Inc. and The Invesco Funds; Vice President and Chief Compliance Officer, Invesco Aim Capital Management, Inc. and Invesco Distributors, Inc.; Vice President, Invesco Investment Services, Inc. and Fund Management Company | | N/A | | N/A |
The Statement of Additional Information of the Trust includes additional information about the Fund’s Trustees and is available upon request, without charge, by calling 1.800.959.4246. Please refer to the Fund’s prospectus for information on the Fund’s sub-advisers.
| | | | | | |
Office of the Fund 11 Greenway Plaza, Suite 1000 Houston, TX 77046-1173 | | Investment Adviser Invesco Advisers, Inc. 1555 Peachtree Street, N.E. Atlanta, GA 30309 | | Distributor Invesco Distributors, Inc. 11 Greenway Plaza, Suite 1000 Houston, TX 77046-1173 | | Auditors PricewaterhouseCoopers LLP 1000 Louisiana Street, Suite 5800 Houston, TX 77002-5678 |
| | | |
| | | | | | |
Counsel to the Fund Stradley Ronon Stevens & Young, LLP 2005 Market Street, Suite 2600 Philadelphia, PA 19103-7018 | | Counsel to the Independent Trustees Goodwin Procter LLP 901 New York Avenue, N.W. Washington, D.C. 20001 | | Transfer Agent Invesco Investment Services, Inc. 11 Greenway Plaza, Suite 1000 Houston, TX 77046-1173 | | Custodian State Street Bank and Trust Company 225 Franklin Street Boston, MA 02110-2801 |
Invesco V.I. Technology Fund
| | | | |
| | |

| | Annual Report to Shareholders | | December 31, 2015 |
| | |
| | Invesco V.I. Value Opportunities Fund |

| | |
| | The Fund provides a complete list of its holdings four times in each fiscal year, at the quarter-ends. For the second and fourth quarters, the lists appear in the Fund’s semiannual and annual reports to shareholders. For the first and third quarters, the Fund files the lists with the Securities and Exchange Commission (SEC) on Form N-Q. The Fund’s Form N-Q filings are available on the SEC website, sec.gov. Copies of the Fund’s Forms N-Q may be reviewed and copied at the SEC Public Reference Room in Washington, D.C. You can obtain information on the operation of the Public Reference Room, including information about duplicating fee charges, by calling 202 551 8090 or 800 732 0330, or by electronic request at the following email address: publicinfo@sec.gov. The SEC file numbers for the Fund are 811-07452 and 033-57340. The Fund’s most recent portfolio holdings, as filed on Form N-Q, have also been made available to insurance companies issuing variable annuity contracts and variable life insurance policies (“variable products”) that invest in the Fund. A description of the policies and procedures that the Fund uses to determine how to vote proxies relating to portfolio securities is available without charge, upon request, from our Client Services department at 800 959 4246 or at invesco.com/proxyguidelines. The information is also available on the SEC website, sec.gov. Information regarding how the Fund voted proxies related to its portfolio securities during the most recent 12-month period ended June 30 is available at invesco.com/ proxysearch. The information is also available on the SEC website, sec.gov. Invesco Advisers, Inc. is an investment adviser; it provides investment advisory services to individual and institutional clients and does not sell securities. Invesco Distributors, Inc. is the US distributor for Invesco Ltd.’s retail mutual funds, exchange-traded funds and institutional money market funds. Both are wholly owned, indirect subsidiaries of Invesco Ltd. This report must be accompanied or preceded by a currently effective Fund prospectus and variable product prospectus, which contain more complete information, including sales charges and expenses. Investors should read each carefully before investing. Invesco Distributors, Inc. VK-VIVOPP-AR-1 NOT FDIC INSURED | MAY LOSE VALUE | NO BANK GUARANTEE |
Management’s Discussion of Fund Performance
Performance summary
For the year ended December 31, 2015, Series I shares of Invesco V.I. Value Opportunities Fund (the Fund), underperformed the S&P 1500 Value Index, the Fund’s style-specific benchmark.
Your Fund’s long-term performance appears later in this report.
Fund vs. Indexes
Total returns, 12/31/14 to 12/31/15, excluding variable product issuer charges.
If variable product issuer charges were included, returns would be lower.
| | | | | |
| Series I Shares | | | | -10.40 | % |
| Series II Shares | | | | -10.65 | |
| S&P 500 Index▼ (Broad Market Index) | | | | 1.38 | |
| S&P 1500 Value Index▼ (Style-Specific Index)* | | | | -3.53 | |
| Russell 3000 Value Index▼ (Former Style-Specific Index)* | | | | -4.13 | |
| Lipper VUF Multi-Cap Value Funds Index¢ (Peer Group Index) | | | | -4.86 | |
| | | | | |
| Source(s): ▼FactSet Research Systems Inc.; ¢Lipper Inc. | | |
* The Fund has elected to use the S&P 1500 Value Index as its style-specific benchmark rather than the Russell 3000 Value Index because the S&P 1500 Value Index more closely reflects the performance of the types of securities in which the Fund invests. |
Market conditions and your Fund
The Fund experienced several changes during the reporting period. Effective March 30, 2015, the Fund’s portfolio management team was changed to R. Canon Coleman II (lead manager), Jonathan Edwards and Jonathan Mueller. The investment process also changed and the style-specific benchmark changed to the S&P 1500 Value Index. The Fund’s investment objective remains the same, and the Fund continues to be a multi-cap offering.
Some of the Fund’s performance for the year is attributable to the investment approach of the previous investment team. The new team seeks to create wealth by maintaining a long-term investment horizon and investing in companies that are selling at a significant discount to their estimated intrinsic value.1 We believe intrinsic value represents the inherent business value of portfolio holdings based on our estimates of future cash flow.
Since our application of this strategy is highly disciplined and relatively unique, it is important to understand the benefits and limitations of our process. First, the investment strategy is intended to preserve capital while growing it at above-market rates over the long term. Second, our investments tend to have little in common with popular stock market indexes and most of our peers. And third, the Fund’s short-term relative performance will naturally be different from the stock market indexes and peers and have little information value since we typically structure the portfolio significantly differently than these benchmarks.
During the year ended December 31, 2015, the US economy improved slowly, though the health of individual economic sectors varied dramatically. The energy sector saw a continued slowdown as oil prices fell in response to increasing supply and slowing global demand. In contrast, continued low interest rates, increased availability of credit and a better
employment picture all contributed to an improved consumer outlook. However, US equity markets moved lower in the summer of 2015 as a significant downturn in China’s financial markets and weak global economic growth led to increased investor uncertainty and market volatility. In the fall of 2015, US markets rallied, the US Federal Reserve saw enough economic stabilization to finally raise interest rates and most major US market indexes ended the year barely in positive territory based on total return. However, value and small- and mid-capitalization indexes in the US posted losses and strongly underperformed growth and large capitalization indexes.
Drivers of Fund performance were mainly stock specific during the year. Health benefits company Anthem was the largest contributor to the Fund’s performance. Cruise company Carnival, and information technology (IT) company,
NXP Semiconductors, were also among the top contributors to Fund performance. We sold Anthem and NXP Semiconductors and significantly reduced the Fund’s position in Carnival during the year. Financial holding AmTrust Financial Services also made a positive contribution to Fund performance. AmTrust Financial Services is a property and casualty insurance company that performed well after reporting strong financial results during the year.
IT company Belden, a global leader in high-quality cable and other signal transmission devices, was the largest detractor from the Fund’s performance during the year. Shares of Belden declined after the company made downward revisions to its earnings expectations for 2015. Materials company Allegheny Technologies, one of the largest manufacturers of diversified specialty materials in the world, was also a large detractor from
| | |
| Portfolio Composition | | |
By sector | | % of total net assets |
| | | | | | | |
Financials | | | | | | 43.3 | % |
| Information Technology | | | | | | 17.0 | |
| Industrials | | | | | | 10.5 | |
| Consumer Discretionary | | | | | | 9.7 | |
| Health Care | | | | | | 6.2 | |
| Energy | | | | | | 6.1 | |
| Consumer Staples | | | | | | 4.2 | |
| Materials | | | | | | 1.3 | |
Money Market Funds Plus Other Assets Less Liabilities | | | | | | 1.7 | |
| | | | | |
| Top 10 Equity Holdings* |
% of total net assets |
| | | | | | | | | | |
| 1. | | AECOM | | | | 5.2 | % |
| 2. | | Belden Inc. | | | | 4.8 | |
| 3. | | JPMorgan Chase & Co. | | | | 4.5 | |
| 4. | | Alere, Inc. | | | | 4.4 | |
| 5. | | Nu Skin Enterprises, Inc.-Class A | | | | 4.2 | |
| 6. | | Zions Bancorp. | | | | 3.6 | |
| 7. | | Citigroup Inc. | | | | 3.6 | |
| 8. | | Affiliated Managers Group, Inc. | | | | 3.5 | |
| 9. | | LPL Financial Holdings, Inc. | | | | 3.5 | |
| 10. | | TD Ameritrade Holding Corp. | | | | 3.5 | |
| | |
| Total Net Assets | | $138.8 million |
| |
| Total Number of Holdings* | | 38 |
The Fund’s holdings are subject to change, and there is no assurance that the Fund will continue to hold any particular security.
*Excluding money market fund holdings.
Data presented here are as of December 31, 2015.
Invesco V.I. Value Opportunities Fund
Fund performance. Shares of the company declined in response to the decline in global commodity prices and some short-term, company-specific issues that affected production, including a strike by the United Steelworkers union. Consumer staples company Nu Skin Enterprises was also among the largest detractors from Fund performance. Shares fell after the company lowered its earnings guidance for 2015. Nu Skin Enterprises is a direct marketing business that sells skin care and beauty products. We used the short-term weakness as an opportunity and added to the Fund’s positions in Belden, Allegheny Technologies and Nu Skin Enterprises during the year.
We believe the single most important indicator of how the Fund is positioned for potential future success is not our recent investment results nor popular statistical measures, but rather the difference between current market prices and the Fund’s estimated intrinsic value – the aggregate business value of the portfolio based on our estimate of intrinsic value for each individual holding.
At the end of the year, the difference between the market price and the estimated intrinsic value of the Fund was very attractive, according to our estimation. While there is no assurance that market value will ever reflect our estimate of the Fund’s intrinsic value, we believe the gap between price and estimated intrinsic value may stack the odds in favor of above-average capital appreciation. We will continue to work hard to protect and grow the Fund’s estimated intrinsic value.
We thank you for your investment and for sharing our long-term investment perspective.
| 1 | Intrinsic value calculations are estimates and, as a result, market price may never reflect intrinsic value estimates, especially for an entire portfolio. |
The views and opinions expressed in management’s discussion of Fund performance are those of Invesco Advisers, Inc. These views and opinions are subject to change at any time based on factors such as market and economic conditions. These views and opinions may not be relied upon as investment advice or recommendations, or as an offer for a particular security. The information is not a complete analysis of every aspect of any market, country, industry, security or the Fund. Statements of fact are from sources considered reliable, but Invesco Advisers, Inc. makes no representation or warranty as to their completeness or accuracy. Although historical performance is no guarantee of future results, these insights may help you understand our investment management philosophy.
See important Fund and, if applicable, index disclosures later in this report.
| | |
 | | R. Canon Coleman II Chartered Financial Analyst, Portfolio Manager, is lead manager of Invesco V.I. Value Opportunities |
| Fund. He joined Invesco in 1999. Mr. Coleman earned a BS and an MS in accounting from the University of Florida. He also earned an MBA from the Wharton School of the University of Pennsylvania. |
| |
 | | Jonathan Edwards Chartered Financial Analyst, Portfolio Manager, is manager of Invesco V.I. Value Opportunities Fund. He |
| joined Invesco in 2001. Mr. Edwards earned a BS in economics from Texas A&M University and an MBA from The University of Texas at Austin. |
| | |
| |
 | | Jonathan Mueller Chartered Financial Analyst, Portfolio Manager, is manager of Invesco V.I. Value Opportunities Fund. He |
| joined Invesco in 2001. Mr. Mueller earned a BBA in accounting from Texas Christian University and an MBA in finance from The University of Texas at Austin. He is also a Certified Public Accountant. |
Invesco V.I. Value Opportunities Fund
Your Fund’s Long-Term Performance
Results of a $10,000 Investment – Oldest Share Class(es)
Fund and index data from 12/31/05
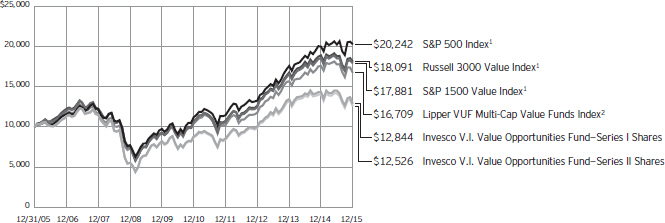
| 1 | Source: FactSet Research Systems Inc. |
Past performance cannot guarantee comparable future results.
The Fund has elected to use the S&P 1500 Value Index as its style-specific benchmark rather than the Russell 3000
Value Index because the S&P 1500 Value Index more closely reflects the performance of the types of securities in which the Fund invests. Because this is the first reporting period since we have adopted
the new index, SEC guidelines require that we compare performance to both the old and new indexes.
| | | | | |
| Average Annual Total Returns |
As of 12/31/15 | | | | | |
| |
| Series I Shares | | | | | |
| Inception (9/10/01) | | | | 3.39 | % |
| 10 Years | | | | 2.53 | |
| 5 Years | | | | 7.83 | |
| 1 Year | | | | -10.40 | |
| |
| Series II Shares | | | | | |
| Inception (9/10/01) | | | | 3.13 | % |
| 10 Years | | | | 2.28 | |
| 5 Years | | | | 7.56 | |
1 Year | | | | -10.65 | |
The performance of the Fund’s Series I and Series II share classes will differ primarily due to different class expenses.
The performance data quoted represent past performance and cannot guarantee comparable future results; current performance may be lower or higher. Please contact your variable product issuer or financial adviser for the most recent month-end variable product performance. Performance figures reflect Fund expenses, reinvested distributions and changes in net asset value. Investment return and principal value will fluctuate so that you may have a gain or loss when you sell shares.
The net annual Fund operating expense ratio set forth in the most recent Fund prospectus as of the date of this report for Series I and Series II shares was 1.04% and 1.29%, respectively.1 The total annual Fund operating expense ratio set forth in the most recent Fund prospectus as of the date of this report for Series I and Series II shares was 1.05% and 1.30%, respectively. The expense ratios presented above may vary from the expense ratios presented in other sections of this report that are based on expenses incurred during the period covered by this report.
Invesco V.I. Value Opportunities Fund, a series portfolio of AIM Variable Insurance Funds (Invesco Variable Insurance Funds), is currently offered through insurance companies issuing variable products. You cannot purchase shares of the Fund directly. Performance figures given represent the Fund and are not intended to reflect actual variable product values. They do not reflect sales charges, expenses and fees assessed in connection with a variable product. Sales charges, expenses and fees, which are determined
by the variable product issuers, will vary and will lower the total return.
The most recent month-end performance at the Fund level, excluding variable product charges, is available at 800 451 4246. As mentioned above, for the most recent month-end performance including variable product charges, please contact your variable product issuer or financial adviser.
Fund performance reflects any applicable fee waivers and/or expense reimbursements. Had the adviser not waived fees and/or reimbursed expenses currently or in the past, returns would have been lower. See current prospectus for more information.
| 1 | Total annual Fund operating expenses after any contractual fee waivers and/or expense reimbursements by the adviser in effect through at least June 30, 2017. See current prospectus for more information. |
Invesco V.I. Value Opportunities Fund
Invesco V.I. Value Opportunities Fund’s investment objective is long-term growth of capital.
| n | | Unless otherwise stated, information presented in this report is as of December 31, 2015, and is based on total net assets. |
| n | | Unless otherwise noted, all data provided by Invesco. |
| n | | To access your Fund’s reports/prospectus, visit invesco.com/fundreports. |
Principal risks of investing in the Fund
Convertible securities risk. The Fund may own convertible securities, the value of which may be affected by market interest rates, the risk that the issuer will default, the value of the underlying stock or the right of the issuer to buy back the convertible securities.
Depositary receipts risk. Depositary receipts involve many of the same risks as those associated with direct investment in foreign securities. In addition, the underlying issuers of certain depositary receipts, particularly unsponsored or unregistered depositary receipts, are under no obligation to distribute shareholder communications to the holders of such receipts or to pass through to them any voting rights with respect to the deposited securities.
Derivatives risk. The value of a derivative instrument depends largely on (and is derived from) the value of an underlying security, currency, commodity, interest rate, index or other asset (each referred to as an underlying asset). In addition to risks relating to the underlying assets, the use of derivatives may include other, possibly greater, risks, including counterparty, leverage and liquidity risks. Counterparty risk is the risk that the counterparty to the derivative contract will default on its obligation to pay the Fund the amount owed or otherwise perform under the derivative contract. Derivatives create leverage risk because they do not require payment up front equal to the economic exposure created by owning the derivative. As a result, an adverse change in the value of the underlying asset could result in the Fund sustaining a loss that is substantially greater than the amount invested in the derivative, which may make the Fund’s returns more volatile and increase the risk of loss. Derivative instruments may also be less liquid than more traditional investments and the Fund may be unable to sell or close out its derivative positions at a desirable time or price. This risk may be more acute under adverse market conditions, during which the Fund may be most in need of liquidating its derivative positions. Derivatives may also be harder to value, less tax efficient and subject to changing government regulation that could impact the Fund’s ability to use certain derivatives or their
cost. Also, derivatives used for
hedging or to gain or limit exposure
to a particular market segment may not provide the expected benefits, particularly during adverse market conditions.
Developing/emerging markets securities risk. The prices of securities issued by foreign companies and governments located in developing/emerging markets countries may be affected more negatively by inflation, devaluation of their currencies, higher transaction costs, delays in settlement, adverse political developments, the introduction of capital controls, withholding taxes, nationalization of private assets, expropriation, social unrest, war or lack of timely information than those in developed countries.
Focus risk. The Fund may from time to time invest a greater amount of its assets in a sector or industries than the Fund’s benchmark or other comparable funds. In this event, the Fund’s performance will depend to a greater extent on the overall condition of the sector or industries and there is increased risk to the Fund if conditions adversely affect that sector or industries.
Foreign securities risk. The Fund’s foreign investments may be affected by changes in a foreign country’s exchange rates, political and social instability, changes in economic or taxation policies, difficulties when enforcing obligations, decreased liquidity, and increased volatility. Foreign companies may be subject to less regulation resulting in less publicly available information about the companies.
Initial public offerings (IPO) risk. The prices of IPO securities fluctuate more than prices of equity securities of companies with longer trading histories. In addition, companies offering securities in IPOs may have less experienced management or limited operating histories. There can be no assurance that the underlying fund will have favorable IPO investment opportunities.
Management risk. The investment techniques and risk analysis used by the Fund’s portfolio managers may not produce the desired results.
Market risk. The prices of and the income generated by the Fund’s securities may decline in response to, among other things, investor sentiment, general economic and market conditions, regional or global instability, and currency and interest rate fluctuations.
Preferred securities risk. Preferred securities may include provisions
that permit the issuer, in its discretion, to defer or omit distributions for a certain period of time. If the Fund owns a security that is deferring or omitting its distributions, the Fund may be required to report the distribution on its tax returns, even though it may not have received this income. Further, preferred securities may lose substantial value due to the omission or deferment of dividend payments.
Real estate investment trust (REIT)/real estate investment risk. Investments in real estate related instruments may be affected by economic, legal, cultural, environmental or technological factors that affect property values, rents or occupancies of real estate related to the Fund’s holdings. Shares of real estate related companies,
Small- and mid-capitalization risks. Stocks of small- and mid-sized companies tend to be more vulnerable to adverse developments and may have little or no operating history or track record of success, and limited product lines, markets, management and financial resources. The securities of small- and mid-sized companies may be more volatile due to less market interest and less publicly available information about the issuer. They also may be illiquid or restricted as to resale, or may trade less frequently and in smaller volumes, all of which may cause difficulty when establishing or closing a position at a desirable price.
Unseasoned issuer risk. Investments in unseasoned companies or companies with special circumstances often involve much greater risks than are inherent in other types of investments and securities of such companies may be more likely to experience fluctuations in price. In addition, investments made in anticipation of future events may, if the events are delayed or never achieved, cause stock prices to fall.
Value investing style risk. The Fund emphasizes a value style of investing, which focuses on undervalued companies with characteristics for improved valuations. This style of investing is subject to the risk that the valuations never improve or that the returns on value equity securities are less than returns on other styles of investing or the overall stock market. Value stocks also may decline in price, even though in theory they are already underpriced.
Invesco V.I. Value Opportunities Fund
About indexes used in this report
The S&P 500® Index is an unmanaged index considered representative of the US stock market.
The S&P 1500® Value Index combines the value stocks of the S&P 500, S&P MidCap 400 and the S&P SmallCap 600 indexes.
The Russell 3000® Value Index is an unmanaged index considered representative of US value stocks. The Russell 3000 Value Index is a trademark/service mark of the Frank Russell Co. Russell® is a trademark of the Frank Russell Co.
The Lipper VUF Multi-Cap Value Funds Index is an unmanaged index considered representative of multi-cap value variable insurance underlying funds tracked by Lipper.
The S&P MidCap 400® Index seeks to track the performance of mid-cap U.S. equities.
The S&P Small Cap 600® Index measures the small-cap segement of the U.S. equity market.
The Fund is not managed to track the performance of any particular index, including the index(es) described here, and consequently, the performance of the Fund may deviate significantly from the performance of the index(es).
A direct investment cannot be made in an index. Unless otherwise indicated, index results include reinvested dividends, and they do not reflect sales charges. Performance of the peer group, if applicable, reflects fund expenses; performance of a market index does not.
Other information
CPA® and Certified Public Accountant® are trademarks owned by the American Institute of Certified Public Accountants.
The returns shown in management’s discussion of Fund performance are based on net asset values calculated for shareholder transactions. Generally accepted accounting principles require adjustments to be made to the net assets of the Fund at period end for financial reporting purposes, and as such, the net asset values for shareholder transactions and the returns based on those net asset values may differ from the net asset values and returns reported in the Financial Highlights. Additionally, the returns and
net asset values shown throughout this report are at the Fund level only and do not include variable product issuer charges. If such charges were included, the total returns would be lower.
Industry classifications used in this report are generally according to the Global Industry Classification Standard, which was developed by and is the exclusive property and a service mark of MSCI Inc. and Standard & Poor’s.
Invesco V.I. Value Opportunities Fund
Schedule of Investments(a)
December 31, 2015
| | | | | | | | |
| | | Shares | | | Value | |
Common Stocks–98.32% | |
| Advertising–3.02% | |
Omnicom Group Inc. | | | 55,415 | | | $ | 4,192,699 | |
|
| Agricultural & Farm Machinery–1.26% | |
AGCO Corp. | | | 38,636 | | | | 1,753,688 | |
|
| Asset Management & Custody Banks–3.50% | |
Affiliated Managers Group, Inc.(b) | | | 30,440 | | | | 4,863,094 | |
|
| Auto Parts & Equipment–6.03% | |
Dana Holding Corp. | | | 301,700 | | | | 4,163,460 | |
Gentex Corp. | | | 262,400 | | | | 4,201,024 | |
| | | | | | | | 8,364,484 | |
|
| Building Products–1.61% | |
Owens Corning | | | 47,388 | | | | 2,228,658 | |
|
| Construction & Engineering–5.23% | |
AECOM(b) | | | 241,804 | | | | 7,261,374 | |
|
| Consumer Finance–3.37% | |
Synchrony Financial(b) | | | 153,632 | | | | 4,671,949 | |
|
| Diversified Banks–11.32% | |
Bank of America Corp. | | | 230,102 | | | | 3,872,617 | |
Citigroup Inc. | | | 95,372 | | | | 4,935,501 | |
JPMorgan Chase & Co. | | | 94,060 | | | | 6,210,782 | |
Wells Fargo & Co. | | | 12,785 | | | | 694,992 | |
| | | | | | | | 15,713,892 | |
|
| Electronic Components–4.79% | |
Belden Inc. | | | 139,264 | | | | 6,640,108 | |
|
| Electronic Equipment & Instruments–2.15% | |
FLIR Systems, Inc. | | | 106,400 | | | | 2,986,648 | |
|
| Electronic Manufacturing Services–2.63% | |
Flextronics International Ltd.(b) | | | 325,000 | | | | 3,643,250 | |
|
| Health Care Supplies–4.43% | |
Alere, Inc.(b) | | | 157,399 | | | | 6,152,727 | |
|
| Hotels, Resorts & Cruise Lines–0.62% | |
Carnival Corp. | | | 15,800 | | | | 860,784 | |
|
| Human Resource & Employment Services–2.37% | |
ManpowerGroup Inc. | | | 39,000 | | | | 3,287,310 | |
|
| Investment Banking & Brokerage–8.81% | |
E*TRADE Financial Corp.(b) | | | 86,000 | | | | 2,549,040 | |
LPL Financial Holdings, Inc. | | | 114,000 | | | | 4,862,100 | |
TD Ameritrade Holding Corp. | | | 138,500 | | | | 4,807,335 | |
| | | | | | | | 12,218,475 | |
|
| Life & Health Insurance–7.44% | |
Aflac, Inc. | | | 42,534 | | | | 2,547,787 | |
| | | | | | | | |
| | | Shares | | | Value | |
| Life & Health Insurance–(continued) | |
MetLife, Inc. | | | 68,517 | | | $ | 3,303,205 | |
Unum Group | | | 134,212 | | | | 4,467,917 | |
| | | | | | | | 10,318,909 | |
|
| Oil & Gas Equipment & Services–4.66% | |
Baker Hughes Inc. | | | 41,900 | | | | 1,933,685 | |
Halliburton Co. | | | 31,200 | | | | 1,062,048 | |
Weatherford International PLC(b) | | | 414,100 | | | | 3,474,299 | |
| | | | | | | | 6,470,032 | |
|
| Oil & Gas Exploration & Production–1.45% | |
Apache Corp. | | | 45,300 | | | | 2,014,491 | |
|
| Personal Products–4.21% | |
Nu Skin Enterprises, Inc.–Class A | | | 154,315 | | | | 5,846,995 | |
|
| Pharmaceuticals–1.80% | |
Novartis AG (Switzerland) | | | 23,552 | | | | 2,013,044 | |
Pfizer Inc. | | | 15,176 | | | | 489,882 | |
| | | | | | | | 2,502,926 | |
|
| Property & Casualty Insurance–3.23% | |
AmTrust Financial Services, Inc. | | | 72,790 | | | | 4,482,408 | |
|
| Regional Banks–5.61% | |
First Horizon National Corp. | | | 189,300 | | | | 2,748,636 | |
Zions Bancorp. | | | 184,539 | | | | 5,037,915 | |
| | | | | | | | 7,786,551 | |
|
| Semiconductor Equipment–2.32% | |
Lam Research Corp. | | | 40,500 | | | | 3,216,510 | |
|
| Semiconductors–2.79% | |
ON Semiconductor Corp.(b) | | | 395,600 | | | | 3,876,880 | |
|
| Steel–1.36% | |
Allegheny Technologies, Inc. | | | 168,100 | | | | 1,891,125 | |
|
| Systems Software–2.31% | |
Oracle Corp. | | | 87,595 | | | | 3,199,845 | |
Total Common Stocks
(Cost $138,512,089) | | | | 136,445,812 | |
|
Money Market Funds–1.92% | |
Liquid Assets Portfolio–Institutional Class, 0.29%(c) | | | 1,330,439 | | | | 1,330,439 | |
Premier Portfolio–Institutional Class, 0.24%(c) | | | 1,330,440 | | | | 1,330,440 | |
Total Money Market Funds
(Cost $2,660,879) | | | | 2,660,879 | |
TOTAL INVESTMENTS–100.24%
(Cost $141,172,968) | | | | 139,106,691 | |
OTHER ASSETS LESS LIABILITIES–(0.24)% | | | | (330,513 | ) |
NET ASSETS–100.00% | | | $ | 138,776,178 | |
Notes to Schedule of Investments:
| (a) | Industry and/or sector classifications used in this report are generally according to the Global Industry Classification Standard, which was developed by and is the exclusive property and a service mark of MSCI Inc. and Standard & Poor’s. |
| (b) | Non-income producing security. |
| (c) | The money market fund and the Fund are affiliated by having the same investment adviser. The rate shown is the 7-day SEC standardized yield as of December 31, 2015. |
See accompanying Notes to Financial Statements which are an integral part of the financial statements.
Invesco V.I. Value Opportunities Fund
Statement of Assets and Liabilities
December 31, 2015
Statement of Operations
For the year ended December 31, 2015
| | | | |
Assets: | |
Investments, at value (Cost $138,512,089) | | $ | 136,445,812 | |
Investments in affiliated money market funds, at value and cost | | | 2,660,879 | |
Total investments, at value (Cost $141,172,968) | | | 139,106,691 | |
Foreign currencies, at value (Cost $1,064) | | | 1,075 | |
Receivable for: | | | | |
Investments sold | | | 150,144 | |
Fund shares sold | | | 26,238 | |
Dividends | | | 135,452 | |
Investment for trustee deferred compensation and retirement plans | | | 98,776 | |
Total assets | | | 139,518,376 | |
| |
Liabilities: | | | | |
Payable for: | | | | |
Investments purchased | | | 415,611 | |
Fund shares reacquired | | | 60,439 | |
Accrued fees to affiliates | | | 128,660 | |
Accrued trustees’ and officers’ fees and benefits | | | 94 | |
Accrued other operating expenses | | | 25,012 | |
Trustee deferred compensation and retirement plans | | | 112,382 | |
Total liabilities | | | 742,198 | |
Net assets applicable to shares outstanding | | $ | 138,776,178 | |
| |
Net assets consist of: | | | | |
Shares of beneficial interest | | $ | 102,397,665 | |
Undistributed net investment income | | | 230,954 | |
Undistributed net realized gain | | | 38,218,009 | |
Net unrealized appreciation (depreciation) | | | (2,070,450 | ) |
| | | $ | 138,776,178 | |
|
Net Assets: | |
Series I | | $ | 83,889,323 | |
Series II | | $ | 54,886,855 | |
|
Shares outstanding, $0.001 par value per share,
with an unlimited number of shares authorized: | |
Series I | | | 10,724,875 | |
Series II | | | 7,041,397 | |
Series I: | | | | |
Net asset value per share | | $ | 7.82 | |
Series II: | | | | |
Net asset value per share | | $ | 7.79 | |
| | | | |
Investment income: | |
Dividends (net of foreign withholding taxes of $62,705) | | $ | 2,560,450 | |
Dividends from affiliated money market funds (includes securities lending income of $11,636) | | | 15,003 | |
Total investment income | | | 2,575,453 | |
| |
Expenses: | | | | |
Advisory fees | | | 1,151,680 | |
Administrative services fees | | | 458,612 | |
Custodian fees | | | 11,216 | |
Distribution fees — Series II | | | 167,587 | |
Transfer agent fees | | | 29,167 | |
Trustees’ and officers’ fees and benefits | | | 24,081 | |
Other | | | 56,477 | |
Total expenses | | | 1,898,820 | |
Less: Fees waived | | | (6,573 | ) |
Net expenses | | | 1,892,247 | |
Net investment income | | | 683,206 | |
| |
Realized and unrealized gain (loss) from: | | | | |
Net realized gain from: | | | | |
Investment securities | | | 40,172,014 | |
Foreign currencies | | | 206 | |
| | | | 40,172,220 | |
Change in net unrealized appreciation (depreciation) of: | | | | |
Investment securities | | | (57,752,090 | ) |
Foreign currencies | | | (391 | ) |
| | | | (57,752,481 | ) |
Net realized and unrealized gain (loss) | | | (17,580,261 | ) |
Net increase (decrease) in net assets resulting from operations | | $ | (16,897,055 | ) |
See accompanying Notes to Financial Statements which are an integral part of the financial statements.
Invesco V.I. Value Opportunities Fund
Statement of Changes in Net Assets
For the years ended December 31, 2015 and 2014
| | | | | | | | |
| | | 2015 | | | 2014 | |
Operations: | | | | | |
Net investment income | | $ | 683,206 | | | $ | 3,826,854 | |
Net realized gain | | | 40,172,220 | | | | 26,891,264 | |
Change in net unrealized appreciation (depreciation) | | | (57,752,481 | ) | | | (17,253,839 | ) |
Net increase (decrease) in net assets resulting from operations | | | (16,897,055 | ) | | | 13,464,279 | |
| | |
Distributions to shareholders from net investment income: | | | | | | | | |
Series I | | | (2,559,400 | ) | | | (1,634,027 | ) |
Series ll | | | (1,443,446 | ) | | | (1,170,784 | ) |
Total distributions from net investment income | | | (4,002,846 | ) | | | (2,804,811 | ) |
| | |
Distributions to shareholders from net realized gains: | | | | | | | | |
Series l | | | (7,184,178 | ) | | | — | |
Series ll | | | (4,742,937 | ) | | | — | |
Total distributions from net realized gains | | | (11,927,115 | ) | | | — | |
| | |
Share transactions–net: | | | | | | | | |
Series l | | | (7,096,221 | ) | | | (25,128,840 | ) |
Series ll | | | (12,382,949 | ) | | | (28,394,119 | ) |
Net increase (decrease) in net assets resulting from share transactions | | | (19,479,170 | ) | | | (53,522,959 | ) |
Net increase (decrease) in net assets | | | (52,306,186 | ) | | | (42,863,491 | ) |
| | |
Net assets: | | | | | | | | |
Beginning of year | | | 191,082,364 | | | | 233,945,855 | |
End of year (includes undistributed net investment income of $230,954 and $3,550,308, respectively) | | $ | 138,776,178 | | | $ | 191,082,364 | |
Notes to Financial Statements
December 31, 2015
NOTE 1—Significant Accounting Policies
Invesco V.I. Value Opportunities Fund (the “Fund”) is a series portfolio of AIM Variable Insurance Funds (Invesco Variable Insurance Funds) (the “Trust”). The Trust is a Delaware statutory trust registered under the Investment Company Act of 1940, as amended (the “1940 Act”), as an open-end series management investment company consisting of twenty-four separate portfolios, (each constituting a “Fund”). The assets, liabilities and operations of each portfolio are accounted for separately. Information presented in these financial statements pertains only to the Fund. Matters affecting each Fund or class will be voted on exclusively by the shareholders of such Fund or class. Current Securities and Exchange Commission (“SEC”) guidance, however, requires participating insurance companies offering separate accounts to vote shares proportionally in accordance with the instructions of the contract owners whose investments are funded by shares of each Fund or class.
The Fund’s investment objective is long-term growth of capital.
The Fund currently offers two classes of shares, Series I and Series II, both of which are offered to insurance company separate accounts funding variable annuity contracts and variable life insurance policies (“variable products”).
The following is a summary of the significant accounting policies followed by the Fund in the preparation of its financial statements.
| A. | Security Valuations — Securities, including restricted securities, are valued according to the following policy. |
A security listed or traded on an exchange (except convertible securities) is valued at its last sales price or official closing price as of the close of the customary trading session on the exchange where the security is principally traded, or lacking any sales or official closing price on a particular day, the security may be valued at the closing bid price on that day. Securities traded in the over-the-counter market are valued based on prices furnished by independent pricing services or market makers. When such securities are valued by an independent pricing service they may be considered fair valued. Futures contracts are valued at the final settlement price set by an exchange on which they are principally traded. Listed options are valued at the mean between the last bid and asked prices from the exchange on which they are principally traded. Options not listed on an exchange are valued by an independent source at the mean between the last bid and asked prices. For purposes of determining net asset value (“NAV”) per share, futures and option contracts generally are valued 15 minutes after the close of the customary trading session of the New York Stock Exchange (“NYSE”).
Investments in open-end and closed-end registered investment companies that do not trade on an exchange are valued at the end-of-day net asset value per share. Investments in open-end and closed-end registered investment companies that trade on an exchange are valued at the last sales price or official closing price as of the close of the customary trading session on the exchange where the security is principally traded.
Debt obligations (including convertible securities) and unlisted equities are fair valued using an evaluated quote provided by an independent pricing service. Evaluated quotes provided by the pricing service may be determined without exclusive reliance on quoted prices, and may reflect
Invesco V.I. Value Opportunities Fund
appropriate factors such as institution-size trading in similar groups of securities, developments related to specific securities, dividend rate (for unlisted equities), yield (for debt obligations), quality, type of issue, coupon rate (for debt obligations), maturity (for debt obligations), individual trading characteristics and other market data. Debt obligations are subject to interest rate and credit risks. In addition, all debt obligations involve some risk of default with respect to interest and/or principal payments.
Foreign securities’ (including foreign exchange contracts) prices are converted into U.S. dollar amounts using the applicable exchange rates as of the close of the NYSE. If market quotations are available and reliable for foreign exchange-traded equity securities, the securities will be valued at the market quotations. Because trading hours for certain foreign securities end before the close of the NYSE, closing market quotations may become unreliable. If between the time trading ends on a particular security and the close of the customary trading session on the NYSE, events occur that the Adviser determines are significant and make the closing price unreliable, the Fund may fair value the security. If the event is likely to have affected the closing price of the security, the security will be valued at fair value in good faith using procedures approved by the Board of Trustees. Adjustments to closing prices to reflect fair value may also be based on a screening process of an independent pricing service to indicate the degree of certainty, based on historical data, that the closing price in the principal market where a foreign security trades is not the current value as of the close of the NYSE. Foreign securities’ prices meeting the approved degree of certainty that the price is not reflective of current value will be priced at the indication of fair value from the independent pricing service. Multiple factors may be considered by the independent pricing service in determining adjustments to reflect fair value and may include information relating to sector indices, American Depositary Receipts and domestic and foreign index futures. Foreign securities may have additional risks including exchange rate changes, potential for sharply devalued currencies and high inflation, political and economic upheaval, the relative lack of issuer information, relatively low market liquidity and the potential lack of strict financial and accounting controls and standards.
Securities for which market prices are not provided by any of the above methods may be valued based upon quotes furnished by independent sources. The last bid price may be used to value equity securities. The mean between the last bid and asked prices is used to value debt obligations, including corporate loans.
Securities for which market quotations are not readily available or became unreliable are valued at fair value as determined in good faith by or under the supervision of the Trust’s officers following procedures approved by the Board of Trustees. Issuer specific events, market trends, bid/asked quotes of brokers and information providers and other market data may be reviewed in the course of making a good faith determination of a security’s fair value.
The Fund may invest in securities that are subject to interest rate risk, meaning the risk that the prices will generally fall as interest rates rise and, conversely, the prices will generally rise as interest rates fall. Specific securities differ in their sensitivity to changes in interest rates depending on their individual characteristics. Changes in interest rates may result in increased market volatility, which may affect the value and/or liquidity of certain Fund investments.
Valuations change in response to many factors including the historical and prospective earnings of the issuer, the value of the issuer’s assets, general economic conditions, interest rates, investor perceptions and market liquidity. Because of the inherent uncertainties of valuation, the values reflected in the financial statements may materially differ from the value received upon actual sale of those investments.
| B. | Securities Transactions and Investment Income — Securities transactions are accounted for on a trade date basis. Realized gains or losses on sales are computed on the basis of specific identification of the securities sold. Interest income (net of withholding tax, if any) is recorded on the accrual basis from settlement date. Dividend income (net of withholding tax, if any) is recorded on the ex-dividend date. |
The Fund may periodically participate in litigation related to Fund investments. As such, the Fund may receive proceeds from litigation settlements. Any proceeds received are included in the Statement of Operations as realized gain (loss) for investments no longer held and as unrealized gain (loss) for investments still held.
Brokerage commissions and mark ups are considered transaction costs and are recorded as an increase to the cost basis of securities purchased and/or a reduction of proceeds on a sale of securities. Such transaction costs are included in the determination of net realized and unrealized gain (loss) from investment securities reported in the Statement of Operations and the Statement of Changes in Net Assets and the net realized and unrealized gains (losses) on securities per share in the Financial Highlights. Transaction costs are included in the calculation of the Fund’s net asset value and, accordingly, they reduce the Fund’s total returns. These transaction costs are not considered operating expenses and are not reflected in net investment income reported in the Statement of Operations and the Statement of Changes in Net Assets, or the net investment income per share and the ratios of expenses and net investment income reported in the Financial Highlights, nor are they limited by any expense limitation arrangements between the Fund and the investment adviser.
The Fund allocates income and realized and unrealized capital gains and losses to a class based on the relative net assets of each class.
| C. | Country Determination — For the purposes of making investment selection decisions and presentation in the Schedule of Investments, the investment adviser may determine the country in which an issuer is located and/or credit risk exposure based on various factors. These factors include the laws of the country under which the issuer is organized, where the issuer maintains a principal office, the country in which the issuer derives 50% or more of its total revenues and the country that has the primary market for the issuer’s securities, as well as other criteria. Among the other criteria that may be evaluated for making this determination are the country in which the issuer maintains 50% or more of its assets, the type of security, financial guarantees and enhancements, the nature of the collateral and the sponsor organization. Country of issuer and/or credit risk exposure has been determined to be the United States of America, unless otherwise noted. |
| D. | Distributions — Distributions from net investment income and net realized capital gain, if any, are generally declared and paid to separate accounts of participating insurance companies annually and recorded on the ex-dividend date. |
| E. | Federal Income Taxes — The Fund intends to comply with the requirements of Subchapter M of the Internal Revenue Code of 1986, as amended (the “Internal Revenue Code”), necessary to qualify as a regulated investment company and to distribute substantially all of the Fund’s taxable earnings to shareholders. As such, the Fund will not be subject to federal income taxes on otherwise taxable income (including net realized capital gain) that is distributed to shareholders. Therefore, no provision for federal income taxes is recorded in the financial statements. |
The Fund recognizes the tax benefits of uncertain tax positions only when the position is more likely than not to be sustained. Management has analyzed the Fund’s uncertain tax positions and concluded that no liability for unrecognized tax benefits should be recorded related to uncertain tax positions. Management is not aware of any tax positions for which it is reasonably possible that the total amounts of unrecognized tax benefits will change materially in the next 12 months.
Invesco V.I. Value Opportunities Fund
The Fund files tax returns in the U.S. Federal jurisdiction and certain other jurisdictions. Generally, the Fund is subject to examinations by such taxing authorities for up to three years after the filing of the return for the tax period.
| F. | Expenses — Fees provided for under the Rule 12b-1 plan of a particular class of the Fund and which are directly attributable to that class are charged to the operations of such class. All other expenses are allocated among the classes based on relative net assets. |
| G. | Accounting Estimates — The preparation of financial statements in conformity with accounting principles generally accepted in the United States of America (“GAAP”) requires management to make estimates and assumptions that affect the reported amounts of assets and liabilities at the date of the financial statements and the reported amounts of revenues and expenses during the reporting period including estimates and assumptions related to taxation. Actual results could differ from those estimates by a significant amount. In addition, the Fund monitors for material events or transactions that may occur or become known after the period-end date and before the date the financial statements are released to print. |
| H. | Indemnifications — Under the Trust’s organizational documents, each Trustee, officer, employee or other agent of the Trust is indemnified against certain liabilities that may arise out of the performance of their duties to the Fund. Additionally, in the normal course of business, the Fund enters into contracts, including the Fund’s servicing agreements, that contain a variety of indemnification clauses. The Fund’s maximum exposure under these arrangements is unknown as this would involve future claims that may be made against the Fund that have not yet occurred. The risk of material loss as a result of such indemnification claims is considered remote. |
| I. | Securities Lending — The Fund may lend portfolio securities having a market value up to one-third of the Fund’s total assets. Such loans are secured by collateral equal to no less than the market value of the loaned securities determined daily by the securities lending provider. Such collateral will be cash or debt securities issued or guaranteed by the U.S. Government or any of its sponsored agencies. Cash collateral received in connection with these loans is invested in short-term money market instruments or affiliated money market funds and is shown as such on the Schedule of Investments. The Fund bears the risk of loss with respect to the investment of collateral. It is the Fund’s policy to obtain additional collateral from or return excess collateral to the borrower by the end of the next business day, following the valuation date of the securities loaned. Therefore, the value of the collateral held may be temporarily less than the value of the securities on loan. When loaning securities, the Fund retains certain benefits of owning the securities, including the economic equivalent of dividends or interest generated by the security. Lending securities entails a risk of loss to the Fund if, and to the extent that, the market value of the securities loaned were to increase and the borrower did not increase the collateral accordingly, and the borrower failed to return the securities. The securities loaned are subject to termination at the option of the borrower or the Fund. Upon termination, the borrower will return to the Fund the securities loaned and the Fund will return the collateral. Upon the failure of the borrower to return the securities, collateral may be liquidated and the securities may be purchased on the open market to replace the loaned securities. The Fund could experience delays and costs in gaining access to the collateral and the securities may lose value during the delay which could result in potential losses to the Fund. Some of these losses may be indemnified by the lending agent. The Fund bears the risk of any deficiency in the amount of the collateral available for return to the borrower due to any loss on the collateral invested. Dividends received on cash collateral investments for securities lending transactions, which are net of compensation to counterparties, are included in Dividends from affiliated money market funds on the Statement of Operations. The aggregate value of securities out on loan, if any, is shown as a footnote on the Statement of Assets and Liabilities. |
| J. | Foreign Currency Translations — Foreign currency is valued at the close of the NYSE based on quotations posted by banks and major currency dealers. Portfolio securities and other assets and liabilities denominated in foreign currencies are translated into U.S. dollar amounts at date of valuation. Purchases and sales of portfolio securities (net of foreign taxes withheld on disposition) and income items denominated in foreign currencies are translated into U.S. dollar amounts on the respective dates of such transactions. The Fund does not separately account for the portion of the results of operations resulting from changes in foreign exchange rates on investments and the fluctuations arising from changes in market prices of securities held. The combined results of changes in foreign exchange rates and the fluctuation of market prices on investments (net of estimated foreign tax withholding) are included with the net realized and unrealized gain or loss from investments in the Statement of Operations. Reported net realized foreign currency gains or losses arise from (1) sales of foreign currencies, (2) currency gains or losses realized between the trade and settlement dates on securities transactions, and (3) the difference between the amounts of dividends, interest, and foreign withholding taxes recorded on the Fund’s books and the U.S. dollar equivalent of the amounts actually received or paid. Net unrealized foreign currency gains and losses arise from changes in the fair values of assets and liabilities, other than investments in securities at fiscal period end, resulting from changes in exchange rates. |
The Fund may invest in foreign securities, which may be subject to foreign taxes on income, gains on investments or currency repatriation, a portion of which may be recoverable. Foreign taxes, if any, are recorded based on the tax regulations and rates that exist in the foreign markets in which the Fund invests and are shown in the Statement of Operations.
| K. | Forward Foreign Currency Contracts — The Fund may engage in foreign currency transactions either on a spot (i.e. for prompt delivery and settlement) basis, or through forward foreign currency contracts, to manage or minimize currency or exchange rate risk. |
The Fund may also enter into forward foreign currency contracts for the purchase or sale of a security denominated in a foreign currency in order to “lock in” the U.S. dollar price of that security, or the Fund may also enter into forward foreign currency contracts that do not provide for physical settlement of the two currencies, but instead are settled by a single cash payment calculated as the difference between the agreed upon exchange rate and the spot rate at settlement based upon an agreed upon notional amount (non-deliverable forwards). The Fund will set aside liquid assets in an amount equal to daily mark-to-market obligation for forward foreign currency contracts.
A forward foreign currency contract is an obligation between two parties (“Counterparties”) to purchase or sell a specific currency for an agreed-upon price at a future date. The use of forward foreign currency contracts does not eliminate fluctuations in the price of the underlying securities the Fund owns or intends to acquire but establishes a rate of exchange in advance. Fluctuations in the value of these contracts are measured by the difference in the contract date and reporting date exchange rates and are recorded as unrealized appreciation (depreciation) until the contracts are closed. When the contracts are closed, realized gains (losses) are recorded. Realized and unrealized gains (losses) on the contracts are included in the Statement of Operations. The primary risks associated with forward foreign currency contracts include failure of the Counterparty to meet the terms of the contract and the value of the foreign currency changing unfavorably. These risks may be in excess of the amounts reflected in the Statement of Assets and Liabilities.
Invesco V.I. Value Opportunities Fund
NOTE 2—Advisory Fees and Other Fees Paid to Affiliates
The Trust has entered into a master investment advisory agreement with Invesco Advisers, Inc. (the “Adviser” or “Invesco”). Under the terms of the investment advisory agreement, the Fund pays an advisory fee to the Adviser based on the annual rate of the Fund’s average daily net assets as follows:
| | | | | | |
| Average Daily Net Assets | | Rate |
First $250 million | | | 0 | .695% | | |
Next $250 million | | | 0 | .67% | | |
Next $500 million | | | 0 | .645% | | |
Next $1.5 billion | | | 0 | .62% | | |
Next $2.5 billion | | | 0 | .595% | | |
Next $2.5 billion | | | 0 | .57% | | |
Next $2.5 billion | | | 0 | .545% | | |
Over $10 billion | | | 0 | .52% | | |
For the year ended December 31, 2015, the effective advisory fees incurred by the Fund was 0.695%.
Under the terms of a master sub-advisory agreement between the Adviser and each of Invesco Asset Management Deutschland GmbH, Invesco Asset Management Limited, Invesco Asset Management (Japan) Limited, Invesco Hong Kong Limited, Invesco Senior Secured Management, Inc. and Invesco Canada Ltd. (collectively, the “Affiliated Sub-Advisers”) the Adviser, not the Fund, may pay 40% of the fees paid to the Adviser to any such Affiliated Sub-Adviser(s) that provide(s) discretionary investment management services to the Fund based on the percentage of assets allocated to such Affiliated Sub-Adviser(s).
The Adviser has contractually agreed, through at least June 30, 2016, to waive advisory fees and/or reimburse expenses of all shares to the extent necessary to limit total annual fund operating expenses after fee waiver and/or expense reimbursement (excluding certain items discussed below) of Series I shares to 2.00% and Series II shares to 2.25% of average daily net assets. In determining the Adviser’s obligation to waive advisory fees and/or reimburse expenses, the following expenses are not taken into account, and could cause the total annual fund operating expenses after fee waiver and/or expense reimbursement to exceed the numbers reflected above: (1) interest; (2) taxes; (3) dividend expense on short sales; (4) extraordinary or non-routine items, including litigation expenses; and (5) expenses that the Fund has incurred but did not actually pay because of an expense offset arrangement. Unless Invesco continues the fee waiver agreement, it will terminate on June 30, 2016. The fee waiver agreement cannot be terminated during its term. The Adviser did not waive fees and/or reimburse expenses during the period under this expense limitation.
Further, the Adviser has contractually agreed, through at least June 30, 2017, to waive the advisory fee payable by the Fund in an amount equal to 100% of the net advisory fees the Adviser receives from the affiliated money market funds on investments by the Fund of uninvested cash (excluding investments of cash collateral from securities lending) in such affiliated money market funds.
For the year ended December 31, 2015, the Adviser waived advisory fees of $6,573.
The Trust has entered into a master administrative services agreement with Invesco pursuant to which the Fund has agreed to pay Invesco a fee for costs incurred in providing accounting services and fund administrative services to the Fund and to reimburse Invesco for administrative services fees paid to insurance companies that have agreed to provide services to the participants of separate accounts. These administrative services provided by the insurance companies may include, among other things: the printing of prospectuses, financial reports and proxy statements and the delivery of the same to existing participants; the maintenance of master accounts; the facilitation of purchases and redemptions requested by the participants; and the servicing of participants’ accounts. Pursuant to such agreement, for the year ended December 31, 2015, Invesco was paid $50,000 for accounting and fund administrative services and reimbursed $408,612 for services provided by insurance companies.
The Trust has entered into a transfer agency and service agreement with Invesco Investment Services, Inc. (“IIS”) pursuant to which the Fund has agreed to pay IIS a fee for providing transfer agency and shareholder services to the Fund and reimburse IIS for certain expenses incurred by IIS in the course of providing such services. For the year ended December 31, 2015, expenses incurred under the agreement are shown in the Statement of Operations as Transfer agent fees.
The Trust has entered into a master distribution agreement with Invesco Distributors, Inc. (“IDI”) to serve as the distributor for the Fund. The Trust has adopted a plan pursuant to Rule 12b-1 under the 1940 Act with respect to the Fund’s Series II shares (the “Plan”). The Fund, pursuant to the Plan, pays IDI compensation at the annual rate of 0.25% of the Fund’s average daily net assets of Series II shares. Of the Plan payments, up to 0.25% of the average daily net assets of the Series II shares may be paid to insurance companies who furnish continuing personal shareholder services to customers who purchase and own Series II shares of the Fund. For the year ended December 31, 2015, expenses incurred under the Plan are detailed in the Statement of Operations as Distribution fees.
For the year ended December 31, 2015, the Fund incurred $3,839 in brokerage commissions with Invesco Capital Markets, Inc., an affiliate of the Adviser and IDI, for portfolio transactions executed on behalf of the Fund.
Certain officers and trustees of the Trust are officers and directors of the Adviser, IIS and/or IDI.
Invesco V.I. Value Opportunities Fund
NOTE 3—Additional Valuation Information
GAAP defines fair value as the price that would be received to sell an asset or paid to transfer a liability in an orderly transaction between market participants at the measurement date, under current market conditions. GAAP establishes a hierarchy that prioritizes the inputs to valuation methods, giving the highest priority to readily available unadjusted quoted prices in an active market for identical assets (Level 1) and the lowest priority to significant unobservable inputs (Level 3), generally when market prices are not readily available or are unreliable. Based on the valuation inputs, the securities or other investments are tiered into one of three levels. Changes in valuation methods may result in transfers in or out of an investment’s assigned level:
| | Level 1 — | Prices are determined using quoted prices in an active market for identical assets. |
| | Level 2 — | Prices are determined using other significant observable inputs. Observable inputs are inputs that other market participants may use in pricing a security. These may include quoted prices for similar securities, interest rates, prepayment speeds, credit risk, yield curves, loss severities, default rates, discount rates, volatilities and others. |
| | Level 3 — | Prices are determined using significant unobservable inputs. In situations where quoted prices or observable inputs are unavailable (for example, when there is little or no market activity for an investment at the end of the period), unobservable inputs may be used. Unobservable inputs reflect the Fund’s own assumptions about the factors market participants would use in determining fair value of the securities or instruments and would be based on the best available information. |
The following is a summary of the tiered valuation input levels, as of December 31, 2015. The level assigned to the securities valuations may not be an indication of the risk or liquidity associated with investing in those securities. Because of the inherent uncertainties of valuation, the values reflected in the financial statements may materially differ from the value received upon actual sale of those investments.
| | | | | | | | | | | | | | | | |
| | | Level 1 | | | Level 2 | | | Level 3 | | | Total | |
Equity Securities | | $ | 137,093,647 | | | $ | 2,013,044 | | | $ | — | | | $ | 139,106,691 | |
NOTE 4—Trustees’ and Officers’ Fees and Benefits
Trustees’ and Officers’ Fees and Benefits include amounts accrued by the Fund to pay remuneration to certain Trustees and Officers of the Fund. Trustees have the option to defer compensation payable by the Fund, and Trustees’ and Officers’ Fees and Benefits also include amounts accrued by the Fund to fund such deferred compensation amounts. Those Trustees who defer compensation have the option to select various Invesco Funds in which their deferral accounts shall be deemed to be invested. Finally, certain current Trustees were eligible to participate in a retirement plan that provided for benefits to be paid upon retirement to Trustees over a period of time based on the number of years of service. The Fund may have certain former Trustees who also participate in a retirement plan and receive benefits under such plan. Trustees’ and Officers’ Fees and Benefits include amounts accrued by the Fund to fund such retirement benefits. Obligations under the deferred compensation and retirement plans represent unsecured claims against the general assets of the Fund.
NOTE 5—Cash Balances
The Fund is permitted to temporarily carry a negative or overdrawn balance in its account with State Street Bank and Trust Company, the custodian bank. Such balances, if any at period end, are shown in the Statement of Assets and Liabilities under the payable caption Amount due custodian. To compensate the custodian bank for such overdrafts, the overdrawn Fund may either (1) leave funds as a compensating balance in the account so the custodian bank can be compensated by earning the additional interest; or (2) compensate by paying the custodian bank at a rate agreed upon by the custodian bank and Invesco, not to exceed the contractually agreed upon rate.
NOTE 6—Distributions to Shareholders and Tax Components of Net Assets
Tax Character of Distributions to Shareholders Paid During the Fiscal Years Ended December 31, 2015 and 2014:
| | | | | | | | |
| | | 2015 | | | 2014 | |
Ordinary income | | $ | 4,002,846 | | | $ | 2,804,811 | |
Long-term capital gain | | | 11,927,115 | | | | — | |
Total distributions | | $ | 15,929,961 | | | $ | 2,804,811 | |
Tax Components of Net Assets at Period-End:
| | | | |
| | | 2015 | |
Undistributed ordinary income | | $ | 503,928 | |
Undistributed long-term gain | | | 38,596,475 | |
Net unrealized appreciation (depreciation) — investments | | | (2,599,670 | ) |
Net unrealized appreciation (depreciation) — other investments | | | (4,173 | ) |
Temporary book/tax differences | | | (118,047 | ) |
Shares of beneficial interest | | | 102,397,665 | |
Total net assets | | $ | 138,776,178 | |
The difference between book-basis and tax-basis unrealized appreciation (depreciation) is due to differences in the timing of recognition of gains and losses on investments for tax and book purposes. The Fund’s net unrealized appreciation (depreciation) difference is attributable primarily to wash sales.
Invesco V.I. Value Opportunities Fund
The temporary book/tax differences are a result of timing differences between book and tax recognition of income and/or expenses. The Fund’s temporary book/tax differences are the result of the trustee deferral of compensation and retirement plan benefits.
Capital loss carryforward is calculated and reported as of a specific date. Results of transactions and other activity after that date may affect the amount of capital loss carryforward actually available for the Fund to utilize. Capital losses generated in years beginning after December 22, 2010 can be carried forward for an unlimited period, whereas previous losses expire in eight tax years. Capital losses with an expiration period may not be used to offset capital gains until all net capital losses without an expiration date have been utilized. Capital loss carryforwards with no expiration date will retain their character as either short-term or long-term capital losses instead of as short-term capital losses as under prior law. The ability to utilize capital loss carryforwards in the future may be limited under the Internal Revenue Code and related regulations based on the results of future transactions.
The Fund does not have a capital loss carryforward as of December 31, 2015.
NOTE 7—Investment Securities
The aggregate amount of investment securities (other than short-term securities, U.S. Treasury obligations and money market funds, if any) purchased and sold by the Fund during the year ended December 31, 2015 was $131,537,257 and $162,614,781, respectively. Cost of investments on a tax basis includes the adjustments for financial reporting purposes as of the most recently completed federal income tax reporting period-end.
| | | | |
| Unrealized Appreciation (Depreciation) of Investment Securities on a Tax Basis | |
Aggregate unrealized appreciation of investment securities | | $ | 16,276,444 | |
Aggregate unrealized (depreciation) of investment securities | | | (18,876,114 | ) |
Net unrealized appreciation (depreciation) of investment securities | | $ | (2,599,670 | ) |
Cost of investments for tax purposes is $141,706,361.
NOTE 8—Reclassification of Permanent Differences
Primarily as a result of differing book/tax treatment of foreign currency transactions and fair fund settelments, on December 31, 2015, undistributed net investment income was increased by $286, undistributed net realized gain was decreased by $286. This reclassification had no effect on the net assets of the Fund.
NOTE 9—Share Information
| | | | | | | | | | | | | | | | |
| | | Summary of Share Activity | |
| | | Years ended December 31, | |
| | | 2015(a) | | | 2014 | |
| | | Shares | | | Amount | | | Shares | | | Amount | |
Sold: | | | | | | | | | | | | | | | | |
Series I | | | 222,458 | | | $ | 2,046,113 | | | | 424,414 | | | $ | 4,064,543 | |
Series II | | | 283,180 | | | | 2,554,872 | | | | 1,022,954 | | | | 9,705,160 | |
| | | | |
Issued as reinvestment of dividends: | | | | | | | | | | | | | | | | |
Series I | | | 1,263,759 | | | | 9,743,578 | | | | 168,630 | | | | 1,634,027 | |
Series II | | | 804,471 | | | | 6,186,383 | | | | 121,325 | | | | 1,170,784 | |
| | | | |
Reacquired: | | | | | | | | | | | | | | | | |
Series I | | | (2,030,461 | ) | | | (18,885,912 | ) | | | (3,227,074 | ) | | | (30,827,410 | ) |
Series II | | | (2,241,197 | ) | | | (21,124,204 | ) | | | (4,093,539 | ) | | | (39,270,063 | ) |
Net increase (decrease) in share activity | | | (1,697,790 | ) | | $ | (19,479,170 | ) | | | (5,583,290 | ) | | $ | (53,522,959 | ) |
| (a) | There are entities that are record owners of more than 5% of the outstanding shares of the Fund and in the aggregate own 62% of the outstanding shares of the Fund. The Fund and the Fund’s principal underwriter or adviser, are parties to participation agreements with these entities whereby these entities sell units of interest in separate accounts funding variable products that are invested in the Fund. The Fund, Invesco and/or Invesco affiliates may make payments to these entities, which are considered to be related to the Fund, for providing services to the Fund, Invesco and/or Invesco affiliates including but not limited to services such as, securities brokerage, third party record keeping and account servicing and administrative services. The Fund has no knowledge as to whether all or any portion of the shares owned of record by these entities are also owned beneficially. |
Invesco V.I. Value Opportunities Fund
NOTE 10—Financial Highlights
The following schedule presents financial highlights for a share of the Fund outstanding throughout the periods indicated.
| | | | | | | | | | | | | | | | | | | | | | | | | | | | | | | | | | | | | | | | | | | | | | | | | | | | | | | | | | | | | | | | | | | | | | |
| | | Net asset
value,
beginning
of period | | Net
investment
income(a) | | Net gains
(losses)
on securities
(both
realized and
unrealized) | | Total from
investment
operations | | Dividends
from net
investment
income | | Distributions
from net
realized
gains | | Total
distributions | | Net asset
value, end
of period | | Total
return(b) | | Net assets,
end of period
(000’s omitted) | | Ratio of
expenses
to average
net assets
with fee waivers
and/or expenses
absorbed | | Ratio of
expenses
to average net
assets without
fee waivers
and/or expenses
absorbed | | Ratio of net
investment
income
to average
net assets | | Portfolio
turnover(c) |
Series I | |
Year ended 12/31/15 | | | $ | 9.84 | | | | $ | 0.05 | | | | $ | (1.09 | ) | | | $ | (1.04 | ) | | | $ | (0.26 | ) | | | $ | (0.72 | ) | | | $ | (0.98 | ) | | | $ | 7.82 | | | | | (10.40 | )% | | | $ | 83,889 | | | | | 1.04 | %(e) | | | | 1.04 | %(e) | | | | 0.51 | %(e) | | | | 82 | % |
Year ended 12/31/14 | | | | 9.36 | | | | | 0.18 | (d) | | | | 0.44 | | | | | 0.62 | | | | | (0.14 | ) | | | | — | | | | | (0.14 | ) | | | | 9.84 | | | | | 6.62 | | | | | 110,865 | | | | | 1.03 | | | | | 1.04 | | | | | 1.87 | (d) | | | | 15 | |
Year ended 12/31/13 | | | | 7.10 | | | | | 0.10 | | | | | 2.28 | | | | | 2.38 | | | | | (0.12 | ) | | | | — | | | | | (0.12 | ) | | | | 9.36 | | | | | 33.75 | | | | | 130,146 | | | | | 1.01 | | | | | 1.02 | | | | | 1.24 | | | | | 17 | |
Year ended 12/31/12 | | | | 6.12 | | | | | 0.09 | | | | | 0.99 | | | | | 1.08 | | | | | (0.10 | ) | | | | — | | | | | (0.10 | ) | | | | 7.10 | | | | | 17.70 | | | | | 130,383 | | | | | 1.01 | | | | | 1.02 | | | | | 1.37 | | | | | 9 | |
Year ended 12/31/11 | | | | 6.38 | | | | | 0.08 | | | | | (0.28 | ) | | | | (0.20 | ) | | | | (0.06 | ) | | | | — | | | | | (0.06 | ) | | | | 6.12 | | | | | (3.05 | ) | | | | 135,644 | | | | | 1.00 | | | | | 1.00 | | | | | 1.28 | | | | | 15 | |
Series II | | | | | | | | | | | | | | | | | | | | | | | | | | | | | | | | | | | | | | | | | | | | | | | | | | | | | | | | | | | | | | | | | | | | | | |
Year ended 12/31/15 | | | | 9.79 | | | | | 0.02 | | | | | (1.08 | ) | | | | (1.06 | ) | | | | (0.22 | ) | | | | (0.72 | ) | | | | (0.94 | ) | | | | 7.79 | | | | | (10.65 | ) | | | | 54,887 | | | | | 1.29 | (e) | | | | 1.29 | (e) | | | | 0.26 | (e) | | | | 82 | |
Year ended 12/31/14 | | | | 9.31 | | | | | 0.15 | (d) | | | | 0.44 | | | | | 0.59 | | | | | (0.11 | ) | | | | — | | | | | (0.11 | ) | | | | 9.79 | | | | | 6.39 | | | | | 80,217 | | | | | 1.28 | | | | | 1.29 | | | | | 1.62 | (d) | | | | 15 | |
Year ended 12/31/13 | | | | 7.07 | | | | | 0.08 | | | | | 2.26 | | | | | 2.34 | | | | | (0.10 | ) | | | | — | | | | | (0.10 | ) | | | | 9.31 | | | | | 33.27 | | | | | 103,800 | | | | | 1.26 | | | | | 1.27 | | | | | 0.99 | | | | | 17 | |
Year ended 12/31/12 | | | | 6.08 | | | | | 0.07 | | | | | 1.00 | | | | | 1.07 | | | | | (0.08 | ) | | | | — | | | | | (0.08 | ) | | | | 7.07 | | | | | 17.66 | | | | | 98,014 | | | | | 1.26 | | | | | 1.27 | | | | | 1.12 | | | | | 9 | |
Year ended 12/31/11 | | | | 6.34 | | | | | 0.06 | | | | | (0.28 | ) | | | | (0.22 | ) | | | | (0.04 | ) | | | | — | | | | | (0.04 | ) | | | | 6.08 | | | | | (3.39 | ) | | | | 103,538 | | | | | 1.25 | | | | | 1.25 | | | | | 1.03 | | | | | 15 | |
| (a) | Calculated using average shares outstanding. |
| (b) | Includes adjustments in accordance with accounting principles generally accepted in the United States of America and as such, the net asset value for financial reporting purposes and the returns based upon those net asset values may differ from the net asset value and returns for shareholder transactions. Total returns are not annualized for periods less than one year, if applicable, and do not reflect charges assessed in connection with a variable product, which if included would reduce total returns. |
| (c) | Portfolio turnover is calculated at the fund level and is not annualized for periods less than one year, if applicable. |
| (d) | Net Investment income per share and the ratio of net investment income to average net assets include significant dividends received during the year ended December 31, 2014. Net Investment income per share and the ratio of net investment income to average net assets excluding the significant dividends are $0.12 and 1.23% and $0.09 and 0.98% for Series I and Series II, respectively. |
| (e) | Ratios are based on average daily net assets (000’s omitted) of $98,674 and $67,035 for Series I and Series II shares, respectively. |
Invesco V.I. Value Opportunities Fund
Report of Independent Registered Public Accounting Firm
To the Board of Trustees of AIM Variable Insurance Funds (Invesco Variable Insurance Funds)
and Shareholders of Invesco V.I. Value Opportunities Fund:
In our opinion, the accompanying statement of assets and liabilities, including the schedule of investments, and the related statements of operations and of changes in net assets and the financial highlights present fairly, in all material respects, the financial position of Invesco V.I. Value Opportunities Fund (one of the funds constituting AIM Variable Insurance Funds (Invesco Variable Insurance Funds), hereafter referred to as the “Fund”) at December 31, 2015, the results of its operations for the year then ended, the changes in its net assets for each of the two years in the period then ended and the financial highlights for each of the five years in the period then ended, in conformity with accounting principles generally accepted in the United States of America. These financial statements and financial highlights (hereafter referred to as “financial statements”) are the responsibility of the Fund’s management. Our responsibility is to express an opinion on these financial statements based on our audits. We conducted our audits of these financial statements in accordance with the standards of the Public Company Accounting Oversight Board (United States). Those standards require that we plan and perform the audit to obtain reasonable assurance about whether the financial statements are free of material misstatement. An audit includes examining, on a test basis, evidence supporting the amounts and disclosures in the financial statements, assessing the accounting principles used and significant estimates made by management, and evaluating the overall financial statement presentation. We believe that our audits, which included confirmation of securities at December 31, 2015 by correspondence with the custodian and brokers, and the application of alternative auditing procedures where confirmations of security purchases have not been received, provide a reasonable basis for our opinion.
PRICEWATERHOUSECOOPERS LLP
Houston, Texas
February 15, 2016
Invesco V.I. Value Opportunities Fund
Calculating your ongoing Fund expenses
Example
As a shareholder of the Fund, you incur ongoing costs, including management fees; distribution and/or service fees (12b-1); and other Fund expenses. This example is intended to help you understand your ongoing costs (in dollars) of investing in the Fund and to compare these costs with ongoing costs of investing in other mutual funds. The example is based on an investment of $1,000 invested at the beginning of the period and held for the entire period July 1, 2015 through December 31, 2015.
The actual and hypothetical expenses in the examples below do not represent the effect of any fees or other expenses assessed in connection with a variable product; if they did, the expenses shown would be higher while the ending account values shown would be lower.
Actual expenses
The table below provides information about actual account values and actual expenses. You may use the information in this table, together with the amount you invested, to estimate the expenses that you paid over the period. Simply divide your account value by $1,000 (for example, an $8,600 account value divided by $1,000 = 8.6), then multiply the result by the number in the table under the heading entitled “Actual Expenses Paid During Period” to estimate the expenses you paid on your account during this period.
Hypothetical example for comparison purposes
The table below also provides information about hypothetical account values and hypothetical expenses based on the Fund’s actual expense ratio and an assumed rate of return of 5% per year before expenses, which is not the Fund’s actual return.
The hypothetical account values and expenses may not be used to estimate the actual ending account balance or expenses you paid for the period. You may use this information to compare the ongoing costs of investing in the Fund and other funds. To do so, compare this 5% hypothetical example with the 5% hypothetical examples that appear in the shareholder reports of the other funds.
Please note that the expenses shown in the table are meant to highlight your ongoing costs. Therefore, the hypothetical information is useful in comparing ongoing costs, and will not help you determine the relative total costs of owning different funds.
| | | | | | | | | | | | | | | | | | | | | | | | |
| Class | | Beginning
Account Value
(07/01/15) | | | ACTUAL | | | HYPOTHETICAL (5% annual return before expenses) | | | Annualized
Expense
Ratio | |
| | | Ending
Account Value
(12/31/15)1 | | | Expenses
Paid During
Period2 | | | Ending
Account Value
(12/31/15) | | | Expenses
Paid During
Period2 | | |
| Series I | | $ | 1,000.00 | | | $ | 886.10 | | | $ | 5.04 | | | $ | 1,019.86 | | | $ | 5.40 | | | | 1.06 | % |
| Series II | | | 1,000.00 | | | | 885.30 | | | | 6.23 | | | | 1,018.60 | | | | 6.67 | | | | 1.31 | |
| 1 | The actual ending account value is based on the actual total return of the Fund for the period July 1, 2015 through December 31, 2015, after actual expenses and will differ from the hypothetical ending account value which is based on the Fund’s expense ratio and a hypothetical annual return of 5% before expenses. |
| 2 | Expenses are equal to the Fund’s annualized expense ratio as indicated above multiplied by the average account value over the period, multiplied by 184/365 to reflect the most recent fiscal half year. |
Invesco V.I. Value Opportunities Fund
Tax Information
Form 1099-DIV, Form 1042-S and other year-end tax information provide shareholders with actual calendar year amounts that should be included in their tax returns. Shareholders should consult their tax advisors.
The following distribution information is being provided as required by the Internal Revenue Code or to meet a specific state’s requirement.
The Fund designates the following amounts or, if subsequently determined to be different, the maximum amount allowable for its fiscal year ended December 31, 2015:
| | | | |
Federal and State Income Tax | |
Long-Term Capital Gain Distribution | | $ | 11,927,115 | |
Corporate Dividends Received Deduction* | | | 88.93 | % |
U.S. Treasury Obligations* | | | 0.00 | % |
| | * | The above percentages are based on ordinary income dividends paid to shareholders during the Fund’s fiscal year. |
Invesco V.I. Value Opportunities Fund
Trustees and Officers
The address of each trustee and officer is AIM Variable Insurance Funds (Invesco Variable Insurance Funds) (the “Trust”), 11 Greenway Plaza, Suite 1000, Houston, Texas 77046-1173. The trustees serve for the life of the Trust, subject to their earlier death, incapacitation, resignation, retirement or removal as more specifically provided in the Trust’s organizational documents. Each officer serves for a one year term or until their successors are elected and qualified. Column two below includes length of time served with predecessor entities, if any.
| | | | | | | | |
Name, Year of Birth and
Position(s) Held with the Trust | | Trustee and/
or Officer Since | | Principal Occupation(s)
During Past 5 Years | | Number of Funds in Fund Complex Overseen by Trustee | | Other Directorship(s) Held by Trustee During Past 5 Years |
| Interested Persons | | | | | | | | |
| Martin L. Flanagan1 — 1960 Trustee | | 2007 | | Executive Director, Chief Executive Officer and President, Invesco Ltd. (ultimate parent of Invesco and a global investment management firm); Advisor to the Board, Invesco Advisers, Inc. (formerly known as Invesco Institutional (N.A.), Inc.); Trustee, The Invesco Funds; Vice Chair, Investment Company Institute; and Member of Executive Board, SMU Cox School of Business Formerly: Chairman and Chief Executive Officer, Invesco Advisers, Inc. (registered investment adviser); Director, Chairman, Chief Executive Officer and President, IVZ Inc. (holding company), INVESCO Group Services, Inc. (service provider) and Invesco North American Holdings, Inc. (holding company); Director, Chief Executive Officer and President, Invesco Holding Company Limited (parent of Invesco and a global investment management firm); Director, Invesco Ltd.; Chairman, Investment Company Institute and President, Co-Chief Executive Officer, Co-President, Chief Operating Officer and Chief Financial Officer, Franklin Resources, Inc. (global investment management organization) | | 146 | | None |
Philip A. Taylor2 — 1954 Trustee, President and Principal Executive Officer | | 2006 | | Head of North American Retail and Senior Managing Director, Invesco Ltd.; Director, Co-Chairman, Co-President and Co-Chief Executive Officer, Invesco Advisers, Inc. (formerly known as Invesco Institutional (N.A.), Inc.) (registered investment adviser); Director, Chairman, Chief Executive Officer and President, Invesco Management Group, Inc. (formerly known as Invesco Aim Management Group, Inc.) (financial services holding company); Director and Chairman, Invesco Investment Services, Inc. (formerly known as Invesco Aim Investment Services, Inc.) (registered transfer agent) Chief Executive Officer, Invesco Corporate Class Inc. (corporate mutual fund company) Director, Chairman and Chief Executive Officer, Invesco Canada Ltd. (formerly known as Invesco Trimark Ltd./Invesco Trimark Ltèe) (registered investment adviser and registered transfer agent); Trustee, President and Principal Executive Officer, The Invesco Funds (other than AIM Treasurer’s Series Trust (Invesco Treasurer’s Series Trust), Short-Term Investments Trust and Invesco Management Trust); Trustee and Executive Vice President, The Invesco Funds (AIM Treasurer’s Series Trust (Invesco Treasurer’s Series Trust), Short-Term Investments Trust and Invesco Management Trust only); Director, Invesco Investment Advisers LLC (formerly known as Van Kampen Asset Management); Director, Chief Executive Officer and President, Van Kampen Exchange Corp. Formerly: Director and President, INVESCO Funds Group, Inc. (registered investment adviser and registered transfer agent); Director and Chairman, IVZ Distributors, Inc. (formerly known as INVESCO Distributors, Inc.) (registered broker dealer); Director, President and Chairman, Invesco Inc. (holding company), Invesco Canada Holdings Inc. (holding company), Trimark Investments Ltd./Placements Trimark Ltèe and Invesco Financial Services Ltd/Services Financiers Invesco Ltèe; Chief Executive Officer, Invesco Canada Fund Inc (corporate mutual fund company); Director and Chairman, Van Kampen Investor Services Inc.; Director, Chief Executive Officer and President, 1371 Preferred Inc. (holding company) and Van Kampen Investments Inc.; Director and President, AIM GP Canada Inc. (general partner for limited partnerships) and Van Kampen Advisors, Inc.; Director and Chief Executive Officer, Invesco Trimark Dealer Inc. (registered broker dealer); Director, Invesco Distributors, Inc. (formerly known as Invesco Aim Distributors, Inc.) (registered broker dealer); Manager, Invesco PowerShares Capital Management LLC; Director, Chief Executive Officer and President, Invesco Advisers, Inc.; Director, Chairman, Chief Executive Officer and President, Invesco Aim Capital Management, Inc.; President, Invesco Trimark Dealer Inc. and Invesco Trimark Ltd./Invesco Trimark Ltèe; Director and President, AIM Trimark Corporate Class Inc. and AIM Trimark Canada Fund Inc.; Senior Managing Director, Invesco Holding Company Limited; Director and Chairman, Fund Management Company (former registered broker dealer); President and Principal Executive Officer, The Invesco Funds (AIM Treasurer’s Series Trust (Invesco Treasurer’s Series Trust), and Short-Term Investments Trust only); President, AIM Trimark Global Fund Inc. and AIM Trimark Canada Fund Inc | | 146 | | None |
| 1 | Mr. Flanagan is considered an interested person (within the meaning of Section 2(a)(19) of the 1940 Act) of the Trust because he is an officer of the Adviser to the Trust, and an officer and a director of Invesco Ltd., ultimate parent of the Adviser. |
| 2 | Mr. Taylor is considered an interested person (within the meaning of Section 2(a)(19) of the 1940 Act) of the Trust because he is an officer and a director of the Adviser. |
Invesco V.I. Value Opportunities Fund
Trustees and Officers—(continued)
| | | | | | | | |
Name, Year of Birth and
Position(s) Held with the Trust | | Trustee and/
or Officer Since | | Principal Occupation(s)
During Past 5 Years | | Number of Funds in Fund Complex Overseen by Trustee | | Other Directorship(s)
Held by Trustee During Past 5 Years |
| Independent Trustees | | | | | | | | |
Bruce L. Crockett — 1944 Trustee and Chair | | 2003 | | Chairman, Crockett Technologies Associates (technology consulting company) Formerly: Director, Captaris (unified messaging provider); Director, President and Chief Executive Officer, COMSAT Corporation; Chairman, Board of Governors of INTELSAT (international communications company); ACE Limited (insurance company); Independent Directors Council and Investment Company Institute | | 146 | | ALPS (Attorneys Liability Protection Society) (insurance company) and Globe Specialty Metals, Inc. (metallurgical company) |
David C. Arch — 1945 Trustee | | 2010 | | Chairman of Blistex Inc., a consumer health care products manufacturer | | 146 | | Board member of the Illinois Manufacturers’ Association; Member of the Board of Visitors, Institute for the Humanities, University of Michigan |
James T. Bunch — 1942 Trustee | | 2000 | | Managing Member, Grumman Hill Group LLC (family office/private equity investments) Formerly: Chairman of the Board of Trustees, Evans Scholars Foundation and Chairman, Board of Governors, Western Golf Association | | 146 | | Trustee, Evans Scholars Foundation; and Chairman of the Board, Denver Film Society |
Albert R. Dowden — 1941 Trustee | | 2003 | | Director of a number of public and private business corporations, including the Boss Group, Ltd. (private investment and management); Nature’s Sunshine Products, Inc. and Reich & Tang Funds (5 portfolios) (registered investment company) Formerly: Director, Homeowners of America Holding Corporation/Homeowners of America Insurance Company (property casualty company); Director, Continental Energy Services, LLC (oil and gas pipeline service); Director, CompuDyne Corporation (provider of product and services to the public security market) and Director, Annuity and Life Re (Holdings), Ltd. (reinsurance company); Director, President and Chief Executive Officer, Volvo Group North America, Inc.; Senior Vice President, AB Volvo; Director of various public and private corporations; Chairman, DHJ Media, Inc.; Director, Magellan Insurance Company; and Director, The Hertz Corporation, Genmar Corporation (boat manufacturer), National Media Corporation; Advisory Board of Rotary Power International (designer, manufacturer, and seller of rotary power engines); and Chairman, Cortland Trust, Inc. (registered investment company) | | 146 | | Director of: Nature’s Sunshine Products, Inc., Reich & Tang Funds, Homeowners of America Holding Corporation/ Homeowners of America Insurance Company, the Boss Group |
Jack M. Fields — 1952 Trustee | | 2003 | | Chief Executive Officer, Twenty First Century Group, Inc. (government affairs company); Owner and Chief Executive Officer, Dos Angeles Ranch, L.P. (cattle, hunting, corporate entertainment); and Discovery Global Education Fund (non-profit) Formerly: Chief Executive Officer, Texana Timber LP (sustainable forestry company); Director of Cross Timbers Quail Research Ranch (non-profit); and member of the U.S. House of Representatives | | 146 | | Insperity, Inc. (formerly known as Administaff) |
Eli Jones — Trustee | | 2016 | | Professor and Dean, Mays Business School, Texas A&M University Formerly: Professor and Dean, Walton College of Business, University of Arkansas, and E.J. Ourso College of Business, Louisiana State University | | 146 | | Director, Insperity, Inc., (2011-present) and ARVEST Bank (2012-2015) |
Prema Mathai-Davis — 1950 Trustee | | 2003 | | Retired. Formerly: Chief Executive Officer, YWCA of the U.S.A. | | 146 | | None |
Larry Soll — 1942 Trustee | | 1997 | | Retired. Formerly: Chairman, Chief Executive Officer and President, Synergen Corp. (a biotechnology company) | | 146 | | None |
Robert C. Troccoli — Trustee | | 2016 | | Retired. Formerly: Senior Partner, KPMG LLP | | 146 | | None |
Raymond Stickel, Jr. — 1944 Trustee | | 2005 | | Retired. Formerly: Director, Mainstay VP Series Funds, Inc. (25 portfolios) and Partner, Deloitte & Touche | | 146 | | None |
Suzanne H. Woolsey — 1941 Trustee | | 2014 | | Chief Executive Officer of Woolsey Partners LLC | | 146 | | Emeritus Chair of the Board of Trustees of the Institute for Defense Analyses; Trustee of Colorado College; Trustee of California Institute of Technology; Prior to 2014, Director of Fluor Corp.; Prior to 2010, Trustee of the German Marshall Fund of the United States; Prior to 2010 Trustee of the Rocky Mountain Institute |
Invesco V.I. Value Opportunities Fund
Trustees and Officers—(continued)
| | | | | | | | |
Name, Year of Birth and
Position(s) Held with the Trust | | Trustee and/
or Officer Since | | Principal Occupation(s)
During Past 5 Years | | Number of Funds in Fund Complex Overseen by Trustee | | Other Directorship(s)
Held by Trustee During Past 5 Years |
| Other Officers | | | | | | | | |
Russell C. Burk — 1958 Senior Vice President and Senior Officer | | 2005 | | Senior Vice President and Senior Officer, The Invesco Funds | | N/A | | N/A |
John M. Zerr — 1962 Senior Vice President, Chief Legal Officer and Secretary | | 2006 | | Director, Senior Vice President, Secretary and General Counsel, Invesco Management Group, Inc. (formerly known as Invesco Aim Management Group, Inc.) and Van Kampen Exchange Corp.; Senior Vice President, Invesco Advisers, Inc. (formerly known as Invesco Institutional (N.A.), Inc.) (registered investment adviser); Senior Vice President and Secretary, Invesco Distributors, Inc. (formerly known as Invesco Aim Distributors, Inc.); Director, Vice President and Secretary, Invesco Investment Services, Inc. (formerly known as Invesco Aim Investment Services, Inc.); Senior Vice President, Chief Legal Officer and Secretary, The Invesco Funds; Managing Director, Invesco PowerShares Capital Management LLC; Director, Secretary and General Counsel, Invesco Investment Advisers LLC (formerly known as Van Kampen Asset Management); Secretary and General Counsel, Invesco Capital Markets, Inc. (formerly known as Van Kampen Funds Inc.) and Chief Legal Officer, PowerShares Exchange-Traded Fund Trust, PowerShares Exchange-Traded Fund Trust II, PowerShares India Exchange-Traded Fund Trust, PowerShares Actively Managed Exchange-Traded Fund Trust, and PowerShares Actively Managed Exchange-Traded Commodity Fund Trust Formerly: Director, Vice President and Secretary, IVZ Distributors, Inc. (formerly known as INVESCO distributors, Inc.); Director and Vice President, INVESCO Funds Group, Inc.; Director and Vice President, Van Kampen Advisors Inc.; Director, Vice President, Secretary and General Counsel, Van Kampen Investor Services Inc.; Director, Invesco Distributors, Inc. (formerly known as Invesco Aim Distributors, Inc.); Director, Senior Vice President, General Counsel and Secretary, Invesco Aim Advisers, Inc. and Van Kampen Investments Inc.; Director, Vice President and Secretary, Fund Management Company; Director, Senior Vice President, Secretary, General Counsel and Vice President, Invesco Aim Capital Management, Inc.; Chief Operating Officer and General Counsel, Liberty Ridge Capital, Inc. (an investment adviser); Vice President and Secretary, PBHG Funds (an investment company) and PBHG Insurance Series Fund (an investment company); Chief Operating Officer, General Counsel and Secretary, Old Mutual Investment Partners (a broker-dealer); General Counsel and Secretary, Old Mutual Fund Services (an administrator) and Old Mutual Shareholder Services (a shareholder servicing center); Executive Vice President, General Counsel and Secretary, Old Mutual Capital, Inc. (an investment adviser); and Vice President and Secretary, Old Mutual Advisors Funds (an investment company) | | N/A | | N/A |
Sheri Morris — 1964 Vice President, Treasurer and Principal Financial Officer | | 2003 | | Vice President, Treasurer and Principal Financial Officer, The Invesco Funds; Vice President, Invesco Advisers, Inc. (formerly known as Invesco Institutional (N.A.), Inc.) (registered investment adviser); and Vice President, PowerShares Exchange-Traded Fund Trust, PowerShares Exchange-Traded Fund Trust II, PowerShares India Exchange-Traded Fund Trust, PowerShares Actively Managed Exchange-Traded Fund Trust, and PowerShares Actively Managed Exchange-Traded Commodity Fund Trust Formerly: Vice President, Invesco Aim Advisers, Inc., Invesco Aim Capital Management, Inc. and Invesco Aim Private Asset Management, Inc.; Assistant Vice President and Assistant Treasurer, The Invesco Funds and Assistant Vice President, Invesco Advisers, Inc., Invesco Aim Capital Management, Inc. and Invesco Aim Private Asset Management, Inc.; and Treasurer, PowerShares Exchange-Traded Fund Trust, PowerShares Exchange-Traded Fund Trust II, PowerShares India Exchange-Traded Fund Trust and PowerShares Actively Managed Exchange-Traded Fund Trust | | N/A | | N/A |
Invesco V.I. Value Opportunities Fund
Trustees and Officers—(continued)
| | | | | | | | |
Name, Year of Birth and
Position(s) Held with the Trust | | Trustee and/
or Officer Since | | Principal Occupation(s)
During Past 5 Years | | Number of Funds in Fund Complex Overseen by Trustee | | Other Directorship(s)
Held by Trustee During Past 5 Years |
| Other Officers—(continued) | | | | | | | | |
Karen Dunn Kelley — 1960 Vice President | | 2003 | | Senior Managing Director, Investments, Invesco Ltd.; Director, Co-President, Co-Chief Executive Officer, and Co-Chairman, Invesco Advisers, Inc. (formerly known as Invesco Institutional (N.A.), Inc.) (registered investment adviser); Chairman, Invesco Senior Secured Management, Inc.; Senior Vice President, Invesco Management Group, Inc. (formerly known as Invesco Aim Management Group, Inc.); Executive Vice President, Invesco Distributors, Inc. (formerly known as Invesco Aim Distributors, Inc.); Director, Invesco Mortgage Capital Inc. and Invesco Management Company Limited; Vice President, The Invesco Funds (other than AIM Treasurer’s Series Trust (Invesco Treasurer’s Series Trust), Short-Term Investments Trust and Invesco Management Trust); and President and Principal Executive Officer, The Invesco Funds (AIM Treasurer’s Series Trust (Invesco Treasurer’s Series Trust), Short-Term Investments Trust and Invesco Management Trust only) Formerly: Director and President, INVESCO Asset Management (Bermuda) Ltd., Director, INVESCO Global Asset Management Limited and INVESCO Management S.A.; Senior Vice President, Van Kampen Investments Inc. and Invesco Advisers, Inc. (formerly known as Invesco Institutional (N.A.), Inc.) (registered investment adviser); Vice President, Invesco Advisers, Inc. (formerly known as Invesco Institutional (N.A.), Inc.); Director of Cash Management and Senior Vice President, Invesco Advisers, Inc. and Invesco Aim Capital Management, Inc.; Director and President, Fund Management Company; Chief Cash Management Officer, Director of Cash Management, Senior Vice President, and Managing Director, Invesco Aim Capital Management, Inc.; Director of Cash Management, Senior Vice President, and Vice President, Invesco Advisers, Inc. and The Invesco Funds (AIM Treasurer’s Series Trust (Invesco Treasurer’s Series Trust), and Short-Term Investments Trust only) | | N/A | | N/A |
Crissie M. Wisdom — 1969 Anti-Money Laundering Compliance Officer | | 2013 | | Anti-Money Laundering Compliance Officer, Invesco Advisers, Inc. (formerly known as Invesco Institutional (N.A.), Inc.) (registered investment adviser), Invesco Capital Markets, Inc. (formerly known as Van Kampen Funds Inc.), Invesco Distributors, Inc., Invesco Investment Services, Inc., Invesco Management Group, Inc., Van Kampen Exchange Corp., The Invesco Funds, and PowerShares Exchange-Traded Fund Trust, PowerShares Exchange-Traded Fund Trust II, PowerShares India Exchange-Traded Fund Trust, PowerShares Actively Managed Exchange-Traded Fund Trust and PowerShares Actively Managed Exchange-Traded Commodity Fund Trust; Anti-Money Laundering Compliance Officer and Bank Secrecy Act Officer, INVESCO National Trust Company and Invesco Trust Company; and Fraud Prevention Manager and Controls and Risk Analysis Manager for Invesco Investment Services, Inc. | | N/A | | N/A |
Lisa O. Brinkley — 1959 Chief Compliance Officer | | 2015 | | Senior Vice President and Chief Compliance Officer, Invesco Advisers, Inc. (registered investment adviser) (formerly known as Invesco Institutional (N.A., Inc.); and Chief Compliance Officer, The Invesco Funds Formerly: Global Assurance Officer, Invesco Ltd. and Vice President, The Invesco Funds; Chief Compliance Officer, Invesco Distributors, Inc. (formerly known as Invesco Aim Distributors, Inc.), Invesco Investment Services, Inc.(formerly known as Invesco Aim Investment Services, Inc.) and Van Kampen Investor Services Inc.; Senior Vice President, Invesco Management Group, Inc.; Senior Vice President and Chief Compliance Officer, Invesco Advisers, Inc. and The Invesco Funds; Vice President and Chief Compliance Officer, Invesco Aim Capital Management, Inc. and Invesco Distributors, Inc.; Vice President, Invesco Investment Services, Inc. and Fund Management Company | | N/A | | N/A |
The Statement of Additional Information of the Trust includes additional information about the Fund’s Trustees and is available upon request, without charge, by calling 1.800.959.4246. Please refer to the Fund’s prospectus for information on the Fund’s sub-advisers.
| | | | | | |
Office of the Fund 11 Greenway Plaza, Suite 1000 Houston, TX 77046-1173 | | Investment Adviser Invesco Advisers, Inc. 1555 Peachtree Street, N.E. Atlanta, GA 30309 | | Distributor Invesco Distributors, Inc. 11 Greenway Plaza, Suite 1000 Houston, TX 77046-1173 | | Auditors PricewaterhouseCoopers LLP 1000 Louisiana Street, Suite 5800 Houston, TX 77002-5678 |
| | | |
| | | | | | |
Counsel to the Fund Stradley Ronon Stevens & Young, LLP 2005 Market Street, Suite 2600 Philadelphia, PA 19103-7018 | | Counsel to the Independent Trustees Goodwin Procter LLP 901 New York Avenue, N.W. Washington, D.C. 20001 | | Transfer Agent Invesco Investment Services, Inc. 11 Greenway Plaza, Suite 1000 Houston, TX 77046-1173 | | Custodian State Street Bank and Trust Company 225 Franklin Street Boston, MA 02110-2801 |
Invesco V.I. Value Opportunities Fund
ITEM 2. CODE OF ETHICS.
As of the end of the period covered by this report, the Registrant had adopted a code of ethics (the “Code”) that applies to the Registrant’s principal executive officer (“PEO”) and principal financial officer (“PFO”). There were no amendments to the Code during the period covered by the report. The Registrant did not grant any waivers, including implicit waivers, from any provisions of the Code to the PEO or PFO during the period covered by this report.
.ITEM 3. AUDIT COMMITTEE FINANCIAL EXPERT.
The Board of Trustees has determined that the Registrant has at least one audit committee financial expert serving on its Audit Committee. The Audit Committee financial expert is Raymond Stickel, Jr. Mr. Stickel is “independent” within the meaning of that term as used in Form N-CSR.
ITEM 4. PRINCIPAL ACCOUNTANT FEES AND SERVICES.
(a) to (d)
Fees Billed by PWC Related to the Registrant
PWC billed the Registrant aggregate fees for services rendered to the Registrant for the last two fiscal years as follows:
| | | | | | | | | | | | | | | | | | | | |
| | | Fees Billed for
Services Rendered to
the Registrant for
fiscal year end 2015 | | (e)(2) Percentage of Fees Billed Applicable to Non-Audit Services Provided for fiscal year end 2015 Pursuant to Waiver of Pre-Approval Requirement(1) | | Fees Billed for
Services Rendered to
the Registrant for
fiscal year end 2014 | | (e)(2) Percentage of Fees Billed Applicable to Non-Audit Services Provided for fiscal year end 2014 Pursuant to Waiver of Pre-Approval Requirement(1) |
| | | | |
Audit Fees | | $ 569,575 | | N/A | | $ 553,850 | | N/A |
Audit-Related Fees | | $ 0 | | 0% | | $ 0 | | 0% |
Tax Fees(2) | | $ 159,139 | | 0% | | $ 124,650 | | 0% |
All Other Fees | | $ 0 | | 0% | | $ 0 | | 0% |
Total Fees | | $ 728,714 | | 0% | | $ 678,500 | | 0% |
(g) PWC billed the Registrant aggregate non-audit fees of $159,139 for the fiscal year ended 2015, and $124,650 for the fiscal year ended 2014, for non-audit services rendered to the Registrant.
| | (1) | With respect to the provision of non-audit services, the pre-approval requirement is waived pursuant to a de minimis exception if (i) such services were not recognized as non-audit services by the Registrant at the time of engagement, (ii) the aggregate amount of all such services provided is no more than 5% of the aggregate audit and non-audit fees paid by the Registrant to PWC during a fiscal year; and (iii) such services are promptly brought to the attention of the Registrant’s Audit Committee and approved by the Registrant’s Audit Committee prior to the completion of the audit. |
| | (2) | Tax fees for the fiscal year end December 31, 2015 includes fees billed for reviewing tax returns. Tax fees for the fiscal year end December 31, 2014 includes fees billed for reviewing tax returns. |
Fees Billed by PWC Related to Invesco and Invesco Affiliates
PWC billed Invesco Advisers, Inc. (“Invesco”), the Registrant’s adviser, and any entity controlling, controlled by or under common control with Invesco that provides ongoing services to the Registrant (“Invesco Affiliates”) aggregate fees for pre-approved non-audit services rendered to Invesco and Invesco Affiliates for the last two fiscal years as follows:
| | | | | | | | | | | | | | | | | | | | |
| | | Fees Billed for Non- Audit Services Rendered to Invesco and Invesco Affiliates for fiscal year end 2015 That Were
Required to be Pre-Approved by the Registrant’s Audit Committee | | (e)(2) Percentage of Fees Billed Applicable to Non-Audit Services Provided for fiscal year end 2015 Pursuant to Waiver of Pre- Approval Requirement(1) | | Fees Billed for Non-
Audit Services Rendered to Invesco and Invesco Affiliates for fiscal year end 2014 That Were Required to be Pre-Approved by the Registrant’s Audit Committee | | (e)(2) Percentage of Fees Billed Applicable to Non-Audit Services Provided for fiscal year end 2014 Pursuant to Waiver of Pre-
Approval Requirement(1) |
| | | | |
Audit-Related Fees | | | | $ 574,000 | | | 0% | | | | $574,000 | | | | | 0 | % |
Tax Fees | | | | $ 0 | | | 0% | | | | $ 0 | | | | | 0 | % |
All Other Fees | | | | $3,750,000 | | | 0% | | | | $ 0 | | | | | 0 | % |
Total Fees(2) | | | | $4,324,000 | | | 0% | | | | $574,000 | | | | | 0 | % |
| (1) | With respect to the provision of non-audit services, the pre-approval requirement is waived pursuant to a de minimis exception if (i) such services were not recognized as non-audit services by the Registrant at the time of engagement, (ii) the aggregate amount of all such services provided is no more than 5% of the aggregate audit and non-audit fees paid by the Registrant, Invesco and Invesco Affiliates to PWC during a fiscal year; and (iii) such services are promptly brought to the attention of the Registrant’s Audit Committee and approved by the Registrant’s Audit Committee prior to the completion of the audit. |
| (2) | Audit-Related fees for the year end 2015 include fees billed related to reviewing controls at a service organization. Audit-Related fees for the year end 2014 include fees billed related to reviewing controls at a service organization. |
All Other fees for the year end 2015 include fees billed related to reviewing the operating effectiveness of strategic projects.
(g) Including the fees for services not required to be pre-approved by the registrant’s audit committee, PWC billed Invesco and Invesco Affiliates aggregate non-audit fees of $9,098,822 for the fiscal year ended 2015, and $4,009,694 for the fiscal year ended 2014, for non-audit services rendered to Invesco and Invesco Affiliates.
(h) The Audit Committee also has considered whether the provision of non-audit services that were rendered to Invesco and Invesco Affiliates that were not required to be pre-approved pursuant to SEC regulations, if any, is compatible with maintaining PWC’s independence.
(f) Not applicable.
(e)(1)
PRE-APPROVAL OF AUDIT AND NON-AUDIT SERVICES
POLICIES AND PROCEDURES
As adopted by the Audit Committees of
the Invesco Funds (the “Funds”)
Last Amended May 4, 2010
Statement of Principles
Under the Sarbanes-Oxley Act of 2002 and rules adopted by the Securities and Exchange Commission (“SEC”) (“Rules”), the Audit Committees of the Funds’ (the “Audit Committees”) Board of Trustees (the “Board”) are responsible for the appointment, compensation and oversight of the work of independent accountants (an “Auditor”). As part of this responsibility and to assure that the Auditor’s independence is not impaired, the Audit Committees pre-approve the audit and non-audit services provided to the Funds by each Auditor, as well as all non-audit services provided by the Auditor to the Funds’ investment adviser and to affiliates of the adviser that provide ongoing services to the Funds (“Service Affiliates”) if the services directly impact the Funds’ operations or financial reporting. The SEC Rules also specify the types of services that an Auditor may not provide to its audit client. The following policies and procedures comply with the requirements for pre-approval and provide a mechanism by which management of the Funds may request and secure pre-approval of audit and non-audit services in an orderly manner with minimal disruption to normal business operations.
Proposed services either may be pre-approved without consideration of specific case-by-case services by the Audit Committees (“general pre-approval”) or require the specific pre-approval of the Audit Committees (“specific pre-approval”). As set forth in these policies and procedures, unless a type of service has received general pre-approval, it will require specific pre-approval by the Audit Committees. Additionally, any fees exceeding 110% of estimated pre-approved fee levels provided at the time the service was pre-approved will also require specific approval by the Audit Committees before payment is made. The Audit Committees will also consider the impact of additional fees on the Auditor’s independence when determining whether to approve any additional fees for previously pre-approved services.
The Audit Committees will annually review and generally pre-approve the services that may be provided by each Auditor without obtaining specific pre-approval from the Audit Committee generally on an annual basis. The term of any general pre-approval runs from the date of such pre-approval through September 30th of the following year, unless the Audit Committees consider a different period and state otherwise. The Audit Committees will add to or subtract from the list of general pre-approved services from time to time, based on subsequent determinations.
The purpose of these policies and procedures is to set forth the guidelines to assist the Audit Committees in fulfilling their responsibilities.
Delegation
The Audit Committees may from time to time delegate pre-approval authority to one or more of its members who are Independent Trustees. All decisions to pre-approve a service by a delegated member shall be reported to the Audit Committees at the next quarterly meeting.
Audit Services
The annual audit services engagement terms will be subject to specific pre-approval of the Audit Committees. Audit services include the annual financial statement audit and other procedures such as tax provision work that is required to be performed by the independent auditor to be able to form an opinion on the Funds’ financial statements. The Audit Committees will obtain, review and consider sufficient information concerning the proposed Auditor to make a reasonable evaluation of the Auditor’s qualifications and independence.
In addition to the annual Audit services engagement, the Audit Committees may grant either general or specific pre-approval of other audit services, which are those services that only the independent auditor
reasonably can provide. Other Audit services may include services such as issuing consents for the inclusion of audited financial statements with SEC registration statements, periodic reports and other documents filed with the SEC or other documents issued in connection with securities offerings.
Non-Audit Services
The Audit Committees may provide either general or specific pre-approval of any non-audit services to the Funds and its Service Affiliates if the Audit Committees believe that the provision of the service will not impair the independence of the Auditor, is consistent with the SEC’s Rules on auditor independence, and otherwise conforms to the Audit Committees’ general principles and policies as set forth herein.
Audit-Related Services
“Audit-related services” are assurance and related services that are reasonably related to the performance of the audit or review of the Fund’s financial statements or that are traditionally performed by the independent auditor. Audit-related services include, among others, accounting consultations related to accounting, financial reporting or disclosure matters not classified as “Audit services”; assistance with understanding and implementing new accounting and financial reporting guidance from rulemaking authorities; and agreed-upon procedures related to mergers, compliance with ratings agency requirements and interfund lending activities.
Tax Services
“Tax services” include, but are not limited to, the review and signing of the Funds’ federal tax returns, the review of required distributions by the Funds and consultations regarding tax matters such as the tax treatment of new investments or the impact of new regulations. The Audit Committees will scrutinize carefully the retention of the Auditor in connection with a transaction initially recommended by the Auditor, the major business purpose of which may be tax avoidance or the tax treatment of which may not be supported in the Internal Revenue Code and related regulations. The Audit Committees will consult with the Funds’ Treasurer (or his or her designee) and may consult with outside counsel or advisors as necessary to ensure the consistency of Tax services rendered by the Auditor with the foregoing policy.
No Auditor shall represent any Fund or any Service Affiliate before a tax court, district court or federal court of claims.
Under rules adopted by the Public Company Accounting Oversight Board and approved by the SEC, in connection with seeking Audit Committees’ pre-approval of permissible Tax services, the Auditor shall:
| | 1. | Describe in writing to the Audit Committees, which writing may be in the form of the proposed engagement letter: |
| | a. | The scope of the service, the fee structure for the engagement, and any side letter or amendment to the engagement letter, or any other agreement between the Auditor and the Fund, relating to the service; and |
| | b. | Any compensation arrangement or other agreement, such as a referral agreement, a referral fee or fee-sharing arrangement, between the Auditor and any person (other than the Fund) with respect to the promoting, marketing, or recommending of a transaction covered by the service; |
| | 2. | Discuss with the Audit Committees the potential effects of the services on the independence of the Auditor; and |
| | 3. | Document the substance of its discussion with the Audit Committees. |
All Other Auditor Services
The Audit Committees may pre-approve non-audit services classified as “All other services” that are not categorically prohibited by the SEC, as listed in Exhibit 1 to this policy.
Pre-Approval Fee Levels or Established Amounts
Pre-approval of estimated fees or established amounts for services to be provided by the Auditor under general or specific pre-approval policies will be set periodically by the Audit Committees. Any proposed fees exceeding 110% of the maximum estimated pre-approved fees or established amounts for pre-approved audit and non-audit services will be reported to the Audit Committees at the quarterly Audit Committees meeting and will require specific approval by the Audit Committees before payment is made. The Audit Committees will always factor in the overall relationship of fees for audit and non-audit services in determining whether to pre-approve any such services and in determining whether to approve any additional fees exceeding 110% of the maximum pre-approved fees or established amounts for previously pre-approved services.
Procedures
Generally on an annual basis, Invesco Advisers, Inc. (“Invesco”) will submit to the Audit Committees for general pre-approval, a list of non-audit services that the Funds or Service Affiliates of the Funds may request from the Auditor. The list will describe the non-audit services in reasonable detail and will include an estimated range of fees and such other information as the Audit Committee may request.
Each request for services to be provided by the Auditor under the general pre-approval of the Audit Committees will be submitted to the Funds’ Treasurer (or his or her designee) and must include a detailed description of the services to be rendered. The Treasurer or his or her designee will ensure that such services are included within the list of services that have received the general pre-approval of the Audit Committees. The Audit Committees will be informed at the next quarterly scheduled Audit Committees meeting of any such services for which the Auditor rendered an invoice and whether such services and fees had been pre-approved and if so, by what means.
Each request to provide services that require specific approval by the Audit Committees shall be submitted to the Audit Committees jointly by the Fund’s Treasurer or his or her designee and the Auditor, and must include a joint statement that, in their view, such request is consistent with the policies and procedures and the SEC Rules.
Each request to provide tax services under either the general or specific pre-approval of the Audit Committees will describe in writing: (i) the scope of the service, the fee structure for the engagement, and any side letter or amendment to the engagement letter, or any other agreement between the Auditor and the audit client, relating to the service; and (ii) any compensation arrangement or other agreement between the Auditor and any person (other than the audit client) with respect to the promoting, marketing, or recommending of a transaction covered by the service. The Auditor will discuss with the Audit Committees the potential effects of the services on the Auditor’s independence and will document the substance of the discussion.
Non-audit services pursuant to the de minimis exception provided by the SEC Rules will be promptly brought to the attention of the Audit Committees for approval, including documentation that each of the conditions for this exception, as set forth in the SEC Rules, has been satisfied.
On at least an annual basis, the Auditor will prepare a summary of all the services provided to any entity in the investment company complex as defined in section 2-01(f)(14) of Regulation S-X in sufficient detail as to the nature of the engagement and the fees associated with those services.
The Audit Committees have designated the Funds’ Treasurer to monitor the performance of all services provided by the Auditor and to ensure such services are in compliance with these policies and procedures. The Funds’ Treasurer will report to the Audit Committees on a periodic basis as to the results of such monitoring. Both the Funds’ Treasurer and management of Invesco will immediately report to the chairman of the Audit Committees any breach of these policies and procedures that comes to the attention of the Funds’ Treasurer or senior management of Invesco.
Exhibit 1 to Pre-Approval of Audit and Non-Audit Services Policies and Procedures
Conditionally Prohibited Non-Audit Services (not prohibited if the Fund can reasonably conclude that the results of the service would not be subject to audit procedures in connection with the audit of the Fund’s financial statements)
| | ● | | Bookkeeping or other services related to the accounting records or financial statements of the audit client |
| | ● | | Financial information systems design and implementation |
| | ● | | Appraisal or valuation services, fairness opinions, or contribution-in-kind reports |
| | ● | | Internal audit outsourcing services |
Categorically Prohibited Non-Audit Services
| | ● | | Broker-dealer, investment adviser, or investment banking services |
| | ● | | Expert services unrelated to the audit |
| | ● | | Any service or product provided for a contingent fee or a commission |
| | ● | | Services related to marketing, planning, or opining in favor of the tax treatment of confidential transactions or aggressive tax position transactions, a significant purpose of which is tax avoidance |
| | ● | | Tax services for persons in financial reporting oversight roles at the Fund |
| | ● | | Any other service that the Public Company Oversight Board determines by regulation is impermissible. |
ITEM 5. AUDIT COMMITTEE OF LISTED REGISTRANTS.
Not applicable.
ITEM 6. SCHEDULE OF INVESTMENTS.
Investments in securities of unaffiliated issuers is included as part of the reports to stockholders filed under Item 1 of this Form.
| | |
ITEM 7. | | DISCLOSURE OF PROXY VOTING POLICIES AND PROCEDURES FOR CLOSED-END MANAGEMENT INVESTMENT COMPANIES. |
Not applicable.
ITEM 8. PORTFOLIO MANAGERS OF CLOSED-END MANAGEMENT COMPANIES.
Not applicable.
| | |
ITEM 9. | | PURCHASES OF EQUITY SECURITIES BY CLOSED-END MANAGEMENT INVESTMENT COMPANY AND AFFILIATED PURCHASERS. |
Not applicable.
ITEM 10. SUBMISSION OF MATTERS TO A VOTE OF SECURITY HOLDERS.
None
ITEM 11. CONTROLS AND PROCEDURES.
| (a) | As of February 12, 2016, an evaluation was performed under the supervision and with the participation of the officers of the Registrant, including the PEO and PFO, to assess the effectiveness of the Registrant’s disclosure controls and procedures, as that term is defined in Rule 30a-3(c) under the Investment Company Act of 1940 (the “Act”), as amended. Based on that evaluation, the Registrant’s officers, including the PEO and PFO, concluded that, as of February 12, 2016, the Registrant’s disclosure controls and procedures were reasonably designed to ensure: (1) that information required to be disclosed by the Registrant on Form N-CSR is recorded, processed, summarized and reported within the time periods specified by the rules and forms of the Securities and Exchange Commission; and (2) that material information relating to the Registrant is made known to the PEO and PFO as appropriate to allow timely decisions regarding required disclosure. |
| (b) | There have been no changes in the Registrant’s internal control over financial reporting (as defined in Rule 30a-3(d) under the Act) that occurred during the second fiscal quarter of the period covered by this report that have materially affected, or are reasonably likely to materially affect, the Registrant’s internal control over financial reporting. |
ITEM 12. EXHIBITS.
| | |
| 12(a) (1) | | Code of Ethics. |
| |
| 12(a) (2) | | Certifications of principal executive officer and principal financial officer as required by Rule 30a-2(a) under the Investment Company Act of 1940. |
| |
| 12(a) (3) | | Not applicable. |
| |
| 12(b) | | Certifications of principal executive officer and principal financial officer as required by Rule 30a-2(b) under the Investment Company Act of 1940. |
SIGNATURES
Pursuant to the requirements of the Securities Exchange Act of 1934 and the Investment Company Act of 1940, the Registrant has duly caused this report to be signed on its behalf by the undersigned, thereunto duly authorized.
Registrant: AIM Variable Insurance Funds (Invesco Variable Insurance Funds)
| | | | |
By: | | /s/ Philip A. Taylor | | |
| | Philip A. Taylor | | |
| | Principal Executive Officer | | |
| | |
Date: | | February 26, 2016 | | |
Pursuant to the requirements of the Securities and Exchange Act of 1934 and the Investment Company Act of 1940, this report has been signed below by the following persons on behalf of the Registrant and in the capacities and on the dates indicated.
| | | | |
By: | | /s/ Philip A. Taylor | | |
| | Philip A. Taylor | | |
| | Principal Executive Officer | | |
| | |
Date: | | February 26, 2016 | | |
| | |
By: | | /s/ Sheri Morris | | |
| | Sheri Morris | | |
| | Principal Financial Officer | | |
| | |
Date: | | February 26, 2016 | | |
EXHIBIT INDEX
| | |
| 12(a) (1) | | Code of Ethics. |
| |
| 12(a) (2) | | Certifications of principal executive officer and principal financial officer as required by Rule 30a-2(a) under the Investment Company Act of 1940. |
| |
| 12(a) (3) | | Not applicable. |
| |
| 12(b) | | Certifications of principal executive officer and principal financial officer as required by Rule 30a-2(b) under the Investment Company Act of 1940. |