| | | | |
OMB APPROVAL |
| OMB Number: | | 3235-0570 |
| Expires: | | August 31, 2020 |
| Estimated average burden |
| hours per response: | | 20.6 |
UNITED STATES
SECURITIES AND EXCHANGE COMMISSION
Washington, D.C. 20549
FORM N-CSR
CERTIFIED SHAREHOLDER REPORT OF REGISTERED
MANAGEMENT INVESTMENT COMPANIES
Investment Company Act file number 811-07452
AIM Variable Insurance Funds (Invesco Variable Insurance Funds)
(Exact name of registrant as specified in charter)
11 Greenway Plaza, Suite 1000 Houston, Texas 77046
(Address of principal executive offices) (Zip code)
Sheri Morris 11 Greenway Plaza, Suite 1000 Houston, Texas 77046
(Name and address of agent for service)
Registrant’s telephone number, including area code: (713) 626-1919
Date of fiscal year end: 12/31
Date of reporting period: 12/31/17
Item 1. Report to Stockholders.
| | | | |
| | |
 | | Annual Report to Shareholders | | December 31, 2017 |
| | |
| | Invesco V.I. American Franchise Fund |

| | |
| | The Fund provides a complete list of its holdings four times in each fiscal year, at the quarter-ends. For the second and fourth quarters, the lists appear in the Fund’s semiannual and annual reports to shareholders. For the first and third quarters, the Fund files the lists with the Securities and Exchange Commission (SEC) on Form N-Q. The Fund’s Form N-Q filings are available on the SEC website, sec.gov. Copies of the Fund’s Forms N-Q may be reviewed and copied at the SEC Public Reference Room in Washington, D.C. You can obtain information on the operation of the Public Reference Room, including information about duplicating fee charges, by calling 202 551 8090 or 800 732 0330, or by electronic request at the following email address: publicinfo@sec.gov. The SEC file numbers for the Fund are 811-07452 and 033-57340. The Fund’s most recent portfolio holdings, as filed on Form N-Q, have also been made available to insurance companies issuing variable annuity contracts and variable life insurance policies (“variable products”) that invest in the Fund. A description of the policies and procedures that the Fund uses to determine how to vote proxies relating to portfolio securities is available without charge, upon request, from our Client Services department at 800 959 4246 or at invesco.com/proxyguidelines. The information is also available on the SEC website, sec.gov. Information regarding how the Fund voted proxies related to its portfolio securities during the most recent 12-month period ended June 30 is available at invesco.com/ proxysearch. The information is also available on the SEC website, sec.gov. Invesco Advisers, Inc. is an investment adviser; it provides investment advisory services to individual and institutional clients and does not sell securities. Invesco Distributors, Inc. is the US distributor for Invesco Ltd.’s retail mutual funds, exchange-traded funds and institutional money market funds. Both are wholly owned, indirect subsidiaries of Invesco Ltd. This report must be accompanied or preceded by a currently effective Fund prospectus and variable product prospectus, which contain more complete information, including sales charges and expenses. Investors should read each carefully before investing. NOT FDIC INSURED | MAY LOSE VALUE | NO BANK GUARANTEE Invesco Distributors, Inc. VK-VIAMFR-AR-1 02082018 1148 |
Management’s Discussion of Fund Performance
Performance summary
For the year ended December 31, 2017, Series I shares of Invesco V.I. American Franchise Fund (the Fund) underperformed the Russell 1000 Growth Index, the Fund’s style-specific benchmark.
Your Fund’s long-term performance appears later in this report.
Fund vs. Indexes
Total returns, 12/31/16 to 12/31/17, excluding variable product issuer charges.
If variable product issuer charges were included, returns would be lower.
| | | | | |
| Series I Shares | | | | 27.34 | % |
| Series II Shares | | | | 27.03 | |
| S&P 500 Index▼ (Broad Market Index) | | | | 21.83 | |
| Russell 1000 Growth Index▼ (Style-Specific Index) | | | | 30.21 | |
| Lipper VUF Large-Cap Growth Funds Index∎ (Peer Group Index) | | | | 31.11 | |
Source(s): ▼FactSet Research Systems Inc.; ∎Lipper Inc. | | | | | |
Market conditions and your Fund
Despite highly destructive hurricanes that threatened to derail a years-long economic recovery, the US economy continued to expand throughout the year ended December 31, 2017. Gross domestic product – the value of all goods and services produced in the US – expanded in the first three quarters of 2017. Inflation remained subdued even as unemployment continued its multiyear decline.
Given signs of an improving economy, the US Federal Reserve (the Fed) raised interest rates three times during the reporting period, most recently in December 2017; each rate hike was 25 basis points.1 (A basis point is 0.01%.) The Fed pledged that “realized and expected economic conditions relative to its objectives of maximum employment and 2 percent inflation” will guide its future actions. At the close of the reporting period, Fed policy remained accommodative, and the fed funds target rate stood at a range of 1.25% to 1.50% – 75 basis points higher than at the start of the reporting period.1
Higher inventories and a worsening outlook caused oil prices and many energy
stocks to decline during the first half of 2017. However, oil prices rose signifi-cantly in the second half of the reporting period as expectations for lower supplies increased, partly due to continued OPEC production cuts, and demand began normalizing.
Major US stock market indexes repeatedly hit all-time highs throughout the reporting period. The stock market rally that began after the 2016 presidential election continued throughout the reporting period, fueled by generally positive economic data, strong corporate earnings and improved consumer confidence. Finally, after much debate in Congress, a tax reform bill was signed into law in December 2017. While its enactment further strengthened stocks, its effect on the US economy remained uncertain.
During the year, the Fund produced a return greater than 25% (excluding variable product issuer charges), but underperformed its style-specific benchmark. The Fund outperformed its style-specific benchmark in the information technology (IT), consumer staples, consumer discretionary, materials and real
estate sectors. Conversely, the Fund underperformed in the health care, energy, telecommunication services, financials and utilities sectors.
The Fund outperformed its style-specific benchmark by the widest margin in the IT sector due to strong stock selection in and an overweight allocation to the sector versus the benchmark. Within the sector, Fund holdings in the internet and software services industry were the largest contributors to relative performance.
Alibaba Group Holdings, an e-commerce and entertainment software developer based in China, was a notable contributor to Fund performance. During the year, the company benefited from better-than-expected growth driven by its video and social networking platforms. Social media giant Facebook and entertainment software developer Activision Blizzard also contributed to relative results. Activision Blizzard reported strong earnings due to sales of its Overwatch, World of Warcraft and Hearthstone games.
Stock selection in and underweight exposure to the consumer staples sector contributed to Fund performance relative to the style-specific benchmark. Consumer staples was one of the weaker-performing sectors within the style-specific benchmark during the year due to what many investors believed to be extended valuations and slow global economic growth.
Philip Morris International, a tobacco manufacturer, was the leading contributor to Fund performance within the sector. The company was boosted by better-than-expected results and its new smokeless tobacco product IQOS exceeding expectations in Asia and Europe. US-based food distributor Tyson Foods was also a contributor to relative performance.
Stock selection in the consumer discretionary sector contributed to relative performance, as well. Retail and e-commerce
| | |
| Portfolio Composition |
By sector | % of total net assets |
| | |
| |
| Information Technology | | 44.5% |
| Consumer Discretionary | | 23.8 |
| Health Care | | 13.0 |
| Industrials | | 6.8 |
| Consumer Staples | | 3.4 |
| Financials | | 3.1 |
| Materials | | 2.5 |
| Energy | | 1.7 |
| Telecommunication Services | | 0.6 |
| Real Estate | | 0.5 |
Money Market Funds Plus Other Assets Less Liabilities | | 0.1 |
| | |
| Top 10 Equity Holdings* |
% of total net assets |
| |
| 1. Amazon.com, Inc. | | 7.9% |
2. Alphabet Inc.-Class A | | 7.1 |
3. Facebook, Inc.-Class A | | 6.1 |
4. Apple Inc. | | 4.6 |
5. Lowe’s Cos., Inc. | | 3.8 |
6. Alibaba Group Holding Ltd.-ADR | | 3.7 |
7. UnitedHealth Group Inc. | | 3.4 |
8. Sony Corp. | | 3.0 |
9. Electronic Arts Inc. | | 2.7 |
10. Visa Inc.-Class A | | 2.6 |
| | |
| Total Net Assets | | $662.2 million |
| |
| Total Number of Holdings* | | 65 |
The Fund’s holdings are subject to change, and there is no assurance that the Fund will continue to hold any particular security.
*Excluding money market fund holdings.
Data presented here are as of December 31, 2017.
Invesco V.I. American Franchise Fund
conglomerate Amazon.com was the leading contributor to Fund performance within the sector. After a short pause in the second half of 2016, the company’s stock price rose throughout the year on better-than-expected quarterly results as Amazon continued to take market share in the retail space. The acquisition of Whole Foods (not a Fund holding) also aided the company’s performance during the year. Electronic equipment manufacturer Sony also benefited Fund performance due to better-than-expected sales in music, image sensors and camera units.
In contrast, the Fund underperformed its style-specific benchmark in the health care sector. Pharmaceutical giant Allergan was the leading detractor in the sector. Shares of the company were negatively affected in the second half of the year as a result of an unfavorable federal court decision on patent protections for Restasis, one of its top-selling drugs. Amgen, a biotechnology company, was also a notable detractor from relative performance. The company’s stock declined after it issued a concerning forecast surrounding the durability of its legacy franchises.
Overweight exposure to the energy sector detracted from Fund performance relative to the style-specific benchmark. The energy sector was the benchmark’s worst-performing sector during the reporting period as crude oil prices declined on concerns over increasing US energy supplies and fears that the OPEC cuts enacted in November 2016 would not be continued after June 2017. Despite OPEC members eventually agreeing to extend the cuts in May and a sharp rally in the fourth quarter, the sector still has yet to fully recover. The Fund’s holdings were not immune to the decline in the sector. Halliburton and Anadarko Petroleum were two of the largest detractors from both absolute and relative performance during the year. We sold our position in Anadarko Petroleum before the close of the reporting period.
The Fund also underperformed the style-specific benchmark in the telecommunication services sector. Shares of Sprint, the Fund’s lone holding in the sector, declined late in the year due to uncertainty around a reported potential merger with T-Mobile (not a Fund holding).
Stock selection in the financials sector was also a detractor from relative performance. Synchrony Financial, a consumer financial services company, was the leading detractor in the sector. The company’s stock price declined early in the year after JP Morgan (not a Fund holding)
announced that its Chase card would be available on Amazon with similar features as the Synchrony Amazon store card, causing the stock to react negatively. We sold our position in Synchrony Financial before the close of the reporting period.
The traditional business cycle recovery has not fully materialized, as results have been mixed over the last several years, depending on which sector we evaluate. However, it is possible that we are just very slow to return to normal, and there is some evidence that we may yet see a more classic recovery and a reacceleration in growth. Given this scenario, we are seeking opportunities in companies that are taking share within their respective industries. Though we anticipate a possible slowdown in the economy, we continue to prudently balance the Fund between dynamic growth opportunities and more durable growth opportunities.
Thank you for your commitment to Invesco V.I. American Franchise Fund and for sharing our long-term investment horizon.
| 1 | Source: US Federal Reserve |
The views and opinions expressed in management’s discussion of Fund performance are those of Invesco Advisers, Inc. These views and opinions are subject to change at any time based on factors such as market and economic conditions. These views and opinions may not be relied upon as investment advice or recommendations, or as an offer for a particular security. The information is not a complete analysis of every aspect of any market, country, industry, security or the Fund. Statements of fact are from sources considered reliable, but Invesco Advisers, Inc. makes no representation or warranty as to their completeness or accuracy. Although historical performance is no guarantee of future results, these insights may help you understand our investment management philosophy.
See important Fund and, if applicable, index disclosures later in this report.
| | |
 | | Erik Voss Chartered Financial Analyst, Portfolio Manager, is lead manager of Invesco V.I. American Franchise |
| Fund. He joined Invesco in 2010. Mr. Voss earned a BS in mathematics and an MS in finance from the University of Wisconsin. |
| | |
 | | Ido Cohen Portfolio Manager, is manager of Invesco V.I. American Franchise Fund. He joined Invesco in 2010. Mr. Cohen |
| earned a BS in economics from The Wharton School of the University of Pennsylvania. |
Invesco V.I. American Franchise Fund
Your Fund’s Long-Term Performance
Results of a $10,000 Investment – Oldest Share Class(es)
Fund and index data from 12/31/07
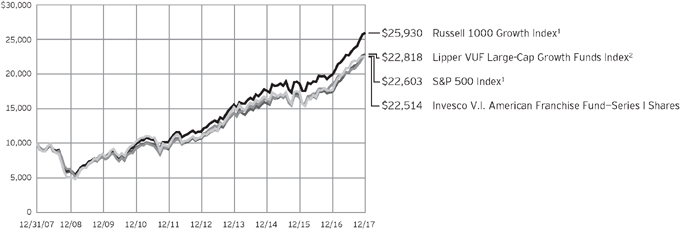
| 1 | Source: FactSet Research Systems Inc. |
Past performance cannot guarantee
comparable future results.
| | | | | |
| Average Annual Total Returns |
As of 12/31/17 | | | | | |
| |
| Series I Shares | | | | | |
| Inception (7/3/95) | | | | 9.47 | % |
| 10 Years | | | | 8.45 | |
| 5 Years | | | | 15.75 | |
| 1 Year | | | | 27.34 | |
| |
| Series II Shares | | | | | |
| Inception (9/18/00) | | | | 1.84 | % |
| 10 Years | | | | 8.18 | |
| 5 Years | | | | 15.47 | |
| 1 Year | | | | 27.03 | |
Effective June 1, 2010, Class I and Class II shares of the predecessor fund, Van Kampen Life Investment Trust Capital Growth Portfolio, advised by Van Kampen Asset Management were reorganized into Series I and Series II shares, respectively, of Invesco Van Kampen V.I. Capital Growth Fund (renamed Invesco V.I. American Franchise Fund on April 29, 2013). Returns shown above, prior to June 1, 2010, for Series I and Series II shares are blended returns of the predecessor fund and Invesco V.I. American Franchise Fund. Share class returns will differ from the predecessor fund because of different expenses.
The performance data quoted represent past performance and cannot guarantee comparable future results; current performance may be lower or higher. Please contact your variable product issuer or financial adviser for the most recent month-end variable product performance. Performance figures reflect Fund expenses, reinvested distributions and changes in net asset value. Investment return and principal value will fluctuate so that you may have a gain or loss when you sell shares.
The total annual Fund operating expense ratio set forth in the most recent Fund prospectus as of the date of this report for Series I and Series II shares was 0.89% and 1.14%, respectively. The expense ratios presented above may vary from the expense ratios presented in other sections of this report that are based on expenses incurred during the period covered by this report.
Invesco V.I. American Franchise Fund, a series portfolio of AIM Variable Insurance Funds (Invesco Variable Insurance Funds), is currently offered through insurance companies issuing variable products. You cannot purchase
shares of the Fund directly. Performance figures given represent the Fund and are not intended to reflect actual variable product values. They do not reflect sales charges, expenses and fees assessed in connection with a variable product. Sales charges, expenses and fees, which are determined by the variable product issuers, will vary and will lower the total return.
The most recent month-end performance at the Fund level, excluding variable product charges, is available at 800 451 4246. As mentioned above, for the most recent month-end performance including variable product charges, please contact your variable product issuer or financial adviser.
Fund performance reflects any applicable fee waivers and/or expense reimbursements. Had the adviser not waived fees and/or reimbursed expenses currently or in the past, returns would have been lower. See current prospectus for more information.
Invesco V.I. American Franchise Fund
Invesco V.I. American Franchise Fund’s investment objective is to seek capital growth.
| ∎ | | Unless otherwise stated, information presented in this report is as of December 31, 2017, and is based on total net assets. |
| ∎ | | Unless otherwise noted, all data provided by Invesco. |
Principal risks of investing in the Fund
Foreign securities risk. The Fund’s foreign investments may be adversely affected by political and social instability, changes in economic or taxation policies, difficulty in enforcing obligations, decreased liquidity or increased volatility. Foreign investments also involve the risk of the possible seizure, nationalization or expropriation of the issuer or foreign deposits (in which the Fund could lose its entire investments in a certain market) and the possible adoption of foreign governmental restrictions such as exchange controls. Unless the Fund has hedged its foreign securities risk, foreign securities risk also involves the risk of negative foreign currency rate fluctuations, which may cause the value of securities denominated in such foreign currency (or other instruments through which the Fund has exposure to foreign currencies) to decline in value. Currency exchange rates may fluctuate significantly over short periods of time. Currency hedging strategies, if used, are not always successful.
Growth investing risk. Growth stocks tend to be more expensive relative to the issuing company’s earnings or assets compared with other types of stock. As a result, they tend to be more sensitive to changes in, or investors’ expectations of, the issuing company’s earnings and can be more volatile.
Management risk. The Fund is actively managed and depends heavily on the Adviser’s judgment about markets, interest rates or the attractiveness, relative values, liquidity, or potential appreciation of particular investments made for the Fund’s portfolio. The Fund could experience losses if these judgments prove to be incorrect. Additionally, legislative, regulatory, or tax developments may adversely affect management of the Fund and, therefore, the ability of the Fund to achieve its investment objective.
Market risk. The market values of the Fund’s investments, and therefore the value of the Fund’s shares, will go up and down, sometimes rapidly or unpredictably. Market risk may affect a single issuer, industry or section of the economy, or it may affect the market as a whole. Individual stock prices tend to go up and down more dramatically than those of certain other types of investments, such
as bonds. During a general downturn in the financial markets, multiple asset classes may decline in value. When markets perform well, there can be no assurance that specific investments held by the Fund will rise in value.
Mid-capitalization companies risk. Mid-capitalization companies tend to be more vulnerable to changing market conditions and may have more limited product lines and markets, less experienced management and fewer financial resources than larger companies. These companies’ securities may be more volatile and less liquid than those of more established companies, and their returns may vary, sometimes significantly, from the overall securities market.
Sector focus risk. The Fund may from time to time invest a significant amount of its assets (i.e. over 25%) in one market sector or group of related industries. In this event, the Fund’s performance will depend to a greater extent on the overall condition of the sector or group of industries and there is increased risk that the Fund will lose significant value if conditions adversely affect that sector or group of industries.
About indexes used in this report
The S&P 500® Index is an unmanaged index considered representative of the US stock market.
The Russell 1000® Growth Index is an unmanaged index considered representative of large-cap growth stocks. The Russell 1000 Growth Index is a trademark/service mark of the Frank Russell Co. Russell® is a trademark of the Frank Russell Co.
The Lipper VUF Large-Cap Growth Funds Index is an unmanaged index considered representative of large-cap growth variable insurance underlying funds tracked by Lipper.
The Fund is not managed to track the performance of any particular index, including the index(es) described here, and consequently, the performance of the Fund may deviate significantly from the performance of the index(es).
A direct investment cannot be made in an index. Unless otherwise indicated, index results include reinvested dividends, and they do not reflect sales charges. Performance of the peer group, if applicable, reflects fund expenses; performance of a market index does not.
Other information
The returns shown in management’s discussion of Fund performance are based on net asset values calculated for shareholder transactions. Generally accepted accounting principles require adjustments to be made to the net assets of the Fund at period end for financial reporting purposes, and as such, the net asset values for shareholder transactions and the returns based on those net asset values may differ from the net asset values and returns reported in the Financial Highlights. Additionally, the returns and net asset values shown throughout this report are at the Fund level only and do not include variable product issuer charges. If such charges were included, the total returns would be lower.
Industry classifications used in this report are generally according to the Global Industry Classification Standard, which was developed by and is the exclusive property and a service mark of MSCI Inc. and Standard & Poor’s.
Invesco V.I. American Franchise Fund
Schedule of Investments(a)
December 31, 2017
| | | | | | | | |
| | | Shares | | | Value | |
Common Stocks & Other Equity Interests–99.87% | |
| Aerospace & Defense–2.63% | |
Boeing Co. (The) | | | 27,305 | | | $ | 8,052,518 | |
Raytheon Co. | | | 49,713 | | | | 9,338,587 | |
| | | | | | | | 17,391,105 | |
|
| Airlines–0.45% | |
Southwest Airlines Co. | | | 45,262 | | | | 2,962,398 | |
|
| Application Software–2.32% | |
salesforce.com, inc.(b) | | | 150,608 | | | | 15,396,656 | |
|
| Biotechnology–4.86% | |
Alexion Pharmaceuticals, Inc.(b) | | | 64,278 | | | | 7,687,006 | |
Amgen Inc. | | | 15,419 | | | | 2,681,364 | |
BioMarin Pharmaceutical Inc.(b) | | | 63,678 | | | | 5,678,167 | |
Celgene Corp.(b) | | | 130,358 | | | | 13,604,161 | |
Incyte Corp.(b) | | | 26,833 | | | | 2,541,354 | |
| | | | | | | | 32,192,052 | |
|
| Cable & Satellite–3.53% | |
Altice USA, Inc.–Class A(b)(c) | | | 92,481 | | | | 1,963,372 | |
Charter Communications, Inc.–Class A(b) | | | 26,146 | | | | 8,784,010 | |
Comcast Corp.–Class A | | | 178,400 | | | | 7,144,920 | |
DISH Network Corp.–Class A(b) | | | 114,586 | | | | 5,471,481 | |
| | | | | | | | 23,363,783 | |
|
| Commodity Chemicals–0.62% | |
LyondellBasell Industries N.V.–Class A | | | 37,218 | | | | 4,105,890 | |
|
| Communications Equipment–0.81% | |
Palo Alto Networks, Inc.(b) | | | 36,934 | | | | 5,353,214 | |
|
| Consumer Electronics–3.04% | |
Sony Corp. (Japan) | | | 448,400 | | | | 20,142,579 | |
|
| Data Processing & Outsourced Services–6.12% | |
First Data Corp.–Class A(b) | | | 370,880 | | | | 6,197,405 | |
Mastercard Inc.–Class A | | | 100,993 | | | | 15,286,300 | |
PayPal Holdings, Inc.(b) | | | 23,835 | | | | 1,754,733 | |
Visa Inc.–Class A | | | 151,609 | | | | 17,286,458 | |
| | | | | | | | 40,524,896 | |
|
| Diversified Banks–0.65% | |
Wells Fargo & Co. | | | 71,200 | | | | 4,319,704 | |
|
| Diversified Support Services–0.73% | |
Cintas Corp. | | | 30,873 | | | | 4,810,940 | |
|
| Environmental & Facilities Services–1.33% | |
Republic Services, Inc. | | | 130,750 | | | | 8,840,007 | |
|
| Financial Exchanges & Data–1.78% | |
London Stock Exchange Group PLC (United Kingdom) | | | 146,626 | | | | 7,508,614 | |
S&P Global Inc. | | | 25,113 | | | | 4,254,142 | |
| | | | | | | | 11,762,756 | |
| | | | | | | | |
| | | Shares | | | Value | |
| General Merchandise Stores–0.75% | |
Dollar Tree, Inc.(b) | | | 46,422 | | | $ | 4,981,545 | |
|
| Health Care Equipment–1.56% | |
Intuitive Surgical, Inc.(b) | | | 15,294 | | | | 5,581,392 | |
Stryker Corp. | | | 30,637 | | | | 4,743,833 | |
| | | | | | | | 10,325,225 | |
|
| Home Entertainment Software–7.48% | |
Activision Blizzard, Inc. | | | 256,220 | | | | 16,223,851 | |
Electronic Arts Inc.(b) | | | 167,106 | | | | 17,556,156 | |
Nintendo Co., Ltd. (Japan) | | | 43,300 | | | | 15,764,150 | |
| | | | | | | | 49,544,157 | |
|
| Home Improvement Retail–3.81% | |
Lowe’s Cos., Inc. | | | 271,317 | | | | 25,216,202 | |
|
| Hotels, Resorts & Cruise Lines–2.71% | |
Norwegian Cruise Line Holdings Ltd.(b) | | | 97,398 | | | | 5,186,443 | |
Royal Caribbean Cruises Ltd. | | | 107,014 | | | | 12,764,630 | |
| | | | | | | | 17,951,073 | |
|
| Housewares & Specialties–0.34% | |
Newell Brands, Inc. | | | 73,005 | | | | 2,255,854 | |
|
| Industrial Gases–0.67% | |
Air Products and Chemicals, Inc. | | | 26,907 | | | | 4,414,901 | |
|
| Industrial Machinery–0.82% | |
Stanley Black & Decker Inc. | | | 32,066 | | | | 5,441,280 | |
|
| Internet & Direct Marketing Retail–9.60% | |
Amazon.com, Inc.(b) | | | 44,572 | | | | 52,125,617 | |
Netflix Inc.(b) | | | 17,379 | | | | 3,336,073 | |
Priceline Group Inc. (The)(b) | | | 4,687 | | | | 8,144,787 | |
| | | | | | | | 63,606,477 | |
|
| Internet Software & Services–16.85% | |
Alibaba Group Holding Ltd.–ADR (China)(b) | | | 140,368 | | | | 24,203,654 | |
Alphabet Inc.–Class A(b) | | | 44,368 | | | | 46,737,251 | |
Facebook, Inc.–Class A(b) | | | 230,508 | | | | 40,675,442 | |
| | | | | | | | 111,616,347 | |
|
| Investment Banking & Brokerage–0.65% | |
Charles Schwab Corp. (The) | | | 83,941 | | | | 4,312,049 | |
|
| Life Sciences Tools & Services–1.32% | |
IQVIA Holdings Inc.(b) | | | 48,560 | | | | 4,754,024 | |
Thermo Fisher Scientific, Inc. | | | 21,025 | | | | 3,992,227 | |
| | | | | | | | 8,746,251 | |
|
| Managed Health Care–3.35% | |
UnitedHealth Group Inc. | | | 100,668 | | | | 22,193,267 | |
|
| Oil & Gas Equipment & Services–0.68% | |
Halliburton Co. | | | 92,628 | | | | 4,526,730 | |
See accompanying Notes to Financial Statements which are an integral part of the financial statements.
Invesco V.I. American Franchise Fund
| | | | | | | | |
| | | Shares | | | Value | |
| Oil & Gas Exploration & Production–0.98% | |
Parsley Energy, Inc.–Class A(b) | | | 220,656 | | | $ | 6,496,113 | |
|
| Packaged Foods & Meats–1.17% | |
Tyson Foods, Inc.–Class A | | | 95,200 | | | | 7,717,864 | |
|
| Pharmaceuticals–1.94% | |
Allergan PLC | | | 42,067 | | | | 6,881,320 | |
Zoetis Inc. | | | 82,800 | | | | 5,964,912 | |
| | | | | | | | 12,846,232 | |
|
| Railroads–0.53% | |
Canadian Pacific Railway Ltd. (Canada) | | | 19,153 | | | | 3,500,402 | |
|
| Research & Consulting Services–0.30% | |
Equifax Inc. | | | 16,910 | | | | 1,994,027 | |
|
| Semiconductor Equipment–2.36% | |
Applied Materials, Inc. | | | 130,851 | | | | 6,689,103 | |
ASML Holding N.V.–New York Shares (Netherlands) | | | 51,475 | | | | 8,947,385 | |
| | | | | | | | 15,636,488 | |
|
| Semiconductors–1.90% | |
Broadcom Ltd. | | | 39,830 | | | | 10,232,327 | |
NVIDIA Corp. | | | 12,140 | | | | 2,349,090 | |
| | | | | | | | 12,581,417 | |
|
| Specialized REIT’s–0.49% | |
American Tower Corp.–Class A | | | 22,774 | | | | 3,249,167 | |
|
| Specialty Chemicals–1.19% | |
Sherwin-Williams Co. (The) | | | 19,157 | | | | 7,855,136 | |
|
| Systems Software–2.07% | |
Microsoft Corp. | | | 124,022 | | | | 10,608,842 | |
ServiceNow, Inc.(b) | | | 23,768 | | | | 3,099,109 | |
| | | | | | | | 13,707,951 | |
| | | | | | | | |
| | | Shares | | | Value | |
| Technology Hardware, Storage & Peripherals–4.60% | |
Apple Inc. | | | 179,840 | | | $ | 30,434,323 | |
|
| Tobacco–2.24% | |
Philip Morris International Inc. | | | 140,623 | | | | 14,856,820 | |
|
| Wireless Telecommunication Services–0.64% | |
Sprint Corp.(b) | | | 715,893 | | | | 4,216,610 | |
Total Common Stocks & Other Equity Interests (Cost $369,830,593) | | | | 661,389,888 | |
|
Money Market Funds–0.21% | |
Invesco Government & Agency Portfolio– Institutional Class, 1.18%(d) | | | 473,159 | | | | 473,159 | |
Invesco Liquid Assets Portfolio–Institutional Class, 1.40%(d) | | | 337,937 | | | | 337,971 | |
Invesco Treasury Portfolio–
Institutional Class, 1.17%(d) | | | 540,753 | | | | 540,753 | |
Total Money Market Funds
(Cost $1,351,883) | | | | 1,351,883 | |
TOTAL INVESTMENTS IN SECURITIES (excluding investments purchased with cash collateral from securities on loan)–100.08% (Cost $371,182,476) | | | | 662,741,771 | |
|
Investments Purchased with Cash
Collateral from Securities on Loan | |
| Money Market Funds–0.07% | |
Invesco Government & Agency Portfolio–Institutional Class,
1.18% (Cost $474,978)(d)(e) | | | 474,978 | | | | 474,978 | |
TOTAL INVESTMENTS IN SECURITIES–100.15% (Cost $371,657,454) | | | | 663,216,749 | |
OTHER ASSETS LESS LIABILITIES–(0.15)% | | | | (989,414 | ) |
NET ASSETS–100.00% | | | $ | 662,227,335 | |
Investment Abbreviations:
| | |
| ADR | | – American Depositary Receipt |
| REIT | | – Real Estate Investment Trust |
Notes to Schedule of Investments:
| (a) | Industry and/or sector classifications used in this report are generally according to the Global Industry Classification Standard, which was developed by and is the exclusive property and a service mark of MSCI Inc. and Standard & Poor’s. |
| (b) | Non-income producing security. |
| (c) | All or a portion of this security was out on loan at December 31, 2017. |
| (d) | The money market fund and the Fund are affiliated by having the same investment adviser. The rate shown is the 7-day SEC standardized yield as of December 31, 2017. |
| (e) | The security has been segregated to satisfy the commitment to return the cash collateral received in securities lending transactions upon the borrower’s return of the securities loaned. See Note 1I. |
See accompanying Notes to Financial Statements which are an integral part of the financial statements.
Invesco V.I. American Franchise Fund
Statement of Assets and Liabilities
December 31, 2017
Statement of Operations
For the year ended December 31, 2017
| | | | |
Assets: | | | | |
Investments in securities, at value (Cost $369,830,593)* | | $ | 661,389,888 | |
Investments in affiliated money market funds, at value and cost | | | 1,826,861 | |
Cash | | | 16,686 | |
Foreign currencies, at value (Cost $6,739) | | | 6,851 | |
Receivable for: | | | | |
Fund shares sold | | | 13,828 | |
Dividends | | | 332,270 | |
Investment for trustee deferred compensation and retirement plans | | | 370,438 | |
Other assets | | | 387 | |
Total assets | | | 663,957,209 | |
| |
Liabilities: | | | | |
Payable for: | | | | |
Collateral upon return of securities loaned | | | 474,978 | |
Fund shares reacquired | | | 443,373 | |
Accrued fees to affiliates | | | 367,374 | |
Accrued trustees’ and officers’ fees and benefits | | | 828 | |
Accrued other operating expenses | | | 44,148 | |
Trustee deferred compensation and retirement plans | | | 399,173 | |
Total liabilities | | | 1,729,874 | |
Net assets applicable to shares outstanding | | $ | 662,227,335 | |
| |
Net assets consist of: | | | | |
Shares of beneficial interest | | $ | 336,692,288 | |
Undistributed net investment income (loss) | | | (341,144 | ) |
Undistributed net realized gain | | | 34,316,968 | |
Net unrealized appreciation | | | 291,559,223 | |
| | | $ | 662,227,335 | |
| |
Net Assets: | | | | |
Series I | | $ | 491,271,475 | |
Series II | | $ | 170,955,860 | |
|
Shares outstanding, no par value,
with an unlimited number of shares authorized: | |
Series I | | | 7,801,524 | |
Series II | | | 2,812,118 | |
Series I: | | | | |
Net asset value per share | | $ | 62.97 | |
Series II: | | | | |
Net asset value per share | | $ | 60.79 | |
| * | At December 31, 2017, securities with an aggregate value of $469,013 were on loan to brokers. |
| | | | |
Investment income: | | | | |
Dividends (net of foreign withholding taxes of $31,156) | | $ | 5,305,181 | |
Dividends from affiliated money market funds (includes securities lending income of $11) | | | 15,877 | |
Total investment income | | | 5,321,058 | |
| |
Expenses: | | | | |
Advisory fees | | | 4,328,605 | |
Administrative services fees | | | 1,112,114 | |
Custodian fees | | | 36,245 | |
Distribution fees — Series II | | | 420,690 | |
Transfer agent fees | | | 90,786 | |
Trustees’ and officers’ fees and benefits | | | 29,379 | |
Reports to shareholders | | | 71,642 | |
Professional services fees | | | 53,973 | |
Other | | | 13,085 | |
Total expenses | | | 6,156,519 | |
Less: Fees waived | | | (2,504 | ) |
Net expenses | | | 6,154,015 | |
Net investment income (loss) | | | (832,957 | ) |
| |
Realized and unrealized gain (loss) from: | | | | |
Net realized gain (loss) from: | | | | |
Investment securities (includes net gains from securities sold to affiliates of $84,877) | | | 40,086,798 | |
Foreign currencies | | | (196 | ) |
| | | | 40,086,602 | |
Change in net unrealized appreciation of: | | | | |
Investment securities | | | 111,504,497 | |
Foreign currencies | | | 579 | |
| | | | 111,505,076 | |
Net realized and unrealized gain | | | 151,591,678 | |
Net increase in net assets resulting from operations | | $ | 150,758,721 | |
See accompanying Notes to Financial Statements which are an integral part of the financial statements.
Invesco V.I. American Franchise Fund
Statement of Changes in Net Assets
For the years ended December 31, 2017 and 2016
| | | | | | | | |
| | | 2017 | | | 2016 | |
Operations: | | | | | | | | |
Net investment income (loss) | | $ | (832,957 | ) | | $ | 350,872 | |
Net realized gain | | | 40,086,602 | | | | 49,357,647 | |
Change in net unrealized appreciation (depreciation) | | | 111,505,076 | | | | (39,458,443 | ) |
Net increase in net assets resulting from operations | | | 150,758,721 | | | | 10,250,076 | |
Distributions to shareholders from net investment income — Series I | | | (384,589 | ) | | | — | |
| | |
Distributions to shareholders from net realized gains: | | | | | | | | |
Series l | | | (37,510,459 | ) | | | (38,558,239 | ) |
Series ll | | | (13,392,445 | ) | | | (14,444,619 | ) |
Total distributions from net realized gains | | | (50,902,904 | ) | | | (53,002,858 | ) |
| | |
Share transactions–net: | | | | | | | | |
Series l | | | (2,950,365 | ) | | | (27,715,041 | ) |
Series ll | | | (6,716,707 | ) | | | (12,325,839 | ) |
Net increase (decrease) in net assets resulting from share transactions | | | (9,667,072 | ) | | | (40,040,880 | ) |
Net increase (decrease) in net assets | | | 89,804,156 | | | | (82,793,662 | ) |
| | |
Net assets: | | | | | | | | |
Beginning of year | | | 572,423,179 | | | | 655,216,841 | |
End of year (includes undistributed net investment income (loss) of $(341,144) and $33,922, respectively) | | $ | 662,227,335 | | | $ | 572,423,179 | |
Notes to Financial Statements
December 31, 2017
NOTE 1—Significant Accounting Policies
Invesco V.I. American Franchise Fund (the “Fund”) is a series portfolio of AIM Variable Insurance Funds (Invesco Variable Insurance Funds) (the “Trust”). The Trust is a Delaware statutory trust registered under the Investment Company Act of 1940, as amended (the “1940 Act”), as an open-end series management investment company consisting of twenty-four separate portfolios, (each constituting a “Fund”). The assets, liabilities and operations of each portfolio are accounted for separately. Information presented in these financial statements pertains only to the Fund. Matters affecting each Fund or class will be voted on exclusively by the shareholders of such Fund or class. Current Securities and Exchange Commission (“SEC”) guidance, however, requires participating insurance companies offering separate accounts to vote shares proportionally in accordance with the instructions of the contract owners whose investments are funded by shares of each Fund or class.
The Fund’s investment objective is to seek capital growth.
The Fund currently offers two classes of shares, Series I and Series II, both of which are offered to insurance company separate accounts funding variable annuity contracts and variable life insurance policies (“variable products”).
The Fund is an investment company and accordingly follows the investment company accounting and reporting guidance in accordance with Financial Accounting Standards Board Accounting Standards Codification Topic 946, Financial Services — Investment Companies.
The following is a summary of the significant accounting policies followed by the Fund in the preparation of its financial statements.
| A. | Security Valuations — Securities, including restricted securities, are valued according to the following policy. |
A security listed or traded on an exchange (except convertible securities) is valued at its last sales price or official closing price as of the close of the customary trading session on the exchange where the security is principally traded, or lacking any sales or official closing price on a particular day, the security may be valued at the closing bid price on that day. Securities traded in the over-the-counter market are valued based on prices furnished by independent pricing services or market makers. When such securities are valued by an independent pricing service they may be considered fair valued. Futures contracts are valued at the final settlement price set by an exchange on which they are principally traded. Listed options are valued at the mean between the last bid and asked prices from the exchange on which they are principally traded. Options not listed on an exchange are valued by an independent source at the mean between the last bid and asked prices. For purposes of determining net asset value (“NAV”) per share, futures and option contracts generally are valued 15 minutes after the close of the customary trading session of the New York Stock Exchange (“NYSE”).
Investments in open-end and closed-end registered investment companies that do not trade on an exchange are valued at the end-of-day net asset value per share. Investments in open-end and closed-end registered investment companies that trade on an exchange are valued at the last sales price or official closing price as of the close of the customary trading session on the exchange where the security is principally traded.
Debt obligations (including convertible securities) and unlisted equities are fair valued using an evaluated quote provided by an independent pricing service. Evaluated quotes provided by the pricing service may be determined without exclusive reliance on quoted prices, and may reflect appropriate factors such as institution-size trading in similar groups of securities, developments related to specific securities, dividend rate (for unlisted equities), yield (for debt obligations), quality, type of issue, coupon rate (for debt obligations), maturity (for debt obligations), individual
Invesco V.I. American Franchise Fund
trading characteristics and other market data. Pricing services generally value debt obligations assuming orderly transactions of institutional round lot size, but a fund may hold or transact in the same securities in smaller, odd lot sizes. Odd lots often trade at lower prices than institutional round lots. Debt obligations are subject to interest rate and credit risks. In addition, all debt obligations involve some risk of default with respect to interest and/or principal payments.
Foreign securities’ (including foreign exchange contracts) prices are converted into U.S. dollar amounts using the applicable exchange rates as of the close of the NYSE. If market quotations are available and reliable for foreign exchange-traded equity securities, the securities will be valued at the market quotations. Because trading hours for certain foreign securities end before the close of the NYSE, closing market quotations may become unreliable. If between the time trading ends on a particular security and the close of the customary trading session on the NYSE, events occur that the investment adviser determines are significant and make the closing price unreliable, the Fund may fair value the security. If the event is likely to have affected the closing price of the security, the security will be valued at fair value in good faith using procedures approved by the Board of Trustees. Adjustments to closing prices to reflect fair value may also be based on a screening process of an independent pricing service to indicate the degree of certainty, based on historical data, that the closing price in the principal market where a foreign security trades is not the current value as of the close of the NYSE. Foreign securities’ prices meeting the approved degree of certainty that the price is not reflective of current value will be priced at the indication of fair value from the independent pricing service. Multiple factors may be considered by the independent pricing service in determining adjustments to reflect fair value and may include information relating to sector indices, American Depositary Receipts and domestic and foreign index futures. Foreign securities may have additional risks including exchange rate changes, potential for sharply devalued currencies and high inflation, political and economic upheaval, the relative lack of issuer information, relatively low market liquidity and the potential lack of strict financial and accounting controls and standards.
Securities for which market prices are not provided by any of the above methods may be valued based upon quotes furnished by independent sources. The last bid price may be used to value equity securities. The mean between the last bid and asked prices is used to value debt obligations, including corporate loans.
Securities for which market quotations are not readily available or became unreliable are valued at fair value as determined in good faith by or under the supervision of the Trust’s officers following procedures approved by the Board of Trustees. Issuer specific events, market trends, bid/asked quotes of brokers and information providers and other market data may be reviewed in the course of making a good faith determination of a security’s fair value.
The Fund may invest in securities that are subject to interest rate risk, meaning the risk that the prices will generally fall as interest rates rise and, conversely, the prices will generally rise as interest rates fall. Specific securities differ in their sensitivity to changes in interest rates depending on their individual characteristics. Changes in interest rates may result in increased market volatility, which may affect the value and/or liquidity of certain Fund investments.
Valuations change in response to many factors including the historical and prospective earnings of the issuer, the value of the issuer’s assets, general economic conditions, interest rates, investor perceptions and market liquidity. Because of the inherent uncertainties of valuation, the values reflected in the financial statements may materially differ from the value received upon actual sale of those investments.
| B. | Securities Transactions and Investment Income — Securities transactions are accounted for on a trade date basis. Realized gains or losses on sales are computed on the basis of specific identification of the securities sold. Interest income (net of withholding tax, if any) is recorded on the accrual basis from settlement date. Dividend income (net of withholding tax, if any) is recorded on the ex-dividend date. |
The Fund may periodically participate in litigation related to Fund investments. As such, the Fund may receive proceeds from litigation settlements. Any proceeds received are included in the Statement of Operations as realized gain (loss) for investments no longer held and as unrealized gain (loss) for investments still held.
Brokerage commissions and mark ups are considered transaction costs and are recorded as an increase to the cost basis of securities purchased and/or a reduction of proceeds on a sale of securities. Such transaction costs are included in the determination of net realized and unrealized gain (loss) from investment securities reported in the Statement of Operations and the Statement of Changes in Net Assets and the net realized and unrealized gains (losses) on securities per share in the Financial Highlights. Transaction costs are included in the calculation of the Fund’s net asset value and, accordingly, they reduce the Fund’s total returns. These transaction costs are not considered operating expenses and are not reflected in net investment income reported in the Statement of Operations and the Statement of Changes in Net Assets, or the net investment income per share and the ratios of expenses and net investment income reported in the Financial Highlights, nor are they limited by any expense limitation arrangements between the Fund and the investment adviser.
The Fund allocates income and realized and unrealized capital gains and losses to a class based on the relative net assets of each class.
| C. | Country Determination — For the purposes of making investment selection decisions and presentation in the Schedule of Investments, the investment adviser may determine the country in which an issuer is located and/or credit risk exposure based on various factors. These factors include the laws of the country under which the issuer is organized, where the issuer maintains a principal office, the country in which the issuer derives 50% or more of its total revenues and the country that has the primary market for the issuer’s securities, as well as other criteria. Among the other criteria that may be evaluated for making this determination are the country in which the issuer maintains 50% or more of its assets, the type of security, financial guarantees and enhancements, the nature of the collateral and the sponsor organization. Country of issuer and/or credit risk exposure has been determined to be the United States of America, unless otherwise noted. |
| D. | Distributions — Distributions from net investment income and net realized capital gain, if any, are generally declared and paid to separate accounts of participating insurance companies annually and recorded on the ex-dividend date. |
| E. | Federal Income Taxes — The Fund intends to comply with the requirements of Subchapter M of the Internal Revenue Code of 1986, as amended (the “Internal Revenue Code”), necessary to qualify as a regulated investment company and to distribute substantially all of the Fund’s taxable earnings to shareholders. As such, the Fund will not be subject to federal income taxes on otherwise taxable income (including net realized capital gain) that is distributed to shareholders. Therefore, no provision for federal income taxes is recorded in the financial statements. |
The Fund recognizes the tax benefits of uncertain tax positions only when the position is more likely than not to be sustained. Management has analyzed the Fund’s uncertain tax positions and concluded that no liability for unrecognized tax benefits should be recorded related to uncertain tax positions. Management is not aware of any tax positions for which it is reasonably possible that the total amounts of unrecognized tax benefits will change materially in the next 12 months.
Invesco V.I. American Franchise Fund
The Fund files tax returns in the U.S. Federal jurisdiction and certain other jurisdictions. Generally, the Fund is subject to examinations by such taxing authorities for up to three years after the filing of the return for the tax period.
| F. | Expenses — Fees provided for under the Rule 12b-1 plan of a particular class of the Fund and which are directly attributable to that class are charged to the operations of such class. All other expenses are allocated among the classes based on relative net assets. |
| G. | Accounting Estimates — The preparation of financial statements in conformity with accounting principles generally accepted in the United States of America (“GAAP”) requires management to make estimates and assumptions that affect the reported amounts of assets and liabilities at the date of the financial statements and the reported amounts of revenues and expenses during the reporting period including estimates and assumptions related to taxation. Actual results could differ from those estimates by a significant amount. In addition, the Fund monitors for material events or transactions that may occur or become known after the period-end date and before the date the financial statements are released to print. |
| H. | Indemnifications — Under the Trust’s organizational documents, each Trustee, officer, employee or other agent of the Trust is indemnified against certain liabilities that may arise out of the performance of their duties to the Fund. Additionally, in the normal course of business, the Fund enters into contracts, including the Fund’s servicing agreements, that contain a variety of indemnification clauses. The Fund’s maximum exposure under these arrangements is unknown as this would involve future claims that may be made against the Fund that have not yet occurred. The risk of material loss as a result of such indemnification claims is considered remote. |
| I. | Securities Lending — The Fund may lend portfolio securities having a market value up to one-third of the Fund’s total assets. Such loans are secured by collateral equal to no less than the market value of the loaned securities determined daily by the securities lending provider. Such collateral will be cash or debt securities issued or guaranteed by the U.S. Government or any of its sponsored agencies. Cash collateral received in connection with these loans is invested in short-term money market instruments or affiliated money market funds and is shown as such on the Schedule of Investments. The Fund bears the risk of loss with respect to the investment of collateral. It is the Fund’s policy to obtain additional collateral from or return excess collateral to the borrower by the end of the next business day, following the valuation date of the securities loaned. Therefore, the value of the collateral held may be temporarily less than the value of the securities on loan. When loaning securities, the Fund retains certain benefits of owning the securities, including the economic equivalent of dividends or interest generated by the security. Lending securities entails a risk of loss to the Fund if, and to the extent that, the market value of the securities loaned were to increase and the borrower did not increase the collateral accordingly, and the borrower failed to return the securities. The securities loaned are subject to termination at the option of the borrower or the Fund. Upon termination, the borrower will return to the Fund the securities loaned and the Fund will return the collateral. Upon the failure of the borrower to return the securities, collateral may be liquidated and the securities may be purchased on the open market to replace the loaned securities. The Fund could experience delays and costs in gaining access to the collateral and the securities may lose value during the delay which could result in potential losses to the Fund. Some of these losses may be indemnified by the lending agent. The Fund bears the risk of any deficiency in the amount of the collateral available for return to the borrower due to any loss on the collateral invested. Dividends received on cash collateral investments for securities lending transactions, which are net of compensation to counterparties, are included in Dividends from affiliated money market funds on the Statement of Operations. The aggregate value of securities out on loan, if any, is shown as a footnote on the Statement of Assets and Liabilities. |
| J. | Foreign Currency Translations — Foreign currency is valued at the close of the NYSE based on quotations posted by banks and major currency dealers. Portfolio securities and other assets and liabilities denominated in foreign currencies are translated into U.S. dollar amounts at date of valuation. Purchases and sales of portfolio securities (net of foreign taxes withheld on disposition) and income items denominated in foreign currencies are translated into U.S. dollar amounts on the respective dates of such transactions. The Fund does not separately account for the portion of the results of operations resulting from changes in foreign exchange rates on investments and the fluctuations arising from changes in market prices of securities held. The combined results of changes in foreign exchange rates and the fluctuation of market prices on investments (net of estimated foreign tax withholding) are included with the net realized and unrealized gain or loss from investments in the Statement of Operations. Reported net realized foreign currency gains or losses arise from (1) sales of foreign currencies, (2) currency gains or losses realized between the trade and settlement dates on securities transactions, and (3) the difference between the amounts of dividends, interest, and foreign withholding taxes recorded on the Fund’s books and the U.S. dollar equivalent of the amounts actually received or paid. Net unrealized foreign currency gains and losses arise from changes in the fair values of assets and liabilities, other than investments in securities at fiscal period end, resulting from changes in exchange rates. |
The Fund may invest in foreign securities, which may be subject to foreign taxes on income, gains on investments or currency repatriation, a portion of which may be recoverable. Foreign taxes, if any, are recorded based on the tax regulations and rates that exist in the foreign markets in which the Fund invests and are shown in the Statement of Operations.
| K. | Forward Foreign Currency Contracts — The Fund may engage in foreign currency transactions either on a spot (i.e. for prompt delivery and settlement) basis, or through forward foreign currency contracts, to manage or minimize currency or exchange rate risk. |
The Fund may also enter into forward foreign currency contracts for the purchase or sale of a security denominated in a foreign currency in order to “lock in” the U.S. dollar price of that security, or the Fund may also enter into forward foreign currency contracts that do not provide for physical settlement of the two currencies, but instead are settled by a single cash payment calculated as the difference between the agreed upon exchange rate and the spot rate at settlement based upon an agreed upon notional amount (non-deliverable forwards). The Fund will set aside liquid assets in an amount equal to the daily mark-to-market obligation for forward foreign currency contracts.
A forward foreign currency contract is an obligation between two parties (“Counterparties”) to purchase or sell a specific currency for an agreed-upon price at a future date. The use of forward foreign currency contracts does not eliminate fluctuations in the price of the underlying securities the Fund owns or intends to acquire but establishes a rate of exchange in advance. Fluctuations in the value of these contracts are measured by the difference in the contract date and reporting date exchange rates and are recorded as unrealized appreciation (depreciation) until the contracts are closed. When the contracts are closed, realized gains (losses) are recorded. Realized and unrealized gains (losses) on the contracts are included in the Statement of Operations. The primary risks associated with forward foreign currency contracts include failure of the Counterparty to meet the terms of the contract and the value of the foreign currency changing unfavorably. These risks may be in excess of the amounts reflected in the Statement of Assets and Liabilities.
Invesco V.I. American Franchise Fund
NOTE 2—Advisory Fees and Other Fees Paid to Affiliates
The Trust has entered into a master investment advisory agreement with Invesco Advisers, Inc. (the “Adviser” or “Invesco”). Under the terms of the investment advisory agreement, the Fund accrues daily and pays monthly an advisory fee to the Adviser based on the annual rate of the Fund’s average daily net assets as follows:
| | | | | | | | |
| Average Daily Net Assets | | Rate | |
First $250 million | | | 0 | .695% | | | | |
Next $250 million | | | 0 | .67% | | | | |
Next $500 million | | | 0 | .645% | | | | |
Next $550 million | | | 0 | .62% | | | | |
Next $3.45 billion | | | 0 | .60% | | | | |
Next $250 million | | | 0 | .595% | | | | |
Next $2.25 billion | | | 0 | .57% | | | | |
Next $2.5 billion | | | 0 | .545% | | | | |
Over $10 billion | | | 0 | .52% | | | | |
For the year ended December 31, 2017, the effective advisory fees incurred by the Fund was 0.67%.
Under the terms of a master sub-advisory agreement between the Adviser and each of Invesco Asset Management Deutschland GmbH, Invesco Asset Management Limited, Invesco Asset Management (Japan) Limited, Invesco Hong Kong Limited, Invesco Senior Secured Management, Inc. and Invesco Canada Ltd. and separate sub-advisory agreements with Invesco PowerShares Capital Management LLC and Invesco Asset Management (India) Private Limited (collectively, the “Affiliated Sub-Advisers”) the Adviser, not the Fund, will pay 40% of the fees paid to the Adviser to any such Affiliated Sub-Adviser(s) that provide(s) discretionary investment management services to the Fund based on the percentage of assets allocated to such Affiliated Sub-Adviser(s).
The Adviser has contractually agreed, through at least June 30, 2018, to waive advisory fees and/or reimburse expenses to the extent necessary to limit total annual fund operating expenses after fee waiver and/or expense reimbursement (excluding certain items discussed below) of Series I shares to 2.00% and Series II shares to 2.25% of average daily net assets (the “expense limits”). In determining the Adviser’s obligation to waive advisory fees and/or reimburse expenses, the following expenses are not taken into account, and could cause the total annual operating expenses after fee waiver and/or expense reimbursement to exceed the numbers reflected above: (1) interest; (2) taxes; (3) dividend expense on short sales; (4) extraordinary or non-routine items, including litigation expenses; and (5) expenses that the Fund has incurred but did not actually pay because of an expense offset arrangement. Unless Invesco continues the fee waiver agreement, it will terminate on June 30, 2018. During its term, the fee waiver agreement cannot be terminated or amended to increase the expense limits or reduce the advisory fee waiver without approval of the Board of Trustees. The Adviser did not waive fees and/or reimburse expenses during the period under these expense limits.
Further, the Adviser has contractually agreed, through at least June 30, 2019, to waive the advisory fee payable by the Fund in an amount equal to 100% of the net advisory fees the Adviser receives from the affiliated money market funds on investments by the Fund of uninvested cash (excluding investments of cash collateral from securities lending) in such affiliated money market funds.
For the year ended December 31, 2017, the Adviser waived advisory fees of $2,504.
The Trust has entered into a master administrative services agreement with Invesco pursuant to which the Fund has agreed to pay Invesco a fee for costs incurred in providing accounting services and fund administrative services to the Fund and to reimburse Invesco for fees paid to insurance companies that have agreed to provide certain administrative services to the Fund. These administrative services provided by the insurance companies may include, among other things: maintenance of master accounts with the Fund; tracking, recording and transmitting net purchase and redemption orders for Fund shares; maintaining and preserving records related to the purchase, redemption and other account activity of variable product owners; distributing copies of Fund documents such as prospectuses, proxy materials and periodic reports, to variable product owners, and responding to inquiries from variable product owners about the Fund. Pursuant to such agreement, for the year ended December 31, 2017, Invesco was paid $152,667 for accounting and fund administrative services and was reimbursed $959,447 for fees paid to insurance companies.
The Trust has entered into a transfer agency and service agreement with Invesco Investment Services, Inc. (“IIS”) pursuant to which the Fund has agreed to pay IIS a fee for providing transfer agency and shareholder services to the Fund and reimburse IIS for certain expenses incurred by IIS in the course of providing such services. For the year ended December 31, 2017, expenses incurred under the agreement are shown in the Statement of Operations as Transfer agent fees.
The Trust has entered into a master distribution agreement with Invesco Distributors, Inc. (“IDI”) to serve as the distributor for the Fund. The Trust has adopted a plan pursuant to Rule 12b-1 under the 1940 Act with respect to the Fund’s Series II shares (the “Plan”). The Fund, pursuant to the Plan, pays IDI compensation at the annual rate of 0.25% of the Fund’s average daily net assets of Series II shares. The fees are accrued daily and paid monthly. Of the Plan payments, up to 0.25% of the average daily net assets of the Series II shares may be paid to insurance companies who furnish continuing personal shareholder services to customers who purchase and own Series II shares of the Fund. For the year ended December 31, 2017, expenses incurred under the Plan are detailed in the Statement of Operations as Distribution fees.
For the year ended December 31, 2017, the Fund incurred $3,244 in brokerage commissions with Invesco Capital Markets, Inc., an affiliate of the Adviser and IDI, for portfolio transactions executed on behalf of the Fund.
Certain officers and trustees of the Trust are officers and directors of the Adviser, IIS and/or IDI.
Invesco V.I. American Franchise Fund
NOTE 3—Additional Valuation Information
GAAP defines fair value as the price that would be received to sell an asset or paid to transfer a liability in an orderly transaction between market participants at the measurement date, under current market conditions. GAAP establishes a hierarchy that prioritizes the inputs to valuation methods, giving the highest priority to readily available unadjusted quoted prices in an active market for identical assets (Level 1) and the lowest priority to significant unobservable inputs (Level 3), generally when market prices are not readily available or are unreliable. Based on the valuation inputs, the securities or other investments are tiered into one of three levels. Changes in valuation methods may result in transfers in or out of an investment’s assigned level:
| | Level 1 — | Prices are determined using quoted prices in an active market for identical assets. |
| | Level 2 — | Prices are determined using other significant observable inputs. Observable inputs are inputs that other market participants may use in pricing a security. These may include quoted prices for similar securities, interest rates, prepayment speeds, credit risk, yield curves, loss severities, default rates, discount rates, volatilities and others. |
| | Level 3 — | Prices are determined using significant unobservable inputs. In situations where quoted prices or observable inputs are unavailable (for example, when there is little or no market activity for an investment at the end of the period), unobservable inputs may be used. Unobservable inputs reflect the Fund’s own assumptions about the factors market participants would use in determining fair value of the securities or instruments and would be based on the best available information. |
The following is a summary of the tiered valuation input levels, as of December 31, 2017. The level assigned to the securities valuations may not be an indication of the risk or liquidity associated with investing in those securities. Because of the inherent uncertainties of valuation, the values reflected in the financial statements may materially differ from the value received upon actual sale of those investments.
The Fund’s policy is to recognize transfers in and out of the valuation levels as of the end of the reporting period. During the year ended December 31, 2017, there were no material transfers between valuation levels.
| | | | | | | | | | | | | | | | |
| Investments in Securities | |
| | | Level 1 | | | Level 2 | | | Level 3 | | | Total | |
| Investments in Securities | | | | | | | | | | | | |
Common Stocks & Other Equity Interests | | $ | 625,453,159 | | | $ | 35,936,729 | | | $ | — | | | $ | 661,389,888 | |
Money Market Funds | | | 1,826,861 | | | | — | | | | — | | | | 1,826,861 | |
Total Investments | | $ | 627,280,020 | | | $ | 35,936,729 | | | $ | — | | | $ | 663,216,749 | |
NOTE 4—Security Transactions with Affiliated Funds
The Fund is permitted to purchase or sell securities from or to certain other Invesco Funds under specified conditions outlined in procedures adopted by the Board of Trustees of the Trust. The procedures have been designed to ensure that any purchase or sale of securities by the Fund from or to another fund or portfolio that is or could be considered an affiliate by virtue of having a common investment adviser (or affiliated investment advisers), common Trustees and/or common officers complies with Rule 17a-7 of the 1940 Act. Further, as defined under the procedures, each transaction is effected at the current market price. Pursuant to these procedures, for the year ended December 31, 2017, the Fund engaged in securities sales of $3,445,769, which resulted in net realized gains of $84,877.
NOTE 5—Trustees’ and Officers’ Fees and Benefits
Trustees’ and Officers’ Fees and Benefits include amounts accrued by the Fund to pay remuneration to certain Trustees and Officers of the Fund. Trustees have the option to defer compensation payable by the Fund, and Trustees’ and Officers’ Fees and Benefits also include amounts accrued by the Fund to fund such deferred compensation amounts. Those Trustees who defer compensation have the option to select various Invesco Funds in which their deferral accounts shall be deemed to be invested. Finally, certain current Trustees were eligible to participate in a retirement plan that provided for benefits to be paid upon retirement to Trustees over a period of time based on the number of years of service. The Fund may have certain former Trustees who also participate in a retirement plan and receive benefits under such plan. Trustees’ and Officers’ Fees and Benefits include amounts accrued by the Fund to fund such retirement benefits. Obligations under the deferred compensation and retirement plans represent unsecured claims against the general assets of the Fund.
NOTE 6—Cash Balances
The Fund is permitted to temporarily carry a negative or overdrawn balance in its account with State Street Bank and Trust Company, the custodian bank. Such balances, if any at period-end, are shown in the Statement of Assets and Liabilities under the payable caption Amount due custodian. To compensate the custodian bank for such overdrafts, the overdrawn Fund may either (1) leave funds as a compensating balance in the account so the custodian bank can be compensated by earning the additional interest; or (2) compensate by paying the custodian bank at a rate agreed upon by the custodian bank and Invesco, not to exceed the contractually agreed upon rate.
Invesco V.I. American Franchise Fund
NOTE 7—Distributions to Shareholders and Tax Components of Net Assets
Tax Character of Distributions to Shareholders Paid During the Fiscal Years Ended December 31, 2017 and 2016:
| | | | | | | | |
| | | 2017 | | | 2016 | |
Ordinary income | | $ | 384,589 | | | $ | — | |
Long-term capital gain | | | 50,902,904 | | | | 53,002,858 | |
Total distributions | | $ | 51,287,493 | | | $ | 53,002,858 | |
Tax Components of Net Assets at Period-End:
| | | | |
| | | 2017 | |
Undistributed ordinary income | | $ | 3,546,315 | |
Undistributed long-term gain | | | 34,579,921 | |
Net unrealized appreciation — investments | | | 287,750,027 | |
Net unrealized appreciation (depreciation) — foreign currencies | | | (72 | ) |
Temporary book/tax differences | | | (341,144 | ) |
Shares of beneficial interest | | | 336,692,288 | |
Total net assets | | $ | 662,227,335 | |
The difference between book-basis and tax-basis unrealized appreciation (depreciation) is due to differences in the timing of recognition of gains and losses on investments for tax and book purposes. The Fund’s net unrealized appreciation (depreciation) difference is attributable primarily to wash sales.
The temporary book/tax differences are a result of timing differences between book and tax recognition of income and/or expenses. The Fund’s temporary book/tax differences are the result of the trustee deferral of compensation and retirement plan benefits.
Capital loss carryforward is calculated and reported as of a specific date. Results of transactions and other activity after that date may affect the amount of capital loss carryforward actually available for the Fund to utilize. Capital losses generated in years beginning after December 22, 2010 can be carried forward for an unlimited period, whereas previous losses expire in eight tax years. Capital losses with an expiration period may not be used to offset capital gains until all net capital losses without an expiration date have been utilized. Capital loss carryforwards with no expiration date will retain their character as either short-term or long-term capital losses instead of as short-term capital losses as under prior law. The ability to utilize capital loss carryforwards in the future may be limited under the Internal Revenue Code and related regulations based on the results of future transactions.
The Fund does not have a capital loss carryforward as of December 31, 2017.
NOTE 8—Investment Transactions
The aggregate amount of investment securities (other than short-term securities, U.S. Treasury obligations and money market funds, if any) purchased and sold by the Fund during the year ended December 31, 2017 was $284,830,502 and $345,009,548, respectively. Cost of investments, including any derivatives, on a tax basis includes the adjustments for financial reporting purposes as of the most recently completed federal income tax reporting period-end.
| | | | |
| Unrealized Appreciation (Depreciation) of Investments on a Tax Basis | |
Aggregate unrealized appreciation of investments | | $ | 291,880,706 | |
Aggregate unrealized (depreciation) of investments | | | (4,130,679 | ) |
Net unrealized appreciation of investments | | $ | 287,750,027 | |
Cost of investments for tax purposes is $375,466,722.
NOTE 9—Reclassification of Permanent Differences
Primarily as a result of differing book/tax treatment of net operating losses, on December 31, 2017, undistributed net investment income (loss) was increased by $842,480 and undistributed net realized gain was decreased by $842,480. This reclassification had no effect on the net assets of the Fund.
Invesco V.I. American Franchise Fund
NOTE 10—Share Information
| | | | | | | | | | | | | | | | |
| | | Summary of Share Activity | |
| | | Years ended December 31, | |
| | | 2017(a) | | | 2016 | |
| | | Shares | | | Amount | | | Shares | | | Amount | |
Sold: | | | | | | | | | | | | | | | | |
Series I | | | 632,683 | | | $ | 39,590,013 | | | | 222,257 | | | $ | 12,031,047 | |
Series II | | | 193,178 | | | | 11,491,194 | | | | 131,825 | | | | 6,897,330 | |
| | | | |
Issued as reinvestment of dividends: | | | | | | | | | | | | | | | | |
Series I | | | 623,684 | | | | 37,895,048 | | | | 705,807 | | | | 38,558,239 | |
Series II | | | 228,151 | | | | 13,392,445 | | | | 272,488 | | | | 14,444,619 | |
| | | | |
Reacquired: | | | | | | | | | | | | | | | | |
Series I | | | (1,308,965 | ) | | | (80,435,426 | ) | | | (1,438,141 | ) | | | (78,304,327 | ) |
Series II | | | (527,169 | ) | | | (31,600,346 | ) | | | (636,218 | ) | | | (33,667,788 | ) |
Net increase (decrease) in share activity | | | (158,438 | ) | | $ | (9,667,072 | ) | | | (741,982 | ) | | $ | (40,040,880 | ) |
| (a) | There are entities that are record owners of more than 5% of the outstanding shares of the Fund and in the aggregate own 22% of the outstanding shares of the Fund. The Fund and the Fund’s principal underwriter or adviser, are parties to participation agreements with these entities whereby these entities sell units of interest in separate accounts funding variable products that are invested in the Fund. The Fund, Invesco and/or Invesco affiliates may make payments to these entities, which are considered to be related to the Fund, for providing services to the Fund, Invesco and/or Invesco affiliates including but not limited to services such as, securities brokerage, third party record keeping and account servicing and administrative services. The Fund has no knowledge as to whether all or any portion of the shares owned of record by these entities are also owned beneficially. |
NOTE 11—Financial Highlights
The following schedule presents financial highlights for a share of the Fund outstanding throughout the periods indicated.
| | | | | | | | | | | | | | | | | | | | | | | | | | | | | | | | | | | | | | | | | | | | | | | | | | | | | | | | |
| | | Net asset
value,
beginning
of period | | | Net
investment
income (loss)(a) | | | Net gains on securities
(both
realized and
unrealized) | | | Total from
investment
operations | | | Dividends
from net
investment
income | | | Distributions
from net
realized
gains | | | Total
distributions | | | Net asset
value, end
of period | | | Total
return(b) | | | Net assets,
end of period
(000’s omitted) | | | Ratio of
expenses
to average net assets
with fee waivers
and/or expenses
absorbed | | | Ratio of
expenses
to average net
assets without
fee waivers
and/or expenses
absorbed | | | Ratio of net
investment
income (loss)
to average
net assets | | | Portfolio
turnover(c) | |
Series I | | | | | | | | | | | | | | | | | | | | | | | | | | | | | | | | | | | | | | | | | | | | | | | | | | | | | | | | |
Year ended 12/31/17 | | $ | 53.58 | | | $ | (0.04 | ) | | $ | 14.50 | | | $ | 14.46 | | | $ | (0.05 | ) | | $ | (5.02 | ) | | $ | (5.07 | ) | | $ | 62.97 | | | | 27.34 | % | | $ | 491,271 | | | | 0.89 | %(d) | | | 0.89 | %(d) | | | (0.06 | )%(d) | | | 45 | % |
Year ended 12/31/16 | | | 57.30 | | | | 0.07 | | | | 1.33 | | | | 1.40 | | | | — | | | | (5.12 | ) | | | (5.12 | ) | | | 53.58 | | | | 2.27 | | | | 420,824 | | | | 0.93 | | | | 0.93 | | | | 0.12 | | | | 59 | |
Year ended 12/31/15 | | | 54.88 | | | | (0.03 | ) | | | 2.76 | | | | 2.73 | | | | — | | | | (0.31 | ) | | | (0.31 | ) | | | 57.30 | | | | 5.01 | | | | 479,298 | | | | 0.96 | | | | 0.96 | | | | (0.05 | ) | | | 68 | |
Year ended 12/31/14 | | | 50.63 | | | | (0.09 | ) | | | 4.36 | | | | 4.27 | | | | (0.02 | ) | | | — | | | | (0.02 | ) | | | 54.88 | | | | 8.44 | | | | 541,929 | | | | 0.92 | | | | 0.95 | | | | (0.17 | ) | | | 64 | |
Year ended 12/31/13 | | | 36.28 | | | | 0.04 | | | | 14.50 | | | | 14.54 | | | | (0.19 | ) | | | — | | | | (0.19 | ) | | | 50.63 | | | | 40.13 | | | | 580,620 | | | | 0.90 | | | | 0.96 | | | | 0.08 | | | | 75 | |
Series II | | | | | | | | | | | | | | | | | | | | | | | | | | | | | | | | | | | | | | | | | | | | | | | | | | | | | | | | |
Year ended 12/31/17 | | | 51.95 | | | | (0.19 | ) | | | 14.05 | | | | 13.86 | | | | — | | | | (5.02 | ) | | | (5.02 | ) | | | 60.79 | | | | 27.03 | | | | 170,956 | | | | 1.14 | (d) | | | 1.14 | (d) | | | (0.31 | )(d) | | | 45 | |
Year ended 12/31/16 | | | 55.85 | | | | (0.06 | ) | | | 1.28 | | | | 1.22 | | | | — | | | | (5.12 | ) | | | (5.12 | ) | | | 51.95 | | | | 2.00 | | | | 151,599 | | | | 1.18 | | | | 1.18 | | | | (0.13 | ) | | | 59 | |
Year ended 12/31/15 | | | 53.63 | | | | (0.16 | ) | | | 2.69 | | | | 2.53 | | | | — | | | | (0.31 | ) | | | (0.31 | ) | | | 55.85 | | | | 4.75 | | | | 175,919 | | | | 1.21 | | | | 1.21 | | | | (0.30 | ) | | | 68 | |
Year ended 12/31/14 | | | 49.58 | | | | (0.22 | ) | | | 4.27 | | | | 4.05 | | | | — | | | | — | | | | — | | | | 53.63 | | | | 8.17 | | | | 199,141 | | | | 1.17 | | | | 1.20 | | | | (0.42 | ) | | | 64 | |
Year ended 12/31/13 | | | 35.55 | | | | (0.07 | ) | | | 14.20 | | | | 14.13 | | | | (0.10 | ) | | | — | | | | (0.10 | ) | | | 49.58 | | | | 39.79 | | | | 257,788 | | | | 1.15 | | | | 1.21 | | | | (0.17 | ) | | | 75 | |
| (a) | Calculated using average shares outstanding. |
| (b) | Includes adjustments in accordance with accounting principles generally accepted in the United States of America and as such, the net asset value for financial reporting purposes and the returns based upon those net asset values may differ from the net asset value and returns for shareholder transactions. Total returns are not annualized for periods less than one year, if applicable, and do not reflect charges assessed in connection with a variable product, which if included would reduce total returns. |
| (c) | Portfolio turnover is calculated at the fund level and is not annualized for periods less than one year, if applicable. |
| (d) | Ratios are based on average daily net assets (000’s omitted) of $473,756 and $168,276 for Series I and Series II shares, respectively. |
Invesco V.I. American Franchise Fund
Report of Independent Registered Public Accounting Firm
To the Board of Trustees of AIM Variable Insurance Funds (Invesco Variable Insurance Funds) and Shareholders of Invesco V.I. American Franchise Fund
Opinion on the Financial Statements
We have audited the accompanying statement of assets and liabilities, including the schedule of investments, of Invesco V.I. American Franchise Fund (one of the funds constituting AIM Variable Insurance Funds (Invesco Variable Insurance Funds), hereafter referred to as the “Fund”) as of December 31, 2017, the related statement of operations for the year ended December 31, 2017, the statement of changes in net assets for each of the two years in the period ended December 31, 2017, including the related notes, and the financial highlights for each of the five years in the period ended December 31, 2017 (collectively referred to as the “financial statements”). In our opinion, the financial statements present fairly, in all material respects, the financial position of the Fund as of December 31, 2017, the results of its operations for the year then ended, the changes in its net assets for each of the two years in the period ended December 31, 2017 and the financial highlights for each of the five years in the period ended December 31, 2017 in conformity with accounting principles generally accepted in the United States of America.
Basis for Opinion
These financial statements are the responsibility of the Fund’s management. Our responsibility is to express an opinion on the Fund’s financial statements based on our audits. We are a public accounting firm registered with the Public Company Accounting Oversight Board (United States) (“PCAOB”) and are required to be independent with respect to the Fund in accordance with the U.S. federal securities laws and the applicable rules and regulations of the Securities and Exchange Commission and the PCAOB.
We conducted our audits of these financial statements in accordance with the standards of the PCAOB. Those standards require that we plan and perform the audit to obtain reasonable assurance about whether the financial statements are free of material misstatement, whether due to error or fraud.
Our audits included performing procedures to assess the risks of material misstatement of the financial statements, whether due to error or fraud, and performing procedures that respond to those risks. Such procedures included examining, on a test basis, evidence regarding the amounts and disclosures in the financial statements. Our audits also included evaluating the accounting principles used and significant estimates made by management, as well as evaluating the overall presentation of the financial statements. Our procedures included confirmation of securities owned as of December 31, 2017 by correspondence with the custodian, transfer agent and brokers; when replies were not received from brokers, we performed other auditing procedures. We believe that our audits provide a reasonable basis for our opinion.
PricewaterhouseCoopers LLP
Houston, TX
February 14, 2018
We have served as the auditor of one or more of the investment companies in the Invesco/PowerShares group of investment companies since at least 1995. We have not determined the specific year we began serving as auditor.
Invesco V.I. American Franchise Fund
Calculating your ongoing Fund expenses
Example
As a shareholder of the Fund, you incur ongoing costs, including management fees; distribution and/or service fees (12b-1); and other Fund expenses. This example is intended to help you understand your ongoing costs (in dollars) of investing in the Fund and to compare these costs with ongoing costs of investing in other mutual funds. The example is based on an investment of $1,000 invested at the beginning of the period and held for the entire period July 1, 2017 through December 31, 2017.
The actual and hypothetical expenses in the examples below do not represent the effect of any fees or other expenses assessed in connection with a variable product; if they did, the expenses shown would be higher while the ending account values shown would be lower.
Actual expenses
The table below provides information about actual account values and actual expenses. You may use the information in this table, together with the amount you invested, to estimate the expenses that you paid over the period. Simply divide your account value by $1,000 (for example, an $8,600 account value divided by $1,000 = 8.6), then multiply the result by the number in the table under the heading entitled “Actual Expenses Paid During Period” to estimate the expenses you paid on your account during this period.
Hypothetical example for comparison purposes
The table below also provides information about hypothetical account values and hypothetical expenses based on the Fund’s actual expense ratio and an assumed rate of return of 5% per year before expenses, which is not the Fund’s actual return.
The hypothetical account values and expenses may not be used to estimate the actual ending account balance or expenses you paid for the period. You may use this information to compare the ongoing costs of investing in the Fund and other funds. To do so, compare this 5% hypothetical example with the 5% hypothetical examples that appear in the shareholder reports of the other funds.
Please note that the expenses shown in the table are meant to highlight your ongoing costs. Therefore, the hypothetical information is useful in comparing ongoing costs, and will not help you determine the relative total costs of owning different funds.
| | | | | | | | | | | | | | | | | | | | | | | | |
| Class | | Beginning
Account Value
(07/01/17) | | | ACTUAL | | | HYPOTHETICAL
(5% annual return before expenses) | | | Annualized
Expense
Ratio | |
| | | Ending
Account Value
(12/31/17)1 | | | Expenses
Paid During
Period2 | | | Ending
Account Value
(12/31/17) | | | Expenses
Paid During
Period2 | | |
| Series I | | $ | 1,000.00 | | | $ | 1,079.20 | | | $ | 4.61 | | | $ | 1,020.77 | | | $ | 4.48 | | | | 0.88 | % |
| Series II | | | 1,000.00 | | | | 1,078.20 | | | | 5.92 | | | | 1,019.51 | | | | 5.75 | | | | 1.13 | |
| 1 | The actual ending account value is based on the actual total return of the Fund for the period July 1, 2017 through December 31, 2017, after actual expenses and will differ from the hypothetical ending account value which is based on the Fund’s expense ratio and a hypothetical annual return of 5% before expenses. |
| 2 | Expenses are equal to the Fund’s annualized expense ratio as indicated above multiplied by the average account value over the period, multiplied by 184/365 to reflect the most recent fiscal half year. |
Invesco V.I. American Franchise Fund
Tax Information
Form 1099-DIV, Form 1042-S and other year-end tax information provide shareholders with actual calendar year amounts that should be included in their tax returns. Shareholders should consult their tax advisors.
The following distribution information is being provided as required by the Internal Revenue Code or to meet a specific state’s requirement.
The Fund designates the following amounts or, if subsequently determined to be different, the maximum amount allowable for its fiscal year ended December 31, 2017:
| | | | |
Federal and State Income Tax | |
Long-Term Capital Gain Distributions | | $ | 50,902,904 | |
Corporate Dividends Received Deduction* | | | 100 | % |
U.S. Treasury Obligations* | | | 0 | % |
| | * | The above percentages are based on ordinary income dividends paid to shareholders during the Fund’s fiscal year. |
Invesco V.I. American Franchise Fund
Trustees and Officers
The address of each trustee and officer is AIM Variable Insurance Funds (Invesco Variable Insurance Funds) (the “Trust”), 11 Greenway Plaza, Suite 1000, Houston, Texas 77046-1173. The trustees serve for the life of the Trust, subject to their earlier death, incapacitation, resignation, retirement or removal as more specifically provided in the Trust’s organizational documents. Each officer serves for a one year term or until their successors are elected and qualified. Column two below includes length of time served with predecessor entities, if any.
| | | | | | | | |
Name, Year of Birth and
Position(s) Held with the Trust | | Trustee and/
or Officer Since | | Principal Occupation(s)
During Past 5 Years | | Number of
Funds in Fund
Complex
Overseen by
Trustee | | Other Directorship(s)
Held by Trustee During
Past 5 Years |
| Interested Persons | | | | | | | | |
Martin L. Flanagan1 — 1960 Trustee | | 2007 | | Executive Director, Chief Executive Officer and President, Invesco Ltd. (ultimate parent of Invesco and a global investment management firm); Trustee, The Invesco Funds; Vice Chair, Investment Company Institute; and Member of Executive Board, SMU Cox School of Business Formerly: Advisor to the Board, Invesco Advisers, Inc. (formerly known as Invesco Institutional (N.A.), Inc.); Chairman and Chief Executive Officer, Invesco Advisers, Inc. (registered investment adviser); Director, Chairman, Chief Executive Officer and President, Invesco Holding Company (US), Inc. (formerly IVZ Inc.) (holding company), Invesco Group Services, Inc. (service provider) and Invesco North American Holdings, Inc. (holding company); Director, Chief Executive Officer and President, Invesco Holding Company Limited (parent of Invesco and a global investment management firm); Director, Invesco Ltd.; Chairman, Investment Company Institute and President, Co-Chief Executive Officer, Co-President, Chief Operating Officer and Chief Financial Officer, Franklin Resources, Inc. (global investment management organization) | | 158 | | None |
Philip A. Taylor2 — 1954 Trustee and Senior Vice President | | 2006 | | Head of the Americas and Senior Managing Director, Invesco Ltd.; Director, Invesco Advisers, Inc. (formerly known as Invesco Institutional (N.A.), Inc.) (registered investment adviser); Director, Chairman, Chief Executive Officer and President, Invesco Management Group, Inc. (formerly known as Invesco Aim Management Group, Inc.) (financial services holding company); Director and Chairman, Invesco Investment Services, Inc. (formerly known as Invesco Aim Investment Services, Inc.) (registered transfer agent); Chief Executive Officer, Invesco Corporate Class Inc. (corporate mutual fund company); Director, Chairman and Chief Executive Officer, Invesco Canada Ltd. (formerly known as Invesco Trimark Ltd./Invesco Trimark Ltèe) (registered investment adviser and registered transfer agent); Trustee and Senior Vice President, The Invesco Funds; Director, Invesco Investment Advisers LLC (formerly known as Van Kampen Asset Management). Formerly: Co-Chairman, Co-President and Co-Chief Executive Officer, Invesco Advisers, Inc. (formerly known as Invesco Institutional (N.A.), Inc.) (registered investment adviser); Director, Chief Executive Officer and President, Van Kampen Exchange Corp; President and Principal Executive Officer, The Invesco Funds (other than AIM Treasurer’s Series Trust (Invesco Treasurer’s Series Trust), Short-Term Investments Trust and Invesco Management Trust); Executive Vice President, The Invesco Funds (AIM Treasurer’s Series Trust (Invesco Treasurer’s Series Trust), Short-Term Investments Trust and Invesco Management Trust only); Director and President, INVESCO Funds Group, Inc. (registered investment adviser and registered transfer agent); Director and Chairman, IVZ Distributors, Inc. (formerly known as INVESCO Distributors, Inc.) (registered broker dealer); Director, President and Chairman, Invesco Inc. (holding company), Invesco Canada Holdings Inc. (holding company), Trimark Investments Ltd./Placements Trimark Ltèe and Invesco Financial Services Ltd/Services Financiers Invesco Ltèe; Chief Executive Officer, Invesco Canada Fund Inc. (corporate mutual fund company); Director and Chairman, Van Kampen Investor Services Inc.; Director, Chief Executive Officer and President, 1371 Preferred Inc. (holding company) and Van Kampen Investments Inc.; Director and President, AIM GP Canada Inc. (general partner for limited partnerships) and Van Kampen Advisors, Inc.; Director and Chief Executive Officer, Invesco Trimark Dealer Inc. (registered broker dealer); Director, Invesco Distributors, Inc. (formerly known as Invesco Aim Distributors, Inc.) (registered broker dealer); Manager, Invesco PowerShares Capital Management LLC; Director, Chief Executive Officer and President, Invesco Advisers, Inc.; Director, Chairman, Chief Executive Officer and President, Invesco Aim Capital Management, Inc.; President, Invesco Trimark Dealer Inc. and Invesco Trimark Ltd./Invesco Trimark Ltèe; Director and President, AIM Trimark Corporate Class Inc. and AIM Trimark Canada Fund Inc.; Senior Managing Director, Invesco Holding Company Limited; Director and Chairman, Fund Management Company (former registered broker dealer); President and Principal Executive Officer, The Invesco Funds (AIM Treasurer’s Series Trust (Invesco Treasurer’s Series Trust), and Short-Term Investments Trust only); President, AIM Trimark Global Fund Inc. and AIM Trimark Canada Fund Inc. | | 158 | | None |
| 1 | Mr. Flanagan is considered an interested person (within the meaning of Section 2(a)(19) of the 1940 Act) of the Trust because he is an officer of the Adviser to the Trust, and an officer and a director of Invesco Ltd., ultimate parent of the Adviser. |
| 2 | Mr. Taylor is considered an interested person (within the meaning of Section 2(a)(19) of the 1940 Act) of the Trust because he is an officer and a director of the Adviser. |
Invesco V.I. American Franchise Fund
Trustees and Officers—(continued)
| | | | | | | | |
Name, Year of Birth and
Position(s) Held with the Trust | | Trustee and/
or Officer Since | | Principal Occupation(s)
During Past 5 Years | | Number of
Funds in Fund
Complex
Overseen by
Trustee | | Other Directorship(s)
Held by Trustee During
Past 5 Years |
| Independent Trustees | | | | | | | | |
Bruce L. Crockett — 1944 Trustee and Chair | | 1993 | | Chairman, Crockett Technologies Associates (technology consulting company) Formerly: Director, Captaris (unified messaging provider); Director, President and Chief Executive Officer, COMSAT Corporation; Chairman, Board of Governors of INTELSAT (international communications company); ACE Limited (insurance company); Independent Directors Council and Investment Company Institute: Member of the Audit Committee, Investment Company Institute; Member of the Executive Committee and Chair of the Governance Committee, Independent Directors Council | | 158 | | Director and Chairman of the Audit Committee, ALPS (Attorneys Liability Protection Society) (insurance company); Director and Member of the Audit Committee and Compensation Committee, Ferroglobe PLC (metallurgical company) |
David C. Arch — 1945 Trustee | | 2010 | | Chairman of Blistex Inc. (consumer health care products manufacturer); Member, World Presidents’ Organization | | 158 | | Board member of the Illinois Manufacturers’ Association |
Jack M. Fields — 1952 Trustee | | 1997 | | Chief Executive Officer, Twenty First Century Group, Inc. (government affairs company); and Chairman, Discovery Learning Alliance (non-profit) Formerly: Owner and Chief Executive Officer, Dos Angeles Ranch L.P. (cattle, hunting, corporate entertainment); Director, Insperity, Inc. (formerly known as Administaff) (human resources provider); Chief Executive Officer, Texana Timber LP (sustainable forestry company); Director of Cross Timbers Quail Research Ranch (non-profit); and member of the U.S. House of Representatives | | 158 | | None |
Cynthia Hostetler — 1962 Trustee | | 2017 | | Non-Executive Director and Trustee of a number of public and private business corporations Formerly: Head of Investment Funds and Private Equity, Overseas Private Investment Corporation; President, First Manhattan Bancorporation, Inc.; Attorney, Simpson Thacher & Bartlett LLP | | 158 | | Vulcan Materials Company (construction materials company); Trilinc Global Impact Fund; Aberdeen Investment Funds (4 portfolios); Artio Global Investment LLC (mutual fund complex); Edgen Group, Inc. (specialized energy and infrastructure products distributor) |
Eli Jones — 1961 Trustee | | 2016 | | Professor and Dean, Mays Business School — Texas A&M University Formerly: Professor and Dean, Walton College of Business, University of Arkansas and E.J. Ourso College of Business, Louisiana State University; Director, Arvest Bank | | 158 | | Insperity, Inc. (formerly known as Administaff) (human resources provider) |
Prema Mathai-Davis — 1950 Trustee | | 1998 | | Retired. | | 158 | | None |
Teresa M. Ressel — 1962 Trustee | | 2017 | | Non-executive director and trustee of a number of public and private business corporations Formerly: Chief Financial Officer, Olayan America, The Olayan Group (international investor/commercial/industrial); Chief Executive Officer, UBS Securities LLC; Group Chief Operating Officer, Americas, UBS AG; Assistant Secretary for Management & Budget and CFO, US Department of the Treasury | | 158 | | Atlantic Power Corporation (power generation company); ON Semiconductor Corp. (semiconductor supplier) |
Ann Barnett Stern — 1957 Trustee | | 2017 | | President and Chief Executive Officer, Houston Endowment Inc. (private philanthropic institution) Formerly: Executive Vice President and General Counsel, Texas Children’s Hospital; Attorney, Beck, Redden and Secrest, LLP; Business Law Instructor, University of St. Thomas; Attorney, Andrews & Kurth LLP | | 158 | | Federal Reserve Bank of Dallas |
Raymond Stickel, Jr. — 1944 Trustee | | 2005 | | Retired. Formerly: Director, Mainstay VP Series Funds, Inc. (25 portfolios); Partner, Deloitte & Touche | | 158 | | None |
Robert C. Troccoli — 1949 Trustee | | 2016 | | Adjunct Professor, University of Denver — Daniels College of Business Formerly: Senior Partner, KPMG LLP | | 158 | | None |
Christopher L. Wilson — 1957 Trustee | | 2017 | | Non-executive director and trustee of a number of public and private business corporations Formerly: Managing Partner, CT2, LLC (investing and consulting firm); President/Chief Executive Officer, Columbia Funds, Bank of America Corporation; President/Chief Executive Officer, CDC IXIS Asset Management Services, Inc.; Principal & Director of Operations, Scudder Funds, Scudder, Stevens & Clark, Inc.; Assistant Vice President, Fidelity Investments | | 158 | | TD Asset Management USA Inc. (mutual fund complex) (22 portfolios); ISO New England, Inc. (non-profit organization managing regional electricity market) |
Invesco V.I. American Franchise Fund
Trustees and Officers—(continued)
| | | | | | | | |
Name, Year of Birth and
Position(s) Held with the Trust | | Trustee and/
or Officer Since | | Principal Occupation(s)
During Past 5 Years | | Number of
Funds in Fund
Complex
Overseen by
Trustee | | Other Directorship(s)
Held by Trustee During
Past 5 Years |
| Other Officers | | | | | | | | |
Sheri Morris — 1964 President, Principal Executive Officer and Treasurer | | 1999 | | President, Principal Executive Officer and Treasurer, The Invesco Funds; Vice President, Invesco Advisers, Inc. (formerly known as Invesco Institutional (N.A.), Inc.) (registered investment adviser); and Vice President, PowerShares Exchange-Traded Fund Trust, PowerShares Exchange-Traded Fund Trust II, PowerShares India Exchange-Traded Fund Trust, PowerShares Actively Managed Exchange-Traded Fund Trust, PowerShares Actively Managed Exchange-Traded Commodity Fund Trust and PowerShares Exchange-Traded Self-Indexed Fund Trust Formerly: Vice President and Principal Financial Officer, The Invesco Funds; Vice President, Invesco Aim Advisers, Inc., Invesco Aim Capital Management, Inc. and Invesco Aim Private Asset Management, Inc.; Assistant Vice President and Assistant Treasurer, The Invesco Funds and Assistant Vice President, Invesco Advisers, Inc., Invesco Aim Capital Management, Inc. and Invesco Aim Private Asset Management, Inc.; and Treasurer, PowerShares Exchange-Traded Fund Trust, PowerShares Exchange-Traded Fund Trust II, PowerShares India Exchange-Traded Fund Trust and PowerShares Actively Managed Exchange-Traded Fund Trust | | N/A | | N/A |
Russell C. Burk — 1958 Senior Vice President and Senior Officer | | 2005 | | Senior Vice President and Senior Officer, The Invesco Funds | | N/A | | N/A |
John M. Zerr — 1962 Senior Vice President, Chief Legal Officer and Secretary | | 2006 | | Director, Senior Vice President, Secretary and General Counsel, Invesco Management Group, Inc. (formerly known as Invesco AIM Management Group, Inc.); Senior Vice President, Invesco Advisers, Inc. (formerly known as Invesco Institutional (N.A.), Inc.) (registered investment adviser); Senior Vice President and Secretary, Invesco Distributors, Inc. (formerly known as Invesco AIM Distributors, Inc.); Director, Vice President and Secretary, Invesco Investment Services, Inc. (formerly known as Invesco AIM Investment Services, Inc.) Senior Vice President, Chief Legal Officer and Secretary, The Invesco Funds; Managing Director, Invesco PowerShares Capital Management LLC; Director, Secretary and General Counsel, Invesco Investment Advisers LLC (formerly known as Van Kampen Asset Management); Secretary and General Counsel, Invesco Capital Markets, Inc. (formerly known as Van Kampen Funds Inc.) and Chief Legal Officer, PowerShares Exchange-Traded Fund Trust, PowerShares Exchange-Traded Fund Trust II, PowerShares India Exchange-Traded Fund Trust, PowerShares Actively Managed Exchange-Traded Fund Trust, PowerShares Actively Managed Exchange-Traded Commodity Fund Trust and PowerShares Exchange-Traded Self-Indexed Fund Trust; Manager and Secretary, Invesco Indexing LLC Formerly: Director, Secretary, General Counsel and Senior Vice President, Van Kampen Exchange Corp.; Director, Vice President and Secretary, IVZ Distributors, Inc. (formerly known as INVESCO Distributors, Inc.); Director and Vice President, INVESCO Funds Group, Inc.; Director and Vice President, Van Kampen Advisors Inc.; Director, Vice President, Secretary and General Counsel, Van Kampen Investor Services Inc.; Director, Invesco Distributors, Inc. (formerly known as Invesco AIM Distributors, Inc.); Director, Senior Vice President, General Counsel and Secretary, Invesco AIM Advisers, Inc. and Van Kampen Investments Inc.; Director, Vice President and Secretary, Fund Management Company; Director, Senior Vice President, Secretary, General Counsel and Vice President, Invesco AIM Capital Management, Inc.; Chief Operating Officer and General Counsel, Liberty Ridge Capital, Inc. (an investment adviser); Vice President and Secretary, PBHG Funds (an investment company) and PBHG Insurance Series Fund (an investment company); Chief Operating Officer, General Counsel and Secretary, Old Mutual Investment Partners (a broker-dealer); General Counsel and Secretary, Old Mutual Fund Services (an administrator) and Old Mutual Shareholder Services (a shareholder servicing center); Executive Vice President, General Counsel and Secretary, Old Mutual Capital, Inc. (an investment adviser); and Vice President and Secretary, Old Mutual Advisors Funds (an investment company) | | N/A | | N/A |
Gregory G. McGreevey — 1962 Senior Vice President | | 2012 | | Senior Managing Director, Invesco Ltd.; Director, Chairman, President, and Chief Executive Officer, Invesco Advisers, Inc. (formerly known as Invesco Institutional (N.A.), Inc.) (registered investment adviser); Senior Vice President, Invesco Management Group, Inc.; Director, Invesco Mortgage Capital, Inc. and Invesco Senior Secured Management, Inc.; and Senior Vice President, The Invesco Funds Formerly: Assistant Vice President, The Invesco Funds | | N/A | | N/A |
Kelli Gallegos — 1970 Vice President, Principal Financial Officer and Assistant Treasurer | | 2008 | | Vice President, Principal Financial Officer and Assistant Treasurer, The Invesco Funds; Assistant Treasurer, Invesco PowerShares Capital Management LLC, PowerShares Exchange-Traded Fund Trust, PowerShares Exchange-Traded Fund Trust II, PowerShares India Exchange-Traded Fund Trust, PowerShares Actively Managed Exchange-Traded Fund Trust, PowerShares Actively Managed Exchange-Traded Commodity Fund Trust and PowerShares Exchange-Traded Self-Indexed Fund Trust Formerly: Assistant Vice President, The Invesco Funds | | N/A | | N/A |
Invesco V.I. American Franchise Fund
Trustees and Officers—(continued)
| | | | | | | | |
Name, Year of Birth and
Position(s) Held with the Trust | | Trustee and/
or Officer Since | | Principal Occupation(s)
During Past 5 Years | | Number of
Funds in Fund
Complex
Overseen by
Trustee | | Other Directorship(s)
Held by Trustee During
Past 5 Years |
| Other Officers—(continued) | | | | | | | | |
Tracy Sullivan — 1962 Vice President, Chief Tax Officer and Assistant Treasurer | | 2008 | | Vice President, Chief Tax Officer and Assistant Treasurer, The Invesco Funds; Assistant Treasurer, Invesco PowerShares Capital Management LLC, PowerShares Exchange-Traded Fund Trust, PowerShares Exchange-Traded Fund Trust II, PowerShares India Exchange-Traded Fund Trust, PowerShares Actively Managed Exchange-Traded Fund Trust, PowerShares Actively Managed Exchange-Traded Commodity Fund Trust and PowerShares Exchange-Traded Self-Indexed Fund Trust Formerly: Assistant Vice President, The Invesco Funds | | N/A | | N/A |
Crissie M. Wisdom — 1969 Anti-Money Laundering Compliance Officer | | 2013 | | Anti-Money Laundering Compliance Officer, Invesco Advisers, Inc. (formerly known as Invesco Institutional (N.A.), Inc.) (registered investment adviser), Invesco Capital Markets, Inc. (formerly known as Van Kampen Funds Inc.), Invesco Distributors, Inc., Invesco Investment Services, Inc., Invesco Management Group, Inc., The Invesco Funds, and PowerShares Exchange-Traded Fund Trust, PowerShares Exchange-Traded Fund Trust II, PowerShares India Exchange-Traded Fund Trust, PowerShares Actively Managed Exchange-Traded Fund Trust, PowerShares Actively Managed Exchange-Traded Commodity Fund Trust and PowerShares Exchange-Traded Self-Indexed Fund Trust; Anti-Money Laundering Compliance Officer and Bank Secrecy Act Officer, INVESCO National Trust Company and Invesco Trust Company; and Fraud Prevention Manager and Controls and Risk Analysis Manager for Invesco Investment Services, Inc. Formerly: Anti-Money Laundering Compliance Officer, Van Kampen Exchange Corp. | | N/A | | N/A |
Robert R. Leveille — 1969 Chief Compliance Officer | | 2016 | | Chief Compliance Officer, Invesco Advisers, Inc. (registered investment adviser); and Chief Compliance Officer, The Invesco Funds Formerly: Chief Compliance Officer, Putnam Investments and the Putnam Funds | | N/A | | N/A |
The Statement of Additional Information of the Trust includes additional information about the Fund’s Trustees and is available upon request, without charge, by calling 1.800.959.4246. Please refer to the Fund’s Statement of Additional Information for information on the Fund’s sub-advisers.
| | | | | | |
Office of the Fund 11 Greenway Plaza, Suite 1000 Houston, TX 77046-1173 | | Investment Adviser Invesco Advisers, Inc. 1555 Peachtree Street, N.E. Atlanta, GA 30309 | | Distributor Invesco Distributors, Inc. 11 Greenway Plaza, Suite 1000 Houston, TX 77046-1173 | | Auditors PricewaterhouseCoopers LLP 1000 Louisiana Street, Suite 5800 Houston, TX 77002-5678 |
| | | |
| | | | | | |
Counsel to the Fund Stradley Ronon Stevens & Young, LLP 2005 Market Street, Suite 2600 Philadelphia, PA 19103-7018 | | Counsel to the Independent Trustees Goodwin Procter LLP 901 New York Avenue, N.W. Washington, D.C. 20001 | | Transfer Agent Invesco Investment Services, Inc. 11 Greenway Plaza, Suite 1000 Houston, TX 77046-1173 | | Custodian State Street Bank and Trust Company 225 Franklin Street Boston, MA 02110-2801 |
Invesco V.I. American Franchise Fund
| | | | |
| | |
 | | Annual Report to Shareholders | | December 31, 2017 |
| | Invesco V.I. American Value Fund |

| | | | |
| | The Fund provides a complete list of its holdings four times in each fiscal year, at the quarter-ends. For the second and fourth quarters, the lists appear in the Fund’s semiannual and annual reports to shareholders. For the first and third quarters, the Fund files the lists with the Securities and Exchange Commission (SEC) on Form N-Q. The Fund’s Form N-Q filings are available on the SEC website, sec.gov. Copies of the Fund’s Forms N-Q may be reviewed and copied at the SEC Public Reference Room in Washington, D.C. You can obtain information on the operation of the Public Reference Room, including information about duplicating fee charges, by calling 202 551 8090 or 800 732 0330, or by electronic request at the following email address: publicinfo@sec.gov. The SEC file numbers for the Fund are 811-07452 and 033-57340. The Fund’s most recent portfolio holdings, as filed on Form N-Q, have also been made available to insurance companies issuing variable annuity contracts and variable life insurance policies (“variable products”) that invest in the Fund. A description of the policies and procedures that the Fund uses to determine how to vote proxies relating to portfolio securities is available without charge, upon request, from our Client Services department at 800 959 4246 or at invesco.com/proxyguidelines. The information is also available on the SEC website, sec.gov. Information regarding how the Fund voted proxies related to its portfolio securities during the most recent 12-month period ended June 30 is available at invesco.com/ proxysearch. The information is also available on the SEC website, sec.gov. Invesco Advisers, Inc. is an investment adviser; it provides investment advisory services to individual and institutional clients and does not sell securities. Invesco Distributors, Inc. is the US distributor for Invesco Ltd.’s retail mutual funds, exchange-traded funds and institutional money market funds. Both are wholly owned, indirect subsidiaries of Invesco Ltd. This report must be accompanied or preceded by a currently effective Fund prospectus and variable product prospectus, which contain more complete information, including sales charges and expenses. Investors should read each carefully before investing. |
| | NOT FDIC INSURED | MAY LOSE VALUE | NO BANK GUARANTEE |
| | Invesco Distributors, Inc. | | VK-VIAMVA-AR-1 02072018 1226 |
Management’s Discussion of Fund Performance
| | | | |
Performance summary For the year ended December 31, 2017, Series I shares of Invesco V.I. American Value Fund (the Fund) underperformed the Russell Midcap Value Index, the Fund’s style-specific benchmark. Your Fund’s long-term performance appears later in this report. | |
Fund vs. Indexes | | | | |
Total returns, 12/31/16 to 12/31/17, excluding variable product issuer charges. If variable product issuer charges were included, returns would be lower. | |
Series I Shares | | | 9.96 | % |
Series II Shares | | | 9.68 | |
S&P 500 Indexq (Broad Market Index) | | | 21.83 | |
Russell Midcap Value Indexq (Style-Specific Index) | | | 13.34 | |
Lipper VUF Mid Cap Value Funds Index∎ (Peer Group Index) | | | 13.26 | |
Source(s): qFactSet Research Systems Inc.; ∎Lipper Inc. | | | | |
Market conditions and your Fund
Despite highly destructive hurricanes that threatened to derail a years-long economic recovery, the US economy continued to expand throughout the year ended December 31, 2017. Gross domestic product – the value of all goods and services produced in the US – expanded in the first three quarters of 2017. Inflation remained subdued even as unemployment continued its multiyear decline.
Given signs of an improving economy, the US Federal Reserve (the Fed) raised interest rates three times during the reporting period, most recently in December 2017; each rate hike was 25 basis points.1 (A basis point is 0.01%.) The Fed pledged that “realized and expected economic conditions relative to its objectives of maximum employment and 2 percent inflation” will guide its future actions. At the close of the reporting period, Fed policy remained accommodative, and the fed funds target rate stood at a range of 1.25% to 1.50% – 75 basis points higher than at the start of the reporting period.1
Higher inventories and a worsening outlook caused oil prices and many energy stocks to decline during the first half of 2017. However, oil prices rose signifi-
cantly in the second half of the reporting period as expectations for lower supplies increased, partly due to continued OPEC production cuts, and demand began normalizing.
Major US stock market indexes repeatedly hit all-time highs throughout the reporting period. The stock market rally that began after the 2016 presidential election continued throughout the reporting period, fueled by generally positive economic data, strong corporate earnings and improved consumer confidence. Finally, after much debate in Congress, a tax reform bill was signed into law in December 2017. While its enactment further strengthened stocks, its effect on the US economy remained uncertain.
Within the Russell Midcap Value Index, the information technology (IT) and materials sectors had the highest returns, while telecommunication services and energy were the only sectors with losses for the reporting period.
Stock selection in the industrials sector was the largest detractor from the Fund’s returns relative to its style-specific index. Key detractors within the sector included Babcock & Wilcox and Fluor Corporation. Babcock & Wilcox sold off sharply in
August after reporting a significant loss due to project charges in its renewables segment, as well as execution issues that squeezed margins in its industrials business. Fluor reported weaker-than-anticipated earnings due to significant cost overruns, and the company lowered its earnings guidance for the rest of its fiscal year. We sold these holdings during the reporting period.
Stock selection in the IT sector also detracted from the Fund’s performance relative to the Fund’s style-specific benchmark. The Fund’s lack of exposure to the semiconductor industry detracted from relative returns. Additionally, the Fund’s holdings in the hardware and equipment industry, particularly Diebold and Ciena, hurt relative performance. During the reporting period, Diebold cut its earnings outlook for the full year of 2017 and suggested that an increase in incremental demand for ATMs may take longer in the future than previously anticipated. Ciena’s shares traded lower following the release of the company’s fiscal fourth quarter results, which were somewhat mixed with weaker earnings and gross margins, but higher revenues.
Stock selection in the utilities sector was another detractor from Fund performance relative to the Fund’s style-specific index during the reporting period. This was due in part to the Fund’s lack of exposure to some of the stronger-performing names within the sector. In addition, the Fund’s holding in Edison International hurt relative performance. Fall wildfires in the company’s Southern California service area presented significant potential liabilities, as state law can hold utilities liable for property damages if the company’s equipment is blamed for starting or adding to the fire.
The Fund’s only holding in the consumer staples sector, Conagra Brands, was also a large detractor during the reporting period, as the company reported de-
| | | | | | | | | | | | |
Portfolio Composition | |
By sector | | | % of total net assets | | | | | |
Financials | | | | | | | 29.0% | | | | | |
Industrials | | | | | | | 12.2 | | | | | |
Information Technology | | | | | | | 11.0 | | | | | |
Consumer Discretionary | | | | | | | 10.3 | | | | | |
Energy | | | | | | | 10.1 | | | | | |
Health Care | | | | | | | 8.9 | | | | | |
Real Estate | | | | | | | 6.4 | | | | | |
Materials | | | | | | | 5.8 | | | | | |
Utilities | | | | | | | 4.1 | | | | | |
Money Market Funds | | | | | | | | | | | | |
Plus Other Assets Less
Liabilities | | | | 2.2 | | | | | |
| | | | | | | | |
| | Top 10 Equity Holdings* | |
| | | | % of total net assets | |
| | 1. | | | KeyCorp | | | 3.6% | |
| | 2. | | | Voya Financial Inc. | | | 3.6 | |
| | 3. | | | Devon Energy Corp. | | | 3.5 | |
| | 4. | | | Comerica | | | 3.5 | |
| | 5. | | | Stifel Financial Corp. | | | 3.3 | |
| | 6. | | | Royal Caribbean Cruises Ltd. | | | 3.3 | |
| | 7. | | | Zions Bancorp. | | | 3.3 | |
| | 8. | | | Mylan N.V. | | | 3.1 | |
| | 9. | | | Keysight Technologies, Inc. | | | 3.1 | |
| | 10. | | | Eastman Chemical Co. | | | 3.0 | |
| | | | | | |
| Total Net Assets | | $ | 399.1 million | |
| | | | | | |
Total Number of Holdings* | | | 42 | |
The Fund’s holdings are subject to change, and there is no assurance that the Fund will continue to hold any particular security.
*Excluding money market fund holdings.
Data presented here are as of December 31, 2017.
Invesco V.I. American Value Fund
clining sales in a number of its key product segments. We sold our position in the company during the reporting period.
Stock selection in the consumer discretionary sector also detracted from the Fund’s returns relative to the style-specific benchmark. The largest detractor within the sector was Advance Auto Parts. During the reporting period, the auto parts retailer reported disappointing first quarter results due to a decline in comparable sales and operating margins.
Despite being an overall detractor from Fund returns, the consumer discretionary sector also included the Fund’s top individual contributor to Fund performance, Royal Caribbean. The cruise operator reported solid earnings and strong bookings, and the company raised its outlook for the full year as demand for cruise travel continued to increase.
Overweight exposure to and stock selection in the financials sector was the largest contributor to Fund performance relative to the style-specific index for the reporting period. Key contributors in the sector included Comerica, Willis Towers Watson and Voya Financial. Financials got a boost when the Fed issued a better-than-expected report of its Comprehensive Capital Analysis and Review, which gave a positive view of the financial strength of US banks. Financial stocks also benefited from the Fed’s series of interest rate increases in 2017.
Overweight exposure to and stock selection in the health care sector was another strong contributor to the Fund’s relative return, due in part to AmerisourceBergen, a pharmaceutical services company. During the reporting period, the company reported better-than-expected earnings and increased its outlook for 2017.
Stock selection in and the Fund’s underweight allocation to the energy, real estate and telecommunication services sectors also helped Fund performance relative to the style-specific benchmark during the year.
During the reporting period, we increased our exposure to the financials, consumer discretionary and energy sectors and decreased exposure to the IT, industrials, consumer staples and telecommunication services sectors. At the end of the year, our largest overweight allocations relative to the style-specific index were in the financials, IT and health care sectors, while the largest underweight allocations were in the real estate, utilities and consumer staples sectors.
Equity markets finished 2017 with very strong gains, and many indexes reached
record highs. However, we expect that market volatility may return in 2018 given potential for slowing economic growth, higher interest rates and gridlock in Washington leading up to the mid-term elections. We believe market volatility creates opportunities to invest in companies with attractive valuations and strong fundamentals. We believe that ultimately those valuations and fundamentals will be re-flected in those companies’ stock prices.
As always, we are committed to working to achieve positive returns for the Fund’s shareholders through an entire market cycle. Thank you for your continued investment in Invesco V.I. American Value Fund.
1 Source: US Federal Reserve
The views and opinions expressed in management’s discussion of Fund performance are those of Invesco Advisers, Inc. These views and opinions are subject to change at any time based on factors such as market and economic conditions. These views and opinions may not be relied upon as investment advice or recommendations, or as an offer for a particular security. The information is not a complete analysis of every aspect of any market, country, industry, security or the Fund. Statements of fact are from sources considered reliable, but Invesco Advisers, Inc. makes no representation or warranty as to their completeness or accuracy. Although historical performance is no guarantee of future results, these insights may help you understand our investment management philosophy.
See important Fund and, if applicable, index disclosures later in this report.
| | |
 | | Thomas Copper Chartered Financial Analyst, Portfolio Manager, is co-lead manager of Invesco V.I. |
| American Value Fund. He joined Invesco in 2010. Mr. Copper earned a BA in economics and political science from Tulane University and an MBA from Baylor University. |
| | |
 | | Jeffrey Vancavage Chartered Financial Analyst, Portfolio Manager, is co-lead manager of Invesco V.I. |
| American Value Fund. He joined Invesco in 2016. Mr. Vancavage earned a BS in aeronautical science from Embry-Riddle University and an MBA from the University of Florida. |
| | |
 | | Sergio Marcheli Portfolio Manager, is manager of Invesco V.I. American Value Fund. He joined Invesco in |
| 2010. Mr. Marcheli earned a BBA from the University of Houston and an MBA from the University of St. Thomas. |
Invesco V.I. American Value Fund
Your Fund’s Long-Term Performance
Results of a $10,000 Investment – Oldest Share Class(es)
Fund and index data from 12/31/07
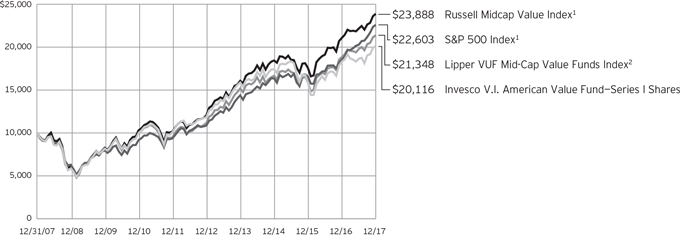
1 Source: FactSet Research Systems Inc.
2 Source: Lipper Inc.
Past performance cannot guarantee
comparable future results.
| | | | |
Average Annual Total Returns | |
As of 12/31/17 | | | | |
Series I Shares | | | | |
Inception (1/2/97) | | | 9.88% | |
10 Years | | | 7.24 | |
5 Years | | | 11.20 | |
1 Year | | | 9.96 | |
Series II Shares | | | | |
Inception (5/5/03) | | | 10.58% | |
10 Years | | | 7.04 | |
5 Years | | | 10.93 | |
1 Year | | | 9.68 | |
Effective June 1, 2010, Class I and Class II shares of the predecessor fund, Universal Institutional Funds Mid Cap Value Portfolio, advised by Morgan Stanley Investment Management Inc. were reorganized into Series I and Series II shares, respectively, of Invesco Van Kampen V.I. Mid Cap Value Fund (renamed Invesco V.I. American Value Fund on April 29, 2013). Returns shown above, prior to June 1, 2010, for Series I and Series II shares are blended returns of the predecessor fund and Invesco V.I. American Value Fund. Share class returns will differ from the predecessor fund because of different expenses.
The performance data quoted represent past performance and cannot guarantee comparable future
results; current performance may be lower or higher. Please contact your variable product issuer or financial adviser for the most recent month-end variable product performance. Performance figures reflect Fund expenses, reinvested distributions and changes in net asset value. Investment return and principal value will fluctuate so that you may have a gain or loss when you sell shares.
The total annual Fund operating expense ratio set forth in the most recent Fund prospectus as of the date of this report for Series I and Series II shares was 1.00% and 1.25%, respectively. The expense ratios presented above may vary from the expense ratios presented in other sections of this report that are based on expenses incurred during the period covered by this report.
Invesco V.I. American Value Fund, a series portfolio of AIM Variable Insurance Funds (Invesco Variable Insurance Funds), is currently offered through insurance companies issuing variable products. You cannot purchase shares of the Fund directly. Performance figures given represent the Fund and are not intended to reflect actual variable product values. They do not reflect sales charges, expenses and
fees assessed in connection with a variable product. Sales charges, expenses and fees, which are determined by the variable product issuers, will vary and will lower the total return.
The most recent month-end performance at the Fund level, excluding variable product charges, is available at 800 451 4246. As mentioned above, for the most recent month-end performance including variable product charges, please contact your variable product issuer or financial adviser.
Fund performance reflects any applicable fee waivers and/or expense reimbursements. Had the adviser not waived fees and/or reimbursed expenses currently or in the past, returns would have been lower. See current prospectus for more information.
Invesco V.I. American Value Fund
Invesco V.I. American Value Fund’s investment objective is to provide above-average total return over a market cycle of three to five years by investing in common stocks and other equity securities.
| ∎ | Unless otherwise stated, information presented in this report is as of December 31, 2017, and is based on total net assets. |
| ∎ | Unless otherwise noted, all data provided by Invesco. |
Principal risks of investing in the Fund
Depositary receipts risk. Investing in depositary receipts involves the same risks as direct investments in foreign securities. In addition, the underlying issuers of certain depositary receipts are under no obligation to distribute shareholder communications or pass through any voting rights with respect to the deposited securities to the holders of such receipts. The Fund may therefore receive less timely information or have less control than if it invested directly in the foreign issuer.
Derivatives risk. The value of a derivative instrument depends largely on (and is derived from) the value of an underlying security, currency, commodity, interest rate, index or other asset (each referred to as an underlying asset). In addition to risks relating to the underlying assets, the use of derivatives may include other, possibly greater, risks, including counterparty, leverage and liquidity risks. Counterparty risk is the risk that the counterparty to the derivative contract will default on its obligation to pay the Fund the amount owed or otherwise perform under the derivative contract. Derivatives create leverage risk because they do not require payment up front equal to the economic exposure created by owning the derivative. As a result, an adverse change in the value of the underlying asset could result in the Fund sustaining a loss that is substantially greater than the amount invested in the derivative, which may make the Fund’s returns more volatile and increase the risk of loss. Derivative instruments may also be less liquid than more traditional investments and the Fund may be unable to sell or close out its derivative positions at a desirable time or price. This risk may be more acute under adverse market conditions, during which the Fund may be most in need of liquidating its derivative positions. Derivatives may also be harder to value, less tax efficient and subject to changing government regulation that could impact the Fund’s ability to use certain derivatives or their cost. Also, derivatives used for hedging or to gain or limit exposure to a particular market segment may not provide the expected benefits, particularly during adverse market conditions.
Foreign securities risk. The Fund’s foreign investments may be adversely affected by political and social instability, changes in economic or taxation policies, difficulty in enforcing obligations, decreased liquidity or increased volatility. Foreign investments also involve the risk of the possible seizure, nationalization or expropriation of the issuer or foreign deposits (in which the Fund could lose its entire investments in a certain market) and the possible adoption of foreign governmental restrictions such as exchange controls. Unless the Fund has hedged its foreign securities risk, foreign securities risk also involves the risk of negative foreign currency rate fluctuations, which may cause the value of securities denominated in such foreign currency (or other instruments through which the Fund has exposure to foreign currencies) to decline in value. Currency exchange rates may fluctuate significantly over short periods of time. Currency hedging strategies, if used, are not always successful.
Management risk. The Fund is actively managed and depends heavily on the Adviser’s judgment about markets, interest rates or the attractiveness, relative values, liquidity, or potential appreciation of particular investments made for the Fund’s portfolio. The Fund could experience losses if these judgments prove to be incorrect. Additionally, legislative, regulatory, or tax developments may adversely affect management of the Fund and, therefore, the ability of the Fund to achieve its investment objective.
Market risk. The market values of the Fund’s investments, and therefore the value of the Fund’s shares, will go up and down, sometimes rapidly or unpredictably. Market risk may affect a single issuer, industry or section of the economy, or it may affect the market as a whole. Individual stock prices tend to go up and down more dramatically than those of certain other types of investments, such as bonds. During a general downturn in the financial markets, multiple asset classes may decline in value. When markets perform well, there can be no assurance that specific investments held by the Fund will rise in value.
REIT risk/real estate risk. Investments in real estate related instruments may be affected by economic, legal, cultural, environmental or technological factors that
affect property values, rents or occupancies of real estate related to the Fund’s holdings. Shares of real estate related companies, which tend to be small- and mid-cap companies, may be more volatile and less liquid.
Small- and mid-capitalization companies risks. Small- and mid-capitalization companies tend to be more vulnerable to changing market conditions, may have little or no operating history or track record of success, and may have more limited product lines and markets, less experienced management and fewer financial resources than larger companies. These companies’ securities may be more volatile and less liquid than those of more established companies, and their returns may vary, sometimes significantly, from the overall securities market.
Value investing style risk. A value investing style subjects the Fund to the risk that the valuations never improve or that the returns on value equity securities are less than returns on other styles of investing or the overall stock market.
About indexes used in this report
The S&P 500® Index is an unmanaged index considered representative of the US stock market.
The Russell Midcap® Value Index is an unmanaged index considered representative of mid-cap value stocks. The Russell Midcap Value Index is a trademark/service mark of the Frank Russell Co. Russell® is a trademark of the Frank Russell Co.
The Lipper VUF Mid Cap Value Funds Index is an unmanaged index considered representative of mid-cap value variable insurance underlying funds tracked by Lipper.
The Fund is not managed to track the performance of any particular index, including the index(es) described here, and consequently, the performance of the Fund may deviate significantly from the performance of the index(es).
A direct investment cannot be made in an index. Unless otherwise indicated, index results include reinvested dividends, and they do not reflect sales charges. Performance of the peer group, if applicable, reflects fund expenses; performance of a market index does not.
Invesco V.I. American Value Fund
Other information
The returns shown in management’s discussion of Fund performance are based on net asset values calculated for shareholder transactions. Generally accepted accounting principles require adjustments to be made to the net assets of the Fund at period end for financial reporting purposes, and as such, the net asset values for shareholder transactions and the returns based on those net asset values may differ from the net asset values and returns reported in the Financial Highlights. Additionally, the returns and net asset values shown throughout this report are at the Fund level only and do not include variable product issuer charges. If such charges were included, the total returns would be lower.
Industry classifications used in this report are generally according to the Global Industry Classification Standard, which was developed by and is the exclusive property and a service mark of MSCI Inc. and Standard & Poor’s.
Invesco V.I. American Value Fund
Schedule of Investments(a)
December 31, 2017
| | | | | | | | |
| | | Shares | | | Value | |
Common Stocks & Other Equity Interests–97.84% | |
| Aerospace & Defense–2.02% | |
Textron Inc. | | | 142,177 | | | $ | 8,045,796 | |
|
| Apparel, Accessories & Luxury Goods–4.38% | |
Hanesbrands, Inc. | | | 424,228 | | | | 8,870,608 | |
Tapestry, Inc. | | | 194,244 | | | | 8,591,412 | |
| | | | | | | | 17,462,020 | |
|
| Automotive Retail–2.10% | |
Advance Auto Parts, Inc. | | | 84,018 | | | | 8,375,754 | |
|
| Building Products–2.10% | |
Johnson Controls International PLC | | | 219,776 | | | | 8,375,663 | |
|
| Communications Equipment–4.61% | |
ARRIS International PLC(b) | | | 298,393 | | | | 7,665,716 | |
Ciena Corp.(b) | | | 511,945 | | | | 10,715,009 | |
| | | | | | | | 18,380,725 | |
|
| Consumer Finance–1.02% | |
Santander Consumer USA Holdings Inc. | | | 217,837 | | | | 4,056,125 | |
|
| Diversified Chemicals–3.02% | |
Eastman Chemical Co. | | | 130,158 | | | | 12,057,837 | |
|
| Diversified REIT’s–4.30% | |
Forest City Realty Trust, Inc.–Class A | | | 360,336 | | | | 8,684,097 | |
Liberty Property Trust | | | 197,274 | | | | 8,484,755 | |
| | | | | | | | 17,168,852 | |
|
| Electric Utilities–4.09% | |
Edison International | | | 112,303 | | | | 7,102,042 | |
FirstEnergy Corp. | | | 300,985 | | | | 9,216,160 | |
| | | | | | | | 16,318,202 | |
|
| Electronic Equipment & Instruments–3.07% | |
Keysight Technologies, Inc.(b) | | | 294,898 | | | | 12,267,757 | |
|
| Health Care Distributors–2.45% | |
AmerisourceBergen Corp. | | | 106,556 | | | | 9,783,972 | |
|
| Health Care Facilities–2.02% | |
HealthSouth Corp. | | | 163,130 | | | | 8,060,253 | |
|
| Health Care Services–1.32% | |
DaVita Inc.(b) | | | 72,760 | | | | 5,256,910 | |
|
| Hotels, Resorts & Cruise Lines–3.32% | |
Royal Caribbean Cruises Ltd. | | | 111,003 | | | | 13,240,438 | |
|
| Industrial Machinery–2.11% | |
Flowserve Corp. | | | 200,179 | | | | 8,433,541 | |
|
| Insurance Brokers–5.34% | |
Arthur J. Gallagher & Co. | | | 159,164 | | | | 10,071,898 | |
Willis Towers Watson PLC | | | 74,719 | | | | 11,259,406 | |
| | | | | | | | 21,331,304 | |
| | | | | | | | |
| | | Shares | | | Value | |
|
| Investment Banking & Brokerage–3.34% | |
Stifel Financial Corp. | | | 223,992 | | | $ | 13,340,964 | |
|
| IT Consulting & Other Services–1.97% | |
Teradata Corp.(b) | | | 204,506 | | | | 7,865,301 | |
|
| Marine–2.03% | |
Kirby Corp.(b) | | | 121,295 | | | | 8,102,506 | |
|
| Movies & Entertainment–0.51% | |
Regal Entertainment Group–Class A | | | 87,874 | | | | 2,021,981 | |
|
| Oil & Gas Equipment & Services–2.62% | |
TechnipFMC PLC (United Kingdom) | | | 334,213 | | | | 10,464,209 | |
|
| Oil & Gas Exploration & Production–6.13% | |
Devon Energy Corp. | | | 340,464 | | | | 14,095,210 | |
Marathon Oil Corp. | | | 611,470 | | | | 10,352,187 | |
| | | | | | | | 24,447,397 | |
|
| Oil & Gas Storage & Transportation–1.39% | |
Plains GP Holdings LP–Class A(b) | | | 252,189 | | | | 5,535,549 | |
|
| Other Diversified Financial Services–3.55% | |
Voya Financial, Inc. | | | 286,722 | | | | 14,184,137 | |
|
| Paper Packaging–0.93% | |
Bemis Co., Inc. | | | 77,755 | | | | 3,715,911 | |
|
| Pharmaceuticals–3.08% | |
Mylan N.V.(b) | | | 290,316 | | | | 12,283,270 | |
|
| Regional Banks–15.78% | |
Comerica Inc. | | | 158,839 | | | | 13,788,814 | |
First Horizon National Corp. | | | 581,355 | | | | 11,621,286 | |
KeyCorp | | | 716,150 | | | | 14,444,745 | |
Wintrust Financial Corp. | | | 122,753 | | | | 10,111,165 | |
Zions Bancorp. | | | 255,813 | | | | 13,002,975 | |
| | | | | | | | 62,968,985 | |
|
| Research & Consulting Services–1.70% | |
Dun & Bradstreet Corp. (The) | | | 57,359 | | | | 6,791,879 | |
|
| Specialized REIT’s–2.11% | |
Life Storage, Inc. | | | 94,767 | | | | 8,440,897 | |
|
| Specialty Chemicals–1.85% | |
W.R. Grace & Co. | | | 105,489 | | | | 7,397,944 | |
|
| Technology Hardware, Storage & Peripherals–1.36% | |
Diebold Nixdorf, Inc. | | | 333,083 | | | | 5,445,907 | |
|
| Trucking–2.22% | |
Ryder System, Inc. | | | 105,456 | | | | 8,876,232 | |
Total Common Stocks & Other Equity Interests
(Cost $327,731,549) | | | | 390,498,218 | |
See accompanying Notes to Financial Statements which are an integral part of the financial statements.
Invesco V.I. American Value Fund
| | | | | | | | |
| | | Shares | | | Value | |
Money Market Funds–2.04% | |
Invesco Government & Agency Portfolio–Institutional Class,
1.18%(c) | | | 3,946,601 | | | $ | 3,946,601 | |
Invesco Liquid Assets Portfolio–Institutional Class, 1.40%(c) | | | 2,818,353 | | | | 2,818,634 | |
Invesco Treasury Portfolio–Institutional Class, 1.17%(c) | | | 1,375,265 | | | | 1,375,265 | |
Total Money Market Funds
(Cost $8,140,657) | | | | 8,140,500 | |
TOTAL INVESTMENTS IN SECURITIES–99.88%
(Cost $335,872,206) | | | | 398,638,718 | |
OTHER ASSETS LESS LIABILITIES–0.12% | | | | 468,930 | |
NET ASSETS–100.00% | | | $ | 399,107,648 | |
Investment Abbreviations:
| | |
| REIT | | – Real Estate Investment Trust |
Notes to Schedule of Investments:
| (a) | Industry and/or sector classifications used in this report are generally according to the Global Industry Classification Standard, which was developed by and is the exclusive property and a service mark of MSCI Inc. and Standard & Poor’s. |
| (b) | Non-income producing security. |
| (c) | The money market fund and the Fund are affiliated by having the same investment adviser. The rate shown is the 7-day SEC standardized yield as of December 31, 2017. |
See accompanying Notes to Financial Statements which are an integral part of the financial statements.
Invesco V.I. American Value Fund
Statement of Assets and Liabilities
December 31, 2017
Statement of Operations
For the year ended December 31, 2017
| | | | |
Assets: | | | | |
Investments in securities, at value (Cost $327,731,549) | | $ | 390,498,218 | |
Investments in affiliated money market funds, at value (Cost $8,140,657) | | | 8,140,500 | |
Receivable for: | | | | |
Investments sold | | | 592,258 | |
Fund shares sold | | | 27,346 | |
Dividends | | | 626,269 | |
Investment for trustee deferred compensation and retirement plans | | | 57,510 | |
Total assets | | | 399,942,101 | |
| |
Liabilities: | | | | |
Payable for: | | | | |
Investments purchased | | | 218,886 | |
Fund shares reacquired | | | 180,564 | |
Accrued fees to affiliates | | | 331,380 | |
Accrued trustees’ and officers’ fees and benefits | | | 733 | |
Accrued other operating expenses | | | 36,680 | |
Trustee deferred compensation and retirement plans | | | 66,210 | |
Total liabilities | | | 834,453 | |
Net assets applicable to shares outstanding | | $ | 399,107,648 | |
| |
Net assets consist of: | | | | |
Shares of beneficial interest | | $ | 294,169,960 | |
Undistributed net investment income | | | 870,117 | |
Undistributed net realized gain | | | 41,301,059 | |
Net unrealized appreciation | | | 62,766,512 | |
| | | $ | 399,107,648 | |
| |
Net Assets: | | | | |
Series I | | $ | 104,509,903 | |
Series II | | $ | 294,597,745 | |
|
Shares outstanding, no par value,
with an unlimited number of shares authorized: | |
Series I | | | 5,687,578 | |
Series II | | | 16,191,852 | |
Series I: | | | | |
Net asset value per share | | $ | 18.38 | |
Series II: | | | | |
Net asset value per share | | $ | 18.19 | |
| | | | |
Investment income: | | | | |
Dividends | | $ | 5,409,319 | |
Dividends from affiliated money market funds | | | 99,096 | |
Total investment income | | | 5,508,415 | |
| |
Expenses: | | | | |
Advisory fees | | | 2,792,231 | |
Administrative services fees | | | 675,526 | |
Custodian fees | | | 21,461 | |
Distribution fees — Series II | | | 701,420 | |
Transfer agent fees | | | 28,142 | |
Trustees’ and officers’ fees and benefits | | | 26,240 | |
Reports to shareholders | | | 48,376 | |
Professional services fees | | | 43,535 | |
Other | | | 5,374 | |
Total expenses | | | 4,342,305 | |
Less: Fees waived | | | (14,950 | ) |
Net expenses | | | 4,327,355 | |
Net investment income | | | 1,181,060 | |
| |
Realized and unrealized gain (loss) from: | | | | |
Net realized gain from: | | | | |
Investment securities | | | 43,347,130 | |
Foreign currencies | | | 3,424 | |
| | | | 43,350,554 | |
Change in net unrealized appreciation (depreciation) of: | | | | |
Investment securities | | | (9,439,026 | ) |
Foreign currencies | | | 587 | |
| | | | (9,438,439 | ) |
Net realized and unrealized gain | | | 33,912,115 | |
Net increase in net assets resulting from operations | | $ | 35,093,175 | |
See accompanying Notes to Financial Statements which are an integral part of the financial statements.
Invesco V.I. American Value Fund
Statement of Changes in Net Assets
For the years ended December 31, 2017 and 2016
| | | | | | | | |
| | | 2017 | | | 2016 | |
Operations: | | | | | | | | |
Net investment income | | $ | 1,181,060 | | | $ | 2,431,847 | |
Net realized gain | | | 43,350,554 | | | | 4,201,151 | |
Change in net unrealized appreciation (depreciation) | | | (9,438,439 | ) | | | 46,182,088 | |
Net increase in net assets resulting from operations | | | 35,093,175 | | | | 52,815,086 | |
| | |
Distributions to shareholders from net investment income: | | | | | | | | |
Series I | | | (854,814 | ) | | | (412,019 | ) |
Series ll | | | (1,557,213 | ) | | | (301,616 | ) |
Total distributions from net investment income | | | (2,412,027 | ) | | | (713,635 | ) |
| | |
Distributions to shareholders from net realized gains: | | | | | | | | |
Series l | | | (1,223,615 | ) | | | (6,365,699 | ) |
Series ll | | | (3,080,153 | ) | | | (14,638,628 | ) |
Total distributions from net realized gains | | | (4,303,768 | ) | | | (21,004,327 | ) |
| | |
Share transactions–net: | | | | | | | | |
Series l | | | (20,241,160 | ) | | | (19,286,477 | ) |
Series ll | | | (9,832,937 | ) | | | 52,953,285 | |
Net increase (decrease) in net assets resulting from share transactions | | | (30,074,097 | ) | | | 33,666,808 | |
Net increase (decrease) in net assets | | | (1,696,717 | ) | | | 64,763,932 | |
| | |
Net assets: | | | | | | | | |
Beginning of year | | | 400,804,365 | | | | 336,040,433 | |
End of year (includes undistributed net investment income of $870,117 and $2,350,923, respectively) | | $ | 399,107,648 | | | $ | 400,804,365 | |
Notes to Financial Statements
December 31, 2017
NOTE 1—Significant Accounting Policies
Invesco V.I. American Value Fund (the “Fund”) is a series portfolio of AIM Variable Insurance Funds (Invesco Variable Insurance Funds) (the “Trust”). The Trust is a Delaware statutory trust registered under the Investment Company Act of 1940, as amended (the “1940 Act”), as an open-end series management investment company consisting of twenty-four separate portfolios, (each constituting a “Fund”). The assets, liabilities and operations of each portfolio are accounted for separately. Information presented in these financial statements pertains only to the Fund. Matters affecting each Fund or class will be voted on exclusively by the shareholders of such Fund or class. Current Securities and Exchange Commission (“SEC”) guidance, however, requires participating insurance companies offering separate accounts to vote shares proportionally in accordance with the instructions of the contract owners whose investments are funded by shares of each Fund or class.
The Fund’s investment objective is to provide above-average total return over a market cycle of three to five years by investing in common stocks and other equity securities.
The Fund currently offers two classes of shares, Series I and Series II, both of which are offered to insurance company separate accounts funding variable annuity contracts and variable life insurance policies (“variable products”).
The Fund is an investment company and accordingly follows the investment company accounting and reporting guidance in accordance with Financial Accounting Standards Board Accounting Standards Codification Topic 946, Financial Services — Investment Companies.
The following is a summary of the significant accounting policies followed by the Fund in the preparation of its financial statements.
| A. | Security Valuations — Securities, including restricted securities, are valued according to the following policy. |
A security listed or traded on an exchange (except convertible securities) is valued at its last sales price or official closing price as of the close of the customary trading session on the exchange where the security is principally traded, or lacking any sales or official closing price on a particular day, the security may be valued at the closing bid price on that day. Securities traded in the over-the-counter market are valued based on prices furnished by independent pricing services or market makers. When such securities are valued by an independent pricing service they may be considered fair valued. Futures contracts are valued at the final settlement price set by an exchange on which they are principally traded. Listed options are valued at the mean between the last bid and asked prices from the exchange on which they are principally traded. Options not listed on an exchange are valued by an independent source at the mean between the last bid and asked prices. For purposes of determining net asset value (“NAV”) per share, futures and option contracts generally are valued 15 minutes after the close of the customary trading session of the New York Stock Exchange (“NYSE”).
Investments in open-end and closed-end registered investment companies that do not trade on an exchange are valued at the end-of-day net asset value per share. Investments in open-end and closed-end registered investment companies that trade on an exchange are valued at the last sales price or official closing price as of the close of the customary trading session on the exchange where the security is principally traded.
Invesco V.I. American Value Fund
Debt obligations (including convertible securities) and unlisted equities are fair valued using an evaluated quote provided by an independent pricing service. Evaluated quotes provided by the pricing service may be determined without exclusive reliance on quoted prices, and may reflect appropriate factors such as institution-size trading in similar groups of securities, developments related to specific securities, dividend rate (for unlisted equities), yield (for debt obligations), quality, type of issue, coupon rate (for debt obligations), maturity (for debt obligations), individual trading characteristics and other market data. Pricing services generally value debt obligations assuming orderly transactions of institutional round lot size, but a fund may hold or transact in the same securities in smaller, odd lot sizes. Odd lots often trade at lower prices than institutional round lots. Debt obligations are subject to interest rate and credit risks. In addition, all debt obligations involve some risk of default with respect to interest and/or principal payments.
Foreign securities’ (including foreign exchange contracts) prices are converted into U.S. dollar amounts using the applicable exchange rates as of the close of the NYSE. If market quotations are available and reliable for foreign exchange-traded equity securities, the securities will be valued at the market quotations. Because trading hours for certain foreign securities end before the close of the NYSE, closing market quotations may become unreliable. If between the time trading ends on a particular security and the close of the customary trading session on the NYSE, events occur that the investment adviser determines are significant and make the closing price unreliable, the Fund may fair value the security. If the event is likely to have affected the closing price of the security, the security will be valued at fair value in good faith using procedures approved by the Board of Trustees. Adjustments to closing prices to reflect fair value may also be based on a screening process of an independent pricing service to indicate the degree of certainty, based on historical data, that the closing price in the principal market where a foreign security trades is not the current value as of the close of the NYSE. Foreign securities’ prices meeting the approved degree of certainty that the price is not reflective of current value will be priced at the indication of fair value from the independent pricing service. Multiple factors may be considered by the independent pricing service in determining adjustments to reflect fair value and may include information relating to sector indices, American Depositary Receipts and domestic and foreign index futures. Foreign securities may have additional risks including exchange rate changes, potential for sharply devalued currencies and high inflation, political and economic upheaval, the relative lack of issuer information, relatively low market liquidity and the potential lack of strict financial and accounting controls and standards.
Securities for which market prices are not provided by any of the above methods may be valued based upon quotes furnished by independent sources. The last bid price may be used to value equity securities. The mean between the last bid and asked prices is used to value debt obligations, including corporate loans.
Securities for which market quotations are not readily available or became unreliable are valued at fair value as determined in good faith by or under the supervision of the Trust’s officers following procedures approved by the Board of Trustees. Issuer specific events, market trends, bid/asked quotes of brokers and information providers and other market data may be reviewed in the course of making a good faith determination of a security’s fair value.
The Fund may invest in securities that are subject to interest rate risk, meaning the risk that the prices will generally fall as interest rates rise and, conversely, the prices will generally rise as interest rates fall. Specific securities differ in their sensitivity to changes in interest rates depending on their individual characteristics. Changes in interest rates may result in increased market volatility, which may affect the value and/or liquidity of certain Fund investments.
Valuations change in response to many factors including the historical and prospective earnings of the issuer, the value of the issuer’s assets, general economic conditions, interest rates, investor perceptions and market liquidity. Because of the inherent uncertainties of valuation, the values reflected in the financial statements may materially differ from the value received upon actual sale of those investments.
| B. | Securities Transactions and Investment Income — Securities transactions are accounted for on a trade date basis. Realized gains or losses on sales are computed on the basis of specific identification of the securities sold. Interest income (net of withholding tax, if any) is recorded on the accrual basis from settlement date. Dividend income (net of withholding tax, if any) is recorded on the ex-dividend date. |
The Fund may periodically participate in litigation related to Fund investments. As such, the Fund may receive proceeds from litigation settlements. Any proceeds received are included in the Statement of Operations as realized gain (loss) for investments no longer held and as unrealized gain (loss) for investments still held.
Brokerage commissions and mark ups are considered transaction costs and are recorded as an increase to the cost basis of securities purchased and/or a reduction of proceeds on a sale of securities. Such transaction costs are included in the determination of net realized and unrealized gain (loss) from investment securities reported in the Statement of Operations and the Statement of Changes in Net Assets and the net realized and unrealized gains (losses) on securities per share in the Financial Highlights. Transaction costs are included in the calculation of the Fund’s net asset value and, accordingly, they reduce the Fund’s total returns. These transaction costs are not considered operating expenses and are not reflected in net investment income reported in the Statement of Operations and the Statement of Changes in Net Assets, or the net investment income per share and the ratios of expenses and net investment income reported in the Financial Highlights, nor are they limited by any expense limitation arrangements between the Fund and the investment adviser.
The Fund allocates income and realized and unrealized capital gains and losses to a class based on the relative net assets of each class.
| C. | Distributions — Distributions from net investment income and net realized capital gain, if any, are generally declared and paid to separate accounts of participating insurance companies annually and recorded on the ex-dividend date. |
| D. | Federal Income Taxes — The Fund intends to comply with the requirements of Subchapter M of the Internal Revenue Code of 1986, as amended (the “Internal Revenue Code”), necessary to qualify as a regulated investment company and to distribute substantially all of the Fund’s taxable earnings to shareholders. As such, the Fund will not be subject to federal income taxes on otherwise taxable income (including net realized capital gain) that is distributed to shareholders. Therefore, no provision for federal income taxes is recorded in the financial statements. |
The Fund recognizes the tax benefits of uncertain tax positions only when the position is more likely than not to be sustained. Management has analyzed the Fund’s uncertain tax positions and concluded that no liability for unrecognized tax benefits should be recorded related to uncertain tax positions. Management is not aware of any tax positions for which it is reasonably possible that the total amounts of unrecognized tax benefits will change materially in the next 12 months.
The Fund files tax returns in the U.S. Federal jurisdiction and certain other jurisdictions. Generally, the Fund is subject to examinations by such taxing authorities for up to three years after the filing of the return for the tax period.
Invesco V.I. American Value Fund
| E. | Country Determination — For the purposes of making investment selection decisions and presentation in the Schedule of Investments, the investment adviser may determine the country in which an issuer is located and/or credit risk exposure based on various factors. These factors include the laws of the country under which the issuer is organized, where the issuer maintains a principal office, the country in which the issuer derives 50% or more of its total revenues and the country that has the primary market for the issuer’s securities, as well as other criteria. Among the other criteria that may be evaluated for making this determination are the country in which the issuer maintains 50% or more of its assets, the type of security, financial guarantees and enhancements, the nature of the collateral and the sponsor organization. Country of issuer and/or credit risk exposure has been determined to be the United States of America, unless otherwise noted. |
| F. | Expenses — Fees provided for under the Rule 12b-1 plan of a particular class of the Fund and which are directly attributable to that class are charged to the operations of such class. All other expenses are allocated among the classes based on relative net assets. |
| G. | Accounting Estimates — The preparation of financial statements in conformity with accounting principles generally accepted in the United States of America (“GAAP”) requires management to make estimates and assumptions that affect the reported amounts of assets and liabilities at the date of the financial statements and the reported amounts of revenues and expenses during the reporting period including estimates and assumptions related to taxation. Actual results could differ from those estimates by a significant amount. In addition, the Fund monitors for material events or transactions that may occur or become known after the period-end date and before the date the financial statements are released to print. |
| H. | Indemnifications — Under the Trust’s organizational documents, each Trustee, officer, employee or other agent of the Trust is indemnified against certain liabilities that may arise out of the performance of their duties to the Fund. Additionally, in the normal course of business, the Fund enters into contracts, including the Fund’s servicing agreements, that contain a variety of indemnification clauses. The Fund’s maximum exposure under these arrangements is unknown as this would involve future claims that may be made against the Fund that have not yet occurred. The risk of material loss as a result of such indemnification claims is considered remote. |
| I. | Foreign Currency Translations — Foreign currency is valued at the close of the NYSE based on quotations posted by banks and major currency dealers. Portfolio securities and other assets and liabilities denominated in foreign currencies are translated into U.S. dollar amounts at date of valuation. Purchases and sales of portfolio securities (net of foreign taxes withheld on disposition) and income items denominated in foreign currencies are translated into U.S. dollar amounts on the respective dates of such transactions. The Fund does not separately account for the portion of the results of operations resulting from changes in foreign exchange rates on investments and the fluctuations arising from changes in market prices of securities held. The combined results of changes in foreign exchange rates and the fluctuation of market prices on investments (net of estimated foreign tax withholding) are included with the net realized and unrealized gain or loss from investments in the Statement of Operations. Reported net realized foreign currency gains or losses arise from (1) sales of foreign currencies, (2) currency gains or losses realized between the trade and settlement dates on securities transactions, and (3) the difference between the amounts of dividends, interest, and foreign withholding taxes recorded on the Fund’s books and the U.S. dollar equivalent of the amounts actually received or paid. Net unrealized foreign currency gains and losses arise from changes in the fair values of assets and liabilities, other than investments in securities at fiscal period end, resulting from changes in exchange rates. |
The Fund may invest in foreign securities, which may be subject to foreign taxes on income, gains on investments or currency repatriation, a portion of which may be recoverable. Foreign taxes, if any, are recorded based on the tax regulations and rates that exist in the foreign markets in which the Fund invests and are shown in the Statement of Operations.
| J. | Forward Foreign Currency Contracts — The Fund may engage in foreign currency transactions either on a spot (i.e. for prompt delivery and settlement) basis, or through forward foreign currency contracts, to manage or minimize currency or exchange rate risk. |
The Fund may also enter into forward foreign currency contracts for the purchase or sale of a security denominated in a foreign currency in order to “lock in” the U.S. dollar price of that security, or the Fund may also enter into forward foreign currency contracts that do not provide for physical settlement of the two currencies, but instead are settled by a single cash payment calculated as the difference between the agreed upon exchange rate and the spot rate at settlement based upon an agreed upon notional amount (non-deliverable forwards). The Fund will set aside liquid assets in an amount equal to the daily mark-to-market obligation for forward foreign currency contracts.
A forward foreign currency contract is an obligation between two parties (“Counterparties”) to purchase or sell a specific currency for an agreed-upon price at a future date. The use of forward foreign currency contracts does not eliminate fluctuations in the price of the underlying securities the Fund owns or intends to acquire but establishes a rate of exchange in advance. Fluctuations in the value of these contracts are measured by the difference in the contract date and reporting date exchange rates and are recorded as unrealized appreciation (depreciation) until the contracts are closed. When the contracts are closed, realized gains (losses) are recorded. Realized and unrealized gains (losses) on the contracts are included in the Statement of Operations. The primary risks associated with forward foreign currency contracts include failure of the Counterparty to meet the terms of the contract and the value of the foreign currency changing unfavorably. These risks may be in excess of the amounts reflected in the Statement of Assets and Liabilities.
NOTE 2—Advisory Fees and Other Fees Paid to Affiliates
The Trust has entered into a master investment advisory agreement with Invesco Advisers, Inc. (the “Adviser” or “Invesco”). Under the terms of the investment advisory agreement, the Fund accrues daily and pays monthly an advisory fee to the Adviser based on the annual rate of the Fund’s average daily net assets as follows:
| | | | |
| Average Daily Net Assets | | Rate | |
First $1 billion | | | 0.72% | |
Over $1 billion | | | 0.65% | |
For the year ended December 31, 2017, the effective advisory fees incurred by the Fund was 0.72%.
Under the terms of a master sub-advisory agreement between the Adviser and each of Invesco Asset Management Deutschland GmbH, Invesco Asset Management Limited, Invesco Asset Management (Japan) Limited, Invesco Hong Kong Limited, Invesco Senior Secured Management, Inc. and Invesco Canada Ltd. and separate sub-advisory agreements with Invesco PowerShares Capital Management LLC and Invesco Asset Management (India)
Invesco V.I. American Value Fund
Private Limited (collectively, the “Affiliated Sub-Advisers”) the Adviser, not the Fund, will pay 40% of the fees paid to the Adviser to any such Affiliated Sub-Adviser(s) that provide(s) discretionary investment management services to the Fund based on the percentage of assets allocated to such Affiliated Sub-Adviser(s).
The Adviser has contractually agreed, through at least June 30, 2018, to waive advisory fees and/or reimburse expenses of all shares to the extent necessary to limit total annual fund operating expenses after fee waiver and/or expense reimbursement (excluding certain items discussed below) of Series I shares to 2.00% and Series II shares to 2.25% of average daily net assets (the “expense limits”). In determining the Adviser’s obligation to waive advisory fees and/or reimburse expenses, the following expenses are not taken into account, and could cause the total annual operating expenses after fee waiver and/or expense reimbursement to exceed the numbers reflected above: (1) interest; (2) taxes; (3) dividend expense on short sales; (4) extraordinary or non-routine items, including litigation expenses; and (5) expenses that the Fund has incurred but did not actually pay because of an expense offset arrangement. Unless Invesco continues the fee waiver agreement, it will terminate on June 30, 2018. During its term, the fee waiver agreement cannot be terminated or amended to increase the expense limits or reduce the advisory fee waiver without approval of the Board of Trustees. The Adviser did not waive fees and/or reimburse expenses during the period under these expense limits.
Further, the Adviser has contractually agreed, through at least June 30, 2019, to waive the advisory fee payable by the Fund in an amount equal to 100% of the net advisory fees the Adviser receives from the affiliated money market funds on investments by the Fund of uninvested cash in such affiliated money market funds.
For the year ended December 31, 2017, the Adviser waived advisory fees of $14,950.
The Trust has entered into a master administrative services agreement with Invesco pursuant to which the Fund has agreed to pay Invesco a fee for costs incurred in providing accounting services and fund administrative services to the Fund and to reimburse Invesco for fees paid to insurance companies that have agreed to provide certain administrative services to the Fund. These administrative services provided by the insurance companies may include, among other things: maintenance of master accounts with the Fund; tracking, recording and transmitting net purchase and redemption orders for Fund shares; maintaining and preserving records related to the purchase, redemption and other account activity of variable product owners; distributing copies of Fund documents such as prospectuses, proxy materials and periodic reports, to variable product owners, and responding to inquiries from variable product owners about the Fund. Pursuant to such agreement, for the year ended December 31, 2017, Invesco was paid $94,196 for accounting and fund administrative services and was reimbursed $581,330 for fees paid to insurance companies.
The Trust has entered into a transfer agency and service agreement with Invesco Investment Services, Inc. (“IIS”) pursuant to which the Fund has agreed to pay IIS a fee for providing transfer agency and shareholder services to the Fund and reimburse IIS for certain expenses incurred by IIS in the course of providing such services. For the year ended December 31, 2017, expenses incurred under the agreement are shown in the Statement of Operations as Transfer agent fees.
The Trust has entered into a master distribution agreement with Invesco Distributors, Inc. (“IDI”) to serve as the distributor for the Fund. The Trust has adopted a plan pursuant to Rule 12b-1 under the 1940 Act with respect to the Fund’s Series II shares (the “Plan”). The Fund, pursuant to the Plan, pays IDI compensation at the annual rate of 0.25% of the Fund’s average daily net assets of Series II shares. The fees are accrued daily and paid monthly. Of the Plan payments, up to 0.25% of the average daily net assets of the Series II shares may be paid to insurance companies who furnish continuing personal shareholder services to customers who purchase and own Series II shares of the Fund. For the year ended December 31, 2017, expenses incurred under the Plan are detailed in the Statement of Operations as Distribution fees.
For the year ended December 31, 2017, the Fund incurred $12,117 in brokerage commissions with Invesco Capital Markets, Inc., an affiliate of the Adviser and IDI, for portfolio transactions executed on behalf of the Fund.
Certain officers and trustees of the Trust are officers and directors of the Adviser, IIS and/or IDI.
NOTE 3—Additional Valuation Information
GAAP defines fair value as the price that would be received to sell an asset or paid to transfer a liability in an orderly transaction between market participants at the measurement date, under current market conditions. GAAP establishes a hierarchy that prioritizes the inputs to valuation methods, giving the highest priority to readily available unadjusted quoted prices in an active market for identical assets (Level 1) and the lowest priority to significant unobservable inputs (Level 3), generally when market prices are not readily available or are unreliable. Based on the valuation inputs, the securities or other investments are tiered into one of three levels. Changes in valuation methods may result in transfers in or out of an investment’s assigned level:
| | Level 1 — | Prices are determined using quoted prices in an active market for identical assets. |
| | Level 2 — | Prices are determined using other significant observable inputs. Observable inputs are inputs that other market participants may use in pricing a security. These may include quoted prices for similar securities, interest rates, prepayment speeds, credit risk, yield curves, loss severities, default rates, discount rates, volatilities and others. |
| | Level 3 — | Prices are determined using significant unobservable inputs. In situations where quoted prices or observable inputs are unavailable (for example, when there is little or no market activity for an investment at the end of the period), unobservable inputs may be used. Unobservable inputs reflect the Fund’s own assumptions about the factors market participants would use in determining fair value of the securities or instruments and would be based on the best available information. |
As of December 31, 2017 all securities in this Fund were valued based on Level 1 inputs (see the Schedule of Investment for security categories). The level assigned to the securities valuations may not be an indication of the risk or liquidity associated with investing in those securities. Because of the inherent uncertainties of valuation, the values reflected in the financial statements may materially differ from the value received upon actual sale of those investments.
The Fund’s policy is to recognize transfers in and out of the valuation levels as of the end of the reporting period. During the year ended December 31, 2017, there were no material transfers between valuation levels.
Invesco V.I. American Value Fund
NOTE 4—Security Transactions with Affiliated Funds
The Fund is permitted to purchase or sell securities from or to certain other Invesco Funds under specified conditions outlined in procedures adopted by the Board of Trustees of the Trust. The procedures have been designed to ensure that any purchase or sale of securities by the Fund from or to another fund or portfolio that is or could be considered an affiliate by virtue of having a common investment adviser (or affiliated investment advisers), common Trustees and/or common officers complies with Rule 17a-7 of the 1940 Act. Further, as defined under the procedures, each transaction is effected at the current market price. Pursuant to these procedures, for the year ended December 31, 2017, the Fund engaged in securities purchases of $2,145,510.
NOTE 5—Trustees’ and Officers’ Fees and Benefits
Trustees’ and Officers’ Fees and Benefits include amounts accrued by the Fund to pay remuneration to certain Trustees and Officers of the Fund. Trustees have the option to defer compensation payable by the Fund, and Trustees’ and Officers’ Fees and Benefits also include amounts accrued by the Fund to fund such deferred compensation amounts. Those Trustees who defer compensation have the option to select various Invesco Funds in which their deferral accounts shall be deemed to be invested. Finally, certain current Trustees were eligible to participate in a retirement plan that provided for benefits to be paid upon retirement to Trustees over a period of time based on the number of years of service. The Fund may have certain former Trustees who also participate in a retirement plan and receive benefits under such plan. Trustees’ and Officers’ Fees and Benefits include amounts accrued by the Fund to fund such retirement benefits. Obligations under the deferred compensation and retirement plans represent unsecured claims against the general assets of the Fund.
NOTE 6—Cash Balances
The Fund is permitted to temporarily carry a negative or overdrawn balance in its account with State Street Bank and Trust Company, the custodian bank. Such balances, if any at period-end, are shown in the Statement of Assets and Liabilities under the payable caption Amount due custodian. To compensate the custodian bank for such overdrafts, the overdrawn Fund may either (1) leave funds as a compensating balance in the account so the custodian bank can be compensated by earning the additional interest; or (2) compensate by paying the custodian bank at a rate agreed upon by the custodian bank and Invesco, not to exceed the contractually agreed upon rate.
NOTE 7—Distributions to Shareholders and Tax Components of Net Assets
Tax Character of Distributions to Shareholders Paid During the Fiscal Years Ended December 31, 2017 and 2016:
| | | | | | | | |
| | | 2017 | | | 2016 | |
Ordinary income | | $ | 2,412,027 | | | $ | 713,635 | |
Long-term capital gain | | | 4,303,768 | | | | 21,004,327 | |
Total distributions | | $ | 6,715,795 | | | $ | 21,717,962 | |
Tax Components of Net Assets at Period-End:
| | | | |
| | | 2017 | |
Undistributed ordinary income | | $ | 3,905,945 | |
Undistributed long-term gain | | | 41,474,605 | |
Net unrealized appreciation — investments | | | 59,614,105 | |
Temporary book/tax differences | | | (56,967 | ) |
Shares of beneficial interest | | | 294,169,960 | |
Total net assets | | $ | 399,107,648 | |
The difference between book-basis and tax-basis unrealized appreciation (depreciation) is due to differences in the timing of recognition of gains and losses on investments for tax and book purposes. The Fund’s net unrealized appreciation difference is attributable primarily to wash sales.
The temporary book/tax differences are a result of timing differences between book and tax recognition of income and/or expenses. The Fund’s temporary book/tax differences are the result of the trustee deferral of compensation and retirement plan benefits.
Capital loss carryforward is calculated and reported as of a specific date. Results of transactions and other activity after that date may affect the amount of capital loss carryforward actually available for the Fund to utilize. Capital losses generated in years beginning after December 22, 2010 can be carried forward for an unlimited period, whereas previous losses expire in eight tax years. Capital losses with an expiration period may not be used to offset capital gains until all net capital losses without an expiration date have been utilized. Capital loss carryforwards with no expiration date will retain their character as either short-term or long-term capital losses instead of as short-term capital losses as under prior law. The ability to utilize capital loss carryforwards in the future may be limited under the Internal Revenue Code and related regulations based on the results of future transactions.
The Fund does not have a capital loss carryforward as of December 31, 2017.
Invesco V.I. American Value Fund
NOTE 8—Investment Transactions
The aggregate amount of investment securities (other than short-term securities, U.S. Treasury obligations and money market funds, if any) purchased and sold by the Fund during the year ended December 31, 2017 was $212,529,677 and $244,447,582, respectively. Cost of investments, including any derivatives, on a tax basis includes the adjustments for financial reporting purposes as of the most recently completed federal income tax reporting period-end.
| | | | |
| Unrealized Appreciation (Depreciation) of Investments on a Tax Basis | |
Aggregate unrealized appreciation of investments | | $ | 69,365,863 | |
Aggregate unrealized (depreciation) of investments | | | (9,751,758 | ) |
Net unrealized appreciation of investments | | $ | 59,614,105 | |
Cost of investments for tax purposes is $339,024,613.
NOTE 9—Reclassification of Permanent Differences
Primarily as a result of differing book/tax treatment of REIT distributions, on December 31, 2017, undistributed net investment income was decreased by $249,839, undistributed net realized gain was increased by $202,655 and shares of beneficial interest was increased by $47,184. This reclassification had no effect on the net assets of the Fund.
NOTE 10—Share Information
| | | | | | | | | | | | | | | | |
| | | Summary of Share Activity | |
| | | Years ended December 31, | |
| | | 2017(a) | | | 2016 | |
| | | Shares | | | Amount | | | Shares | | | Amount | |
Sold: | | | | | | | | | | | | | | | | |
Series I | | | 303,660 | | | $ | 5,290,582 | | | | 465,190 | | | $ | 7,060,652 | |
Series II | | | 3,186,094 | | | | 54,783,210 | | | | 5,595,826 | | | | 89,247,325 | |
| | | | |
Issued as reinvestment of dividends: | | | | | | | | | | | | | | | | |
Series I | | | 122,260 | | | | 2,078,429 | | | | 427,077 | | | | 6,777,718 | |
Series II | | | 275,215 | | | | 4,637,366 | | | | 949,793 | | | | 14,940,244 | |
| | | | |
Reacquired: | | | | | | | | | | | | | | | | |
Series I | | | (1,582,312 | ) | | | (27,610,171 | ) | | | (2,060,028 | ) | | | (33,124,847 | ) |
Series II | | | (4,078,148 | ) | | | (69,253,513 | ) | | | (3,266,703 | ) | | | (51,234,284 | ) |
Net increase (decrease) in share activity | | | (1,773,231 | ) | | $ | (30,074,097 | ) | | | 2,111,155 | | | $ | 33,666,808 | |
| (a) | There are entities that are record owners of more than 5% of the outstanding shares of the Fund and in the aggregate own 60% of the outstanding shares of the Fund. The Fund and the Fund’s principal underwriter or adviser, are parties to participation agreements with these entities whereby these entities sell units of interest in separate accounts funding variable products that are invested in the Fund. The Fund, Invesco and/or Invesco affiliates may make payments to these entities, which are considered to be related to the Fund, for providing services to the Fund, Invesco and/or Invesco affiliates including but not limited to services such as, securities brokerage, third party record keeping and account servicing and administrative services. The Fund has no knowledge as to whether all or any portion of the shares owned of record by these entities are also owned beneficially. |
Invesco V.I. American Value Fund
NOTE 11—Financial Highlights
The following schedule presents financial highlights for a share of the Fund outstanding throughout the periods indicated.
| | | | | | | | | | | | | | | | | | | | | | | | | | | | | | | | | | | | | | | | | | | | | | | | | | | | | | | | |
| | | Net asset
value,
beginning
of period | | | Net
investment
income(a) | | | Net gains
(losses)
on securities
(both
realized and
unrealized) | | | Total from
investment
operations | | | Dividends
from net
investment
income | | | Distributions
from net
realized
gains | | | Total
distributions | | | Net asset
value, end
of period | | | Total
return(b) | | | Net assets,
end of period
(000’s omitted) | | | Ratio of
expenses
to average
net assets
with fee waivers
and/or expenses
absorbed | | | Ratio of
expenses
to average net
assets without
fee waivers
and/or expenses
absorbed | | | Ratio of net
investment
income
to average
net assets | | | Portfolio
turnover(c) | |
Series I | | | | | | | | | | | | | | | | | | | | | | | | | | | | | | | | | | | | | | | | | | | | | | | | | | | | | | | | |
Year ended 12/31/17 | | $ | 17.06 | | | $ | 0.08 | | | $ | 1.59 | | | $ | 1.67 | | | $ | (0.14 | ) | | $ | (0.21 | ) | | $ | (0.35 | ) | | $ | 18.38 | | | | 9.96 | % | | $ | 104,510 | | | | 0.94 | %(d) | | | 0.94 | %(d) | | | 0.48 | %(d) | | | 56 | % |
Year ended 12/31/16 | | | 15.69 | | | | 0.13 | | | | 2.23 | | | | 2.36 | | | | (0.06 | ) | | | (0.93 | ) | | | (0.99 | ) | | | 17.06 | | | | 15.49 | | | | 116,762 | | | | 0.97 | | | | 0.97 | | | | 0.84 | | | | 50 | |
Year ended 12/31/15 | | | 19.92 | | | | 0.06 | | | | (1.82 | ) | | | (1.76 | ) | | | (0.06 | ) | | | (2.41 | ) | | | (2.47 | ) | | | 15.69 | | | | (9.13 | ) | | | 125,686 | | | | 0.99 | | | | 0.99 | | | | 0.33 | | | | 26 | |
Year ended 12/31/14 | | | 19.89 | | | | 0.07 | | | | 1.78 | | | | 1.85 | | | | (0.10 | ) | | | (1.72 | ) | | | (1.82 | ) | | | 19.92 | | | | 9.75 | | | | 152,938 | | | | 0.99 | | | | 1.00 | | | | 0.32 | | | | 48 | |
Year ended 12/31/13 | | | 14.91 | | | | 0.07 | | | | 5.03 | | | | 5.10 | | | | (0.12 | ) | | | — | | | | (0.12 | ) | | | 19.89 | | | | 34.27 | | | | 156,824 | | | | 0.99 | | | | 1.00 | | | | 0.39 | | | | 42 | |
Series II | | | | | | | | | | | | | | | | | | | | | | | | | | | | | | | | | | | | | | | | | | | | | | | | | | | | | | | | |
Year ended 12/31/17 | | | 16.90 | | | | 0.04 | | | | 1.56 | | | | 1.60 | | | | (0.10 | ) | | | (0.21 | ) | | | (0.31 | ) | | | 18.19 | | | | 9.62 | | | | 294,598 | | | | 1.19 | (d) | | | 1.19 | (d) | | | 0.23 | (d) | | | 56 | |
Year ended 12/31/16 | | | 15.55 | | | | 0.09 | | | | 2.21 | | | | 2.30 | | | | (0.02 | ) | | | (0.93 | ) | | | (0.95 | ) | | | 16.90 | | | | 15.22 | | | | 284,043 | | | | 1.22 | | | | 1.22 | | | | 0.59 | | | | 50 | |
Year ended 12/31/15 | | | 19.75 | | | | 0.02 | | | | (1.80 | ) | | | (1.78 | ) | | | (0.01 | ) | | | (2.41 | ) | | | (2.42 | ) | | | 15.55 | | | | (9.36 | ) | | | 210,354 | | | | 1.24 | | | | 1.24 | | | | 0.08 | | | | 26 | |
Year ended 12/31/14 | | | 19.73 | | | | 0.01 | | | | 1.77 | | | | 1.78 | | | | (0.04 | ) | | | (1.72 | ) | | | (1.76 | ) | | | 19.75 | | | | 9.48 | | | | 270,908 | | | | 1.24 | | | | 1.25 | | | | 0.07 | | | | 48 | |
Year ended 12/31/13 | | | 14.81 | | | | 0.03 | | | | 4.99 | | | | 5.02 | | | | (0.10 | ) | | | — | | | | (0.10 | ) | | | 19.73 | | | | 33.93 | | | | 320,754 | | | | 1.24 | | | | 1.25 | | | | 0.14 | | | | 42 | |
| (a) | Calculated using average shares outstanding. |
| (b) | Includes adjustments in accordance with accounting principles generally accepted in the United States of America and as such, the net asset value for financial reporting purposes and the returns based upon those net asset values may differ from the net asset value and returns for shareholder transactions. Total returns are not annualized for periods less than one year, if applicable, and do not reflect charges assessed in connection with a variable product, which if included would reduce total returns. |
| (c) | Portfolio turnover is calculated at the fund level and is not annualized for periods less than one year, if applicable. |
| (d) | Ratios are based on average daily net assets (000’s omitted) of $107,242 and $280,568 for Series I and Series II shares, respectively. |
Invesco V.I. American Value Fund
Report of Independent Registered Public Accounting Firm
To the Board of Trustees of AIM Variable Insurance Funds (Invesco Variable Insurance Funds)
and Shareholders of Invesco V.I. American Value Fund
Opinion on the Financial Statements
We have audited the accompanying statement of assets and liabilities, including the schedule of investments, of Invesco V.I. American Value Fund (one of the funds constituting AIM Variable Insurance Funds (Invesco Variable Insurance Funds), hereafter referred to as the “Fund”) as of December 31, 2017, the related statement of operations for the year ended December 31, 2017, the statement of changes in net assets for each of the two years in the period ended December 31, 2017, including the related notes, and the financial highlights for each of the five years in the period ended December 31, 2017 (collectively referred to as the “financial statements”). In our opinion, the financial statements present fairly, in all material respects, the financial position of the Fund as of December 31, 2017, the results of its operations for the year then ended, the changes in its net assets for each of the two years in the period ended December 31, 2017 and the financial highlights for each of the five years in the period ended December 31, 2017 in conformity with accounting principles generally accepted in the United States of America.
Basis for Opinion
These financial statements are the responsibility of the Fund’s management. Our responsibility is to express an opinion on the Fund’s financial statements based on our audits. We are a public accounting firm registered with the Public Company Accounting Oversight Board (United States) (“PCAOB”) and are required to be independent with respect to the Fund in accordance with the U.S. federal securities laws and the applicable rules and regulations of the Securities and Exchange Commission and the PCAOB.
We conducted our audits of these financial statements in accordance with the standards of the PCAOB. Those standards require that we plan and perform the audit to obtain reasonable assurance about whether the financial statements are free of material misstatement, whether due to error or fraud.
Our audits included performing procedures to assess the risks of material misstatement of the financial statements, whether due to error or fraud, and performing procedures that respond to those risks. Such procedures included examining, on a test basis, evidence regarding the amounts and disclosures in the financial statements. Our audits also included evaluating the accounting principles used and significant estimates made by management, as well as evaluating the overall presentation of the financial statements. Our procedures included confirmation of securities owned as of December 31, 2017 by correspondence with the custodian, transfer agent and brokers; when replies were not received from brokers, we performed other auditing procedures. We believe that our audits provide a reasonable basis for our opinion.
PricewaterhouseCoopers LLP
Houston, TX
February 14, 2018
We have served as the auditor of one or more of the investment companies in the Invesco/PowerShares group of investment companies since at least 1995. We have not determined the specific year we began serving as auditor.
Invesco V.I. American Value Fund
Calculating your ongoing Fund expenses
Example
As a shareholder of the Fund, you incur ongoing costs, including management fees; distribution and/or service fees (12b-1); and other Fund expenses. This example is intended to help you understand your ongoing costs (in dollars) of investing in the Fund and to compare these costs with ongoing costs of investing in other mutual funds. The example is based on an investment of $1,000 invested at the beginning of the period and held for the entire period July 1, 2017 through December 31, 2017.
The actual and hypothetical expenses in the examples below do not represent the effect of any fees or other expenses assessed in connection with a variable product; if they did, the expenses shown would be higher while the ending account values shown would be lower.
Actual expenses
The table below provides information about actual account values and actual expenses. You may use the information in this table, together with the amount you invested, to estimate the expenses that you paid over the period. Simply divide your account value by $1,000 (for example, an $8,600 account value divided by $1,000 = 8.6), then multiply the result by the number in the table under the heading entitled “Actual Expenses Paid During Period” to estimate the expenses you paid on your account during this period.
Hypothetical example for comparison purposes
The table below also provides information about hypothetical account values and hypothetical expenses based on the Fund’s actual expense ratio and an assumed rate of return of 5% per year before expenses, which is not the Fund’s actual return.
The hypothetical account values and expenses may not be used to estimate the actual ending account balance or expenses you paid for the period. You may use this information to compare the ongoing costs of investing in the Fund and other funds. To do so, compare this 5% hypothetical example with the 5% hypothetical examples that appear in the shareholder reports of the other funds.
Please note that the expenses shown in the table are meant to highlight your ongoing costs. Therefore, the hypothetical information is useful in comparing ongoing costs, and will not help you determine the relative total costs of owning different funds.
| | | | | | | | | | | | | | | | | | | | | | | | |
| Class | | Beginning
Account Value
(07/01/17) | | | ACTUAL | | | HYPOTHETICAL (5% annual return before
expenses) | | | Annualized
Expense
Ratio | |
| | | Ending
Account Value
(12/31/17)1 | | | Expenses
Paid During
Period2 | | | Ending
Account Value
(12/31/17) | | | Expenses
Paid During
Period2 | | |
Series I | | $ | 1,000.00 | | | $ | 1,078.70 | | | $ | 4.87 | | | $ | 1,020.52 | | | $ | 4.74 | | | | 0.93 | % |
Series II | | | 1,000.00 | | | | 1,077.70 | | | | 6.18 | | | | 1,019.26 | | | | 6.01 | | | | 1.18 | |
| 1 | The actual ending account value is based on the actual total return of the Fund for the period July 1, 2017 through December 31, 2017, after actual expenses and will differ from the hypothetical ending account value which is based on the Fund’s expense ratio and a hypothetical annual return of 5% before expenses. |
| 2 | Expenses are equal to the Fund’s annualized expense ratio as indicated above multiplied by the average account value over the period, multiplied by 184/365 to reflect the most recent fiscal half year. |
Invesco V.I. American Value Fund
Tax Information
Form 1099-DIV, Form 1042-S and other year-end tax information provide shareholders with actual calendar year amounts that should be included in their tax returns. Shareholders should consult their tax advisors.
The following distribution information is being provided as required by the Internal Revenue Code or to meet a specific state’s requirement.
The Fund designates the following amounts or, if subsequently determined to be different, the maximum amount allowable for its fiscal year ended December 31, 2017:
| | | | |
Federal and State Income Tax | |
Long-Term Capital Gain Distributions | | $ | 4,303,768 | |
Corporate Dividends Received Deduction* | | | 99.99 | % |
U.S. Treasury Obligations* | | | 0.00 | % |
| | * | The above percentages are based on ordinary income dividends paid to shareholders during the Fund’s fiscal year. |
Invesco V.I. American Value Fund
Trustees and Officers
The address of each trustee and officer is AIM Variable Insurance Funds (Invesco Variable Insurance Funds) (the “Trust”), 11 Greenway Plaza, Suite 1000, Houston, Texas 77046-1173. The trustees serve for the life of the Trust, subject to their earlier death, incapacitation, resignation, retirement or removal as more specifically provided in the Trust’s organizational documents. Each officer serves for a one year term or until their successors are elected and qualified. Column two below includes length of time served with predecessor entities, if any.
| | | | | | | | |
Name, Year of Birth and
Position(s) Held with the Trust | | Trustee and/
or Officer Since | | Principal Occupation(s)
During Past 5 Years | | Number of
Funds in Fund
Complex
Overseen by
Trustee | | Other Directorship(s)
Held by Trustee During
Past 5 Years |
| Interested Persons | | | | | | | | |
Martin L. Flanagan1 — 1960 Trustee | | 2007 | | Executive Director, Chief Executive Officer and President, Invesco Ltd. (ultimate parent of Invesco and a global investment management firm); Trustee, The Invesco Funds; Vice Chair, Investment Company Institute; and Member of Executive Board, SMU Cox School of Business Formerly: Advisor to the Board, Invesco Advisers, Inc. (formerly known as Invesco Institutional (N.A.), Inc.); Chairman and Chief Executive Officer, Invesco Advisers, Inc. (registered investment adviser); Director, Chairman, Chief Executive Officer and President, Invesco Holding Company (US), Inc. (formerly IVZ Inc.) (holding company), Invesco Group Services, Inc. (service provider) and Invesco North American Holdings, Inc. (holding company); Director, Chief Executive Officer and President, Invesco Holding Company Limited (parent of Invesco and a global investment management firm); Director, Invesco Ltd.; Chairman, Investment Company Institute and President, Co-Chief Executive Officer, Co-President, Chief Operating Officer and Chief Financial Officer, Franklin Resources, Inc. (global investment management organization) | | 158 | | None |
Philip A. Taylor2 — 1954 Trustee and Senior Vice President | | 2006 | | Head of the Americas and Senior Managing Director, Invesco Ltd.; Director, Invesco Advisers, Inc. (formerly known as Invesco Institutional (N.A.), Inc.) (registered investment adviser); Director, Chairman, Chief Executive Officer and President, Invesco Management Group, Inc. (formerly known as Invesco Aim Management Group, Inc.) (financial services holding company); Director and Chairman, Invesco Investment Services, Inc. (formerly known as Invesco Aim Investment Services, Inc.) (registered transfer agent); Chief Executive Officer, Invesco Corporate Class Inc. (corporate mutual fund company); Director, Chairman and Chief Executive Officer, Invesco Canada Ltd. (formerly known as Invesco Trimark Ltd./Invesco Trimark Ltèe) (registered investment adviser and registered transfer agent); Trustee and Senior Vice President, The Invesco Funds; Director, Invesco Investment Advisers LLC (formerly known as Van Kampen Asset Management). Formerly: Co-Chairman, Co-President and Co-Chief Executive Officer, Invesco Advisers, Inc. (formerly known as Invesco Institutional (N.A.), Inc.) (registered investment adviser); Director, Chief Executive Officer and President, Van Kampen Exchange Corp; President and Principal Executive Officer, The Invesco Funds (other than AIM Treasurer’s Series Trust (Invesco Treasurer’s Series Trust), Short-Term Investments Trust and Invesco Management Trust); Executive Vice President, The Invesco Funds (AIM Treasurer’s Series Trust (Invesco Treasurer’s Series Trust), Short-Term Investments Trust and Invesco Management Trust only); Director and President, INVESCO Funds Group, Inc. (registered investment adviser and registered transfer agent); Director and Chairman, IVZ Distributors, Inc. (formerly known as INVESCO Distributors, Inc.) (registered broker dealer); Director, President and Chairman, Invesco Inc. (holding company), Invesco Canada Holdings Inc. (holding company), Trimark Investments Ltd./Placements Trimark Ltèe and Invesco Financial Services Ltd/Services Financiers Invesco Ltèe; Chief Executive Officer, Invesco Canada Fund Inc. (corporate mutual fund company); Director and Chairman, Van Kampen Investor Services Inc.; Director, Chief Executive Officer and President, 1371 Preferred Inc. (holding company) and Van Kampen Investments Inc.; Director and President, AIM GP Canada Inc. (general partner for limited partnerships) and Van Kampen Advisors, Inc.; Director and Chief Executive Officer, Invesco Trimark Dealer Inc. (registered broker dealer); Director, Invesco Distributors, Inc. (formerly known as Invesco Aim Distributors, Inc.) (registered broker dealer); Manager, Invesco PowerShares Capital Management LLC; Director, Chief Executive Officer and President, Invesco Advisers, Inc.; Director, Chairman, Chief Executive Officer and President, Invesco Aim Capital Management, Inc.; President, Invesco Trimark Dealer Inc. and Invesco Trimark Ltd./Invesco Trimark Ltèe; Director and President, AIM Trimark Corporate Class Inc. and AIM Trimark Canada Fund Inc.; Senior Managing Director, Invesco Holding Company Limited; Director and Chairman, Fund Management Company (former registered broker dealer); President and Principal Executive Officer, The Invesco Funds (AIM Treasurer’s Series Trust (Invesco Treasurer’s Series Trust), and Short-Term Investments Trust only); President, AIM Trimark Global Fund Inc. and AIM Trimark Canada Fund Inc. | | 158 | | None |
| 1 | Mr. Flanagan is considered an interested person (within the meaning of Section 2(a)(19) of the 1940 Act) of the Trust because he is an officer of the Adviser to the Trust, and an officer and a director of Invesco Ltd., ultimate parent of the Adviser. |
| 2 | Mr. Taylor is considered an interested person (within the meaning of Section 2(a)(19) of the 1940 Act) of the Trust because he is an officer and a director of the Adviser. |
Invesco V.I. American Value Fund
Trustees and Officers—(continued)
| | | | | | | | |
Name, Year of Birth and
Position(s) Held with the Trust | | Trustee and/
or Officer Since | | Principal Occupation(s)
During Past 5 Years | | Number of
Funds in Fund
Complex
Overseen by
Trustee | | Other Directorship(s)
Held by Trustee During
Past 5 Years |
| Independent Trustees | | | | | | | | |
Bruce L. Crockett — 1944 Trustee and Chair | | 1993 | | Chairman, Crockett Technologies Associates (technology consulting company) Formerly: Director, Captaris (unified messaging provider); Director, President and Chief Executive Officer, COMSAT Corporation; Chairman, Board of Governors of INTELSAT (international communications company); ACE Limited (insurance company); Independent Directors Council and Investment Company Institute: Member of the Audit Committee, Investment Company Institute; Member of the Executive Committee and Chair of the Governance Committee, Independent Directors Council | | 158 | | Director and Chairman of the Audit Committee, ALPS (Attorneys Liability Protection Society) (insurance company); Director and Member of the Audit Committee and Compensation Committee, Ferroglobe PLC (metallurgical company) |
David C. Arch — 1945 Trustee | | 2010 | | Chairman of Blistex Inc. (consumer health care products manufacturer); Member, World Presidents’ Organization | | 158 | | Board member of the Illinois Manufacturers’ Association |
Jack M. Fields — 1952 Trustee | | 1997 | | Chief Executive Officer, Twenty First Century Group, Inc. (government affairs company); and Chairman, Discovery Learning Alliance (non-profit) Formerly: Owner and Chief Executive Officer, Dos Angeles Ranch L.P. (cattle, hunting, corporate entertainment); Director, Insperity, Inc. (formerly known as Administaff) (human resources provider); Chief Executive Officer, Texana Timber LP (sustainable forestry company); Director of Cross Timbers Quail Research Ranch (non-profit); and member of the U.S. House of Representatives | | 158 | | None |
Cynthia Hostetler — 1962 Trustee | | 2017 | | Non-Executive Director and Trustee of a number of public and private business corporations Formerly: Head of Investment Funds and Private Equity, Overseas Private Investment Corporation; President, First Manhattan Bancorporation, Inc.; Attorney, Simpson Thacher & Bartlett LLP | | 158 | | Vulcan Materials Company (construction materials company); Trilinc Global Impact Fund; Aberdeen Investment Funds (4 portfolios); Artio Global Investment LLC (mutual fund complex); Edgen Group, Inc. (specialized energy and infrastructure products distributor) |
Eli Jones — 1961 Trustee | | 2016 | | Professor and Dean, Mays Business School — Texas A&M University Formerly: Professor and Dean, Walton College of Business, University of Arkansas and E.J. Ourso College of Business, Louisiana State University; Director, Arvest Bank | | 158 | | Insperity, Inc. (formerly known as Administaff) (human resources provider) |
Prema Mathai-Davis — 1950 Trustee | | 1998 | | Retired. | | 158 | | None |
Teresa M. Ressel — 1962 Trustee | | 2017 | | Non-executive director and trustee of a number of public and private business corporations Formerly: Chief Financial Officer, Olayan America, The Olayan Group (international investor/commercial/industrial); Chief Executive Officer, UBS Securities LLC; Group Chief Operating Officer, Americas, UBS AG; Assistant Secretary for Management & Budget and CFO, US Department of the Treasury | | 158 | | Atlantic Power Corporation (power generation company); ON Semiconductor Corp. (semiconductor supplier) |
Ann Barnett Stern — 1957 Trustee | | 2017 | | President and Chief Executive Officer, Houston Endowment Inc. (private philanthropic institution) Formerly: Executive Vice President and General Counsel, Texas Children’s Hospital; Attorney, Beck, Redden and Secrest, LLP; Business Law Instructor, University of St. Thomas; Attorney, Andrews & Kurth LLP | | 158 | | Federal Reserve Bank of Dallas |
Raymond Stickel, Jr. — 1944 Trustee | | 2005 | | Retired. Formerly: Director, Mainstay VP Series Funds, Inc. (25 portfolios); Partner, Deloitte & Touche | | 158 | | None |
Robert C. Troccoli — 1949 Trustee | | 2016 | | Adjunct Professor, University of Denver — Daniels College of Business Formerly: Senior Partner, KPMG LLP | | 158 | | None |
Christopher L. Wilson — 1957 Trustee | | 2017 | | Non-executive director and trustee of a number of public and private business corporations Formerly: Managing Partner, CT2, LLC (investing and consulting firm); President/Chief Executive Officer, Columbia Funds, Bank of America Corporation; President/Chief Executive Officer, CDC IXIS Asset Management Services, Inc.; Principal & Director of Operations, Scudder Funds, Scudder, Stevens & Clark, Inc.; Assistant Vice President, Fidelity Investments | | 158 | | TD Asset Management USA Inc. (mutual fund complex) (22 portfolios); ISO New England, Inc. (non-profit organization managing regional electricity market) |
Invesco V.I. American Value Fund
Trustees and Officers—(continued)
| | | | | | | | |
Name, Year of Birth and
Position(s) Held with the Trust | | Trustee and/
or Officer Since | | Principal Occupation(s)
During Past 5 Years | | Number of
Funds in Fund
Complex
Overseen by
Trustee | | Other Directorship(s)
Held by Trustee During
Past 5 Years |
| Other Officers | | | | | | | | |
Sheri Morris — 1964 President, Principal Executive Officer and Treasurer | | 1999 | | President, Principal Executive Officer and Treasurer, The Invesco Funds; Vice President, Invesco Advisers, Inc. (formerly known as Invesco Institutional (N.A.), Inc.) (registered investment adviser); and Vice President, PowerShares Exchange-Traded Fund Trust, PowerShares Exchange-Traded Fund Trust II, PowerShares India Exchange-Traded Fund Trust, PowerShares Actively Managed Exchange-Traded Fund Trust, PowerShares Actively Managed Exchange-Traded Commodity Fund Trust and PowerShares Exchange-Traded Self-Indexed Fund Trust Formerly: Vice President and Principal Financial Officer, The Invesco Funds; Vice President, Invesco Aim Advisers, Inc., Invesco Aim Capital Management, Inc. and Invesco Aim Private Asset Management, Inc.; Assistant Vice President and Assistant Treasurer, The Invesco Funds and Assistant Vice President, Invesco Advisers, Inc., Invesco Aim Capital Management, Inc. and Invesco Aim Private Asset Management, Inc.; and Treasurer, PowerShares Exchange-Traded Fund Trust, PowerShares Exchange-Traded Fund Trust II, PowerShares India Exchange-Traded Fund Trust and PowerShares Actively Managed Exchange-Traded Fund Trust | | N/A | | N/A |
Russell C. Burk — 1958 Senior Vice President and Senior Officer | | 2005 | | Senior Vice President and Senior Officer, The Invesco Funds | | N/A | | N/A |
John M. Zerr — 1962 Senior Vice President, Chief Legal Officer and Secretary | | 2006 | | Director, Senior Vice President, Secretary and General Counsel, Invesco Management Group, Inc. (formerly known as Invesco AIM Management Group, Inc.); Senior Vice President, Invesco Advisers, Inc. (formerly known as Invesco Institutional (N.A.), Inc.) (registered investment adviser); Senior Vice President and Secretary, Invesco Distributors, Inc. (formerly known as Invesco AIM Distributors, Inc.); Director, Vice President and Secretary, Invesco Investment Services, Inc. (formerly known as Invesco AIM Investment Services, Inc.) Senior Vice President, Chief Legal Officer and Secretary, The Invesco Funds; Managing Director, Invesco PowerShares Capital Management LLC; Director, Secretary and General Counsel, Invesco Investment Advisers LLC (formerly known as Van Kampen Asset Management); Secretary and General Counsel, Invesco Capital Markets, Inc. (formerly known as Van Kampen Funds Inc.) and Chief Legal Officer, PowerShares Exchange-Traded Fund Trust, PowerShares Exchange-Traded Fund Trust II, PowerShares India Exchange-Traded Fund Trust, PowerShares Actively Managed Exchange-Traded Fund Trust, PowerShares Actively Managed Exchange-Traded Commodity Fund Trust and PowerShares Exchange-Traded Self-Indexed Fund Trust; Manager and Secretary, Invesco Indexing LLC Formerly: Director, Secretary, General Counsel and Senior Vice President, Van Kampen Exchange Corp.; Director, Vice President and Secretary, IVZ Distributors, Inc. (formerly known as INVESCO Distributors, Inc.); Director and Vice President, INVESCO Funds Group, Inc.; Director and Vice President, Van Kampen Advisors Inc.; Director, Vice President, Secretary and General Counsel, Van Kampen Investor Services Inc.; Director, Invesco Distributors, Inc. (formerly known as Invesco AIM Distributors, Inc.); Director, Senior Vice President, General Counsel and Secretary, Invesco AIM Advisers, Inc. and Van Kampen Investments Inc.; Director, Vice President and Secretary, Fund Management Company; Director, Senior Vice President, Secretary, General Counsel and Vice President, Invesco AIM Capital Management, Inc.; Chief Operating Officer and General Counsel, Liberty Ridge Capital, Inc. (an investment adviser); Vice President and Secretary, PBHG Funds (an investment company) and PBHG Insurance Series Fund (an investment company); Chief Operating Officer, General Counsel and Secretary, Old Mutual Investment Partners (a broker-dealer); General Counsel and Secretary, Old Mutual Fund Services (an administrator) and Old Mutual Shareholder Services (a shareholder servicing center); Executive Vice President, General Counsel and Secretary, Old Mutual Capital, Inc. (an investment adviser); and Vice President and Secretary, Old Mutual Advisors Funds (an investment company) | | N/A | | N/A |
Gregory G. McGreevey — 1962 Senior Vice President | | 2012 | | Senior Managing Director, Invesco Ltd.; Director, Chairman, President, and Chief Executive Officer, Invesco Advisers, Inc. (formerly known as Invesco Institutional (N.A.), Inc.) (registered investment adviser); Senior Vice President, Invesco Management Group, Inc.; Director, Invesco Mortgage Capital, Inc. and Invesco Senior Secured Management, Inc.; and Senior Vice President, The Invesco Funds Formerly: Assistant Vice President, The Invesco Funds | | N/A | | N/A |
Kelli Gallegos — 1970 Vice President, Principal Financial Officer and Assistant Treasurer | | 2008 | | Vice President, Principal Financial Officer and Assistant Treasurer, The Invesco Funds; Assistant Treasurer, Invesco PowerShares Capital Management LLC, PowerShares Exchange-Traded Fund Trust, PowerShares Exchange-Traded Fund Trust II, PowerShares India Exchange-Traded Fund Trust, PowerShares Actively Managed Exchange-Traded Fund Trust, PowerShares Actively Managed Exchange-Traded Commodity Fund Trust and PowerShares Exchange-Traded Self-Indexed Fund Trust Formerly: Assistant Vice President, The Invesco Funds | | N/A | | N/A |
Invesco V.I. American Value Fund
Trustees and Officers—(continued)
| | | | | | | | |
Name, Year of Birth and
Position(s) Held with the Trust | | Trustee and/
or Officer Since | | Principal Occupation(s)
During Past 5 Years | | Number of
Funds in Fund
Complex
Overseen by
Trustee | | Other Directorship(s)
Held by Trustee During
Past 5 Years |
| Other Officers—(continued) | | | | | | | | |
Tracy Sullivan — 1962 Vice President, Chief Tax Officer and Assistant Treasurer | | 2008 | | Vice President, Chief Tax Officer and Assistant Treasurer, The Invesco Funds; Assistant Treasurer, Invesco PowerShares Capital Management LLC, PowerShares Exchange-Traded Fund Trust, PowerShares Exchange-Traded Fund Trust II, PowerShares India Exchange-Traded Fund Trust, PowerShares Actively Managed Exchange-Traded Fund Trust, PowerShares Actively Managed Exchange-Traded Commodity Fund Trust and PowerShares Exchange-Traded Self-Indexed Fund Trust Formerly: Assistant Vice President, The Invesco Funds | | N/A | | N/A |
Crissie M. Wisdom — 1969 Anti-Money Laundering Compliance Officer | | 2013 | | Anti-Money Laundering Compliance Officer, Invesco Advisers, Inc. (formerly known as Invesco Institutional (N.A.), Inc.) (registered investment adviser), Invesco Capital Markets, Inc. (formerly known as Van Kampen Funds Inc.), Invesco Distributors, Inc., Invesco Investment Services, Inc., Invesco Management Group, Inc., The Invesco Funds, and PowerShares Exchange-Traded Fund Trust, PowerShares Exchange-Traded Fund Trust II, PowerShares India Exchange-Traded Fund Trust, PowerShares Actively Managed Exchange-Traded Fund Trust, PowerShares Actively Managed Exchange-Traded Commodity Fund Trust and PowerShares Exchange-Traded Self-Indexed Fund Trust; Anti-Money Laundering Compliance Officer and Bank Secrecy Act Officer, INVESCO National Trust Company and Invesco Trust Company; and Fraud Prevention Manager and Controls and Risk Analysis Manager for Invesco Investment Services, Inc. Formerly: Anti-Money Laundering Compliance Officer, Van Kampen Exchange Corp. | | N/A | | N/A |
Robert R. Leveille — 1969 Chief Compliance Officer | | 2016 | | Chief Compliance Officer, Invesco Advisers, Inc. (registered investment adviser); and Chief Compliance Officer, The Invesco Funds Formerly: Chief Compliance Officer, Putnam Investments and the Putnam Funds | | N/A | | N/A |
The Statement of Additional Information of the Trust includes additional information about the Fund’s Trustees and is available upon request, without charge, by calling 1.800.959.4246. Please refer to the Fund’s Statement of Additional Information for information on the Fund’s sub-advisers.
| | | | | | |
Office of the Fund 11 Greenway Plaza, Suite 1000 Houston, TX 77046-1173 | | Investment Adviser Invesco Advisers, Inc. 1555 Peachtree Street, N.E. Atlanta, GA 30309 | | Distributor Invesco Distributors, Inc. 11 Greenway Plaza, Suite 1000 Houston, TX 77046-1173 | | Auditors PricewaterhouseCoopers LLP 1000 Louisiana Street, Suite 5800 Houston, TX 77002-5678 |
| | | |
| | | | | | |
Counsel to the Fund Stradley Ronon Stevens & Young, LLP 2005 Market Street, Suite 2600 Philadelphia, PA 19103-7018 | | Counsel to the Independent Trustees Goodwin Procter LLP 901 New York Avenue, N.W. Washington, D.C. 20001 | | Transfer Agent Invesco Investment Services, Inc. 11 Greenway Plaza, Suite 1000 Houston, TX 77046-1173 | | Custodian State Street Bank and Trust Company 225 Franklin Street Boston, MA 02110-2801 |
Invesco V.I. American Value Fund
| | | | |
| | |
 | | Annual Report to Shareholders | | December 31, 2017 |
| | |
| | Invesco V.I. Balanced-Risk Allocation Fund |

| | |
| | The Fund provides a complete list of its holdings four times in each fiscal year, at the quarter-ends. For the second and fourth quarters, the lists appear in the Fund’s semiannual and annual reports to shareholders. For the first and third quarters, the Fund files the lists with the Securities and Exchange Commission (SEC) on Form N-Q. The Fund’s Form N-Q filings are available on the SEC website, sec.gov. Copies of the Fund’s Forms N-Q may be reviewed and copied at the SEC Public Reference Room in Washington, D.C. You can obtain information on the operation of the Public Reference Room, including information about duplicating fee charges, by calling 202 551 8090 or 800 732 0330, or by electronic request at the following email address: publicinfo@sec.gov. The SEC file numbers for the Fund are 811-07452 and 033-57340. The Fund’s most recent portfolio holdings, as filed on Form N-Q, have also been made available to insurance companies issuing variable annuity contracts and variable life insurance policies (“variable products”) that invest in the Fund. A description of the policies and procedures that the Fund uses to determine how to vote proxies relating to portfolio securities is available without charge, upon request, from our Client Services department at 800 959 4246 or at invesco.com/proxyguidelines. The information is also available on the SEC website, sec.gov. Information regarding how the Fund voted proxies related to its portfolio securities during the most recent 12-month period ended June 30 is available at invesco.com/ proxysearch. The information is also available on the SEC website, sec.gov. Invesco Advisers, Inc. is an investment adviser; it provides investment advisory services to individual and institutional clients and does not sell securities. Invesco Distributors, Inc. is the US distributor for Invesco Ltd.’s retail mutual funds, exchange-traded funds and institutional money market funds. Both are wholly owned, indirect subsidiaries of Invesco Ltd. This report must be accompanied or preceded by a currently effective Fund prospectus and variable product prospectus, which contain more complete information, including sales charges and expenses. Investors should read each carefully before investing. NOT FDIC INSURED | MAY LOSE VALUE | NO BANK GUARANTEE Invesco Distributors, Inc. VIIBRA-AR-1 02142018 1346 |
Management’s Discussion of Fund Performance
Performance summary
For the year ended December 31, 2017, Series I shares of Invesco V.I. Balanced-Risk Allocation Fund (the Fund) underperformed the Custom Invesco V.I. Balanced-Risk Allocation Index, the Fund’s custom style-specific index.
Your Fund’s long-term performance appears later in this report.
Fund vs. Indexes
Total returns, 12/31/16 to 12/31/17, excluding variable product issuer charges.
If variable product issuer charges were included, returns would be lower.
| | | | | |
Series I Shares | | | | 10.16 | % |
Series II Shares | | | | 9.83 | |
MSCI World Index▼ (Broad Market Index) | | | | 22.40 | |
Custom Invesco V.I. Balanced-Risk Allocation Index∎ (Style-Specific Index) | | | | 14.54 | |
Lipper VUF Absolute Return Funds Classification Average◆ (Peer Group) | | | | 5.28 | |
Source(s): ▼FactSet Research Systems Inc.; ∎Invesco, FactSet Research Systems Inc.; ◆Lipper Inc. | | | | | |
Market conditions and your Fund
For the year ended December 31, 2017, each of the asset classes in which the Fund invests (directly or indirectly through derivatives) provided positive contributions to Fund performance – and the Fund reported positive absolute performance. The Fund invests in derivatives, such as swaps and futures, which are expected to correspond to the performance of US and international fixed income, equity and commodity markets. The strategic allocation portion of the investment process involves first selecting representative assets for each asset class from a universe of more than 50 assets. Next, we seek to construct the portfolio so that an approximately equal amount of risk comes from our equity, fixed income and commodity allocations. Tactical adjustments to the Fund’s portfolio are then made on a monthly basis to try and take advantage of short-term market dynamics, while remaining consistent with the balanced-risk long-term portfolio structure.
The Fund’s strategic exposure to equities, obtained through the use of swaps and futures, led results for the reporting period, with all six markets in which the Fund invests – Europe ex-UK, Hong Kong,
Japan, the UK, US large caps and US small caps – posting positive returns. Asian equities were the leading contributor to Fund performance as Japanese equity prices were boosted by increased exports. Hong Kong equities provided further positive influence from the Asian region, rising in sympathy with emerging markets, which enjoyed a substantial rally. While the prospect of less accommodative monetary policy from the European Central Bank (ECB) and Brexit (the UK’s plan to leave the European Union) remained sources of political and economic uncertainty, European and UK equities performed strongly due to improved economic data and positive confidence surveys. US equities (both large- and small-caps) also contributed to the Fund’s performance. The reporting period began with most major US stock market indexes hitting record highs following the US presidential election. Investors believed the new administration’s plans to reduce tax rates, scale back regulations and increase infrastructure spending had the potential to stimulate economic growth. That was called into question after the first quarter of 2017, when it appeared that enacting significant regulatory and tax reform might be
more difficult than previously anticipated – although in December 2017, major tax reform legislation was enacted into law. Tactical positioning in US equities, obtained through the use of swaps and futures, contributed to Fund performance for the reporting period as overweight exposure to the asset class proved timely.
The Fund’s exposure to commodities, obtained through the use of swaps, futures and commodity-linked notes, also contributed to Fund performance for the year, as gains in industrial metals, energy and precious metals outweighed losses in agriculture. Strategic positioning in industrial metals was the leading performer within the asset class, with gains in both aluminum and copper. Increased industrial metals prices were supported by strong manufacturing and import growth data out of China and by indications that China intended to cut production to curb pollution. The Fund’s strategic positioning within energy was also favorable as all assets, with the exception of natural gas, experienced gains. The energy commodity sector started the year plagued by high inventory levels and rising US production and rig counts. These conditions lasted throughout much of the first half of 2017. Oil and distillate prices rebounded in the third quarter of 2017 as the US rig count declined and expectations rose for an extension of OPEC’s production cuts. Severe weather also affected energy prices in the third quarter of 2017 as hurricanes forced refinery shutdowns that further boosted prices. Natural gas prices rose at the beginning of the year, but those gains were not enough to outweigh the losses from rising US output at the end of the year. Strategic positioning in precious metals contributed to Fund performance with gains in gold outweighing losses in silver. Precious metals were pressured as the US Federal Reserve raised short-term interest rates three
| | | | | | | | | | |
| Target Risk Allocation and |
Notional Asset Weights as of 12/31/17 | |
By asset class | | | | | | | | | | |
Asset Class | | |
| Target Risk
Allocation* |
| | |
| Notional Asset
Weights** |
|
Equities | | | | 43.91 | % | | | | 42.61 | % |
Fixed Income | | | | 19.79 | | | | | 62.19 | |
Commodities | | | | 36.30 | | | | | 36.24 | |
Total | | | | 100.00 | | | | | 141.04 | |
| * | Reflects the risk that each asset class is expected to contribute to the overall risk of the Fund as measured by standard deviation and estimates of risk based on historical data. Standard deviation measures the annualized fluctuations (volatility) of monthly returns. |
| ** | Proprietary models determine the Notional Asset Weights necessary to achieve the Target Risk Allocations. Total Notional Asset Weight greater than 100% is achieved through derivatives and other instruments that create leverage. |
| | |
| Total Net Assets | | $1.2 billion |
Invesco V.I. Balanced-Risk Allocation Fund
times during the year – in March, June and December. Strategic positioning in agriculture was the sole detractor within the sector. Most agriculture assets posted losses except cotton, lean hogs and live cattle. Lean hogs and live cattle rose due to strong US export demand. Sugar was by far the leading detractor from Fund performance as production increased despite softer global demand. Tactical positioning within commodities, obtained through the use of futures, swaps and commodity-linked notes, slightly detracted from Fund results for the reporting period.
The Fund’s exposure to global government bonds, obtained through the use of swaps and futures, contributed to results for the reporting period led by Australia and the US. Despite expectations that the ECB would likely begin tapering its monetary policy accommodation, German government bonds also contributed to Fund performance. Canadian government bonds were the largest detractor within the fixed income asset class as yields rose after the Central Bank of Canada raised rates in July. Yields spiked again in the third quarter of 2017 in response to a surprise rate hike by the Central Bank of Canada. UK bonds detracted as they continued to be consumed with Brexit and terrorism. The Fund’s tactical positioning within bonds detracted from performance as losses from overweight exposure to Canadian and UK government bonds, coupled with underweight exposure to German government bonds, outweighed gains from underweight exposure to Australian and US government bonds.
Please note that our strategy is principally implemented with derivative instruments that include futures, commodity-linked notes and total return swaps. Therefore, all or most of the performance of the strategy, both positive and negative, can be attributed to these instruments. Derivatives can be a cost-effective way to gain exposure to asset classes. However, derivatives may amplify traditional investment risks through the creation of leverage and may be less liquid than traditional securities.
Thank you for your continued investment in Invesco V.I. Balanced-Risk Allocation Fund.
The views and opinions expressed in management’s discussion of Fund performance are those of Invesco Advisers, Inc. These views and opinions are subject to change at any time based on factors such as market and economic conditions. These views and opinions may not be relied upon as investment advice or recommendations, or as an offer for a particular security. The information is not a complete analysis of every aspect of any market, country, industry, security or the Fund. Statements of fact are from sources considered reliable, but Invesco Advisers, Inc. makes no representation or warranty as to their completeness or accuracy. Although historical performance is no guarantee of future results, these insights may help you understand our investment management philosophy.
See important Fund and, if applicable, index disclosures later in this report.
| | |
 | | Mark Ahnrud Chartered Financial Analyst, Portfolio Manager, is manager of Invesco V.I. Balanced-Risk Allocation Fund. |
| He joined Invesco in 2000. Mr. Ahnrud earned a BS in finance and investments from Babson College and an MBA from Duke University Fuqua School of Business. |
| | |
 | | Chris Devine Chartered Financial Analyst, Portfolio Manager, is manager of Invesco V.I. Balanced-Risk Allocation Fund. |
| He joined Invesco in 1998. Mr. Devine earned a BA in economics from Wake Forest University and an MBA from the University of Georgia. |
| | |
 | | Scott Hixon Chartered Financial Analyst, Portfolio Manager, is manager of Invesco V.I. Balanced-Risk Allocation Fund. |
| He joined Invesco in 1994. Mr. Hixon earned a BBA in finance from Georgia Southern University and an MBA in finance from Georgia State University. |
| | |
 | | Christian Ulrich Chartered Financial Analyst, Portfolio Manager, is manager of Invesco V.I. Balanced-Risk Allocation Fund. |
| He joined Invesco in 2000. Mr. Ulrich earned the equivalent of a BBA from the KV Zurich Business School in Zurich, Switzerland. |
| | |
 | | Scott Wolle Chartered Financial Analyst, Portfolio Manager, is manager of Invesco V.I. Balanced-Risk Allocation Fund. |
| He joined Invesco in 1999. Mr. Wolle earned a BS in finance from Virginia Polytechnic Institute and State University and an MBA from Duke University Fuqua School of Business. |
Assisted by Invesco’s Global Asset Allocation Team
Invesco V.I. Balanced-Risk Allocation Fund
Your Fund’s Long-Term Performance
Results of a $10,000 Investment – Oldest Share Class(es) since Inception
Fund and index data from 1/23/09
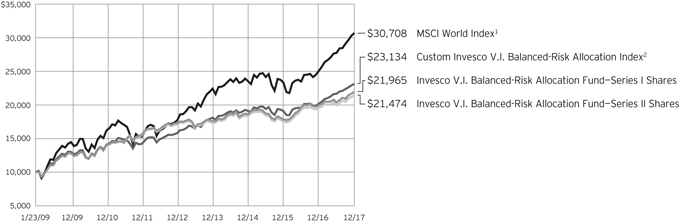
| 1 | Source: FactSet Research Systems Inc. |
| 2 | Source(s): Invesco, FactSet Research Systems Inc. |
Past performance cannot guarantee comparable future results.
Due to changes within the Lipper VUF Absolute Returns Funds Classification Average, certain components do not have 10 years of historical data. As such, the benchmark has not been included within the chart above.
| | | | | |
| Average Annual Total Returns |
As of 12/31/17 | | | | | |
| |
| Series I Shares | | | | | |
| Inception (1/23/09) | | | | 9.20 | % |
| 5 Years | | | | 4.90 | |
| 1 Years | | | | 10.16 | |
| |
| Series II Shares | | | | | |
| Inception (1/23/09) | | | | 8.93 | % |
| 5 Years | | | | 4.65 | |
| 1 Year | | | | 9.83 | |
The returns shown above include the returns of Invesco Van Kampen V.I. Global Tactical Asset Allocation Fund (the first predecessor fund) for the period June 1, 2010, to May 2, 2011, the date the first predecessor fund was reorganized into the Fund, and the returns of Van Kampen Life Investment Trust Global Tactical Asset Allocation Portfolio (the second predecessor fund) for the period prior to June 1, 2010, the date the second predecessor fund was reorganized into the first predecessor fund. The second predecessor fund was advised by Van Kampen Asset Management. Returns shown above for Series I and Series II shares are blended returns of the predecessor funds and Invesco V.I. Balanced-Risk Allocation Fund. Share class returns will differ from the predecessor funds because of different expenses.
The performance data quoted represent past performance and cannot guarantee comparable future results; current performance may be lower or higher. Please contact your variable product issuer or financial adviser for the most recent month-end variable product performance. Performance figures reflect Fund expenses, reinvested distributions and changes in net asset value. Investment return and principal value will fluctuate so that you may have a gain or loss when you sell shares.
The net annual Fund operating expense ratio set forth in the most recent Fund prospectus as of the date of this report for Series I and Series II shares was 0.80% and 1.05%, respectively.1,2,3 The total annual Fund operating expense ratio set forth in the most recent Fund prospectus as of the date of this report for Series I and Series II shares was 1.25% and 1.50%, respectively.1 The expense ratios presented above may vary from the expense ratios presented in other sections of this report that are based on expenses incurred during the period covered by this report.
Invesco V.I. Balanced-Risk Allocation Fund, a series portfolio of AIM Variable Insurance Funds (Invesco Variable Insurance Funds), is currently offered through insurance companies issuing variable products. You cannot purchase shares of the Fund directly.
Performance figures given represent the Fund and are not intended to reflect actual variable product values. They do not reflect sales charges, expenses and fees assessed in connection with a variable product. Sales charges, expenses and fees, which are determined by the variable product issuers, will vary and will lower the total return.
The most recent month-end performance at the Fund level, excluding variable product charges, is available at 800 451 4246. As mentioned above, for the most recent month-end performance including variable product charges, please contact your variable product issuer or financial adviser.
Fund performance reflects any applicable fee waivers and/or expense reimbursements. Had the adviser not waived fees and/or reimbursed expenses currently or in the past, returns would have been lower. See current prospectus for more information.
| 1 | The expense ratio includes acquired fund fees and expenses of the underlying funds in which the Fund invests of 0.13%. |
| 2 | Total annual Fund operating expenses after any contractual fee waivers and/or expense reimbursements by the adviser in effect through at least April 30, 2019. See current prospectus for more information. |
| 3 | Total annual Fund operating expenses after any contractual fee waivers by the adviser in effect through at least June 30, 2019. See current prospectus for more information. |
Invesco V.I. Balanced-Risk Allocation Fund
Invesco V.I. Balanced-Risk Allocation Fund’s investment objective is total return with a low to moderate correlation to traditional financial market indices.
| ∎ | Unless otherwise stated, information presented in this report is as of December 31, 2017, and is based on total net assets. |
| ∎ | Unless otherwise noted, all data provided by Invesco. |
Principal risks of investing in the Fund
Changing fixed income market conditions risk. The current low interest rate environment was created in part by the Federal Reserve Board (FRB) and certain foreign central banks keeping the federal funds and equivalent foreign rates near, at or below zero. Increases in the federal funds and equivalent foreign rates may expose fixed income markets to heightened volatility and reduced liquidity for certain fixed income investments, particularly those with longer maturities. In addition, decreases in fixed income dealer market-making capacity may also potentially lead to heightened volatility and reduced liquidity in the fixed income markets. As a result, the value of the Fund’s investments and share price may decline. Changes in central bank policies could also result in higher than normal shareholder redemptions, which could potentially increase portfolio turnover and the Fund’s transaction costs.
Commodities tax risk. The tax treatment of commodity-linked derivative instruments may be adversely affected by changes in legislation, regulations or other legally binding authority. If, as a result of any such adverse action, the income of the Fund from certain commodity-linked derivatives was treated as non-qualifying income, the Fund might fail to qualify as a regulated investment company and be subject to federal income tax at the Fund level. As a result of a recent announcement by the Internal Revenue Service, the Fund intends to invest in commodity-linked notes: (a) directly, generally only to the extent that it obtains an opinion of counsel confirming that income from such investments should be qualifying income because such commodity-linked notes constitute securities under section 2(a)(36) of the 1940 Act or (b) indirectly through the Subsidiary. Should the Internal Revenue Service issue further guidance, or Congress enact legislation, that adversely affects the tax treatment of the Fund’s use of commodity-linked notes or the Subsidiary (which guidance might be applied to the Fund retroactively), it could, among other consequences, limit the Fund’s ability to pursue its investment strategy.
Commodity-linked notes risk. In addition to risks associated with the underlying commodities, investments in commodity-
linked notes may be subject to additional risks, such as non-payment of interest and loss of principal, counterparty risk, lack of a secondary market and risk of greater volatility than traditional equity and debt securities. The value of the commodity-linked notes the Fund buys may fluctuate significantly because the values of the underlying investments to which they are linked are themselves volatile. Additionally, certain commodity-linked notes employ “economic” leverage by requiring payment by the issuer of an amount that is a multiple of the price increase or decrease of the underlying commodity, commodity index, or other economic variable. Such economic leverage will increase the volatility of the value of these commodity-linked notes and the Fund to the extent it invests in such notes.
Commodity risk. The Fund may have investment exposure to the commodities markets and/or a particular sector of the commodities markets, which may subject the Fund to greater volatility than investments in traditional securities, such as stocks and bonds. Volatility in the commodities markets may be caused by changes in overall market movements, domestic and foreign political and economic events and policies, war, acts of terrorism, changes in domestic or foreign interest rates and/or investor expectations concerning interest rates, domestic and foreign inflation rates, investment and trading activities of mutual funds, hedge funds and commodities funds, and factors such as drought, floods, weather, livestock disease, embargoes, tariffs and other regulatory developments or supply and demand disruptions. Because the Fund’s performance may be linked to the performance of volatile commodities, investors should be willing to assume the risks of potentially significant fluctuations in the value of the Fund’s shares.
Correlation risk. Because the Fund’s investment strategy seeks to balance risk across three asset classes and, within each asset class, across different countries and investments, to the extent either the asset classes or the selected countries and investments become correlated in a way not anticipated by the Adviser, the Fund’s risk allocation process may result in magnified risks and loss instead of balancing (reducing) the risk of loss.
Debt securities risk. The prices of debt securities held by the Fund will be affected by changes in interest rates, the creditworthiness of the issuer and other factors. An increase in prevailing interest rates typically causes the value of existing debt securities to fall and often has a greater impact on longer-duration debt securities and higher quality debt securities. Falling interest rates will cause the Fund to reinvest the proceeds of debt securities that have been repaid by the issuer at lower interest rates. Falling interest rates may also reduce the Fund’s distributable income because interest payments on floating rate debt instruments held by the Fund will decline. The Fund could lose money on investments in debt securities if the issuer or borrower fails to meet its obligations to make interest payments and/or to repay principal in a timely manner. Changes in an issuer’s financial strength, the market’s perception of such strength or in the credit rating of the issuer or the security may affect the value of debt securities. The Adviser’s credit analysis may fail to anticipate such changes, which could result in buying a debt security at an inopportune time or failing to sell a debt security in advance of a price decline or other credit event.
Derivatives risk. The value of a derivative instrument depends largely on (and is derived from) the value of an underlying security, currency, commodity, interest rate, index or other asset (each referred to as an underlying asset). In addition to risks relating to the underlying assets, the use of derivatives may include other, possibly greater, risks, including counterparty, leverage and liquidity risks. Counterparty risk is the risk that the counterparty to the derivative contract will default on its obligation to pay the Fund the amount owed or otherwise perform under the derivative contract. Derivatives create leverage risk because they do not require payment up front equal to the economic exposure created by owning the derivative. As a result, an adverse change in the value of the underlying asset could result in the Fund sustaining a loss that is substantially greater than the amount invested in the derivative, which may make the Fund’s returns more volatile and increase the risk of loss. Derivative instruments may also be less liquid than more traditional investments
Invesco V.I. Balanced-Risk Allocation Fund
and the Fund may be unable to sell or close out its derivative positions at a desirable time or price. This risk may be more acute under adverse market conditions, during which the Fund may be most in need of liquidating its derivative positions. Derivatives may also be harder to value, less tax efficient and subject to changing government regulation that could impact the Fund’s ability to use certain derivatives or their cost. The SEC has proposed new regulations related to the use of derivatives and related instruments by registered investment companies. If adopted as proposed, these regulations would limit the Fund’s ability to engage in derivatives transactions and may result in increased costs or require the Fund to modify its investment strategies or to liquidate. Also, derivatives used for hedging or to gain or limit exposure to a particular market segment may not provide the expected benefits, particularly during adverse market conditions. These risks are greater for the Fund than most other mutual funds because the Fund will implement its investment strategy primarily through derivative instruments rather than direct investments in stocks/bonds.
Emerging markets securities risk. Emerging markets (also referred to as developing markets) are generally subject to greater market volatility, political, social and economic instability, uncertain trading markets and more governmental limitations on foreign investment than more developed markets. In addition, companies operating in emerging markets may be subject to lower trading volume and greater price fluctuations than companies in more developed markets. Securities law and the enforcement of systems of taxation in many emerging market countries may change quickly and unpredictably. In addition, investments in emerging markets securities may also be subject to additional transaction costs, delays in settlement procedures, and lack of timely information.
Exchange-traded funds risk. In addition to the risks associated with the underlying assets held by the exchange-traded fund, investments in exchange-traded funds are subject to the following additional risks: (1) an exchange-traded fund’s shares may trade above or below its net asset value; (2) an active trading market for the exchange-traded fund’s shares may not develop or be maintained; (3) trading an exchange-traded fund’s shares may be halted by the listing exchange; (4) a passively managed exchange-traded fund may not track the performance of the reference asset; and (5) a passively managed exchange-traded
fund may hold troubled securities. Investment in exchange-traded funds may involve duplication of management fees and certain other expenses, as the Fund indirectly bears its proportionate share of any expenses paid by the exchange-traded funds in which it invests. Further, certain exchange-traded funds in which the Fund may invest are leveraged, which may result in economic leverage, permitting the Fund to gain exposure that is greater than would be the case in an unlevered instrument and potentially resulting in greater volatility.
Exchange-traded notes risk. Exchange-traded notes are subject to credit risk, counterparty risk, and the risk that the value of the exchange-traded note may drop due to a downgrade in the issuer’s credit rating. The value of an exchange-traded note may also be influenced by time to maturity, level of supply and demand for the exchange-traded note, volatility and lack of liquidity in the underlying market, changes in the applicable interest rates, and economic, legal, political, or geographic events that affect the referenced underlying market or assets. The Fund will bear its proportionate share of any fees and expenses borne by an exchange-traded note in which it invests. For certain exchange-traded notes, there may be restrictions on the Fund’s right to redeem its investment, which is meant to be held until maturity.
Foreign government debt risk. Investments in foreign government debt securities (sometimes referred to as sovereign debt securities) involve certain risks in addition to those relating to foreign securities or debt securities generally. The issuer of the debt or the governmental authorities that control the repayment of the debt may be unable or unwilling to repay principal or interest when due in accordance with the terms of such debt, and the Fund may have limited recourse in the event of a default against the defaulting government. Without the approval of debt holders, some governmental debtors have in the past been able to reschedule or restructure their debt payments or declare moratoria on payments.
Foreign securities risk. The Fund’s foreign investments may be adversely affected by political and social instability, changes in economic or taxation policies, difficulty in enforcing obligations, decreased liquidity or increased volatility. Foreign investments also involve the risk of the possible seizure, nationalization or expropriation of the issuer or foreign deposits (in which the Fund could lose its entire investments in a certain market)
and the possible adoption of foreign governmental restrictions such as exchange controls. Unless the Fund has hedged its foreign securities risk, foreign securities risk also involves the risk of negative foreign currency rate fluctuations, which may cause the value of securities denominated in such foreign currency (or other instruments through which the Fund has exposure to foreign currencies) to decline in value. Currency exchange rates may fluctuate significantly over short periods of time. Currency hedging strategies, if used, are not always successful.
Management risk. The Fund is actively managed and depends heavily on the Adviser’s judgment about markets, interest rates or the attractiveness, relative values, liquidity, or potential appreciation of particular investments made for the Fund’s portfolio. The Fund could experience losses if these judgments prove to be incorrect. Because the Fund’s investment process relies heavily on its asset allocation process, market movements that are counter to the portfolio managers’ expectations may have a significant adverse effect on the Fund’s net asset value. Additionally, legislative, regulatory, or tax developments may adversely affect management of the Fund and, therefore, the ability of the Fund to achieve its investment objective.
Market risk. The market values of the Fund’s investments, and therefore the value of the Fund’s shares, will go up and down, sometimes rapidly or unpredictably. Market risk may affect a single issuer, industry or section of the economy, or it may affect the market as a whole. Individual stock prices tend to go up and down more dramatically than those of certain other types of investments, such as bonds. During a general downturn in the financial markets, multiple asset classes may decline in value. When markets perform well, there can be no assurance that specific investments held by the Fund will rise in value.
Short position risk. Because the Fund’s potential loss on a short position arises from increases in the value of the asset sold short, the Fund will incur a loss on a short position, which is theoretically unlimited, if the price of the asset sold short increases from the short sale price. The counterparty to a short position or other market factors may prevent the Fund from closing out a short position at a desirable time or price and may reduce or eliminate any gain or result in a loss. In a rising market, the Fund’s short positions will cause the Fund to underperform the overall market and its peers that do not
Invesco V.I. Balanced-Risk Allocation Fund
engage in shorting. If the Fund holds both long and short positions, and both positions decline simultaneously, the short positions will not provide any buffer (hedge) from declines in value of the Fund’s long positions. Certain types of short positions involve leverage, which may exaggerate any losses, potentially more than the actual cost of the investment, and will increase the volatility of the Fund’s returns.
Subsidiary risk. By investing in the Subsidiary, the Fund is indirectly exposed to risks associated with the Subsidiary’s investments. The Subsidiary is not registered under the Investment Company Act of 1940, as amended (1940 Act), and, except as otherwise noted in this prospectus, is not subject to the investor protections of the 1940 Act. Changes in the laws of the United States and/or the Cayman Islands, under which the Fund and the Subsidiary, respectively, are organized, could result in the inability of the Fund and/or the Subsidiary to operate as described in this prospectus and the SAI, and could negatively affect the Fund and its shareholders.
US government obligations risk. Obligations of US government agencies and authorities receive varying levels of support and may not be backed by the full faith and credit of the US government, which could affect the Fund’s ability to recover should they default. No assurance can be given that the US government will provide financial support to its agencies and authorities if it is not obligated by law to do so.
Volatility risk. Although the Fund’s investment strategy targets a specific volatility level, certain of the Fund’s investments may appreciate or decrease significantly in value over short periods of time. This may cause the Fund’s net asset value per share to experience significant increases or declines in value over short periods of time.
About indexes used in this report
The MSCI WorldSM Index is an unmanaged index considered representative of stocks of developed countries. The index is computed using the net return, which withholds applicable taxes for non-resident investors.
The Custom Invesco V.I. Balanced-Risk Allocation Index, created by Invesco to serve as a benchmark for Invesco V.I. Balanced-Risk Allocation Fund, comprises the following indexes: MSCI World Index (60%) and Bloomberg Barclays U.S. Aggregate Bond Index (40%). Prior to May 2, 2011, the index
comprised the MSCI World Index (65%), J.P. Morgan GBI Global Index (30%) and FTSE US 3-Month Treasury Bill Index (5%).
The Lipper VUF Absolute Return Funds Classification Average represents an average of all variable insurance underlying funds in the Lipper Absolute Return Funds Classification.
The Bloomberg Barclays U.S. Aggregate Bond Index is an unmanaged index considered representative of the US investment grade, fixed-rate bond market.
The J.P. Morgan GBI Global Index tracks fixed-rate issuances from high-income countries spanning the globe.
The FTSE US 3-Month Treasury Bill Index is an unmanaged index representative of three-month US Treasury bills.
The Fund is not managed to track the performance of any particular index, including the index(es) described here, and consequently, the performance of the Fund may deviate significantly from the performance of the index(es).
A direct investment cannot be made in an index. Unless otherwise indicated, index results include reinvested dividends, and they do not reflect sales charges. Performance of the peer group, if applicable, reflects fund expenses; performance of a market index does not.
Other information
The returns shown in management’s discussion of Fund performance are based on net asset values calculated for shareholder transactions. Generally
accepted accounting principles require adjustments to be made to the net assets of the Fund at period end for financial reporting purposes, and as such, the net asset values for shareholder transactions and the returns based on those net asset values may differ from the net asset values and returns reported in the Financial Highlights. Additionally, the returns and net asset values shown throughout this report are at the Fund level only and do not include variable product issuer charges. If such charges were included, the total returns would be lower.
Invesco V.I. Balanced-Risk Allocation Fund
Consolidated Schedule of Investments
December 31, 2017
| | | | | | | | | | | | | | | | |
| | | Interest
Rate | | | Maturity
Date | | | Principal
Amount | | | Value | |
U.S. Treasury Bills–10.96%(a) | |
U.S. Treasury Bills(b) | | | 1.12 | % | | | 01/04/2018 | | | $ | 15,500,000 | | | $ | 15,499,028 | |
U.S. Treasury Bills(b) | | | 1.02 | % | | | 01/11/2018 | | | | 47,200,000 | | | | 47,186,166 | |
U.S. Treasury Bills | | | 1.11 | % | | | 02/08/2018 | | | | 14,980,000 | | | | 14,960,812 | |
U.S. Treasury Bills | | | 1.44 | % | | | 06/07/2018 | | | | 54,000,000 | | | | 53,657,775 | |
Total U.S. Treasury Bills (Cost $131,309,526) | | | | | | | | | | | | | | | 131,303,781 | |
| | | | |
| | | | | | Expiration
Date | | | | | | | |
Commodity-Linked Securities–2.00% | | | | | | | | | | | | | | | | |
Canadian Imperial Bank of Commerce EMTN, U.S. Federal Funds Effective Rate minus 0.03% (linked to the Canadian Imperial Bank of Commerce Custom 5 Agriculture Commodity Index, multiplied by 2)(c)(g) | | | | | | | 09/24/2018 | | | | 8,850,000 | | | | 9,611,802 | |
Cargill, Inc., Commodity-Linked Notes, one month USD LIBOR minus 0.10% (linked to the Monthly Rebalance Commodity Excess Return Index, multiplied by 2)(c)(g) | | | | | | | 08/15/2018 | | | | 15,050,000 | | | | 14,307,158 | |
Total Commodity-Linked Securities (Cost $23,900,000) | | | | | | | | | | | | | | | 23,918,960 | |
| | | | |
| | | | | | | | | Shares | | | | |
Money Market Funds–83.92% | | | | | | | | | | | | | | | | |
Invesco Government & Agency Portfolio–Institutional Class, 1.18%(d) | | | | | | | | | | | 357,347,280 | | | | 357,347,280 | |
Invesco Government Money Market Fund–Cash Reserve Shares, 0.64%(d) | | | | | | | | | | | 11,260,610 | | | | 11,260,610 | |
Invesco Premier U.S. Government Money Portfolio–Institutional Class, 1.15%(d) | | | | | | | | | | | 124,910,149 | | | | 124,910,149 | |
Invesco Treasury Obligations Portfolio–Institutional Class, 1.07%(d) | | | | | | | | | | | 186,855,744 | | | | 186,855,744 | |
Invesco Treasury Portfolio–Institutional Class, 1.17%(d) | | | | | | | | | | | 229,511,825 | | | | 229,511,825 | |
Invesco V.I. Government Money Market Fund–Series I, 0.90%(d) | | | | | | | | | | | 16,640,310 | | | | 16,640,310 | |
STIC (Global Series) PLC–U.S. Dollar Liquidity Portfolio–Institutional Class (Ireland), 1.39%(d) | | | | | | | | | | | 78,367,910 | | | | 78,367,910 | |
Total Money Market Funds (Cost $1,004,893,828) | | | | | | | | | | | | | | | 1,004,893,828 | |
TOTAL INVESTMENTS IN SECURITIES–96.88% (Cost $1,160,103,354) | | | | | | | | | | | | | | | 1,160,116,569 | |
OTHER ASSETS LESS LIABILITIES–3.12% | | | | | | | | | | | | | | | 37,300,376 | |
NET ASSETS–100.00% | | | | | | | | | | | | | | $ | 1,197,416,945 | |
| | | | | | | | | | | | | | | | | | | | |
| Open Futures Contracts(e) | |
| Long Futures Contracts | | Number of
Contracts | | | Expiration
Month | | | Notional
Value | | | Value | | | Unrealized
Appreciation
(Depreciation) | |
Brent Crude | | | 333 | | | | March-2018 | | | $ | 22,267,710 | | | $ | 1,033,582 | | | $ | 1,033,582 | |
Gasoline Reformulated Blendstock Oxygenate Blending | | | 470 | | | | February-2018 | | | | 35,449,092 | | | | 2,235,837 | | | | 2,235,837 | |
Heating Oil | | | 169 | | | | April-2018 | | | | 14,292,533 | | | | 2,074,091 | | | | 2,074,091 | |
Silver | | | 371 | | | | March-2018 | | | | 31,803,975 | | | | (96,852 | ) | | | (96,852 | ) |
WTI Crude | | | 263 | | | | June-2018 | | | | 15,795,780 | | | | 626,274 | | | | 626,274 | |
Subtotal — Commodity Risk | | | | 5,872,932 | | | | 5,872,932 | |
Dow Jones EURO STOXX 50 Index | | | 2,085 | | | | March-2018 | | | | 87,380,294 | | | | (2,208,417 | ) | | | (2,208,417 | ) |
E-Mini Russell 2000 Index | | | 883 | | | | March-2018 | | | | 67,836,475 | | | | 868,245 | | | | 868,245 | |
E-Mini S&P 500 Index | | | 528 | | | | March-2018 | | | | 70,646,400 | | | | 1,176,670 | | | | 1,176,670 | |
FTSE 100 Index | | | 920 | | | | March-2018 | | | | 94,870,987 | | | | 2,969,523 | | | | 2,969,523 | |
Hang Seng Index | | | 388 | | | | January-2018 | | | | 74,363,066 | | | | 1,154,573 | | | | 1,154,573 | |
Tokyo Stock Price Index | | | 626 | | | | March-2018 | | | | 100,953,404 | | | | 2,426,419 | | | | 2,426,419 | |
Subtotal — Equity Risk | | | | 6,387,013 | | | | 6,387,013 | |
Australia 10 Year Bonds | | | 1,615 | | | | March-2018 | | | | 162,741,962 | | | | (1,170,994 | ) | | | (1,170,994 | ) |
Canada 10 Year Bonds | | | 2,120 | | | | March-2018 | | | | 227,332,007 | | | | (3,002,411 | ) | | | (3,002,411 | ) |
Euro Bonds | | | 545 | | | | March-2018 | | | | 105,721,097 | | | | (951,857 | ) | | | (951,857 | ) |
Long Gilt | | | 746 | | | | March-2018 | | | | 126,057,973 | | | | 854,542 | | | | 854,542 | |
U.S. Treasury Long Bonds | | | 711 | | | | March-2018 | | | | 108,783,000 | | | | (160,637 | ) | | | (160,637 | ) |
Subtotal — Interest Rate Risk | | | | (4,431,357 | ) | | | (4,431,357 | ) |
Total Futures Contracts | | | $ | 7,828,588 | | | $ | 7,828,588 | |
See accompanying Notes to Consolidated Financial Statements which are an integral part of the financial statements.
Invesco V.I. Balanced-Risk Allocation Fund
| | | | | | | | | | | | | | | | | | | | | | | | | | | | | | | | | | | | | | |
| Open Over-The-Counter Total Return Swap Agreements(f) | |
| Counterparty | | Pay/
Receive | | | Reference Entity(g) | | Fixed
Rate | | | Payment
Frequency | | | Number of
Contracts | | | Maturity Date | | | Notional
Value(h) | | | Upfront
Payments
Paid
(Received) | | | Value | | | Unrealized
Appreciation
(Depreciation) | |
Barclays Bank PLC | | | Receive | | | Barclays Commodity Strategy 1452 Excess Return Index | | | 0.33 | % | | | Monthly | | | | 43,000 | | | | October-2018 | | | $ | 24,188,402 | | | $ | — | | | $ | 1,280,009 | | | $ | 1,280,009 | |
Barclays Bank PLC | | | Receive | | | Barclays Commodity Strategy 1719 Excess Return Index | | | 0.45 | | | | Monthly | | | | 107,400 | | | | July-2018 | | | | 27,289,470 | | | | — | | | | 653,164 | | | | 653,164 | |
Canadian Imperial Bank of Commerce | | | Receive | | | Canadian Imperial Bank of Commerce Custom 5 Agriculture Commodity Index | | | 0.55 | | | | Monthly | | | | 310,500 | | | | July-2018 | | | | 28,789,560 | | | | — | | | | 598,427 | | | | 598,427 | |
Canadian Imperial Bank of Commerce | | | Receive | | | Canadian Imperial Bank of Commerce Dynamic Roll LME Copper Excess Return Index 2 | | | 0.30 | | | | Monthly | | | | 278,500 | | | | April-2018 | | | | 23,410,292 | | | | — | | | | 2,030,822 | | | | 2,030,822 | |
Cargill, Inc. | | | Receive | | | Monthly Rebalance Commodity Excess Return Index | | | 0.47 | | | | Monthly | | | | 37,200 | | | | July-2018 | | | | 30,776,416 | | | | — | | | | 0 | | | | 0 | |
Cargill, Inc. | | | Receive | | | Single Commodity Index Excess Return | | | 0.12 | | | | Monthly | | | | 13,800 | | | | January-2018 | | | | 12,520,850 | | | | — | | | | 0 | | | | 0 | |
Goldman Sachs International | | | Receive | | | Goldman Sachs Alpha Basket B823 Excess Return Strategy | | | 0.40 | | | | Monthly | | | | 339,500 | | | | July-2018 | | | | 27,811,742 | | | | — | | | | 114,245 | | | | 114,245 | |
J.P. Morgan Chase Bank, N.A. | | | Receive | | | J.P. Morgan Contag Beta Gas Oil Excess Return Index | | | 0.25 | | | | Monthly | | | | 63,300 | | | | April-2018 | | | | 15,071,008 | | | | — | | | | 498,823 | | | | 498,823 | |
J.P. Morgan Chase Bank, N.A. | | | Receive | | | S&P GSCI Gold Index Excess Return | | | 0.09 | | | | Monthly | | | | 161,500 | | | | October-2018 | | | | 16,761,100 | | | | — | | | | 399,761 | | | | 399,761 | |
Macquarie Bank Ltd. | | | Receive | | | Macquarie Aluminum Dynamic Selection Index | | | 0.30 | | | | Monthly | | | | 192,000 | | | | December-2018 | | | | 10,892,544 | | | | — | | | | 832,704 | | | | 832,704 | |
Merrill Lynch International | | | Receive | | | Merrill Lynch Gold Excess Return Index | | | 0.14 | | | | Monthly | | | | 129,000 | | | | June-2018 | | | | 21,482,344 | | | | — | | | | 0 | | | | 0 | |
Merrill Lynch International | | | Receive | | | MLCX Aluminum Annual Excess Return Index | | | 0.28 | | | | Monthly | | | | 15,000 | | | | September-2018 | | | | 1,881,231 | | | | — | | | | 0 | | | | 0 | |
Merrill Lynch International | | | Receive | | | MLCX Dynamic Enhanced Copper Excess Return Index | | | 0.25 | | | | Monthly | | | | 2,300 | | | | September-2018 | | | | 1,615,076 | | | | — | | | | 0 | | | | 0 | |
Merrill Lynch International | | | Receive | | | MLCX Natural Gas Annual Excess Return Index | | | 0.25 | | | | Monthly | | | | 217,000 | | | | November-2018 | | | | 9,232,154 | | | | — | | | | 0 | | | | 0 | |
Morgan Stanley Capital Services LLC | | | Receive | | | S&P GSCI Aluminum Dynamic Roll Index Excess Return | | | 0.38 | | | | Monthly | | | | 149,500 | | | | October-2018 | | | | 16,972,047 | | | | — | | | | 1,449,522 | | | | 1,449,522 | |
Subtotal — Commodity Risk | | | | | | | | | | | | — | | | | 7,857,477 | | | | 7,857,477 | |
Goldman Sachs International | | | Receive | | | Hang Seng Index Futures | | | — | | | | Monthly | | | | 106 | | | | January-2018 | | | | 20,315,683 | | | | — | | | | 333,716 | | | | 333,716 | |
Subtotal — Equity Risk | | | | | | | | — | | | | 333,716 | | | | 333,716 | |
Subtotal — Appreciation | | | | | | | | | | | | — | | | | 8,191,193 | | | | 8,191,193 | |
Macquarie Bank Ltd. | | | Receive | | | Macquarie CGB 10 Year Index | | | 0.34 | | | | Monthly | | | | 107,000 | | | | June-2018 | | | | CAD 19,108,049 | | | | — | | | | (74,084 | ) | | | (74,084 | ) |
Subtotal — Depreciation — Interest Rate Risk | | | | | | | | | | | | — | | | | (74,084 | ) | | | (74,084 | ) |
Total Swap Agreements | | | | | | | $ | — | | | $ | 8,117,109 | | | $ | 8,117,109 | |
Investments Abbreviations:
| | |
| CAD | | – Canadian Dollar |
| CGB | | – Canadian Government Bonds |
| EMTN | | – European Medium-Term Notes |
| | |
| LIBOR | | – London Interbank Offered Rate |
| USD | | – U.S. Dollar |
Notes to Consolidated Schedule of Investments:
| (a) | Securities traded on a discount basis. The interest rates shown represent the discount rates at the time of purchase by the Fund. |
| (b) | All or a portion of the value was pledged as collateral to cover margin requirements for open futures contracts. See Note 1L and Note 4. |
| (c) | Security purchased or received in a transaction exempt from registration under the Securities Act of 1933, as amended (the “1933 Act”). The security may be resold pursuant to an exemption from registration under the 1933 Act, typically to qualified institutional buyers. The aggregate value of these securities at December 31, 2017, was $23,918,960, which represented 2.00% of the Fund’s Net Assets. |
| (d) | The money market fund and the Fund are affiliated by having the same investment adviser. The rate shown is the 7-day SEC standardized yield as of December 31, 2017. |
| (e) | Futures contracts collateralized by $9,191,000 cash held with Goldman Sachs & Co., the futures commission merchant. |
| (f) | The Fund receives or pays payments based on any positive or negative return on the Reference Entity, respectively. |
| (g) | The table below includes additional information regarding the underlying components of certain reference entities that are not publicly available. |
See accompanying Notes to Consolidated Financial Statements which are an integral part of the financial statements.
Invesco V.I. Balanced-Risk Allocation Fund
| | | | | | |
| Reference Entity Components | |
| Reference Entity | | Underlying Components | | Percentage | |
| Barclays Commodity Strategy 1452 Excess Return Index | | | | | | |
| | | Long Futures Contracts | | | |
| | Copper | | | 100.00 | |
| Barclays Commodity Strategy 1719 Excess Return Index | | | | | | |
| | | Long Futures Contracts | | | |
| | Cocoa | | | 0.17 | |
| | Coffee ‘C’ | | | 5.28 | |
| | Corn | | | 7.70 | |
| | Cotton No. 2 | | | 18.88 | |
| | Lean Hogs | | | 0.52 | |
| | Live Cattle | | | 1.24 | |
| | Soybean Meal | | | 18.81 | |
| | Soybean Oil | | | 4.79 | |
| | Soybeans | | | 18.38 | |
| | Sugar No. 11 | | | 19.42 | |
| | Wheat | | | 4.81 | |
| | Total | | | 100.00 | |
Canadian Imperial Bank of Commerce Custom 5 Agriculture Commodity Index | | | | | | |
| | | Long Futures Contracts | | | |
| | Cocoa | | | 0.17 | |
| | Coffee ‘C’ | | | 5.28 | |
| | Corn | | | 7.70 | |
| | Cotton No. 2 | | | 18.88 | |
| | Lean Hogs | | | 0.52 | |
| | Live Cattle | | | 1.24 | |
| | Soybean Meal | | | 18.81 | |
| | Soybean Oil | | | 4.79 | |
| | Soybeans | | | 18.38 | |
| | Sugar No. 11 | | | 19.42 | |
| | Wheat | | | 4.81 | |
| | Total | | | 100.00 | |
Canadian Imperial Bank of Commerce Dynamic Roll LME Copper Excess Return Index 2 | | | | | | |
| | | Long Futures Contracts | | | |
| | Copper | | | 100.00 | |
| Monthly Rebalance Commodity Excess Return Index | | | | | | |
| | | Long Futures Contracts | | | |
| | Cocoa | | | 0.17 | |
| | Coffee ‘C’ | | | 5.28 | |
| | Corn | | | 7.70 | |
| | Cotton No. 2 | | | 18.88 | |
| | Lean Hogs | | | 0.52 | |
| | Live Cattle | | | 1.24 | |
| | Soybean Meal | | | 18.81 | |
| | Soybean Oil | | | 4.79 | |
| | Soybeans | | | 18.38 | |
| | Sugar No. 11 | | | 19.42 | |
| | Wheat | | | 4.81 | |
| | Total | | | 100.00 | |
| Single Commodity Index Excess Return | | | | | | |
| | | Long Futures Contracts | | | |
| | Gold | | | 100.00 | |
See accompanying Notes to Consolidated Financial Statements which are an integral part of the financial statements.
Invesco V.I. Balanced-Risk Allocation Fund
| | | | | | |
| Reference Entity Components (Continued) | |
| Reference Entity | | Underlying Components | | Percentage | |
| Goldman Sachs Alpha Basket B823 Excess Return Strategy | | | | | | |
| | | Long Futures Contracts | | | |
| | Cocoa | | | 0.17 | |
| | Coffee ‘C’ | | | 5.28 | |
| | Corn | | | 7.70 | |
| | Cotton No. 2 | | | 18.88 | |
| | Lean Hogs | | | 0.52 | |
| | Live Cattle | | | 1.24 | |
| | Soybean Meal | | | 18.81 | |
| | Soybean Oil | | | 4.79 | |
| | Soybeans | | | 18.38 | |
| | Sugar No. 11 | | | 19.42 | |
| | Wheat | | | 4.81 | |
| | Total | | | 100.00 | |
| J.P. Morgan Contag Beta Gas Oil Excess Return Index | | | | | | |
| | | Long Futures Contracts | | | |
| | Gas Oil | | | 100.00 | |
| S&P GSCI Gold Index Excess Return | | | | | | |
| | | Long Futures Contracts | | | |
| | Gold | | | 100.00 | |
| Macquarie Aluminum Dynamic Selection Index | | | | | | |
| | | Long Futures Contracts | | | |
| | Aluminum | | | 100.00 | |
| Merrill Lynch Gold Excess Return Index | | | | | | |
| | | Long Futures Contracts | | | |
| | Gold | | | 100.00 | |
| MLCX Aluminum Annual Excess Return Index | | | | | | |
| | | Long Futures Contracts | | | |
| | Aluminum | | | 100.00 | |
| MLCX Dynamic Enhanced Copper Excess Return Index | | | | | | |
| | | Long Futures Contracts | | | |
| | Copper | | | 100.00 | |
| MLCX Natural Gas Annual Excess Return Index | | | | | | |
| | | Long Futures Contracts | | | |
| | Natural Gas | | | 100.00 | |
| S&P GSCI Aluminum Dynamic Roll Index Excess Return | | | | | | |
| | | Long Futures Contracts | | | |
| | Aluminum | | | 100.00 | |
| Macquarie CGB 10 Year Index | | | | | | |
| | | Long Futures Contracts | | | |
| | Canada 10 Year Bonds | | | 100.00 | |
| (h) | Notional value is denominated in U.S. Dollars unless otherwise noted. |
See accompanying Notes to Consolidated Financial Statements which are an integral part of the financial statements.
Invesco V.I. Balanced-Risk Allocation Fund
Consolidated Statement of Assets and Liabilities
December 31, 2017
Consolidated Statement of Operations
For the year ended December 31, 2017
| | | | |
Assets: | | | | |
Investments in securities, at value (Cost $155,209,526) | | $ | 155,222,741 | |
Investments in affiliated money market funds, at value and cost | | | 1,004,893,828 | |
Other investments: | | | | |
Variation margin receivable — futures contracts | | | 914,195 | |
Swaps receivable — OTC | | | 1,133,066 | |
Unrealized appreciation on swap agreements — OTC | | | 8,191,193 | |
Cash | | | 9,932,287 | |
Foreign currencies, at value (Cost $1,438) | | | 1,486 | |
Deposits with brokers: | | | | |
Cash collateral — futures contracts | | | 9,191,000 | |
Cash collateral — OTC derivatives | | | 9,039,293 | |
Receivable for: | | | | |
Fund shares sold | | | 43,648 | |
Dividends and interest | | | 1,017,997 | |
Fund expenses absorbed | | | 4,410 | |
Investment for trustee deferred compensation and retirement plans | | | 105,793 | |
Total assets | | | 1,199,690,937 | |
| |
Liabilities: | | | | |
Other investments: | | | | |
Swaps payable — OTC | | | 608,908 | |
Unrealized depreciation on swap agreements — OTC | | | 74,084 | |
Payable for: | | | | |
Fund shares reacquired | | | 231,854 | |
Accrued fees to affiliates | | | 1,174,223 | |
Accrued trustees’ and officers’ fees and benefits | | | 1,228 | |
Accrued other operating expenses | | | 63,825 | |
Trustee deferred compensation and retirement plans | | | 119,870 | |
Total liabilities | | | 2,273,992 | |
Net assets applicable to shares outstanding | | $ | 1,197,416,945 | |
| |
Net assets consist of: | | | | |
Shares of beneficial interest | | $ | 1,088,131,232 | |
Undistributed net investment income | | | 6,690,148 | |
Undistributed net realized gain | | | 86,636,605 | |
Net unrealized appreciation | | | 15,958,960 | |
| | | $ | 1,197,416,945 | |
| |
Net Assets: | | | | |
Series I | | $ | 39,340,358 | |
Series II | | $ | 1,158,076,587 | |
|
Shares outstanding, no par value,
with an unlimited number of shares authorized: | |
Series I | | | 3,478,326 | |
Series II | | | 103,694,237 | |
Series I: | | | | |
Net asset value and offering price per share | | $ | 11.31 | |
Series II: | | | | |
Net asset value per share | | $ | 11.17 | |
| | | | |
Investment income: | | | | |
Dividends from affiliated money market funds | | $ | 7,762,271 | |
Interest | | | 1,504,055 | |
Total investment income | | | 9,266,326 | |
| |
Expenses: | | | | |
Advisory fees | | | 10,822,792 | |
Administrative services fees | | | 2,057,695 | |
Custodian fees | | | 17,745 | |
Distribution fees — Series II | | | 2,875,453 | |
Transfer agent fees | | | 25,141 | |
Trustees’ and officers’ fees and benefits | | | 36,787 | |
Reports to shareholders | | | 124,095 | |
Professional services fees | | | 68,969 | |
Other | | | 16,650 | |
Total expenses | | | 16,045,327 | |
Less: Fees waived | | | (5,103,040 | ) |
Net expenses | | | 10,942,287 | |
Net investment income (loss) | | | (1,675,961 | ) |
| |
Realized and unrealized gain (loss) from: | | | | |
Net realized gain (loss) from: | | | | |
Investment securities | | | (6,652,593 | ) |
Foreign currencies | | | (173,894 | ) |
Futures contracts | | | 99,163,916 | |
Swap agreements | | | 9,156,992 | |
| | | | 101,494,421 | |
Change in net unrealized appreciation (depreciation) of: | | | | |
Investment securities | | | 3,268,818 | |
Foreign currencies | | | 473 | |
Futures contracts | | | (2,169,999 | ) |
Swap agreements | | | 9,696,284 | |
| | | | 10,795,576 | |
Net realized and unrealized gain | | | 112,289,997 | |
Net increase in net assets resulting from operations | | $ | 110,614,036 | |
See accompanying Notes to Consolidated Financial Statements which are an integral part of the financial statements.
Invesco V.I. Balanced-Risk Allocation Fund
Consolidated Statement of Changes in Net Assets
For the years ended December 31, 2017 and 2016
| | | | | | | | |
| | | 2017 | | | 2016 | |
Operations: | | | | | | | | |
Net investment income (loss) | | $ | (1,675,961 | ) | | $ | (5,966,345 | ) |
Net realized gain | | | 101,494,421 | | | | 110,140,284 | |
Change in net unrealized appreciation | | | 10,795,576 | | | | 5,010,818 | |
Net increase in net assets resulting from operations | | | 110,614,036 | | | | 109,184,757 | |
| | |
Distributions to shareholders from net investment income: | | | | | | | | |
Series I | | | (1,508,787 | ) | | | (141,115 | ) |
Series ll | | | (43,695,120 | ) | | | (1,965,605 | ) |
Total distributions from net investment income | | | (45,203,907 | ) | | | (2,106,720 | ) |
| | |
Distributions to shareholders from net realized gains: | | | | | | | | |
Series l | | | (2,046,037 | ) | | | — | |
Series ll | | | (62,678,695 | ) | | | — | |
Total distributions from net realized gains | | | (64,724,732 | ) | | | — | |
| | |
Share transactions–net: | | | | | | | | |
Series l | | | 4,606,109 | | | | 4,731,130 | |
Series ll | | | 43,872,788 | | | | 70,235,119 | |
Net increase in net assets resulting from share transactions | | | 48,478,897 | | | | 74,966,249 | |
Net increase in net assets | | | 49,164,294 | | | | 182,044,286 | |
| | |
Net assets: | | | | | | | | |
Beginning of year | | | 1,148,252,651 | | | | 966,208,365 | |
End of year (includes undistributed net investment income of $6,690,148 and $46,947,454, respectively) | | $ | 1,197,416,945 | | | $ | 1,148,252,651 | |
Notes to Consolidated Financial Statements
December 31, 2017
NOTE 1—Significant Accounting Policies
Invesco V.I. Balanced-Risk Allocation Fund (the “Fund”) is a series portfolio of AIM Variable Insurance Funds (Invesco Variable Insurance Funds) (the “Trust”). The Trust is a Delaware statutory trust registered under the Investment Company Act of 1940, as amended (the “1940 Act”), as an open-end series management investment company consisting of twenty-four separate portfolios, (each constituting a “Fund”). The assets, liabilities and operations of each portfolio are accounted for separately. Information presented in these consolidated financial statements pertains only to the Fund. Matters affecting each Fund or class will be voted on exclusively by the shareholders of such Fund or class. Current Securities and Exchange Commission (“SEC”) guidance, however, requires participating insurance companies offering separate accounts to vote shares proportionally in accordance with the instructions of the contract owners whose investments are funded by shares of each Fund or class.
The Fund will seek to gain exposure to the commodity markets primarily through investments in the Invesco Cayman Commodity Fund IV Ltd. (the “Subsidiary”), a wholly-owned subsidiary of the Fund organized under the laws of the Cayman Islands. The Subsidiary was organized by the Fund to invest in commodity-linked derivatives and other securities that may provide leveraged and non-leveraged exposure to commodities. The Fund may invest up to 25% of its total assets in the Subsidiary.
The Fund’s investment objective is total return with a low to moderate correlation to traditional financial market indices.
The Fund currently offers two classes of shares, Series I and Series II, both of which are offered to insurance company separate accounts funding variable annuity contracts and variable life insurance policies (“variable products”).
The Fund is an investment company and accordingly follows the investment company accounting and reporting guidance in accordance with Financial Accounting Standards Board Accounting Standards Codification Topic 946, Financial Services – Investment Companies.
The following is a summary of the significant accounting policies followed by the Fund in the preparation of its consolidated financial statements.
| A. | Security Valuations — Securities, including restricted securities, are valued according to the following policy. |
Debt obligations (including convertible securities) and unlisted equities are fair valued using an evaluated quote provided by an independent pricing service. Evaluated quotes provided by the pricing service may be determined without exclusive reliance on quoted prices, and may reflect appropriate factors such as institution-size trading in similar groups of securities, developments related to specific securities, dividend rate (for unlisted equities), yield (for debt obligations), quality, type of issue, coupon rate (for debt obligations), maturity (for debt obligations), individual trading characteristics and other market data. Pricing services generally value debt obligations assuming orderly transactions of institutional round lot size, but a fund may hold or transact in the same securities in smaller, odd lot sizes. Odd lots often trade at lower prices than institutional round lots. Debt obligations are subject to interest rate and credit risks. In addition, all debt obligations involve some risk of default with respect to interest and/or principal payments.
Invesco V.I. Balanced-Risk Allocation Fund
A security listed or traded on an exchange (except convertible securities) is valued at its last sales price or official closing price as of the close of the customary trading session on the exchange where the security is principally traded, or lacking any sales or official closing price on a particular day, the security may be valued at the closing bid price on that day. Securities traded in the over-the-counter market are valued based on prices furnished by independent pricing services or market makers. When such securities are valued by an independent pricing service they may be considered fair valued. Futures contracts are valued at the final settlement price set by an exchange on which they are principally traded. Listed options are valued at the mean between the last bid and asked prices from the exchange on which they are principally traded. Options not listed on an exchange are valued by an independent source at the mean between the last bid and asked prices. For purposes of determining net asset value (“NAV”) per share, futures and option contracts generally are valued 15 minutes after the close of the customary trading session of the New York Stock Exchange (“NYSE”).
Investments in open-end and closed-end registered investment companies that do not trade on an exchange are valued at the end-of-day net asset value per share. Investments in open-end and closed-end registered investment companies that trade on an exchange are valued at the last sales price or official closing price as of the close of the customary trading session on the exchange where the security is principally traded.
Swap agreements are fair valued using an evaluated quote, if available, provided by an independent pricing service. Evaluated quotes provided by the pricing service are valued based on a model which may include end-of-day net present values, spreads, ratings, industry, company performance and returns of referenced assets. Centrally cleared swap agreements are valued at the daily settlement price determined by the relevant exchange or clearinghouse.
Foreign securities’ (including foreign exchange contracts) prices are converted into U.S. dollar amounts using the applicable exchange rates as of the close of the NYSE. If market quotations are available and reliable for foreign exchange-traded equity securities, the securities will be valued at the market quotations. Because trading hours for certain foreign securities end before the close of the NYSE, closing market quotations may become unreliable. If between the time trading ends on a particular security and the close of the customary trading session on the NYSE, events occur that the investment adviser determines are significant and make the closing price unreliable, the Fund may fair value the security. If the event is likely to have affected the closing price of the security, the security will be valued at fair value in good faith using procedures approved by the Board of Trustees. Adjustments to closing prices to reflect fair value may also be based on a screening process of an independent pricing service to indicate the degree of certainty, based on historical data, that the closing price in the principal market where a foreign security trades is not the current value as of the close of the NYSE. Foreign securities’ prices meeting the approved degree of certainty that the price is not reflective of current value will be priced at the indication of fair value from the independent pricing service. Multiple factors may be considered by the independent pricing service in determining adjustments to reflect fair value and may include information relating to sector indices, American Depositary Receipts and domestic and foreign index futures. Foreign securities may have additional risks including exchange rate changes, potential for sharply devalued currencies and high inflation, political and economic upheaval, the relative lack of issuer information, relatively low market liquidity and the potential lack of strict financial and accounting controls and standards.
Securities for which market prices are not provided by any of the above methods may be valued based upon quotes furnished by independent sources. The last bid price may be used to value equity securities. The mean between the last bid and asked prices is used to value debt obligations, including corporate loans.
Securities for which market quotations are not readily available or became unreliable are valued at fair value as determined in good faith by or under the supervision of the Trust’s officers following procedures approved by the Board of Trustees. Issuer specific events, market trends, bid/asked quotes of brokers and information providers and other market data may be reviewed in the course of making a good faith determination of a security’s fair value.
The Fund may invest in securities that are subject to interest rate risk, meaning the risk that the prices will generally fall as interest rates rise and, conversely, the prices will generally rise as interest rates fall. Specific securities differ in their sensitivity to changes in interest rates depending on their individual characteristics. Changes in interest rates may result in increased market volatility, which may affect the value and/or liquidity of certain Fund investments.
Valuations change in response to many factors including the historical and prospective earnings of the issuer, the value of the issuer’s assets, general economic conditions, interest rates, investor perceptions and market liquidity. Because of the inherent uncertainties of valuation, the values reflected in the consolidated financial statements may materially differ from the value received upon actual sale of those investments.
| B. | Securities Transactions and Investment Income — Securities transactions are accounted for on a trade date basis. Realized gains or losses on sales are computed on the basis of specific identification of the securities sold. Interest income (net of withholding tax, if any) is recorded on the accrual basis from settlement date. Bond premiums and discounts are amortized and/or accreted over the lives of the respective securities. Pay-in-kind interest income and non-cash dividend income received in the form of securities in-lieu of cash are recorded at the fair value of the securities received. Dividend income (net of withholding tax, if any) is recorded on the ex-dividend date. |
The Fund may periodically participate in litigation related to Fund investments. As such, the Fund may receive proceeds from litigation settlements. Any proceeds received are included in the Consolidated Statement of Operations as realized gain (loss) for investments no longer held and as unrealized gain (loss) for investments still held.
Brokerage commissions and mark ups are considered transaction costs and are recorded as an increase to the cost basis of securities purchased and/or a reduction of proceeds on a sale of securities. Such transaction costs are included in the determination of net realized and unrealized gain (loss) from investment securities reported in the Consolidated Statement of Operations and the Consolidated Statement of Changes in Net Assets and the net realized and unrealized gains (losses) on securities per share in the Financial Highlights. Transaction costs are included in the calculation of the Fund’s net asset value and, accordingly, they reduce the Fund’s total returns. These transaction costs are not considered operating expenses and are not reflected in net investment income reported in the Consolidated Statement of Operations and the Consolidated Statement of Changes in Net Assets, or the net investment income per share and the ratios of expenses and net investment income reported in the Financial Highlights, nor are they limited by any expense limitation arrangements between the Fund and the investment adviser.
The Fund allocates income and realized and unrealized capital gains and losses to a class based on the relative net assets of each class.
| C. | Country Determination — For the purposes of making investment selection decisions and presentation in the Consolidated Schedule of Investments, the investment adviser may determine the country in which an issuer is located and/or credit risk exposure based on various factors. These factors include the laws of the country under which the issuer is organized, where the issuer maintains a principal office, the country in |
Invesco V.I. Balanced-Risk Allocation Fund
| | which the issuer derives 50% or more of its total revenues and the country that has the primary market for the issuer’s securities, as well as other criteria. Among the other criteria that may be evaluated for making this determination are the country in which the issuer maintains 50% or more of its assets, the type of security, financial guarantees and enhancements, the nature of the collateral and the sponsor organization. Country of issuer and/or credit risk exposure has been determined to be the United States of America, unless otherwise noted. |
| D. | Distributions — Distributions from net investment income and net realized capital gain, if any, are generally declared and paid to separate accounts of participating insurance companies annually and recorded on the ex-dividend date. |
| E. | Federal Income Taxes — The Fund intends to comply with the requirements of Subchapter M of the Internal Revenue Code of 1986, as amended (the “Internal Revenue Code”), necessary to qualify as a regulated investment company and to distribute substantially all of the Fund’s taxable earnings to shareholders. As such, the Fund will not be subject to federal income taxes on otherwise taxable income (including net realized capital gain) that is distributed to shareholders. Therefore, no provision for federal income taxes is recorded in the consolidated financial statements. |
The Fund recognizes the tax benefits of uncertain tax positions only when the position is more likely than not to be sustained. Management has analyzed the Fund’s uncertain tax positions and concluded that no liability for unrecognized tax benefits should be recorded related to uncertain tax positions. Management is not aware of any tax positions for which it is reasonably possible that the total amounts of unrecognized tax benefits will change materially in the next 12 months.
The Subsidiary is classified as a controlled foreign corporation under Subchapter N of the Internal Revenue Code. Therefore, the Fund is required to increase its taxable income by its share of the Subsidiary’s income. Net investment losses of the Subsidiary cannot be deducted by the Fund in the current period nor carried forward to offset taxable income in future periods.
The Fund files tax returns in the U.S. Federal jurisdiction and certain other jurisdictions. Generally the Fund is subject to examinations by such taxing authorities for up to three years after the filing of the return for the tax period.
| F. | Expenses — Fees provided for under the Rule 12b-1 plan of a particular class of the Fund and which are directly attributable to that class are charged to the operations of such class. All other expenses are allocated among the classes based on relative net assets. |
| G. | Accounting Estimates — The financial statements are prepared on a consolidated basis in conformity with accounting principles generally accepted in the United States of America (“GAAP”), which requires management to make estimates and assumptions that affect the reported amounts of assets and liabilities at the date of the financial statements and the reported amounts of revenues and expenses during the reporting period including estimates and assumptions related to taxation. Actual results could differ from those estimates by a significant amount. The accompanying financial statements reflect the financial position of the Fund and its Subsidiary and the results of operations on a consolidated basis. All inter-company accounts and transactions have been eliminated in consolidation. |
In addition, the Fund monitors for material events or transactions that may occur or become known after the period-end date and before the date the consolidated financial statements are released to print.
| H. | Indemnifications — Under the Trust’s organizational documents, each Trustee, officer, employee or other agent of the Trust, and under the Subsidiary’s organizational documents, the directors and officers of the Subsidiary, are indemnified against certain liabilities that may arise out of the performance of their duties to the Fund and/or the Subsidiary, respectively. Additionally, in the normal course of business, the Fund enters into contracts, including the Fund’s servicing agreements, that contain a variety of indemnification clauses. The Fund’s maximum exposure under these arrangements is unknown as this would involve future claims that may be made against the Fund that have not yet occurred. The risk of material loss as a result of such indemnification claims is considered remote. |
| I. | Foreign Currency Translations — Foreign currency is valued at the close of the NYSE based on quotations posted by banks and major currency dealers. Portfolio securities and other assets and liabilities denominated in foreign currencies are translated into U.S. dollar amounts at date of valuation. Purchases and sales of portfolio securities (net of foreign taxes withheld on disposition) and income items denominated in foreign currencies are translated into U.S. dollar amounts on the respective dates of such transactions. The Fund does not separately account for the portion of the results of operations resulting from changes in foreign exchange rates on investments and the fluctuations arising from changes in market prices of securities held. The combined results of changes in foreign exchange rates and the fluctuation of market prices on investments (net of estimated foreign tax withholding) are included with the net realized and unrealized gain or loss from investments in the Consolidated Statement of Operations. Reported net realized foreign currency gains or losses arise from (1) sales of foreign currencies, (2) currency gains or losses realized between the trade and settlement dates on securities transactions, and (3) the difference between the amounts of dividends, interest, and foreign withholding taxes recorded on the Fund’s books and the U.S. dollar equivalent of the amounts actually received or paid. Net unrealized foreign currency gains and losses arise from changes in the fair values of assets and liabilities, other than investments in securities at fiscal period end, resulting from changes in exchange rates. |
The Fund may invest in foreign securities, which may be subject to foreign taxes on income, gains on investments or currency repatriation, a portion of which may be recoverable. Foreign taxes, if any, are recorded based on the tax regulations and rates that exist in the foreign markets in which the Fund invests and are shown in the Consolidated Statement of Operations.
| J. | Forward Foreign Currency Contracts — The Fund may engage in foreign currency transactions either on a spot (i.e. for prompt delivery and settlement) basis, or through forward foreign currency contracts, to manage or minimize currency or exchange rate risk. |
The Fund may also enter into forward foreign currency contracts for the purchase or sale of a security denominated in a foreign currency in order to “lock in” the U.S. dollar price of that security, or the Fund may also enter into forward foreign currency contracts that do not provide for physical settlement of the two currencies, but instead are settled by a single cash payment calculated as the difference between the agreed upon exchange rate and the spot rate at settlement based upon an agreed upon notional amount (non-deliverable forwards). The Fund will set aside liquid assets in an amount equal to the daily mark-to-market obligation for forward foreign currency contracts.
A forward foreign currency contract is an obligation between two parties (“Counterparties”) to purchase or sell a specific currency for an agreed-upon price at a future date. The use of forward foreign currency contracts does not eliminate fluctuations in the price of the underlying securities the Fund owns or intends to acquire but establishes a rate of exchange in advance. Fluctuations in the value of these contracts are measured by the difference in the contract date and reporting date exchange rates and are recorded as unrealized appreciation (depreciation) until the contracts are closed. When the contracts are closed, realized gains (losses) are recorded. Realized and unrealized gains (losses) on the contracts are included in the Consolidated Statement of Operations. The primary risks associated with forward foreign currency contracts include
Invesco V.I. Balanced-Risk Allocation Fund
failure of the Counterparty to meet the terms of the contract and the value of the foreign currency changing unfavorably. These risks may be in excess of the amounts reflected in the Consolidated Statement of Assets and Liabilities.
| K. | Structured Securities — The Fund may invest in structured securities. Structured securities are a type of derivative security whose value is determined by reference to changes in the value of underlying securities, currencies, interest rates, commodities, indices or other financial indicators (“reference instruments”). Most structured securities are fixed-income securities that have maturities of three years or less. Structured securities may be positively or negatively indexed (i.e., their principal value or interest rates may increase or decrease if the underlying reference instrument appreciates) and may have return characteristics similar to direct investments in the underlying reference instrument. |
Structured securities may entail a greater degree of market risk than other types of debt securities because the investor bears the risk of the reference instruments. In addition to the credit risk of structured securities and the normal risks of price changes in response to changes in interest rates, the principal amount of structured notes or indexed securities may decrease as a result of changes in the value of the underlying reference instruments. Changes in the daily value of structured securities are recorded as unrealized gains (losses) in the Consolidated Statement of Operations. When the structured securities mature or are sold, the Fund recognizes a realized gain (loss) on the Consolidated Statement of Operations.
| L. | Futures Contracts — The Fund may enter into futures contracts to equitize the Fund’s cash holdings or to manage exposure to interest rate, equity, commodity and market price movements and/or currency risks. A futures contract is an agreement between Counterparties to purchase or sell a specified underlying security, currency or commodity (or delivery of a cash settlement price, in the case of an index future) for a fixed price at a future date. The Fund currently invests only in exchange-traded futures and they are standardized as to maturity date and underlying financial instrument. Initial margin deposits required upon entering into futures contracts are satisfied by the segregation of specific securities or cash as collateral at the futures commission merchant (broker). During the period the futures contracts are open, changes in the value of the contracts are recognized as unrealized gains or losses by recalculating the value of the contracts on a daily basis. Subsequent or variation margin payments are received or made depending upon whether unrealized gains or losses are incurred. These amounts are reflected as receivables or payables on the Consolidated Statement of Assets and Liabilities. When the contracts are closed or expire, the Fund recognizes a realized gain or loss equal to the difference between the proceeds from, or cost of, the closing transaction and the Fund’s basis in the contract. The net realized gain (loss) and the change in unrealized gain (loss) on futures contracts held during the period is included on the Consolidated Statement of Operations. The primary risks associated with futures contracts are market risk and the absence of a liquid secondary market. If the Fund were unable to liquidate a futures contract and/or enter into an offsetting closing transaction, the Fund would continue to be subject to market risk with respect to the value of the contracts and continue to be required to maintain the margin deposits on the futures contracts. Futures contracts have minimal Counterparty risk since the exchange’s clearinghouse, as Counterparty to all exchange-traded futures, guarantees the futures against default. Risks may exceed amounts recognized in the Consolidated Statement of Assets and Liabilities. |
| M. | Swap Agreements — The Fund may enter into various swap transactions, including interest rate, total return, index, currency, commodity and credit default swap contracts (“CDS”) for investment purposes or to manage interest rate, currency or credit risk. Such transactions are agreements between Counterparties. These agreements may contain among other conditions, events of default and termination events, and various covenants and representations such as provisions that require the Fund to maintain a pre-determined level of net assets, and/or provide limits regarding the decline of the Fund’s NAV over specific periods of time. If the Fund were to trigger such provisions and have open derivative positions at that time, the Counterparty may be able to terminate such agreement and request immediate payment in an amount equal to the net liability positions, if any. |
Interest rate, total return, index, and currency swap agreements are two-party contracts entered into primarily to exchange the returns (or differentials in rates of returns) earned or realized on particular predetermined investments or instruments. The gross returns to be exchanged or “swapped” between the parties are calculated with respect to a notional amount, i.e., the return on or increase in value of a particular dollar amount invested at a particular interest rate or return of an underlying asset, in a particular foreign currency, or in a “basket” of securities representing a particular index.
An interest rate swap is an agreement between Counterparties pursuant to which the parties exchange a floating rate payment for a fixed rate payment based on a specified notional amount.
A total return swap is an agreement in which one party makes payments based on a set rate, either fixed or variable, while the other party makes payments based on the return of an underlying asset, which includes both the income generated and capital gains, if any. The unrealized appreciation (depreciation) on total return swaps includes dividends on the underlying securities and financing rate payable from the Counterparty. At the maturity date, a net cash flow is exchanged where the total return is equivalent to the return of the underlying reference less a financing rate, if any. As a receiver, the Fund would receive payments based on any positive total return and would owe payments in the event of a negative total return. As the payer, the Fund would owe payments on any net positive total return, and would receive payment in the event of a negative total return.
Changes in the value of swap agreements are recognized as unrealized gains (losses) in the Consolidated Statement of Operations by “marking to market” on a daily basis to reflect the value of the swap agreement at the end of each trading day. Payments received or paid at the beginning of the agreement are reflected as such on the Consolidated Statement of Assets and Liabilities and may be referred to as upfront payments. The Fund accrues for the fixed payment stream and amortizes upfront payments, if any, on swap agreements on a daily basis with the net amount, recorded as a component of realized gain (loss) on the Consolidated Statement of Operations. A liquidation payment received or made at the termination of a swap agreement is recorded as realized gain (loss) on the Consolidated Statement of Operations. The Fund segregates cash or liquid securities having a value at least equal to the amount of the potential obligation of a Fund under any swap transaction. Cash held as collateral is recorded as deposits with brokers on the Consolidated Statement of Assets and Liabilities. Entering into these agreements involves, to varying degrees, lack of liquidity and elements of credit, market, and Counterparty risk in excess of amounts recognized on the Consolidated Statement of Assets and Liabilities. Such risks involve the possibility that a swap is difficult to sell or liquidate; the Counterparty does not honor its obligations under the agreement and unfavorable interest rates and market fluctuations. It is possible that developments in the swaps market, including potential government regulation, could adversely affect the Fund’s ability to terminate existing swap agreements or to realize amounts to be received under such agreements. A short position in a security poses more risk than holding the same security long. As there is no limit on how much the price of the security can increase, the Fund’s exposure is unlimited.
Invesco V.I. Balanced-Risk Allocation Fund
| N. | Leverage Risk — Leverage exists when the Fund can lose more than it originally invests because it purchases or sells an instrument or enters into a transaction without investing an amount equal to the full economic exposure of the instrument or transaction. |
| O. | Other Risks — The Fund will seek to gain exposure to commodity markets primarily through an investment in the Subsidiary and through investments in exchange-traded funds and commodity-linked derivatives. The Subsidiary, unlike the Fund, may invest without limitation in commodities, commodity-linked derivatives and other securities, such as exchange-traded and commodity-linked notes, that may provide leveraged and non-leveraged exposure to commodity markets. The Fund is indirectly exposed to the risks associated with the Subsidiary’s investments. |
| P. | Collateral — To the extent the Fund has designated or segregated a security as collateral and that security is subsequently sold, it is the Fund’s practice to replace such collateral no later than the next business day. |
NOTE 2—Advisory Fees and Other Fees Paid to Affiliates
The Trust has entered into a master investment advisory agreement with Invesco Advisers, Inc. (the “Adviser” or “Invesco”). Under the terms of the investment advisory agreement, the Fund accrues daily and pays monthly an advisory fee to the Adviser less the amount paid by the Subsidiary to the Adviser based on the annual rate of the Fund’s average daily net assets as follows:
| | | | | | | | |
| Average Daily Net Assets | | Rate | |
First $250 million | | | 0 | .95% | | | | |
Next $250 million | | | 0 | .925% | | | | |
Next $500 million | | | 0 | .90% | | | | |
Next $1.5 billion | | | 0 | .875% | | | | |
Next $2.5 billion | | | 0 | .85% | | | | |
Next $2.5 billion | | | 0 | .825% | | | | |
Next $2.5 billion | | | 0 | .80% | | | | |
Over $10 billion | | | 0 | .775% | | | | |
For the year ended December 31, 2017, the effective advisory fees incurred by the Fund was 0.91%.
The Subsidiary has entered into a separate contract with the Adviser whereby the Adviser provides investment advisory and other services to the Subsidiary. In consideration of these services, the Subsidiary pays an advisory fee to the Adviser based on the annual rate of the Subsidiary’s average daily net assets as set forth in the table above.
Under the terms of a master sub-advisory agreement between the Adviser and each of Invesco Asset Management Deutschland GmbH, Invesco Asset Management Limited, Invesco Asset Management (Japan) Limited, Invesco Hong Kong Limited, Invesco Senior Secured Management, Inc. and Invesco Canada Ltd. and separate sub-advisory agreements with Invesco PowerShares Capital Management LLC and Invesco Asset Management (India) Private Limited (collectively, the “Affiliated Sub-Advisers”) the Adviser, not the Fund, will pay 40% of the fees paid to the Adviser to any such Affiliated Sub-Adviser(s) that provide(s) discretionary investment management services to the Fund based on the percentage of assets allocated to such Affiliated Sub-Adviser(s).
The Adviser has contractually agreed, through at least April 30, 2019, to waive advisory fees and/or reimburse expenses of shares to the extent necessary to limit total annual fund operating expenses after fee waiver and/or expense reimbursement (including prior fiscal year-end Acquired Fund Fees and Expenses of 0.13% and excluding certain items discussed below) of Series I shares to 0.80% and Series II shares to 1.05% of average daily net assets (the “expense limits”). In determining the Adviser’s obligation to waive advisory fees and/or reimburse expenses, the following expenses are not taken into account, and could cause the total annual fund operating expenses after fee waiver and/or expense reimbursement to exceed the numbers reflected above: (1) interest; (2) taxes; (3) dividend expense on short sales; (4) extraordinary or non-routine items, including litigation expenses; and (5) expenses that the Fund has incurred but did not actually pay because of an expense offset arrangement. Acquired Fund Fees and Expenses are not operating expenses of the Fund directly, but are fees and expenses, including management fees, of the investment companies in which the Fund invests. As a result, the total annual fund operating expenses after expense reimbursement may exceed the expense limits above. Unless Invesco continues the fee waiver agreement, it will terminate on April 30, 2019. During its term, the fee waiver agreement cannot be terminated or amended to increase the expense limits or reduce the advisory fee waiver without approval of the Board of Trustees.
Further, the Adviser has contractually agreed, through at least June 30, 2019, to waive the advisory fee payable by the Fund in an amount equal to 100% of the net advisory fees the Adviser receives from the affiliated money market funds on investments by the Fund of uninvested cash in such affiliated money market funds.
For the year ended December 31, 2017, the Adviser waived advisory fees of $5,103,040.
The Trust has entered into a master administrative services agreement with Invesco pursuant to which the Fund has agreed to pay Invesco a fee for costs incurred in providing accounting services and fund administrative services to the Fund and to reimburse Invesco for fees paid to insurance companies that have agreed to provide certain administrative services to the Fund. These administrative services provided by the insurance companies may include, among other things: maintenance of master accounts with the Fund; tracking, recording and transmitting net purchase and redemption orders for Fund shares; maintaining and preserving records related to the purchase, redemption and other account activity of variable product owners; distributing copies of Fund documents such as prospectuses, proxy materials and periodic reports, to variable product owners, and responding to inquiries from variable product owners about the Fund. Pursuant to such agreement, for the year ended December 31, 2017, Invesco was paid $277,985 for accounting and fund administrative services and was reimbursed $1,779,710 for fees paid to insurance companies.
Invesco V.I. Balanced-Risk Allocation Fund
The Trust has entered into a transfer agency and service agreement with Invesco Investment Services, Inc. (“IIS”) pursuant to which the Fund has agreed to pay IIS a fee for providing transfer agency and shareholder services to the Fund and reimburse IIS for certain expenses incurred by IIS in the course of providing such services. For the year ended December 31, 2017, expenses incurred under the agreement are shown in the Consolidated Statement of Operations as Transfer agent fees.
The Trust has entered into a master distribution agreement with Invesco Distributors, Inc. (“IDI”) to serve as the distributor for the Fund. The Trust has adopted a plan pursuant to Rule 12b-1 under the 1940 Act with respect to the Fund’s Series II shares (the “Plan”). The Fund, pursuant to the Plan, pays IDI compensation at the annual rate of 0.25% of the Fund’s average daily net assets of Series II shares. The fees are accrued daily and paid monthly. Of the Plan payments, up to 0.25% of the average daily net assets of the Series II shares may be paid to insurance companies who furnish continuing personal shareholder services to customers who purchase and own Series II shares of the Fund. For the year ended December 31, 2017, expenses incurred under the Plan are detailed in the Consolidated Statement of Operations as Distribution fees.
Certain officers and trustees of the Trust are officers and directors of the Adviser, IIS and/or IDI.
NOTE 3—Additional Valuation Information
GAAP defines fair value as the price that would be received to sell an asset or paid to transfer a liability in an orderly transaction between market participants at the measurement date, under current market conditions. GAAP establishes a hierarchy that prioritizes the inputs to valuation methods, giving the highest priority to readily available unadjusted quoted prices in an active market for identical assets (Level 1) and the lowest priority to significant unobservable inputs (Level 3), generally when market prices are not readily available or are unreliable. Based on the valuation inputs, the securities or other investments are tiered into one of three levels. Changes in valuation methods may result in transfers in or out of an investment’s assigned level:
| | Level 1 — | Prices are determined using quoted prices in an active market for identical assets. |
| | Level 2 — | Prices are determined using other significant observable inputs. Observable inputs are inputs that other market participants may use in pricing a security. These may include quoted prices for similar securities, interest rates, prepayment speeds, credit risk, yield curves, loss severities, default rates, discount rates, volatilities and others. |
| | Level 3 — | Prices are determined using significant unobservable inputs. In situations where quoted prices or observable inputs are unavailable (for example, when there is little or no market activity for an investment at the end of the period), unobservable inputs may be used. Unobservable inputs reflect the Fund’s own assumptions about the factors market participants would use in determining fair value of the securities or instruments and would be based on the best available information. |
The following is a summary of the tiered valuation input levels, as of December 31, 2017. The level assigned to the securities valuations may not be an indication of the risk or liquidity associated with investing in those securities. Because of the inherent uncertainties of valuation, the values reflected in the consolidated financial statements may materially differ from the value received upon actual sale of those investments.
The Fund’s policy is to recognize transfers in and out of the valuation levels as of the end of the reporting period. During the year ended December 31, 2017, there were no material transfers between valuation levels.
| | | | | | | | | | | | | | | | |
| | | Level 1 | | | Level 2 | | | Level 3 | | | Total | |
Investments in Securities | | | | | | | | | | | | | | | | |
U.S. Treasury Securities | | $ | — | | | $ | 131,303,781 | | | $ | �� | | | $ | 131,303,781 | |
Commodity Linked Securities | | | — | | | | 23,918,960 | | | | — | | | | 23,918,960 | |
Money Market Funds | | | 1,004,893,828 | | | | — | | | | — | | | | 1,004,893,828 | |
Total Investments in Securities | | | 1,004,893,828 | | | | 155,222,741 | | | | — | | | | 1,160,116,569 | |
Other Investments – Assets* | | | | | | | | | | | | | | | | |
Futures Contracts | | | 15,419,756 | | | | — | | | | — | | | | 15,419,756 | |
Swap Agreements | | | — | | | | 8,191,193 | | | | — | | | | 8,191,193 | |
| | | | 15,419,756 | | | | 8,191,193 | | | | — | | | | 23,610,949 | |
Other Investments – Liabilities* | | | | | | | | | | | | | | | | |
Futures Contracts | | | (7,591,168 | ) | | | — | | | | — | | | | (7,591,168 | ) |
Swap Agreements | | | — | | | | (74,084 | ) | | | — | | | | (74,084 | ) |
| | | | (7,591,168 | ) | | | (74,084 | ) | | | — | | | | (7,665,252 | ) |
Total Other Investments | | | 7,828,588 | | | | 8,117,109 | | | | — | | | | 15,945,697 | |
Total Investments | | $ | 1,012,722,416 | | | $ | 163,339,850 | | | $ | — | | | $ | 1,176,062,266 | |
| * | Unrealized appreciation (depreciation). |
NOTE 4—Derivative Investments
The Fund may enter into an International Swaps and Derivatives Association Master Agreement (“ISDA Master Agreement”) under which a fund may trade OTC derivatives. An OTC transaction entered into under an ISDA Master Agreement typically involves a collateral posting arrangement, payment netting provisions and close-out netting provisions. These netting provisions allow for reduction of credit risk through netting of contractual obligations. The enforceability of the netting provisions of the ISDA Master Agreement depends on the governing law of the ISDA Master Agreement, among other factors.
For financial reporting purposes, the Fund does not offset OTC derivative assets or liabilities that are subject to ISDA Master Agreements in the Consolidated Statement of Assets and Liabilities.
Invesco V.I. Balanced-Risk Allocation Fund
Value of Derivative Investments at Period-End
The table below summarizes the value of the Fund’s derivative investments, detailed by primary risk exposure, held as of December 31, 2017:
| | | | | | | | | | | | | | | | |
| | | Value | |
| Derivative Assets | | Commodity
Risk | | | Equity Risk | | | Interest Rate
Risk | | | Total | |
Unrealized appreciation on futures contracts — Exchange-Traded(a) | | $ | 5,969,784 | | | $ | 8,595,430 | | | $ | 854,542 | | | $ | 15,419,756 | |
Unrealized appreciation on swap agreements — OTC | | | 7,857,477 | | | | 333,716 | | | | — | | | | 8,191,193 | |
Total Derivative Assets | | | 13,827,261 | | | | 8,929,146 | | | | 854,542 | | | | 23,610,949 | |
Derivatives not subject to master netting agreements | | | (5,969,784 | ) | | | (8,595,430 | ) | | | (854,542 | ) | | | (15,419,756 | ) |
Total Derivative Assets subject to master netting agreements | | $ | 7,857,477 | | | $ | 333,716 | | | $ | — | | | $ | 8,191,193 | |
| |
| | | Value | |
| Derivative Liabilities | | Commodity
Risk | | | Equity Risk | | | Interest Rate
Risk | | | Total | |
Unrealized depreciation on futures contracts — Exchange-Traded(a) | | $ | (96,852 | ) | | $ | (2,208,417 | ) | | $ | (5,285,899 | ) | | $ | (7,591,168 | ) |
Unrealized depreciation on swap agreements — OTC | | | — | | | | — | | | | (74,084 | ) | | | (74,084 | ) |
Total Derivative Liabilities | | | (96,852 | ) | | | (2,208,417 | ) | | | (5,359,983 | ) | | | (7,665,252 | ) |
Derivatives not subject to master netting agreements | | | 96,852 | | | | 2,208,417 | | | | 5,285,899 | | | | 7,591,168 | |
Total Derivative Liabilities subject to master netting agreements | | $ | — | | | $ | — | | | $ | (74,084 | ) | | $ | (74,084 | ) |
| (a) | The daily variation margin receivable at period-end is recorded in the Consolidated Statement of Assets and Liabilities. |
Offsetting Assets and Liabilities
The table below reflects the Fund’s exposure to Counterparties subject to either an ISDA Master Agreement or other agreement for OTC derivative transactions as of December 31, 2017.
| | | | | | | | | | | | | | | | | | | | | | | | |
| | | Financial
Derivative
Assets | | | Financial
Derivative
Liabilities | | | Net Value of
Derivatives | | | Collateral
(Received)/Pledged | | | Net
Amount(b) | |
| Counterparty | | Swap
Agreements | | | Swap
Agreements | | | | Non-Cash | | | Cash | | |
Fund | | | | | | | | | | | | | | | | | | | | | | | | |
Goldman Sachs International | | $ | 333,716 | | | $ | (111,592 | ) | | $ | 222,124 | | | $ | — | | | $ | — | | | $ | 222,124 | |
Macquarie Bank Ltd. | | | — | | | | (75,025 | ) | | | (75,025 | ) | | | — | | | | — | | | | (75,025 | ) |
Subtotal — Fund | | | 333,716 | | | | (186,617 | ) | | | 147,099 | | | | — | | | | — | | | | 147,099 | |
| | | | | | |
Subsidiary | | | | | | | | | | | | | | | | | | | | | | | | |
Barclays Bank PLC | | | 1,933,173 | | | | (12,482 | ) | | | 1,920,691 | | | | — | | | | — | | | | 1,920,691 | |
Cargill, Inc. | | | 311,754 | | | | (24,698 | ) | | | 287,056 | | | | — | | | | — | | | | 287,056 | |
Canadian Imperial Bank of Commerce | | | 2,638,807 | | | | (24,193 | ) | | | 2,614,614 | | | | — | | | | — | | | | 2,614,614 | |
Goldman Sachs International | | | 114,705 | | | | (8,981 | ) | | | 105,724 | | | | — | | | | — | | | | 105,724 | |
J.P. Morgan Chase Bank, N.A. | | | 898,584 | | | | (1,280 | ) | | | 897,304 | | | | — | | | | — | | | | 897,304 | |
Macquarie Bank Ltd. | | | 832,704 | | | | (1,164 | ) | | | 831,540 | | | | — | | | | (260,000 | ) | | | 571,540 | |
Merrill Lynch International | | | 811,294 | | | | (421,104 | ) | | | 390,190 | | | | — | | | | — | | | | 390,190 | |
Morgan Stanley Capital Services LLC | | | 1,449,522 | | | | (2,473 | ) | | | 1,447,049 | | | | — | | | | (1,340,000 | ) | | | 107,049 | |
Subtotal — Subsidiary | | $ | 8,990,543 | | | $ | (496,375 | ) | | $ | 8,494,168 | | | $ | — | | | $ | (1,600,000 | ) | | $ | 6,894,168 | |
Total | | $ | 9,324,259 | | | $ | (682,992 | ) | | $ | 8,641,267 | | | $ | — | | | $ | (1,600,000 | ) | | $ | 7,041,267 | |
| (b) | The Fund and the Subsidiary are recognized as separate legal entities and as such are subject to separate netting arrangements with the Counterparty. |
Invesco V.I. Balanced-Risk Allocation Fund
Effect of Derivative Investments for the year ended December 31, 2017
The table below summarizes the gains (losses) on derivative investments, detailed by primary risk exposure, recognized in earnings during the period:
| | | | | | | | | | | | | | | | |
| | | Location of Gain (Loss) on
Consolidated Statement of Operations | |
| | | Commodity
Risk | | | Equity Risk | | | Interest Rate
Risk | | | Total | |
Realized Gain (Loss): | | | | | | | | | | | | | | | | |
Futures contracts | | $ | 3,485,053 | | | $ | 82,408,649 | | | $ | 13,270,214 | | | $ | 99,163,916 | |
Swap agreements | | | 3,059,735 | | | | 6,764,613 | | | | (667,356 | ) | | | 9,156,992 | |
Change in Net Unrealized Appreciation (Depreciation): | | | | | | | | | | | | | | | | |
Futures contracts | | | 3,100,499 | | | | (269,988 | ) | | | (5,000,510 | ) | | | (2,169,999 | ) |
Swap agreements | | | 9,714,697 | | | | 55,671 | | | | (74,084 | ) | | | 9,696,284 | |
Total | | $ | 19,359,984 | | | $ | 88,958,945 | | | $ | 7,528,264 | | | $ | 115,847,193 | |
The table below summarizes the average notional value of futures contracts and swap agreements outstanding during the period.
| | | | | | | | |
| | | Futures Contracts | | | Swap
Agreements | |
Average notional value | | $ | 1,356,016,346 | | | $ | 278,427,349 | |
NOTE 5—Trustees’ and Officers’ Fees and Benefits
Trustees’ and Officers’ Fees and Benefits include amounts accrued by the Fund to pay remuneration to certain Trustees and Officers of the Fund. Trustees have the option to defer compensation payable by the Fund, and Trustees’ and Officers’ Fees and Benefits also include amounts accrued by the Fund to fund such deferred compensation amounts. Those Trustees who defer compensation have the option to select various Invesco Funds in which their deferral accounts shall be deemed to be invested. Finally, certain current Trustees were eligible to participate in a retirement plan that provided for benefits to be paid upon retirement to Trustees over a period of time based on the number of years of service. The Fund may have certain former Trustees who also participate in a retirement plan and receive benefits under such plan. Trustees’ and Officers’ Fees and Benefits include amounts accrued by the Fund to fund such retirement benefits. Obligations under the deferred compensation and retirement plans represent unsecured claims against the general assets of the Fund.
NOTE 6—Cash Balances
The Fund is permitted to temporarily carry a negative or overdrawn balance in its account with State Street Bank and Trust Company, the custodian bank. Such balances, if any at period-end, are shown in the Consolidated Statement of Assets and Liabilities under the payable caption Amount due custodian. To compensate the custodian bank for such overdrafts, the overdrawn Fund may either (1) leave funds as a compensating balance in the account so the custodian bank can be compensated by earning the additional interest; or (2) compensate by paying the custodian bank at a rate agreed upon by the custodian bank and Invesco, not to exceed the contractually agreed upon rate.
NOTE 7—Distributions to Shareholders and Tax Components of Net Assets
Tax Character of Distributions to Shareholders Paid During the Fiscal Years Ended December 31, 2017 and 2016:
| | | | | | | | |
| | | 2017 | | | 2016 | |
Ordinary income | | $ | 72,920,240 | | | $ | 2,106,720 | |
Long-term capital gain | | | 37,008,399 | | | | — | |
Total distributions | | $ | 109,928,639 | | | $ | 2,106,720 | |
Tax Components of Net Assets at Period-End:
| | | | |
| | | 2017 | |
Undistributed ordinary income | | $ | 82,771,063 | |
Undistributed long-term gain | | | 26,864,066 | |
Net unrealized appreciation (depreciation) — investments | | | (245,481 | ) |
Net unrealized appreciation — foreign currencies | | | 48 | |
Temporary book/tax differences | | | (103,983 | ) |
Shares of beneficial interest | | | 1,088,131,232 | |
Total net assets | | $ | 1,197,416,945 | |
The difference between book-basis and tax-basis unrealized appreciation (depreciation) is due to differences in the timing of recognition of gains and losses on investments for tax and book purposes. The Fund’s net unrealized appreciation (depreciation) difference is attributable primarily to futures contracts and swap agreements.
Invesco V.I. Balanced-Risk Allocation Fund
The temporary book/tax differences are a result of timing differences between book and tax recognition of income and/or expenses. The Fund’s temporary book/tax differences are the result of the trustee deferral of compensation and retirement plan benefits.
Capital loss carryforward is calculated and reported as of a specific date. Results of transactions and other activity after that date may affect the amount of capital loss carryforward actually available for the Fund to utilize. Capital losses generated in years beginning after December 22, 2010 can be carried forward for an unlimited period, whereas previous losses expire in eight tax years. Capital losses with an expiration period may not be used to offset capital gains until all net capital losses without an expiration date have been utilized. Capital loss carryforwards with no expiration date will retain their character as either short-term or long-term capital losses instead of as short-term capital losses as under prior law. The ability to utilize capital loss carryforwards in the future may be limited under the Internal Revenue Code and related regulations based on the results of future transactions.
The Fund does not have a capital loss carryforward as of December 31, 2017.
NOTE 8—Investment Transactions
The aggregate amount of investment securities (other than short-term securities, U.S. Treasury obligations and money market funds, if any) purchased and sold by the Fund during the year ended December 31, 2017 was $23,900,000 and $20,590,483, respectively. During the same period, sales of U.S. Treasury obligations were $42,675,466. Cost of investments, including any derivatives, on a tax basis includes the adjustments for financial reporting purposes as of the most recently completed federal income tax reporting period-end.
| | | | |
| Unrealized Appreciation (Depreciation) of Investments on a Tax Basis | |
Aggregate unrealized appreciation of investments | | $ | 56,710,161 | |
Aggregate unrealized (depreciation) of investments | | | (56,955,642 | ) |
Net unrealized appreciation (depreciation) of investments | | $ | (245,481 | ) |
Cost of investments for tax purposes is $1,176,307,747. | | | | |
NOTE 9—Reclassification of Permanent Differences
Primarily as a result of differing book/tax treatment of swap agreement income and futures contracts, on December 31, 2017, undistributed net investment income was increased by $6,622,562, undistributed net realized gain was decreased by $6,539,825 and shares of beneficial interest was decreased by $82,737. This reclassification had no effect on the net assets of the Fund.
NOTE 10—Share Information
| | | | | | | | | | | | | | | | |
| | | Summary of Share Activity | |
| | | Years ended December 31, | |
| | | 2017(a) | | | 2016 | |
| | | Shares | | | Amount | | | Shares | | | Amount | |
Sold: | | | | | | | | | | | | | | | | |
Series I | | | 353,444 | | | $ | 4,089,594 | | | | 2,079,260 | | | $ | 23,038,972 | |
Series II | | | 11,147,285 | | | | 127,157,678 | | | | 20,137,979 | | | | 220,328,126 | |
| | | | |
Issued as reinvestment of dividends: | | | | | | | | | | | | | | | | |
Series I | | | 330,067 | | | | 3,554,824 | | | | 12,271 | | | | 141,114 | |
Series II | | | 9,988,152 | | | | 106,373,815 | | | | 172,876 | | | | 1,965,605 | |
| | | | |
Reacquired: | | | | | | | | | | | | | | | | |
Series I | | | (264,404 | ) | | | (3,038,309 | ) | | | (1,664,871 | ) | | | (18,448,956 | ) |
Series II | | | (16,688,062 | ) | | | (189,658,705 | ) | | | (14,209,711 | ) | | | (152,058,612 | ) |
Net increase in share activity | | | 4,866,482 | | | $ | 48,478,897 | | | | 6,527,804 | | | $ | 74,966,249 | |
| (a) | There are entities that are record owners of more than 5% of the outstanding shares of the Fund and in the aggregate own 83% of the outstanding shares of the Fund. The Fund and the Fund’s principal underwriter or adviser, are parties to participation agreements with these entities whereby these entities sell units of interest in separate accounts funding variable products that are invested in the Fund. The Fund, Invesco and/or Invesco affiliates may make payments to these entities, which are considered to be related to the Fund, for providing services to the Fund, Invesco and/or Invesco affiliates including but not limited to services such as, securities brokerage, third party record keeping and account servicing and administrative services. The Fund has no knowledge as to whether all or any portion of the shares owned of record by these entities are also owned beneficially. |
Invesco V.I. Balanced-Risk Allocation Fund
NOTE 11—Financial Highlights
The following schedule presents financial highlights for a share of the Fund outstanding throughout the periods indicated.
| | | | | | | | | | | | | | | | | | | | | | | | | | | | | | | | | | | | | | | | | | | | | | | | | | | | | | | | |
| | | Net asset
value,
beginning
of period | | | Net
investment
income
(loss)(a) | | | Net gains
(losses)
on securities
(both
realized and
unrealized) | | | Total from
investment
operations | | | Dividends
from net
investment
income | | | Distributions
from net
realized
gains | | | Total
distributions | | | Net asset
value, end
of period | | | Total
return(b) | | | Net assets, end of period
(000’s omitted) | | | Ratio of
expenses
to average
net assets
with fee waivers
and/or expenses
absorbed | | | Ratio of
expenses
to average net
assets without
fee waivers
and/or expenses
absorbed | | | Ratio of net
investment
income (loss)
to average
net assets | | | Portfolio
turnover(c) | |
Series I | | | | | | | | | | | | | | | | | | | | | | | | | | | | | | | | | | | | | | | | | | | | | | | | | | | | | | | | |
Year ended 12/31/17 | | $ | 11.35 | | | $ | 0.01 | | | $ | 1.08 | | | $ | 1.09 | | | $ | (0.48 | ) | | $ | (0.65 | ) | | $ | (1.13 | ) | | $ | 11.31 | | | | 10.06 | % | | $ | 39,340 | | | | 0.68 | %(d)(e) | | | 1.11 | %(d) | | | 0.10 | %(d) | | | 52 | % |
Year ended 12/31/16 | | | 10.20 | | | | (0.04 | ) | | | 1.24 | | | | 1.20 | | | | (0.05 | ) | | | — | | | | (0.05 | ) | | | 11.35 | | | | 11.74 | | | | 34,714 | | | | 0.67 | (e) | | | 1.12 | | | | (0.33 | ) | | | 120 | |
Year ended 12/31/15 | | | 12.30 | | | | (0.07 | ) | | | (0.44 | ) | | | (0.51 | ) | | | (0.52 | ) | | | (1.07 | ) | | | (1.59 | ) | | | 10.20 | | | | (4.10 | ) | | | 26,854 | | | | 0.69 | | | | 1.15 | | | | (0.61 | ) | | | 44 | |
Year ended 12/31/14 | | | 12.30 | | | | (0.08 | ) | | | 0.80 | | | | 0.72 | | | | — | | | | (0.72 | ) | | | (0.72 | ) | | | 12.30 | | | | 5.91 | | | | 11,397 | | | | 0.69 | (e) | | | 1.11 | | | | (0.65 | ) | | | 60 | |
Year ended 12/31/13 | | | 12.65 | | | | (0.08 | ) | | | 0.30 | | | | 0.22 | | | | (0.21 | ) | | | (0.36 | ) | | | (0.57 | ) | | | 12.30 | | | | 1.70 | | | | 8,821 | | | | 0.70 | | | | 1.11 | | | | (0.65 | ) | | | 76 | |
Series II | | | | | | | | | | | | | | | | | | | | | | | | | | | | | | | | | | | | | | | | | | | | | | | | | | | | | | | | |
Year ended 12/31/17 | | | 11.22 | | | | (0.02 | ) | | | 1.07 | | | | 1.05 | | | | (0.45 | ) | | | (0.65 | ) | | | (1.10 | ) | | | 11.17 | | | | 9.83 | | | | 1,158,077 | | | | 0.93 | (d)(e) | | | 1.36 | (d) | | | (0.15 | )(d) | | | 52 | |
Year ended 12/31/16 | | | 10.08 | | | | (0.06 | ) | | | 1.22 | | | | 1.16 | | | | (0.02 | ) | | | — | | | | (0.02 | ) | | | 11.22 | | | | 11.51 | | | | 1,113,539 | | | | 0.92 | (e) | | | 1.37 | | | | (0.58 | ) | | | 120 | |
Year ended 12/31/15 | | | 12.17 | | | | (0.10 | ) | | | (0.44 | ) | | | (0.54 | ) | | | (0.48 | ) | | | (1.07 | ) | | | (1.55 | ) | | | 10.08 | | | | (4.40 | ) | | | 939,354 | | | | 0.94 | | | | 1.40 | | | | (0.86 | ) | | | 44 | |
Year ended 12/31/14 | | | 12.21 | | | | (0.12 | ) | | | 0.80 | | | | 0.68 | | | | — | | | | (0.72 | ) | | | (0.72 | ) | | | 12.17 | | | | 5.62 | | | | 1,002,835 | | | | 0.94 | (e) | | | 1.36 | | | | (0.90 | ) | | | 60 | |
Year ended 12/31/13 | | | 12.57 | | | | (0.11 | ) | | | 0.30 | | | | 0.19 | | | | (0.19 | ) | | | (0.36 | ) | | | (0.55 | ) | | | 12.21 | | | | 1.50 | | | | 1,369,485 | | | | 0.95 | | | | 1.36 | | | | (0.90 | ) | | | 76 | |
| (a) | Calculated using average shares outstanding. |
| (b) | Includes adjustments in accordance with accounting principles generally accepted in the United States of America and as such, the net asset value for financial reporting purposes and the returns based upon those net asset values may differ from the net asset value and returns for shareholder transactions. Total returns are not annualized for periods less than one year, if applicable and do not reflect charges assessed in connection with a variable product, which if included would reduce total returns. |
| (c) | Portfolio turnover is calculated at the fund level and is not annualized for periods less than one year, if applicable. |
| (d) | Ratios are based on average daily net assets (000’s omitted) of $36,709 and $1,150,181 for Series I and Series II shares, respectively. |
| (e) | In addition to the fees and expenses which the Fund bears directly; the Fund indirectly bears a pro rata share of the fees and expenses of the underlying funds in which the Fund invests. Because the underlying funds have varied expenses and fee levels and the Fund may own different proportions at different times, the amount of fees and expenses incurred indirectly by the Fund will vary. Estimated underlying fund expenses are not expenses that are incurred directly by your Fund. They are expenses that are incurred directly by the underlying funds and are deducted from the value of the funds your Fund invests in. The effect of the estimated underlying fund expenses that you bear indirectly is included in your Fund’s total return. Estimated acquired fund fees from underlying funds were 0.15%, 0.13% and 0.09% for the year ended December 31, 2017, 2016 and 2014, respectively. |
Invesco V.I. Balanced-Risk Allocation Fund
Report of Independent Registered Public Accounting Firm
To the Board of Trustees of AIM Variable Insurance Funds (Invesco Variable Insurance Funds)
and Shareholders of Invesco V.I. Balanced-Risk Allocation Fund
Opinion on the Financial Statements
We have audited the accompanying consolidated statement of assets and liabilities, including the consolidated schedule of investments, of Invesco V.I. Balanced-Risk Allocation Fund and its subsidiary (one of the funds constituting AIM Variable Insurance Funds (Invesco Variable Insurance Funds), hereafter collectively referred to as the “Fund”) as of December 31, 2017, the related consolidated statement of operations for the year ended December 31, 2017, the consolidated statement of changes in net assets for each of the two years in the period ended December 31, 2017, including the related notes, and the financial highlights for each of the five years in the period ended December 31, 2017 (collectively referred to as the “financial statements”). In our opinion, the financial statements present fairly, in all material respects, the financial position of the Fund as of December 31, 2017, the results of their operations for the year then ended, the changes in their net assets for each of the two years in the period ended December 31, 2017 and the financial highlights for each of the five years in the period ended December 31, 2017 in conformity with accounting principles generally accepted in the United States of America.
Basis for Opinion
These financial statements are the responsibility of the Fund’s management. Our responsibility is to express an opinion on the Fund’s financial statements based on our audits. We are a public accounting firm registered with the Public Company Accounting Oversight Board (United States) (“PCAOB”) and are required to be independent with respect to the Fund in accordance with the U.S. federal securities laws and the applicable rules and regulations of the Securities and Exchange Commission and the PCAOB.
We conducted our audits of these financial statements in accordance with the standards of the PCAOB. Those standards require that we plan and perform the audit to obtain reasonable assurance about whether the financial statements are free of material misstatement, whether due to error or fraud.
Our audits included performing procedures to assess the risks of material misstatement of the financial statements, whether due to error or fraud, and performing procedures that respond to those risks. Such procedures included examining, on a test basis, evidence regarding the amounts and disclosures in the financial statements. Our audits also included evaluating the accounting principles used and significant estimates made by management, as well as evaluating the overall presentation of the financial statements. Our procedures included confirmation of securities owned as of December 31, 2017 by correspondence with the custodian, transfer agent and brokers; when replies were not received from brokers, we performed other auditing procedures. We believe that our audits provide a reasonable basis for our opinion.
PricewaterhouseCoopers LLP
Houston, TX
February 14, 2018
We have served as the auditor of one or more of the investment companies in the Invesco/PowerShares group of investment companies since at least 1995. We have not determined the specific year we began serving as auditor.
Invesco V.I. Balanced-Risk Allocation Fund
Calculating your ongoing Fund expenses
Example
As a shareholder of the Fund, you incur ongoing costs, including management fees; distribution and/or service fees (12b-1); and other Fund expenses. This example is intended to help you understand your ongoing costs (in dollars) of investing in the Fund and to compare these costs with ongoing costs of investing in other mutual funds. The example is based on an investment of $1,000 invested at the beginning of the period and held for the entire period July 1, 2017 through December 31, 2017.
The actual and hypothetical expenses in the examples below do not represent the effect of any fees or other expenses assessed in connection with a variable product; if they did, the expenses shown would be higher while the ending account values shown would be lower.
Actual expenses
The table below provides information about actual account values and actual expenses. You may use the information in this table, together with the amount you invested, to estimate the expenses that you paid over the period. Simply divide your account value by $1,000 (for example, an $8,600 account value divided by $1,000 = 8.6), then multiply the result by the number in the table under the heading entitled “Actual Expenses Paid During Period” to estimate the expenses you paid on your account during this period.
Hypothetical example for comparison purposes
The table below also provides information about hypothetical account values and hypothetical expenses based on the Fund’s actual expense ratio and an assumed rate of return of 5% per year before expenses, which is not the Fund’s actual return.
The hypothetical account values and expenses may not be used to estimate the actual ending account balance or expenses you paid for the period. You may use this information to compare the ongoing costs of investing in the Fund and other funds. To do so, compare this 5% hypothetical example with the 5% hypothetical examples that appear in the shareholder reports of the other funds.
Please note that the expenses shown in the table are meant to highlight your ongoing costs. Therefore, the hypothetical information is useful in comparing ongoing costs, and will not help you determine the relative total costs of owning different funds.
| | | | | | | | | | | | | | | | | | | | | | | | |
Class | | Beginning
Account Value
(07/01/17) | | | ACTUAL | | | HYPOTHETICAL
(5% annual return before
expenses) | | | Annualized
Expense Ratio | |
| | | Ending
Account Value
(12/31/17)1 | | | Expenses
Paid During
Period2 | | | Ending
Account Value
(12/31/17) | | | Expenses
Paid During
Period2 | | |
| Series I | | $ | 1,000.00 | | | $ | 1,077.80 | | | $ | 3.56 | | | $ | 1,021.78 | | | $ | 3.47 | | | | 0.68 | % |
| Series II | | | 1,000.00 | | | | 1,077.20 | | | | 4.87 | | | | 1,020.52 | | | | 4.74 | | | | 0.93 | |
| 1 | The actual ending account value is based on the actual total return of the Fund for the period July 1, 2017 through December 31, 2017, after actual expenses and will differ from the hypothetical ending account value which is based on the Fund’s expense ratio and a hypothetical annual return of 5% before expenses. |
| 2 | Expenses are equal to the Fund’s annualized expense ratio as indicated above multiplied by the average account value over the period, multiplied by 184/365 to reflect the most recent fiscal half year. |
Invesco V.I. Balanced-Risk Allocation Fund
Tax Information
Form 1099-DIV, Form 1042-S and other year-end tax information provide shareholders with actual calendar year amounts that should be included in their tax returns. Shareholders should consult their tax advisors.
The following distribution information is being provided as required by the Internal Revenue Code or to meet a specific state’s requirement.
The Fund designates the following amounts or, if subsequently determined to be different, the maximum amount allowable for its fiscal year ended December 31, 2017:
| | | | |
Federal and State Income Tax | |
Long-Term Capital Gain Distributions | | $ | 37,008,399 | |
Corporate Dividends Received Deduction* | | | 0.00 | % |
U.S. Treasury Obligations* | | | 4.43 | % |
| | * | The above percentages are based on ordinary income dividends paid to shareholders during the Fund’s fiscal year. |
Invesco V.I. Balanced-Risk Allocation Fund
Trustees and Officers
The address of each trustee and officer is AIM Variable Insurance Funds (Invesco Variable Insurance Funds) (the “Trust”), 11 Greenway Plaza, Suite 1000, Houston, Texas 77046-1173. The trustees serve for the life of the Trust, subject to their earlier death, incapacitation, resignation, retirement or removal as more specifically provided in the Trust’s organizational documents. Each officer serves for a one year term or until their successors are elected and qualified. Column two below includes length of time served with predecessor entities, if any.
| | | | | | | | |
Name, Year of Birth and
Position(s) Held with the Trust | | Trustee and/
or Officer Since | | Principal Occupation(s)
During Past 5 Years | | Number of
Funds in Fund
Complex
Overseen by
Trustee | | Other Directorship(s)
Held by Trustee During
Past 5 Years |
| Interested Persons | | | | | | | | |
Martin L. Flanagan1 — 1960 Trustee | | 2007 | | Executive Director, Chief Executive Officer and President, Invesco Ltd. (ultimate parent of Invesco and a global investment management firm); Trustee, The Invesco Funds; Vice Chair, Investment Company Institute; and Member of Executive Board, SMU Cox School of Business Formerly: Advisor to the Board, Invesco Advisers, Inc. (formerly known as Invesco Institutional (N.A.), Inc.); Chairman and Chief Executive Officer, Invesco Advisers, Inc. (registered investment adviser); Director, Chairman, Chief Executive Officer and President, Invesco Holding Company (US), Inc. (formerly IVZ Inc.) (holding company), Invesco Group Services, Inc. (service provider) and Invesco North American Holdings, Inc. (holding company); Director, Chief Executive Officer and President, Invesco Holding Company Limited (parent of Invesco and a global investment management firm); Director, Invesco Ltd.; Chairman, Investment Company Institute and President, Co-Chief Executive Officer, Co-President, Chief Operating Officer and Chief Financial Officer, Franklin Resources, Inc. (global investment management organization) | | 158 | | None |
Philip A. Taylor2 — 1954 Trustee and Senior Vice President | | 2006 | | Head of the Americas and Senior Managing Director, Invesco Ltd.; Director, Invesco Advisers, Inc. (formerly known as Invesco Institutional (N.A.), Inc.) (registered investment adviser); Director, Chairman, Chief Executive Officer and President, Invesco Management Group, Inc. (formerly known as Invesco Aim Management Group, Inc.) (financial services holding company); Director and Chairman, Invesco Investment Services, Inc. (formerly known as Invesco Aim Investment Services, Inc.) (registered transfer agent); Chief Executive Officer, Invesco Corporate Class Inc. (corporate mutual fund company); Director, Chairman and Chief Executive Officer, Invesco Canada Ltd. (formerly known as Invesco Trimark Ltd./Invesco Trimark Ltèe) (registered investment adviser and registered transfer agent); Trustee and Senior Vice President, The Invesco Funds; Director, Invesco Investment Advisers LLC (formerly known as Van Kampen Asset Management). Formerly: Co-Chairman, Co-President and Co-Chief Executive Officer, Invesco Advisers, Inc. (formerly known as Invesco Institutional (N.A.), Inc.) (registered investment adviser); Director, Chief Executive Officer and President, Van Kampen Exchange Corp; President and Principal Executive Officer, The Invesco Funds (other than AIM Treasurer’s Series Trust (Invesco Treasurer’s Series Trust), Short-Term Investments Trust and Invesco Management Trust); Executive Vice President, The Invesco Funds (AIM Treasurer’s Series Trust (Invesco Treasurer’s Series Trust), Short-Term Investments Trust and Invesco Management Trust only); Director and President, INVESCO Funds Group, Inc. (registered investment adviser and registered transfer agent); Director and Chairman, IVZ Distributors, Inc. (formerly known as INVESCO Distributors, Inc.) (registered broker dealer); Director, President and Chairman, Invesco Inc. (holding company), Invesco Canada Holdings Inc. (holding company), Trimark Investments Ltd./Placements Trimark Ltèe and Invesco Financial Services Ltd/Services Financiers Invesco Ltèe; Chief Executive Officer, Invesco Canada Fund Inc. (corporate mutual fund company); Director and Chairman, Van Kampen Investor Services Inc.; Director, Chief Executive Officer and President, 1371 Preferred Inc. (holding company) and Van Kampen Investments Inc.; Director and President, AIM GP Canada Inc. (general partner for limited partnerships) and Van Kampen Advisors, Inc.; Director and Chief Executive Officer, Invesco Trimark Dealer Inc. (registered broker dealer); Director, Invesco Distributors, Inc. (formerly known as Invesco Aim Distributors, Inc.) (registered broker dealer); Manager, Invesco PowerShares Capital Management LLC; Director, Chief Executive Officer and President, Invesco Advisers, Inc.; Director, Chairman, Chief Executive Officer and President, Invesco Aim Capital Management, Inc.; President, Invesco Trimark Dealer Inc. and Invesco Trimark Ltd./Invesco Trimark Ltèe; Director and President, AIM Trimark Corporate Class Inc. and AIM Trimark Canada Fund Inc.; Senior Managing Director, Invesco Holding Company Limited; Director and Chairman, Fund Management Company (former registered broker dealer); President and Principal Executive Officer, The Invesco Funds (AIM Treasurer’s Series Trust (Invesco Treasurer’s Series Trust), and Short-Term Investments Trust only); President, AIM Trimark Global Fund Inc. and AIM Trimark Canada Fund Inc. | | 158 | | None |
| 1 | Mr. Flanagan is considered an interested person (within the meaning of Section 2(a)(19) of the 1940 Act) of the Trust because he is an officer of the Adviser to the Trust, and an officer and a director of Invesco Ltd., ultimate parent of the Adviser. |
| 2 | Mr. Taylor is considered an interested person (within the meaning of Section 2(a)(19) of the 1940 Act) of the Trust because he is an officer and a director of the Adviser. |
Invesco V.I. Balanced-Risk Allocation Fund
Trustees and Officers—(continued)
| | | | | | | | |
Name, Year of Birth and
Position(s) Held with the Trust | | Trustee and/
or Officer Since | | Principal Occupation(s)
During Past 5 Years | | Number of
Funds in Fund
Complex
Overseen by
Trustee | | Other Directorship(s)
Held by Trustee During
Past 5 Years |
| Independent Trustees | | | | | | | | |
Bruce L. Crockett — 1944 Trustee and Chair | | 1993 | | Chairman, Crockett Technologies Associates (technology consulting company) Formerly: Director, Captaris (unified messaging provider); Director, President and Chief Executive Officer, COMSAT Corporation; Chairman, Board of Governors of INTELSAT (international communications company); ACE Limited (insurance company); Independent Directors Council and Investment Company Institute: Member of the Audit Committee, Investment Company Institute; Member of the Executive Committee and Chair of the Governance Committee, Independent Directors Council | | 158 | | Director and Chairman of the Audit Committee, ALPS (Attorneys Liability Protection Society) (insurance company); Director and Member of the Audit Committee and Compensation Committee, Ferroglobe PLC (metallurgical company) |
David C. Arch — 1945 Trustee | | 2010 | | Chairman of Blistex Inc. (consumer health care products manufacturer); Member, World Presidents’ Organization | | 158 | | Board member of the Illinois Manufacturers’ Association |
Jack M. Fields — 1952 Trustee | | 1997 | | Chief Executive Officer, Twenty First Century Group, Inc. (government affairs company); and Chairman, Discovery Learning Alliance (non-profit) Formerly: Owner and Chief Executive Officer, Dos Angeles Ranch L.P. (cattle, hunting, corporate entertainment); Director, Insperity, Inc. (formerly known as Administaff) (human resources provider); Chief Executive Officer, Texana Timber LP (sustainable forestry company); Director of Cross Timbers Quail Research Ranch (non-profit); and member of the U.S. House of Representatives | | 158 | | None |
Cynthia Hostetler — 1962 Trustee | | 2017 | | Non-Executive Director and Trustee of a number of public and private business corporations Formerly: Head of Investment Funds and Private Equity, Overseas Private Investment Corporation; President, First Manhattan Bancorporation, Inc.; Attorney, Simpson Thacher & Bartlett LLP | | 158 | | Vulcan Materials Company (construction materials company); Trilinc Global Impact Fund; Aberdeen Investment Funds (4 portfolios); Artio Global Investment LLC (mutual fund complex); Edgen Group, Inc. (specialized energy and infrastructure products distributor) |
Eli Jones — 1961 Trustee | | 2016 | | Professor and Dean, Mays Business School — Texas A&M University Formerly: Professor and Dean, Walton College of Business, University of Arkansas and E.J. Ourso College of Business, Louisiana State University; Director, Arvest Bank | | 158 | | Insperity, Inc. (formerly known as Administaff) (human resources provider) |
Prema Mathai-Davis — 1950 Trustee | | 1998 | | Retired. | | 158 | | None |
Teresa M. Ressel — 1962 Trustee | | 2017 | | Non-executive director and trustee of a number of public and private business corporations Formerly: Chief Financial Officer, Olayan America, The Olayan Group (international investor/commercial/industrial); Chief Executive Officer, UBS Securities LLC; Group Chief Operating Officer, Americas, UBS AG; Assistant Secretary for Management & Budget and CFO, US Department of the Treasury | | 158 | | Atlantic Power Corporation (power generation company); ON Semiconductor Corp. (semiconductor supplier) |
Ann Barnett Stern — 1957 Trustee | | 2017 | | President and Chief Executive Officer, Houston Endowment Inc. (private philanthropic institution) Formerly: Executive Vice President and General Counsel, Texas Children’s Hospital; Attorney, Beck, Redden and Secrest, LLP; Business Law Instructor, University of St. Thomas; Attorney, Andrews & Kurth LLP | | 158 | | Federal Reserve Bank of Dallas |
Raymond Stickel, Jr. — 1944 Trustee | | 2005 | | Retired. Formerly: Director, Mainstay VP Series Funds, Inc. (25 portfolios); Partner, Deloitte & Touche | | 158 | | None |
Robert C. Troccoli — 1949 Trustee | | 2016 | | Adjunct Professor, University of Denver — Daniels College of Business Formerly: Senior Partner, KPMG LLP | | 158 | | None |
Christopher L. Wilson — 1957 Trustee | | 2017 | | Non-executive director and trustee of a number of public and private business corporations Formerly: Managing Partner, CT2, LLC (investing and consulting firm); President/Chief Executive Officer, Columbia Funds, Bank of America Corporation; President/Chief Executive Officer, CDC IXIS Asset Management Services, Inc.; Principal & Director of Operations, Scudder Funds, Scudder, Stevens & Clark, Inc.; Assistant Vice President, Fidelity Investments | | 158 | | TD Asset Management USA Inc. (mutual fund complex) (22 portfolios); ISO New England, Inc. (non-profit organization managing regional electricity market) |
Invesco V.I. Balanced-Risk Allocation Fund
Trustees and Officers—(continued)
| | | | | | | | |
Name, Year of Birth and
Position(s) Held with the Trust | | Trustee and/
or Officer Since | | Principal Occupation(s)
During Past 5 Years | | Number of
Funds in Fund
Complex
Overseen by
Trustee | | Other Directorship(s)
Held by Trustee During
Past 5 Years |
| Other Officers | | | | | | | | |
Sheri Morris — 1964 President, Principal Executive Officer and Treasurer | | 1999 | | President, Principal Executive Officer and Treasurer, The Invesco Funds; Vice President, Invesco Advisers, Inc. (formerly known as Invesco Institutional (N.A.), Inc.) (registered investment adviser); and Vice President, PowerShares Exchange-Traded Fund Trust, PowerShares Exchange-Traded Fund Trust II, PowerShares India Exchange-Traded Fund Trust, PowerShares Actively Managed Exchange-Traded Fund Trust, PowerShares Actively Managed Exchange-Traded Commodity Fund Trust and PowerShares Exchange-Traded Self-Indexed Fund Trust Formerly: Vice President and Principal Financial Officer, The Invesco Funds; Vice President, Invesco Aim Advisers, Inc., Invesco Aim Capital Management, Inc. and Invesco Aim Private Asset Management, Inc.; Assistant Vice President and Assistant Treasurer, The Invesco Funds and Assistant Vice President, Invesco Advisers, Inc., Invesco Aim Capital Management, Inc. and Invesco Aim Private Asset Management, Inc.; and Treasurer, PowerShares Exchange-Traded Fund Trust, PowerShares Exchange-Traded Fund Trust II, PowerShares India Exchange-Traded Fund Trust and PowerShares Actively Managed Exchange-Traded Fund Trust | | N/A | | N/A |
Russell C. Burk — 1958 Senior Vice President and Senior Officer | | 2005 | | Senior Vice President and Senior Officer, The Invesco Funds | | N/A | | N/A |
John M. Zerr — 1962 Senior Vice President, Chief Legal Officer and Secretary | | 2006 | | Director, Senior Vice President, Secretary and General Counsel, Invesco Management Group, Inc. (formerly known as Invesco AIM Management Group, Inc.); Senior Vice President, Invesco Advisers, Inc. (formerly known as Invesco Institutional (N.A.), Inc.) (registered investment adviser); Senior Vice President and Secretary, Invesco Distributors, Inc. (formerly known as Invesco AIM Distributors, Inc.); Director, Vice President and Secretary, Invesco Investment Services, Inc. (formerly known as Invesco AIM Investment Services, Inc.) Senior Vice President, Chief Legal Officer and Secretary, The Invesco Funds; Managing Director, Invesco PowerShares Capital Management LLC; Director, Secretary and General Counsel, Invesco Investment Advisers LLC (formerly known as Van Kampen Asset Management); Secretary and General Counsel, Invesco Capital Markets, Inc. (formerly known as Van Kampen Funds Inc.) and Chief Legal Officer, PowerShares Exchange-Traded Fund Trust, PowerShares Exchange-Traded Fund Trust II, PowerShares India Exchange-Traded Fund Trust, PowerShares Actively Managed Exchange-Traded Fund Trust, PowerShares Actively Managed Exchange-Traded Commodity Fund Trust and PowerShares Exchange-Traded Self-Indexed Fund Trust; Manager and Secretary, Invesco Indexing LLC Formerly: Director, Secretary, General Counsel and Senior Vice President, Van Kampen Exchange Corp.; Director, Vice President and Secretary, IVZ Distributors, Inc. (formerly known as INVESCO Distributors, Inc.); Director and Vice President, INVESCO Funds Group, Inc.; Director and Vice President, Van Kampen Advisors Inc.; Director, Vice President, Secretary and General Counsel, Van Kampen Investor Services Inc.; Director, Invesco Distributors, Inc. (formerly known as Invesco AIM Distributors, Inc.); Director, Senior Vice President, General Counsel and Secretary, Invesco AIM Advisers, Inc. and Van Kampen Investments Inc.; Director, Vice President and Secretary, Fund Management Company; Director, Senior Vice President, Secretary, General Counsel and Vice President, Invesco AIM Capital Management, Inc.; Chief Operating Officer and General Counsel, Liberty Ridge Capital, Inc. (an investment adviser); Vice President and Secretary, PBHG Funds (an investment company) and PBHG Insurance Series Fund (an investment company); Chief Operating Officer, General Counsel and Secretary, Old Mutual Investment Partners (a broker-dealer); General Counsel and Secretary, Old Mutual Fund Services (an administrator) and Old Mutual Shareholder Services (a shareholder servicing center); Executive Vice President, General Counsel and Secretary, Old Mutual Capital, Inc. (an investment adviser); and Vice President and Secretary, Old Mutual Advisors Funds (an investment company) | | N/A | | N/A |
Gregory G. McGreevey — 1962 Senior Vice President | | 2012 | | Senior Managing Director, Invesco Ltd.; Director, Chairman, President, and Chief Executive Officer, Invesco Advisers, Inc. (formerly known as Invesco Institutional (N.A.), Inc.) (registered investment adviser); Senior Vice President, Invesco Management Group, Inc.; Director, Invesco Mortgage Capital, Inc. and Invesco Senior Secured Management, Inc.; and Senior Vice President, The Invesco Funds Formerly: Assistant Vice President, The Invesco Funds | | N/A | | N/A |
Kelli Gallegos — 1970 Vice President, Principal Financial Officer and Assistant Treasurer | | 2008 | | Vice President, Principal Financial Officer and Assistant Treasurer, The Invesco Funds; Assistant Treasurer, Invesco PowerShares Capital Management LLC, PowerShares Exchange-Traded Fund Trust, PowerShares Exchange-Traded Fund Trust II, PowerShares India Exchange-Traded Fund Trust, PowerShares Actively Managed Exchange-Traded Fund Trust, PowerShares Actively Managed Exchange-Traded Commodity Fund Trust and PowerShares Exchange-Traded Self-Indexed Fund Trust Formerly: Assistant Vice President, The Invesco Funds | | N/A | | N/A |
Invesco V.I. Balanced-Risk Allocation Fund
Trustees and Officers—(continued)
| | | | | | | | |
Name, Year of Birth and
Position(s) Held with the Trust | | Trustee and/
or Officer Since | | Principal Occupation(s)
During Past 5 Years | | Number of
Funds in Fund
Complex
Overseen by
Trustee | | Other Directorship(s)
Held by Trustee During
Past 5 Years |
| Other Officers—(continued) | | | | | | | | |
Tracy Sullivan — 1962 Vice President, Chief Tax Officer and Assistant Treasurer | | 2008 | | Vice President, Chief Tax Officer and Assistant Treasurer, The Invesco Funds; Assistant Treasurer, Invesco PowerShares Capital Management LLC, PowerShares Exchange-Traded Fund Trust, PowerShares Exchange-Traded Fund Trust II, PowerShares India Exchange-Traded Fund Trust, PowerShares Actively Managed Exchange-Traded Fund Trust, PowerShares Actively Managed Exchange-Traded Commodity Fund Trust and PowerShares Exchange-Traded Self-Indexed Fund Trust Formerly: Assistant Vice President, The Invesco Funds | | N/A | | N/A |
Crissie M. Wisdom — 1969 Anti-Money Laundering Compliance Officer | | 2013 | | Anti-Money Laundering Compliance Officer, Invesco Advisers, Inc. (formerly known as Invesco Institutional (N.A.), Inc.) (registered investment adviser), Invesco Capital Markets, Inc. (formerly known as Van Kampen Funds Inc.), Invesco Distributors, Inc., Invesco Investment Services, Inc., Invesco Management Group, Inc., The Invesco Funds, and PowerShares Exchange-Traded Fund Trust, PowerShares Exchange-Traded Fund Trust II, PowerShares India Exchange-Traded Fund Trust, PowerShares Actively Managed Exchange-Traded Fund Trust, PowerShares Actively Managed Exchange-Traded Commodity Fund Trust and PowerShares Exchange-Traded Self-Indexed Fund Trust; Anti-Money Laundering Compliance Officer and Bank Secrecy Act Officer, INVESCO National Trust Company and Invesco Trust Company; and Fraud Prevention Manager and Controls and Risk Analysis Manager for Invesco Investment Services, Inc. Formerly: Anti-Money Laundering Compliance Officer, Van Kampen Exchange Corp. | | N/A | | N/A |
Robert R. Leveille — 1969 Chief Compliance Officer | | 2016 | | Chief Compliance Officer, Invesco Advisers, Inc. (registered investment adviser); and Chief Compliance Officer, The Invesco Funds Formerly: Chief Compliance Officer, Putnam Investments and the Putnam Funds | | N/A | | N/A |
The Statement of Additional Information of the Trust includes additional information about the Fund’s Trustees and is available upon request, without charge, by calling 1.800.959.4246. Please refer to the Fund’s Statement of Additional Information for information on the Fund’s sub-advisers.
| | | | | | |
Office of the Fund 11 Greenway Plaza, Suite 1000 Houston, TX 77046-1173 | | Investment Adviser Invesco Advisers, Inc. 1555 Peachtree Street, N.E. Atlanta, GA 30309 | | Distributor Invesco Distributors, Inc. 11 Greenway Plaza, Suite 1000 Houston, TX 77046-1173 | | Auditors PricewaterhouseCoopers LLP 1000 Louisiana Street, Suite 5800 Houston, TX 77002-5678 |
| | | |
| | | | | | |
Counsel to the Fund Stradley Ronon Stevens & Young, LLP 2005 Market Street, Suite 2600 Philadelphia, PA 19103-7018 | | Counsel to the Independent Trustees Goodwin Procter LLP 901 New York Avenue, N.W. Washington, D.C. 20001 | | Transfer Agent Invesco Investment Services, Inc. 11 Greenway Plaza, Suite 1000 Houston, TX 77046-1173 | | Custodian State Street Bank and Trust Company 225 Franklin Street Boston, MA 02110-2801 |
Invesco V.I. Balanced-Risk Allocation Fund
| | | | |
| | |
 | | Annual Report to Shareholders | | December 31, 2017 |
| | |
| | Invesco V.I. Comstock Fund |

| | |
| | The Fund provides a complete list of its holdings four times in each fiscal year, at the quarter-ends. For the second and fourth quarters, the lists appear in the Fund’s semiannual and annual reports to shareholders. For the first and third quarters, the Fund files the lists with the Securities and Exchange Commission (SEC) on Form N-Q. The Fund’s Form N-Q filings are available on the SEC website, sec.gov. Copies of the Fund’s Forms N-Q may be reviewed and copied at the SEC Public Reference Room in Washington, D.C. You can obtain information on the operation of the Public Reference Room, including information about duplicating fee charges, by calling 202 551 8090 or 800 732 0330, or by electronic request at the following email address: publicinfo@sec.gov. The SEC file numbers for the Fund are 811-07452 and 033-57340. The Fund’s most recent portfolio holdings, as filed on Form N-Q, have also been made available to insurance companies issuing variable annuity contracts and variable life insurance policies (“variable products”) that invest in the Fund. A description of the policies and procedures that the Fund uses to determine how to vote proxies relating to portfolio securities is available without charge, upon request, from our Client Services department at 800 959 4246 or at invesco.com/proxyguidelines. The information is also available on the SEC website, sec.gov. Information regarding how the Fund voted proxies related to its portfolio securities during the most recent 12-month period ended June 30 is available at invesco.com/ proxysearch. The information is also available on the SEC website, sec.gov. Invesco Advisers, Inc. is an investment adviser; it provides investment advisory services to individual and institutional clients and does not sell securities. Invesco Distributors, Inc. is the US distributor for Invesco Ltd.’s retail mutual funds, exchange-traded funds and institutional money market funds. Both are wholly owned, indirect subsidiaries of Invesco Ltd. This report must be accompanied or preceded by a currently effective Fund prospectus and variable product prospectus, which contain more complete information, including sales charges and expenses. Investors should read each carefully before investing. |
| | NOT FDIC INSURED | MAY LOSE VALUE | NO BANK GUARANTEE |
| | | | | | |
| | Invesco Distributors, Inc. | | VK-VICOM-AR-1 | | 02072018 1554 |
Management’s Discussion of Fund Performance
Performance summary
For the year ended December 31, 2017, Series I shares of Invesco V.I. Comstock Fund (the Fund) outperformed the Russell 1000 Value Index, the Fund’s style-spe-cific benchmark.
Your Fund’s long-term performance appears later in this report.
Fund vs. Indexes
Total returns, 12/31/16 to 12/31/17, excluding variable product issuer charges.
If variable product issuer charges were included, returns would be lower.
| | | | | |
| Series I Shares | | | | 17.85 | % |
| Series II Shares | | | | 17.58 | |
| S&P 500 Index▼ (Broad Market Index) | | | | 21.83 | |
| Russell 1000 Value Index▼ (Style-Specific Index) | | | | 13.66 | |
| Lipper VUF Large-Cap Value Funds Index∎ (Peer Group Index) | | | | 14.65 | |
Source(s): ▼FactSet Research Systems Inc.; ∎Lipper Inc. | | | | | |
Market conditions and your Fund
Despite highly destructive hurricanes that threatened to derail a years-long economic recovery, the US economy continued to expand throughout the year ended December 31, 2017. Gross domestic product – the value of all goods and services produced in the US – expanded in the first three quarters of 2017. Inflation remained subdued even as unemployment continued its multiyear decline.
Given signs of an improving economy, the US Federal Reserve (the Fed) raised interest rates three times during the reporting period, most recently in December 2017; each rate hike was 25 basis points. (A basis point is 0.01%.) The Fed pledged that “realized and expected economic conditions relative to its objectives of maximum employment and 2 percent inflation” will guide its future actions. At the close of the reporting period, Fed policy remained accommodative, and the fed funds target rate stood at a range of 1.25% to 1.50% – 75 basis points higher than at the start of the reporting period.1
Higher inventories and a worsening outlook caused oil prices and many energy
stocks to decline during the first half of 2017. However, oil prices rose significantly in the second half of the reporting period as expectations for lower supplies increased, partly due to continued OPEC production cuts, and demand began normalizing.
Major US stock market indexes repeatedly hit all-time highs throughout the reporting period. The stock market rally that began after the 2016 presidential election continued throughout the reporting period, fueled by generally positive economic data, strong corporate earnings and improved consumer confidence. Finally, after much debate in Congress, a tax reform bill was signed into law in December 2017. While its enactment further strengthened stocks, its effect on the US economy remained uncertain.
For the reporting period as a whole, the financials and consumer discretionary sectors were the strongest-performing sectors for the Fund, while consumer staples and materials were the weakest-performing sectors for the Fund, relative to the Russell 1000 Value Index.
Stock selection in and overweight exposure to the financials sector were the
largest contributors to Fund performance relative to the style-specific benchmark. Notably, within banks, Citigroup and Bank of America performed well for the reporting period, outperforming the sector and the style-specific benchmark. Within diversified financials, Ally Financial and Morgan Stanley were top performers. These companies benefited from investor optimism about higher interest rates, an improving economy and lower corporate tax rates. Financials also benefited when the Fed’s Comprehensive Capital Analysis and Review was better than expected, providing a favorable view of the financial strength of US banks.
Strong stock selection in and overweight exposure to the information technology sector also boosted the Fund’s relative performance for the reporting period. Within hardware and equipment, NetApp and Cisco Systems were large contributors to relative Fund performance. Software and services companies eBay, PayPal and Microsoft, as well as semiconductors and equipment company Qualcomm, were also large contributors to the Fund’s relative performance. NetApp’s stock rallied in November after reporting earnings that far exceeded expectations due to strong customer demand in cloud tools and flash storage devices.
Stock selection in the energy sector was also a large driver of Fund performance, with Royal Dutch Shell being a top contributor to returns relative to the style-specific benchmark. However, the largest drivers of relative Fund performance were having no exposure to Exxon Mobile and not owning Schlumberger. Energy stocks generally performed well toward the end of the reporting period, as oil prices rose due to tighter US supply, normalizing demand and political tensions in the Middle East.
| | |
| Portfolio Composition |
By sector | | % of total net assets |
| | |
| |
| Financials | | 33.4% |
| Energy | | 16.6 |
| Health Care | | 12.5 |
| Information Technology | | 11.4 |
| Industrials | | 8.1 |
| Consumer Discretionary | | 6.6 |
| Consumer Staples | | 3.6 |
| Materials | | 2.3 |
| Telecommunication Services | | 0.8 |
| Utilities | | 0.6 |
Money Market Funds Plus Other Assets Less Liabilities | | 4.1 |
| | |
| Top 10 Equity Holdings* |
| | % of total net assets |
| |
| 1. Citigroup Inc. | | 5.8% |
2. Bank of America Corp. | | 4.8 |
3. JPMorgan Chase & Co. | | 3.6 |
4. Cisco Systems, Inc. | | 2.8 |
5. Suncor Energy, Inc. | | 2.3 |
6. Royal Dutch Shell PLC-Class A - ADR | | 2.3 |
7. PNC Financial Services Group, Inc. (The) | | 2.2 |
8. Morgan Stanley | | 2.1 |
9. Chevron Corp. | | 2.0 |
10. General Motors Co. | | 1.9 |
| | |
| Total Net Assets | | $1.9 billion |
| |
| Total Number of Holdings* | | 75 |
The Fund’s holdings are subject to change, and there is no assurance that the Fund will continue to hold any particular security.
*Excluding money market fund holdings.
Data presented here are as of December 31, 2017.
Invesco V.I. Comstock Fund
Being materially underweight in the telecommunication services sector and having no exposure to the real estate sector also helped relative Fund performance. We kept the Fund underweight in these sectors based on the opinion that valuations were unattractive.
Stock selection within the industrials sector also contributed to Fund performance relative to the style-specific benchmark. Notably, Caterpillar was the largest contributor with a return of 75% for the year. Caterpillar reported consecutive quarters of improving revenue and profits and analysts upgraded the stock on projected strong demand for construction equipment. Underweight exposure to General Electric also aided relative Fund performance, as the stock posted double-digit negative returns for the reporting period.
The Fund utilizes currency forward contracts to hedge foreign currency exposure. These instruments detracted from Fund performance as the US dollar weakened relative to the foreign currencies of the Fund’s non-US holdings.
The Fund’s cash position, while 3% on average, was the largest detractor from performance relative to the style-specific benchmark, given the strong equity market.
Stock selection within the consumer discretionary sector also detracted from Fund performance relative to the style-specific benchmark. Strong gains in Carnival Cruise were offset by poor performance from Advance Auto Parts when the company’s stock price fell after missing earnings expectations and management projecting a drop in same-store sales due to industry headwinds.
We used currency forward contracts during the reporting period for the purpose of hedging currency exposure of non-US-based companies held in the Fund. Derivatives were used solely for the purpose of hedging and not for speculative purposes or leverage. The use of currency forward contracts had a negative impact on the Fund’s performance relative to the Russell 1000 Value Index for the reporting period.
At the close of the reporting period, the Fund’s financials sector weighting was overweight relative to the Fund’s style-specific benchmark, as we had a favorable view of large banks within financials. We also maintained a constructive view on the long-term prospects for our energy holdings as we believed supply and demand for oil should balance over time.
The portfolio’s exposure to each sector has a higher beta2 than the benchmark. Therefore, the portfolio should be more sensitive to broad moves within these sectors for the foreseeable future.
Thank you for your investment in Invesco V.I. Comstock Fund and for sharing our long-term investment horizon.
| 1 | Source: US Federal Reserve |
| 2 | Beta is a measure of risk representing how a security is expected to respond to general market movements. |
The views and opinions expressed in management’s discussion of Fund performance are those of Invesco Advisers, Inc. These views and opinions are subject to change at any time based on factors such as market and economic conditions. These views and opinions may not be relied upon as investment advice or recommendations, or as an offer for a particular security. The information is not a complete analysis of every aspect of any market, country, industry, security or the Fund. Statements of fact are from sources considered reliable, but Invesco Advisers, Inc. makes no representation or warranty as to their completeness or accuracy. Although historical performance is no guarantee of future results, these insights may help you understand our investment management philosophy.
See important Fund and, if applicable, index disclosures later in this report.
| | |
 | | Kevin Holt Chartered Financial Analyst, Portfolio Manager and Chief Investment Officer for Invesco US Value |
| Disciplines, is lead manager of Invesco V.I. Comstock Fund. He joined Invesco in 2010. Mr. Holt earned a bachelor’s degree from the University of Iowa and an MBA from the University of Chicago Graduate School of Business. |
| | |
 | | Devin Armstrong Chartered Financial Analyst, Portfolio Manager, is manager of Invesco V.I. Comstock Fund. He joined Invesco |
| in 2010. Mr. Armstrong earned a BS in psychology and finance from the University of Illinois and an MBA from Columbia University. |
| | |
 | | Charles DyReyes Chartered Financial Analyst, Portfolio Manager, is manager of Invesco V.I. Comstock Fund. He joined Invesco |
| in 2015. Mr. DyReyes earned a BS in finance from Lehigh University. |
| | |
 | | James (Jay) Warwick Portfolio Manager, is manager of Invesco V.I. Comstock Fund. He joined Invesco in 2010. Mr. Warwick earned a |
| BBA from Stephen F. Austin State University and an MBA from the University of Houston. |
Invesco V.I. Comstock Fund
Your Fund’s Long-Term Performance
Results of a $10,000 Investment - Oldest Share Class(es)
Fund and index data from 12/31/07
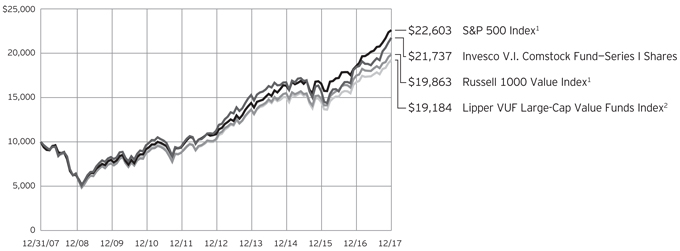
| 1 | Source: FactSet Research Systems Inc. |
Past performance cannot guarantee
comparable future results.
| | | | | |
| Average Annual Total Returns |
As of 12/31/17 | | | | | |
| |
| Series I Shares | | | | | |
| Inception (4/30/99) | | | | 7.49 | % |
| 10 Years | | | | 8.07 | |
| 5 Years | | | | 14.09 | |
| 1 Year | | | | 17.85 | |
| |
Series II Shares | | | | | |
| Inception (9/18/00) | | | | 7.56 | % |
| 10 Years | | | | 7.81 | |
| 5 Years | | | | 13.81 | |
| 1 Year | | | | 17.58 | |
Effective June 1, 2010, Class I and Class II shares of the predecessor fund, Van Kampen Life Investment Trust Comstock Portfolio, advised by Van Kampen Asset Management were reorganized into Series I and Series II shares, respectively, of Invesco Van Kampen V.I. Comstock Fund (renamed Invesco V.I. Comstock Fund on April 29, 2013). Returns shown above, prior to June 1, 2010, for Series I and Series II shares are blended returns of the predecessor fund and Invesco V.I. Comstock Fund. Share class returns will differ from the predecessor fund because of different expenses.
The performance data quoted represent past performance and cannot guarantee comparable future results; current performance may be
lower or higher. Please contact your variable product issuer or financial adviser for the most recent month-end variable product performance. Performance figures reflect Fund expenses, reinvested distributions and changes in net asset value. Investment return and principal value will fluctuate so that you may have a gain or loss when you sell shares.
The net annual Fund operating expense ratio set forth in the most recent Fund prospectus as of the date of this report for Series I and Series II shares was 0.78% and 1.03%, respectively.1 The total annual Fund operating expense ratio set forth in the most recent Fund prospectus as of the date of this report for Series I and Series II shares was 0.79% and 1.04%, respectively. The expense ratios presented above may vary from the expense ratios presented in other sections of this report that are based on expenses incurred during the period covered by this report.
Invesco V.I. Comstock Fund, a series portfolio of AIM Variable Insurance Funds (Invesco Variable Insurance Funds), is currently offered through insurance companies issuing variable products. You cannot purchase shares of the Fund directly. Performance figures given represent the Fund and
are not intended to reflect actual variable product values. They do not reflect sales charges, expenses and fees assessed in connection with a variable product. Sales charges, expenses and fees, which are determined by the variable product issuers, will vary and will lower the total return.
The most recent month-end performance at the Fund level, excluding variable product charges, is available at 800 451 4246. As mentioned above, for the most recent month-end performance including variable product charges, please contact your variable product issuer or financial adviser.
Fund performance reflects any applicable fee waivers and/or expense reimbursements. Had the adviser not waived fees and/or reimbursed expenses currently or in the past, returns would have been lower. See current prospectus for more information.
| 1 | Total annual Fund operating expenses after any contractual fee waivers and/or expense reimbursements by the adviser in effect through at least April 30, 2019. See current prospectus for more information. |
Invesco V.I. Comstock Fund
Invesco V.I. Comstock Fund’s investment objective is to seek capital growth and income through investments in equity securities, including common stocks, preferred stocks and securities convertible into common and preferred stocks.
| ∎ | | Unless otherwise stated, information presented in this report is as of December 31, 2017, and is based on total net assets. |
| ∎ | | Unless otherwise noted, all data provided by Invesco. |
Principal risks of investing in the Fund
Depositary receipts risk. Investing in depositary receipts involves the same risks as direct investments in foreign securities. In addition, the underlying issuers of certain depositary receipts are under no obligation to distribute shareholder communications or pass through any voting rights with respect to the deposited securities to the holders of such receipts. The Fund may therefore receive less timely information or have less control than if it invested directly in the foreign issuer.
Derivatives risk. The value of a derivative instrument depends largely on (and is derived from) the value of an underlying security, currency, commodity, interest rate, index or other asset (each referred to as an underlying asset). In addition to risks relating to the underlying assets, the use of derivatives may include other, possibly greater, risks, including counterparty, leverage and liquidity risks. Counterparty risk is the risk that the counterparty to the derivative contract will default on its obligation to pay the Fund the amount owed or otherwise perform under the derivative contract. Derivatives create leverage risk because they do not require payment up front equal to the economic exposure created by owning the derivative. As a result, an adverse change in the value of the underlying asset could result in the Fund sustaining a loss that is substantially greater than the amount invested in the derivative, which may make the Fund’s returns more volatile and increase the risk of loss. Derivative instruments may also be less liquid than more traditional investments and the Fund may be unable to sell or close out its derivative positions at a desirable time or price. This risk may be more acute under adverse market conditions, during which the Fund may be most in need of liquidating its derivative positions. Derivatives may also be harder to value, less tax efficient and subject to changing government regulation that could impact the Fund’s ability to use certain derivatives or their cost. Also, derivatives used for hedging or to gain or limit exposure to a particular market segment may not provide the expected benefits, particularly during adverse market conditions.
Emerging markets securities risk. Emerging markets (also referred to as developing markets) are generally subject to greater market volatility, political, social and economic instability, uncertain trading markets and more governmental limitations on foreign investment than more developed markets. In addition, companies operating in emerging markets may be subject to lower trading volume and greater price fluctuations than companies in more developed markets. Securities law and the enforcement of systems of taxation in many emerging market countries may change quickly and unpredictably. In addition, investments in emerging markets securities may also be subject to additional transaction costs, delays in settlement procedures, and lack of timely information.
Foreign securities risk. The Fund’s foreign investments may be adversely affected by political and social instability, changes in economic or taxation policies, difficulty in enforcing obligations, decreased liquidity or increased volatility. Foreign investments also involve the risk of the possible seizure, nationalization or expropriation of the issuer or foreign deposits (in which the Fund could lose its entire investments in a certain market) and the possible adoption of foreign governmental restrictions such as exchange controls. Unless the Fund has hedged its foreign securities risk, foreign securities risk also involves the risk of negative foreign currency rate fluctuations, which may cause the value of securities denominated in such foreign currency (or other instruments through which the Fund has exposure to foreign currencies) to decline in value. Currency exchange rates may fluctuate significantly over short periods of time. Currency hedging strategies, if used, are not always successful.
Management risk. The Fund is actively managed and depends heavily on the Adviser’s judgment about markets, interest rates or the attractiveness, relative values, liquidity, or potential appreciation of particular investments made for the Fund’s portfolio. The Fund could experience losses if these judgments prove to be incorrect. Additionally, legislative, regulatory, or tax developments may adversely affect management of the Fund and, therefore, the ability of the Fund to achieve its investment objective.
Market risk. The market values of the Fund’s investments, and therefore the value of the Fund’s shares, will go up and down, sometimes rapidly or unpredictably. Market risk may affect a single issuer, industry or section of the economy, or it may affect the market as a whole. Individual stock prices tend to go up and down more dramatically than those of certain other types of investments, such as bonds. During a general downturn in the financial markets, multiple asset classes may decline in value. When markets perform well, there can be no assurance that specific investments held by the Fund will rise in value.
REIT risk/real estate risk. Investments in real estate related instruments may be affected by economic, legal, cultural, environmental or technological factors that affect property values, rents or occupancies of real estate related to the Fund’s holdings. Shares of real estate related companies, which tend to be small-and mid-cap companies, may be more volatile and less liquid.
Sector focus risk. The Fund may from time to time invest a significant amount of its assets (i.e. over 25%) in one market sector or group of related industries. In this event, the Fund’s performance will depend to a greater extent on the overall condition of the sector or group of industries and there is increased risk that the Fund will lose significant value if conditions adversely affect that sector or group of industries.
Small-and mid-capitalization companies risks. Small-and mid-capitalization companies tend to be more vulnerable to changing market conditions, may have little or no operating history or track record of success, and may have more limited product lines and markets, less experienced management and fewer financial resources than larger companies. These companies’ securities may be more volatile and less liquid than those of more established companies, and their returns may vary, sometimes significantly, from the overall securities market.
Value investing style risk. A value investing style subjects the Fund to the risk that the valuations never improve or that the returns on value equity securities are less than returns on other styles of investing or the overall stock market.
Invesco V.I. Comstock Fund
About indexes used in this report
The S&P 500® Index is an unmanaged index considered representative of the US stock market.
The Russell 1000® Value Index is an unmanaged index considered representative of large-cap value stocks. The Russell 1000 Value Index is a trademark/service mark of the Frank Russell Co. Russell® is a trademark of the Frank Russell Co.
The Lipper VUF Large-Cap Value Funds Index is an unmanaged index considered representative of large-cap value variable insurance underlying funds tracked by Lipper.
The Fund is not managed to track the performance of any particular index, including the index(es) described here, and consequently, the performance of the Fund may deviate significantly from the performance of the index(es).
A direct investment cannot be made in an index. Unless otherwise indicated, index results include reinvested dividends, and they do not reflect sales charges. Performance of the peer group, if applicable, reflects fund expenses; performance of a market index does not.
Other information
The returns shown in management’s discussion of Fund performance are based on net asset values calculated for shareholder transactions. Generally accepted accounting principles require adjustments to be made to the net assets of the Fund at period end for financial reporting purposes, and as such, the net asset values for shareholder transactions and the returns based on those net asset values may differ from the net asset values and returns reported in the Financial Highlights. Additionally, the returns and net asset values shown throughout this report are at the Fund level only and do not include variable product issuer charges. If such charges were included, the total returns would be lower.
Industry classifications used in this report are generally according to the Global Industry Classification Standard, which was developed by and is the exclusive property and a service mark of MSCI Inc. and Standard & Poor’s.
Invesco V.I. Comstock Fund
Schedule of Investments(a)
December 31, 2017
| | | | | | | | |
| | | Shares | | | Value | |
Common Stocks & Other Equity Interests–95.87% | |
| Aerospace & Defense–1.94% | |
Arconic Inc. | | | 568,867 | | | $ | 15,501,617 | |
Textron Inc. | | | 382,581 | | | | 21,650,259 | |
| | | | | | | | 37,151,876 | |
|
| Aluminum–0.49% | |
Alcoa Corp.(b) | | | 174,994 | | | | 9,426,927 | |
|
| Asset Management & Custody Banks–2.74% | |
Bank of New York Mellon Corp. (The) | | | 517,664 | | | | 27,881,383 | |
State Street Corp. | | | 250,825 | | | | 24,483,028 | |
| | | | | | | | 52,364,411 | |
|
| Automobile Manufacturers–1.89% | |
General Motors Co. | | | 882,759 | | | | 36,184,291 | |
|
| Automotive Retail–0.77% | |
Advance Auto Parts, Inc. | | | 148,601 | | | | 14,814,034 | |
|
| Biotechnology–2.22% | |
Biogen Inc.(b) | | | 58,724 | | | | 18,707,705 | |
Gilead Sciences, Inc. | | | 191,668 | | | | 13,731,096 | |
Shire PLC | | | 194,799 | | | | 10,103,524 | |
| | | | | | | | 42,542,325 | |
|
| Broadcasting–0.50% | |
CBS Corp.–Class B | | | 162,870 | | | | 9,609,330 | |
|
| Building Products–1.51% | |
Johnson Controls International PLC | | | 756,760 | | | | 28,840,124 | |
|
| Cable & Satellite–1.09% | |
Charter Communications, Inc.–Class A(b) | | | 24,985 | | | | 8,393,961 | |
Comcast Corp.–Class A | | | 310,640 | | | | 12,441,132 | |
| | | | | | | | 20,835,093 | |
|
| Communications Equipment–2.82% | |
Cisco Systems, Inc. | | | 1,410,129 | | | | 54,007,941 | |
|
| Construction Machinery & Heavy Trucks–1.16% | |
Caterpillar Inc. | | | 141,328 | | | | 22,270,466 | |
|
| Consumer Finance–1.26% | |
Ally Financial Inc. | | | 824,946 | | | | 24,055,425 | |
|
| Data Processing & Outsourced Services–0.75% | |
PayPal Holdings, Inc.(b) | | | 193,956 | | | | 14,279,041 | |
|
| Diversified Banks–16.09% | |
Bank of America Corp. | | | 3,092,090 | | | | 91,278,497 | |
Citigroup Inc. | | | 1,487,736 | | | | 110,702,436 | |
JPMorgan Chase & Co. | | | 649,422 | | | | 69,449,188 | |
U.S. Bancorp | | | 51,022 | | | | 2,733,759 | |
Wells Fargo & Co. | | | 557,051 | | | | 33,796,284 | |
| | | | | | | | 307,960,164 | |
| | | | | | | | |
| | | Shares | | | Value | |
| Drug Retail–0.75% | |
CVS Health Corp. | | | 197,805 | | | $ | 14,340,862 | |
|
| Electric Utilities–0.57% | |
FirstEnergy Corp. | | | 358,474 | | | | 10,976,474 | |
|
| Electrical Components & Equipment–2.30% | |
Eaton Corp. PLC | | | 386,099 | | | | 30,505,682 | |
Emerson Electric Co. | | | 194,570 | | | | 13,559,583 | |
| | | | | | | | 44,065,265 | |
|
| Fertilizers & Agricultural Chemicals–0.92% | |
CF Industries Holdings, Inc. | | | 414,009 | | | | 17,611,943 | |
|
| Health Care Distributors–1.83% | |
Cardinal Health, Inc. | | | 289,344 | | | | 17,728,107 | |
McKesson Corp. | | | 110,335 | | | | 17,206,743 | |
| | | | | | | | 34,934,850 | |
|
| Health Care Equipment–0.69% | |
Medtronic PLC | | | 163,502 | | | | 13,202,786 | |
|
| Hotels, Resorts & Cruise Lines–1.62% | |
Carnival Corp. | | | 467,856 | | | | 31,051,603 | |
|
| Household Products–0.41% | |
Reckitt Benckiser Group PLC (United Kingdom) | | | 83,285 | | | | 7,779,937 | |
|
| Hypermarkets & Super Centers–1.17% | |
Wal-Mart Stores, Inc. | | | 226,746 | | | | 22,391,167 | |
|
| Industrial Conglomerates–0.66% | |
General Electric Co. | | | 720,421 | | | | 12,571,346 | |
|
| Industrial Machinery–0.58% | |
Ingersoll-Rand PLC | | | 123,442 | | | | 11,009,792 | |
|
| Integrated Oil & Gas–9.33% | |
BP PLC–ADR (United Kingdom) | | | 856,090 | | | | 35,981,463 | |
Chevron Corp. | | | 301,538 | | | | 37,749,542 | |
Occidental Petroleum Corp. | | | 238,766 | | | | 17,587,504 | |
Royal Dutch Shell PLC–Class A–ADR (United Kingdom) | | | 651,488 | | | | 43,460,764 | |
Suncor Energy, Inc. (Canada) | | | 1,191,284 | | | | 43,743,948 | |
| | | | | | | | 178,523,221 | |
|
| Internet Software & Services–1.69% | |
Altaba Inc.(b) | | | 130,580 | | | | 9,121,013 | |
eBay Inc.(b) | | | 614,691 | | | | 23,198,438 | |
| | | | | | | | 32,319,451 | |
|
| Investment Banking & Brokerage–3.20% | |
Goldman Sachs Group, Inc. (The) | | | 85,906 | | | | 21,885,412 | |
Morgan Stanley | | | 750,895 | | | | 39,399,461 | |
| | | | | | | | 61,284,873 | |
See accompanying Notes to Financial Statements which are an integral part of the financial statements.
Invesco V.I. Comstock Fund
| | | | | | | | |
| | | Shares | | | Value | |
| IT Consulting & Other Services–0.67% | |
Cognizant Technology Solutions Corp.–Class A | | | 179,166 | | | $ | 12,724,369 | |
|
| Life & Health Insurance–2.11% | |
Aflac, Inc. | | | 123,800 | | | | 10,867,164 | |
MetLife, Inc. | | | 583,893 | | | | 29,521,630 | |
| | | | | | | | 40,388,794 | |
|
| Managed Health Care–1.50% | |
Anthem, Inc. | | | 127,572 | | | | 28,704,976 | |
|
| Movies & Entertainment–0.70% | |
Twenty-First Century Fox, Inc.–Class B | | | 392,163 | | | | 13,380,602 | |
|
| Multi-Line Insurance–1.32% | |
American International Group, Inc. | | | 425,148 | | | | 25,330,318 | |
|
| Oil & Gas Equipment & Services–0.96% | |
Halliburton Co. | | | 376,605 | | | | 18,404,686 | |
|
| Oil & Gas Exploration & Production–6.32% | |
Anadarko Petroleum Corp. | | | 138,737 | | | | 7,441,853 | |
Canadian Natural Resources Ltd. (Canada) | | | 595,743 | | | | 21,291,094 | |
Devon Energy Corp. | | | 724,357 | | | | 29,988,380 | |
Hess Corp. | | | 459,206 | | | | 21,798,509 | |
Marathon Oil Corp. | | | 1,883,249 | | | | 31,883,405 | |
QEP Resources, Inc.(b) | | | 894,264 | | | | 8,558,106 | |
| | | | | | | | 120,961,347 | |
|
| Packaged Foods & Meats–1.23% | |
Danone S.A. (France) | | | 280,805 | | | | 23,541,037 | |
|
| Paper Packaging–0.91% | |
International Paper Co. | | | 302,082 | | | | 17,502,631 | |
|
| Pharmaceuticals–6.27% | |
Merck & Co., Inc. | | | 330,790 | | | | 18,613,553 | |
Mylan N.V.(b) | | | 525,987 | | | | 22,254,510 | |
Novartis AG (Switzerland) | | | 196,810 | | | | 16,644,919 | |
Pfizer Inc. | | | 994,832 | | | | 36,032,815 | |
Sanofi–ADR (France) | | | 613,333 | | | | 26,373,319 | |
| | | | | | | | 119,919,116 | |
| | | | | | | | |
| | | Shares | | | Value | |
| Property & Casualty Insurance–1.15% | |
Allstate Corp. (The) | | | 211,049 | | | $ | 22,098,941 | |
|
| Regional Banks–5.54% | |
Citizens Financial Group, Inc. | | | 568,157 | | | | 23,851,231 | |
Fifth Third Bancorp | | | 1,073,680 | | | | 32,575,451 | |
KeyCorp | | | 399,852 | | | | 8,065,015 | |
PNC Financial Services Group, Inc. (The) | | | 287,821 | | | | 41,529,692 | |
| | | | | | | | 106,021,389 | |
|
| Semiconductors–3.19% | |
Intel Corp. | | | 690,602 | | | | 31,878,188 | |
QUALCOMM Inc. | | | 457,084 | | | | 29,262,518 | |
| | | | | | | | 61,140,706 | |
|
| Systems Software–1.57% | |
Microsoft Corp. | | | 350,540 | | | | 29,985,192 | |
|
| Technology Hardware, Storage & Peripherals–0.72% | |
NetApp, Inc. | | | 248,959 | | | | 13,772,412 | |
|
| Wireless Telecommunication Services–0.76% | |
Vodafone Group PLC (United Kingdom) | | | 4,618,323 | | | | 14,589,064 | |
Total Common Stocks & Other Equity Interests (Cost $1,441,270,400) | | | | 1,834,870,598 | |
|
Money Market Funds–4.78% | |
Invesco Government & Agency Portfolio–Institutional Class, 1.18%(c) | | | 32,029,553 | | | | 32,029,553 | |
Invesco Liquid Assets Portfolio–Institutional Class, 1.40%(c) | | | 22,874,427 | | | | 22,876,714 | |
Invesco Treasury Portfolio–
Institutional Class, 1.17%(c) | | | 36,605,203 | | | | 36,605,203 | |
Total Money Market Funds
(Cost $91,513,088) | | | | 91,511,470 | |
TOTAL INVESTMENTS IN SECURITIES–100.65%
(Cost $1,532,783,488) | | | | 1,926,382,068 | |
OTHER ASSETS LESS LIABILITIES–(0.65)% | | | | (12,450,231 | ) |
NET ASSETS–100.00% | | | | | | $ | 1,913,931,837 | |
Investment Abbreviations:
| | |
| ADR | | — American Depositary Receipt |
Notes to Schedule of Investments:
| (a) | Industry and/or sector classifications used in this report are generally according to the Global Industry Classification Standard, which was developed by and is the exclusive property and a service mark of MSCI Inc. and Standard & Poor’s. |
| (b) | Non-income producing security. |
| (c) | The money market fund and the Fund are affiliated by having the same investment adviser. The rate shown is the 7-day SEC standardized yield as of December 31, 2017. |
See accompanying Notes to Financial Statements which are an integral part of the financial statements.
Invesco V.I. Comstock Fund
| | | | | | | | | | | | | | | | | | | | | | |
| Open Forward Foreign Currency Contracts | |
Settlement Date | | Counterparty | | Contract to | | | Unrealized
Appreciation
(Depreciation) | |
| | | Deliver | | | Receive | | |
01/19/2018 | | Barclays Bank PLC | | | CAD | | | | 16,679,199 | | | | USD | | | | 12,951,851 | | | $ | (322,619 | ) |
01/19/2018 | | Barclays Bank PLC | | | CHF | | | | 3,517,294 | | | | USD | | | | 3,578,049 | | | | (37,690 | ) |
01/19/2018 | | Barclays Bank PLC | | | GBP | | | | 10,158,735 | | | | USD | | | | 13,587,028 | | | | (138,484 | ) |
01/19/2018 | | CIBC World Markets Corp. | | | EUR | | | | 16,700,324 | | | | USD | | | | 19,793,224 | | | | (270,502 | ) |
01/19/2018 | | Deutsche Bank Securities Inc. | | | CAD | | | | 16,679,199 | | | | USD | | | | 12,950,594 | | | | (323,876 | ) |
01/19/2018 | | Deutsche Bank Securities Inc. | | | CHF | | | | 3,517,294 | | | | USD | | | | 3,574,849 | | | | (40,890 | ) |
01/19/2018 | | Deutsche Bank Securities Inc. | | | GBP | | | | 11,868,295 | | | | USD | | | | 15,880,309 | | | | (154,998 | ) |
01/19/2018 | | Goldman Sachs International | | | CHF | | | | 3,517,294 | | | | USD | | | | 3,573,760 | | | | (41,979 | ) |
01/19/2018 | | Goldman Sachs International | | | EUR | | | | 16,700,324 | | | | USD | | | | 19,785,041 | | | | (278,685 | ) |
01/19/2018 | | Goldman Sachs International | | | GBP | | | | 10,158,735 | | | | USD | | | | 13,590,152 | | | | (135,360 | ) |
01/19/2018 | | JPMorgan Chase Bank, N.A. | | | CAD | | | | 16,679,199 | | | | USD | | | | 12,949,387 | | | | (325,083 | ) |
01/19/2018 | | JPMorgan Chase Bank, N.A. | | | CHF | | | | 3,517,080 | | | | USD | | | | 3,572,489 | | | | (43,030 | ) |
01/19/2018 | | JPMorgan Chase Bank, N.A. | | | EUR | | | | 16,703,876 | | | | USD | | | | 19,792,423 | | | | (275,570 | ) |
01/19/2018 | | RBC Capital Markets Corp. | | | CAD | | | | 16,679,101 | | | | USD | | | | 12,945,994 | | | | (328,398 | ) |
01/19/2018 | | RBC Capital Markets Corp. | | | EUR | | | | 16,700,324 | | | | USD | | | | 19,786,961 | | | | (276,765 | ) |
01/19/2018 | | RBC Capital Markets Corp. | | | GBP | | | | 10,158,735 | | | | USD | | | | 13,590,355 | | | | (135,157 | ) |
Total Forward Foreign Currency Contracts — Currency Risk | | | | | | | | | | | | | | | | | | $ | (3,129,086 | ) |
Abbreviations:
| | |
| CAD | | – Canadian Dollar |
| CHF | | – Swiss Franc |
| EUR | | – Euro |
| GBP | | – British Pound Sterling |
| USD | | – U.S. Dollar |
See accompanying Notes to Financial Statements which are an integral part of the financial statements.
Invesco V.I. Comstock Fund
Statement of Assets and Liabilities
December 31, 2017
Statement of Operations
For the year ended December 31, 2017
| | | | |
Assets: | | | | |
Investments in securities, at value (Cost $1,441,270,400) | | $ | 1,834,870,598 | |
Investments in affiliated money market funds, at value (Cost $91,513,088) | | | 91,511,470 | |
Cash | | | 56,472 | |
Foreign currencies, at value (Cost $4,622) | | | 4,666 | |
Receivable for: | | | | |
Investments sold | | | 3,146,696 | |
Fund shares sold | | | 73,995 | |
Dividends | | | 2,102,497 | |
Investment for trustee deferred compensation and retirement plans | | | 208,603 | |
Total assets | | | 1,931,974,997 | |
| |
Liabilities: | | | | |
Other investments: | | | | |
Unrealized depreciation on forward foreign currency contracts outstanding | | | 3,129,086 | |
Payable for: | | | | |
Investments purchased | | | 331,739 | |
Fund shares reacquired | | | 12,579,594 | |
Accrued fees to affiliates | | | 1,727,369 | |
Accrued trustees’ and officers’ fees and benefits | | | 1,524 | |
Accrued other operating expenses | | | 38,063 | |
Trustee deferred compensation and retirement plans | | | 235,785 | |
Total liabilities | | | 18,043,160 | |
Net assets applicable to shares outstanding | | $ | 1,913,931,837 | |
| |
Net assets consist of: | | | | |
Shares of beneficial interest | | $ | 1,347,808,595 | |
Undistributed net investment income | | | 23,361,865 | |
Undistributed net realized gain | | | 152,279,322 | |
Net unrealized appreciation | | | 390,482,055 | |
| | | $ | 1,913,931,837 | |
| |
Net Assets: | | | | |
Series I | | $ | 270,650,916 | |
Series II | | $ | 1,643,280,921 | |
|
Shares outstanding, no par value,
with an unlimited number of shares authorized: | |
Series I | | | 13,123,732 | |
Series II | | | 80,007,737 | |
Series I: | | | | |
Net asset value per share | | $ | 20.62 | |
Series II: | | | | |
Net asset value per share | | $ | 20.54 | |
| | | | |
Investment income: | | | | |
Dividends (net of foreign withholding taxes of $937,185) | | $ | 41,241,736 | |
Dividends from affiliated money market funds | | | 426,064 | |
Total investment income | | | 41,667,800 | |
| |
Expenses: | | | | |
Advisory fees | | | 10,554,476 | |
Administrative services fees | | | 3,148,132 | |
Custodian fees | | | 65,106 | |
Distribution fees — Series II | | | 4,046,002 | |
Transfer agent fees | | | 37,672 | |
Trustees’ and officers’ fees and benefits | | | 45,812 | |
Reports to shareholders | | | 199,862 | |
Professional services fees | | | 55,850 | |
Other | | | 23,506 | |
Total expenses | | | 18,176,418 | |
Less: Fees waived | | | (54,344 | ) |
Net expenses | | | 18,122,074 | |
Net investment income | | | 23,545,726 | |
| |
Realized and unrealized gain (loss) from: | | | | |
Net realized gain (loss) from: | | | | |
Investment securities | | | 164,991,354 | |
Foreign currencies | | | 58,253 | |
Forward foreign currency contracts | | | (8,866,170 | ) |
| | | | 156,183,437 | |
Change in net unrealized appreciation (depreciation) of: | | | | |
Investment securities | | | 129,776,331 | |
Foreign currencies | | | 18,336 | |
Forward foreign currency contracts | | | (6,116,444 | ) |
| | | | 123,678,223 | |
Net realized and unrealized gain | | | 279,861,660 | |
Net increase in net assets resulting from operations | | $ | 303,407,386 | |
See accompanying Notes to Financial Statements which are an integral part of the financial statements.
Invesco V.I. Comstock Fund
Statement of Changes in Net Assets
For the years ended December 31, 2017 and 2016
| | | | | | | | |
| | | 2017 | | | 2016 | |
Operations: | | | | | | | | |
Net investment income | | $ | 23,545,726 | | | $ | 36,500,553 | |
Net realized gain | | | 156,183,437 | | | | 78,523,600 | |
Change in net unrealized appreciation | | | 123,678,223 | | | | 178,667,857 | |
Net increase in net assets resulting from operations | | | 303,407,386 | | | | 293,692,010 | |
| | |
Distributions to shareholders from net investment income: | | | | | | | | |
Series I | | | (5,551,772 | ) | | | (3,755,275 | ) |
Series ll | | | (31,132,801 | ) | | | (21,043,734 | ) |
Total distributions from net investment income | | | (36,684,573 | ) | | | (24,799,009 | ) |
| | |
Distributions to shareholders from net realized gains: | | | | | | | | |
Series l | | | (10,812,478 | ) | | | (18,737,448 | ) |
Series ll | | | (68,204,783 | ) | | | (126,507,707 | ) |
Total distributions from net realized gains | | | (79,017,261 | ) | | | (145,245,155 | ) |
| | |
Share transactions–net: | | | | | | | | |
Series l | | | (11,573,352 | ) | | | (92,188,106 | ) |
Series ll | | | (198,048,701 | ) | | | 22,299,020 | |
Net increase (decrease) in net assets resulting from share transactions | | | (209,622,053 | ) | | | (69,889,086 | ) |
Net increase (decrease) in net assets | | | (21,916,501 | ) | | | 53,758,760 | |
| | |
Net assets: | | | | | | | | |
Beginning of year | | | 1,935,848,338 | | | | 1,882,089,578 | |
End of year (includes undistributed net investment income of $23,361,865 and $36,453,985, respectively) | | $ | 1,913,931,837 | | | $ | 1,935,848,338 | |
Notes to Financial Statements
December 31, 2017
NOTE 1—Significant Accounting Policies
Invesco V.I. Comstock Fund (the “Fund”) is a series portfolio of AIM Variable Insurance Funds (Invesco Variable Insurance Funds) (the “Trust”). The Trust is a Delaware statutory trust registered under the Investment Company Act of 1940, as amended (the “1940 Act”), as an open-end series management investment company consisting of twenty-four separate portfolios, (each constituting a “Fund”). The assets, liabilities and operations of each portfolio are accounted for separately. Information presented in these financial statements pertains only to the Fund. Matters affecting each Fund or class will be voted on exclusively by the shareholders of such Fund or class. Current Securities and Exchange Commission (“SEC”) guidance, however, requires participating insurance companies offering separate accounts to vote shares proportionally in accordance with the instructions of the contract owners whose investments are funded by shares of each Fund or class.
The Fund’s investment objective is to seek capital growth and income through investments in equity securities, including common stocks, preferred stocks and securities convertible into common and preferred stocks.
The Fund currently offers two classes of shares, Series I and Series II, both of which are offered to insurance company separate accounts funding variable annuity contracts and variable life insurance policies (“variable products”).
The Fund is an investment company and accordingly follows the investment company accounting and reporting guidance in accordance with Financial Accounting Standards Board Accounting Standards Codification Topic 946, Financial Services — Investment Companies.
The following is a summary of the significant accounting policies followed by the Fund in the preparation of its financial statements.
| A. | Security Valuations — Securities, including restricted securities, are valued according to the following policy. |
A security listed or traded on an exchange (except convertible securities) is valued at its last sales price or official closing price as of the close of the customary trading session on the exchange where the security is principally traded, or lacking any sales or official closing price on a particular day, the security may be valued at the closing bid price on that day. Securities traded in the over-the-counter market are valued based on prices furnished by independent pricing services or market makers. When such securities are valued by an independent pricing service they may be considered fair valued. Futures contracts are valued at the final settlement price set by an exchange on which they are principally traded. Listed options are valued at the mean between the last bid and asked prices from the exchange on which they are principally traded. Options not listed on an exchange are valued by an independent source at the mean between the last bid and asked prices. For purposes of determining net asset value (“NAV”) per share, futures and option contracts generally are valued 15 minutes after the close of the customary trading session of the New York Stock Exchange (“NYSE”).
Invesco V.I. Comstock Fund
Investments in open-end and closed-end registered investment companies that do not trade on an exchange are valued at the end-of-day net asset value per share. Investments in open-end and closed-end registered investment companies that trade on an exchange are valued at the last sales price or official closing price as of the close of the customary trading session on the exchange where the security is principally traded.
Debt obligations (including convertible securities) and unlisted equities are fair valued using an evaluated quote provided by an independent pricing service. Evaluated quotes provided by the pricing service may be determined without exclusive reliance on quoted prices, and may reflect appropriate factors such as institution-size trading in similar groups of securities, developments related to specific securities, dividend rate (for unlisted equities), yield (for debt obligations), quality, type of issue, coupon rate (for debt obligations), maturity (for debt obligations), individual trading characteristics and other market data. Pricing services generally value debt obligations assuming orderly transactions of institutional round lot size, but a fund may hold or transact in the same securities in smaller, odd lot sizes. Odd lots often trade at lower prices than institutional round lots. Debt obligations are subject to interest rate and credit risks. In addition, all debt obligations involve some risk of default with respect to interest and/or principal payments.
Foreign securities’ (including foreign exchange contracts) prices are converted into U.S. dollar amounts using the applicable exchange rates as of the close of the NYSE. If market quotations are available and reliable for foreign exchange-traded equity securities, the securities will be valued at the market quotations. Because trading hours for certain foreign securities end before the close of the NYSE, closing market quotations may become unreliable. If between the time trading ends on a particular security and the close of the customary trading session on the NYSE, events occur that the investment adviser determines are significant and make the closing price unreliable, the Fund may fair value the security. If the event is likely to have affected the closing price of the security, the security will be valued at fair value in good faith using procedures approved by the Board of Trustees. Adjustments to closing prices to reflect fair value may also be based on a screening process of an independent pricing service to indicate the degree of certainty, based on historical data, that the closing price in the principal market where a foreign security trades is not the current value as of the close of the NYSE. Foreign securities’ prices meeting the approved degree of certainty that the price is not reflective of current value will be priced at the indication of fair value from the independent pricing service. Multiple factors may be considered by the independent pricing service in determining adjustments to reflect fair value and may include information relating to sector indices, American Depositary Receipts and domestic and foreign index futures. Foreign securities may have additional risks including exchange rate changes, potential for sharply devalued currencies and high inflation, political and economic upheaval, the relative lack of issuer information, relatively low market liquidity and the potential lack of strict financial and accounting controls and standards.
Securities for which market prices are not provided by any of the above methods may be valued based upon quotes furnished by independent sources. The last bid price may be used to value equity securities. The mean between the last bid and asked prices is used to value debt obligations, including corporate loans.
Securities for which market quotations are not readily available or became unreliable are valued at fair value as determined in good faith by or under the supervision of the Trust’s officers following procedures approved by the Board of Trustees. Issuer specific events, market trends, bid/asked quotes of brokers and information providers and other market data may be reviewed in the course of making a good faith determination of a security’s fair value.
The Fund may invest in securities that are subject to interest rate risk, meaning the risk that the prices will generally fall as interest rates rise and, conversely, the prices will generally rise as interest rates fall. Specific securities differ in their sensitivity to changes in interest rates depending on their individual characteristics. Changes in interest rates may result in increased market volatility, which may affect the value and/or liquidity of certain Fund investments.
Valuations change in response to many factors including the historical and prospective earnings of the issuer, the value of the issuer’s assets, general economic conditions, interest rates, investor perceptions and market liquidity. Because of the inherent uncertainties of valuation, the values reflected in the financial statements may materially differ from the value received upon actual sale of those investments.
| B. | Securities Transactions and Investment Income — Securities transactions are accounted for on a trade date basis. Realized gains or losses on sales are computed on the basis of specific identification of the securities sold. Interest income (net of withholding tax, if any) is recorded on the accrual basis from settlement date. Dividend income (net of withholding tax, if any) is recorded on the ex-dividend date. |
The Fund may periodically participate in litigation related to Fund investments. As such, the Fund may receive proceeds from litigation settlements. Any proceeds received are included in the Statement of Operations as realized gain (loss) for investments no longer held and as unrealized gain (loss) for investments still held.
Brokerage commissions and mark ups are considered transaction costs and are recorded as an increase to the cost basis of securities purchased and/or a reduction of proceeds on a sale of securities. Such transaction costs are included in the determination of net realized and unrealized gain (loss) from investment securities reported in the Statement of Operations and the Statement of Changes in Net Assets and the net realized and unrealized gains (losses) on securities per share in the Financial Highlights. Transaction costs are included in the calculation of the Fund’s net asset value and, accordingly, they reduce the Fund’s total returns. These transaction costs are not considered operating expenses and are not reflected in net investment income reported in the Statement of Operations and the Statement of Changes in Net Assets, or the net investment income per share and the ratios of expenses and net investment income reported in the Financial Highlights, nor are they limited by any expense limitation arrangements between the Fund and the investment adviser.
The Fund allocates income and realized and unrealized capital gains and losses to a class based on the relative net assets of each class.
| C. | Country Determination — For the purposes of making investment selection decisions and presentation in the Schedule of Investments, the investment adviser may determine the country in which an issuer is located and/or credit risk exposure based on various factors. These factors include the laws of the country under which the issuer is organized, where the issuer maintains a principal office, the country in which the issuer derives 50% or more of its total revenues and the country that has the primary market for the issuer’s securities, as well as other criteria. Among the other criteria that may be evaluated for making this determination are the country in which the issuer maintains 50% or more of its assets, the type of security, financial guarantees and enhancements, the nature of the collateral and the sponsor organization. Country of issuer and/or credit risk exposure has been determined to be the United States of America, unless otherwise noted. |
| D. | Distributions — Distributions from net investment income and net realized capital gain, if any, are generally declared and paid to separate accounts of participating insurance companies annually and recorded on the ex-dividend date. |
Invesco V.I. Comstock Fund
| E. | Federal Income Taxes — The Fund intends to comply with the requirements of Subchapter M of the Internal Revenue Code of 1986, as amended (the “Internal Revenue Code”), necessary to qualify as a regulated investment company and to distribute substantially all of the Fund’s taxable earnings to shareholders. As such, the Fund will not be subject to federal income taxes on otherwise taxable income (including net realized capital gain) that is distributed to shareholders. Therefore, no provision for federal income taxes is recorded in the financial statements. |
The Fund recognizes the tax benefits of uncertain tax positions only when the position is more likely than not to be sustained. Management has analyzed the Fund’s uncertain tax positions and concluded that no liability for unrecognized tax benefits should be recorded related to uncertain tax positions. Management is not aware of any tax positions for which it is reasonably possible that the total amounts of unrecognized tax benefits will change materially in the next 12 months.
The Fund files tax returns in the U.S. Federal jurisdiction and certain other jurisdictions. Generally, the Fund is subject to examinations by such taxing authorities for up to three years after the filing of the return for the tax period.
| F. | Expenses — Fees provided for under the Rule 12b-1 plan of a particular class of the Fund and which are directly attributable to that class are charged to the operations of such class. All other expenses are allocated among the classes based on relative net assets. |
| G. | Accounting Estimates — The preparation of financial statements in conformity with accounting principles generally accepted in the United States of America (“GAAP”) requires management to make estimates and assumptions that affect the reported amounts of assets and liabilities at the date of the financial statements and the reported amounts of revenues and expenses during the reporting period including estimates and assumptions related to taxation. Actual results could differ from those estimates by a significant amount. In addition, the Fund monitors for material events or transactions that may occur or become known after the period-end date and before the date the financial statements are released to print. |
| H. | Indemnifications — Under the Trust’s organizational documents, each Trustee, officer, employee or other agent of the Trust is indemnified against certain liabilities that may arise out of the performance of their duties to the Fund. Additionally, in the normal course of business, the Fund enters into contracts, including the Fund’s servicing agreements, that contain a variety of indemnification clauses. The Fund’s maximum exposure under these arrangements is unknown as this would involve future claims that may be made against the Fund that have not yet occurred. The risk of material loss as a result of such indemnification claims is considered remote. |
| I. | Foreign Currency Translations — Foreign currency is valued at the close of the NYSE based on quotations posted by banks and major currency dealers. Portfolio securities and other assets and liabilities denominated in foreign currencies are translated into U.S. dollar amounts at date of valuation. Purchases and sales of portfolio securities (net of foreign taxes withheld on disposition) and income items denominated in foreign currencies are translated into U.S. dollar amounts on the respective dates of such transactions. The Fund does not separately account for the portion of the results of operations resulting from changes in foreign exchange rates on investments and the fluctuations arising from changes in market prices of securities held. The combined results of changes in foreign exchange rates and the fluctuation of market prices on investments (net of estimated foreign tax withholding) are included with the net realized and unrealized gain or loss from investments in the Statement of Operations. Reported net realized foreign currency gains or losses arise from (1) sales of foreign currencies, (2) currency gains or losses realized between the trade and settlement dates on securities transactions, and (3) the difference between the amounts of dividends, interest, and foreign withholding taxes recorded on the Fund’s books and the U.S. dollar equivalent of the amounts actually received or paid. Net unrealized foreign currency gains and losses arise from changes in the fair values of assets and liabilities, other than investments in securities at fiscal period end, resulting from changes in exchange rates. |
The Fund may invest in foreign securities, which may be subject to foreign taxes on income, gains on investments or currency repatriation, a portion of which may be recoverable. Foreign taxes, if any, are recorded based on the tax regulations and rates that exist in the foreign markets in which the Fund invests and are shown in the Statement of Operations.
| J. | Forward Foreign Currency Contracts — The Fund may engage in foreign currency transactions either on a spot (i.e. for prompt delivery and settlement) basis, or through forward foreign currency contracts, to manage or minimize currency or exchange rate risk. |
The Fund may also enter into forward foreign currency contracts for the purchase or sale of a security denominated in a foreign currency in order to “lock in” the U.S. dollar price of that security, or the Fund may also enter into forward foreign currency contracts that do not provide for physical settlement of the two currencies, but instead are settled by a single cash payment calculated as the difference between the agreed upon exchange rate and the spot rate at settlement based upon an agreed upon notional amount (non-deliverable forwards). The Fund will set aside liquid assets in an amount equal to the daily mark-to-market obligation for forward foreign currency contracts.
A forward foreign currency contract is an obligation between two parties (“Counterparties”) to purchase or sell a specific currency for an agreed-upon price at a future date. The use of forward foreign currency contracts does not eliminate fluctuations in the price of the underlying securities the Fund owns or intends to acquire but establishes a rate of exchange in advance. Fluctuations in the value of these contracts are measured by the difference in the contract date and reporting date exchange rates and are recorded as unrealized appreciation (depreciation) until the contracts are closed. When the contracts are closed, realized gains (losses) are recorded. Realized and unrealized gains (losses) on the contracts are included in the Statement of Operations. The primary risks associated with forward foreign currency contracts include failure of the Counterparty to meet the terms of the contract and the value of the foreign currency changing unfavorably. These risks may be in excess of the amounts reflected in the Statement of Assets and Liabilities.
NOTE 2—Advisory Fees and Other Fees Paid to Affiliates
The Trust has entered into a master investment advisory agreement with Invesco Advisers, Inc. (the “Adviser” or “Invesco”). Under the terms of the investment advisory agreement, the Fund accrues daily and pays monthly an advisory fee to the Adviser based on the annual rate of the Fund’s average daily net assets as follows:
| | | | |
| Average Daily Net Assets | | Rate | |
First $500 million | | | 0.60% | |
Over $500 million | | | 0.55% | |
For the year ended December 31, 2017, the effective advisory fees incurred by the Fund was 0.56%.
Invesco V.I. Comstock Fund
Under the terms of a master sub-advisory agreement between the Adviser and each of Invesco Asset Management Deutschland GmbH, Invesco Asset Management Limited, Invesco Asset Management (Japan) Limited, Invesco Hong Kong Limited, Invesco Senior Secured Management, Inc. and Invesco Canada Ltd. and separate sub-advisory agreements with Invesco PowerShares Capital Management LLC and Invesco Asset Management (India) Private Limited (collectively, the “Affiliated Sub-Advisers”) the Adviser, not the Fund, will pay 40% of the fees paid to the Adviser to any such Affiliated Sub-Adviser(s) that provide(s) discretionary investment management services to the Fund based on the percentage of assets allocated to such Affiliated Sub-Adviser(s).
The Adviser has contractually agreed, through at least April 30, 2019, to waive advisory fees and/or reimburse expenses to the extent necessary to limit total annual operating expenses after fee waiver and/or expense reimbursement (excluding certain items discussed below) of Series I shares to 0.78% and Series II shares to 1.03% of average daily net assets (the “expense limits”). In determining the Adviser’s obligation to waive advisory fees and/or reimburse expenses, the following expenses are not taken into account, and could cause total annual operating expenses after fee waiver and/or expense reimbursement to exceed the numbers reflected above: (1) interest; (2) taxes; (3) dividend expense on short sales; (4) extraordinary or non-routine items, including litigation expenses; and (5) expenses that the Fund has incurred but did not actually pay because of an expense offset arrangement. Unless Invesco continues the fee waiver agreement, it will terminate on April 30, 2019. During its term, the fee waiver agreement cannot be terminated or amended to increase the expense limits or reduce the advisory fee waiver without approval of the Board of Trustees. The Adviser did not waive fees and/or reimburse expenses during the period under these expense limits.
Further, the Adviser has contractually agreed, through at least June 30, 2019, to waive the advisory fee payable by the Fund in an amount equal to 100% of the net advisory fees the Adviser receives from the affiliated money market funds on investments by the Fund of uninvested cash in such affiliated money market funds.
For the year ended December 31, 2017, the Adviser waived advisory fees of $54,344.
The Trust has entered into a master administrative services agreement with Invesco pursuant to which the Fund has agreed to pay Invesco a fee for costs incurred in providing accounting services and fund administrative services to the Fund and to reimburse Invesco for fees paid to insurance companies that have agreed to provide certain administrative services to the Fund. These administrative services provided by the insurance companies may include, among other things: maintenance of master accounts with the Fund; tracking, recording and transmitting net purchase and redemption orders for Fund shares; maintaining and preserving records related to the purchase, redemption and other account activity of variable product owners; distributing copies of Fund documents such as prospectuses, proxy materials and periodic reports, to variable product owners, and responding to inquiries from variable product owners about the Fund. Pursuant to such agreement, for the year ended December 31, 2017, Invesco was paid $398,560 for accounting and fund administrative services and was reimbursed $2,749,572 for fees paid to insurance companies.
The Trust has entered into a transfer agency and service agreement with Invesco Investment Services, Inc. (“IIS”) pursuant to which the Fund has agreed to pay IIS a fee for providing transfer agency and shareholder services to the Fund and reimburse IIS for certain expenses incurred by IIS in the course of providing such services. For the year ended December 31, 2017, expenses incurred under the agreement are shown in the Statement of Operations as Transfer agent fees.
The Trust has entered into a master distribution agreement with Invesco Distributors, Inc. (“IDI”) to serve as the distributor for the Fund. The Trust has adopted a plan pursuant to Rule 12b-1 under the 1940 Act with respect to the Fund’s Series II shares (the “Plan”). The Fund, pursuant to the Plan, pays IDI compensation at the annual rate of 0.25% of the Fund’s average daily net assets of Series II shares. The fees are accrued daily and paid monthly. Of the Plan payments, up to 0.25% of the average daily net assets of the Series II shares may be paid to insurance companies who furnish continuing personal shareholder services to customers who purchase and own Series II shares of the Fund. For the year ended December 31, 2017, expenses incurred under the Plan are detailed in the Statement of Operations as Distribution fees.
For the year ended December 31, 2017, the Fund incurred $30,219 in brokerage commissions with Invesco Capital Markets, Inc., an affiliate of the Adviser and IDI, for portfolio transactions executed on behalf of the Fund.
Certain officers and trustees of the Trust are officers and directors of the Adviser, IIS and/or IDI.
NOTE 3—Additional Valuation Information
GAAP defines fair value as the price that would be received to sell an asset or paid to transfer a liability in an orderly transaction between market participants at the measurement date, under current market conditions. GAAP establishes a hierarchy that prioritizes the inputs to valuation methods, giving the highest priority to readily available unadjusted quoted prices in an active market for identical assets (Level 1) and the lowest priority to significant unobservable inputs (Level 3), generally when market prices are not readily available or are unreliable. Based on the valuation inputs, the securities or other investments are tiered into one of three levels. Changes in valuation methods may result in transfers in or out of an investment’s assigned level:
| | Level 1 — | Prices are determined using quoted prices in an active market for identical assets. |
| | Level 2 — | Prices are determined using other significant observable inputs. Observable inputs are inputs that other market participants may use in pricing a security. These may include quoted prices for similar securities, interest rates, prepayment speeds, credit risk, yield curves, loss severities, default rates, discount rates, volatilities and others. |
| | Level 3 — | Prices are determined using significant unobservable inputs. In situations where quoted prices or observable inputs are unavailable (for example, when there is little or no market activity for an investment at the end of the period), unobservable inputs may be used. Unobservable inputs reflect the Fund’s own assumptions about the factors market participants would use in determining fair value of the securities or instruments and would be based on the best available information. |
The following is a summary of the tiered valuation input levels, as of December 31, 2017. The level assigned to the securities valuations may not be an indication of the risk or liquidity associated with investing in those securities. Because of the inherent uncertainties of valuation, the values reflected in the financial statements may materially differ from the value received upon actual sale of those investments.
Invesco V.I. Comstock Fund
The Fund’s policy is to recognize transfers in and out of the valuation levels as of the end of the reporting period. During the year ended December 31, 2017, there were no material transfers between valuation levels.
| | | | | | | | | | | | | | | | |
| | | Level 1 | | | Level 2 | | | Level 3 | | | Total | |
| Investments in Securities | | | | | | | | | | | | |
Common Stocks & Other Equity Interests | | $ | 1,786,636,973 | | | $ | 48,233,625 | | | $ | — | | | $ | 1,834,870,598 | |
Money Market Funds | | | 91,511,470 | | | | — | | | | — | | | | 91,511,470 | |
Total Investments in Securities | | | 1,878,148,443 | | | | 48,233,625 | | | | — | | | | 1,926,382,068 | |
| Other Investments — Liabilities* | | | | | | | | | | | | |
Forward Foreign Currency Contracts | | | — | | | | (3,129,086 | ) | | | — | | | | (3,129,086 | ) |
Total Investments | | $ | 1,878,148,443 | | | $ | 45,104,539 | | | $ | — | | | $ | 1,923,252,982 | |
| * | Unrealized appreciation (depreciation). |
NOTE 4—Derivative Investments
The Fund may enter into an International Swaps and Derivatives Association Master Agreement (“ISDA Master Agreement”) under which a fund may trade OTC derivatives. An OTC transaction entered into under an ISDA Master Agreement typically involves a collateral posting arrangement, payment netting provisions and close-out netting provisions. These netting provisions allow for reduction of credit risk through netting of contractual obligations. The enforceability of the netting provisions of the ISDA Master Agreement depends on the governing law of the ISDA Master Agreement, among other factors.
For financial reporting purposes, the Fund does not offset OTC derivative assets or liabilities that are subject to ISDA Master Agreements in the Statement of Assets and Liabilities.
Value of Derivative Investments at Period-End
The table below summarizes the value of the Fund’s derivative investments, detailed by primary risk exposure, held as of December 31, 2017:
| | | | |
| | | Value | |
| Derivative Liabilities | | Currency Risk | |
Unrealized depreciation on forward foreign currency contracts outstanding | | $ | (3,129,086 | ) |
Derivatives not subject to master netting agreements | | | — | |
Total Derivative Liabilities subject to master netting agreements | | $ | (3,129,086 | ) |
Offsetting Assets and Liabilities
The table below reflects the Fund’s exposure to Counterparties subject to either an ISDA Master Agreement or other agreement for OTC derivative transactions as of December 31, 2017.
| | | | | | | | | | | | | | | | | | | | | | | | |
| | | Financial
Derivative
Assets | | | Financial
Derivative
Liabilities | | | | | | Collateral (Received)/Pledged | | | | |
| Counterparty | | Forward
Foreign Currency
Contracts | | | Forward
Foreign Currency
Contracts | | | Net Value of
Derivatives | | | Non-Cash | | | Cash | | | Net
Amount | |
Barclays Bank PLC | | $ | — | | | $ | (498,793 | ) | | $ | (498,793 | ) | | $ | — | | | $ | — | | | $ | (498,793 | ) |
CIBC World Markets Corp. | | | — | | | | (270,502 | ) | | | (270,502 | ) | | | — | | | | — | | | | (270,502 | ) |
Deutsche Bank Securities Inc. | | | — | | | | (519,764 | ) | | | (519,764 | ) | | | — | | | | — | | | | (519,764 | ) |
Goldman Sachs International | | | — | | | | (456,024 | ) | | | (456,024 | ) | | | — | | | | — | | | | (456,024 | ) |
JPMorgan Chase Bank, N.A. | | | — | | | | (643,683 | ) | | | (643,683 | ) | | | — | | | | — | | | | (643,683 | ) |
RBC Capital Markets Corp. | | | — | | | | (740,320 | ) | | | (740,320 | ) | | | — | | | | — | | | | (740,320 | ) |
Total | | $ | — | | | $ | (3,129,086 | ) | | $ | (3,129,086 | ) | | $ | — | | | $ | — | | | $ | (3,129,086 | ) |
Effect of Derivative Investments for the year ended December 31, 2017
The table below summarizes the gains (losses) on derivative investments, detailed by primary risk exposure, recognized in earnings during the period:
| | | | |
| | | Location of Gain (Loss) on
Statement of Operations | |
| | | Currency Risk | |
Realized Gain (Loss): | | | | |
Forward foreign currency contracts | | $ | (8,866,170 | ) |
Change in Net Unrealized Appreciation (Depreciation): | | | | |
Forward foreign currency contracts | | | (6,116,444 | ) |
Total | | $ | (14,982,614 | ) |
Invesco V.I. Comstock Fund
The table below summarizes the average notional value of forward foreign currency contracts outstanding during the period.
| | | | |
| | | Forward Foreign Currency
Contracts | |
Average notional value | | $ | 184,530,405 | |
NOTE 5—Trustees’ and Officers’ Fees and Benefits
Trustees’ and Officers’ Fees and Benefits include amounts accrued by the Fund to pay remuneration to certain Trustees and Officers of the Fund. Trustees have the option to defer compensation payable by the Fund, and Trustees’ and Officers’ Fees and Benefits also include amounts accrued by the Fund to fund such deferred compensation amounts. Those Trustees who defer compensation have the option to select various Invesco Funds in which their deferral accounts shall be deemed to be invested. Finally, certain current Trustees were eligible to participate in a retirement plan that provided for benefits to be paid upon retirement to Trustees over a period of time based on the number of years of service. The Fund may have certain former Trustees who also participate in a retirement plan and receive benefits under such plan. Trustees’ and Officers’ Fees and Benefits include amounts accrued by the Fund to fund such retirement benefits. Obligations under the deferred compensation and retirement plans represent unsecured claims against the general assets of the Fund.
NOTE 6—Cash Balances
The Fund is permitted to temporarily carry a negative or overdrawn balance in its account with State Street Bank and Trust Company, the custodian bank. Such balances, if any at period-end, are shown in the Statement of Assets and Liabilities under the payable caption Amount due custodian. To compensate the custodian bank for such overdrafts, the overdrawn Fund may either (1) leave funds as a compensating balance in the account so the custodian bank can be compensated by earning the additional interest; or (2) compensate by paying the custodian bank at a rate agreed upon by the custodian bank and Invesco, not to exceed the contractually agreed upon rate.
NOTE 7—Distributions to Shareholders and Tax Components of Net Assets
Tax Character of Distributions to Shareholders Paid During the Fiscal Years Ended December 31, 2017 and 2016:
| | | | | | | | |
| | | 2017 | | | 2016 | |
Ordinary income | | $ | 47,708,517 | | | $ | 38,036,033 | |
Long-term capital gain | | | 67,993,317 | | | | 132,008,131 | |
Total distributions | | $ | 115,701,834 | | | $ | 170,044,164 | |
Tax Components of Net Assets at Period-End:
| | | | |
| | | 2017 | |
Undistributed ordinary income | | $ | 23,569,551 | |
Undistributed long-term gain | | | 149,494,946 | |
Net unrealized appreciation — investments | | | 393,253,871 | |
Net unrealized appreciation — foreign currencies | | | 12,561 | |
Temporary book/tax differences | | | (207,687 | ) |
Shares of beneficial interest | | | 1,347,808,595 | |
Total net assets | | $ | 1,913,931,837 | |
The difference between book-basis and tax-basis unrealized appreciation (depreciation) is due to differences in the timing of recognition of gains and losses on investments for tax and book purposes. The Fund’s net unrealized appreciation difference is attributable primarily to wash sales and forward foreign currency contracts.
The temporary book/tax differences are a result of timing differences between book and tax recognition of income and/or expenses. The Fund’s temporary book/tax differences are the result of the trustee deferral of compensation and retirement plan benefits.
Capital loss carryforward is calculated and reported as of a specific date. Results of transactions and other activity after that date may affect the amount of capital loss carryforward actually available for the Fund to utilize. Capital losses generated in years beginning after December 22, 2010 can be carried forward for an unlimited period, whereas previous losses expire in eight tax years. Capital losses with an expiration period may not be used to offset capital gains until all net capital losses without an expiration date have been utilized. Capital loss carryforwards with no expiration date will retain their character as either short-term or long-term capital losses instead of as short-term capital losses as under prior law. The ability to utilize capital loss carryforwards in the future may be limited under the Internal Revenue Code and related regulations based on the results of future transactions.
The Fund does not have a capital loss carryforward as of December 31, 2017.
NOTE 8—Investment Transactions
The aggregate amount of investment securities (other than short-term securities, U.S. Treasury obligations and money market funds, if any) purchased and sold by the Fund during the year ended December 31, 2017 was $243,835,055 and $637,013,315, respectively. Cost of investments, including any derivatives, on a tax basis includes the adjustments for financial reporting purposes as of the most recently completed federal income tax reporting period-end.
Invesco V.I. Comstock Fund
| | | | |
| Unrealized Appreciation (Depreciation) of Investments on a Tax Basis | |
Aggregate unrealized appreciation of investments | | $ | 472,054,891 | |
Aggregate unrealized (depreciation) of investments | | | (78,801,020 | ) |
Net unrealized appreciation of investments | | $ | 393,253,871 | |
Cost of investments for tax purposes is $1,529,999,111. | | | | |
NOTE 9—Reclassification of Permanent Differences
Primarily as a result of differing book/tax treatment of foreign currency transactions, on December 31, 2017, undistributed net investment income was increased by $46,727 and undistributed net realized gain was decreased by $46,727. This reclassification had no effect on the net assets of the Fund.
NOTE 10—Share Information
| | | | | | | | | | | | | | | | |
| | | Summary of Share Activity | |
| | | Years ended December 31, | |
| | | 2017(a) | | | 2016 | |
| | | Shares | | | Amount | | | Shares | | | Amount | |
Sold: | | | | | | | | | | | | | | | | |
Series I | | | 618,922 | | | $ | 11,976,966 | | | | 1,383,440 | | | $ | 23,426,576 | |
Series II | | | 2,755,173 | | | | 52,626,539 | | | | 9,559,621 | | | | 166,299,943 | |
| | | | |
Issued as reinvestment of dividends: | | | | | | | | | | | | | | | | |
Series I | | | 863,093 | | | | 16,364,250 | | | | 1,332,508 | | | | 22,492,723 | |
Series II | | | 5,255,957 | | | | 99,337,584 | | | | 8,772,380 | | | | 147,551,441 | |
| | | | |
Reacquired: | | | | | | | | | | | | | | | | |
Series I | | | (2,062,592 | ) | | | (39,914,568 | ) | | | (7,929,844 | ) | | | (138,107,405 | ) |
Series II | | | (18,238,937 | ) | | | (350,012,824 | ) | | | (16,614,390 | ) | | | (291,552,364 | ) |
Net increase (decrease) in share activity | | | (10,808,384 | ) | | $ | (209,622,053 | ) | | | (3,496,285 | ) | | $ | (69,889,086 | ) |
| (a) | There are entities that are record owners of more than 5% of the outstanding shares of the Fund and in the aggregate own 54% of the outstanding shares of the Fund. The Fund and the Fund’s principal underwriter or adviser, are parties to participation agreements with these entities whereby these entities sell units of interest in separate accounts funding variable products that are invested in the Fund. The Fund, Invesco and/or Invesco affiliates may make payments to these entities, which are considered to be related to the Fund, for providing services to the Fund, Invesco and/or Invesco affiliates including but not limited to services such as, securities brokerage, third party record keeping and account servicing and administrative services. The Fund has no knowledge as to whether all or any portion of the shares owned of record by these entities are also owned beneficially. |
NOTE 11—Financial Highlights
The following schedule presents financial highlights for a share of the Fund outstanding throughout the periods indicated.
| | | | | | | | | | | | | | | | | | | | | | | | | | | | | | | | | | | | | | | | | | | | | | | | | | | | | | | | |
| | | Net asset
value,
beginning
of period | | | Net
investment
income(a) | | | Net gains
(losses)
on securities
(both
realized and
unrealized) | | | Total from
investment
operations | | | Dividends
from net
investment
income | | | Distributions
from net
realized
gains | | | Total
distributions | | | Net asset
value, end
of period | | | Total
return(b) | | | Net assets,
end of period
(000’s
omitted) | | | Ratio of
expenses
to average
net assets
with fee waivers
and/or expenses
absorbed | | | Ratio of
expenses
to average net
assets without
fee waivers
and/or expenses
absorbed | | | Ratio of net
investment
income
to average
net assets | | | Portfolio
turnover(c) | |
Series I | | | | | | | | | | | | | | | | | | | | | | | | | | | | | | | | | | | | | | | | | | | | | | | | | | | | | | | | |
Year ended 12/31/17 | | $ | 18.69 | | | $ | 0.28 | | | $ | 2.94 | | | $ | 3.22 | | | $ | (0.44 | ) | | $ | (0.85 | ) | | $ | (1.29 | ) | | $ | 20.62 | | | | 17.85 | % | | $ | 270,651 | | | | 0.75 | %(d) | | | 0.75 | %(d) | | | 1.47 | %(d) | | | 13 | % |
Year ended 12/31/16 | | | 17.57 | | | | 0.38 | | | | 2.47 | | | | 2.85 | | | | (0.29 | ) | | | (1.44 | ) | | | (1.73 | ) | | | 18.69 | | | | 17.30 | | | | 256,080 | | | | 0.77 | | | | 0.78 | | | | 2.20 | | | | 21 | |
Year ended 12/31/15 | | | 19.16 | | | | 0.28 | | | | (1.45 | ) | | | (1.17 | ) | | | (0.37 | ) | | | (0.05 | ) | | | (0.42 | ) | | | 17.57 | | | | (5.98 | ) | | | 332,411 | | | | 0.78 | | | | 0.83 | | | | 1.52 | | | | 16 | |
Year ended 12/31/14 | | | 17.75 | | | | 0.32 | | | | 1.34 | | | | 1.66 | | | | (0.25 | ) | | | – | | | | (0.25 | ) | | | 19.16 | | | | 9.39 | | | | 338,159 | | | | 0.78 | | | | 0.83 | | | | 1.73 | | | | 19 | |
Year ended 12/31/13 | | | 13.27 | | | | 0.22 | | | | 4.53 | | | | 4.75 | | | | (0.27 | ) | | | – | | | | (0.27 | ) | | | 17.75 | | | | 35.97 | | | | 311,837 | | | | 0.76 | | | | 0.84 | | | | 1.36 | | | | 11 | |
Series II | | | | | | | | | | | | | | | | | | | | | | | | | | | | | | | | | | | | | | | | | | | | | | | | | | | | | | | | |
Year ended 12/31/17 | | | 18.62 | | | | 0.23 | | | | 2.93 | | | | 3.16 | | | | (0.39 | ) | | | (0.85 | ) | | | (1.24 | ) | | | 20.54 | | | | 17.58 | | | | 1,643,281 | | | | 1.00 | (d) | | | 1.00 | (d) | | | 1.22 | (d) | | | 13 | |
Year ended 12/31/16 | | | 17.51 | | | | 0.34 | | | | 2.45 | | | | 2.79 | | | | (0.24 | ) | | | (1.44 | ) | | | (1.68 | ) | | | 18.62 | | | | 16.99 | | | | 1,679,769 | | | | 1.02 | | | | 1.03 | | | | 1.95 | | | | 21 | |
Year ended 12/31/15 | | | 19.08 | | | | 0.24 | | | | (1.44 | ) | | | (1.20 | ) | | | (0.32 | ) | | | (0.05 | ) | | | (0.37 | ) | | | 17.51 | | | | (6.19 | ) | | | 1,549,679 | | | | 1.03 | | | | 1.08 | | | | 1.27 | | | | 16 | |
Year ended 12/31/14 | | | 17.68 | | | | 0.27 | | | | 1.33 | | | | 1.60 | | | | (0.20 | ) | | | – | | | | (0.20 | ) | | | 19.08 | | | | 9.10 | | | | 1,840,794 | | | | 1.03 | | | | 1.08 | | | | 1.48 | | | | 19 | |
Year ended 12/31/13 | | | 13.22 | | | | 0.17 | | | | 4.52 | | | | 4.69 | | | | (0.23 | ) | | | – | | | | (0.23 | ) | | | 17.68 | | | | 35.65 | | | | 1,916,026 | | | | 1.01 | | | | 1.09 | | | | 1.11 | | | | 11 | |
| (a) | Calculated using average shares outstanding. |
| (b) | Includes adjustments in accordance with accounting principles generally accepted in the United States of America and as such, the net asset value for financial reporting purposes and the returns based upon those net asset values may differ from the net asset value and returns for shareholder transactions. Total returns are not annualized for periods less than one year, if applicable, and do not reflect charges assessed in connection with a variable product, which if included would reduce total returns. |
| (c) | Portfolio turnover is calculated at the fund level and is not annualized for periods less than one year, if applicable. |
| (d) | Ratios are based on average daily net assets (000’s omitted) of $255,140 and $1,618,401 for Series I and Series II shares, respectively. |
Invesco V.I. Comstock Fund
Report of Independent Registered Public Accounting Firm
To the Board of Trustees of AIM Variable Insurance Funds (Invesco Variable Insurance Funds) and Shareholders of Invesco V.I. Comstock Fund
Opinion on the Financial Statements
We have audited the accompanying statement of assets and liabilities, including the schedule of investments, of Invesco V.I. Comstock Fund (one of the funds constituting AIM Variable Insurance Funds (Invesco Variable Insurance Funds), hereafter referred to as the “Fund”) as of December 31, 2017, the related statement of operations for the year ended December 31, 2017, the statement of changes in net assets for each of the two years in the period ended December 31, 2017, including the related notes, and the financial highlights for each of the five years in the period ended December 31, 2017 (collectively referred to as the “financial statements”). In our opinion, the financial statements present fairly, in all material respects, the financial position of the Fund as of December 31, 2017, the results of its operations for the year then ended, the changes in its net assets for each of the two years in the period ended December 31, 2017 and the financial highlights for each of the five years in the period ended December 31, 2017 in conformity with accounting principles generally accepted in the United States of America.
Basis for Opinion
These financial statements are the responsibility of the Fund’s management. Our responsibility is to express an opinion on the Fund’s financial statements based on our audits. We are a public accounting firm registered with the Public Company Accounting Oversight Board (United States) (“PCAOB”) and are required to be independent with respect to the Fund in accordance with the U.S. federal securities laws and the applicable rules and regulations of the Securities and Exchange Commission and the PCAOB.
We conducted our audits of these financial statements in accordance with the standards of the PCAOB. Those standards require that we plan and perform the audit to obtain reasonable assurance about whether the financial statements are free of material misstatement, whether due to error or fraud.
Our audits included performing procedures to assess the risks of material misstatement of the financial statements, whether due to error or fraud, and performing procedures that respond to those risks. Such procedures included examining, on a test basis, evidence regarding the amounts and disclosures in the financial statements. Our audits also included evaluating the accounting principles used and significant estimates made by management, as well as evaluating the overall presentation of the financial statements. Our procedures included confirmation of securities owned as of December 31, 2017 by correspondence with the custodian, transfer agent and brokers; when replies were not received from brokers, we performed other auditing procedures. We believe that our audits provide a reasonable basis for our opinion.
PricewaterhouseCoopers LLP
Houston, TX
February 14, 2018
We have served as the auditor of one or more of the investment companies in the Invesco/PowerShares group of investment companies since at least 1995. We have not determined the specific year we began serving as auditor.
Invesco V.I. Comstock Fund
Calculating your ongoing Fund expenses
Example
As a shareholder of the Fund, you incur ongoing costs, including management fees; distribution and/or service fees (12b-1); and other Fund expenses. This example is intended to help you understand your ongoing costs (in dollars) of investing in the Fund and to compare these costs with ongoing costs of investing in other mutual funds. The example is based on an investment of $1,000 invested at the beginning of the period and held for the entire period July 1, 2017 through December 31, 2017.
The actual and hypothetical expenses in the examples below do not represent the effect of any fees or other expenses assessed in connection with a variable product; if they did, the expenses shown would be higher while the ending account values shown would be lower.
Actual expenses
The table below provides information about actual account values and actual expenses. You may use the information in this table, together with the amount you invested, to estimate the expenses that you paid over the period. Simply divide your account value by $1,000 (for example, an $8,600 account value divided by $1,000 = 8.6), then multiply the result by the number in the table under the heading entitled “Actual Expenses Paid During Period” to estimate the expenses you paid on your account during this period.
Hypothetical example for comparison purposes
The table below also provides information about hypothetical account values and hypothetical expenses based on the Fund’s actual expense ratio and an assumed rate of return of 5% per year before expenses, which is not the Fund’s actual return.
The hypothetical account values and expenses may not be used to estimate the actual ending account balance or expenses you paid for the period. You may use this information to compare the ongoing costs of investing in the Fund and other funds. To do so, compare this 5% hypothetical example with the 5% hypothetical examples that appear in the shareholder reports of the other funds.
Please note that the expenses shown in the table are meant to highlight your ongoing costs. Therefore, the hypothetical information is useful in comparing ongoing costs, and will not help you determine the relative total costs of owning different funds.
| | | | | | | | | | | | | | | | | | | | | | | | |
| | | Beginning
Account Value
(07/01/17) | | | ACTUAL | | | HYPOTHETICAL (5% annual return before expenses) | | | Annualized
Expense
Ratio | |
| Class | | | Ending
Account Value
(12/31/17)1 | | | Expenses
Paid During
Period2 | | | Ending
Account Value
(12/31/17) | | | Expenses
Paid During
Period2 | | |
Series I | | $ | 1,000.00 | | | $ | 1,139.50 | | | $ | 4.04 | | | $ | 1,021.42 | | | $ | 3.82 | | | | 0.75 | % |
Series II | | | 1,000.00 | | | | 1,138.50 | | | | 5.39 | | | | 1,020.16 | | | | 5.09 | | | | 1.00 | |
| 1 | The actual ending account value is based on the actual total return of the Fund for the period July 1, 2017 through December 31, 2017, after actual expenses and will differ from the hypothetical ending account value which is based on the Fund’s expense ratio and a hypothetical annual return of 5% before expenses. |
| 2�� | Expenses are equal to the Fund’s annualized expense ratio as indicated above multiplied by the average account value over the period, multiplied by 184/365 to reflect the most recent fiscal half year. |
Invesco V.I. Comstock Fund
Tax Information
Form 1099-DIV, Form 1042-S and other year-end tax information provide shareholders with actual calendar year amounts that should be included in their tax returns. Shareholders should consult their tax advisors.
The following distribution information is being provided as required by the Internal Revenue Code or to meet a specific state’s requirement.
The Fund designates the following amounts or, if subsequently determined to be different, the maximum amount allowable for its fiscal year ended December 31, 2017:
| | | | |
Federal and State Income Tax | |
Long-Term Capital Gain Distributions | | $ | 67,993,317 | |
Corporate Dividends Received Deduction* | | | 87.82 | % |
U.S. Treasury Obligations* | | | 0.00 | % |
| | * | The above percentages are based on ordinary income dividends paid to shareholders during the Fund’s fiscal year. |
Invesco V.I. Comstock Fund
Trustees and Officers
The address of each trustee and officer is AIM Variable Insurance Funds (Invesco Variable Insurance Funds) (the “Trust”), 11 Greenway Plaza, Suite 1000, Houston, Texas 77046-1173. The trustees serve for the life of the Trust, subject to their earlier death, incapacitation, resignation, retirement or removal as more specifically provided in the Trust’s organizational documents. Each officer serves for a one year term or until their successors are elected and qualified. Column two below includes length of time served with predecessor entities, if any.
| | | | | | | | |
Name, Year of Birth and
Position(s) Held with the Trust | | Trustee and/
or Officer Since | | Principal Occupation(s)
During Past 5 Years | | Number of
Funds in Fund
Complex
Overseen by
Trustee | | Other Directorship(s)
Held by Trustee During
Past 5 Years |
| Interested Persons | | | | | | | | |
Martin L. Flanagan1 — 1960 Trustee | | 2007 | | Executive Director, Chief Executive Officer and President, Invesco Ltd. (ultimate parent of Invesco and a global investment management firm); Trustee, The Invesco Funds; Vice Chair, Investment Company Institute; and Member of Executive Board, SMU Cox School of Business Formerly: Advisor to the Board, Invesco Advisers, Inc. (formerly known as Invesco Institutional (N.A.), Inc.); Chairman and Chief Executive Officer, Invesco Advisers, Inc. (registered investment adviser); Director, Chairman, Chief Executive Officer and President, Invesco Holding Company (US), Inc. (formerly IVZ Inc.) (holding company), Invesco Group Services, Inc. (service provider) and Invesco North American Holdings, Inc. (holding company); Director, Chief Executive Officer and President, Invesco Holding Company Limited (parent of Invesco and a global investment management firm); Director, Invesco Ltd.; Chairman, Investment Company Institute and President, Co-Chief Executive Officer, Co-President, Chief Operating Officer and Chief Financial Officer, Franklin Resources, Inc. (global investment management organization) | | 158 | | None |
Philip A. Taylor2 — 1954 Trustee and Senior Vice President | | 2006 | | Head of the Americas and Senior Managing Director, Invesco Ltd.; Director, Invesco Advisers, Inc. (formerly known as Invesco Institutional (N.A.), Inc.) (registered investment adviser); Director, Chairman, Chief Executive Officer and President, Invesco Management Group, Inc. (formerly known as Invesco Aim Management Group, Inc.) (financial services holding company); Director and Chairman, Invesco Investment Services, Inc. (formerly known as Invesco Aim Investment Services, Inc.) (registered transfer agent); Chief Executive Officer, Invesco Corporate Class Inc. (corporate mutual fund company); Director, Chairman and Chief Executive Officer, Invesco Canada Ltd. (formerly known as Invesco Trimark Ltd./Invesco Trimark Ltèe) (registered investment adviser and registered transfer agent); Trustee and Senior Vice President, The Invesco Funds; Director, Invesco Investment Advisers LLC (formerly known as Van Kampen Asset Management). Formerly: Co-Chairman, Co-President and Co-Chief Executive Officer, Invesco Advisers, Inc. (formerly known as Invesco Institutional (N.A.), Inc.) (registered investment adviser); Director, Chief Executive Officer and President, Van Kampen Exchange Corp; President and Principal Executive Officer, The Invesco Funds (other than AIM Treasurer’s Series Trust (Invesco Treasurer’s Series Trust), Short-Term Investments Trust and Invesco Management Trust); Executive Vice President, The Invesco Funds (AIM Treasurer’s Series Trust (Invesco Treasurer’s Series Trust), Short-Term Investments Trust and Invesco Management Trust only); Director and President, INVESCO Funds Group, Inc. (registered investment adviser and registered transfer agent); Director and Chairman, IVZ Distributors, Inc. (formerly known as INVESCO Distributors, Inc.) (registered broker dealer); Director, President and Chairman, Invesco Inc. (holding company), Invesco Canada Holdings Inc. (holding company), Trimark Investments Ltd./Placements Trimark Ltèe and Invesco Financial Services Ltd/Services Financiers Invesco Ltèe; Chief Executive Officer, Invesco Canada Fund Inc. (corporate mutual fund company); Director and Chairman, Van Kampen Investor Services Inc.; Director, Chief Executive Officer and President, 1371 Preferred Inc. (holding company) and Van Kampen Investments Inc.; Director and President, AIM GP Canada Inc. (general partner for limited partnerships) and Van Kampen Advisors, Inc.; Director and Chief Executive Officer, Invesco Trimark Dealer Inc. (registered broker dealer); Director, Invesco Distributors, Inc. (formerly known as Invesco Aim Distributors, Inc.) (registered broker dealer); Manager, Invesco PowerShares Capital Management LLC; Director, Chief Executive Officer and President, Invesco Advisers, Inc.; Director, Chairman, Chief Executive Officer and President, Invesco Aim Capital Management, Inc.; President, Invesco Trimark Dealer Inc. and Invesco Trimark Ltd./Invesco Trimark Ltèe; Director and President, AIM Trimark Corporate Class Inc. and AIM Trimark Canada Fund Inc.; Senior Managing Director, Invesco Holding Company Limited; Director and Chairman, Fund Management Company (former registered broker dealer); President and Principal Executive Officer, The Invesco Funds (AIM Treasurer’s Series Trust (Invesco Treasurer’s Series Trust), and Short-Term Investments Trust only); President, AIM Trimark Global Fund Inc. and AIM Trimark Canada Fund Inc. | | 158 | | None |
| 1 | Mr. Flanagan is considered an interested person (within the meaning of Section 2(a)(19) of the 1940 Act) of the Trust because he is an officer of the Adviser to the Trust, and an officer and a director of Invesco Ltd., ultimate parent of the Adviser. |
| 2 | Mr. Taylor is considered an interested person (within the meaning of Section 2(a)(19) of the 1940 Act) of the Trust because he is an officer and a director of the Adviser. |
Invesco V.I. Comstock Fund
Trustees and Officers—(continued)
| | | | | | | | |
Name, Year of Birth and
Position(s) Held with the Trust | | Trustee and/
or Officer Since | | Principal Occupation(s)
During Past 5 Years | | Number of
Funds in Fund
Complex
Overseen by
Trustee | | Other Directorship(s)
Held by Trustee During
Past 5 Years |
| Independent Trustees | | | | | | | | |
Bruce L. Crockett — 1944 Trustee and Chair | | 1993 | | Chairman, Crockett Technologies Associates (technology consulting company) Formerly: Director, Captaris (unified messaging provider); Director, President and Chief Executive Officer, COMSAT Corporation; Chairman, Board of Governors of INTELSAT (international communications company); ACE Limited (insurance company); Independent Directors Council and Investment Company Institute: Member of the Audit Committee, Investment Company Institute; Member of the Executive Committee and Chair of the Governance Committee, Independent Directors Council | | 158 | | Director and Chairman of the Audit Committee, ALPS (Attorneys Liability Protection Society) (insurance company); Director and Member of the Audit Committee and Compensation Committee, Ferroglobe PLC (metallurgical company) |
David C. Arch — 1945 Trustee | | 2010 | | Chairman of Blistex Inc. (consumer health care products manufacturer); Member, World Presidents’ Organization | | 158 | | Board member of the Illinois Manufacturers’ Association |
Jack M. Fields — 1952 Trustee | | 1997 | | Chief Executive Officer, Twenty First Century Group, Inc. (government affairs company); and Chairman, Discovery Learning Alliance (non-profit) Formerly: Owner and Chief Executive Officer, Dos Angeles Ranch L.P. (cattle, hunting, corporate entertainment); Director, Insperity, Inc. (formerly known as Administaff) (human resources provider); Chief Executive Officer, Texana Timber LP (sustainable forestry company); Director of Cross Timbers Quail Research Ranch (non-profit); and member of the U.S. House of Representatives | | 158 | | None |
Cynthia Hostetler — 1962 Trustee | | 2017 | | Non-Executive Director and Trustee of a number of public and private business corporations Formerly: Head of Investment Funds and Private Equity, Overseas Private Investment Corporation; President, First Manhattan Bancorporation, Inc.; Attorney, Simpson Thacher & Bartlett LLP | | 158 | | Vulcan Materials Company (construction materials company); Trilinc Global Impact Fund; Aberdeen Investment Funds (4 portfolios); Artio Global Investment LLC (mutual fund complex); Edgen Group, Inc. (specialized energy and infrastructure products distributor) |
Eli Jones — 1961 Trustee | | 2016 | | Professor and Dean, Mays Business School — Texas A&M University Formerly: Professor and Dean, Walton College of Business, University of Arkansas and E.J. Ourso College of Business, Louisiana State University; Director, Arvest Bank | | 158 | | Insperity, Inc. (formerly known as Administaff) (human resources provider) |
Prema Mathai-Davis — 1950 Trustee | | 1998 | | Retired. | | 158 | | None |
Teresa M. Ressel — 1962 Trustee | | 2017 | | Non-executive director and trustee of a number of public and private business corporations Formerly: Chief Financial Officer, Olayan America, The Olayan Group (international investor/commercial/industrial); Chief Executive Officer, UBS Securities LLC; Group Chief Operating Officer, Americas, UBS AG; Assistant Secretary for Management & Budget and CFO, US Department of the Treasury | | 158 | | Atlantic Power Corporation (power generation company); ON Semiconductor Corp. (semiconductor supplier) |
Ann Barnett Stern — 1957 Trustee | | 2017 | | President and Chief Executive Officer, Houston Endowment Inc. (private philanthropic institution) Formerly: Executive Vice President and General Counsel, Texas Children’s Hospital; Attorney, Beck, Redden and Secrest, LLP; Business Law Instructor, University of St. Thomas; Attorney, Andrews & Kurth LLP | | 158 | | Federal Reserve Bank of Dallas |
Raymond Stickel, Jr. — 1944 Trustee | | 2005 | | Retired. Formerly: Director, Mainstay VP Series Funds, Inc. (25 portfolios); Partner, Deloitte & Touche | | 158 | | None |
Robert C. Troccoli — 1949 Trustee | | 2016 | | Adjunct Professor, University of Denver — Daniels College of Business Formerly: Senior Partner, KPMG LLP | | 158 | | None |
Christopher L. Wilson — 1957 Trustee | | 2017 | | Non-executive director and trustee of a number of public and private business corporations Formerly: Managing Partner, CT2, LLC (investing and consulting firm); President/Chief Executive Officer, Columbia Funds, Bank of America Corporation; President/Chief Executive Officer, CDC IXIS Asset Management Services, Inc.; Principal & Director of Operations, Scudder Funds, Scudder, Stevens & Clark, Inc.; Assistant Vice President, Fidelity Investments | | 158 | | TD Asset Management USA Inc. (mutual fund complex) (22 portfolios); ISO New England, Inc. (non-profit organization managing regional electricity market) |
Invesco V.I. Comstock Fund
Trustees and Officers—(continued)
| | | | | | | | |
Name, Year of Birth and
Position(s) Held with the Trust | | Trustee and/
or Officer Since | | Principal Occupation(s)
During Past 5 Years | | Number of
Funds in Fund
Complex
Overseen by
Trustee | | Other Directorship(s)
Held by Trustee During
Past 5 Years |
| Other Officers | | | | | | | | |
Sheri Morris — 1964 President, Principal Executive Officer and Treasurer | | 1999 | | President, Principal Executive Officer and Treasurer, The Invesco Funds; Vice President, Invesco Advisers, Inc. (formerly known as Invesco Institutional (N.A.), Inc.) (registered investment adviser); and Vice President, PowerShares Exchange-Traded Fund Trust, PowerShares Exchange-Traded Fund Trust II, PowerShares India Exchange-Traded Fund Trust, PowerShares Actively Managed Exchange-Traded Fund Trust, PowerShares Actively Managed Exchange-Traded Commodity Fund Trust and PowerShares Exchange-Traded Self-Indexed Fund Trust Formerly: Vice President and Principal Financial Officer, The Invesco Funds; Vice President, Invesco Aim Advisers, Inc., Invesco Aim Capital Management, Inc. and Invesco Aim Private Asset Management, Inc.; Assistant Vice President and Assistant Treasurer, The Invesco Funds and Assistant Vice President, Invesco Advisers, Inc., Invesco Aim Capital Management, Inc. and Invesco Aim Private Asset Management, Inc.; and Treasurer, PowerShares Exchange-Traded Fund Trust, PowerShares Exchange-Traded Fund Trust II, PowerShares India Exchange-Traded Fund Trust and PowerShares Actively Managed Exchange-Traded Fund Trust | | N/A | | N/A |
Russell C. Burk — 1958 Senior Vice President and Senior Officer | | 2005 | | Senior Vice President and Senior Officer, The Invesco Funds | | N/A | | N/A |
John M. Zerr — 1962 Senior Vice President, Chief Legal Officer and Secretary | | 2006 | | Director, Senior Vice President, Secretary and General Counsel, Invesco Management Group, Inc. (formerly known as Invesco AIM Management Group, Inc.); Senior Vice President, Invesco Advisers, Inc. (formerly known as Invesco Institutional (N.A.), Inc.) (registered investment adviser); Senior Vice President and Secretary, Invesco Distributors, Inc. (formerly known as Invesco AIM Distributors, Inc.); Director, Vice President and Secretary, Invesco Investment Services, Inc. (formerly known as Invesco AIM Investment Services, Inc.) Senior Vice President, Chief Legal Officer and Secretary, The Invesco Funds; Managing Director, Invesco PowerShares Capital Management LLC; Director, Secretary and General Counsel, Invesco Investment Advisers LLC (formerly known as Van Kampen Asset Management); Secretary and General Counsel, Invesco Capital Markets, Inc. (formerly known as Van Kampen Funds Inc.) and Chief Legal Officer, PowerShares Exchange-Traded Fund Trust, PowerShares Exchange-Traded Fund Trust II, PowerShares India Exchange-Traded Fund Trust, PowerShares Actively Managed Exchange-Traded Fund Trust, PowerShares Actively Managed Exchange-Traded Commodity Fund Trust and PowerShares Exchange-Traded Self-Indexed Fund Trust; Manager and Secretary, Invesco Indexing LLC Formerly: Director, Secretary, General Counsel and Senior Vice President, Van Kampen Exchange Corp.; Director, Vice President and Secretary, IVZ Distributors, Inc. (formerly known as INVESCO Distributors, Inc.); Director and Vice President, INVESCO Funds Group, Inc.; Director and Vice President, Van Kampen Advisors Inc.; Director, Vice President, Secretary and General Counsel, Van Kampen Investor Services Inc.; Director, Invesco Distributors, Inc. (formerly known as Invesco AIM Distributors, Inc.); Director, Senior Vice President, General Counsel and Secretary, Invesco AIM Advisers, Inc. and Van Kampen Investments Inc.; Director, Vice President and Secretary, Fund Management Company; Director, Senior Vice President, Secretary, General Counsel and Vice President, Invesco AIM Capital Management, Inc.; Chief Operating Officer and General Counsel, Liberty Ridge Capital, Inc. (an investment adviser); Vice President and Secretary, PBHG Funds (an investment company) and PBHG Insurance Series Fund (an investment company); Chief Operating Officer, General Counsel and Secretary, Old Mutual Investment Partners (a broker-dealer); General Counsel and Secretary, Old Mutual Fund Services (an administrator) and Old Mutual Shareholder Services (a shareholder servicing center); Executive Vice President, General Counsel and Secretary, Old Mutual Capital, Inc. (an investment adviser); and Vice President and Secretary, Old Mutual Advisors Funds (an investment company) | | N/A | | N/A |
Gregory G. McGreevey — 1962 Senior Vice President | | 2012 | | Senior Managing Director, Invesco Ltd.; Director, Chairman, President, and Chief Executive Officer, Invesco Advisers, Inc. (formerly known as Invesco Institutional (N.A.), Inc.) (registered investment adviser); Senior Vice President, Invesco Management Group, Inc.; Director, Invesco Mortgage Capital, Inc. and Invesco Senior Secured Management, Inc.; and Senior Vice President, The Invesco Funds Formerly: Assistant Vice President, The Invesco Funds | | N/A | | N/A |
Kelli Gallegos — 1970 Vice President, Principal Financial Officer and Assistant Treasurer | | 2008 | | Vice President, Principal Financial Officer and Assistant Treasurer, The Invesco Funds; Assistant Treasurer, Invesco PowerShares Capital Management LLC, PowerShares Exchange-Traded Fund Trust, PowerShares Exchange-Traded Fund Trust II, PowerShares India Exchange-Traded Fund Trust, PowerShares Actively Managed Exchange-Traded Fund Trust, PowerShares Actively Managed Exchange-Traded Commodity Fund Trust and PowerShares Exchange-Traded Self-Indexed Fund Trust Formerly: Assistant Vice President, The Invesco Funds | | N/A | | N/A |
Invesco V.I. Comstock Fund
Trustees and Officers—(continued)
| | | | | | | | |
Name, Year of Birth and
Position(s) Held with the Trust | | Trustee and/
or Officer Since | | Principal Occupation(s)
During Past 5 Years | | Number of
Funds in Fund
Complex
Overseen by
Trustee | | Other Directorship(s)
Held by Trustee During
Past 5 Years |
| Other Officers—(continued) | | | | | | | | |
Tracy Sullivan — 1962 Vice President, Chief Tax Officer and Assistant Treasurer | | 2008 | | Vice President, Chief Tax Officer and Assistant Treasurer, The Invesco Funds; Assistant Treasurer, Invesco PowerShares Capital Management LLC, PowerShares Exchange-Traded Fund Trust, PowerShares Exchange-Traded Fund Trust II, PowerShares India Exchange-Traded Fund Trust, PowerShares Actively Managed Exchange-Traded Fund Trust, PowerShares Actively Managed Exchange-Traded Commodity Fund Trust and PowerShares Exchange-Traded Self-Indexed Fund Trust Formerly: Assistant Vice President, The Invesco Funds | | N/A | | N/A |
Crissie M. Wisdom — 1969 Anti-Money Laundering Compliance Officer | | 2013 | | Anti-Money Laundering Compliance Officer, Invesco Advisers, Inc. (formerly known as Invesco Institutional (N.A.), Inc.) (registered investment adviser), Invesco Capital Markets, Inc. (formerly known as Van Kampen Funds Inc.), Invesco Distributors, Inc., Invesco Investment Services, Inc., Invesco Management Group, Inc., The Invesco Funds, and PowerShares Exchange-Traded Fund Trust, PowerShares Exchange-Traded Fund Trust II, PowerShares India Exchange-Traded Fund Trust, PowerShares Actively Managed Exchange-Traded Fund Trust, PowerShares Actively Managed Exchange-Traded Commodity Fund Trust and PowerShares Exchange-Traded Self-Indexed Fund Trust; Anti-Money Laundering Compliance Officer and Bank Secrecy Act Officer, INVESCO National Trust Company and Invesco Trust Company; and Fraud Prevention Manager and Controls and Risk Analysis Manager for Invesco Investment Services, Inc. Formerly: Anti-Money Laundering Compliance Officer, Van Kampen Exchange Corp. | | N/A | | N/A |
Robert R. Leveille — 1969 Chief Compliance Officer | | 2016 | | Chief Compliance Officer, Invesco Advisers, Inc. (registered investment adviser); and Chief Compliance Officer, The Invesco Funds Formerly: Chief Compliance Officer, Putnam Investments and the Putnam Funds | | N/A | | N/A |
The Statement of Additional Information of the Trust includes additional information about the Fund’s Trustees and is available upon request, without charge, by calling 1.800.959.4246. Please refer to the Fund’s Statement of Additional Information for information on the Fund’s sub-advisers.
| | | | | | |
Office of the Fund 11 Greenway Plaza, Suite 1000 Houston, TX 77046-1173 | | Investment Adviser Invesco Advisers, Inc. 1555 Peachtree Street, N.E. Atlanta, GA 30309 | | Distributor Invesco Distributors, Inc. 11 Greenway Plaza, Suite 1000 Houston, TX 77046-1173 | | Auditors PricewaterhouseCoopers LLP 1000 Louisiana Street, Suite 5800 Houston, TX 77002-5678 |
| | | |
| | | | | | |
Counsel to the Fund Stradley Ronon Stevens & Young, LLP 2005 Market Street, Suite 2600 Philadelphia, PA 19103-7018 | | Counsel to the Independent Trustees Goodwin Procter LLP 901 New York Avenue, N.W. Washington, D.C. 20001 | | Transfer Agent Invesco Investment Services, Inc. 11 Greenway Plaza, Suite 1000 Houston, TX 77046-1173 | | Custodian State Street Bank and Trust Company 225 Franklin Street Boston, MA 02110-2801 |
Invesco V.I. Comstock Fund
| | | | |
| | |
 | | Annual Report to Shareholders | | December 31, 2017 |
| | |
| | Invesco V.I. Core Equity Fund | | |

| | |
| | The Fund provides a complete list of its holdings four times in each fiscal year, at the quarter-ends. For the second and fourth quarters, the lists appear in the Fund’s semiannual and annual reports to shareholders. For the first and third quarters, the Fund files the lists with the Securities and Exchange Commission (SEC) on Form N-Q. The Fund’s Form N-Q filings are available on the SEC website, sec.gov. Copies of the Fund’s Forms N-Q may be reviewed and copied at the SEC Public Reference Room in Washington, D.C. You can obtain information on the operation of the Public Reference Room, including information about duplicating fee charges, by calling 202 551 8090 or 800 732 0330, or by electronic request at the following email address: publicinfo@sec.gov. The SEC file numbers for the Fund are 811-07452 and 033-57340. The Fund’s most recent portfolio holdings, as filed on Form N-Q, have also been made available to insurance companies issuing variable annuity contracts and variable life insurance policies (“variable products”) that invest in the Fund. A description of the policies and procedures that the Fund uses to determine how to vote proxies relating to portfolio securities is available without charge, upon request, from our Client Services department at 800 959 4246 or at invesco.com/proxyguidelines. The information is also available on the SEC website, sec.gov. Information regarding how the Fund voted proxies related to its portfolio securities during the most recent 12-month period ended June 30 is available at invesco.com/ proxysearch. The information is also available on the SEC website, sec.gov. Invesco Advisers, Inc. is an investment adviser; it provides investment advisory services to individual and institutional clients and does not sell securities. Invesco Distributors, Inc. is the US distributor for Invesco Ltd.’s retail mutual funds, exchange-traded funds and institutional money market funds. Both are wholly owned, indirect subsidiaries of Invesco Ltd. This report must be accompanied or preceded by a currently effective Fund prospectus and variable product prospectus, which contain more complete information, including sales charges and expenses. Investors should read each carefully before investing. NOT FDIC INSURED | MAY LOSE VALUE | NO BANK GUARANTEE |
| | | | | | |
| | Invesco Distributors, Inc. | | VICEQ-AR-1 | | 02072018 1419 |
Management’s Discussion of Fund Performance
Performance summary
For the year ended December 31, 2017, Series I shares of Invesco V.I. Core Equity
Fund (the Fund) underperformed the Russell 1000 Index, the Fund’s style-specific benchmark.
Your Fund’s long-term performance appears later in this report.
Fund vs. Indexes
Total returns, 12/31/16 to 12/31/17, excluding variable product issuer charges.
If variable product issuer charges were included, returns would be lower.
| | | | | |
| Series I Shares | | | | 13.17 | % |
| Series II Shares | | | | 12.87 | |
| S&P 500 Index▼ (Broad Market Index) | | | | 21.83 | |
| Russell 1000 Index▼ (Style-Specific Index) | | | | 21.69 | |
| Lipper VUF Large-Cap Core Funds Index∎ (Peer Group Index) | | | | 20.52 | |
Source(s): ▼FactSet Research Systems Inc.; ∎Lipper Inc. | | | | | |
Market conditions and your Fund
Despite highly destructive hurricanes that threatened to derail a years-long economic recovery, the US economy continued to expand throughout the year ended December 31, 2017. Gross domestic product – the value of all goods and services produced in the US – expanded in the first three quarters of 2017. Inflation remained subdued even as unemployment continued its multiyear decline.
Given signs of an improving economy, the US Federal Reserve (the Fed) raised interest rates three times during the reporting period, most recently in December 2017; each rate hike was 25 basis points.1 (A basis point is 0.01%.) The Fed pledged that “realized and expected economic conditions relative to its objectives of maximum employment and 2 percent inflation” will guide its future actions. At the close of the reporting period, Fed policy remained accommodative, and the fed funds target rate stood at a range of 1.25% to 1.50% – 75 basis points higher than at the start of the reporting period.1
Higher inventories and a worsening outlook caused oil prices and many energy
stocks to decline during the first half of 2017. However, oil prices rose significantly in the second half of the reporting period as expectations for lower supplies increased, partly due to continued OPEC production cuts, and demand began normalizing.
Major US stock market indexes repeatedly hit all-time highs throughout the reporting period. The stock market rally that began after the 2016 presidential election continued throughout the reporting period, fueled by generally positive economic data, strong corporate earnings and improved consumer confidence. Finally, after much debate in Congress, a tax reform bill was signed into law in December 2017. While its enactment further strengthened stocks, its effect on the US economy remained uncertain.
During the year, stock selection in the consumer staples, financials and telecommunication services sectors delivered positive performance for the Fund. In addition, underweight exposure to the consumer staples, real estate, telecommunication services and utilities sectors benefited the Fund. The largest detractors from Fund performance relative to the
Fund’s style-specific benchmark included stock selection in the health care and information technology (IT) sectors, as well as underweight exposure to the latter.
Stock selection in the financials sector was advantageous to the Fund during the reporting period. The largest contributors to Fund performance relative to the style-specific benchmark were Progressive and AIA Group, two major insurance providers. During the year, both companies reported strong earnings growth and higher revenues in several key segments. Another strong performer was Stanley Black & Decker. During the year, the company expanded its product portfolio and increased its market share through acquired assets.
The largest individual detractor from the Fund’s performance versus the style-specific benchmark was Range Resources, a natural gas company, which underperformed due to declining natural gas prices. We sold our position in Range Resources before the close of the reporting period. Another detractor from Fund performance for the year was Newell Brands, a consumer goods company. During the year, the company reported weaker-than-expected results because of inventory mismanagement. In addition, shares of Allergan fell amid criticism of a controversial patent agreement the company struck to protect Restasis, one of its top-selling drugs, from generic competition.
Finally, the Fund’s conservative positioning and allocation to cash hampered performance during the year. We have been quite active in deploying cash during periods of market volatility, and we remain focused on putting these assets back to work.
At the close of the reporting period, the Fund’s largest overweight position relative to the Russell 1000 Index was in the consumer discretionary sector. The Fund’s largest underweight positions
| | |
| Portfolio Composition |
By sector | | % of total net assets |
| | |
| |
| Information Technology | | 20.7% |
| Financials | | 16.5 |
| Consumer Discretionary | | 15.2 |
| Health Care | | 14.1 |
| Industrials | | 10.5 |
| Energy | | 4.7 |
| Consumer Staples | | 2.6 |
| Telecommunication Services | | 1.4 |
| Materials | | 1.2 |
| Money Market Funds | | |
Plus Other Assets Less Liabilities | | 13.1 |
| | |
| Top 10 Equity Holdings* |
% of total net assets |
| |
| 1. Alphabet Inc.-Class C | | 3.2% |
2. AIA Group Ltd. | | 2.9 |
3. Comcast Corp.-Class A | | 2.7 |
4. Diageo PLC | | 2.6 |
5. Cognizant Technology Solutions Corp.-Class A | | 2.6 |
6. American Express Co. | | 2.5 |
7. Oracle Corp. | | 2.5 |
8. Stanley Black & Decker Inc. | | 2.4 |
9. Progressive Corp. (The) | | 2.1 |
10. LVMH Moet Hennessy Louis Vuitton S.E. | | 2.1 |
| | |
| Total Net Assets | | $1.2 billion |
| |
| Total Number of Holdings* | | 54 |
The Fund’s holdings are subject to change, and there is no assurance that the Fund will continue to hold any particular security.
*Excluding money market fund holdings.
Data presented here are as of December 31, 2017.
Invesco V.I. Core Equity Fund
were in the consumer staples and IT sectors. The Fund also held slight underweight positions in the materials, real estate, telecommunication services and utilities sectors.
As always, the Fund focuses on companies that provide an attractive return on invested capital, trade at attractive valuations and have high-quality management teams with a long-term perspective. In short, we seek to take advantage of the market’s volatile behavior and short-term focus. We believe our conservative approach should position the Fund to navigate the evolving economic backdrop.
We thank you for your continued investment in Invesco V.I. Core Equity Fund.
| 1 | Source: US Federal Reserve |
The views and opinions expressed in management’s discussion of Fund performance are those of Invesco Advisers, Inc. These views and opinions are subject to change at any time based on factors such as market and economic conditions. These views and opinions may not be relied upon as investment advice or recommendations, or as an offer for a particular security. The information is not a complete analysis of every aspect of any market, country, industry, security or the Fund. Statements of fact are from sources considered reliable, but Invesco Advisers, Inc. makes no representation or warranty as to their completeness or accuracy. Although historical performance is no guarantee of future results, these insights may help you understand our investment management philosophy.
See important Fund and, if applicable, index disclosures later in this report.
| | |
 | | Ronald Sloan Chartered Financial Analyst, Portfolio Manager and Co-Chief Investment Officer of Invesco’s Global Core |
| Equity Team, is lead manager of Invesco V.I. Core Equity Fund. He joined Invesco in 1998. Mr. Sloan earned a BS in business administration and an MBA from the University of Missouri. |
| | |
 | | Brian Nelson Chartered Financial Analyst, Portfolio Manager, is manager of Invesco V.I. Core Equity Fund. He joined Invesco |
| in 2004. Mr. Nelson earned a BA from the University of California, Santa Barbara. |
Assisted by Invesco’s Global Core
Equity Team
Invesco V.I. Core Equity Fund
Your Fund’s Long-Term Performance
Results of a $10,000 Investment – Oldest Share Class(es)
Fund and index data from 12/31/07
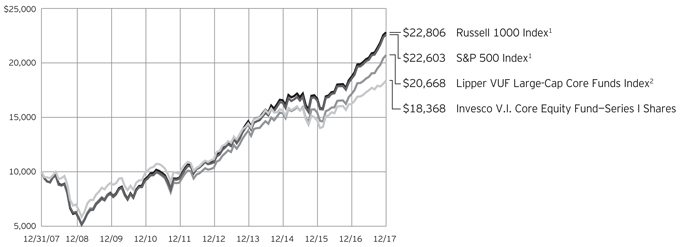
| 1 | Source: FactSet Research Systems Inc. |
Past performance cannot guarantee
comparable future results.
| | | | | |
| Average Annual Total Returns |
As of 12/31/17 | | | | | |
| |
| Series I Shares | | | | | |
| Inception (5/2/94) | | | | 8.14 | % |
| 10 Years | | | | 6.27 | |
| 5 Years | | | | 10.45 | |
| 1 Year | | | | 13.17 | |
| |
Series II Shares | | | | | |
| Inception (10/24/01) | | | | 6.71 | % |
| 10 Years | | | | 6.00 | |
| 5 Years | | | | 10.17 | |
| 1 Year | | | | 12.87 | |
The performance of the Fund’s Series I and Series II share classes will differ primarily due to different class expenses.
The performance data quoted represent past performance and cannot guarantee comparable future results; current performance may be lower or higher. Please contact your variable product issuer or financial adviser for the most recent month-end variable product performance. Performance figures reflect Fund expenses, reinvested distributions and changes in net asset value. Investment return and principal value will fluctuate so that you may have a gain or loss when you sell shares.
The net annual Fund operating expense ratio set forth in the most recent Fund prospectus as of the date
of this report for Series I and Series II shares was 0.82% and 1.07%, respectively.1 The total annual Fund operating expense ratio set forth in the most recent Fund prospectus as of the date of this report for Series I and Series II shares was 0.83% and 1.08%, respectively. The expense ratios presented above may vary from the expense ratios presented in other sections of this report that are based on expenses incurred during the period covered by this report.
Invesco V.I. Core Equity Fund, a series portfolio of AIM Variable Insurance Funds (Invesco Variable Insurance Funds), is currently offered through insurance companies issuing variable products. You cannot purchase shares of the Fund directly. Performance figures given represent the Fund and are not intended to reflect actual variable product values. They do not reflect sales charges, expenses and fees assessed in connection with a variable product. Sales charges, expenses and fees, which are determined by the variable product issuers, will vary and will lower the total return.
The most recent month-end performance at the Fund level, excluding variable product charges, is available at 800 451 4246. As mentioned above,
for the most recent month-end performance including variable product charges, please contact your variable product issuer or financial adviser.
Fund performance reflects any applicable fee waivers and/or expense reimbursements. Had the adviser not waived fees and/or reimbursed expenses currently or in the past, returns would have been lower. See current prospectus for more information.
| 1 | Total annual Fund operating expenses after any contractual fee waivers and/or expense reimbursements by the adviser in effect through at least June 30, 2019. See current prospectus for more information. |
Invesco V.I. Core Equity Fund
Invesco V.I. Core Equity Fund’s investment objective is long-term growth of capital.
| ∎ | | Unless otherwise stated, information presented in this report is as of December 31, 2017, and is based on total net assets. |
| ∎ | | Unless otherwise noted, all data provided by Invesco. |
Principal risks of investing
in the Fund
Cash/cash equivalents risk. In rising markets, holding cash or cash equivalents will negatively affect the Fund’s performance relative to its benchmark.
Debt securities risk. The prices of debt securities held by the Fund will be affected by changes in interest rates, the creditworthiness of the issuer and other factors. An increase in prevailing interest rates typically causes the value of existing debt securities to fall and often has a greater impact on longer-duration debt securities and higher quality debt securities. Falling interest rates will cause the Fund to reinvest the proceeds of debt securities that have been repaid by the issuer at lower interest rates. Falling interest rates may also reduce the Fund’s distributable income because interest payments on floating rate debt instruments held by the Fund will decline. The Fund could lose money on investments in debt securities if the issuer or borrower fails to meet its obligations to make interest payments and/or to repay principal in a timely manner. Changes in an issuer’s financial strength, the market’s perception of such strength or in the credit rating of the issuer or the security may affect the value of debt securities. The Adviser’s credit analysis may fail to anticipate such changes, which could result in buying a debt security at an inopportune time or failing to sell a debt security in advance of a price decline or other credit event.
Derivatives risk. The value of a derivative instrument depends largely on (and is derived from) the value of an underlying security, currency, commodity, interest rate, index or other asset (each referred to as an underlying asset). In addition to risks relating to the underlying assets, the use of derivatives may include other, possibly greater, risks, including counterparty, leverage and liquidity risks. Counterparty risk is the risk that the counterparty to the derivative contract will default on its obligation to pay the Fund the amount owed or otherwise perform under the derivative contract. Derivatives create leverage risk because they do not require payment up front equal to the economic exposure created by owning the derivative. As a result, an adverse change in the value of the underlying asset could result in the
Fund sustaining a loss that is substantially greater than the amount invested in the derivative, which may make the Fund’s returns more volatile and increase the risk of loss. Derivative instruments may also be less liquid than more traditional investments and the Fund may be unable to sell or close out its derivative positions at a desirable time or price. This risk may be more acute under adverse market conditions, during which the Fund may be most in need of liquidating its derivative positions. Derivatives may also be harder to value, less tax efficient and subject to changing government regulation that could impact the Fund’s ability to use certain derivatives or their cost. Also, derivatives used for hedging or to gain or limit exposure to a particular market segment may not provide the expected benefits, particularly during adverse market conditions.
Foreign government debt risk. Investments in foreign government debt securities (sometimes referred to as sovereign debt securities) involve certain risks in addition to those relating to foreign securities or debt securities generally. The issuer of the debt or the governmental authorities that control the repayment of the debt may be unable or unwilling to repay principal or interest when due in accordance with the terms of such debt, and the Fund may have limited recourse in the event of a default against the defaulting government. Without the approval of debt holders, some governmental debtors have in the past been able to reschedule or restructure their debt payments or declare moratoria on payments.
Foreign securities risk. The Fund’s foreign investments may be adversely affected by political and social instability, changes in economic or taxation policies, difficulty in enforcing obligations, decreased liquidity or increased volatility. Foreign investments also involve the risk of the possible seizure, nationalization or expropriation of the issuer or foreign deposits (in which the Fund could lose its entire investments in a certain market) and the possible adoption of foreign governmental restrictions such as exchange controls. Unless the Fund has hedged its foreign securities risk, foreign securities risk also involves the risk of negative foreign currency rate fluctuations, which may cause the value of securities denominated in such foreign currency (or other
instruments through which the Fund has exposure to foreign currencies) to decline in value. Currency exchange rates may fluctuate significantly over short periods of time. Currency hedging strategies, if used, are not always successful.
Management risk. The Fund is actively managed and depends heavily on the Adviser’s judgment about markets, interest rates or the attractiveness, relative values, liquidity, or potential appreciation of particular investments made for the Fund’s portfolio. The Fund could experience losses if these judgments prove to be incorrect. Additionally, legislative, regulatory, or tax developments may adversely affect management of the Fund and, therefore, the ability of the Fund to achieve its investment objective.
Market risk. The market values of the Fund’s investments, and therefore the value of the Fund’s shares, will go up and down, sometimes rapidly or unpredictably. Market risk may affect a single issuer, industry or section of the economy, or it may affect the market as a whole. Individual stock prices tend to go up and down more dramatically than those of certain other types of investments, such as bonds. During a general downturn in the financial markets, multiple asset classes may decline in value. When markets perform well, there can be no assurance that specific investments held by the Fund will rise in value.
Small-and mid-capitalization companies risks. Small-and mid-capitalization companies tend to be more vulnerable to changing market conditions, may have little or no operating history or track record of success, and may have more limited product lines and markets, less experienced management and fewer financial resources than larger companies. These companies’ securities may be more volatile and less liquid than those of more established companies, and their returns may vary, sometimes significantly, from the overall securities market.
Invesco V.I. Core Equity Fund
About indexes used in this report
The S&P 500® Index is an unmanaged index considered representative of the US stock market.
The Russell 1000® Index is an unmanaged index considered representative of large-cap stocks. The Russell 1000 Index is a trademark/service mark of the Frank Russell Co. Russell® is a trademark of the Frank Russell Co.
The Lipper VUF Large-Cap Core Funds Index is an unmanaged index considered representative of large-cap core variable insurance underlying funds tracked by Lipper.
The Fund is not managed to track the performance of any particular index, including the index(es) described here, and consequently, the performance of the Fund may deviate significantly from the performance of the index(es).
A direct investment cannot be made in an index. Unless otherwise indicated, index results include reinvested dividends, and they do not reflect sales charges. Performance of the peer group, if applicable, reflects fund expenses; performance of a market index does not.
Other information
The returns shown in management’s discussion of Fund performance are based on net asset values calculated for shareholder transactions. Generally accepted accounting principles require adjustments to be made to the net assets of the Fund at period end for financial reporting purposes, and as such, the net asset values for shareholder transactions and the returns based on those net asset values may differ from the net asset values and returns reported in the Financial Highlights. Additionally, the returns and net asset values shown throughout this report are at the Fund level only and do not include variable product issuer charges. If such charges were included, the total returns would be lower.
Industry classifications used in this report are generally according to the Global Industry Classification Standard, which was developed by and is the exclusive property and a service mark of MSCI Inc. and Standard & Poor’s.
Invesco V.I. Core Equity Fund
Schedule of Investments(a)
December 31, 2017
| | | | | | | | |
| | | Shares | | | Value | |
Common Stocks & Other Equity Interests–86.89% | |
| Aerospace & Defense–2.71% | |
General Dynamics Corp. | | | 84,413 | | | $ | 17,173,825 | |
United Technologies Corp. | | | 130,157 | | | | 16,604,128 | |
| | | | | | | | 33,777,953 | |
|
| Air Freight & Logistics–1.11% | |
United Parcel Service, Inc.–Class B | | | 115,608 | | | | 13,774,693 | |
|
| Airlines–0.94% | |
Delta Air Lines, Inc. | | | 208,745 | | | | 11,689,720 | |
|
| Apparel, Accessories & Luxury Goods–2.06% | |
LVMH Moet Hennessy Louis Vuitton S.E. (France) | | | 87,325 | | | | 25,650,656 | |
|
| Auto Parts & Equipment–1.31% | |
Aptiv PLC | | | 192,129 | | | | 16,298,303 | |
|
| Biotechnology–5.42% | |
Biogen Inc.(b) | | | 65,159 | | | | 20,757,703 | |
BioMarin Pharmaceutical Inc.(b) | | | 92,244 | | | | 8,225,398 | |
Celgene Corp.(b) | | | 202,851 | | | | 21,169,530 | |
Shire PLC–ADR | | | 111,687 | | | | 17,324,887 | |
| | | | | | | | 67,477,518 | |
|
| Cable & Satellite–2.67% | |
Comcast Corp.–Class A | | | 830,414 | | | | 33,258,081 | |
|
| Casinos & Gaming–1.30% | |
Wynn Resorts Ltd. | | | 96,034 | | | | 16,190,372 | |
|
| Consumer Finance–2.49% | |
American Express Co. | | | 311,605 | | | | 30,945,493 | |
|
| Data Processing & Outsourced Services–1.26% | |
Mastercard Inc.–Class A | | | 103,525 | | | | 15,669,544 | |
|
| Distillers & Vintners–2.58% | |
Diageo PLC (United Kingdom) | | | 876,005 | | | | 32,059,125 | |
|
| Diversified Banks–2.65% | |
Svenska Handelsbanken AB–Class A (Sweden) | | | 1,083,043 | | | | 14,785,906 | |
U.S. Bancorp | | | 339,779 | | | | 18,205,359 | |
| | | | | | | | 32,991,265 | |
|
| Diversified Capital Markets–0.92% | |
UBS Group AG (Switzerland) | | | 624,294 | | | | 11,472,674 | |
|
| Electronic Manufacturing Services–1.61% | |
TE Connectivity Ltd. | | | 210,172 | | | | 19,974,747 | |
|
| Footwear–1.26% | |
NIKE, Inc.–Class B | | | 250,100 | | | | 15,643,755 | |
|
| General Merchandise Stores–1.32% | |
Dollar General Corp. | | | 177,239 | | | | 16,484,999 | |
| | | | | | | | |
| | | Shares | | | Value | |
| Health Care Equipment–0.91% | |
Zimmer Biomet Holdings, Inc. | | | 93,955 | | | $ | 11,337,550 | |
|
| Health Care Facilities–1.64% | |
HCA Healthcare, Inc.(b) | | | 232,957 | | | | 20,462,943 | |
|
| Health Care Supplies–1.43% | |
DENTSPLY SIRONA Inc. | | | 270,005 | | | | 17,774,429 | |
|
| Home Improvement Retail–1.78% | |
Home Depot, Inc. (The) | | | 116,693 | | | | 22,116,824 | |
|
| Household Appliances–0.94% | |
Whirlpool Corp. | | | 69,531 | | | | 11,725,708 | |
|
| Housewares & Specialties–1.15% | |
Newell Brands, Inc. | | | 464,687 | | | | 14,358,828 | |
|
| Industrial Conglomerates–2.10% | |
Honeywell International Inc. | | | 62,400 | | | | 9,569,664 | |
Siemens AG (Germany) | | | 118,995 | | | | 16,509,762 | |
| | | | | | | | 26,079,426 | |
|
| Industrial Gases–1.23% | |
Air Liquide S.A. (France) | | | 121,883 | | | | 15,328,736 | |
|
| Industrial Machinery–3.65% | |
Illinois Tool Works Inc. | | | 92,249 | | | | 15,391,746 | |
Stanley Black & Decker Inc. | | | 176,879 | | | | 30,014,597 | |
| | | | | | | | 45,406,343 | |
|
| Insurance Brokers–1.66% | |
Marsh & McLennan Cos., Inc. | | | 254,504 | | | | 20,714,081 | |
|
| Integrated Oil & Gas–1.65% | |
Suncor Energy, Inc. (Canada) | | | 560,524 | | | | 20,582,441 | |
|
| Internet & Direct Marketing Retail–1.38% | |
Priceline Group Inc. (The)(b) | | | 9,873 | | | | 17,156,707 | |
|
| Internet Software & Services–6.84% | |
Alphabet Inc.–Class C(b) | | | 37,523 | | | | 39,264,067 | |
eBay Inc.(b) | | | 569,868 | | | | 21,506,819 | |
Facebook, Inc.–Class A(b) | | | 138,105 | | | | 24,370,008 | |
| | | | | | | | 85,140,894 | |
|
| IT Consulting & Other Services–2.57% | |
Cognizant Technology Solutions Corp.–Class A | | | 450,556 | | | | 31,998,487 | |
|
| Life & Health Insurance–2.93% | |
AIA Group Ltd. (Hong Kong) | | | 4,279,400 | | | | 36,506,548 | |
|
| Life Sciences Tools & Services–1.90% | |
Thermo Fisher Scientific, Inc. | | | 124,769 | | | | 23,691,138 | |
|
| Multi-Sector Holdings–2.06% | |
Berkshire Hathaway Inc.–Class A(b) | | | 86 | | | | 25,593,601 | |
See accompanying Notes to Financial Statements which are an integral part of the financial statements.
Invesco V.I. Core Equity Fund
| | | | | | | | |
| | | Shares | | | Value | |
| Oil & Gas Equipment & Services–1.37% | |
Halliburton Co. | | | 349,347 | | | $ | 17,072,588 | |
|
| Oil & Gas Exploration & Production–1.72% | |
Concho Resources Inc.(b) | | | 142,421 | | | | 21,394,483 | |
|
| Pharmaceuticals–2.78% | |
Allergan PLC | | | 113,648 | | | | 18,590,540 | |
Merck & Co., Inc. | | | 284,226 | | | | 15,993,397 | |
| | | | | | | | 34,583,937 | |
|
| Property & Casualty Insurance–2.09% | |
Progressive Corp. (The) | | | 462,886 | | | | 26,069,740 | |
|
| Regional Banks–1.71% | |
First Republic Bank | | | 246,037 | | | | 21,316,646 | |
|
| Semiconductors–4.17% | |
Analog Devices, Inc. | | | 225,796 | | | | 20,102,618 | |
QUALCOMM Inc. | | | 196,061 | | | | 12,551,825 | |
Taiwan Semiconductor Manufacturing Co. Ltd. (Taiwan) | | | 2,495,823 | | | | 19,194,512 | |
| | | | | | | | 51,848,955 | |
| Systems Software–4.24% | |
Microsoft Corp. | | | 255,402 | | | | 21,847,087 | |
Oracle Corp. | | | 653,501 | | | | 30,897,527 | |
| | | | | | | | 52,744,614 | |
| | | | | | | | |
| | | Shares | | | Value | |
| Wireless Telecommunication Services–1.38% | |
Vodafone Group PLC–ADR (United Kingdom) | | | 540,167 | | | $ | 17,231,327 | |
Total Common Stocks & Other Equity Interests
(Cost $777,212,068) | | | | 1,081,595,872 | |
|
Money Market Funds–10.92% | |
Invesco Government & Agency Portfolio–Institutional Class, 1.18%(c) | | | 47,562,456 | | | | 47,562,456 | |
Invesco Liquid Assets Portfolio–Institutional Class, 1.40%(c) | | | 33,965,672 | | | | 33,969,069 | |
Invesco Treasury Portfolio–Institutional Class, 1.17%(c) | | | 54,357,092 | | | | 54,357,092 | |
Total Money Market Funds
(Cost $135,891,765) | | | | 135,888,617 | |
TOTAL INVESTMENTS IN SECURITIES–97.81% (Cost $913,103,833) | | | | 1,217,484,489 | |
OTHER ASSETS LESS LIABILITIES–2.19% | | | | 27,300,289 | |
NET ASSETS–100.00% | | | | | | $ | 1,244,784,778 | |
Investment Abbreviations:
| | |
| ADR | | – American Depositary Receipt |
Notes to Schedule of Investments:
| (a) | Industry and/or sector classifications used in this report are generally according to the Global Industry Classification Standard, which was developed by and is the exclusive property and a service mark of MSCI Inc. and Standard & Poor’s. |
| (b) | Non-income producing security. |
| (c) | The money market fund and the Fund are affiliated by having the same investment adviser. The rate shown is the 7-day SEC standardized yield as of December 31, 2017. |
See accompanying Notes to Financial Statements which are an integral part of the financial statements.
Invesco V.I. Core Equity Fund
Statement of Assets and Liabilities
December 31, 2017
Statement of Operations
For the year ended December 31, 2017
| | | | |
Assets: | | | | |
Investments in securities, at value (Cost $777,212,068) | | $ | 1,081,595,872 | |
Investments in affiliated money market funds, at value (Cost $135,891,765) | | | 135,888,617 | |
Foreign currencies, at value (Cost $26,908,714) | | | 27,844,549 | |
Receivable for: | | | | |
Fund shares sold | | | 119,383 | |
Dividends | | | 803,922 | |
Investment for trustee deferred compensation and retirement plans | | | 447,735 | |
Other assets | | | 191 | |
Total assets | | | 1,246,700,269 | |
| |
Liabilities: | | | | |
Payable for: | | | | |
Fund shares reacquired | | | 833,896 | |
Accrued fees to affiliates | | | 546,602 | |
Accrued trustees’ and officers’ fees and benefits | | | 1,034 | |
Accrued other operating expenses | | | 37,627 | |
Trustee deferred compensation and retirement plans | | | 496,332 | |
Total liabilities | | | 1,915,491 | |
Net assets applicable to shares outstanding | | $ | 1,244,784,778 | |
| |
Net assets consist of: | | | | |
Shares of beneficial interest | | $ | 871,608,960 | |
Undistributed net investment income | | | 8,498,127 | |
Undistributed net realized gain | | | 59,361,302 | |
Net unrealized appreciation | | | 305,316,389 | |
| | | $ | 1,244,784,778 | |
| |
Net Assets: | | | | |
Series I | | $ | 1,054,802,354 | |
Series II | | $ | 189,982,424 | |
|
Shares outstanding, no par value,
with an unlimited number of shares authorized: | |
Series I | | | 28,726,935 | |
Series II | | | 5,251,714 | |
Series I: | | | | |
Net asset value per share | | $ | 36.72 | |
Series II: | | | | |
Net asset value per share | | $ | 36.18 | |
| | | | |
Investment income: | | | | |
Dividends (net of foreign withholding taxes of $641,834) | | $ | 17,914,861 | |
Dividends from affiliated money market funds | | | 1,093,713 | |
Total investment income | | | 19,008,574 | |
| |
Expenses: | | | | |
Advisory fees | | | 7,557,806 | |
Administrative services fees | | | 2,004,199 | |
Custodian fees | | | 97,308 | |
Distribution fees — Series II | | | 462,816 | |
Transfer agent fees | | | 59,642 | |
Trustees’ and officers’ fees and benefits | | | 37,984 | |
Reports to shareholders | | | 133,980 | |
Professional services fees | | | 48,081 | |
Other | | | 15,372 | |
Total expenses | | | 10,417,188 | |
Less: Fees waived | | | (155,469 | ) |
Net expenses | | | 10,261,719 | |
Net investment income | | | 8,746,855 | |
| |
Realized and unrealized gain from: | | | | |
Net realized gain from: | | | | |
Investment securities (includes net gains (losses) from securities sold to affiliates of $(197,609)) | | | 62,967,473 | |
Foreign currencies | | | 231,393 | |
| | | | 63,198,866 | |
Change in net unrealized appreciation of: | | | | |
Investment securities | | | 79,770,839 | |
Foreign currencies | | | 996,605 | |
| | | | 80,767,444 | |
Net realized and unrealized gain | | | 143,966,310 | |
Net increase in net assets resulting from operations | | $ | 152,713,165 | |
See accompanying Notes to Financial Statements which are an integral part of the financial statements.
Invesco V.I. Core Equity Fund
Statement of Changes in Net Assets
For the years ended December 31, 2017 and 2016
| | | | | | | | |
| | | 2017 | | | 2016 | |
Operations: | | | | | | | | |
Net investment income | | $ | 8,746,855 | | | $ | 12,378,633 | |
Net realized gain | | | 63,198,866 | | | | 63,806,796 | |
Change in net unrealized appreciation | | | 80,767,444 | | | | 35,541,249 | |
Net increase in net assets resulting from operations | | | 152,713,165 | | | | 111,726,678 | |
| | |
Distributions to shareholders from net investment income: | | | | | | | | |
Series I | | | (10,820,715 | ) | | | (7,743,417 | ) |
Series ll | | | (1,482,765 | ) | | | (879,585 | ) |
Total distributions from net investment income | | | (12,303,480 | ) | | | (8,623,002 | ) |
| | |
Distributions to shareholders from net realized gains: | | | | | | | | |
Series l | | | (54,200,882 | ) | | | (69,406,591 | ) |
Series ll | | | (9,654,814 | ) | | | (12,096,765 | ) |
Total distributions from net realized gains | | | (63,855,696 | ) | | | (81,503,356 | ) |
| | |
Share transactions–net: | | | | | | | | |
Series l | | | (44,176,644 | ) | | | 94,841,524 | |
Series ll | | | (888,493 | ) | | | (2,788,171 | ) |
Net increase (decrease) in net assets resulting from share transactions | | | (45,065,137 | ) | | | 92,053,353 | |
Net increase in net assets | | | 31,488,852 | | | | 113,653,673 | |
| | |
Net assets: | | | | | | | | |
Beginning of year | | | 1,213,295,926 | | | | 1,099,642,253 | |
End of year (includes undistributed net investment income of $8,498,127 and $11,825,531, respectively) | | $ | 1,244,784,778 | | | $ | 1,213,295,926 | |
Notes to Financial Statements
December 31, 2017
NOTE 1—Significant Accounting Policies
Invesco V.I. Core Equity Fund (the “Fund”) is a series portfolio of AIM Variable Insurance Funds (Invesco Variable Insurance Funds) (the “Trust”). The Trust is a Delaware statutory trust registered under the Investment Company Act of 1940, as amended (the “1940 Act”), as an open-end series management investment company consisting of twenty-four separate portfolios, (each constituting a “Fund”). The assets, liabilities and operations of each portfolio are accounted for separately. Information presented in these financial statements pertains only to the Fund. Matters affecting each Fund or class will be voted on exclusively by the shareholders of such Fund or class. Current Securities and Exchange Commission (“SEC”) guidance, however, requires participating insurance companies offering separate accounts to vote shares proportionally in accordance with the instructions of the contract owners whose investments are funded by shares of each Fund or class.
The Fund’s investment objective is long-term growth of capital.
The Fund currently offers two classes of shares, Series I and Series II, both of which are offered to insurance company separate accounts funding variable annuity contracts and variable life insurance policies (“variable products”).
The Fund is an investment company and accordingly follows the investment company accounting and reporting guidance in accordance with Financial Accounting Standards Board Accounting Standards Codification Topic 946, Financial Services — Investment Companies.
The following is a summary of the significant accounting policies followed by the Fund in the preparation of its financial statements.
| A. | Security Valuations — Securities, including restricted securities, are valued according to the following policy. |
A security listed or traded on an exchange (except convertible securities) is valued at its last sales price or official closing price as of the close of the customary trading session on the exchange where the security is principally traded, or lacking any sales or official closing price on a particular day, the security may be valued at the closing bid price on that day. Securities traded in the over-the-counter market are valued based on prices furnished by independent pricing services or market makers. When such securities are valued by an independent pricing service they may be considered fair valued. Futures contracts are valued at the final settlement price set by an exchange on which they are principally traded. Listed options are valued at the mean between the last bid and asked prices from the exchange on which they are principally traded. Options not listed on an exchange are valued by an independent source at the mean between the last bid and asked prices. For purposes of determining net asset value (“NAV”) per share, futures and option contracts generally are valued 15 minutes after the close of the customary trading session of the New York Stock Exchange (“NYSE”).
Investments in open-end and closed-end registered investment companies that do not trade on an exchange are valued at the end-of-day net asset value per share. Investments in open-end and closed-end registered investment companies that trade on an exchange are valued at the last sales price or official closing price as of the close of the customary trading session on the exchange where the security is principally traded.
Invesco V.I. Core Equity Fund
Debt obligations (including convertible securities) and unlisted equities are fair valued using an evaluated quote provided by an independent pricing service. Evaluated quotes provided by the pricing service may be determined without exclusive reliance on quoted prices, and may reflect appropriate factors such as institution-size trading in similar groups of securities, developments related to specific securities, dividend rate (for unlisted equities), yield (for debt obligations), quality, type of issue, coupon rate (for debt obligations), maturity (for debt obligations), individual trading characteristics and other market data. Pricing services generally value debt obligations assuming orderly transactions of institutional round lot size, but a fund may hold or transact in the same securities in smaller, odd lot sizes. Odd lots often trade at lower prices than institutional round lots. Debt obligations are subject to interest rate and credit risks. In addition, all debt obligations involve some risk of default with respect to interest and/or principal payments.
Foreign securities’ (including foreign exchange contracts) prices are converted into U.S. dollar amounts using the applicable exchange rates as of the close of the NYSE. If market quotations are available and reliable for foreign exchange-traded equity securities, the securities will be valued at the market quotations. Because trading hours for certain foreign securities end before the close of the NYSE, closing market quotations may become unreliable. If between the time trading ends on a particular security and the close of the customary trading session on the NYSE, events occur that the investment adviser determines are significant and make the closing price unreliable, the Fund may fair value the security. If the event is likely to have affected the closing price of the security, the security will be valued at fair value in good faith using procedures approved by the Board of Trustees. Adjustments to closing prices to reflect fair value may also be based on a screening process of an independent pricing service to indicate the degree of certainty, based on historical data, that the closing price in the principal market where a foreign security trades is not the current value as of the close of the NYSE. Foreign securities’ prices meeting the approved degree of certainty that the price is not reflective of current value will be priced at the indication of fair value from the independent pricing service. Multiple factors may be considered by the independent pricing service in determining adjustments to reflect fair value and may include information relating to sector indices, American Depositary Receipts and domestic and foreign index futures. Foreign securities may have additional risks including exchange rate changes, potential for sharply devalued currencies and high inflation, political and economic upheaval, the relative lack of issuer information, relatively low market liquidity and the potential lack of strict financial and accounting controls and standards.
Securities for which market prices are not provided by any of the above methods may be valued based upon quotes furnished by independent sources. The last bid price may be used to value equity securities. The mean between the last bid and asked prices is used to value debt obligations, including corporate loans.
Securities for which market quotations are not readily available or became unreliable are valued at fair value as determined in good faith by or under the supervision of the Trust’s officers following procedures approved by the Board of Trustees. Issuer specific events, market trends, bid/asked quotes of brokers and information providers and other market data may be reviewed in the course of making a good faith determination of a security’s fair value.
The Fund may invest in securities that are subject to interest rate risk, meaning the risk that the prices will generally fall as interest rates rise and, conversely, the prices will generally rise as interest rates fall. Specific securities differ in their sensitivity to changes in interest rates depending on their individual characteristics. Changes in interest rates may result in increased market volatility, which may affect the value and/or liquidity of certain Fund investments.
Valuations change in response to many factors including the historical and prospective earnings of the issuer, the value of the issuer’s assets, general economic conditions, interest rates, investor perceptions and market liquidity. Because of the inherent uncertainties of valuation, the values reflected in the financial statements may materially differ from the value received upon actual sale of those investments.
| B. | Securities Transactions and Investment Income — Securities transactions are accounted for on a trade date basis. Realized gains or losses on sales are computed on the basis of specific identification of the securities sold. Interest income (net of withholding tax, if any) is recorded on the accrual basis from settlement date. Dividend income (net of withholding tax, if any) is recorded on the ex-dividend date. |
The Fund may periodically participate in litigation related to Fund investments. As such, the Fund may receive proceeds from litigation settlements. Any proceeds received are included in the Statement of Operations as realized gain (loss) for investments no longer held and as unrealized gain (loss) for investments still held.
Brokerage commissions and mark ups are considered transaction costs and are recorded as an increase to the cost basis of securities purchased and/or a reduction of proceeds on a sale of securities. Such transaction costs are included in the determination of net realized and unrealized gain (loss) from investment securities reported in the Statement of Operations and the Statement of Changes in Net Assets and the net realized and unrealized gains (losses) on securities per share in the Financial Highlights. Transaction costs are included in the calculation of the Fund’s net asset value and, accordingly, they reduce the Fund’s total returns. These transaction costs are not considered operating expenses and are not reflected in net investment income reported in the Statement of Operations and the Statement of Changes in Net Assets, or the net investment income per share and the ratios of expenses and net investment income reported in the Financial Highlights, nor are they limited by any expense limitation arrangements between the Fund and the investment adviser.
The Fund allocates income and realized and unrealized capital gains and losses to a class based on the relative net assets of each class.
| C. | Country Determination — For the purposes of making investment selection decisions and presentation in the Schedule of Investments, the investment adviser may determine the country in which an issuer is located and/or credit risk exposure based on various factors. These factors include the laws of the country under which the issuer is organized, where the issuer maintains a principal office, the country in which the issuer derives 50% or more of its total revenues and the country that has the primary market for the issuer’s securities, as well as other criteria. Among the other criteria that may be evaluated for making this determination are the country in which the issuer maintains 50% or more of its assets, the type of security, financial guarantees and enhancements, the nature of the collateral and the sponsor organization. Country of issuer and/or credit risk exposure has been determined to be the United States of America, unless otherwise noted. |
| D. | Distributions — Distributions from net investment income and net realized capital gain, if any, are generally declared and paid to separate accounts of participating insurance companies annually and recorded on the ex-dividend date. |
| E. | Federal Income Taxes — The Fund intends to comply with the requirements of Subchapter M of the Internal Revenue Code of 1986, as amended (the “Internal Revenue Code”), necessary to qualify as a regulated investment company and to distribute substantially all of the Fund’s taxable earnings to shareholders. As such, the Fund will not be subject to federal income taxes on otherwise taxable income (including net realized capital gain) that is distributed to shareholders. Therefore, no provision for federal income taxes is recorded in the financial statements. |
Invesco V.I. Core Equity Fund
The Fund recognizes the tax benefits of uncertain tax positions only when the position is more likely than not to be sustained. Management has analyzed the Fund’s uncertain tax positions and concluded that no liability for unrecognized tax benefits should be recorded related to uncertain tax positions. Management is not aware of any tax positions for which it is reasonably possible that the total amounts of unrecognized tax benefits will change materially in the next 12 months.
The Fund files tax returns in the U.S. Federal jurisdiction and certain other jurisdictions. Generally, the Fund is subject to examinations by such taxing authorities for up to three years after the filing of the return for the tax period.
| F. | Expenses — Fees provided for under the Rule 12b-1 plan of a particular class of the Fund and which are directly attributable to that class are charged to the operations of such class. All other expenses are allocated among the classes based on relative net assets. |
| G. | Accounting Estimates — The preparation of financial statements in conformity with accounting principles generally accepted in the United States of America (“GAAP”) requires management to make estimates and assumptions that affect the reported amounts of assets and liabilities at the date of the financial statements and the reported amounts of revenues and expenses during the reporting period including estimates and assumptions related to taxation. Actual results could differ from those estimates by a significant amount. In addition, the Fund monitors for material events or transactions that may occur or become known after the period-end date and before the date the financial statements are released to print. |
| H. | Indemnifications — Under the Trust’s organizational documents, each Trustee, officer, employee or other agent of the Trust is indemnified against certain liabilities that may arise out of the performance of their duties to the Fund. Additionally, in the normal course of business, the Fund enters into contracts, including the Fund’s servicing agreements, that contain a variety of indemnification clauses. The Fund’s maximum exposure under these arrangements is unknown as this would involve future claims that may be made against the Fund that have not yet occurred. The risk of material loss as a result of such indemnification claims is considered remote. |
| I. | Foreign Currency Translations — Foreign currency is valued at the close of the NYSE based on quotations posted by banks and major currency dealers. Portfolio securities and other assets and liabilities denominated in foreign currencies are translated into U.S. dollar amounts at date of valuation. Purchases and sales of portfolio securities (net of foreign taxes withheld on disposition) and income items denominated in foreign currencies are translated into U.S. dollar amounts on the respective dates of such transactions. The Fund does not separately account for the portion of the results of operations resulting from changes in foreign exchange rates on investments and the fluctuations arising from changes in market prices of securities held. The combined results of changes in foreign exchange rates and the fluctuation of market prices on investments (net of estimated foreign tax withholding) are included with the net realized and unrealized gain or loss from investments in the Statement of Operations. Reported net realized foreign currency gains or losses arise from (1) sales of foreign currencies, (2) currency gains or losses realized between the trade and settlement dates on securities transactions, and (3) the difference between the amounts of dividends, interest, and foreign withholding taxes recorded on the Fund’s books and the U.S. dollar equivalent of the amounts actually received or paid. Net unrealized foreign currency gains and losses arise from changes in the fair values of assets and liabilities, other than investments in securities at fiscal period end, resulting from changes in exchange rates. |
The Fund may invest in foreign securities, which may be subject to foreign taxes on income, gains on investments or currency repatriation, a portion of which may be recoverable. Foreign taxes, if any, are recorded based on the tax regulations and rates that exist in the foreign markets in which the Fund invests and are shown in the Statement of Operations.
| J. | Forward Foreign Currency Contracts — The Fund may engage in foreign currency transactions either on a spot (i.e. for prompt delivery and settlement) basis, or through forward foreign currency contracts, to manage or minimize currency or exchange rate risk. |
The Fund may also enter into forward foreign currency contracts for the purchase or sale of a security denominated in a foreign currency in order to “lock in” the U.S. dollar price of that security, or the Fund may also enter into forward foreign currency contracts that do not provide for physical settlement of the two currencies, but instead are settled by a single cash payment calculated as the difference between the agreed upon exchange rate and the spot rate at settlement based upon an agreed upon notional amount (non-deliverable forwards). The Fund will set aside liquid assets in an amount equal to the daily mark-to-market obligation for forward foreign currency contracts.
A forward foreign currency contract is an obligation between two parties (“Counterparties”) to purchase or sell a specific currency for an agreed-upon price at a future date. The use of forward foreign currency contracts does not eliminate fluctuations in the price of the underlying securities the Fund owns or intends to acquire but establishes a rate of exchange in advance. Fluctuations in the value of these contracts are measured by the difference in the contract date and reporting date exchange rates and are recorded as unrealized appreciation (depreciation) until the contracts are closed. When the contracts are closed, realized gains (losses) are recorded. Realized and unrealized gains (losses) on the contracts are included in the Statement of Operations. The primary risks associated with forward foreign currency contracts include failure of the Counterparty to meet the terms of the contract and the value of the foreign currency changing unfavorably. These risks may be in excess of the amounts reflected in the Statement of Assets and Liabilities.
NOTE 2—Advisory Fees and Other Fees Paid to Affiliates
The Trust has entered into a master investment advisory agreement with Invesco Advisers, Inc. (the “Adviser” or “Invesco”). Under the terms of the investment advisory agreement, the Fund accrues daily and pays monthly an advisory fee to the Adviser based on the annual rate of the Fund’s average daily net assets as follows:
| | | | |
| Average Daily Net Assets | | Rate | |
First $250 million | | | 0.65% | |
Over $250 million | | | 0.60% | |
For the year ended December 31, 2017, the effective advisory fees incurred by the Fund was 0.61%.
Under the terms of a master sub-advisory agreement between the Adviser and each of Invesco Asset Management Deutschland GmbH, Invesco Asset Management Limited, Invesco Asset Management (Japan) Limited, Invesco Hong Kong Limited, Invesco Senior Secured Management, Inc. and Invesco Canada Ltd. and separate sub-advisory agreements with Invesco PowerShares Capital Management LLC and Invesco Asset Management (India) Private Limited (collectively, the “Affiliated Sub-Advisers”) the Adviser, not the Fund, will pay 40% of the fees paid to the Adviser to any such
Invesco V.I. Core Equity Fund
Affiliated Sub-Adviser(s) that provide(s) discretionary investment management services to the Fund based on the percentage of assets allocated to such Affiliated Sub-Adviser(s).
The Adviser has contractually agreed, through at least June 30, 2018, to waive advisory fees and/or reimburse expenses of all shares to the extent necessary to limit total annual fund operating expenses after fee waiver and/or expense reimbursement (excluding certain items discussed below) of Series I shares to 2.00% and Series II shares to 2.25% of average daily net assets (the “expense limits”). In determining the Adviser’s obligation to waive advisory fees and/or reimburse expenses, the following expenses are not taken into account, and could cause the total annual fund operating expenses after fee waiver and/or expense reimbursement to exceed the numbers reflected above: (1) interest; (2) taxes; (3) dividend expense on short sales; (4) extraordinary or non-routine items, including litigation expenses; and (5) expenses that the Fund has incurred but did not actually pay because of an expense offset arrangement. Unless Invesco continues the fee waiver agreement, it will terminate on June 30, 2018. During its term, the fee waiver agreement cannot be terminated or amended to increase the expense limits or reduce the advisory fee waiver without approval of the Board of Trustees. The Adviser did not waive fees and/or reimburse expenses during the period under these expense limits.
Further, the Adviser has contractually agreed, through at least June 30, 2019, to waive the advisory fee payable by the Fund in an amount equal to 100% of the net advisory fees the Adviser receives from the affiliated money market funds on investments by the Fund of uninvested cash in such affiliated money market funds.
For the year ended December 31, 2017, the Adviser waived advisory fees of $155,469.
The Trust has entered into a master administrative services agreement with Invesco pursuant to which the Fund has agreed to pay Invesco a fee for costs incurred in providing accounting services and fund administrative services to the Fund and to reimburse Invesco for fees paid to insurance companies that have agreed to provide certain administrative services to the Fund. These administrative services provided by the insurance companies may include, among other things: maintenance of master accounts with the Fund; tracking, recording and transmitting net purchase and redemption orders for Fund shares; maintaining and preserving records related to the purchase, redemption and other account activity of variable product owners; distributing copies of Fund documents such as prospectuses, proxy materials and periodic reports, to variable product owners, and responding to inquiries from variable product owners about the Fund. Pursuant to such agreement, for the year ended December 31, 2017, Invesco was paid $289,924 for accounting and fund administrative services and was reimbursed $1,714,275 for fees paid to insurance companies.
The Trust has entered into a transfer agency and service agreement with Invesco Investment Services, Inc. (“IIS”) pursuant to which the Fund has agreed to pay IIS a fee for providing transfer agency and shareholder services to the Fund and reimburse IIS for certain expenses incurred by IIS in the course of providing such services. For the year ended December 31, 2017, expenses incurred under the agreement are shown in the Statement of Operations as Transfer agent fees.
The Trust has entered into a master distribution agreement with Invesco Distributors, Inc. (“IDI”) to serve as the distributor for the Fund. The Trust has adopted a plan pursuant to Rule 12b-1 under the 1940 Act with respect to the Fund’s Series II shares (the “Plan”). The Fund, pursuant to the Plan, pays IDI compensation at the annual rate of 0.25% of the Fund’s average daily net assets of Series II shares. The fees are accrued daily and paid monthly. Of the Plan payments, up to 0.25% of the average daily net assets of the Series II shares may be paid to insurance companies who furnish continuing personal shareholder services to customers who purchase and own Series II shares of the Fund. For the year ended December 31, 2017, expenses incurred under the Plan are detailed in the Statement of Operations as Distribution fees .
For the year ended December 31, 2017, the Fund incurred $503 in brokerage commissions with Invesco Capital Markets, Inc., an affiliate of the Adviser and IDI, for portfolio transactions executed on behalf of the Fund.
Certain officers and trustees of the Trust are officers and directors of the Adviser, IIS and/or IDI.
NOTE 3—Additional Valuation Information
GAAP defines fair value as the price that would be received to sell an asset or paid to transfer a liability in an orderly transaction between market participants at the measurement date, under current market conditions. GAAP establishes a hierarchy that prioritizes the inputs to valuation methods, giving the highest priority to readily available unadjusted quoted prices in an active market for identical assets (Level 1) and the lowest priority to significant unobservable inputs (Level 3), generally when market prices are not readily available or are unreliable. Based on the valuation inputs, the securities or other investments are tiered into one of three levels. Changes in valuation methods may result in transfers in or out of an investment’s assigned level:
| | Level 1 — | Prices are determined using quoted prices in an active market for identical assets. |
| | Level 2 — | Prices are determined using other significant observable inputs. Observable inputs are inputs that other market participants may use in pricing a security. These may include quoted prices for similar securities, interest rates, prepayment speeds, credit risk, yield curves, loss severities, default rates, discount rates, volatilities and others. |
| | Level 3 — | Prices are determined using significant unobservable inputs. In situations where quoted prices or observable inputs are unavailable (for example, when there is little or no market activity for an investment at the end of the period), unobservable inputs may be used. Unobservable inputs reflect the Fund’s own assumptions about the factors market participants would use in determining fair value of the securities or instruments and would be based on the best available information. |
The following is a summary of the tiered valuation input levels, as of December 31, 2017. The level assigned to the securities valuations may not be an indication of the risk or liquidity associated with investing in those securities. Because of the inherent uncertainties of valuation, the values reflected in the financial statements may materially differ from the value received upon actual sale of those investments.
The Fund’s policy is to recognize transfers in and out of the valuation levels as of the end of the reporting period. During the year ended December 31, 2017, there were transfers from Level 1 to Level 2 of $14,785,906 and from Level 2 to Level 1 of $36,506,548, due to foreign fair value adjustments.
| | | | | | | | | | | | | | | | |
| | | Level 1 | | | Level 2 | | | Level 3 | | | Total | |
| Investments in Securities | | | | | | | | | | | | |
Common Stocks & Other Equity Interests | | $ | 946,594,501 | | | $ | 135,001,371 | | | $ | — | | | $ | 1,081,595,872 | |
Money Market Funds | | | 135,888,617 | | | | — | | | | — | | | | 135,888,617 | |
Total Investments | | $ | 1,082,483,118 | | | $ | 135,001,371 | | | $ | — | | | $ | 1,217,484,489 | |
Invesco V.I. Core Equity Fund
NOTE 4—Security Transactions with Affiliated Funds
The Fund is permitted to purchase or sell securities from or to certain other Invesco Funds under specified conditions outlined in procedures adopted by the Board of Trustees of the Trust. The procedures have been designed to ensure that any purchase or sale of securities by the Fund from or to another fund or portfolio that is or could be considered an affiliate by virtue of having a common investment adviser (or affiliated investment advisers), common Trustees and/or common officers complies with Rule 17a-7 of the 1940 Act. Further, as defined under the procedures, each transaction is effected at the current market price. Pursuant to these procedures, for the year ended December 31, 2017, the Fund engaged in securities sales of $493,229 which resulted in net realized gains (losses) of $(197,609).
NOTE 5—Trustees’ and Officers’ Fees and Benefits
Trustees’ and Officers’ Fees and Benefits include amounts accrued by the Fund to pay remuneration to certain Trustees and Officers of the Fund. Trustees have the option to defer compensation payable by the Fund, and Trustees’ and Officers’ Fees and Benefits also include amounts accrued by the Fund to fund such deferred compensation amounts. Those Trustees who defer compensation have the option to select various Invesco Funds in which their deferral accounts shall be deemed to be invested. Finally, certain current Trustees were eligible to participate in a retirement plan that provided for benefits to be paid upon retirement to Trustees over a period of time based on the number of years of service. The Fund may have certain former Trustees who also participate in a retirement plan and receive benefits under such plan. Trustees’ and Officers’ Fees and Benefits include amounts accrued by the Fund to fund such retirement benefits. Obligations under the deferred compensation and retirement plans represent unsecured claims against the general assets of the Fund.
NOTE 6—Cash Balances
The Fund is permitted to temporarily carry a negative or overdrawn balance in its account with State Street Bank and Trust Company, the custodian bank. Such balances, if any at period-end, are shown in the Statement of Assets and Liabilities under the payable caption Amount due custodian . To compensate the custodian bank for such overdrafts, the overdrawn Fund may either (1) leave funds as a compensating balance in the account so the custodian bank can be compensated by earning the additional interest; or (2) compensate by paying the custodian bank at a rate agreed upon by the custodian bank and Invesco, not to exceed the contractually agreed upon rate.
NOTE 7—Distributions to Shareholders and Tax Components of Net Assets
Tax Character of Distributions to Shareholders Paid During the Fiscal Years Ended December 31, 2017 and 2016:
| | | | | | | | |
| | | 2017 | | | 2016 | |
Ordinary income | | $ | 13,761,073 | | | $ | 8,623,002 | |
Long-term capital gain | | | 62,398,103 | | | | 81,503,356 | |
Total distributions | | $ | 76,159,176 | | | $ | 90,126,358 | |
Tax Components of Net Assets at Period-End:
| | | | |
| | | 2017 | |
Undistributed ordinary income | | $ | 8,933,488 | |
Undistributed long-term gain | | | 62,376,136 | |
Net unrealized appreciation — investments | | | 301,365,822 | |
Net unrealized appreciation — foreign currencies | | | 935,733 | |
Temporary book/tax differences | | | (435,361 | ) |
Shares of beneficial interest | | | 871,608,960 | |
Total net assets | | $ | 1,244,784,778 | |
The difference between book-basis and tax-basis unrealized appreciation (depreciation) is due to differences in the timing of recognition of gains and losses on investments for tax and book purposes. The Fund’s net unrealized appreciation difference is attributable primarily to wash sales.
The temporary book/tax differences are a result of timing differences between book and tax recognition of income and/or expenses. The Fund’s temporary book/tax differences are the result of the trustee deferral of compensation and retirement plan benefits.
Capital loss carryforward is calculated and reported as of a specific date. Results of transactions and other activity after that date may affect the amount of capital loss carryforward actually available for the Fund to utilize. Capital losses generated in years beginning after December 22, 2010 can be carried forward for an unlimited period, whereas previous losses expire in eight tax years. Capital losses with an expiration period may not be used to offset capital gains until all net capital losses without an expiration date have been utilized. Capital loss carryforwards with no expiration date will retain their character as either short-term or long-term capital losses instead of as short-term capital losses as under prior law. The ability to utilize capital loss carryforwards in the future may be limited under the Internal Revenue Code and related regulations based on the results of future transactions.
The Fund does not have a capital loss carryforward as of December 31, 2017.
Invesco V.I. Core Equity Fund
NOTE 8—Investment Transactions
The aggregate amount of investment securities (other than short-term securities, U.S. Treasury obligations and money market funds, if any) purchased and sold by the Fund during the year ended December 31, 2017 was $325,858,254 and $499,929,363, respectively. Cost of investments, including any derivatives, on a tax basis includes the adjustments for financial reporting purposes as of the most recently completed federal income tax reporting period-end.
| | | | |
| Unrealized Appreciation (Depreciation) of Investments on a Tax Basis | |
Aggregate unrealized appreciation of investments | | $ | 333,049,837 | |
Aggregate unrealized (depreciation) of investments | | | (31,684,015 | ) |
Net unrealized appreciation of investments | | $ | 301,365,822 | |
Cost of investments for tax purposes is $916,118,667.
NOTE 9—Reclassification of Permanent Differences
Primarily as a result of differing book/tax treatment of foreign currency transactions, on December 31, 2017, undistributed net investment income was increased by $229,221 and undistributed net realized gain was decreased by $229,221. This reclassification had no effect on the net assets of the Fund.
NOTE 10—Share Information
| | | | | | | | | | | | | | | | |
| | | Summary of Share Activity | |
| | | Years ended December 31, | |
| | | 2017(a) | | | 2016 | |
| | | Shares | | | Amount | | | Shares | | | Amount | |
Sold: | | | | | | | | | | | | | | | | |
Series I | | | 1,051,421 | | | $ | 37,861,752 | | | | 4,633,218 | | | $ | 163,930,451 | |
Series II | | | 212,324 | | | | 7,514,897 | | | | 229,629 | | | | 7,596,362 | |
| | | | |
Issued as reinvestment of dividends: | | | | | | | | | | | | | | | | |
Series I | | | 1,829,018 | | | | 65,021,597 | | | | 2,245,997 | | | | 77,150,008 | |
Series II | | | 317,853 | | | | 11,137,579 | | | | 382,783 | | | | 12,976,350 | |
| | | | |
Reacquired: | | | | | | | | | | | | | | | | |
Series I | | | (4,043,650 | ) | | | (147,059,993 | ) | | | (4,224,160 | ) | | | (146,238,935 | ) |
Series II | | | (544,318 | ) | | | (19,540,969 | ) | | | (680,023 | ) | | | (23,360,883 | ) |
Net increase (decrease) in share activity | | | (1,177,352 | ) | | $ | (45,065,137 | ) | | | 2,587,444 | | | $ | 92,053,353 | |
| (a) | There are entities that are record owners of more than 5% of the outstanding shares of the Fund and in the aggregate own 57% of the outstanding shares of the Fund. The Fund and the Fund’s principal underwriter or adviser, are parties to participation agreements with these entities whereby these entities sell units of interest in separate accounts funding variable products that are invested in the Fund. The Fund, Invesco and/or Invesco affiliates may make payments to these entities, which are considered to be related to the Fund, for providing services to the Fund, Invesco and/or Invesco affiliates including but not limited to services such as, securities brokerage, third party record keeping and account servicing and administrative services. The Fund has no knowledge as to whether all or any portion of the shares owned of record by these entities are also owned beneficially. |
Invesco V.I. Core Equity Fund
NOTE 11—Financial Highlights
The following schedule presents financial highlights for a share of the Fund outstanding throughout the periods indicated.
| | | | | | | | | | | | | | | | | | | | | | | | | | | | | | | | | | | | | | | | | | | | | | | | | | | | | | | | |
| | | Net asset
value,
beginning
of period | | | Net
investment
income(a) | | | Net gains
(losses)
on securities
(both
realized and
unrealized) | | | Total from
investment
operations | | | Dividends
from net
investment
income | | | Distributions
from net
realized
gains | | | Total
distributions | | | Net asset
value, end
of period | | | Total
return(b) | | | Net assets,
end of period
(000’s omitted) | | | Ratio of
expenses
to average
net assets
with fee waivers
and/or expenses
absorbed | | | Ratio of
expenses
to average net
assets without
fee waivers
and/or expenses
absorbed | | | Ratio of net
investment
income
to average
net assets | | | Portfolio
turnover(c) | |
Series I | | | | | | | | | | | | | | | | | | | | | | | | | | | | | | | | | | | | | | | | | | | | | | | | | | | | | | | | |
Year ended 12/31/17 | | $ | 34.58 | | | $ | 0.27 | | | $ | 4.21 | | | $ | 4.48 | | | $ | (0.39 | ) | | $ | (1.95 | ) | | $ | (2.34 | ) | | $ | 36.72 | | | | 13.17 | % | | $ | 1,054,802 | | | | 0.79 | %(d) | | | 0.80 | %(d) | | | 0.74 | %(d) | | | 30 | % |
Year ended 12/31/16 | | | 33.84 | | | | 0.39 | | | | 3.07 | | | | 3.46 | | | | (0.28 | ) | | | (2.44 | ) | | | (2.72 | ) | | | 34.58 | | | | 10.26 | | | | 1,033,700 | | | | 0.84 | | | | 0.85 | | | | 1.11 | | | | 38 | |
Year ended 12/31/15 | | | 41.00 | | | | 0.32 | | | | (2.79 | ) | | | (2.47 | ) | | | (0.46 | ) | | | (4.23 | ) | | | (4.69 | ) | | | 33.84 | | | | (5.75 | ) | | | 921,516 | | | | 0.89 | | | | 0.90 | | | | 0.81 | | | | 45 | |
Year ended 12/31/14 | | | 38.43 | | | | 0.40 | | | | 2.72 | | | | 3.12 | | | | (0.35 | ) | | | (0.20 | ) | | | (0.55 | ) | | | 41.00 | | | | 8.12 | | | | 1,096,219 | | | | 0.88 | | | | 0.90 | | | | 1.01 | | | | 35 | |
Year ended 12/31/13 | | | 30.14 | | | | 0.31 | | | | 8.47 | | | | 8.78 | | | | (0.49 | ) | | | — | | | | (0.49 | ) | | | 38.43 | | | | 29.25 | | | | 1,167,023 | | | | 0.88 | | | | 0.90 | | | | 0.89 | | | | 25 | |
Series II | | | | | | | | | | | | | | | | | | | | | | | | | | | | | | | | | | | | | | | | | | | | | | | | | | | | | | | | |
Year ended 12/31/17 | | | 34.11 | | | | 0.18 | | | | 4.14 | | | | 4.32 | | | | (0.30 | ) | | | (1.95 | ) | | | (2.25 | ) | | | 36.18 | | | | 12.87 | | | | 189,982 | | | | 1.04 | (d) | | | 1.05 | (d) | | | 0.49 | (d) | | | 30 | |
Year ended 12/31/16 | | | 33.40 | | | | 0.30 | | | | 3.03 | | | | 3.33 | | | | (0.18 | ) | | | (2.44 | ) | | | (2.62 | ) | | | 34.11 | | | | 10.02 | | | | 179,596 | | | | 1.09 | | | | 1.10 | | | | 0.86 | | | | 38 | |
Year ended 12/31/15 | | | 40.53 | | | | 0.22 | | | | (2.75 | ) | | | (2.53 | ) | | | (0.37 | ) | | | (4.23 | ) | | | (4.60 | ) | | | 33.40 | | | | (5.98 | ) | | | 178,126 | | | | 1.14 | | | | 1.15 | | | | 0.56 | | | | 45 | |
Year ended 12/31/14 | | | 38.03 | | | | 0.30 | | | | 2.67 | | | | 2.97 | | | | (0.27 | ) | | | (0.20 | ) | | | (0.47 | ) | | | 40.53 | | | | 7.82 | | | | 185,406 | | | | 1.13 | | | | 1.15 | | | | 0.76 | | | | 35 | |
Year ended 12/31/13 | | | 29.86 | | | | 0.22 | | | | 8.39 | | | | 8.61 | | | | (0.44 | ) | | | — | | | | (0.44 | ) | | | 38.03 | | | | 28.94 | | | | 158,700 | | | | 1.13 | | | | 1.15 | | | | 0.64 | | | | 25 | |
| (a) | Calculated using average shares outstanding. |
| (b) | Includes adjustments in accordance with accounting principles generally accepted in the United States of America and as such, the net asset value for financial reporting purposes and the returns based upon those net asset values may differ from the net asset value and returns for shareholder transactions. Total returns are not annualized for periods less than one year, if applicable, and do not reflect charges assessed in connection with a variable product, which if included would reduce total returns. |
| (c) | Portfolio turnover is calculated at the fund level and is not annualized for periods less than one year, if applicable. |
| (d) | Ratios are based on average daily net assets (000’s omitted) of $1,053,675 and $185,126 for Series I and Series II shares, respectively. |
Invesco V.I. Core Equity Fund
Report of Independent Registered Public Accounting Firm
To the Board of Trustees of AIM Variable Insurance Funds (Invesco Variable Insurance Funds)
and Shareholders of Invesco V.I. Core Equity Fund
Opinion on the Financial Statements
We have audited the accompanying statement of assets and liabilities, including the schedule of investments, of Invesco V.I. Core Equity Fund (one of the funds constituting AIM Variable Insurance Funds (Invesco Variable Insurance Funds), hereafter referred to as the “Fund”) as of December 31, 2017, the related statement of operations for the year ended December 31, 2017, the statement of changes in net assets for each of the two years in the period ended December 31, 2017, including the related notes, and the financial highlights for each of the five years in the period ended December 31, 2017 (collectively referred to as the “financial statements”). In our opinion, the financial statements present fairly, in all material respects, the financial position of the Fund as of December 31, 2017, the results of its operations for the year then ended, the changes in its net assets for each of the two years in the period ended December 31, 2017 and the financial highlights for each of the five years in the period ended December 31, 2017 in conformity with accounting principles generally accepted in the United States of America.
Basis for Opinion
These financial statements are the responsibility of the Fund’s management. Our responsibility is to express an opinion on the Fund’s financial statements based on our audits. We are a public accounting firm registered with the Public Company Accounting Oversight Board (United States) (“PCAOB”) and are required to be independent with respect to the Fund in accordance with the U.S. federal securities laws and the applicable rules and regulations of the Securities and Exchange Commission and the PCAOB.
We conducted our audits of these financial statements in accordance with the standards of the PCAOB. Those standards require that we plan and perform the audit to obtain reasonable assurance about whether the financial statements are free of material misstatement, whether due to error or fraud.
Our audits included performing procedures to assess the risks of material misstatement of the financial statements, whether due to error or fraud, and performing procedures that respond to those risks. Such procedures included examining, on a test basis, evidence regarding the amounts and disclosures in the financial statements. Our audits also included evaluating the accounting principles used and significant estimates made by management, as well as evaluating the overall presentation of the financial statements. Our procedures included confirmation of securities owned as of December 31, 2017 by correspondence with the custodian and transfer agent. We believe that our audits provide a reasonable basis for our opinion.
PricewaterhouseCoopers LLP
Houston, TX
February 14, 2018
We have served as the auditor of one or more of the investment companies in the Invesco/PowerShares group of investment companies since at least 1995. We have not determined the specific year we began serving as auditor.
Invesco V.I. Core Equity Fund
Calculating your ongoing Fund expenses
Example
As a shareholder of the Fund, you incur ongoing costs, including management fees; distribution and/or service fees (12b-1); and other Fund expenses. This example is intended to help you understand your ongoing costs (in dollars) of investing in the Fund and to compare these costs with ongoing costs of investing in other mutual funds. The example is based on an investment of $1,000 invested at the beginning of the period and held for the entire period July 1, 2017 through December 31, 2017.
The actual and hypothetical expenses in the examples below do not represent the effect of any fees or other expenses assessed in connection with a variable product; if they did, the expenses shown would be higher while the ending account values shown would be lower.
Actual expenses
The table below provides information about actual account values and actual expenses. You may use the information in this table, together with the amount you invested, to estimate the expenses that you paid over the period. Simply divide your account value by $1,000 (for example, an $8,600 account value divided by $1,000 = 8.6), then multiply the result by the number in the table under the heading entitled “Actual Expenses Paid During Period” to estimate the expenses you paid on your account during this period.
Hypothetical example for comparison purposes
The table below also provides information about hypothetical account values and hypothetical expenses based on the Fund’s actual expense ratio and an assumed rate of return of 5% per year before expenses, which is not the Fund’s actual return.
The hypothetical account values and expenses may not be used to estimate the actual ending account balance or expenses you paid for the period. You may use this information to compare the ongoing costs of investing in the Fund and other funds. To do so, compare this 5% hypothetical example with the 5% hypothetical examples that appear in the shareholder reports of the other funds.
Please note that the expenses shown in the table are meant to highlight your ongoing costs. Therefore, the hypothetical information is useful in comparing ongoing costs, and will not help you determine the relative total costs of owning different funds.
| | | | | | | | | | | | | | | | | | | | | | | | |
| Class | | Beginning
Account Value
(07/01/17) | | | ACTUAL | | | HYPOTHETICAL
(5% annual return before
expenses) | | | Annualized
Expense
Ratio | |
| | | Ending
Account Value
(12/31/17)1 | | | Expenses
Paid During
Period2 | | | Ending
Account Value
(12/31/17) | | | Expenses
Paid During
Period2 | | |
Series I | | $ | 1,000.00 | | | $ | 1,050.00 | | | $ | 4.03 | | | $ | 1,021.27 | | | $ | 3.97 | | | | 0.78 | % |
Series II | | | 1,000.00 | | | | 1,048.90 | | | | 5.32 | | | | 1,020.01 | | | | 5.24 | | | | 1.03 | |
| 1 | The actual ending account value is based on the actual total return of the Fund for the period July 1, 2017 through December 31, 2017, after actual expenses and will differ from the hypothetical ending account value which is based on the Fund’s expense ratio and a hypothetical annual return of 5% before expenses. |
| 2 | Expenses are equal to the Fund’s annualized expense ratio as indicated above multiplied by the average account value over the period, multiplied by 184/365 to reflect the most recent fiscal half year. |
Invesco V.I. Core Equity Fund
Tax Information
Form 1099-DIV, Form 1042-S and other year–end tax information provide shareholders with actual calendar year amounts that should be included in their tax returns. Shareholders should consult their tax advisors.
The following distribution information is being provided as required by the Internal Revenue Code or to meet a specific state’s requirement.
The Fund designates the following amounts or, if subsequently determined to be different, the maximum amount allowable for its fiscal year ended December 31, 2017:
| | | | |
Federal and State Income Tax | |
Long-Term Capital Gain Distributions | | $ | 62,398,103 | |
Corporate Dividends Received Deduction* | | | 100.00 | % |
U.S. Treasury Obligations* | | | 0.00 | % |
| | * | The above percentages are based on ordinary income dividends paid to shareholders during the Fund’s fiscal year. |
Invesco V.I. Core Equity Fund
Trustees and Officers
The address of each trustee and officer is AIM Variable Insurance Funds (Invesco Variable Insurance Funds) (the “Trust”), 11 Greenway Plaza, Suite 1000, Houston, Texas 77046-1173. The trustees serve for the life of the Trust, subject to their earlier death, incapacitation, resignation, retirement or removal as more specifically provided in the Trust’s organizational documents. Each officer serves for a one year term or until their successors are elected and qualified. Column two below includes length of time served with predecessor entities, if any.
| | | | | | | | |
Name, Year of Birth and
Position(s) Held with the Trust | | Trustee and/
or Officer Since | | Principal Occupation(s)
During Past 5 Years | | Number of
Funds in Fund
Complex
Overseen by
Trustee | | Other Directorship(s)
Held by Trustee During
Past 5 Years |
| Interested Persons | | | | | | | | |
Martin L. Flanagan1 — 1960 Trustee | | 2007 | | Executive Director, Chief Executive Officer and President, Invesco Ltd. (ultimate parent of Invesco and a global investment management firm); Trustee, The Invesco Funds; Vice Chair, Investment Company Institute; and Member of Executive Board, SMU Cox School of Business Formerly: Advisor to the Board, Invesco Advisers, Inc. (formerly known as Invesco Institutional (N.A.), Inc.); Chairman and Chief Executive Officer, Invesco Advisers, Inc. (registered investment adviser); Director, Chairman, Chief Executive Officer and President, Invesco Holding Company (US), Inc. (formerly IVZ Inc.) (holding company), Invesco Group Services, Inc. (service provider) and Invesco North American Holdings, Inc. (holding company); Director, Chief Executive Officer and President, Invesco Holding Company Limited (parent of Invesco and a global investment management firm); Director, Invesco Ltd.; Chairman, Investment Company Institute and President, Co-Chief Executive Officer, Co-President, Chief Operating Officer and Chief Financial Officer, Franklin Resources, Inc. (global investment management organization) | | 158 | | None |
Philip A. Taylor2 — 1954 Trustee and Senior Vice President | | 2006 | | Head of the Americas and Senior Managing Director, Invesco Ltd.; Director, Invesco Advisers, Inc. (formerly known as Invesco Institutional (N.A.), Inc.) (registered investment adviser); Director, Chairman, Chief Executive Officer and President, Invesco Management Group, Inc. (formerly known as Invesco Aim Management Group, Inc.) (financial services holding company); Director and Chairman, Invesco Investment Services, Inc. (formerly known as Invesco Aim Investment Services, Inc.) (registered transfer agent); Chief Executive Officer, Invesco Corporate Class Inc. (corporate mutual fund company); Director, Chairman and Chief Executive Officer, Invesco Canada Ltd. (formerly known as Invesco Trimark Ltd./Invesco Trimark Ltèe) (registered investment adviser and registered transfer agent); Trustee and Senior Vice President, The Invesco Funds; Director, Invesco Investment Advisers LLC (formerly known as Van Kampen Asset Management). Formerly: Co-Chairman, Co-President and Co-Chief Executive Officer, Invesco Advisers, Inc. (formerly known as Invesco Institutional (N.A.), Inc.) (registered investment adviser); Director, Chief Executive Officer and President, Van Kampen Exchange Corp; President and Principal Executive Officer, The Invesco Funds (other than AIM Treasurer’s Series Trust (Invesco Treasurer’s Series Trust), Short-Term Investments Trust and Invesco Management Trust); Executive Vice President, The Invesco Funds (AIM Treasurer’s Series Trust (Invesco Treasurer’s Series Trust), Short-Term Investments Trust and Invesco Management Trust only); Director and President, INVESCO Funds Group, Inc. (registered investment adviser and registered transfer agent); Director and Chairman, IVZ Distributors, Inc. (formerly known as INVESCO Distributors, Inc.) (registered broker dealer); Director, President and Chairman, Invesco Inc. (holding company), Invesco Canada Holdings Inc. (holding company), Trimark Investments Ltd./Placements Trimark Ltèe and Invesco Financial Services Ltd/Services Financiers Invesco Ltèe; Chief Executive Officer, Invesco Canada Fund Inc. (corporate mutual fund company); Director and Chairman, Van Kampen Investor Services Inc.; Director, Chief Executive Officer and President, 1371 Preferred Inc. (holding company) and Van Kampen Investments Inc.; Director and President, AIM GP Canada Inc. (general partner for limited partnerships) and Van Kampen Advisors, Inc.; Director and Chief Executive Officer, Invesco Trimark Dealer Inc. (registered broker dealer); Director, Invesco Distributors, Inc. (formerly known as Invesco Aim Distributors, Inc.) (registered broker dealer); Manager, Invesco PowerShares Capital Management LLC; Director, Chief Executive Officer and President, Invesco Advisers, Inc.; Director, Chairman, Chief Executive Officer and President, Invesco Aim Capital Management, Inc.; President, Invesco Trimark Dealer Inc. and Invesco Trimark Ltd./Invesco Trimark Ltèe; Director and President, AIM Trimark Corporate Class Inc. and AIM Trimark Canada Fund Inc.; Senior Managing Director, Invesco Holding Company Limited; Director and Chairman, Fund Management Company (former registered broker dealer); President and Principal Executive Officer, The Invesco Funds (AIM Treasurer’s Series Trust (Invesco Treasurer’s Series Trust), and Short-Term Investments Trust only); President, AIM Trimark Global Fund Inc. and AIM Trimark Canada Fund Inc. | | 158 | | None |
| 1 | Mr. Flanagan is considered an interested person (within the meaning of Section 2(a)(19) of the 1940 Act) of the Trust because he is an officer of the Adviser to the Trust, and an officer and a director of Invesco Ltd., ultimate parent of the Adviser. |
| 2 | Mr. Taylor is considered an interested person (within the meaning of Section 2(a)(19) of the 1940 Act) of the Trust because he is an officer and a director of the Adviser. |
Invesco V.I. Core Equity Fund
Trustees and Officers—(continued)
| | | | | | | | |
Name, Year of Birth and
Position(s) Held with the Trust | | Trustee and/
or Officer Since | | Principal Occupation(s)
During Past 5 Years | | Number of
Funds in Fund
Complex
Overseen by
Trustee | | Other Directorship(s)
Held by Trustee During
Past 5 Years |
| Independent Trustees | | | | | | | | |
Bruce L. Crockett — 1944 Trustee and Chair | | 1993 | | Chairman, Crockett Technologies Associates (technology consulting company) Formerly: Director, Captaris (unified messaging provider); Director, President and Chief Executive Officer, COMSAT Corporation; Chairman, Board of Governors of INTELSAT (international communications company); ACE Limited (insurance company); Independent Directors Council and Investment Company Institute: Member of the Audit Committee, Investment Company Institute; Member of the Executive Committee and Chair of the Governance Committee, Independent Directors Council | | 158 | | Director and Chairman of the Audit Committee, ALPS (Attorneys Liability Protection Society) (insurance company); Director and Member of the Audit Committee and Compensation Committee, Ferroglobe PLC (metallurgical company) |
David C. Arch — 1945 Trustee | | 2010 | | Chairman of Blistex Inc. (consumer health care products manufacturer); Member, World Presidents’ Organization | | 158 | | Board member of the Illinois Manufacturers’ Association |
Jack M. Fields — 1952 Trustee | | 1997 | | Chief Executive Officer, Twenty First Century Group, Inc. (government affairs company); and Chairman, Discovery Learning Alliance (non-profit) Formerly: Owner and Chief Executive Officer, Dos Angeles Ranch L.P. (cattle, hunting, corporate entertainment); Director, Insperity, Inc. (formerly known as Administaff) (human resources provider); Chief Executive Officer, Texana Timber LP (sustainable forestry company); Director of Cross Timbers Quail Research Ranch (non-profit); and member of the U.S. House of Representatives | | 158 | | None |
Cynthia Hostetler — 1962 Trustee | | 2017 | | Non-Executive Director and Trustee of a number of public and private business corporations Formerly: Head of Investment Funds and Private Equity, Overseas Private Investment Corporation; President, First Manhattan Bancorporation, Inc.; Attorney, Simpson Thacher & Bartlett LLP | | 158 | | Vulcan Materials Company (construction materials company); Trilinc Global Impact Fund; Aberdeen Investment Funds (4 portfolios); Artio Global Investment LLC (mutual fund complex); Edgen Group, Inc. (specialized energy and infrastructure products distributor) |
Eli Jones — 1961 Trustee | | 2016 | | Professor and Dean, Mays Business School — Texas A&M University Formerly: Professor and Dean, Walton College of Business, University of Arkansas and E.J. Ourso College of Business, Louisiana State University; Director, Arvest Bank | | 158 | | Insperity, Inc. (formerly known as Administaff) (human resources provider) |
Prema Mathai-Davis — 1950 Trustee | | 1998 | | Retired. | | 158 | | None |
Teresa M. Ressel — 1962 Trustee | | 2017 | | Non-executive director and trustee of a number of public and private business corporations Formerly: Chief Financial Officer, Olayan America, The Olayan Group (international investor/commercial/industrial); Chief Executive Officer, UBS Securities LLC; Group Chief Operating Officer, Americas, UBS AG; Assistant Secretary for Management & Budget and CFO, US Department of the Treasury | | 158 | | Atlantic Power Corporation (power generation company); ON Semiconductor Corp. (semiconductor supplier) |
Ann Barnett Stern — 1957 Trustee | | 2017 | | President and Chief Executive Officer, Houston Endowment Inc. (private philanthropic institution) Formerly: Executive Vice President and General Counsel, Texas Children’s Hospital; Attorney, Beck, Redden and Secrest, LLP; Business Law Instructor, University of St. Thomas; Attorney, Andrews & Kurth LLP | | 158 | | Federal Reserve Bank of Dallas |
Raymond Stickel, Jr. — 1944 Trustee | | 2005 | | Retired. Formerly: Director, Mainstay VP Series Funds, Inc. (25 portfolios); Partner, Deloitte & Touche | | 158 | | None |
Robert C. Troccoli — 1949 Trustee | | 2016 | | Adjunct Professor, University of Denver — Daniels College of Business Formerly: Senior Partner, KPMG LLP | | 158 | | None |
Christopher L. Wilson — 1957 Trustee | | 2017 | | Non-executive director and trustee of a number of public and private business corporations Formerly: Managing Partner, CT2, LLC (investing and consulting firm); President/Chief Executive Officer, Columbia Funds, Bank of America Corporation; President/Chief Executive Officer, CDC IXIS Asset Management Services, Inc.; Principal & Director of Operations, Scudder Funds, Scudder, Stevens & Clark, Inc.; Assistant Vice President, Fidelity Investments | | 158 | | TD Asset Management USA Inc. (mutual fund complex) (22 portfolios); ISO New England, Inc. (non-profit organization managing regional electricity market) |
Invesco V.I. Core Equity Fund
Trustees and Officers—(continued)
| | | | | | | | |
Name, Year of Birth and
Position(s) Held with the Trust | | Trustee and/
or Officer Since | | Principal Occupation(s)
During Past 5 Years | | Number of
Funds in Fund
Complex
Overseen by
Trustee | | Other Directorship(s)
Held by Trustee During
Past 5 Years |
| Other Officers | | | | | | | | |
Sheri Morris — 1964 President, Principal Executive Officer and Treasurer | | 1999 | | President, Principal Executive Officer and Treasurer, The Invesco Funds; Vice President, Invesco Advisers, Inc. (formerly known as Invesco Institutional (N.A.), Inc.) (registered investment adviser); and Vice President, PowerShares Exchange-Traded Fund Trust, PowerShares Exchange-Traded Fund Trust II, PowerShares India Exchange-Traded Fund Trust, PowerShares Actively Managed Exchange-Traded Fund Trust, PowerShares Actively Managed Exchange-Traded Commodity Fund Trust and PowerShares Exchange-Traded Self-Indexed Fund Trust Formerly: Vice President and Principal Financial Officer, The Invesco Funds; Vice President, Invesco Aim Advisers, Inc., Invesco Aim Capital Management, Inc. and Invesco Aim Private Asset Management, Inc.; Assistant Vice President and Assistant Treasurer, The Invesco Funds and Assistant Vice President, Invesco Advisers, Inc., Invesco Aim Capital Management, Inc. and Invesco Aim Private Asset Management, Inc.; and Treasurer, PowerShares Exchange-Traded Fund Trust, PowerShares Exchange-Traded Fund Trust II, PowerShares India Exchange-Traded Fund Trust and PowerShares Actively Managed Exchange-Traded Fund Trust | | N/A | | N/A |
Russell C. Burk — 1958 Senior Vice President and Senior Officer | | 2005 | | Senior Vice President and Senior Officer, The Invesco Funds | | N/A | | N/A |
John M. Zerr — 1962 Senior Vice President, Chief Legal Officer and Secretary | | 2006 | | Director, Senior Vice President, Secretary and General Counsel, Invesco Management Group, Inc. (formerly known as Invesco AIM Management Group, Inc.); Senior Vice President, Invesco Advisers, Inc. (formerly known as Invesco Institutional (N.A.), Inc.) (registered investment adviser); Senior Vice President and Secretary, Invesco Distributors, Inc. (formerly known as Invesco AIM Distributors, Inc.); Director, Vice President and Secretary, Invesco Investment Services, Inc. (formerly known as Invesco AIM Investment Services, Inc.) Senior Vice President, Chief Legal Officer and Secretary, The Invesco Funds; Managing Director, Invesco PowerShares Capital Management LLC; Director, Secretary and General Counsel, Invesco Investment Advisers LLC (formerly known as Van Kampen Asset Management); Secretary and General Counsel, Invesco Capital Markets, Inc. (formerly known as Van Kampen Funds Inc.) and Chief Legal Officer, PowerShares Exchange-Traded Fund Trust, PowerShares Exchange-Traded Fund Trust II, PowerShares India Exchange-Traded Fund Trust, PowerShares Actively Managed Exchange-Traded Fund Trust, PowerShares Actively Managed Exchange-Traded Commodity Fund Trust and PowerShares Exchange-Traded Self-Indexed Fund Trust; Manager and Secretary, Invesco Indexing LLC Formerly: Director, Secretary, General Counsel and Senior Vice President, Van Kampen Exchange Corp.; Director, Vice President and Secretary, IVZ Distributors, Inc. (formerly known as INVESCO Distributors, Inc.); Director and Vice President, INVESCO Funds Group, Inc.; Director and Vice President, Van Kampen Advisors Inc.; Director, Vice President, Secretary and General Counsel, Van Kampen Investor Services Inc.; Director, Invesco Distributors, Inc. (formerly known as Invesco AIM Distributors, Inc.); Director, Senior Vice President, General Counsel and Secretary, Invesco AIM Advisers, Inc. and Van Kampen Investments Inc.; Director, Vice President and Secretary, Fund Management Company; Director, Senior Vice President, Secretary, General Counsel and Vice President, Invesco AIM Capital Management, Inc.; Chief Operating Officer and General Counsel, Liberty Ridge Capital, Inc. (an investment adviser); Vice President and Secretary, PBHG Funds (an investment company) and PBHG Insurance Series Fund (an investment company); Chief Operating Officer, General Counsel and Secretary, Old Mutual Investment Partners (a broker-dealer); General Counsel and Secretary, Old Mutual Fund Services (an administrator) and Old Mutual Shareholder Services (a shareholder servicing center); Executive Vice President, General Counsel and Secretary, Old Mutual Capital, Inc. (an investment adviser); and Vice President and Secretary, Old Mutual Advisors Funds (an investment company) | | N/A | | N/A |
Gregory G. McGreevey — 1962 Senior Vice President | | 2012 | | Senior Managing Director, Invesco Ltd.; Director, Chairman, President, and Chief Executive Officer, Invesco Advisers, Inc. (formerly known as Invesco Institutional (N.A.), Inc.) (registered investment adviser); Senior Vice President, Invesco Management Group, Inc.; Director, Invesco Mortgage Capital, Inc. and Invesco Senior Secured Management, Inc.; and Senior Vice President, The Invesco Funds Formerly: Assistant Vice President, The Invesco Funds | | N/A | | N/A |
Kelli Gallegos — 1970 Vice President, Principal Financial Officer and Assistant Treasurer | | 2008 | | Vice President, Principal Financial Officer and Assistant Treasurer, The Invesco Funds; Assistant Treasurer, Invesco PowerShares Capital Management LLC, PowerShares Exchange-Traded Fund Trust, PowerShares Exchange-Traded Fund Trust II, PowerShares India Exchange-Traded Fund Trust, PowerShares Actively Managed Exchange-Traded Fund Trust, PowerShares Actively Managed Exchange-Traded Commodity Fund Trust and PowerShares Exchange-Traded Self-Indexed Fund Trust Formerly: Assistant Vice President, The Invesco Funds | | N/A | | N/A |
Invesco V.I. Core Equity Fund
Trustees and Officers—(continued)
| | | | | | | | |
Name, Year of Birth and
Position(s) Held with the Trust | | Trustee and/
or Officer Since | | Principal Occupation(s)
During Past 5 Years | | Number of
Funds in Fund
Complex
Overseen by
Trustee | | Other Directorship(s)
Held by Trustee During
Past 5 Years |
| Other Officers—(continued) | | | | | | | | |
Tracy Sullivan — 1962 Vice President, Chief Tax Officer and Assistant Treasurer | | 2008 | | Vice President, Chief Tax Officer and Assistant Treasurer, The Invesco Funds; Assistant Treasurer, Invesco PowerShares Capital Management LLC, PowerShares Exchange-Traded Fund Trust, PowerShares Exchange-Traded Fund Trust II, PowerShares India Exchange-Traded Fund Trust, PowerShares Actively Managed Exchange-Traded Fund Trust, PowerShares Actively Managed Exchange-Traded Commodity Fund Trust and PowerShares Exchange-Traded Self-Indexed Fund Trust Formerly: Assistant Vice President, The Invesco Funds | | N/A | | N/A |
Crissie M. Wisdom — 1969 Anti-Money Laundering Compliance Officer | | 2013 | | Anti-Money Laundering Compliance Officer, Invesco Advisers, Inc. (formerly known as Invesco Institutional (N.A.), Inc.) (registered investment adviser), Invesco Capital Markets, Inc. (formerly known as Van Kampen Funds Inc.), Invesco Distributors, Inc., Invesco Investment Services, Inc., Invesco Management Group, Inc., The Invesco Funds, and PowerShares Exchange-Traded Fund Trust, PowerShares Exchange-Traded Fund Trust II, PowerShares India Exchange-Traded Fund Trust, PowerShares Actively Managed Exchange-Traded Fund Trust, PowerShares Actively Managed Exchange-Traded Commodity Fund Trust and PowerShares Exchange-Traded Self-Indexed Fund Trust; Anti-Money Laundering Compliance Officer and Bank Secrecy Act Officer, INVESCO National Trust Company and Invesco Trust Company; and Fraud Prevention Manager and Controls and Risk Analysis Manager for Invesco Investment Services, Inc. Formerly: Anti-Money Laundering Compliance Officer, Van Kampen Exchange Corp. | | N/A | | N/A |
Robert R. Leveille — 1969 Chief Compliance Officer | | 2016 | | Chief Compliance Officer, Invesco Advisers, Inc. (registered investment adviser); and Chief Compliance Officer, The Invesco Funds Formerly: Chief Compliance Officer, Putnam Investments and the Putnam Funds | | N/A | | N/A |
The Statement of Additional Information of the Trust includes additional information about the Fund’s Trustees and is available upon request, without charge, by calling 1.800.959.4246. Please refer to the Fund’s Statement of Additional Information for information on the Fund’s sub-advisers.
| | | | | | |
Office of the Fund 11 Greenway Plaza, Suite 1000 Houston, TX 77046-1173 | | Investment Adviser Invesco Advisers, Inc. 1555 Peachtree Street, N.E. Atlanta, GA 30309 | | Distributor Invesco Distributors, Inc. 11 Greenway Plaza, Suite 1000 Houston, TX 77046-1173 | | Auditors PricewaterhouseCoopers LLP 1000 Louisiana Street, Suite 5800 Houston, TX 77002-5678 |
| | | |
| | | | | | |
Counsel to the Fund Stradley Ronon Stevens & Young, LLP 2005 Market Street, Suite 2600 Philadelphia, PA 19103-7018 | | Counsel to the Independent Trustees Goodwin Procter LLP 901 New York Avenue, N.W. Washington, D.C. 20001 | | Transfer Agent Invesco Investment Services, Inc. 11 Greenway Plaza, Suite 1000 Houston, TX 77046-1173 | | Custodian State Street Bank and Trust Company 225 Franklin Street Boston, MA 02110-2801 |
Invesco V.I. Core Equity Fund
| | | | |
| | |
 | | Annual Report to Shareholders | | December 31, 2017 |
| | |
| | Invesco V.I. Core Plus Bond Fund |

| | |
| | The Fund provides a complete list of its holdings four times in each fiscal year, at the quarter-ends. For the second and fourth quarters, the lists appear in the Fund’s semiannual and annual reports to shareholders. For the first and third quarters, the Fund files the lists with the Securities and Exchange Commission (SEC) on Form N-Q. The Fund’s Form N-Q filings are available on the SEC website, sec.gov. Copies of the Fund’s Forms N-Q may be reviewed and copied at the SEC Public Reference Room in Washington, D.C. You can obtain information on the operation of the Public Reference Room, including information about duplicating fee charges, by calling 202 551 8090 or 800 732 0330, or by electronic request at the following email address: publicinfo@sec.gov. The SEC file numbers for the Fund are 811-07452 and 033-57340. The Fund’s most recent portfolio holdings, as filed on Form N-Q, have also been made available to insurance companies issuing variable annuity contracts and variable life insurance policies (“variable products”) that invest in the Fund. A description of the policies and procedures that the Fund uses to determine how to vote proxies relating to portfolio securities is available without charge, upon request, from our Client Services department at 800 959 4246 or at invesco.com/proxyguidelines. The information is also available on the SEC website, sec.gov. Information regarding how the Fund voted proxies related to its portfolio securities during the most recent 12-month period ended June 30 is available at invesco.com/ proxysearch. The information is also available on the SEC website, sec.gov. Invesco Advisers, Inc. is an investment adviser; it provides investment advisory services to individual and institutional clients and does not sell securities. Invesco Distributors, Inc. is the US distributor for Invesco Ltd.’s retail mutual funds, exchange-traded funds and institutional money market funds. Both are wholly owned, indirect subsidiaries of Invesco Ltd. This report must be accompanied or preceded by a currently effective Fund prospectus and variable product prospectus, which contain more complete information, including sales charges and expenses. Investors should read each carefully before investing. NOT FDIC INSURED | MAY LOSE VALUE | NO BANK GUARANTEE |
| |
| | Invesco Distributors, Inc. VICPB-AR-1 02122018 1547 |
Management’s Discussion of Fund Performance
Performance summary
For the year ended December 31, 2017, Series I shares of Invesco V.I. Core Plus Bond Fund (the Fund), outperformed the Fund’s broad market/style-specific index, the Bloomberg Barclays U.S. Aggregate Bond Index.
Your Fund’s long-term performance appears later in this report.
Fund vs. Indexes
Total returns, 12/31/16 to 12/31/17, excluding variable product issuer charges.
If variable product issuer charges were included, returns would be lower.
| | | | | |
| Series I Shares | | | | 6.34 | % |
| Series II Shares | | | | 6.06 | |
| Bloomberg Barclays U.S. Aggregate Bond Index▼ (Broad Market/Style-Specific Index) | | | | 3.54 | |
| Lipper VUF Core Plus Bond Funds Index∎ (Peer Group Index) | | | | 4.24 | |
Source(s): ▼FactSet Research Systems Inc.; ∎Lipper Inc. | | | | | |
Market conditions and your Fund
For the year ended December 31, 2017, US bond returns were positive across fixed income indexes, primarily driven by strong macroeconomic conditions, muted market volatility and global investor demand for yield. The US Federal Reserve (the Fed) raised the fed funds rate to a range of 1.25% to 1.50% in December 2017, highlighting the ongoing positive health of the US economy, with low unemployment and moderate economic growth.1 This was the Fed’s third 0.25% rate hike in 2017, and further hikes are expected in 2018.1 A benign inflation outlook dampened long-term interest rates as the yield curve flattened, benefiting investors invested in longer maturity securities. In addition, the benign inflation environment allowed the Fed to remain less aggressive with rate hikes. As proxies for interest rate movements, the two-year Treasury yield rose from 1.20% to 1.89% during the year.1 In contrast, the 10-year Treasury yield fell from 2.45% to 2.40%, and the 30-year Treasury yield fell from 3.06% to 2.74%.1
The US corporate credit sector remained a key contributor to excess return for the year, with lower-rated investment grade securities outperforming higher-
rated credits and comparable-maturity Treasuries. Corporate debt issuance was roughly $1.632 trillion2 for the year, yet spread premiums grinded tighter as supply declined at various points during the year, driven by persistent demand. Tax cut legislation enacted in December 2017 included significant corporate tax reductions that were an additional catalyst for the positive tone in the credit market. The high yield sector also benefited from strong demand during the year, despite lofty valuations. Within structured securities, commercial mortgage-backed securities (MBS) were the primary outperformers, with asset-backed securities also performing well in the midst of higher short-term interest rates. Agency MBS also outperformed comparable maturity Treasuries on a relative basis for the year, even as the Fed began to systematically de-lever its MBS and Treasury holdings.
The US investment grade bond market, as represented by the Bloomberg Barclays U.S. Aggregate Bond Index, returned 3.54% for the year. This was largely attributable to income (bond coupon payments) of underlying debt, as well as the outperformance of credit-related fixed income sectors relative to Treasuries.
All fixed income sectors (Treasuries, government-related, corporate and securitized) posted positive returns for the year. The Fund’s out-of-index exposure, such as high yield and emerging market (EM) debt, provided strong gains for the Fund despite the specter of additional Fed interest rate hikes. Helping to support returns in high yield and EM debt were accommodative global central bank policies and signs of recovery in various EM economies.
The Fund generated positive returns for the year and outperformed its broad market/style-specific benchmark, the Bloomberg Barclays U.S. Aggregate Bond Index. The Fund’s overweight allocations to corporate credit benefited relative return. In addition, the Fund’s overweight exposure to lower-rated investment grade securities and its allocation to high yield securities enhanced relative results. The Fund also benefited from its exposure to non-agency MBS and EM corporate securities. However, the Fund’s underweight allocation to the agency MBS sector was a detractor from relative returns as the sector posted positive excess returns. The Fund’s slight overweight duration posture was also a detractor for the year, with the sharp upward movement in interest rates along the maturity spectrum.
The Fund benefited from incremental income earned from transactions in the highly liquid to-be-announced market for agency MBS for the year. Such transactions involve the Fund selling an agency MBS to a financial institution, with an agreement to repurchase a substantially similar security at an agreed upon price and date. Cash received by the Fund as a result of these repurchase transactions may be invested in short-term instruments, and the income from these investments, together with any additional fee income received from this activity, may generate income for the Fund.
| | |
| Portfolio Composition |
By security type | % of total net assets |
| | | | | |
| |
| Bonds & Notes | | | | 58.5% | |
| U.S. Government Sponsored Agency Mortgage-Backed Securities | | | | 14.3 | |
| Asset-Backed Securities | | | | 13.0 | |
| U.S. Treasury Securities | | | | 7.5 | |
| Preferred Stocks | | | | 1.0 | |
| Security Types Each Less Than 1% of Portfolio | | | | 0.6 | |
Money Market Funds Plus Other Assets Less Liabilities | | | | 5.1 | |
| | |
| Top Five Debt Issuers* |
% of total net assets |
| |
1. Federal National Mortgage Association | | 8.0% |
2. U.S. Treasury Notes | | 4.3 |
3. Federal Home Loan Mortgage Corp. | | 3.2 |
4. Government National Mortgage Association | | 2.8 |
5. Moody’s Corp. | | 1.7 |
| | |
| Total Net Assets | | $20.4 million |
| |
| Total Number of Holdings* | | 495 |
The Fund’s holdings are subject to change, and there is no assurance that the Fund will continue to hold any particular security.
*Excluding money market fund holdings.
Data presented here are as of December 31, 2017.
Invesco V.I. Core Plus Bond Fund
The Fund also may use active duration and yield curve positioning for risk management and for generating excess return versus its broad market/style-specific benchmark. Duration measures a portfolio’s price sensitivity to interest rate changes. Yield curve positioning refers to actively emphasizing particular points (maturities) along the yield curve with favorable risk-return expectations. Duration of the portfolio was maintained close to that of the Fund’s broad market/style-specific benchmark, on average, and the timing of changes and the degree of variance from the benchmark during the reporting period detracted modestly from relative returns. Buying and selling US Treasury futures and interest rate swaptions were important tools used during the reporting period for the management of interest rate risk and to maintain the Fund’s targeted portfolio duration.
Part of the Fund’s strategy to manage credit and currency risk in the portfolio during the reporting period entailed purchasing and selling credit and currency derivatives. We managed credit market risk by purchasing and selling protection through credit default swaps at various points throughout the year. Currency management was carried out via currency forwards and options on an as-needed basis and was effective in managing the currency positioning within the Fund during the year.
We wish to remind you that the Fund is subject to interest rate risk, meaning when interest rates rise, the value of fixed income securities tends to fall. The risk may be greater in the current market environment because interest rates are at or near historic lows. The degree to which the value of fixed income securities may decline due to rising interest rates may vary depending on the speed and magnitude of the increase in interest rates, as well as individual security characteristics such as price, maturity, duration and coupon and market forces such as supply and demand for similar securities. We are monitoring interest rates, and the market, economic and geopolitical factors that may impact the direction, speed and magnitude of changes to interest rates across the maturity spectrum, including the potential impact of monetary policy
changes by the Fed and certain foreign central banks. If interest rates rise, markets may experience increased volatility, which may affect the value and/ or liquidity of certain of the Fund’s investments.
Thank you for investing in Invesco V.I. Core Plus Bond Fund and for sharing our long-term investment horizon.
| 1 | Source: US Federal Reserve |
The views and opinions expressed in management’s discussion of Fund performance are those of Invesco Advisers, Inc. These views and opinions are subject to change at any time based on factors such as market and economic conditions. These views and opinions may not be relied upon as investment advice or recommendations, or as an offer for a particular security. The information is not a complete analysis of every aspect of any market, country, industry, security or the Fund. Statements of fact are from sources considered reliable, but Invesco Advisers, Inc. makes no representation or warranty as to their completeness or accuracy. Although historical performance is no guarantee of future results, these insights may help you understand our investment management philosophy.
See important Fund and, if applicable, index disclosures later in this report.
| | |
 | | Matt Brill Chartered Financial Analyst, Portfolio Manager, is manager of Invesco V.I. Core Plus Bond Fund. He |
| joined Invesco in 2013. Mr. Brill earned a BA in economics from Washington and Lee University. |
| | |
 | | Chuck Burge Portfolio Manager, is manager of Invesco V.I. Core Plus Bond Fund. He joined Invesco in 2002. Mr. Burge earned a BS |
| in economics from Texas A&M University and an MBA in finance and accounting from Rice University. |
| | |
 | | Michael Hyman Portfolio Manager, is manager of Invesco V.I. Core Plus Bond Fund. He joined Invesco in 2013. Mr. Hyman earned a BSE |
| in finance from Pennsylvania State University and an MBA from the Stern School of Business at New York University. |
| | |
 | | Joseph Portera Portfolio Manager, is manager of Invesco V.I. Core Plus Bond Fund. He joined Invesco in 2012. Mr. Portera earned BA |
| and MA degrees in Soviet studies and an MA in international political economy and development from Fordham University. |
| | |
 | | Rashique Rahman Portfolio Manager, is manager of Invesco V.I. Core Plus Bond Fund. Mr. Rahman is the Head of Emerging Markets for |
| Invesco Fixed Income. He joined Invesco in 2014. Mr. Rahman did undergraduate work at the University of California, Los Angeles, and earned an MA and an MBA from Columbia University. |
| | |
 | | Scott Roberts Chartered Financial Analyst, Portfolio Manager, is manager of Invesco V.I. Core Plus Bond Fund. He joined |
| Invesco in 2000. Mr. Roberts earned a BBA in finance from the University of Houston. |
| | |
 | | Robert Waldner Chartered Financial Analyst, Portfolio Manager, is manager of Invesco V.I. Core Plus Bond Fund. He joined |
| Invesco in 2013. Mr. Waldner earned a BSE degree in civil engineering from Princeton University. |
Invesco V.I. Core Plus Bond Fund
Your Fund’s Long-Term Performance
Results of a $10,000 Investment – Oldest Share Class(es)
Fund and index data from 12/31/07
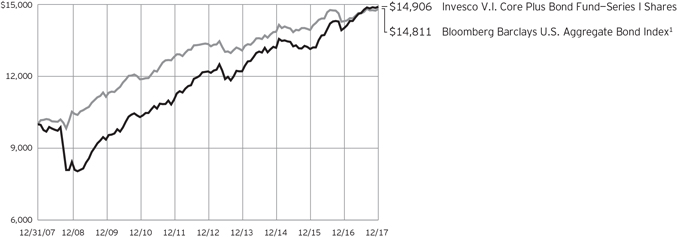
| 1 | Source: FactSet Research Systems Inc. |
Past performance cannot guarantee comparable future results.
The Lipper VUF Core Plus Bond Fund Index is not shown on the chart as the index does not have 10 years of performance history.
| | | | | |
| Average Annual Total Returns |
As of 12/31/17 | | | | | |
| |
| Series I Shares | | | | | |
| Inception (5/5/93) | | | | 4.45 | % |
| 10 Years | | | | 4.07 | |
| 5 Years | | | | 4.08 | |
| 1 Year | | | | 6.34 | |
| |
| Series II Shares | | | | | |
| Inception (3/14/02) | | | | 4.04 | % |
| 10 Years | | | | 3.80 | |
| 5 Years | | | | 3.81 | |
| 1 Year | | | | 6.06 | |
The performance of the Fund’s Series I and Series II share classes will differ primarily due to different class expenses.
The performance data quoted represent past performance and cannot guarantee comparable future results; current performance may be lower or higher. Please contact your variable product issuer or financial adviser for the most recent month-end variable product performance. Performance figures reflect Fund expenses, reinvested distributions and changes in net asset value. Investment return and principal value will fluctuate so that you may have a gain or loss when you sell shares.
The net annual Fund operating expense ratio set forth in the most
recent Fund prospectus as of the date of this report for Series I and Series II shares was 0.61% and 0.86%, respectively.1,2 The total annual Fund operating expense ratio set forth in the most recent Fund prospectus as of the date of this report for Series I and Series II shares was 1.74% and 1.99%, respectively. The expense ratios presented above may vary from the expense ratios presented in other sections of this report that are based on expenses incurred during the period covered by this report.
Invesco V.I. Core Plus Bond Fund, a series portfolio of AIM Variable Insurance Funds (Invesco Variable Insurance Funds), is currently offered through insurance companies issuing variable products. You cannot purchase shares of the Fund directly. Performance figures given represent the Fund and are not intended to reflect actual variable product values. They do not reflect sales charges, expenses and fees assessed in connection with a variable product. Sales charges, expenses and fees, which are determined by the variable product issuers, will vary and will lower the total return.
The most recent month-end performance at the Fund level, excluding variable product charges, is available at 800 451 4246. As mentioned above,
for the most recent month-end performance including variable product charges, please contact your variable product issuer or financial adviser.
Fund performance reflects any applicable fee waivers and/or expense reimbursements. Had the adviser not waived fees and/or reimbursed expenses currently or in the past, returns would have been lower. See current prospectus for more information.
| 1 | Total annual Fund operating expenses after any contractual fee waivers and/or expense reimbursements by the adviser in effect through at least April 30, 2019. See current prospectus for more information. |
| 2 | Total annual Fund operating expenses after any contractual fee waivers and/or expense reimbursements by the adviser in effect through at least June 30, 2019. See current prospectus for more information. |
Invesco V.I. Core Plus Bond Fund
Invesco V.I. Core Plus Bond Fund’s investment objective is total return, comprised of current income and capital appreciation.
| ∎ | | Unless otherwise stated, information presented in this report is as of December 31, 2017, and is based on total net assets. |
| ∎ | | Unless otherwise noted, all data provided by Invesco. |
Principal risks of investing in the Fund
Active trading risk. Active trading of portfolio securities may result in added expenses and a lower return.
Changing fixed income market conditions risk. The current low interest rate environment was created in part by the Federal Reserve Board (FRB) and certain foreign central banks keeping the federal funds and equivalent foreign rates near, at or below zero. Increases in the federal funds and equivalent foreign rates may expose fixed income markets to heightened volatility and reduced liquidity for certain fixed income investments, particularly those with longer maturities. In addition, decreases in fixed income dealer market-making capacity may also potentially lead to heightened volatility and reduced liquidity in the fixed income markets. As a result, the value of the Fund’s investments and share price may decline. Changes in central bank policies could also result in higher than normal shareholder redemptions, which could potentially increase portfolio turnover and the Fund’s transaction costs.
Collateralized loan obligations risk. CLOs are subject to the risks of substantial losses due to actual defaults by underlying borrowers, which will be greater during periods of economic or financial stress. CLOs may also lose value due to collateral defaults and disappearance of subordinate tranches, market anticipation of defaults, and investor aversion to CLO securities as a class. The risks of CLOs will be greater if the Fund invests in CLOs that hold loans of uncreditworthy borrowers or if the Fund holds subordinate tranches of the CLO that absorbs losses from the defaults before senior tranches. In addition, CLOs are subject to interest rate risk and credit risk.
Debt securities risk. The prices of debt securities held by the Fund will be affected by changes in interest rates, the creditworthiness of the issuer and other factors. An increase in prevailing interest rates typically causes the value of existing debt securities to fall and often has a greater impact on longer-duration debt securities and higher quality debt securities. Falling interest
rates will cause the Fund to reinvest the proceeds of debt securities that have been repaid by the issuer at lower interest rates. Falling interest rates may also reduce the Fund’s distributable income because interest payments on floating rate debt instruments held by the Fund will decline. The Fund could lose money on investments in debt securities if the issuer or borrower fails to meet its obligations to make interest payments and/or to repay principal in a timely manner. Changes in an issuer’s financial strength, the market’s perception of such strength or in the credit rating of the issuer or the security may affect the value of debt securities. The Adviser’s credit analysis may fail to anticipate such changes, which could result in buying a debt security at an inopportune time or failing to sell a debt security in advance of a price decline or other credit event.
Derivatives risk. The value of a derivative instrument depends largely on (and is derived from) the value of an underlying security, currency, commodity, interest rate, index or other asset (each referred to as an underlying asset). In addition to risks relating to the underlying assets, the use of derivatives may include other, possibly greater, risks, including counterparty, leverage and liquidity risks. Counterparty risk is the risk that the counterparty to the derivative contract will default on its obligation to pay the Fund the amount owed or otherwise perform under the derivative contract. Derivatives create leverage risk because they do not require payment up front equal to the economic exposure created by owning the derivative. As a result, an adverse change in the value of the underlying asset could result in the Fund sustaining a loss that is substantially greater than the amount invested in the derivative, which may make the Fund’s returns more volatile and increase the risk of loss. Derivative instruments may also be less liquid than more traditional investments and the Fund may be unable to sell or close out its derivative positions at a desirable time or price. This risk may be more acute under adverse market conditions, during which the Fund may be most in need of liquidating its derivative positions. Derivatives may also be harder to value, less tax efficient and subject to changing government regulation that could impact the Fund’s ability to use certain derivatives or their cost. Also, derivatives used for hedging or to gain or limit exposure to a particular market segment may not provide the expected benefits,
particularly during adverse market conditions.
Emerging markets securities risk. Emerging markets (also referred to as developing markets) are generally subject to greater market volatility, political, social and economic instability, uncertain trading markets and more governmental limitations on foreign investment than more developed markets. In addition, companies operating in emerging markets may be subject to lower trading volume and greater price fluctuations than companies in more developed markets. Securities law and the enforcement of systems of taxation in many emerging market countries may change quickly and unpredictably. In addition, investments in emerging markets securities may also be subject to additional transaction costs, delays in settlement procedures, and lack of timely information.
Foreign government debt risk. Investments in foreign government debt securities (sometimes referred to as sovereign debt securities) involve certain risks in addition to those relating to foreign securities or debt securities generally. The issuer of the debt or the governmental authorities that control the repayment of the debt may be unable or unwilling to repay principal or interest when due in accordance with the terms of such debt, and the Fund may have limited recourse in the event of a default against the defaulting government. Without the approval of debt holders, some governmental debtors have in the past been able to reschedule or restructure their debt payments or declare moratoria on payments.
Foreign securities risk. The Fund’s foreign investments may be adversely affected by political and social instability, changes in economic or taxation policies, difficulty in enforcing obligations, decreased liquidity or increased volatility. Foreign investments also involve the risk of the possible seizure, nationalization or expropriation of the issuer or foreign deposits (in which the Fund could lose its entire investments in a certain market) and the possible adoption of foreign governmental restrictions such as exchange controls. Unless the Fund has hedged its foreign securities risk, foreign securities risk also involves the risk of negative foreign currency rate fluctuations, which may cause the value of securities denominated in such foreign currency (or other
Invesco V.I. Core Plus Bond Fund
instruments through which the Fund has exposure to foreign currencies) to decline in value. Currency exchange rates may fluctuate significantly over short periods of time. Currency hedging strategies, if used, are not always successful.
High yield debt securities (junk bond) risk. Investments in high yield debt securities (“junk bonds”) and other lower-rated securities will subject the Fund to substantial risk of loss. These securities are considered to be speculative with respect to the issuer’s ability to pay interest and principal when due, are more susceptible to default or decline in market value and are less liquid than investment grade debt securities. Prices of high yield debt securities tend to be very volatile.
Liquidity risk. The Fund may be unable to sell illiquid investments at the time or price it desires and, as a result, could lose its entire investment in such investments. Liquid securities can become illiquid during periods of market stress. If a significant amount of the Fund’s securities become illiquid, the Fund may not be able to timely pay redemption proceeds and may need to sell securities at significantly reduced prices.
Management risk. The Fund is actively managed and depends heavily on the Adviser’s judgment about markets, interest rates or the attractiveness, relative values, liquidity, or potential appreciation of particular investments made for the Fund’s portfolio. The Fund could experience losses if these judgments prove to be incorrect. Additionally, legislative, regulatory, or tax developments may adversely affect management of the Fund and, therefore, the ability of the Fund to achieve its investment objective.
Market risk. The market values of the Fund’s investments, and therefore the value of the Fund’s shares, will go up and down, sometimes rapidly or unpredictably. Market risk may affect a single issuer, industry or section of the economy, or it may affect the market as a whole. Individual stock prices tend to go up and down more dramatically than those of certain other types of investments, such as bonds. During a general downturn in the financial markets, multiple asset classes may decline in value. When markets perform well, there can be no assurance that specific investments held by the Fund will rise in value.
Mortgage- and asset-backed securities risk. Mortgage- and asset-backed securities, including collateralized debt obligations and collateralized mortgage obligations, are subject to prepayment or call
risk, which is the risk that a borrower’s payments may be received earlier or later than expected due to changes in prepayment rates on underlying loans. This could result in the Fund reinvesting these early payments at lower interest rates, thereby reducing the Fund’s income. Mortgage- and asset-backed securities also are subject to extension risk, which is the risk that an unexpected rise in interest rates could reduce the rate of prepayments, causing the price of the mortgage- and asset-backed securities and the Fund’s share price to fall. An unexpectedly high rate of defaults on the mortgages held by a mortgage pool may adversely affect the value of mortgage-backed securities and could result in losses to the Fund. The Fund may invest in mortgage pools that include subprime mortgages, which are loans made to borrowers with weakened credit histories or with lower capacity to make timely payments on their mortgages. Privately issued mortgage-related securities are not subject to the same underwriting requirements as those with government or government-sponsored entity guarantees and, therefore, mortgage loans underlying privately issued mortgage-related securities may have less favorable collateral, credit risk or other underwriting characteristics, and wider variances in interest rate, term, size, purpose and borrower characteristics.
Municipal securities risk. The risk of a municipal obligation generally depends on the financial and credit status of the issuer. Constitutional amendments, legislative enactments, executive orders, administrative regulations, voter initiatives, and the issuer’s regional economic conditions may affect the municipal security’s value, interest payments, repayment of principal and the Fund’s ability to sell the security. Failure of a municipal security issuer to comply with applicable tax requirements may make income paid thereon taxable, resulting in a decline in the security’s value. In addition, there could be changes in applicable tax laws or tax treatments that reduce or eliminate the current federal income tax exemption on municipal securities or otherwise adversely affect the current federal or state tax status of municipal securities.
TBA transactions risk. TBA transactions involve the risk of loss if the securities received are less favorable than what was anticipated by the Fund when entering into the TBA transaction, or if the counterparty fails to deliver the securities. When the Fund enters into a short
sale of a TBA mortgage it does not own, the Fund may have to purchase deliverable mortgages to settle the short sale at a higher price than anticipated, thereby causing a loss. As there is no limit on how much the price of mortgage securities can increase, the Fund’s exposure is unlimited. The Fund may not always be able to purchase mortgage securities to close out the short position at a particular time or at an acceptable price. In addition, taking short positions results in a form of leverage, which could increase the volatility of the Fund’s share price.
US government obligations risk. Obligations of US government agencies and authorities receive varying levels of support and may not be backed by the full faith and credit of the US government, which could affect the Fund’s ability to recover should they default. No assurance can be given that the US government will provide financial support to its agencies and authorities if it is not obligated by law to do so.
When-issued, delayed delivery and forward commitment risks. When-issued and delayed delivery transactions subject the Fund to market risk because the value or yield of a security at delivery may be more or less than the purchase price or yield generally available when delivery occurs, and counterparty risk because the Fund relies on the buyer or seller, as the case may be, to consummate the transaction. These transactions also have a leveraging effect on the Fund because the Fund commits to purchase securities that it does not have to pay for until a later date, which increases the Fund’s overall investment exposure and, as a result, its volatility.
Zero coupon or pay-in-kind securities risk. The value, interest rates, and liquidity of non-cash paying instruments, such as zero coupon and pay-in-kind securities, are subject to greater fluctuation than other types of securities. The higher yields and interest rates on pay-in-kind securities reflect the payment deferral and increased credit risk associated with such instruments and that such investments may represent a higher credit risk than loans that periodically pay interest.
Invesco V.I. Core Plus Bond Fund
About indexes used in this report
The Bloomberg Barclays U.S. Aggregate Bond Index is an unmanaged index considered representative of the US investment grade, fixed-rate bond market.
The Lipper VUF Core Plus Bond Funds Index is an unmanaged index considered representative of core plus bond variable insurance underlying funds tracked by Lipper.
The Fund is not managed to track the performance of any particular index, including the index(es) described here, and consequently, the performance of the Fund may deviate significantly from the performance of the index(es).
A direct investment cannot be made in an index. Unless otherwise indicated, index results include reinvested dividends, and they do not reflect sales charges. Performance of the peer group, if applicable, reflects fund expenses; performance of a market index does not.
Other information
The returns shown in management’s discussion of Fund performance are based on net asset values calculated for shareholder transactions. Generally accepted accounting principles require adjustments to be made to the net assets of the Fund at period end for financial reporting purposes, and as such, the net asset values for shareholder transactions and the returns based on those net asset values may differ from the net asset values and returns reported in the Financial Highlights. Additionally, the returns and net asset values shown throughout this report are at the Fund level only and do not include variable product issuer charges. If such charges were included, the total returns would be lower.
Invesco V.I. Core Plus Bond Fund
Schedule of Investments(a)
December 31, 2017
| | | | | | | | |
| | | Principal
Amount | | | Value | |
Bonds & Notes–58.45% | |
| Advertising–0.02% | |
Lamar Media Corp., Sr. Unsec. Gtd. Global Notes, 5.75%, 02/01/2026 | | $ | 4,000 | | | $ | 4,285 | |
|
| Aerospace & Defense–0.77% | |
Bombardier Inc. (Canada), Sr. Unsec. Notes,
6.13%, 01/15/2023(b) | | | 2,000 | | | | 1,970 | |
7.50%, 03/15/2025(b) | | | 2,000 | | | | 2,025 | |
Huntington Ingalls Industries, Inc., Sr. Unsec. Gtd. Notes, 3.48%, 12/01/2027(b) | | | 36,000 | | | | 35,955 | |
Moog Inc., Sr. Unsec. Gtd. Notes, 5.25%, 12/01/2022(b) | | | 2,000 | | | | 2,075 | |
Northrop Grumman Corp., Sr. Unsec. Global Notes,
3.25%, 01/15/2028 | | | 45,000 | | | | 45,148 | |
4.03%, 10/15/2047 | | | 62,000 | | | | 65,016 | |
TransDigm Inc., Sr. Unsec. Gtd. Sub. Global Notes,
6.50%, 07/15/2024 | | | 2,000 | | | | 2,055 | |
6.50%, 05/15/2025 | | | 3,000 | | | | 3,075 | |
| | | | | | | | 157,319 | |
|
| Agricultural & Farm Machinery–0.03% | |
Titan International, Inc., Sr. Sec. Gtd. First Lien Notes, 6.50%, 11/30/2023(b) | | | 5,000 | | | | 5,100 | |
|
| Air Freight & Logistics–0.01% | |
XPO Logistics, Inc., Sr. Unsec. Gtd. Notes, 6.50%, 06/15/2022(b) | | | 2,000 | | | | 2,095 | |
|
| Airlines–3.83% | |
Air Canada Pass Through Trust (Canada), Series 2017-1, Class A, Sec. Pass Through Ctfs., 3.55%, 07/15/2031(b) | | | 37,000 | | | | 37,073 | |
Series 2017-1, Class B, Sec. Pass Through Ctfs., 3.70%, 07/15/2027(b) | | | 39,000 | | | | 39,433 | |
Series 2017-1, Class AA, Sec. Pass Through Ctfs., 3.30%, 07/15/2031(b) | | | 38,000 | | | | 38,435 | |
American Airlines Pass Through Trust, Series 2015-2, Class B, Sec. Third Lien Pass Through Ctfs., 4.40%, 03/22/2025 | | | 29,301 | | | | 29,972 | |
Series 2016-1, Class AA, Sr. Sec. First Lien Pass Through Ctfs., 3.58%, 01/15/2028 | | | 30,451 | | | | 31,101 | |
Series 2016-3, Class B, Sec. Third Lien Pass Through Ctfs., 3.75%, 04/15/2027 | | | 35,000 | | | | 34,621 | |
Series 2016-3, Class AA, Sr. Sec. First Lien Pass Through Ctfs., 3.00%, 04/15/2030 | | | 50,564 | | | | 49,593 | |
Series 2017-1, Class A, Sec. Second Lien Pass Through Ctfs., 4.00%, 08/15/2030 | | | 34,000 | | | | 35,336 | |
| | | | | | | | |
| | | Principal
Amount | | | Value | |
| Airlines–(continued) | |
Series 2017-1, Class B, Sec. Third Lien Pass Through Ctfs., 4.95%, 08/15/2026 | | $ | 36,000 | | | $ | 37,807 | |
Series 2017-1, Class AA, Sr. Sec. First Lien Pass Through Ctfs., 3.65%, 08/15/2030 | | | 42,000 | | | | 43,059 | |
Series 2017-2, Class A, Sec. Second Lien Pass Through Ctfs., 3.60%, 04/15/2031 | | | 46,000 | | | | 46,628 | |
Series 2017-2, Class B, Sec. Third Lien Pass Through Ctfs., 3.70%, 04/15/2027 | | | 36,000 | | | | 35,762 | |
Delta Air Lines Pass Through Trust, Series 2010-2, Class A, Sr. Sec. First Lien Pass Through Ctfs., 4.95%, 11/23/2020 | | | 22,118 | | | | 22,709 | |
Delta Air Lines, Inc., Sr. Unsec. Global Notes, 2.88%, 03/13/2020 | | | 27,000 | | | | 27,194 | |
3.63%, 03/15/2022 | | | 45,000 | | | | 45,703 | |
LATAM Airlines Group S.A. Pass Through Trust (Chile), Series 2015-1, Class A, Sec. Global Pass Through Ctfs., 4.20%, 08/15/2029 | | | 105,085 | | | | 106,530 | |
United Airlines Pass Through Trust, Series 2014-2, Class B, Sec. Second Lien Pass Through Ctfs., 4.63%, 09/03/2022 | | | 40,558 | | | | 41,783 | |
Series 2016-1, Class B, Sec. Third Lien Pass Through Ctfs., 3.65%, 07/07/2027 | | | 37,000 | | | | 36,908 | |
Series 2016-2, Class B, Sec. Third Lien Pass Through Ctfs., 3.65%, 04/07/2027 | | | 43,000 | | | | 42,824 | |
US Airways Pass Through Trust, Series 2012-1, Class B, Sec. Second Lien Pass Through Ctfs., 8.00%, 04/01/2021 | | | 679 | | | | 737 | |
| | | | | | | | 783,208 | |
|
| Alternative Carriers–0.04% | |
CenturyLink, Inc.,
Series S, Sr. Unsec. Notes, 6.45%, 06/15/2021 | | | 2,000 | | | | 2,030 | |
Series Y, Sr. Unsec. Global Notes, 7.50%, 04/01/2024 | | | 1,000 | | | | 1,000 | |
Level 3 Financing, Inc., Sr. Unsec. Gtd. Global Notes, 5.38%, 05/01/2025 | | | 5,000 | | | | 5,006 | |
| | | | | | | | 8,036 | |
|
| Aluminum–0.01% | |
Novelis Corp., Sr. Unsec. Gtd. Notes, 6.25%, 08/15/2024(b) | | | 2,000 | | | | 2,100 | |
|
| Apparel Retail–0.22% | |
Gap, Inc. (The), Sr. Unsec. Global Bonds, 5.95%, 04/12/2021 | | | 2,000 | | | | 2,158 | |
See accompanying Notes to Financial Statements which are an integral part of the financial statements.
Invesco V.I. Core Plus Bond Fund
| | | | | | | | |
| | | Principal
Amount | | | Value | |
| Apparel Retail–(continued) | |
L Brands, Inc., Sr. Unsec. Gtd. Global Notes, 5.63%, 02/15/2022 | | $ | 39,000 | | | $ | 41,779 | |
6.88%, 11/01/2035 | | | 2,000 | | | | 2,030 | |
| | | | | | | | 45,967 | |
|
| Apparel, Accessories & Luxury Goods–0.02% | |
Hanesbrands Inc., Sr. Unsec. Gtd. Notes, 4.88%, 05/15/2026(b) | | | 3,000 | | | | 3,090 | |
|
| Asset Management & Custody Banks–1.26% | |
Bank of New York Mellon Corp. (The), Unsec. Sub. Medium-Term Notes, 3.30%, 08/23/2029 | | | 60,000 | | | | 59,876 | |
Blackstone Holdings Finance Co. LLC, Sr. Unsec. Gtd. Notes,
5.00%, 06/15/2044(b) | | | 90,000 | | | | 104,228 | |
Carlyle Holdings II Finance LLC, Sr. Unsec. Gtd. Notes, 5.63%, 03/30/2043(b) | | | 75,000 | | | | 85,983 | |
Prime Security Services Borrower, LLC/Prime Finance, Inc., Sec. Gtd. Second Lien Notes, 9.25%, 05/15/2023(b) | | | 6,000 | | | | 6,675 | |
| | | | | | | | 256,762 | |
|
| Auto Parts & Equipment–0.04% | |
Dana Inc., Sr. Unsec. Notes, 5.50%, 12/15/2024 | | | 5,000 | | | | 5,306 | |
Delphi Technologies PLC, Sr. Unsec. Gtd. Notes, 5.00%, 10/01/2025(b) | | | 1,000 | | | | 1,015 | |
Hertz Corp. (The), Sec. Gtd. Second Lien Notes, 7.63%, 06/01/2022(b) | | | 2,000 | | | | 2,100 | |
| | | | | | | | 8,421 | |
|
| Automobile Manufacturers–0.19% | |
General Motors Financial Co., Inc., Sr. Unsec. Gtd. Notes, 3.15%, 01/15/2020 | | | 39,000 | | | | 39,457 | |
|
| Automotive Retail–0.09% | |
Advance Auto Parts, Inc., Sr. Unsec. Gtd. Notes, 5.75%, 05/01/2020 | | | 12,000 | | | | 12,794 | |
Lithia Motors, Inc., Sr. Unsec. Gtd. Notes, 5.25%, 08/01/2025(b) | | | 2,000 | | | | 2,090 | |
Murphy Oil USA, Inc., Sr. Unsec. Gtd. Global Notes, 5.63%, 05/01/2027 | | | 2,000 | | | | 2,108 | |
Penske Automotive Group Inc., Sr. Unsec. Sub. Gtd. Notes, 5.50%, 05/15/2026 | | | 2,000 | | | | 2,034 | |
| | | | | | | | 19,026 | |
|
| Brewers–0.28% | |
Anheuser-Busch InBev Finance, Inc. (Belgium), Sr. Unsec. Gtd. Global Notes, 3.65%, 02/01/2026 | | | 55,000 | | | | 56,841 | |
|
| Broadcasting–0.08% | |
Clear Channel Worldwide Holdings, Inc., Series B, Sr. Unsec. Gtd. Sub. Global Notes, 7.63%, 03/15/2020 | | | 6,000 | | | | 5,902 | |
Netflix, Inc., Sr. Unsec. Global Notes, 5.75%, 03/01/2024 | | | 3,000 | | | | 3,199 | |
| | | | | | | | |
| | | Principal
Amount | | | Value | |
| Broadcasting–(continued) | |
Nexstar Broadcasting, Inc., Sr. Unsec. Gtd. Notes, 5.63%, 08/01/2024(b) | | $ | 4,000 | | | $ | 4,140 | |
Tribune Media Co., Sr. Unsec. Gtd. Global Notes, 5.88%, 07/15/2022 | | | 3,000 | | | | 3,098 | |
| | | | | | | | 16,339 | |
|
| Building Products–0.28% | |
Gibraltar Industries Inc., Sr. Unsec. Gtd. Sub. Global Notes, 6.25%, 02/01/2021 | | | 2,000 | | | | 2,036 | |
Standard Industries Inc., Sr. Unsec. Notes, 4.75%, 01/15/2028(b) | | | 51,000 | | | | 51,373 | |
5.00%, 02/15/2027(b) | | | 3,000 | | | | 3,075 | |
| | | | | | | | 56,484 | |
|
| Cable & Satellite–0.70% | |
CCO Holdings LLC/CCO Holdings Capital Corp.,
Sr. Unsec. Global Notes, 5.75%, 09/01/2023 | | | 2,000 | | | | 2,055 | |
Sr. Unsec. Notes, 5.75%, 02/15/2026(b) | | | 6,000 | | | | 6,247 | |
Charter Communications Operating, LLC/Charter Communications Operating Capital Corp., Sr. Sec. Gtd. First Lien Global Notes, 6.83%, 10/23/2055 | | | 27,000 | | | | 32,573 | |
Cox Communications, Inc., Sr. Unsec. Notes, 3.35%, 09/15/2026(b) | | | 50,000 | | | | 48,940 | |
CSC Holdings LLC, Sr. Unsec. Global Notes, 6.75%, 11/15/2021 | | | 7,000 | | | | 7,525 | |
Discovery Communications LLC, Sr. Unsec. Gtd. Global Notes, 5.20%, 09/20/2047 | | | 15,000 | | | | 15,702 | |
DISH DBS Corp., Sr. Unsec. Gtd. Global Notes, 5.88%, 11/15/2024 | | | 6,000 | | | | 5,858 | |
Intelsat Jackson Holdings S.A. (Luxembourg),
Sr. Unsec. Gtd. Global Bonds,
5.50%, 08/01/2023 | | | 2,000 | | | | 1,640 | |
Sr. Unsec. Gtd. Global Notes, 7.25%, 10/15/2020 | | | 4,000 | | | | 3,780 | |
7.50%, 04/01/2021 | | | 2,000 | | | | 1,830 | |
Sirius XM Radio Inc., Sr. Unsec. Gtd. Notes, 3.88%, 08/01/2022(b) | | | 9,000 | | | | 9,067 | |
5.38%, 07/15/2026(b) | | | 5,000 | | | | 5,194 | |
6.00%, 07/15/2024(b) | | | 2,000 | | | | 2,120 | |
| | | | | | | | 142,531 | |
|
| Casinos & Gaming–0.14% | |
Boyd Gaming Corp., Sr. Unsec. Gtd. Global Notes, 6.88%, 05/15/2023 | | | 4,000 | | | | 4,255 | |
MGM Resorts International, Sr. Unsec. Gtd. Notes,
6.00%, 03/15/2023 | | | 3,000 | | | | 3,248 | |
7.75%, 03/15/2022 | | | 5,000 | | | | 5,712 | |
Pinnacle Entertainment, Inc., Sr. Unsec. Global Notes, 5.63%, 05/01/2024 | | | 6,000 | | | | 6,450 | |
Scientific Games International Inc., Sr. Unsec. Gtd. Global Notes, 10.00%, 12/01/2022 | | | 2,000 | | | | 2,203 | |
See accompanying Notes to Financial Statements which are an integral part of the financial statements.
Invesco V.I. Core Plus Bond Fund
| | | | | | | | |
| | | Principal
Amount | | | Value | |
| Casinos & Gaming–(continued) | |
Wynn Las Vegas LLC/Wynn Las Vegas Capital Corp., Sr. Unsec. Gtd. Notes, 5.25%, 05/15/2027(b) | | $ | 2,000 | | | $ | 2,030 | |
5.50%, 03/01/2025(b) | | | 5,000 | | | | 5,162 | |
| | | | | | | | 29,060 | |
|
| Coal & Consumable Fuels–0.01% | |
SunCoke Energy Partners, L.P./ SunCoke Energy Partners Finance Corp., Sr. Unsec. Gtd. Notes, 7.50%, 06/15/2025(b) | | | 2,000 | | | | 2,100 | |
|
| Commodity Chemicals–0.02% | |
Valvoline Inc., Sr. Unsec. Gtd. Global Notes, 5.50%, 07/15/2024 | | | 4,000 | | | | 4,260 | |
|
| Communications Equipment–0.07% | |
CommScope Technologies LLC, Sr. Unsec. Gtd. Notes, 6.00%, 06/15/2025(b) | | | 6,000 | | | | 6,405 | |
Hughes Satellite Systems Corp.,
Sr. Sec. Gtd. First Lien Global Notes, 5.25%, 08/01/2026 | | | 2,000 | | | | 2,047 | |
Sr. Unsec. Gtd. Global Notes, 7.63%, 06/15/2021 | | | 5,000 | | | | 5,544 | |
| | | | | | | | 13,996 | |
|
| Construction Machinery & Heavy Trucks–0.05% | |
Meritor Inc., Sr. Unsec. Gtd. Notes, 6.25%, 02/15/2024 | | | 3,000 | | | | 3,172 | |
Oshkosh Corp.,
Sr. Unsec. Gtd. Global Notes,
5.38%, 03/01/2025 | | | 3,000 | | | | 3,199 | |
Terex Corp., Sr. Unsec. Gtd. Notes, 5.63%, 02/01/2025(b) | | | 4,000 | | | | 4,185 | |
| | | | | | | | 10,556 | |
|
| Construction Materials–0.31% | |
Martin Marietta Materials, Inc., Sr. Unsec. Global Notes, 4.25%, 12/15/2047 | | | 64,000 | | | | 63,533 | |
|
| Consumer Finance–0.94% | |
Ally Financial Inc.,
Sr. Unsec. Global Notes, 4.63%, 03/30/2025 | | | 2,000 | | �� | | 2,108 | |
5.13%, 09/30/2024 | | | 3,000 | | | | 3,251 | |
Sr. Unsec. Gtd. Global Notes, 8.00%, 03/15/2020 | | | 2,000 | | | | 2,210 | |
Capital One Financial Corp., Sr. Unsec. Global Notes,
3.05%, 03/09/2022 | | | 35,000 | | | | 35,275 | |
3.75%, 03/09/2027 | | | 85,000 | | | | 86,047 | |
Discover Financial Services, Inc., Series C, Jr. Unsec. Sub. Global Notes, 5.50%(c) | | | 58,000 | | | | 59,812 | |
Navient Corp., Sr. Unsec. Medium-Term Notes,
7.25%, 01/25/2022 | | | 2,000 | | | | 2,150 | |
8.00%, 03/25/2020 | | | 2,000 | | | | 2,168 | |
| | | | | | | | 193,021 | |
|
| Copper–0.30% | |
First Quantum Minerals Ltd. (Zambia), Sr. Unsec. Gtd. Notes,
7.00%, 02/15/2021(b) | | | 2,000 | | | | 2,080 | |
| | | | | | | | |
| | | Principal
Amount | | | Value | |
| Copper–(continued) | |
Freeport-McMoRan Inc., Sr. Unsec. Gtd. Global Notes, 5.40%, 11/14/2034 | | $ | 2,000 | | | $ | 2,045 | |
Lundin Mining Corp. (Canada), Sr. Sec. Gtd. First Lien Notes, 7.88%, 11/01/2022(b) | | | 33,000 | | | | 35,475 | |
Southern Copper Corp. (Peru), Sr. Unsec. Global Notes, 5.88%, 04/23/2045 | | | 18,000 | | | | 21,804 | |
| | | | | | | | 61,404 | |
|
| Data Processing & Outsourced Services–0.03% | |
First Data Corp., Sr. Unsec. Gtd. Notes, 7.00%, 12/01/2023(b) | | | 6,000 | | | | 6,360 | |
|
| Diversified Banks–7.41% | |
Bank of America Corp.,
Sr. Unsec. Global Notes,
3.71%, 04/24/2028 | | | 25,000 | | | | 25,683 | |
Sr. Unsec. Medium-Term Global Notes, 3.59%, 07/21/2028 | | | 50,000 | | | | 50,869 | |
Series Z, Jr. Unsec. Sub. Notes, 6.50%(c) | | | 85,000 | | | | 96,688 | |
Series DD, Jr. Unsec. Sub. Notes, 6.30%(c) | | | 30,000 | | | | 33,975 | |
Bank of Montreal (Canada), Unsec. Sub. Global Notes, 3.80%, 12/15/2032 | | | 30,000 | | | | 29,696 | |
BBVA Bancomer S.A. (Mexico), Unsec. Sub. Notes, 6.75%, 09/30/2022(b) | | | 150,000 | | | | 169,688 | |
Citigroup Inc.,
Sr. Unsec. Global Notes,
2.88%, 07/24/2023 | | | 20,000 | | | | 19,918 | |
3.67%, 07/24/2028 | | | 75,000 | | | | 76,160 | |
Series Q, Jr. Unsec. Sub. Global Notes, 5.95%(c) | | | 40,000 | | | | 41,875 | |
Series T, Jr. Unsec. Sub. Global Notes, 6.25%(c) | | | 30,000 | | | | 33,128 | |
Corp. Andina de Fomento (Supranational), Sr. Unsec. Global Notes, 4.38%, 06/15/2022 | | | 50,000 | | | | 53,395 | |
HSBC Holdings PLC (United Kingdom), Jr. Unsec. Sub. Global Bonds, 6.00%(c) | | | 200,000 | | | | 210,750 | |
Sr. Unsec. Global Notes, 4.00%, 03/30/2022 | | | 45,000 | | | | 47,027 | |
JPMorgan Chase & Co., Sr. Unsec. Global Notes,
3.54%, 05/01/2028 | | | 42,000 | | | | 42,767 | |
3.78%, 02/01/2028 | | | 35,000 | | | | 36,300 | |
Sr. Unsec. Medium-Term Global Bonds, 2.30%, 08/15/2021 | | | 65,000 | | | | 64,444 | |
Unsec. Sub. Global Notes, 3.63%, 12/01/2027 | | | 35,000 | | | | 35,438 | |
Series I, Jr. Unsec. Sub. Global Notes, 7.90%(c) | | | 30,000 | | | | 30,413 | |
Series V, Jr. Unsec. Sub. Global Notes, 5.00%(c) | | | 40,000 | | | | 40,745 | |
Series CC, Jr. Unsec. Sub. Global Notes, 4.63%(c) | | | 50,000 | | | | 49,250 | |
Royal Bank of Scotland Group PLC (United Kingdom), Unsec. Sub. Global Notes, 6.00%, 12/19/2023 | | | 5,000 | | | | 5,524 | |
Standard Chartered PLC (United Kingdom), Unsec. Sub. Notes, 4.30%, 02/19/2027(b) | | | 200,000 | | | | 204,158 | |
See accompanying Notes to Financial Statements which are an integral part of the financial statements.
Invesco V.I. Core Plus Bond Fund
| | | | | | | | |
| | | Principal
Amount | | | Value | |
| Diversified Banks–(continued) | |
Wells Fargo & Co.,
Unsec. Sub. Medium-Term Notes,
4.75%, 12/07/2046 | | $ | 25,000 | | | $ | 27,984 | |
Series U, Jr. Unsec. Sub. Global Notes, 5.88%(c) | | | 45,000 | | | | 49,896 | |
Westpac Banking Corp. (Australia), Jr. Unsec. Sub. Global Bonds, 5.00%(c) | | | 40,000 | | | | 39,926 | |
| | | | | | | | 1,515,697 | |
|
| Diversified Chemicals–0.07% | |
Chemours Co. (The), Sr. Unsec. Gtd. Global Notes,
6.63%, 05/15/2023 | | | 9,000 | | | | 9,562 | |
7.00%, 05/15/2025 | | | 2,000 | | | | 2,180 | |
Trinseo Materials Operating S.C.A./Trinseo Materials Finance, Inc., Sr. Unsec. Gtd. Notes, 5.38%, 09/01/2025(b) | | | 2,000 | | | | 2,075 | |
| | | | | | | | 13,817 | |
|
| Diversified Metals & Mining–0.03% | |
HudBay Minerals, Inc. (Canada), Sr. Unsec. Gtd. Notes, 7.63%, 01/15/2025(b) | | | 4,000 | | | | 4,400 | |
Teck Resources Ltd. (Canada), Sr. Unsec. Notes, 6.13%, 10/01/2035 | | | 2,000 | | | | 2,250 | |
| | | | | | | | 6,650 | |
|
| Diversified REIT's–1.04% | |
CyrusOne L.P./CyrusOne Finance Corp., Sr. Unsec. Gtd. Notes, 5.00%, 03/15/2024(b) | | | 2,000 | | | | 2,080 | |
Trust F/1401 (Mexico), Sr. Unsec. Notes, 5.25%, 01/30/2026(b) | | | 200,000 | | | | 211,500 | |
| | | | | | | | 213,580 | |
|
| Diversified Support Services–0.01% | |
Jaguar Holding Co. II/Pharmaceutical Product Development, LLC, Sr. Unsec. Gtd. Notes, 6.38%, 08/01/2023(b) | | | 2,000 | | | | 2,025 | |
|
| Drug Retail–0.78% | |
CVS Pass Through Trust, Sr. Sec. First Lien Mortgage Pass Through Ctfs., 5.77%, 01/10/2033(b) | | | 141,201 | | | | 158,997 | |
|
| Electric Utilities–0.26% | |
Exelon Corp., Jr. Unsec. Sub. Notes, 3.50%, 06/01/2022 | | | 18,000 | | | | 18,360 | |
Southern Co. (The), Series B, Jr. Unsec. Sub. Global Notes, 5.50%, 03/15/2057 | | | 32,000 | | | | 33,960 | |
| | | | | | | | 52,320 | |
|
| Electrical Components & Equipment–0.04% | |
Sensata Technologies B.V., Sr. Unsec. Gtd. Notes, 4.88%, 10/15/2023(b) | | | 7,000 | | | | 7,341 | |
|
| Electronic Equipment & Instruments–0.02% | |
Itron, Inc., Sr. Unsec. Gtd. Notes, 5.00%, 01/15/2026(b) | | | 4,000 | | | | 4,025 | |
| | | | | | | | |
| | | Principal
Amount | | | Value | |
| Environmental & Facilities Services–0.04% | |
Advanced Disposal Services, Inc., Sr. Unsec. Gtd. Notes, 5.63%, 11/15/2024(b) | | $ | 2,000 | | | $ | 2,050 | |
Core & Main LP, Sr. Unsec. Notes, 6.13%, 08/15/2025(b) | | | 3,000 | | | | 3,052 | |
Wrangler Buyer Corp., Sr. Unsec. Notes, 6.00%, 10/01/2025(b) | | | 2,000 | | | | 2,070 | |
| | | | | | | | 7,172 | |
|
| Fertilizers & Agricultural Chemicals–0.21% | |
Mosaic Co. (The), Sr. Unsec. Global Notes, 3.25%, 11/15/2022 | | | 44,000 | | | | 43,658 | |
|
| Financial Exchanges & Data–1.84% | |
Moody’s Corp.,
Sr. Unsec. Global Bonds, 5.50%, 09/01/2020 | | | 110,000 | | | | 118,521 | |
Sr. Unsec. Global Notes, 2.75%, 07/15/2019 | | | 45,000 | | | | 45,288 | |
4.88%, 02/15/2024 | | | 138,000 | | | | 151,748 | |
5.25%, 07/15/2044 | | | 35,000 | | | | 42,405 | |
MSCI Inc., Sr. Unsec. Gtd. Notes, 5.75%, 08/15/2025(b) | | | 3,000 | | | | 3,236 | |
Nasdaq, Inc., Sr. Unsec. Notes, 3.85%, 06/30/2026 | | | 15,000 | | | | 15,425 | |
| | | | | | | | 376,623 | |
|
| Food Distributors–0.02% | |
US Foods, Inc., Sr. Unsec. Gtd. Notes, 5.88%, 06/15/2024(b) | | | 4,000 | | | | 4,220 | |
|
| Food Retail–0.05% | |
Albertsons Cos. LLC/ Safeway Inc./New Albertson's, Inc./Albertson's LLC, Sr. Unsec. Gtd. Global Notes, 6.63%, 06/15/2024 | | | 6,000 | | | | 5,760 | |
Ingles Markets, Inc., Sr. Unsec. Global Notes, 5.75%, 06/15/2023 | | | 4,000 | | | | 4,070 | |
| | | | | | | | 9,830 | |
|
| Gas Utilities–0.04% | |
AmeriGas Partners, L.P./AmeriGas Finance Corp., Sr. Unsec. Global Notes, 5.63%, 05/20/2024 | | | 4,000 | | | | 4,180 | |
5.88%, 08/20/2026 | | | 2,000 | | | | 2,070 | |
Suburban Propane Partners, L.P./Suburban Energy Finance Corp., Sr. Unsec. Global Notes, 5.50%, 06/01/2024 | | | 2,000 | | | | 1,990 | |
| | | | | | | | 8,240 | |
|
| General Merchandise Stores–0.49% | |
Dollar Tree, Inc., Sr. Unsec. Gtd. Global Notes, 5.75%, 03/01/2023 | | | 95,000 | | | | 99,691 | |
|
| Health Care Distributors–0.48% | |
AmerisourceBergen Corp., Sr. Unsec. Global Notes,
3.45%, 12/15/2027 | | | 49,000 | | | | 48,679 | |
4.30%, 12/15/2047 | | | 49,000 | | | | 49,334 | |
| | | | | | | | 98,013 | |
See accompanying Notes to Financial Statements which are an integral part of the financial statements.
Invesco V.I. Core Plus Bond Fund
| | | | | | | | |
| | | Principal
Amount | | | Value | |
| Health Care Equipment–0.43% | |
Becton, Dickinson and Co., Sr. Unsec. Notes, 3.36%, 06/06/2024 | | $ | 29,000 | | | $ | 29,116 | |
3.70%, 06/06/2027 | | | 39,000 | | | | 39,366 | |
Hill-Rom Holdings, Inc., Sr. Unsec. Gtd. Notes, 5.00%, 02/15/2025(b) | | | 2,000 | | | | 2,049 | |
Teleflex Inc., Sr. Unsec. Gtd. Global Notes, 4.63%, 11/15/2027 | | | 17,000 | | | | 17,209 | |
| | | | | | | | 87,740 | |
|
| Health Care Facilities–0.56% | |
Acadia Healthcare Co., Inc., Sr. Unsec. Gtd. Global Notes, 6.50%, 03/01/2024 | | | 2,000 | | | | 2,090 | |
Community Health Systems, Inc.,
Sr. Sec. Gtd. First Lien Notes, 6.25%, 03/31/2023 | | | 6,000 | | | | 5,430 | |
Sr. Unsec. Gtd. Global Notes, 8.00%, 11/15/2019 | | | 2,000 | | | | 1,705 | |
HCA, Inc.,
Sr. Sec. Gtd. First Lien Global Notes,
6.50%, 02/15/2020 | | | 19,000 | | | | 20,187 | |
Sr. Sec. Gtd. First Lien Notes, 5.25%, 04/15/2025 | | | 4,000 | | | | 4,240 | |
5.50%, 06/15/2047 | | | 62,000 | | | | 62,000 | |
Sr. Unsec. Gtd. Notes, 5.88%, 02/15/2026 | | | 8,000 | | | | 8,480 | |
HealthSouth Corp., Sr. Unsec. Gtd. Global Notes, 5.75%, 09/15/2025 | | | 2,000 | | | | 2,090 | |
LifePoint Health, Inc., Sr. Unsec. Gtd. Global Notes, 5.38%, 05/01/2024 | | | 2,000 | | | | 1,993 | |
Tenet Healthcare Corp.,
Sec. Gtd. Second Lien Notes, 7.50%, 01/01/2022(b) | | | 2,000 | | | | 2,107 | |
Sr. Unsec. Global Notes, 6.75%, 06/15/2023 | | | 2,000 | | | | 1,948 | |
8.13%, 04/01/2022 | | | 2,000 | | | | 2,042 | |
| | | | | | | | 114,312 | |
|
| Health Care REIT's–0.68% | |
HCP, Inc., Sr. Unsec. Global Notes, 4.00%, 12/01/2022 | | | 71,000 | | | | 74,414 | |
Physicians Realty L.P., Sr. Unsec. Gtd. Global Notes, 4.30%, 03/15/2027 | | | 20,000 | | | | 20,381 | |
Senior Housing Properties Trust, Sr. Unsec. Notes, 6.75%, 12/15/2021 | | | 40,000 | | | | 44,293 | |
| | | | | | | | 139,088 | |
|
| Health Care Services–0.45% | |
AMN Healthcare, Inc., Sr. Unsec. Gtd. Notes, 5.13%, 10/01/2024(b) | | | 2,000 | | | | 2,065 | |
Eagle Holding Co. II, LLC, Sr. Unsec. PIK Notes, 8.38% PIK Rate, 7.63% Cash Rate, 05/15/2022(b)(d) | | | 2,000 | | | | 2,040 | |
Envision Healthcare Corp., Sr. Unsec. Gtd. Notes, 6.25%, 12/01/2024(b) | | | 2,000 | | | | 2,070 | |
Laboratory Corp. of America Holdings, Sr. Unsec. Notes,
3.25%, 09/01/2024 | | | 52,000 | | | | 52,145 | |
3.60%, 09/01/2027 | | | 23,000 | | | | 23,095 | |
MEDNAX, Inc., Sr. Unsec. Gtd. Notes, 5.25%, 12/01/2023(b) | | | 3,000 | | | | 3,060 | |
| | | | | | | | |
| | | Principal
Amount | | | Value | |
| Health Care Services–(continued) | |
MPH Acquisition Holdings LLC, Sr. Unsec. Gtd. Notes, 7.13%, 06/01/2024(b) | | $ | 4,000 | | | $ | 4,270 | |
Surgery Center Holdings, Inc., Sr. Unsec. Gtd. Notes,
6.75%, 07/01/2025(b) | | | 2,000 | | | | 1,900 | |
8.88%, 04/15/2021(b) | | | 1,000 | | | | 1,040 | |
| | | | | | | | 91,685 | |
|
| Home Entertainment Software–0.20% | |
Electronic Arts Inc., Sr. Unsec. Global Notes, 3.70%, 03/01/2021 | | | 40,000 | | | | 41,270 | |
|
| Homebuilding–1.09% | |
Ashton Woods USA LLC/Ashton Woods Finance Co., Sr. Unsec. Notes, 6.75%, 08/01/2025(b) | | | 2,000 | | | | 2,008 | |
6.88%, 02/15/2021(b) | | | 2,000 | | | | 2,047 | |
Beazer Homes USA, Inc., Sr. Unsec. Gtd. Global Notes,
6.75%, 03/15/2025 | | | 3,000 | | | | 3,176 | |
8.75%, 03/15/2022 | | | 3,000 | | | | 3,315 | |
CalAtlantic Group, Inc., Sr. Unsec. Gtd. Global Notes, 8.38%, 01/15/2021 | | | 2,000 | | | | 2,312 | |
KB Home, Sr. Unsec. Gtd. Notes, 7.50%, 09/15/2022 | | | 3,000 | | | | 3,427 | |
Lennar Corp., Sr. Unsec. Gtd. Notes, 4.50%, 04/30/2024 | | | 11,000 | | | | 11,306 | |
MDC Holdings, Inc., Sr. Unsec. Gtd. Notes, 6.00%, 01/15/2043 | | | 190,000 | | | | 186,675 | |
Meritage Homes Corp., Sr. Unsec. Gtd. Global Notes,
6.00%, 06/01/2025 | | | 3,000 | | | | 3,225 | |
7.15%, 04/15/2020 | | | 2,000 | | | | 2,185 | |
Taylor Morrison Communities Inc./ Taylor Morrison Holdings II, Inc., Sr. Unsec. Gtd. Notes, 5.88%, 04/15/2023(b) | | | 3,000 | | | | 3,184 | |
| | | | | | | | 222,860 | |
|
| Hotel and Resort REIT's–0.18% | |
Host Hotels & Resorts L.P., Series F, Sr. Unsec. Global Notes, 4.50%, 02/01/2026 | | | 35,000 | | | | 36,694 | |
|
| Hotels, Resorts & Cruise Lines–0.12% | |
Choice Hotels International, Inc., Sr. Unsec. Gtd. Notes, 5.75%, 07/01/2022 | | | 4,000 | | | | 4,395 | |
Royal Caribbean Cruises Ltd., Sr. Unsec. Global Notes, 3.70%, 03/15/2028 | | | 20,000 | | | | 19,854 | |
| | | | | | | | 24,249 | |
|
| Household Products–0.20% | |
Reynolds Group Issuer Inc./LLC,
Sr. Sec. Gtd. First Lien Global Notes, 5.75%, 10/15/2020 | | | 35,857 | | | | 36,439 | |
Sr. Unsec. Gtd. Notes,
7.00%, 07/15/2024(b) | | | 2,000 | | | | 2,146 | |
Spectrum Brands, Inc., Sr. Unsec. Gtd. Global Notes, 5.75%, 07/15/2025 | | | 2,000 | | | | 2,115 | |
| | | | | | | | 40,700 | |
See accompanying Notes to Financial Statements which are an integral part of the financial statements.
Invesco V.I. Core Plus Bond Fund
| | | | | | | | |
| | | Principal
Amount | | | Value | |
| Independent Power Producers & Energy Traders–0.05% | |
AES Corp. (The), Sr. Unsec. Notes, 5.50%, 04/15/2025 | | $ | 5,000 | | | $ | 5,275 | |
Dynegy Inc., Sr. Unsec. Gtd. Global Notes, 7.38%, 11/01/2022 | | | 2,000 | | | | 2,115 | |
NRG Energy, Inc., Sr. Unsec. Gtd. Global Notes, 6.25%, 05/01/2024 | | | 2,000 | | | | 2,105 | |
| | | | | | | | 9,495 | |
|
| Industrial Conglomerates–0.33% | |
General Electric Co., Series D, Jr. Unsec. Sub. Global Notes, 5.00%(c) | | | 66,000 | | | | 68,102 | |
|
| Industrial Machinery–0.02% | |
Cleaver-Brooks, Inc., Sr. Sec. Notes, 7.88%, 03/01/2023(b) | | | 2,000 | | | | 2,055 | |
Mueller Industries, Inc., Unsec. Sub. Deb., 6.00%, 03/01/2027 | | | 1,000 | | | | 1,028 | |
TriMas Corp., Sr. Unsec. Gtd. Notes, 4.88%, 10/15/2025(b) | | | 2,000 | | | | 2,011 | |
| | | | | | | | 5,094 | |
|
| Integrated Oil & Gas–0.24% | |
Petróleos Mexicanos (Mexico),
Sr. Unsec. Gtd. Global Bonds,
6.63%, 06/15/2035 | | | 23,000 | | | | 24,658 | |
Sr. Unsec. Gtd. Notes,
6.50%, 03/13/2027(b) | | | 23,000 | | | | 25,168 | |
| | | | | | | | 49,826 | |
|
| Integrated Telecommunication Services–2.44% | |
AT&T Inc.,
Sr. Unsec. Global Notes, 3.90%, 08/14/2027 | | | 78,000 | | | | 78,652 | |
5.15%, 02/14/2050 | | | 66,000 | | | | 66,588 | |
5.25%, 03/01/2037 | | | 35,000 | | | | 37,103 | |
5.30%, 08/14/2058 | | | 66,000 | | | | 66,431 | |
5.70%, 03/01/2057 | | | 35,000 | | | | 38,564 | |
Sr. Unsec. Notes,
4.45%, 04/01/2024 | | | 30,000 | | | | 31,770 | |
Cincinnati Bell Inc., Sr. Unsec. Gtd. Notes, 7.00%, 07/15/2024(b) | | | 2,000 | | | | 1,990 | |
Frontier Communications Corp., Sr. Unsec. Global Notes,
8.50%, 04/15/2020 | | | 3,000 | | | | 2,497 | |
11.00%, 09/15/2025 | | | 2,000 | | | | 1,480 | |
T-Mobile USA, Inc., Sr. Unsec. Gtd. Global Notes, 6.38%, 03/01/2025 | | | 6,000 | | | | 6,435 | |
Telecom Italia Capital S.A. (Italy), Sr. Unsec. Gtd. Global Notes, 7.20%, 07/18/2036 | | | 2,000 | | | | 2,495 | |
Verizon Communications Inc., Sr. Unsec. Global Notes,
2.63%, 08/15/2026 | | | 60,000 | | | | 56,605 | |
4.13%, 08/15/2046 | | | 22,000 | | | | 20,388 | |
4.81%, 03/15/2039 | | | 27,000 | | | | 28,321 | |
5.01%, 08/21/2054 | | | 58,000 | | | | 59,467 | |
| | | | | | | | 498,786 | |
| | | | | | | | |
| | | Principal
Amount | | | Value | |
| Internet & Direct Marketing Retail–0.57% | |
Amazon.com, Inc., Sr. Unsec. Notes, 2.80%, 08/22/2024(b) | | $ | 37,000 | | | $ | 36,935 | |
3.15%, 08/22/2027(b) | | | 36,000 | | | | 36,116 | |
4.05%, 08/22/2047(b) | | | 40,000 | | | | 43,256 | |
| | | | | | | | 116,307 | |
|
| Investment Banking & Brokerage–1.52% | |
Cantor Fitzgerald, L.P., Unsec. Notes, 6.50%, 06/17/2022(b) | | | 34,000 | | | | 37,723 | |
E*TRADE Financial Corp., Series B, Jr. Unsec. Sub. Global Notes, 5.30%(c) | | | 50,000 | | | | 50,375 | |
Goldman Sachs Group, Inc. (The),
Sr. Unsec. Notes, 3.27%, 09/29/2025 | | | 50,000 | | | | 49,832 | |
Series L, Jr. Unsec. Sub. Notes, 5.70%(c) | | | 55,000 | | | | 56,779 | |
Series P, Jr. Unsec. Sub. Notes, 5.00%(c) | | | 40,000 | | | | 39,700 | |
Morgan Stanley, Sr. Unsec. Global Notes, 3.59%, 07/22/2028 | | | 75,000 | | | | 75,759 | |
| | | | | | | | 310,168 | |
|
| Leisure Facilities–0.01% | |
Six Flags Entertainment Corp., Sr. Unsec. Gtd. Notes, 4.88%, 07/31/2024(b) | | | 2,000 | | | | 2,035 | |
|
| Leisure Products–0.18% | |
Mattel, Inc.,
Sr. Unsec. Global Notes, 2.35%, 05/06/2019 | | | 31,000 | | | | 30,764 | |
5.45%, 11/01/2041 | | | 2,000 | | | | 1,665 | |
Sr. Unsec. Gtd. Notes,
6.75%, 12/31/2025(b) | | | 2,000 | | | | 2,032 | |
Sr. Unsec. Notes, 6.20%, 10/01/2040 | | | 2,000 | | | | 1,807 | |
| | | | | | | | 36,268 | |
|
| Life & Health Insurance–3.22% | |
American Equity Investment Life Holding Co., Sr. Unsec. Global Notes, 5.00%, 06/15/2027 | | | 40,000 | | | | 41,513 | |
Dai-ichi Life Insurance Co., Ltd. (The) (Japan), Jr. Unsec. Sub. Notes, 4.00%(b)(c) | | | 200,000 | | | | 196,440 | |
MetLife, Inc., Series C, Jr. Unsec. Sub. Global Notes, 5.25%(c) | | | 65,000 | | | | 67,746 | |
Nationwide Financial Services, Inc., Sr. Unsec. Notes, 5.38%, 03/25/2021(b) | | | 165,000 | | | | 177,886 | |
Pacific Life Insurance Co., Unsec. Sub. Notes, 4.30%, 10/24/2067(b) | | | 40,000 | | | | 40,224 | |
Prudential Financial, Inc., Jr. Unsec. Sub. Global Notes, 8.88%, 06/15/2068 | | | 130,000 | | | | 133,867 | |
| | | | | | | | 657,676 | |
|
| Managed Health Care–0.45% | |
Centene Corp., Sr. Unsec. Notes, 4.75%, 01/15/2025 | | | 2,000 | | | | 2,040 | |
Cigna Corp., Sr. Unsec. Notes, 4.50%, 03/15/2021 | | | 45,000 | | | | 47,326 | |
Molina Healthcare, Inc., Sr. Unsec. Gtd. Notes, 4.88%, 06/15/2025(b) | | | 1,000 | | | | 1,003 | |
See accompanying Notes to Financial Statements which are an integral part of the financial statements.
Invesco V.I. Core Plus Bond Fund
| | | | | | | | |
| | | Principal
Amount | | | Value | |
| Managed Health Care–(continued) | |
UnitedHealth Group Inc., Sr. Unsec. Global Notes, 3.75%, 07/15/2025 | | $ | 35,000 | | | $ | 36,918 | |
WellCare Health Plans Inc., Sr. Unsec. Notes, 5.25%, 04/01/2025 | | | 5,000 | | | | 5,288 | |
| | | | | | | | 92,575 | |
|
| Metal & Glass Containers–0.04% | |
Ball Corp., Sr. Unsec. Gtd. Global Notes, 5.25%, 07/01/2025 | | | 3,000 | | | | 3,274 | |
Berry Global, Inc., Sec. Gtd. Second Lien Global Notes, 6.00%, 10/15/2022 | | | 2,000 | | | | 2,102 | |
OI European Group B.V., Sr. Unsec. Gtd. Notes, 4.00%, 03/15/2023(b) | | | 2,000 | | | | 2,008 | |
| | | | | | | | 7,384 | |
|
| Movies & Entertainment–0.52% | |
AMC Entertainment Holdings, Inc., Sr. Unsec. Gtd. Sub. Global Notes, 5.75%, 06/15/2025 | | | 5,000 | | | | 4,969 | |
Lions Gate Entertainment Corp., Sr. Unsec. Gtd. Notes, 5.88%, 11/01/2024(b) | | | 2,000 | | | | 2,123 | |
Time Warner Cable, Inc., Sr. Sec. Gtd. First Lien Global Deb., 6.75%, 07/01/2018 | | | 55,000 | | | | 56,224 | |
Viacom Inc., Jr. Unsec. Sub. Global Notes, 5.88%, 02/28/2057 | | | 30,000 | | | | 29,539 | |
6.25%, 02/28/2057 | | | 13,000 | | | | 12,714 | |
| | | | | | | | 105,569 | |
|
| Multi-Line Insurance–1.17% | |
AIG Global Funding, Sr. Sec. First Lien Notes, 2.70%, 12/15/2021(b) | | | 42,000 | | | | 41,997 | |
American Financial Group, Inc., Sr. Unsec. Notes, 3.50%, 08/15/2026 | | | 20,000 | | | | 19,852 | |
American International Group, Inc., Sr. Unsec. Global Notes, 3.90%, 04/01/2026 | | | 45,000 | | | | 46,734 | |
Massachusetts Mutual Life Insurance Co., Unsec. Sub. Notes, 4.90%, 04/01/2077(b) | | | 15,000 | | | | 17,088 | |
Nationwide Mutual Insurance Co., Unsec. Sub. Notes, 4.95%, 04/22/2044(b) | | | 100,000 | | | | 112,837 | |
| | | | | | | | 238,508 | |
|
| Office REIT's–0.37% | |
Alexandria Real Estate Equities, Inc., Sr. Unsec. Gtd. Global Notes, 3.95%, 01/15/2027 | | | 40,000 | | | | 40,926 | |
Hudson Pacific Properties, LP, Sr. Unsec. Gtd. Notes, 3.95%, 11/01/2027 | | | 35,000 | | | | 34,880 | |
| | | | �� | | | | 75,806 | |
|
| Office Services & Supplies–0.43% | |
Pitney Bowes Inc., Sr. Unsec. Global Notes, 3.63%, 10/01/2021 | | | 55,000 | | | | 51,425 | |
4.70%, 04/01/2023 | | | 39,000 | | | | 35,977 | |
| | | | | | | | 87,402 | |
|
| Oil & Gas Drilling–0.04% | |
Ensco PLC, Sr. Unsec. Global Notes, 4.50%, 10/01/2024 | | | 2,000 | | | | 1,690 | |
| | | | | | | | |
| | | Principal
Amount | | | Value | |
| Oil & Gas Drilling–(continued) | |
Noble Holding International Ltd. (United Kingdom), Sr. Unsec. Gtd. Global Notes, 7.75%, 01/15/2024 | | $ | 2,000 | | | $ | 1,730 | |
Precision Drilling Corp. (Canada), Sr. Unsec. Gtd. Global Notes,
5.25%, 11/15/2024 | | | 2,000 | | | | 1,895 | |
6.50%, 12/15/2021 | | | 2,000 | | | | 2,047 | |
Transocean Inc., Sr. Unsec. Gtd. Global Notes, 7.50%, 04/15/2031 | | | 2,000 | | | | 1,790 | |
| | | | | | | | 9,152 | |
|
| Oil & Gas Equipment & Services–0.19% | |
Archrock Partners, L.P./Archrock Partners Finance Corp., Sr. Unsec. Gtd. Global Notes, 6.00%, 10/01/2022 | | | 2,000 | | | | 2,010 | |
Baker Hughes, a GE Co., LLC/Baker Hughes Co-Obligor, Inc., Sr. Unsec. Notes, 2.77%, 12/15/2022(b) | | | 32,000 | | | | 31,976 | |
SESI, L.L.C., Sr. Unsec. Gtd. Global Notes, 7.13%, 12/15/2021 | | | 2,000 | | | | 2,052 | |
Weatherford International Ltd., Sr. Unsec. Gtd. Notes,
6.50%, 08/01/2036 | | | 2,000 | | | | 1,655 | |
8.25%, 06/15/2023 | | | 2,000 | | | | 2,025 | |
| | | | | | | | 39,718 | |
|
| Oil & Gas Exploration & Production–0.49% | |
Antero Resources Corp., Sr. Unsec. Gtd. Global Notes, 5.63%, 06/01/2023 | | | 2,000 | | | | 2,090 | |
Callon Petroleum Co., Sr. Unsec. Gtd. Global Notes, 6.13%, 10/01/2024 | | | 2,000 | | | | 2,070 | |
Concho Resources Inc., Sr. Unsec. Gtd. Global Notes, 4.38%, 01/15/2025 | | | 52,000 | | | | 54,210 | |
Continental Resources Inc., Sr. Unsec. Gtd. Global Notes, 3.80%, 06/01/2024 | | | 3,000 | | | | 2,977 | |
EP Energy LLC/Everest Acquisition Finance Inc., Sr. Sec. Gtd. First Lien Notes, 8.00%, 11/29/2024(b) | | | 2,000 | | | | 2,075 | |
Gulfport Energy Corp., Sr. Unsec. Gtd. Global Notes, 6.00%, 10/15/2024 | | | 4,000 | | | | 4,020 | |
Newfield Exploration Co., Sr. Unsec. Global Notes, 5.63%, 07/01/2024 | | | 3,000 | | | | 3,240 | |
Oasis Petroleum Inc., Sr. Unsec. Gtd. Global Notes, 6.88%, 01/15/2023 | | | 2,000 | | | | 2,052 | |
Parsley Energy LLC/Parsley Finance Corp., Sr. Unsec. Gtd. Notes, 6.25%, 06/01/2024(b) | | | 2,000 | | | | 2,115 | |
QEP Resources, Inc.,
Sr. Unsec. Global Notes,
5.25%, 05/01/2023 | | | 2,000 | | | | 2,034 | |
5.63%, 03/01/2026 | | | 2,000 | | | | 2,035 | |
Sr. Unsec. Notes,
6.88%, 03/01/2021 | | | 2,000 | | | | 2,170 | |
Range Resources Corp., Sr. Unsec. Gtd. Global Notes,
4.88%, 05/15/2025 | | | 2,000 | | | | 1,940 | |
5.88%, 07/01/2022 | | | 2,000 | | | | 2,050 | |
See accompanying Notes to Financial Statements which are an integral part of the financial statements.
Invesco V.I. Core Plus Bond Fund
| | | | | | | | |
| | | Principal
Amount | | | Value | |
| Oil & Gas Exploration & Production–(continued) | |
RSP Permian, Inc., Sr. Unsec. Gtd. Global Notes, 5.25%, 01/15/2025 | | $ | 2,000 | | | $ | 2,060 | |
SM Energy Co., Sr. Unsec. Global Notes, 6.13%, 11/15/2022 | | | 2,000 | | | | 2,048 | |
Southwestern Energy Co., Sr. Unsec. Global Notes, 4.10%, 03/15/2022 | | | 2,000 | | | | 1,975 | |
Whiting Petroleum Corp., Sr. Unsec. Gtd. Global Notes, 6.25%, 04/01/2023 | | | 4,000 | | | | 4,110 | |
WildHorse Resource Development Corp., Sr. Unsec. Gtd. Global Notes, 6.88%, 02/01/2025 | | | 3,000 | | | | 3,075 | |
WPX Energy Inc., Sr. Unsec. Notes, 5.25%, 09/15/2024 | | | 2,000 | | | | 2,003 | |
| | | | | | | | 100,349 | |
|
| Oil & Gas Storage & Transportation–7.18% | |
Abu Dhabi Crude Oil Pipeline LLC (United Arab Emirates), Sr. Sec. Notes, 3.65%, 11/02/2029(b) | | | 200,000 | | | | 198,934 | |
Andeavor Logistics LP/ Tesoro Logistics Finance Corp.,
Sr. Unsec. Gtd. Global Notes, 5.20%, 12/01/2047 | | | 23,000 | | | | 24,059 | |
Sr. Unsec. Gtd. Notes, 4.25%, 12/01/2027 | | | 17,000 | | | | 17,175 | |
Antero Midstream Partners LP/Antero Midstream Finance Corp., Sr. Unsec. Gtd. Global Notes, 5.38%, 09/15/2024 | | | 2,000 | | | | 2,070 | |
Energy Transfer Equity, L.P., Sr. Sec. First Lien Notes, 5.88%, 01/15/2024 | | | 4,000 | | | | 4,220 | |
Energy Transfer Partners, L.P.,
Series A, Jr. Unsec. Sub. Global Notes, 6.25%(c) | | | 225,000 | | | | 218,953 | |
Series B, Jr. Unsec. Sub. Global Notes, 6.63%(c) | | | 106,000 | | | | 103,151 | |
Energy Transfer, L.P.,
Sr. Unsec. Global Notes, 4.65%, 06/01/2021 | | | 26,000 | | | | 27,310 | |
Sr. Unsec. Notes,
4.20%, 04/15/2027 | | | 22,000 | | | | 21,921 | |
4.75%, 01/15/2026 | | | 42,000 | | | | 43,635 | |
5.30%, 04/15/2047 | | | 47,000 | | | | 46,839 | |
Enterprise Products Operating LLC,
Series A, Jr. Unsec. Gtd. Sub. Variable Rate Notes, 5.08% (3 mo. USD LIBOR + 3.71%), 08/01/2066(e) | | | 79,000 | | | | 79,099 | |
Series D, Jr. Unsec. Gtd. Sub. Deb., 4.88%, 08/16/2077 | | | 42,000 | | | | 42,210 | |
EQT Midstream Partners L.P., Sr. Unsec. Notes, 4.00%, 08/01/2024 | | | 65,000 | | | | 65,326 | |
Holly Energy Partners L.P./Holly Energy Finance Corp., Sr. Unsec. Gtd. Notes, 6.00%, 08/01/2024(b) | | | 2,000 | | | | 2,095 | |
MPLX LP,
Sr. Unsec. Global Bonds, 4.50%, 07/15/2023 | | | 92,000 | | | | 97,300 | |
Sr. Unsec. Global Notes, 5.50%, 02/15/2023 | | | 76,000 | | | | 78,305 | |
| | | | | | | | |
| | | Principal
Amount | | | Value | |
| Oil & Gas Storage & Transportation–(continued) | |
NGPL PipeCo. LLC,
Sr. Unsec. Bonds,
4.88%, 08/15/2027(b) | | $ | 23,000 | | | $ | 23,949 | |
Sr. Unsec. Notes, 4.38%, 08/15/2022(b) | | | 13,000 | | | | 13,268 | |
Plains All American Pipeline, L.P., Series B, Jr. Unsec. Sub. Notes, 6.13%(c) | | | 181,000 | | | | 181,181 | |
Sabine Pass Liquefaction, LLC, Sr. Sec. First Lien Global Notes, 5.00%, 03/15/2027 | | | 27,000 | | | | 28,986 | |
SemGroup Corp./ Rose Rock Finance Corp., Sr. Unsec. Gtd. Global Notes, 5.63%, 11/15/2023 | | | 2,000 | | | | 1,960 | |
Sunoco Logistics Partners Operations L.P., Sr. Unsec. Gtd. Notes, 5.40%, 10/01/2047 | | | 31,000 | | | | 31,390 | |
Targa Resources Partners L.P./Targa Resources Partners Finance Corp., Sr. Unsec. Gtd. Global Bonds, 5.13%, 02/01/2025 | | | 2,000 | | | | 2,055 | |
5.25%, 05/01/2023 | | | 69,000 | | | | 70,725 | |
Williams Cos., Inc. (The),
Sr. Unsec. Global Notes, 4.55%, 06/24/2024 | | | 4,000 | | | | 4,170 | |
Sr. Unsec. Notes,
7.88%, 09/01/2021 | | | 4,000 | | | | 4,640 | |
Williams Partners L.P., Sr. Unsec. Notes, 4.13%, 11/15/2020 | | | 32,000 | | | | 33,247 | |
| | | | | | | | 1,468,173 | |
|
| Other Diversified Financial Services–0.54% | |
Football Trust V, Sec. Pass Through Ctfs., 5.35%, 10/05/2020(b) | | | 100,000 | | | | 106,498 | |
LPL Holdings Inc., Sr. Unsec. Gtd. Notes, 5.75%, 09/15/2025(b) | | | 2,000 | | | | 2,040 | |
VFH Parent LLC/Orchestra Co-Issuer Inc., Sec. Gtd. Second Lien Notes, 6.75%, 06/15/2022(b) | | | 2,000 | | | | 2,110 | |
| | | | | | | | 110,648 | |
|
| Packaged Foods & Meats–0.14% | |
B&G Foods, Inc., Sr. Unsec. Gtd. Notes, 5.25%, 04/01/2025 | | | 2,000 | | | | 2,039 | |
JBS USA Lux S.A./JBS USA Finance Inc. (Brazil), Sr. Unsec. Gtd. Notes, 5.75%, 06/15/2025(b) | | | 2,000 | | | | 1,935 | |
Kraft Heinz Foods Co. (The), Sr. Unsec. Gtd. Global Notes, 4.38%, 06/01/2046 | | | 20,000 | | | | 19,873 | |
Lamb Weston Holdings, Inc., Sr. Unsec. Gtd. Notes, 4.63%, 11/01/2024(b) | | | 4,000 | | | | 4,140 | |
| | | | | | | | 27,987 | |
|
| Paper Packaging–0.01% | |
Plastipak Holdings Inc., Sr. Unsec. Notes, 6.25%, 10/15/2025(b) | | | 2,000 | | | | 2,065 | |
|
| Paper Products–0.18% | |
Clearwater Paper Corp., Sr. Unsec. Gtd. Global Notes, 4.50%, 02/01/2023 | | | 2,000 | | | | 1,987 | |
Fibria Overseas Finance Ltd. (Brazil), Sr. Unsec. Gtd. Global Notes, 4.00%, 01/14/2025 | | | 33,000 | | | | 32,732 | |
See accompanying Notes to Financial Statements which are an integral part of the financial statements.
Invesco V.I. Core Plus Bond Fund
| | | | | | | | |
| | | Principal
Amount | | | Value | |
| Paper Products–(continued) | |
Mercer International Inc. (Canada), Sr. Unsec. Global Notes, 6.50%, 02/01/2024 | | $ | 2,000 | | | $ | 2,130 | |
| | | | | | | | 36,849 | |
|
| Pharmaceuticals–0.07% | |
Catalent Pharma Solutions, Inc., Sr. Unsec. Gtd. Notes, 4.88%, 01/15/2026(b) | | | 2,000 | | | | 2,013 | |
Valeant Pharmaceuticals International, Inc., Sr. Sec. Gtd. First Lien Notes, 5.50%, 11/01/2025(b) | | | 4,000 | | | | 4,090 | |
Sr. Unsec. Gtd. Notes,
5.63%, 12/01/2021(b) | | | 9,000 | | | | 8,831 | |
| | | | | | | | 14,934 | |
|
| Property & Casualty Insurance–0.72% | |
Allstate Corp. (The), Sr. Unsec. Notes, 4.20%, 12/15/2046 | | | 20,000 | | | | 21,894 | |
Arch Capital Finance LLC, Sr. Unsec. Gtd. Notes, 5.03%, 12/15/2046 | | | 22,000 | | | | 25,650 | |
Liberty Mutual Group Inc., Jr. Unsec. Gtd. Sub. Bonds, 7.80%, 03/07/2087(b) | | | 45,000 | | | | 57,398 | |
W.R. Berkley Corp., Sr. Unsec. Notes, 7.38%, 09/15/2019 | | | 40,000 | | | | 43,063 | |
| | | | | | | | 148,005 | |
|
| Railroads–0.01% | |
Kenan Advantage Group Inc. (The), Sr. Unsec. Notes, 7.88%, 07/31/2023(b) | | | 2,000 | | | | 2,080 | |
|
| Regional Banks–0.67% | |
CIT Group Inc., Sr. Unsec. Global Notes, 5.00%, 08/15/2022 | | | 3,000 | | | | 3,188 | |
5.00%, 08/01/2023 | | | 2,000 | | | | 2,135 | |
Fifth Third Bancorp, Unsec. Sub. Notes, 4.30%, 01/16/2024 | | | 55,000 | | | | 58,440 | |
First Niagara Financial Group Inc., Unsec. Sub. Notes, 7.25%, 12/15/2021 | | | 35,000 | | | | 40,324 | |
Synovus Financial Corp., Sr. Unsec. Global Notes, 3.13%, 11/01/2022 | | | 33,000 | | | | 32,767 | |
| | | | | | | | 136,854 | |
|
| Reinsurance–0.16% | |
Reinsurance Group of America, Inc., Sr. Unsec. Medium-Term Notes, 4.70%, 09/15/2023 | | | 30,000 | | | | 32,217 | |
|
| Residential REIT's–0.58% | |
Essex Portfolio L.P., Sr. Unsec. Gtd. Global Notes, 3.63%, 08/15/2022 | | | 115,000 | | | | 118,281 | |
|
| Restaurants–0.75% | |
1011778 BC ULC/ New Red Finance, Inc. (Canada),
Sec. Gtd. Second Lien Notes, 5.00%, 10/15/2025(b) | | | 97,000 | | | | 98,212 | |
Sr. Sec. Gtd. First Lien Notes, 4.63%, 01/15/2022(b) | | | 47,000 | | | | 48,234 | |
Aramark Services, Inc., Sr. Unsec. Gtd. Notes, 5.00%, 04/01/2025(b) | | | 2,000 | | | | 2,118 | |
| | | | | | | | |
| | | Principal
Amount | | | Value | |
| Restaurants–(continued) | |
Carrols Restaurant Group, Inc., Sec. Gtd. Second Lien Global Notes, 8.00%, 05/01/2022 | | $ | 2,000 | | | $ | 2,115 | |
KFC Holding Co./Pizza Hut Holdings LLC/Taco Bell of America LLC, Sr. Unsec. Gtd. Notes, 4.75%, 06/01/2027(b) | | | 2,000 | | | | 2,050 | |
| | | | | | | | 152,729 | |
|
| Retail REIT's–0.18% | |
Brixmor Operating Partnership LP, Sr. Unsec. Global Notes, 3.25%, 09/15/2023 | | | 38,000 | | | | 37,272 | |
|
| Semiconductor Equipment–0.01% | |
Entegris Inc., Sr. Unsec. Gtd. Notes, 4.63%, 02/10/2026(b) | | | 2,000 | | | | 2,040 | |
|
| Semiconductors–0.57% | |
Analog Devices, Inc., Sr. Unsec. Global Notes, 3.13%, 12/05/2023 | | | 30,000 | | | | 30,095 | |
Broadcom Corp./Broadcom Cayman Finance Ltd., Sr. Unsec. Gtd. Notes, 3.50%, 01/15/2028(b) | | | 89,000 | | | | 84,996 | |
Micron Technology, Inc., Sr. Unsec. Global Notes, 5.50%, 02/01/2025 | | | 2,000 | | | | 2,102 | |
| | | | | | | | 117,193 | |
|
| Sovereign Debt–0.38% | |
Argentine Republic Government International Bond (Argentina), Sr. Unsec. Notes, 7.13%, 06/28/2117(b) | | | 1,000 | | | | 1,033 | |
Hungary Government International Bond (Hungary), Sr. Unsec. Global Notes, 5.38%, 03/25/2024 | | | 28,000 | | | | 31,729 | |
Mexico Government International Bond (Mexico), Sr. Unsec. Global Notes, 4.00%, 10/02/2023 | | | 14,000 | | | | 14,686 | |
Peruvian Government International Bond (Peru), Sr. Unsec. Global Bonds, 4.13%, 08/25/2027 | | | 8,000 | | | | 8,712 | |
Uruguay Government International Bond (Uruguay), Sr. Unsec. Global Notes, 4.38%, 10/27/2027 | | | 20,000 | | | | 21,483 | |
| | | | | | | | 77,643 | |
|
| Specialized Consumer Services–0.03% | |
ServiceMaster Co., LLC (The),
Sr. Unsec. Gtd. Notes,
5.13%, 11/15/2024(b) | | | 2,000 | | | | 2,030 | |
Sr. Unsec. Notes, 7.45%, 08/15/2027 | | | 3,000 | | | | 3,263 | |
| | | | | | | | 5,293 | |
|
| Specialized Finance–3.05% | |
AerCap Global Aviation Trust (Ireland), Jr. Unsec. Gtd. Sub. Notes, 6.50%, 06/15/2045(b) | | | 235,000 | | | | 257,912 | |
Air Lease Corp., Sr. Unsec. Global Notes, 3.00%, 09/15/2023 | | | 64,000 | | | | 63,577 | |
3.38%, 06/01/2021 | | | 60,000 | | | | 61,333 | |
3.63%, 12/01/2027 | | | 35,000 | | | | 35,046 | |
3.88%, 04/01/2021 | | | 85,000 | | | | 88,098 | |
See accompanying Notes to Financial Statements which are an integral part of the financial statements.
Invesco V.I. Core Plus Bond Fund
| | | | | | | | |
| | | Principal
Amount | | | Value | |
| Specialized Finance–(continued) | |
Aircastle Ltd., Sr. Unsec. Notes, 5.00%, 04/01/2023 | | $ | 2,000 | | | $ | 2,113 | |
5.50%, 02/15/2022 | | | 2,000 | | | | 2,153 | |
Aviation Capital Group LLC, Sr. Unsec. Notes, 3.50%, 11/01/2027(b) | | | 115,000 | | | | 112,904 | |
| | | | | | | | 623,136 | |
|
| Specialized REIT's–2.07% | |
Crown Castle Towers LLC, Sr. Sec. Gtd. First Lien Notes, 4.88%, 08/15/2020(b) | | | 120,000 | | | | 125,565 | |
EPR Properties, Sr. Unsec. Gtd. Global Notes, 7.75%, 07/15/2020 | | | 253,000 | | | | 280,769 | |
Equinix Inc., Sr. Unsec. Notes, 5.88%, 01/15/2026 | | | 5,000 | | | | 5,381 | |
GLP Capital LP/GLP Financing II Inc., Sr. Unsec. Gtd. Notes, 5.38%, 04/15/2026 | | | 2,000 | | | | 2,150 | |
Iron Mountain Inc., Sr. Unsec. Gtd. Notes, 6.00%, 08/15/2023 | | | 2,000 | | | | 2,100 | |
Iron Mountain US Holdings, Inc., Sr. Unsec. Gtd. Notes, 5.38%, 06/01/2026(b) | | | 2,000 | | | | 2,065 | |
Rayonier A.M. Products Inc., Sr. Unsec. Gtd. Notes, 5.50%, 06/01/2024(b) | | | 4,000 | | | | 4,005 | |
SBA Communications Corp., Sr. Unsec. Global Notes, 4.88%, 09/01/2024 | | | 2,000 | | | | 2,060 | |
| | | | | | | | 424,095 | |
|
| Specialty Chemicals–0.07% | |
Ashland LLC, Sr. Unsec. Gtd. Global Notes, 4.75%, 08/15/2022 | | | 2,000 | | | | 2,085 | |
Kraton Polymers LLC/Kraton Polymers Capital Corp., Sr. Unsec. Gtd. Notes, 10.50%, 04/15/2023(b) | | | 2,000 | | | | 2,270 | |
Platform Specialty Products Corp., Sr. Unsec. Gtd. Notes,
5.88%, 12/01/2025(b) | | | 2,000 | | | | 1,987 | |
PQ Corp.,
Sr. Sec. Gtd. First Lien Notes,
6.75%, 11/15/2022(b) | | | 4,000 | | | | 4,285 | |
Sr. Unsec. Gtd. Notes,
5.75%, 12/15/2025(b) | | | 2,000 | | | | 2,040 | |
Venator Finance S.a.r.l./Venator Materials Corp., Sr. Unsec. Gtd. Notes,
5.75%, 07/15/2025(b) | | | 2,000 | | | | 2,120 | |
| | | | | | | | 14,787 | |
|
| Steel–0.10% | |
ArcelorMittal (Luxembourg), Sr. Unsec. Global Notes, 7.50%, 10/15/2039 | | | 2,000 | | | | 2,570 | |
Steel Dynamics, Inc., Sr. Unsec. Gtd. Global Notes, 5.13%, 10/01/2021 | | | 15,000 | | | | 15,413 | |
United States Steel Corp., Sr. Unsec. Global Notes, 6.88%, 08/15/2025 | | | 3,000 | | | | 3,146 | |
| | | | | | | | 21,129 | |
|
| Systems Software–0.35% | |
Microsoft Corp., Sr. Unsec. Global Notes, 4.25%, 02/06/2047 | | | 24,000 | | | | 27,484 | |
VMware, Inc., Sr. Unsec. Global Notes, 2.30%, 08/21/2020 | | | 45,000 | | | | 44,770 | |
| | | | | | | | 72,254 | |
| | | | | | | | |
| | | Principal
Amount | | | Value | |
| Technology Distributors–0.19% | |
Avnet, Inc., Sr. Unsec. Global Notes, 4.63%, 04/15/2026 | | $ | 35,000 | | | $ | 36,150 | |
CDW LLC/CDW Finance Corp., Sr. Unsec. Gtd. Notes, 5.00%, 09/01/2025 | | | 2,000 | | | | 2,080 | |
| | | | | | | | 38,230 | |
|
| Technology Hardware, Storage & Peripherals–0.83% | |
Apple Inc., Sr. Unsec. Global Notes, 4.25%, 02/09/2047 | | | 20,000 | | | | 22,261 | |
Dell International LLC/ EMC Corp.,
Sr. Sec. Gtd. First Lien Notes, 6.02%, 06/15/2026(b) | | | 92,000 | | | | 101,582 | |
8.35%, 07/15/2046(b) | | | 24,000 | | | | 31,001 | |
Sr. Unsec. Gtd. Notes,
7.13%, 06/15/2024(b) | | | 6,000 | | | | 6,571 | |
Diebold Nixdorf, Inc., Sr. Unsec. Gtd. Global Notes, 8.50%, 04/15/2024 | | | 4,000 | | | | 4,265 | |
Western Digital Corp., Sr. Unsec. Gtd. Global Notes, 10.50%, 04/01/2024 | | | 4,000 | | | | 4,645 | |
| | | | | | | | 170,325 | |
|
| Tobacco–0.56% | |
BAT Capital Corp. (United Kingdom), Sr. Unsec. Gtd. Notes,
3.22%, 08/15/2024(b) | | | 33,000 | | | | 33,040 | |
Philip Morris International Inc., Sr. Unsec. Global Notes, 2.50%, 11/02/2022 | | | 83,000 | | | | 82,306 | |
| | | | | | | | 115,346 | |
|
| Trading Companies & Distributors–0.05% | |
BMC East, LLC, Sr. Sec. Gtd. First Lien Notes, 5.50%, 10/01/2024(b) | | | 4,000 | | | | 4,150 | |
H&E Equipment Services, Inc., Sr. Unsec. Gtd. Notes, 5.63%, 09/01/2025(b) | | | 2,000 | | | | 2,095 | |
Herc Rentals Inc., Sec. Gtd. Second Lien Notes, 7.75%, 06/01/2024(b) | | | 2,000 | | | | 2,205 | |
United Rentals North America, Inc., Sr. Unsec. Gtd. Notes, 5.50%, 05/15/2027 | | | 2,000 | | | | 2,110 | |
| | | | | | | | 10,560 | |
|
| Trucking–0.14% | |
DAE Funding LLC (United Arab Emirates), Sr. Unsec. Gtd. Notes,
4.00%, 08/01/2020(b) | | | 12,000 | | | | 12,150 | |
4.50%, 08/01/2022(b) | | | 17,000 | | | | 16,745 | |
| | | | | | | | 28,895 | |
|
| Wireless Telecommunication Services–0.10% | |
Sprint Communications Inc., Sr. Unsec. Gtd. Notes, 7.00%, 03/01/2020(b) | | | 8,000 | | | | 8,580 | |
Sprint Corp., Sr. Unsec. Gtd. Global Notes, 7.25%, 09/15/2021 | | | 7,000 | | | | 7,429 | |
7.88%, 09/15/2023 | | | 4,000 | | | | 4,270 | |
| | | | | | | | 20,279 | |
Total Bonds & Notes
(Cost $11,567,997) | | | | | | | 11,951,367 | |
See accompanying Notes to Financial Statements which are an integral part of the financial statements.
Invesco V.I. Core Plus Bond Fund
| | | | | | | | |
| | | Principal
Amount | | | Value | |
U.S. Government Sponsored Agency Mortgage-Backed Securities–14.35% | |
| Collateralized Mortgage Obligations–0.29% | |
Freddie Mac Whole Loan Securities Trust, 3.50%, 05/25/2047 | | $ | 33,547 | | | $ | 33,948 | |
Ginnie Mae REMICs, IO, 1.59%, 09/20/2064(f) | | | 268,185 | | | | 24,283 | |
| | | | | | | | 58,231 | |
|
| Federal Home Loan Mortgage Corp. (FHLMC)–3.17% | |
Pass Through Ctfs., 6.50%, 07/01/2031 to 08/01/2032 | | | 1,469 | | | | 1,627 | |
Pass Through Ctfs., TBA, 3.50%, 02/01/2048(g) | | | 488,000 | | | | 500,609 | |
4.00%, 02/01/2048(g) | | | 140,000 | | | | 146,268 | |
| | | | | | | | 648,504 | |
|
| Federal National Mortgage Association (FNMA)–8.07% | |
Pass Through Ctfs.,
5.00%, 11/01/2018 | | | 760 | | | | 774 | |
7.50%, 04/01/2029 | | | 1,953 | | | | 2,109 | |
3.50%, 12/01/2030 | | | 56,480 | | | | 58,625 | |
6.50%, 09/01/2031 | | | 887 | | | | 1,004 | |
7.00%, 09/01/2032 | | | 5,326 | | | | 5,635 | |
Pass Through Ctfs., TBA, 2.50%, 02/01/2033(g) | | | 291,000 | | | | 290,464 | |
3.00%, 02/01/2033 to
02/01/2048(g) | | | 444,000 | | | | 447,105 | |
3.50%, 02/01/2048(g) | | | 497,000 | | | | 509,792 | |
4.00%, 02/01/2048(g) | | | 320,000 | | | | 334,391 | |
| | | | | | | | 1,649,899 | |
|
Government National Mortgage Association
(GNMA)–2.82% | |
Pass Through Ctfs.,
7.50%, 06/15/2023 | | | 1,775 | | | | 1,882 | |
8.50%, 11/15/2024 | | | 983 | | | | 986 | |
7.00%, 07/15/2031 to 08/15/2031 | | | 1,081 | | | | 1,213 | |
6.50%, 11/15/2031 to 03/15/2032 | | | 2,479 | | | | 2,752 | |
6.00%, 11/15/2032 | | | 1,209 | | | | 1,380 | |
Pass Through Ctfs., TBA, 3.00%, 02/01/2048(g) | | | 345,000 | | | | 347,672 | |
4.00%, 02/01/2048(g) | | | 212,000 | | | | 221,058 | |
| | | | | | | | 576,943 | |
Total U.S. Government Sponsored Agency Mortgage-Backed Securities (Cost $2,941,639) | | | | 2,933,577 | |
|
Asset-Backed Securities–12.99% | |
Adjustable Rate Mortgage Trust, Series 2004-2, Class 6A1, Variable Rate Pass Through Ctfs., 3.60%, 02/25/2035(f) | | | 21,427 | | | | 21,612 | |
Angel Oak Mortgage Trust LLC, Series 2017-3, Class A1, Variable Rate Pass Through Ctfs., 2.71%, 11/25/2047(b)(f) | | | 48,715 | | | | 48,654 | |
Banc of America Commercial Mortgage Trust, Series 2015-UBS7, Class AS, Variable Rate Pass Through Ctfs., 3.99%, 09/15/2048(f) | | | 70,000 | | | | 73,029 | |
| | | | | | | | |
| | | Principal
Amount | | | Value | |
Barclays Bank Commercial Mortgage Securities Trust, Series 2015-RRI, Class D, Floating Rate Pass Through Ctfs., 4.25% (1 mo. USD LIBOR + 3.00%), 05/15/2032(b)(e) | | $ | 230,000 | | | $ | 230,979 | |
Bear Stearns Adjustable Rate Mortgage Trust,
Series 2005-2, Class A1,
Floating Rate Pass Through Ctfs.,
3.26% (1 yr. U.S. Treasury Yield Curve Rate + 2.45%), 03/25/2035(e) | | | 77,384 | | | | 78,404 | |
Series 2005-2, Class A2, Floating Rate Pass Through Ctfs., 3.64% (1 yr. USD LIBOR + 1.95%), 03/25/2035(e) | | | 10,206 | | | | 10,331 | |
Series 2005-5, Class A1, Floating Rate Pass Through Ctfs., 3.28% (1 yr. U.S. Treasury Yield Curve Rate + 2.05%), 08/25/2035(e) | | | 15,852 | | | | 16,198 | |
CGDBB Commercial Mortgage Trust, Series 2017-BIOC, Class A, Floating Rate Pass Through Ctfs., 2.27% (1 mo. USD LIBOR + 0.79%), 07/15/2028(b)(e) | | | 100,000 | | | | 100,235 | |
Series 2017-BIOC, Class C, Floating Rate Pass Through Ctfs., 2.53% (1 mo. USD LIBOR + 1.05%), 07/15/2028(b)(e) | | | 100,000 | | | | 100,110 | |
Series 2017-BIOC, Class D, Floating Rate Pass Through Ctfs., 3.08% (1 mo. USD LIBOR + 1.60%), 07/15/2028(b)(e) | | | 100,000 | | | | 100,118 | |
Chase Mortgage Trust,
Series 2016-1, Class M3, Variable Rate Pass Through Ctfs., 3.75%, 04/25/2045(b)(f) | | | 73,358 | | | | 73,487 | |
Series 2016-2, Class M3, Variable Rate Pass Through Ctfs., 3.75%, 12/25/2045(b)(f) | | | 80,346 | | | | 80,270 | |
Commercial Mortgage Trust, Series 2015-CR23, Class CMB, Variable Rate Pass Through Ctfs., 3.68%, 05/10/2048(b)(f) | | | 150,000 | | | | 150,878 | |
Series 2015-CR25, Class B, Variable Rate Pass Through Ctfs., 4.55%, 08/10/2048(f) | | | 72,000 | | | | 76,465 | |
Series 2016-GCT, Class B, Pass Through Ctfs., 3.09%, 08/10/2029(b) | | | 100,000 | | | | 99,863 | |
Credit Suisse First Boston Mortgage Securities Corp., Series 2004-AR5, Class 3A1, Variable Rate Pass Through Ctfs., 3.49%, 06/25/2034(f) | | | 29,700 | | | | 30,052 | |
DB Master Finance LLC, Series 2015-1A, Class A2II, Pass Through Ctfs., 3.98%, 02/20/2045(b) | | | 67,103 | | | | 68,597 | |
Dominos Pizza Master Issuer LLC, Series 2017-1A, Class A2II, Pass Through Ctfs., 3.08%, 07/25/2047(b) | | | 49,875 | | | | 49,440 | |
GMACM Mortgage Loan Trust, Series 2006-AR1, Class 1A1, Variable Rate Pass Through Ctfs., 3.84%, 04/19/2036(f) | | | 84,395 | | | | 79,895 | |
HMH Trust, Series 2017-NSS, Class A, Pass Through Ctfs., 3.06%, 07/05/2031(b) | | | 100,000 | | | | 99,602 | |
Invitation Homes Trust, Series 2017-SFR2, Class C, Floating Rate Pass Through Ctfs., 2.94% (1 mo. USD LIBOR + 1.45%), 12/17/2036(b)(e) | | | 100,000 | | | | 100,833 | |
See accompanying Notes to Financial Statements which are an integral part of the financial statements.
Invesco V.I. Core Plus Bond Fund
| | | | | | | | |
| | | Principal
Amount | | | Value | |
JP Morgan Chase Commercial Mortgage Securities Trust, Series 2013-LC11, Class C, Variable Rate Pass Through Ctfs., 3.96%, 04/15/2046(f) | | $ | 50,000 | | | $ | 50,347 | |
Merrill Lynch Mortgage Investors Trust, Series 2005-3, Class 3A, Variable Rate Pass Through Ctfs., 3.30%, 11/25/2035(f) | | | 23,281 | | | | 23,474 | |
Morgan Stanley Capital I Trust, Series 2006-HQ10, Class AJ, Variable Rate Pass Through Ctfs., 5.39%, 11/12/2041(f) | | | 20,453 | | | | 20,494 | |
Series 2017-CLS, Class A, Floating Rate Pass Through Ctfs., 1.95% (1 mo. USD LIBOR + 0.70%), 11/15/2034(b)(e) | | | 99,000 | | | | 99,123 | |
Series 2017-CLS, Class B, Floating Rate Pass Through Ctfs., 2.10% (1 mo. USD LIBOR + 0.85%), 11/15/2034(b)(e) | | | 49,000 | | | | 49,038 | |
Series 2017-CLS, Class C, Floating Rate Pass Through Ctfs., 2.25% (1 mo. USD LIBOR + 1.00%), 11/15/2034(b)(e) | | | 33,000 | | | | 33,026 | |
Starwood Waypoint Homes Trust, Series 2017-1, Class D, Floating Rate Pass Through Ctfs., 3.44% (1 mo. USD LIBOR + 1.95%), 01/17/2035(b)(e) | | | 100,000 | | | | 100,834 | |
Structured Adjustable Rate Mortgage Loan Trust, Series 2004-12, Class 3A2, Variable Rate Pass Through Ctfs., 3.46%, 09/25/2034(f) | | | 23,764 | | | | 23,545 | |
Structured Asset Securities Corp., Series 2003-34A, Class 5A5, Variable Rate Pass Through Ctfs., 3.51%, 11/25/2033(f) | | | 101,652 | | | | 102,477 | |
Thornburg Mortgage Securities Trust, Series 2005-1, Class A3, Variable Rate Pass Through Ctfs., 3.19%, 04/25/2045(f) | | | 82,924 | | | | 83,481 | |
Series 2005-2, Class A1, Variable Rate Pass Through Ctfs., 3.17%, 07/25/2045(f) | | | 36,956 | | | | 36,125 | |
Towd Point Mortgage Trust, Series 2017-2, Class A1, Variable Rate Pass Through Ctfs., 2.75%, 04/25/2057(b)(f) | | | 87,304 | | | | 87,335 | |
Wachovia Bank Commercial Mortgage Trust, Series 2006-C27, Class AJ, Variable Rate Pass Through Ctfs., 5.83%, 07/15/2045(f) | | | 28,320 | | | | 28,448 | |
Wells Fargo Mortgage Backed Securities Trust, Series 2004-Z, Class 2A1, Variable Rate Pass Through Ctfs., 3.74%, 12/25/2034(f) | | | 34,769 | | | | 35,493 | |
Wendys Funding LLC,
Series 2018-1A, Class A2I, Pass Through Ctfs.,
3.57%, 03/15/2048(b) | | | 50,000 | | | | 50,047 | |
Series 2018-1A, Class A2II, Pass Through Ctfs., 3.88%, 03/15/2048(b) | | | 60,000 | | | | 60,117 | |
WFRBS Commercial Mortgage Trust, Series 2012-C6, Class B, Pass Through Ctfs., 4.70%, 04/15/2045 | | | 80,000 | | | | 84,412 | |
Total Asset-Backed Securities
(Cost $2,645,305) | | | | | | | 2,656,868 | |
| | | | | | | | |
| | | Principal
Amount | | | Value | |
U.S. Treasury Securities–7.53% | |
| U.S. Treasury Bills-1.63% | | | | | | | | |
1.04%, 02/01/2018(h)(i) | | $ | 5,000 | | | $ | 4,994 | |
1.09%, 02/01/2018(h)(i) | | | 3,000 | | | | 2,997 | |
1.10%, 02/01/2018(h)(i) | | | 321,000 | | | | 320,663 | |
1.13%, 02/01/2018(h)(i) | | | 5,000 | | | | 4,995 | |
| | | | | | | | 333,649 | |
|
| U.S. Treasury Notes–4.33% | |
1.88%, 12/15/2020 | | | 66,500 | | | | 66,309 | |
2.00%, 11/30/2022 | | | 99,800 | | | | 98,890 | |
2.13%, 11/30/2024 | | | 60,000 | | | | 59,206 | |
2.25%, 11/15/2027 | | | 670,200 | | | | 660,640 | |
| | | | | | | | 885,045 | |
|
| U.S. Treasury Bonds–1.57% | |
2.75%, 08/15/2047 | | | 320,100 | | | | 320,209 | |
Total U.S. Treasury Securities
(Cost $1,538,709) | | | | | | | 1,538,903 | |
| | |
| | | Shares | | | | |
Preferred Stocks–1.00% | |
| Investment Banking & Brokerage–0.70% | |
Morgan Stanley, Series F, 6.88% Pfd. | | | 5,000 | | | | 142,200 | |
|
| Regional Banks–0.03% | |
SunTrust Banks, Inc., Series G, 5.05% Pfd. | | | 7,000 | | | | 7,105 | |
|
| Reinsurance–0.27% | |
Reinsurance Group of America, Inc., 6.20% Pfd. | | | 2,000 | | | | 55,040 | |
Total Preferred Stocks
(Cost $182,000) | | | | | | | 204,345 | |
| | |
| | | Principal
Amount | | | | |
|
Municipal Obligations–0.31% | |
Georgia (State of) Municipal Electric Authority (Plant Vogtle Units 3 & 4 Project J); Series 2010 A, Taxable Build America RB, 6.64%, 04/01/2057 (Cost $50,000) | | $ | 50,000 | | | | 64,271 | |
|
Variable Rate Senior Loan Interests–0.29%(j) | |
| Food Retail–0.29% | |
Albertson's LLC, Term Loan B-4, 4.10% (1 mo. USD LIBOR + 2.75%), 08/25/2021 (Cost $58,254) | | | 60,695 | | | | 59,581 | |
| | |
| | | Shares | | | | |
|
Common Stocks & Other Equity Interests–0.00% | |
| Broadcasting–0.00% | |
Adelphia Recovery Trust–Series ACC-1(k) | | | 87,412 | | | | 9 | |
|
| Diversified Support Services–0.00% | |
ACC Claims Holdings, LLC(l) | | | 73,980 | | | | 259 | |
Total Common Stocks & Other Equity Interests
(Cost $22,181) | | | | 268 | |
See accompanying Notes to Financial Statements which are an integral part of the financial statements.
Invesco V.I. Core Plus Bond Fund
| | | | | | | | |
| | |
Shares | | | Value | |
Money Market Funds–18.40% | |
Invesco Government & Agency Portfolio–Institutional Class, 1.18%(m) | | | 1,317,300 | | | $ | 1,317,300 | |
Invesco Liquid Assets Portfolio–Institutional Class, 1.40%(m) | | | 940,744 | | | | 940,838 | |
Invesco Treasury Portfolio–Institutional Class, 1.17%(m) | | | 1,505,486 | | | | 1,505,486 | |
Total Money Market Funds
(Cost $3,763,716) | | | | | | | 3,763,624 | |
TOTAL INVESTMENTS IN SECURITIES–113.32% (Cost $22,769,801) | | | | | | | 23,172,804 | |
OTHER ASSETS LESS LIABILITIES–(13.32)% | | | | | | | (2,723,877 | ) |
NET ASSETS–100.00% | | | | | | $ | 20,448,927 | |
Investment Abbreviations:
| | |
| Ctfs. | | – Certificates |
| Deb. | | – Debentures |
| Gtd. | | – Guaranteed |
| IO | | – Interest Only |
| Jr. | | – Junior |
| LIBOR | | – London Interbank Offered Rate |
| Pfd. | | – Preferred |
| PIK | | – Pay-in-Kind |
| RB | | – Revenue Bonds |
| REIT | | – Real Estate Investment Trust |
| REMICS | | – Real Estate Mortgage Investment Conduits |
| Sec. | | – Secured |
| Sr. | | – Senior |
| Sub. | | – Subordinated |
| TBA | | – To Be Announced |
| Unsec. | | – Unsecured |
| USD | | – U.S. Dollar |
Notes to Schedule of Investments:
| (a) | Industry and/or sector classifications used in this report are generally according to the Global Industry Classification Standard, which was developed by and is the exclusive property and a service mark of MSCI Inc. and Standard & Poor's. |
| (b) | Security purchased or received in a transaction exempt from registration under the Securities Act of 1933, as amended (the "1933 Act"). The security may be resold pursuant to an exemption from registration under the 1933 Act, typically to qualified institutional buyers. The aggregate value of these securities at December 31, 2017 was $5,381,408, which represented 26.32% of the Fund's Net Assets. |
| (c) | Perpetual bond with no specified maturity date. |
| (d) | All or a portion of this security is Pay-in-Kind. Pay-in-Kind securities pay interest income in the form of securities. |
| (e) | Interest or dividend rate is redetermined periodically. Rate shown is the rate in effect on December 31, 2017. |
| (f) | Interest rate is redetermined periodically based on the cash flows generated by the pool of assets backing the security, less any applicable fees. The rate shown is the rate in effect December 31, 2017. |
| (g) | Security purchased on a forward commitment basis. This security is subject to dollar roll transactions. See Note 1M. |
| (h) | Security traded on a discount basis. The interest rate shown represents the discount rate at the time of purchase by the Fund. |
| (i) | All or a portion of the value was pledged as collateral to cover margin requirements for open futures contracts. See Note 1L. |
| (j) | Variable rate senior loan interests are, at present, not readily marketable, not registered under the 1933 Act, and may be subject to contractual and legal restrictions on sale. Variable rate senior loan interests in the Fund's portfolio generally have variable rates which adjust to a base, such as the LIBOR, on set dates, typically every 30 days but not greater than one year; and/or have interest rates that float at a margin above a widely recognized base lending rate such as the Prime Rate of a designated U.S. bank. |
| (k) | Non-income producing security acquired as part of the Adelphia Communications bankruptcy reorganization. |
| (l) | Non-income producing security. |
| (m) | The money market fund and the Fund are affiliated by having the same investment adviser. The rate shown is the 7-day SEC standardized yield as of December 31, 2017. |
See accompanying Notes to Financial Statements which are an integral part of the financial statements.
Invesco V.I. Core Plus Bond Fund
| | | | | | | | | | | | | | | | | | | | |
| Open Futures Contracts | |
| | | Number of
Contracts | | | Expiration
Month | | | Notional
Value | | | Value | | | Unrealized
Appreciation
(Depreciation) | |
Long Futures Contracts | | | | | | | | | | | | | | | | | | | | |
U.S. Treasury 5 Year Notes | | | 11 | | | | March-2018 | | | $ | 1,277,804 | | | $ | (2,865 | ) | | $ | (2,865 | ) |
U.S. Treasury 10 Year Ultra Bonds | | | 2 | | | | March-2018 | | | | 267,125 | | | | (1,167 | ) | | | (1,167 | ) |
U.S. Treasury Long Bonds | | | 4 | | | | March-2018 | | | | 612,000 | | | | (984 | ) | | | (984 | ) |
Subtotal — Long Futures Contracts | | | | | | | | | | | | | | | (5,016 | ) | | | (5,016 | ) |
| | | | | |
| | | | | | | | | | | | | | | | | | | | |
Short Futures Contracts | | | | | | | | | | | | | | | | | | | | |
U.S. Treasury 2 Year Notes | | | 6 | | | | March-2018 | | | | (1,284,656 | ) | | | 1,206 | | | | 1,206 | |
Total Futures Contracts — Interest Rate Risk | | | | | | | | | | | | | | $ | (3,810 | ) | | $ | (3,810 | ) |
| | | | | | | | | | | | | | | | | | | | | | |
| | | Open Forward Foreign Currency Contracts-Currency Risk | |
Settlement
Date | | | | Contract to | | | Unrealized
Appreciation
(Depreciation) | |
| | Counterparty | | Deliver | | | Receive | | |
02/28/2018 | | Barclays Bank PLC | | | EUR | | | | 101,288 | | | | USD | | | | 119,642 | | | $ | (2,322 | ) |
Abbreviations:
| | |
| EUR | | – Euro |
| USD | | – U.S. Dollar |
See accompanying Notes to Financial Statements which are an integral part of the financial statements.
Invesco V.I. Core Plus Bond Fund
Statement of Assets and Liabilities
December 31, 2017
Statement of Operations
For the year ended December 31, 2017
| | | | |
Assets: | | | | |
Investments in securities, at value (Cost $19,006,085) | | $ | 19,409,180 | |
Investments in affiliated money market funds, at value (Cost $3,763,716) | | | 3,763,624 | |
Other investments: | | | | |
Variation margin receivable — futures contracts | | | 1,515 | |
Foreign currencies, at value (Cost $121,749) | | | 122,803 | |
Receivable for: | | | | |
Investments sold | | | 2,799,551 | |
Fund shares sold | | | 1,375 | |
Dividends and interest | | | 161,576 | |
Principal paydowns | | | 180 | |
Investment for trustee deferred compensation and retirement plans | | | 63,373 | |
Other assets | | | 3,195 | |
Total assets | | | 26,326,372 | |
| |
Liabilities: | | | | |
Other investments: | | | | |
Unrealized depreciation on forward foreign currency contracts outstanding | | | 2,322 | |
Payable for: | | | | |
Investments purchased | | | 5,741,187 | |
Fund shares reacquired | | | 1,276 | |
Accrued fees to affiliates | | | 11,515 | |
Accrued trustees’ and officers’ fees and benefits | | | 738 | |
Accrued other operating expenses | | | 54,920 | |
Trustee deferred compensation and retirement plans | | | 65,487 | |
Total liabilities | | | 5,877,445 | |
Net assets applicable to shares outstanding | | $ | 20,448,927 | |
| |
Net assets consist of: | | | | |
Shares of beneficial interest | | $ | 19,488,001 | |
Undistributed net investment income | | | 562,630 | |
Undistributed net realized gain | | | 371 | |
Net unrealized appreciation | | | 397,925 | |
| | | $ | 20,448,927 | |
|
Net Assets: | |
Series I | | $ | 20,326,253 | |
Series II | | $ | 122,674 | |
|
Shares outstanding, no par value,
with an unlimited number of shares authorized: | |
Series I | | | 3,187,842 | |
Series II | | | 19,322 | |
Series I: | | | | |
Net asset value and offering price per share | | $ | 6.38 | |
Series II: | | | | |
Net asset value per share | | $ | 6.35 | |
| | | | |
Investment income: | | | | |
Interest | | $ | 683,342 | |
Dividends | | | 11,719 | |
Dividends from affiliated money market funds | | | 19,687 | |
Total investment income | | | 714,748 | |
| |
Expenses: | | | | |
Advisory fees | | | 79,181 | |
Administrative services fees | | | 75,307 | |
Custodian fees | | | 15,478 | |
Distribution fees — Series II | | | 312 | |
Transfer agent fees | | | 8,750 | |
Trustees’ and officers’ fees and benefits | | | 20,923 | |
Reports to shareholders | | | 13,092 | |
Professional services fees | | | 52,829 | |
Other | | | 11,808 | |
Total expenses | | | 277,680 | |
Less: Fees waived | | | (172,326 | ) |
Net expenses | | | 105,354 | |
Net investment income | | | 609,394 | |
| |
Realized and unrealized gain (loss) from: | | | | |
Net realized gain (loss) from: | | | | |
Investment securities | | | 299,835 | |
Foreign currencies | | | 1,043 | |
Forward foreign currency contracts | | | (3,444 | ) |
Futures contracts | | | (98,763 | ) |
Swap agreements | | | (3,107 | ) |
| | | | 195,564 | |
Change in net unrealized appreciation (depreciation) of: | | | | |
Investment securities | | | 213,055 | |
Foreign currencies | | | 1,054 | |
Forward foreign currency contracts | | | (2,322 | ) |
Futures contracts | | | (12,962 | ) |
Swap agreements | | | 2,859 | |
| | | | 201,684 | |
Net realized and unrealized gain | | | 397,248 | |
Net increase in net assets resulting from operations | | $ | 1,006,642 | |
See accompanying Notes to Financial Statements which are an integral part of the financial statements.
Invesco V.I. Core Plus Bond Fund
Statement of Changes in Net Assets
For the years ended December 31, 2017 and 2016
| | | | | | | | |
| | | 2017 | | | 2016 | |
Operations: | | | | | | | | |
Net investment income | | $ | 609,394 | | | $ | 582,105 | |
Net realized gain | | | 195,564 | | | | 97,505 | |
Change in net unrealized appreciation | | | 201,684 | | | | 338,816 | |
Net increase in net assets resulting from operations | | | 1,006,642 | | | | 1,018,426 | |
| | |
Distributions to shareholders from net investment income: | | | | | | | | |
Series I | | | (647,374 | ) | | | (646,158 | ) |
Series ll | | | (3,900 | ) | | | (4,899 | ) |
Total distributions from net investment income | | | (651,274 | ) | | | (651,057 | ) |
| | |
Share transactions–net: | | | | | | | | |
Series l | | | 4,488,700 | | | | (463,972 | ) |
Series ll | | | (6,224 | ) | | | (35,515 | ) |
Net increase (decrease) in net assets resulting from share transactions | | | 4,482,476 | | | | (499,487 | ) |
Net increase (decrease) in net assets | | | 4,837,844 | | | | (132,118 | ) |
| | |
Net assets: | | | | | | | | |
Beginning of year | | | 15,611,083 | | | | 15,743,201 | |
End of year (includes undistributed net investment income of $562,630 and $555,060, respectively) | | $ | 20,448,927 | | | $ | 15,611,083 | |
Notes to Financial Statements
December 31, 2017
NOTE 1—Significant Accounting Policies
Invesco V.I. Core Plus Bond Fund (the “Fund”) is a series portfolio of AIM Variable Insurance Funds (Invesco Variable Insurance Funds) (the “Trust”). The Trust is a Delaware statutory trust registered under the Investment Company Act of 1940, as amended (the “1940 Act”), as an open-end series management investment company consisting of twenty-four separate portfolios, (each constituting a “Fund”). The assets, liabilities and operations of each portfolio are accounted for separately. Information presented in these financial statements pertains only to the Fund. Matters affecting each Fund or class will be voted on exclusively by the shareholders of such Fund or class. Current Securities and Exchange Commission (“SEC”) guidance, however, requires participating insurance companies offering separate accounts to vote shares proportionally in accordance with the instructions of the contract owners whose investments are funded by shares of each Fund or class.
The Fund’s investment objective is total return, comprised of current income and capital appreciation.
The Fund currently offers two classes of shares, Series I and Series II, both of which are offered to insurance company separate accounts funding variable annuity contracts and variable life insurance policies (“variable products”).
The Fund is an investment company and accordingly follows the investment company accounting and reporting guidance in accordance with Financial Accounting Standards Board Accounting Standards Codification Topic 946, Financial Services — Investment Companies.
The following is a summary of the significant accounting policies followed by the Fund in the preparation of its financial statements.
| A. | Security Valuations — Securities, including restricted securities, are valued according to the following policy. |
Debt obligations (including convertible securities) and unlisted equities are fair valued using an evaluated quote provided by an independent pricing service. Evaluated quotes provided by the pricing service may be determined without exclusive reliance on quoted prices, and may reflect appropriate factors such as institution-size trading in similar groups of securities, developments related to specific securities, dividend rate (for unlisted equities), yield (for debt obligations), quality, type of issue, coupon rate (for debt obligations), maturity (for debt obligations), individual trading characteristics and other market data. Pricing services generally value debt obligations assuming orderly transactions of institutional round lot size, but a fund may hold or transact in the same securities in smaller, odd lot sizes. Odd lots often trade at lower prices than institutional round lots. Debt obligations are subject to interest rate and credit risks. In addition, all debt obligations involve some risk of default with respect to interest and/or principal payments.
A security listed or traded on an exchange (except convertible securities) is valued at its last sales price or official closing price as of the close of the customary trading session on the exchange where the security is principally traded, or lacking any sales or official closing price on a particular day, the security may be valued at the closing bid price on that day. Securities traded in the over-the-counter market are valued based on prices furnished by independent pricing services or market makers. When such securities are valued by an independent pricing service they may be considered fair valued. Futures contracts are valued at the final settlement price set by an exchange on which they are principally traded. Listed options are valued at the mean between the last bid and asked prices from the exchange on which they are principally traded. Options not listed on an exchange are valued by an independent source at the mean between the last bid and asked prices. For purposes of determining net asset value (“NAV”) per share, futures and option contracts generally are valued 15 minutes after the close of the customary trading session of the New York Stock Exchange (“NYSE”).
Invesco V.I. Core Plus Bond Fund
Investments in open-end and closed-end registered investment companies that do not trade on an exchange are valued at the end-of-day net asset value per share. Investments in open-end and closed-end registered investment companies that trade on an exchange are valued at the last sales price or official closing price as of the close of the customary trading session on the exchange where the security is principally traded.
Swap agreements are fair valued using an evaluated quote, if available, provided by an independent pricing service. Evaluated quotes provided by the pricing service are valued based on a model which may include end-of-day net present values, spreads, ratings, industry, company performance and returns of referenced assets. Centrally cleared swap agreements are valued at the daily settlement price determined by the relevant exchange or clearinghouse.
Foreign securities’ (including foreign exchange contracts) prices are converted into U.S. dollar amounts using the applicable exchange rates as of the close of the NYSE. If market quotations are available and reliable for foreign exchange-traded equity securities, the securities will be valued at the market quotations. Because trading hours for certain foreign securities end before the close of the NYSE, closing market quotations may become unreliable. If between the time trading ends on a particular security and the close of the customary trading session on the NYSE, events occur that the investment adviser determines are significant and make the closing price unreliable, the Fund may fair value the security. If the event is likely to have affected the closing price of the security, the security will be valued at fair value in good faith using procedures approved by the Board of Trustees. Adjustments to closing prices to reflect fair value may also be based on a screening process of an independent pricing service to indicate the degree of certainty, based on historical data, that the closing price in the principal market where a foreign security trades is not the current value as of the close of the NYSE. Foreign securities’ prices meeting the approved degree of certainty that the price is not reflective of current value will be priced at the indication of fair value from the independent pricing service. Multiple factors may be considered by the independent pricing service in determining adjustments to reflect fair value and may include information relating to sector indices, American Depositary Receipts and domestic and foreign index futures. Foreign securities may have additional risks including exchange rate changes, potential for sharply devalued currencies and high inflation, political and economic upheaval, the relative lack of issuer information, relatively low market liquidity and the potential lack of strict financial and accounting controls and standards.
Securities for which market prices are not provided by any of the above methods may be valued based upon quotes furnished by independent sources. The last bid price may be used to value equity securities. The mean between the last bid and asked prices is used to value debt obligations, including corporate loans.
Securities for which market quotations are not readily available or became unreliable are valued at fair value as determined in good faith by or under the supervision of the Trust’s officers following procedures approved by the Board of Trustees. Issuer specific events, market trends, bid/asked quotes of brokers and information providers and other market data may be reviewed in the course of making a good faith determination of a security’s fair value.
The Fund may invest in securities that are subject to interest rate risk, meaning the risk that the prices will generally fall as interest rates rise and, conversely, the prices will generally rise as interest rates fall. Specific securities differ in their sensitivity to changes in interest rates depending on their individual characteristics. Changes in interest rates may result in increased market volatility, which may affect the value and/or liquidity of certain Fund investments.
Valuations change in response to many factors including the historical and prospective earnings of the issuer, the value of the issuer’s assets, general economic conditions, interest rates, investor perceptions and market liquidity. Because of the inherent uncertainties of valuation, the values reflected in the financial statements may materially differ from the value received upon actual sale of those investments.
| B. | Securities Transactions and Investment Income — Securities transactions are accounted for on a trade date basis. Realized gains or losses on sales are computed on the basis of specific identification of the securities sold. Interest income (net of withholding tax, if any) is recorded on the accrual basis from settlement date. Bond premiums and discounts are amortized and/or accreted over the lives of the respective securities. Pay-in-kind interest income and non-cash dividend income received in the form of securities in-lieu of cash are recorded at the fair value of the securities received. Paydown gains and losses on mortgage and asset-backed securities are recorded as adjustments to interest income. Dividend income (net of withholding tax, if any) is recorded on the ex-dividend date. |
The Fund may periodically participate in litigation related to Fund investments. As such, the Fund may receive proceeds from litigation settlements. Any proceeds received are included in the Statement of Operations as realized gain (loss) for investments no longer held and as unrealized gain (loss) for investments still held.
Brokerage commissions and mark ups are considered transaction costs and are recorded as an increase to the cost basis of securities purchased and/or a reduction of proceeds on a sale of securities. Such transaction costs are included in the determination of net realized and unrealized gain (loss) from investment securities reported in the Statement of Operations and the Statement of Changes in Net Assets and the net realized and unrealized gains (losses) on securities per share in the Financial Highlights. Transaction costs are included in the calculation of the Fund’s net asset value and, accordingly, they reduce the Fund’s total returns. These transaction costs are not considered operating expenses and are not reflected in net investment income reported in the Statement of Operations and the Statement of Changes in Net Assets, or the net investment income per share and the ratios of expenses and net investment income reported in the Financial Highlights, nor are they limited by any expense limitation arrangements between the Fund and the investment adviser.
The Fund allocates income and realized and unrealized capital gains and losses to a class based on the relative net assets of each class.
| C. | Country Determination — For the purposes of making investment selection decisions and presentation in the Schedule of Investments, the investment adviser may determine the country in which an issuer is located and/or credit risk exposure based on various factors. These factors include the laws of the country under which the issuer is organized, where the issuer maintains a principal office, the country in which the issuer derives 50% or more of its total revenues and the country that has the primary market for the issuer’s securities, as well as other criteria. Among the other criteria that may be evaluated for making this determination are the country in which the issuer maintains 50% or more of its assets, the type of security, financial guarantees and enhancements, the nature of the collateral and the sponsor organization. Country of issuer and/or credit risk exposure has been determined to be the United States of America, unless otherwise noted. |
| D. | Distributions — Distributions from net investment income and net realized capital gain, if any, are generally declared and paid to separate accounts of participating insurance companies annually and recorded on the ex-dividend date. |
| E. | Federal Income Taxes — The Fund intends to comply with the requirements of Subchapter M of the Internal Revenue Code of 1986, as amended (the “Internal Revenue Code”), necessary to qualify as a regulated investment company and to distribute substantially all of the Fund’s |
Invesco V.I. Core Plus Bond Fund
| | taxable earnings to shareholders. As such, the Fund will not be subject to federal income taxes on otherwise taxable income (including net realized capital gain) that is distributed to shareholders. Therefore, no provision for federal income taxes is recorded in the financial statements. |
The Fund recognizes the tax benefits of uncertain tax positions only when the position is more likely than not to be sustained. Management has analyzed the Fund’s uncertain tax positions and concluded that no liability for unrecognized tax benefits should be recorded related to uncertain tax positions. Management is not aware of any tax positions for which it is reasonably possible that the total amounts of unrecognized tax benefits will change materially in the next 12 months.
The Fund files tax returns in the U.S. Federal jurisdiction and certain other jurisdictions. Generally, the Fund is subject to examinations by such taxing authorities for up to three years after the filing of the return for the tax period.
| F. | Expenses — Fees provided for under the Rule 12b-1 plan of a particular class of the Fund and which are directly attributable to that class are charged to the operations of such class. All other expenses are allocated among the classes based on relative net assets. |
| G. | Accounting Estimates — The preparation of financial statements in conformity with accounting principles generally accepted in the United States of America (“GAAP”) requires management to make estimates and assumptions that affect the reported amounts of assets and liabilities at the date of the financial statements and the reported amounts of revenues and expenses during the reporting period including estimates and assumptions related to taxation. Actual results could differ from those estimates by a significant amount. In addition, the Fund monitors for material events or transactions that may occur or become known after the period-end date and before the date the financial statements are released to print. |
| H. | Indemnifications — Under the Trust’s organizational documents, each Trustee, officer, employee or other agent of the Trust is indemnified against certain liabilities that may arise out of the performance of their duties to the Fund. Additionally, in the normal course of business, the Fund enters into contracts, including the Fund’s servicing agreements, that contain a variety of indemnification clauses. The Fund’s maximum exposure under these arrangements is unknown as this would involve future claims that may be made against the Fund that have not yet occurred. The risk of material loss as a result of such indemnification claims is considered remote. |
| I. | Lower-Rated Securities — The Fund may invest in lower-quality debt securities, i.e., “junk bonds”. Investments in lower-rated securities or unrated securities of comparable quality tend to be more sensitive to economic conditions than higher rated securities. Junk bonds involve a greater risk of default by the issuer because such securities are generally unsecured and are often subordinated to other creditors’ claims. |
| J. | Foreign Currency Translations — Foreign currency is valued at the close of the NYSE based on quotations posted by banks and major currency dealers. Portfolio securities and other assets and liabilities denominated in foreign currencies are translated into U.S. dollar amounts at date of valuation. Purchases and sales of portfolio securities (net of foreign taxes withheld on disposition) and income items denominated in foreign currencies are translated into U.S. dollar amounts on the respective dates of such transactions. The Fund does not separately account for the portion of the results of operations resulting from changes in foreign exchange rates on investments and the fluctuations arising from changes in market prices of securities held. The combined results of changes in foreign exchange rates and the fluctuation of market prices on investments (net of estimated foreign tax withholding) are included with the net realized and unrealized gain or loss from investments in the Statement of Operations. Reported net realized foreign currency gains or losses arise from (1) sales of foreign currencies, (2) currency gains or losses realized between the trade and settlement dates on securities transactions, and (3) the difference between the amounts of dividends, interest, and foreign withholding taxes recorded on the Fund’s books and the U.S. dollar equivalent of the amounts actually received or paid. Net unrealized foreign currency gains and losses arise from changes in the fair values of assets and liabilities, other than investments in securities at fiscal period end, resulting from changes in exchange rates. |
The Fund may invest in foreign securities, which may be subject to foreign taxes on income, gains on investments or currency repatriation, a portion of which may be recoverable. Foreign taxes, if any, are recorded based on the tax regulations and rates that exist in the foreign markets in which the Fund invests and are shown in the Statement of Operations.
| K. | Forward Foreign Currency Contracts — The Fund may engage in foreign currency transactions either on a spot (i.e. for prompt delivery and settlement) basis, or through forward foreign currency contracts, to manage or minimize currency or exchange rate risk. |
The Fund may also enter into forward foreign currency contracts for the purchase or sale of a security denominated in a foreign currency in order to “lock in” the U.S. dollar price of that security, or the Fund may also enter into forward foreign currency contracts that do not provide for physical settlement of the two currencies, but instead are settled by a single cash payment calculated as the difference between the agreed upon exchange rate and the spot rate at settlement based upon an agreed upon notional amount (non-deliverable forwards). The Fund will set aside liquid assets in an amount equal to the daily mark-to-market obligation for forward foreign currency contracts.
A forward foreign currency contract is an obligation between two parties (“Counterparties”) to purchase or sell a specific currency for an agreed-upon price at a future date. The use of forward foreign currency contracts does not eliminate fluctuations in the price of the underlying securities the Fund owns or intends to acquire but establishes a rate of exchange in advance. Fluctuations in the value of these contracts are measured by the difference in the contract date and reporting date exchange rates and are recorded as unrealized appreciation (depreciation) until the contracts are closed. When the contracts are closed, realized gains (losses) are recorded. Realized and unrealized gains (losses) on the contracts are included in the Statement of Operations. The primary risks associated with forward foreign currency contracts include failure of the Counterparty to meet the terms of the contract and the value of the foreign currency changing unfavorably. These risks may be in excess of the amounts reflected in the Statement of Assets and Liabilities.
| L. | Futures Contracts — The Fund may enter into futures contracts to manage exposure to interest rate, equity and market price movements and/or currency risks. A futures contract is an agreement between Counterparties to purchase or sell a specified underlying security, currency or commodity (or delivery of a cash settlement price, in the case of an index future) for a fixed price at a future date. The Fund currently invests only in exchange-traded futures and they are standardized as to maturity date and underlying financial instrument. Initial margin deposits required upon entering into futures contracts are satisfied by the segregation of specific securities or cash as collateral at the futures commission merchant (broker). During the period the futures contracts are open, changes in the value of the contracts are recognized as unrealized gains or losses by recalculating the value of the contracts on a daily basis. Subsequent or variation margin payments are received or made depending upon whether unrealized gains or losses are incurred. These amounts are reflected as receivables or payables on the Statement of Assets and Liabilities. When the contracts are closed or expire, the Fund recognizes a realized gain or loss equal to the difference between the proceeds from, or cost of, the closing transaction and the Fund’s basis in the contract. The net realized gain (loss) and the change in unrealized gain (loss) |
Invesco V.I. Core Plus Bond Fund
| | on futures contracts held during the period is included on the Statement of Operations. The primary risks associated with futures contracts are market risk and the absence of a liquid secondary market. If the Fund were unable to liquidate a futures contract and/or enter into an offsetting closing transaction, the Fund would continue to be subject to market risk with respect to the value of the contracts and continue to be required to maintain the margin deposits on the futures contracts. Futures contracts have minimal Counterparty risk since the exchange’s clearinghouse, as Counterparty to all exchange-traded futures, guarantees the futures against default. Risks may exceed amounts recognized in the Statement of Assets and Liabilities. |
| M. | Dollar Rolls and Forward Commitment Transactions — The Fund may enter into dollar roll transactions to enhance the Fund’s performance. The Fund executes its dollar roll transactions in the to be announced (“TBA”) market whereby the Fund makes a forward commitment to purchase a security and, instead of accepting delivery, the position is offset by the sale of the security with a simultaneous agreement to repurchase at a future date. |
The Fund accounts for dollar roll transactions as purchases and sales and realizes gains and losses on these transactions. These transactions increase the Fund’s portfolio turnover rate. The Fund will segregate liquid assets in an amount equal to its dollar roll commitments. Dollar roll transactions may be considered borrowings under the 1940 Act.
Dollar roll transactions involve the risk that a Counterparty to the transaction may fail to complete the transaction. If this occurs, the Fund may lose the opportunity to purchase or sell the security at the agreed upon price. Dollar roll transactions also involve the risk that the value of the securities retained by the Fund may decline below the price of the securities that the Fund has sold but is obligated to purchase under the agreement.
| N. | Swap Agreements — The Fund may enter into various swap transactions, including interest rate, total return, index, currency and credit default swap contracts (“CDS”) for investment purposes or to manage interest rate, currency or credit risk. Such transactions are agreements between Counterparties. A swap agreement may be negotiated bilaterally and traded over-the-counter (“OTC”) between two parties (“uncleared/OTC”) or, in some instances, must be transacted through a future commission merchant (“FCM”) and cleared through a clearinghouse that serves as a central Counterparty (“centrally cleared swap”). These agreements may contain among other conditions, events of default and termination events, and various covenants and representations such as provisions that require the Fund to maintain a pre-determined level of net assets, and/or provide limits regarding the decline of the Fund’s NAV over specific periods of time. If the Fund were to trigger such provisions and have open derivative positions at that time, the Counterparty may be able to terminate such agreement and request immediate payment in an amount equal to the net liability positions, if any. |
Interest rate, total return, index, and currency swap agreements are two-party contracts entered into primarily to exchange the returns (or differentials in rates of returns) earned or realized on particular predetermined investments or instruments. The gross returns to be exchanged or “swapped” between the parties are calculated with respect to a notional amount, i.e., the return on or increase in value of a particular dollar amount invested at a particular interest rate or return of an underlying asset, in a particular foreign currency, or in a “basket” of securities representing a particular index.
In a centrally cleared swap, the Fund’s ultimate Counterparty is a central clearinghouse. The Fund initially will enter into centrally cleared swaps through an executing broker. When a fund enters into a centrally cleared swap, it must deliver to the central Counterparty (via the FCM) an amount referred to as “initial margin.” Initial margin requirements are determined by the central Counterparty, but an FCM may require additional initial margin above the amount required by the central Counterparty. Initial margin deposits required upon entering into centrally cleared swaps are satisfied by cash or securities as collateral at the FCM. Securities deposited as initial margin are designated on the Schedule of Investments and cash deposited is recorded on the Statement of Assets and Liabilities. During the term of a cleared swap agreement, a “variation margin” amount may be required to be paid by the Fund or may be received by the Fund, based on the daily change in price of the underlying reference instrument subject to the swap agreement and is recorded as a receivable or payable for variation margin in the Statement of Assets and Liabilities until the centrally cleared swap is terminated at which time a realized gain or loss is recorded.
A CDS is an agreement between Counterparties to exchange the credit risk of an issuer. A buyer of a CDS is said to buy protection by paying a fixed payment over the life of the agreement and in some situations an upfront payment to the seller of the CDS. If a defined credit event occurs (such as payment default or bankruptcy), the Fund as a protection buyer would cease paying its fixed payment, the Fund would deliver eligible bonds issued by the reference entity to the seller, and the seller would pay the full notional value, or the “par value”, of the referenced obligation to the Fund. A seller of a CDS is said to sell protection and thus would receive a fixed payment over the life of the agreement and an upfront payment, if applicable. If a credit event occurs, the Fund as a protection seller would cease to receive the fixed payment stream, the Fund would pay the buyer “par value” or the full notional value of the referenced obligation, and the Fund would receive the eligible bonds issued by the reference entity. In turn, these bonds may be sold in order to realize a recovery value. Alternatively, the seller of the CDS and its Counterparty may agree to net the notional amount and the market value of the bonds and make a cash payment equal to the difference to the buyer of protection. If no credit event occurs, the Fund receives the fixed payment over the life of the agreement. As the seller, the Fund would effectively add leverage to its portfolio because, in addition to its total net assets, the Fund would be subject to investment exposure on the notional amount of the CDS. In connection with these agreements, cash and securities may be identified as collateral in accordance with the terms of the respective swap agreements to provide assets of value and recourse in the event of default under the swap agreement or bankruptcy/insolvency of a party to the swap agreement. If a Counterparty becomes bankrupt or otherwise fails to perform its obligations due to financial difficulties, the Fund may experience significant delays in obtaining any recovery in a bankruptcy or other reorganization proceeding. The Fund may obtain only limited recovery or may obtain no recovery in such circumstances. The Fund’s maximum risk of loss from Counterparty risk, either as the protection seller or as the protection buyer, is the value of the contract. The risk may be mitigated by having a master netting arrangement between the Fund and the Counterparty and by the designation of collateral by the Counterparty to cover the Fund’s exposure to the Counterparty.
Implied credit spreads represent the current level at which protection could be bought or sold given the terms of the existing CDS contract and serve as an indicator of the current status of the payment/performance risk of the CDS. An implied spread that has widened or increased since entry into the initial contract may indicate a deteriorating credit profile and increased risk of default for the reference entity. A declining or narrowing spread may indicate an improving credit profile or decreased risk of default for the reference entity. Alternatively, credit spreads may increase or decrease reflecting the general tolerance for risk in the credit markets.
Invesco V.I. Core Plus Bond Fund
An interest rate swap is an agreement between Counterparties pursuant to which the parties exchange a floating rate payment for a fixed rate payment based on a specified notional amount.
Changes in the value of centrally cleared and OTC swap agreements are recognized as unrealized gains (losses) in the Statement of Operations by “marking to market” on a daily basis to reflect the value of the swap agreement at the end of each trading day. Payments received or paid at the beginning of the agreement are reflected as such on the Statement of Assets and Liabilities and may be referred to as upfront payments. The Fund accrues for the fixed payment stream and amortizes upfront payments, if any, on swap agreements on a daily basis with the net amount, recorded as a component of realized gain (loss) on the Statement of Operations. A liquidation payment received or made at the termination of a swap agreement is recorded as realized gain (loss) on the Statement of Operations. The Fund segregates cash or liquid securities having a value at least equal to the amount of the potential obligation of a Fund under any swap transaction. Cash held as collateral is recorded as deposits with brokers on the Statement of Assets and Liabilities. Entering into these agreements involves, to varying degrees, lack of liquidity and elements of credit, market, and Counterparty risk in excess of amounts recognized on the Statement of Assets and Liabilities. Such risks involve the possibility that a swap is difficult to sell or liquidate; the Counterparty does not honor its obligations under the agreement and unfavorable interest rates and market fluctuations. It is possible that developments in the swaps market, including potential government regulation, could adversely affect the Fund’s ability to terminate existing swap agreements or to realize amounts to be received under such agreements. A short position in a security poses more risk than holding the same security long. As there is no limit on how much the price of the security can increase, the Fund’s exposure is unlimited.
Notional amounts of each individual credit default swap agreement outstanding as of December 31, 2017 for which the Fund is the seller of protection are disclosed in the open swap agreements table. These potential amounts would be partially offset by any recovery values of the respective referenced obligations, upfront payments received upon entering into the agreement, or net amounts received from the settlement of buy protection credit default swap agreements entered into by the Fund for the same referenced entity or entities.
| O. | Leverage Risk — Leverage exists when the Fund can lose more than it originally invests because it purchases or sells an instrument or enters into a transaction without investing an amount equal to the full economic exposure of the instrument or transaction. |
| P. | Collateral — To the extent the Fund has designated or segregated a security as collateral and that security is subsequently sold, it is the Fund’s practice to replace such collateral no later than the next business day. |
NOTE 2—Advisory Fees and Other Fees Paid to Affiliates
The Trust has entered into a master investment advisory agreement with Invesco Advisers, Inc. (the “Adviser” or “Invesco”). Under the terms of the investment advisory agreement, the Fund accrues daily and pays monthly an advisory fee to the Adviser based on the annual rate of the Fund’s average daily net assets as follows:
| | | | | | | | |
| Average Daily Net Assets | | Rate | |
First $500 million | | | 0 | .45% | | | | |
Next $500 million | | | 0 | .425% | | | | |
Next $1.5 billion | | | 0 | .40% | | | | |
Next $2.5 billion | | | 0 | .375% | | | | |
Over $5 billion | | | 0 | .35% | | | | |
For the year ended December 31, 2017, the effective advisory fees incurred by the Fund was 0.45%.
Under the terms of a master sub-advisory agreement between the Adviser and each of Invesco Asset Management Deutschland GmbH, Invesco Asset Management Limited, Invesco Asset Management (Japan) Limited, Invesco Hong Kong Limited, Invesco Senior Secured Management, Inc. and Invesco Canada Ltd. and separate sub-advisory agreements with Invesco PowerShares Capital Management LLC and Invesco Asset Management (India) Private Limited (collectively, the “Affiliated Sub-Advisers”) the Adviser, not the Fund, will pay 40% of the fees paid to the Adviser to any such Affiliated Sub-Adviser(s) that provide(s) discretionary investment management services to the Fund based on the percentage of assets allocated to such Affiliated Sub-Adviser(s).
The Adviser has contractually agreed, through at least April 30, 2019, to waive advisory fees and/or reimburse expenses of all shares to the extent necessary to limit total annual fund operating expenses after fee waiver and/or expense reimbursement (excluding certain items discussed below) of Series I shares to 0.61% and Series II shares to 0.86% of average daily net assets (the “expense limits”). In determining the Adviser’s obligation to waive advisory fees and/or reimburse expenses, the following expenses are not taken into account, and could cause the total annual fund operating expenses after fee waiver and/or expense reimbursement to exceed the numbers reflected above: (1) interest; (2) taxes; (3) dividend expense on short sales; (4) extraordinary or non-routine items, including litigation expenses; and (5) expenses that the Fund has incurred but did not actually pay because of an expense offset arrangement. Unless Invesco continues the fee waiver agreement, it will terminate on April 30, 2019. During its term, the fee waiver agreement cannot be terminated or amended to increase the expense limits or reduce the advisory fee waiver without approval of the Board of Trustees.
Further, the Adviser has contractually agreed, through at least June 30, 2019, to waive the advisory fee payable by the Fund in an amount equal to 100% of the net advisory fees the Adviser receives from the affiliated money market funds on investments by the Fund of uninvested cash in such affiliated money market funds.
For the year ended December 31, 2017, the Adviser waived advisory fees of $79,181 and reimbursed Fund expenses of $93,145.
The Trust has entered into a master administrative services agreement with Invesco pursuant to which the Fund has agreed to pay Invesco a fee for costs incurred in providing accounting services and fund administrative services to the Fund and to reimburse Invesco for fees paid to insurance companies that have agreed to provide certain administrative services to the Fund. These administrative services provided by the insurance companies may include, among other things: maintenance of master accounts with the Fund; tracking, recording and transmitting net purchase and redemption orders for Fund shares; maintaining and preserving records related to the purchase, redemption and other account activity of variable product owners; distributing copies of Fund documents such as prospectuses, proxy materials and periodic reports, to variable product owners, and responding to inquiries from variable product owners about the Fund. Pursuant to such agreement, for the year ended December 31, 2017, Invesco was paid $50,000 for accounting and fund administrative services and was reimbursed $25,307 for fees paid to insurance companies.
Invesco V.I. Core Plus Bond Fund
The Trust has entered into a transfer agency and service agreement with Invesco Investment Services, Inc. (“IIS”) pursuant to which the Fund has agreed to pay IIS a fee for providing transfer agency and shareholder services to the Fund and reimburse IIS for certain expenses incurred by IIS in the course of providing such services. For the year ended December 31, 2017, expenses incurred under the agreement are shown in the Statement of Operations as Transfer agent fees.
The Trust has entered into a master distribution agreement with Invesco Distributors, Inc. (“IDI”) to serve as the distributor for the Fund. The Trust has adopted a plan pursuant to Rule 12b-1 under the 1940 Act with respect to the Fund’s Series II shares (the “Plan”). The Fund, pursuant to the Plan, pays IDI compensation at the annual rate of 0.25% of the Fund’s average daily net assets of Series II shares. The fees are accrued daily and paid monthly. Of the Plan payments, up to 0.25% of the average daily net assets of the Series II shares may be paid to insurance companies who furnish continuing personal shareholder services to customers who purchase and own Series II shares of the Fund. For the year ended December 31, 2017, expenses incurred under the Plan are detailed in the Statement of Operations as Distribution fees.
Certain officers and trustees of the Trust are officers and directors of the Adviser, IIS and/or IDI.
NOTE 3—Additional Valuation Information
GAAP defines fair value as the price that would be received to sell an asset or paid to transfer a liability in an orderly transaction between market participants at the measurement date, under current market conditions. GAAP establishes a hierarchy that prioritizes the inputs to valuation methods, giving the highest priority to readily available unadjusted quoted prices in an active market for identical assets (Level 1) and the lowest priority to significant unobservable inputs (Level 3), generally when market prices are not readily available or are unreliable. Based on the valuation inputs, the securities or other investments are tiered into one of three levels. Changes in valuation methods may result in transfers in or out of an investment’s assigned level:
| | Level 1 — | Prices are determined using quoted prices in an active market for identical assets. |
| | Level 2 — | Prices are determined using other significant observable inputs. Observable inputs are inputs that other market participants may use in pricing a security. These may include quoted prices for similar securities, interest rates, prepayment speeds, credit risk, yield curves, loss severities, default rates, discount rates, volatilities and others. |
| | Level 3 — | Prices are determined using significant unobservable inputs. In situations where quoted prices or observable inputs are unavailable (for example, when there is little or no market activity for an investment at the end of the period), unobservable inputs may be used. Unobservable inputs reflect the Fund’s own assumptions about the factors market participants would use in determining fair value of the securities or instruments and would be based on the best available information. |
The following is a summary of the tiered valuation input levels, as of December 31, 2017. The level assigned to the securities valuations may not be an indication of the risk or liquidity associated with investing in those securities. Because of the inherent uncertainties of valuation, the values reflected in the financial statements may materially differ from the value received upon actual sale of those investments.
The Fund’s policy is to recognize transfers in and out of the valuation levels as of the end of the reporting period. During the year ended December 31, 2017, there were no material transfers between valuation levels.
| | | | | | | | | | | | | | | | |
| | | Level 1 | | | Level 2 | | | Level 3 | | | Total | |
| Investments in Securities | | | | | | | | | | | | |
Bonds & Notes | | $ | — | | | $ | 11,951,367 | | | $ | — | | | $ | 11,951,367 | |
U.S. Government Sponsored Agency Mortgage-Backed Securities | | | — | | | | 2,933,577 | | | | — | | | | 2,933,577 | |
Asset-Backed Securities | | | — | | | | 2,656,868 | | | | — | | | | 2,656,868 | |
U.S. Treasury Securities | | | — | | | | 1,538,903 | | | | — | | | | 1,538,903 | |
Preferred Stocks | | | 197,240 | | | | 7,105 | | | | — | | | | 204,345 | |
Municipal Obligations | | | — | | | | 64,271 | | | | — | | | | 64,271 | |
Variable Rate Senior Loan Interests | | | — | | | | 59,581 | | | | — | | | | 59,581 | |
Common Stocks & Other Equity Interests | | | — | | | | 268 | | | | — | | | | 268 | |
Money Market Funds | | | 3,763,624 | | | | — | | | | — | | | | 3,763,624 | |
Total Investments in Securities | | | 3,960,864 | | | | 19,211,940 | | | | — | | | | 23,172,804 | |
| Other Investments — Assets* | | | | | | | | | | | | |
Futures Contracts | | | 1,206 | | | | — | | | | — | | | | 1,206 | |
| Other Investments — Liabilities* | | | | | | | | | | | | |
Forward Foreign Currency Contracts | | | — | | | | (2,322 | ) | | | — | | | | (2,322 | ) |
Futures Contracts | | | (5,016 | ) | | | — | | | | — | | | | (5,016 | ) |
| | | | (5,016 | ) | | | (2,322 | ) | | | — | | | | (7,338 | ) |
Total Other Investments | | | (3,810 | ) | | | (2,322 | ) | | | — | | | | (6,132 | ) |
Total Investments | | $ | 3,957,054 | | | $ | 19,209,618 | | | $ | — | | | $ | 23,166,672 | |
| * | Unrealized appreciation (depreciation). |
NOTE 4—Derivative Investments
The Fund may enter into an International Swaps and Derivatives Association Master Agreement (“ISDA Master Agreement”) under which a fund may trade OTC derivatives. An OTC transaction entered into under an ISDA Master Agreement typically involves a collateral posting arrangement, payment netting provisions and close-out netting provisions. These netting provisions allow for reduction of credit risk through netting of contractual obligations. The enforceability of the netting provisions of the ISDA Master Agreement depends on the governing law of the ISDA Master Agreement, among other factors.
For financial reporting purposes, the Fund does not offset OTC derivative assets or liabilities that are subject to ISDA Master Agreements in the Statement of Assets and Liabilities.
Invesco V.I. Core Plus Bond Fund
Value of Derivative Investments at Period-End
The table below summarizes the value of the Fund’s derivative investments, detailed by primary risk exposure, held as of December 31, 2017:
| | | | | | | | | | | | |
| | | Value | |
| Derivative Assets | | Currency Risk | | | Interest Rate Risk | | | Total | |
Unrealized appreciation on futures contracts — Exchange-Traded(a) | | $ | — | | | $ | 1,206 | | | $ | 1,206 | |
Derivatives not subject to master netting agreements | | | — | | | | (1,206 | ) | | | (1,206 | ) |
Total Derivative Assets subject to master netting agreements | | $ | — | | | $ | — | | | $ | — | |
| |
| | | Value | |
| Derivative Liabilities | | Currency Risk | | | Interest Rate Risk | | | Total | |
Unrealized depreciation on futures contracts — Exchange-Traded(a) | | $ | — | | | $ | (5,016 | ) | | $ | (5,016 | ) |
Unrealized depreciation on forward foreign currency contracts outstanding | | | (2,322 | ) | | | — | | | | (2,322 | ) |
Total Derivative Liabilities | | | (2,322 | ) | | | (5,016 | ) | | | (7,338 | ) |
Derivatives not subject to master netting agreements | | | — | | | | 5,016 | | | | 5,016 | |
Total Derivative Liabilities subject to master netting agreements | | $ | (2,322 | ) | | $ | — | | | $ | (2,322 | ) |
| (a) | The daily variation margin receivable (payable) at period-end is recorded in the Statement of Assets and Liabilities. |
Offsetting Assets and Liabilities
The table below reflects the Fund’s exposure to Counterparties subject to either an ISDA Master Agreement or other agreement for OTC derivative transactions as of December 31, 2017.
| | | | | | | | | | | | | | | | | | | | | | | | |
| | | Financial Derivative
Assets | | | Financial Derivative
Liabilities | | | Net Value of
Derivatives | | | Collateral
(Received)/Pledged | | | Net Amount | |
| Counterparty | | Forward Foreign
Currency Contracts | | | Forward Foreign
Currency Contracts | | | | Non-Cash | | | Cash | | |
Barclays Bank PLC | | $ | — | | | $ | (2,322 | ) | | $ | (2,322 | ) | | $ | — | | | $ | — | | | $ | (2,322 | ) |
Effect of Derivative Investments for the year ended December 31, 2017
The table below summarizes the gains (losses) on derivative investments, detailed by primary risk exposure, recognized in earnings during the period:
| | | | | | | | | | | | | | | | |
| | | Location of Gain (Loss) on
Statement of Operations | |
| | | Credit
Risk | | | Currency
Risk | | | Interest
Rate Risk | | | Total | |
Realized Gain (Loss): | | | | | | | | | | | | | | | | |
Forward foreign currency contracts | | $ | — | | | $ | (3,444 | ) | | $ | — | | | $ | (3,444 | ) |
Futures contracts | | | — | | | | — | | | | (98,763 | ) | | | (98,763 | ) |
Swap agreements | | | (3,107 | ) | | | — | | | | — | | | | (3,107 | ) |
Change in Net Unrealized Appreciation (Depreciation): | | | | | | | | | | | | | | | | |
Forward foreign currency contracts | | | — | | | | (2,322 | ) | | | — | | | | (2,322 | ) |
Futures contracts | | | — | | | | — | | | | (12,962 | ) | | | (12,962 | ) |
Swap agreements | | | 2,859 | | | | — | | | | — | | | | 2,859 | |
Total | | $ | (248 | ) | | $ | (5,766 | ) | | $ | (111,725 | ) | | $ | (117,739 | ) |
The table below summarizes the twelve month average notional value of futures contracts, the six month average notional value of forward foreign currency contracts and the five month average notional value of swap agreements outstanding during the period.
| | | | | | | | | | | | |
| | | Forward Foreign
Currency Contracts | | | Futures
Contracts | | | Swap
Agreements | |
Average notional value | | $ | 197,491 | | | $ | 4,144,158 | | | $ | 250,000 | |
NOTE 5—Trustees’ and Officers’ Fees and Benefits
Trustees’ and Officers’ Fees and Benefits include amounts accrued by the Fund to pay remuneration to certain Trustees and Officers of the Fund. Trustees have the option to defer compensation payable by the Fund, and Trustees’ and Officers’ Fees and Benefits also include amounts accrued by the Fund to fund such deferred compensation amounts. Those Trustees who defer compensation have the option to select various Invesco Funds in which their deferral accounts shall be deemed to be invested. Finally, certain current Trustees were eligible to participate in a retirement plan that provided for benefits to be paid upon retirement to Trustees over a period of time based on the number of years of service. The Fund may have certain former Trustees who also participate in a retirement plan and receive benefits under such plan. Trustees’ and Officers’ Fees and Benefits include amounts accrued by the Fund to fund such retirement benefits. Obligations under the deferred compensation and retirement plans represent unsecured claims against the general assets of the Fund.
Invesco V.I. Core Plus Bond Fund
NOTE 6—Cash Balances
The Fund may borrow for leveraging in an amount up to 5% of the Fund’s total assets (excluding the amount borrowed) at the time the borrowing is made. In doing so, the Fund is permitted to temporarily carry a negative or overdrawn balance in its account with State Street Bank and Trust Company, the custodian bank. Such balances, if any at period end, are shown in the Statement of Assets and Liabilities under the payable caption Amount due custodian. To compensate the custodian bank for such overdrafts, the overdrawn Fund may either (1) leave funds as a compensating balance in the account so the custodian bank can be compensated by earning the additional interest; or (2) compensate by paying the custodian bank at a rate agreed upon by the custodian bank and Invesco, not to exceed the contractually agreed upon rate. The Fund may not purchase additional securities when any borrowings from banks exceed 5% of the Fund’s total assets.
NOTE 7—Distributions to Shareholders and Tax Components of Net Assets
Tax Character of Distributions to Shareholders Paid During the Fiscal Years Ended December 31, 2017 and 2016:
| | | | | | | | |
| | | 2017 | | | 2016 | |
Ordinary income | | $ | 651,274 | | | $ | 651,057 | |
Tax Components of Net Assets at Period-End:
| | | | |
| | | 2017 | |
Undistributed ordinary income | | $ | 613,154 | |
Net unrealized appreciation — investments | | | 399,564 | |
Net unrealized appreciation — foreign currencies | | | 1,054 | |
Temporary book/tax differences | | | (52,846 | ) |
Shares of beneficial interest | | | 19,488,001 | |
Total net assets | | $ | 20,448,927 | |
The difference between book-basis and tax-basis unrealized appreciation (depreciation) is due to differences in the timing of recognition of gains and losses on investments for tax and book purposes. The Fund’s net unrealized appreciation difference is attributable primarily to forward foreign currency contracts and straddle loss deferral.
The temporary book/tax differences are a result of timing differences between book and tax recognition of income and/or expenses. The Fund’s temporary book/tax differences are the result of the trustee deferral of compensation and retirement plan benefits.
Capital loss carryforward is calculated and reported as of a specific date. Results of transactions and other activity after that date may affect the amount of capital loss carryforward actually available for the Fund to utilize. Capital losses generated in years beginning after December 22, 2010 can be carried forward for an unlimited period, whereas previous losses expire in eight tax years. Capital losses with an expiration period may not be used to offset capital gains until all net capital losses without an expiration date have been utilized. Capital loss carryforwards with no expiration date will retain their character as either short-term or long-term capital losses instead of as short-term capital losses as under prior law. The ability to utilize capital loss carryforwards in the future may be limited under the Internal Revenue Code and related regulations based on the results of future transactions.
The Fund does not have a capital loss carryforward as of December 31, 2017.
NOTE 8—Investment Transactions
The aggregate amount of investment securities (other than short-term securities, U.S. Treasury obligations and money market funds, if any) purchased and sold by the Fund during the year ended December 31, 2017 was $58,435,584 and $57,689,832, respectively. During the same period, purchases and sales of U.S. Treasury obligations were $15,762,975 and $15,792,060, respectively. Cost of investments, including any derivatives, on a tax basis includes the adjustments for financial reporting purposes as of the most recently completed federal income tax reporting period-end.
| | | | |
| Unrealized Appreciation (Depreciation) of Investments on a Tax Basis | |
Aggregate unrealized appreciation of investments | | $ | 500,953 | |
Aggregate unrealized (depreciation) of investments | | | (101,389 | ) |
Net unrealized appreciation of investments | | $ | 399,564 | |
Cost of investments for tax purposes is $22,767,108.
NOTE 9—Reclassification of Permanent Differences
Primarily as a result of differing book/tax treatment of expired capital loss carryforward, on December 31, 2017, undistributed net investment income was increased by $49,450, undistributed net realized gain was increased by $7,177,411 and shares of beneficial interest was decreased by $7,226,861. This reclassification had no effect on the net assets of the Fund.
Invesco V.I. Core Plus Bond Fund
NOTE 10—Share Information
| | | | | | | | | | | | | | | | |
| | | Summary of Share Activity | |
| | | Years ended December 31, | |
| | | 2017(a) | | | 2016 | |
| | | Shares | | | Amount | | | Shares | | | Amount | |
Sold: | | | | | | | | | | | | | | | | |
Series I | | | 1,139,378 | | | $ | 7,342,799 | | | | 234,703 | | | $ | 1,481,864 | |
Series II | | | 2 | | | | 14 | | | | 2 | | | | 14 | |
| | | | |
Issued as reinvestment of dividends: | | | | | | | | | | | | | | | | |
Series I | | | 101,948 | | | | 647,374 | | | | 102,079 | | | | 646,158 | |
Series II | | | 568 | | | | 3,588 | | | | 716 | | | | 4,517 | |
| | | | |
Reacquired: | | | | | | | | | | | | | | | | |
Series I | | | (545,804 | ) | | | (3,501,473 | ) | | | (412,191 | ) | | | (2,591,994 | ) |
Series II | | | (1,551 | ) | | | (9,826 | ) | | | (6,221 | ) | | | (40,046 | ) |
Net increase (decrease) in share activity | | | 694,541 | | | $ | 4,482,476 | | | | (80,912 | ) | | $ | (499,487 | ) |
| (a) | There are entities that are record owners of more than 5% of the outstanding shares of the Fund and in the aggregate own 84% of the outstanding shares of the Fund. The Fund and the Fund’s principal underwriter or adviser, are parties to participation agreements with these entities whereby these entities sell units of interest in separate accounts funding variable products that are invested in the Fund. The Fund, Invesco and/or Invesco affiliates may make payments to these entities, which are considered to be related to the Fund, for providing services to the Fund, Invesco and/or Invesco affiliates including but not limited to services such as, securities brokerage, third party record keeping and account servicing and administrative services. The Fund has no knowledge as to whether all or any portion of the shares owned of record by these entities are also owned beneficially. |
Invesco V.I. Core Plus Bond Fund
NOTE 11—Financial Highlights
The following schedule presents financial highlights for a share of the Fund outstanding throughout the periods indicated.
| | | | | | | | | | | | | | | | | | | | | | | | | | | | | | | | | | | | | | | | | | | | | | | | |
| | | Net asset
value,
beginning
of period | | | Net
investment
income(a) | | | Net gains
(losses)
on securities
(both
realized and
unrealized) | | | Total from
investment
operations | | | Dividends
from net
investment
income | | | Net asset
value, end
of period | | | Total
return(b) | | | Net assets,
end of period
(000’s omitted) | | | Ratio of
expenses
to average
net assets
with fee waivers
and/or expenses
absorbed | | | Ratio of
expenses
to average net
assets without
fee waivers
and/or expenses
absorbed | | | Ratio of net
investment
income
to average
net assets | | | Portfolio
turnover(c) | |
Series I | | | | | | | | | | | | | | | | | | | | | | | | | | | | | | | | | | | | | | | | | | | | | | | | |
Year ended 12/31/17 | | $ | 6.21 | | | $ | 0.22 | | | $ | 0.17 | | | $ | 0.39 | | | $ | (0.22 | ) | | $ | 6.38 | | | | 6.34 | % | | $ | 20,326 | | | | 0.60 | %(d) | | | 1.58 | %(d) | | | 3.46 | %(d) | | | 407 | % |
Year ended 12/31/16 | | | 6.07 | | | | 0.23 | | | | 0.18 | | | | 0.41 | | | | (0.27 | ) | | | 6.21 | | | | 6.66 | | | | 15,485 | | | | 0.55 | | | | 1.68 | | | | 3.71 | | | | 474 | |
Year ended 12/31/15 | | | 6.39 | | | | 0.24 | | | | (0.26 | ) | | | (0.02 | ) | | | (0.30 | ) | | | 6.07 | | | | (0.37 | ) | | | 15,587 | | | | 0.65 | | | | 1.73 | | | | 3.81 | | | | 416 | |
Year ended 12/31/14 | | | 6.23 | | | | 0.26 | | | | 0.24 | | | | 0.50 | | | | (0.34 | ) | | | 6.39 | | | | 8.03 | | | | 17,821 | | | | 0.75 | | | | 1.77 | | | | 4.04 | | | | 255 | |
Year ended 12/31/13 | | | 6.54 | | | | 0.27 | | | | (0.27 | ) | | | 0.00 | | | | (0.31 | ) | | | 6.23 | | | | 0.05 | | | | 19,671 | | | | 0.75 | | | | 1.76 | | | | 4.18 | | | | 150 | |
Series II | | | | | | | | | | | | | | | | | | | | | | | | | | | | | | | | | | | | | | | | | | | | | | | | |
Year ended 12/31/17 | | | 6.19 | | | | 0.20 | | | | 0.16 | | | | 0.36 | | | | (0.20 | ) | | | 6.35 | | | | 5.89 | | | | 123 | | | | 0.85 | (d) | | | 1.83 | (d) | | | 3.21 | (d) | | | 407 | |
Year ended 12/31/16 | | | 6.04 | | | | 0.22 | | | | 0.18 | | | | 0.40 | | | | (0.25 | ) | | | 6.19 | | | | 6.52 | | | | 126 | | | | 0.80 | | | | 1.93 | | | | 3.46 | | | | 474 | |
Year ended 12/31/15 | | | 6.36 | | | | 0.22 | | | | (0.26 | ) | | | (0.04 | ) | | | (0.28 | ) | | | 6.04 | | | | (0.64 | ) | | | 156 | | | | 0.90 | | | | 1.98 | | | | 3.56 | | | | 416 | |
Year ended 12/31/14 | | | 6.19 | | | | 0.24 | | | | 0.24 | | | | 0.48 | | | | (0.31 | ) | | | 6.36 | | | | 7.85 | | | | 161 | | | | 1.00 | | | | 2.02 | | | | 3.79 | | | | 255 | |
Year ended 12/31/13 | | | 6.50 | | | | 0.25 | | | | (0.27 | ) | | | (0.02 | ) | | | (0.29 | ) | | | 6.19 | | | | (0.26 | ) | | | 172 | | | | 1.00 | | | | 2.01 | | | | 3.93 | | | | 150 | |
| (a) | Calculated using average shares outstanding. |
| (b) | Includes adjustments in accordance with accounting principles generally accepted in the United States of America and as such, the net asset value for financial reporting purposes and the returns based upon those net asset values may differ from the net asset value and returns for shareholder transactions. Total returns are not annualized for periods less than one year, if applicable, and do not reflect charges assessed in connection with a variable product, which if included would reduce total returns. |
| (c) | Portfolio turnover is calculated at the fund level and is not annualized for periods less than one year, if applicable. |
| (d) | Ratios are based on average daily net assets (000’s omitted) of $17,471 and $125 for Series I and Series II shares, respectively. |
Invesco V.I. Core Plus Bond Fund
Report of Independent Registered Public Accounting Firm
To the Board of Trustees of AIM Variable Insurance Funds (Invesco Variable Insurance Funds)
and Shareholders of Invesco V.I. Core Plus Bond Fund
Opinion on the Financial Statements
We have audited the accompanying statement of assets and liabilities, including the schedule of investments, of Invesco V.I. Core Plus Bond Fund (one of the funds constituting AIM Variable Insurance Funds (Invesco Variable Insurance Funds), hereafter referred to as the “Fund”) as of December 31, 2017, the related statement of operations for the year ended December 31, 2017, the statement of changes in net assets for each of the two years in the period ended December 31, 2017, including the related notes, and the financial highlights for each of the five years in the period ended December 31, 2017 (collectively referred to as the “financial statements”). In our opinion, the financial statements present fairly, in all material respects, the financial position of the Fund as of December 31, 2017, the results of its operations for the year then ended, the changes in its net assets for each of the two years in the period ended December 31, 2017 and the financial highlights for each of the five years in the period ended December 31, 2017 in conformity with accounting principles generally accepted in the United States of America.
Basis for Opinion
These financial statements are the responsibility of the Fund’s management. Our responsibility is to express an opinion on the Fund’s financial statements based on our audits. We are a public accounting firm registered with the Public Company Accounting Oversight Board (United States) (“PCAOB”) and are required to be independent with respect to the Fund in accordance with the U.S. federal securities laws and the applicable rules and regulations of the Securities and Exchange Commission and the PCAOB.
We conducted our audits of these financial statements in accordance with the standards of the PCAOB. Those standards require that we plan and perform the audit to obtain reasonable assurance about whether the financial statements are free of material misstatement, whether due to error or fraud.
Our audits included performing procedures to assess the risks of material misstatement of the financial statements, whether due to error or fraud, and performing procedures that respond to those risks. Such procedures included examining, on a test basis, evidence regarding the amounts and disclosures in the financial statements. Our audits also included evaluating the accounting principles used and significant estimates made by management, as well as evaluating the overall presentation of the financial statements. Our procedures included confirmation of securities owned as of December 31, 2017 by correspondence with the custodian, transfer agent and brokers; when replies were not received from brokers, we performed other auditing procedures. We believe that our audits provide a reasonable basis for our opinion.
PricewaterhouseCoopers LLP
Houston, TX
February 14, 2018
We have served as the auditor of one or more investment companies in the Invesco/PowerShares group of investment companies since at least 1995. We have not determined the specific year we began serving as auditor.
Invesco V.I. Core Plus Bond Fund
Calculating your ongoing Fund expenses
Example
As a shareholder of the Fund, you incur ongoing costs, including management fees; distribution and/or service fees (12b-1); and other Fund expenses. This example is intended to help you understand your ongoing costs (in dollars) of investing in the Fund and to compare these costs with ongoing costs of investing in other mutual funds. The example is based on an investment of $1,000 invested at the beginning of the period and held for the entire period July 1, 2017 through December 31, 2017.
The actual and hypothetical expenses in the examples below do not represent the effect of any fees or other expenses assessed in connection with a variable product; if they did, the expenses shown would be higher while the ending account values shown would be lower.
Actual expenses
The table below provides information about actual account values and actual expenses. You may use the information in this table, together with the amount you invested, to estimate the expenses that you paid over the period. Simply divide your account value by $1,000 (for example, an $8,600 account value divided by $1,000 = 8.6), then multiply the result by the number in the table under the heading entitled “Actual Expenses Paid During Period” to estimate the expenses you paid on your account during this period.
Hypothetical example for comparison purposes
The table below also provides information about hypothetical account values and hypothetical expenses based on the Fund’s actual expense ratio and an assumed rate of return of 5% per year before expenses, which is not the Fund’s actual return.
The hypothetical account values and expenses may not be used to estimate the actual ending account balance or expenses you paid for the period. You may use this information to compare the ongoing costs of investing in the Fund and other funds. To do so, compare this 5% hypothetical example with the 5% hypothetical examples that appear in the shareholder reports of the other funds.
Please note that the expenses shown in the table are meant to highlight your ongoing costs. Therefore, the hypothetical information is useful in comparing ongoing costs, and will not help you determine the relative total costs of owning different funds.
| | | | | | | | | | | | | | | | | | | | | | | | |
| Class | | Beginning
Account Value
(07/01/17) | | | ACTUAL | | | HYPOTHETICAL (5% annual return before expenses) | | | Annualized
Expense
Ratio | |
| | | Ending
Account Value
(12/31/17)1 | | | Expenses
Paid During
Period2 | | | Ending
Account Value
(12/31/17) | | | Expenses
Paid During
Period2 | | |
| Series I | | $ | 1,000.00 | | | $ | 1,017.50 | | | $ | 3.00 | | | $ | 1,022.23 | | | $ | 3.01 | | | | 0.59 | % |
| Series II | | | 1,000.00 | | | | 1,014.60 | | | | 4.27 | | | | 1,020.97 | | | | 4.28 | | | | 0.84 | |
| 1 | The actual ending account value is based on the actual total return of the Fund for the period July 1, 2017 through December 31, 2017, after actual expenses and will differ from the hypothetical ending account value which is based on the Fund’s expense ratio and a hypothetical annual return of 5% before expenses. |
| 2 | Expenses are equal to the Fund’s annualized expense ratio as indicated above multiplied by the average account value over the period, multiplied by 184/365 to reflect the most recent fiscal half year. |
Invesco V.I. Core Plus Bond Fund
Tax Information
Form 1099-DIV, Form 1042-S and other year-end tax information provide shareholders with actual calendar year amounts that should be included in their tax returns. Shareholders should consult their tax advisors.
The following distribution information is being provided as required by the Internal Revenue Code or to meet a specific state’s requirement.
The Fund designates the following amounts or, if subsequently determined to be different, the maximum amount allowable for its fiscal year ended December 31, 2017:
| | | | |
Federal and State Income Tax | |
Corporate Dividends Received Deduction* | | | 1.38 | % |
U.S. Treasury Obligations* | | | 3.28 | % |
| | * | The above percentages are based on ordinary income dividends paid to shareholders during the Fund’s fiscal year. |
Invesco V.I. Core Plus Bond Fund
Trustees and Officers
The address of each trustee and officer is AIM Variable Insurance Funds (Invesco Variable Insurance Funds) (the “Trust”), 11 Greenway Plaza, Suite 1000, Houston, Texas 77046-1173. The trustees serve for the life of the Trust, subject to their earlier death, incapacitation, resignation, retirement or removal as more specifically provided in the Trust’s organizational documents. Each officer serves for a one year term or until their successors are elected and qualified. Column two below includes length of time served with predecessor entities, if any.
| | | | | | | | |
Name, Year of Birth and
Position(s) Held with the Trust | | Trustee and/
or Officer Since | | Principal Occupation(s)
During Past 5 Years | | Number of
Funds in Fund
Complex
Overseen by
Trustee | | Other Directorship(s)
Held by Trustee During
Past 5 Years |
| Interested Persons | | | | | | | | |
Martin L. Flanagan1 — 1960 Trustee | | 2007 | | Executive Director, Chief Executive Officer and President, Invesco Ltd. (ultimate parent of Invesco and a global investment management firm); Trustee, The Invesco Funds; Vice Chair, Investment Company Institute; and Member of Executive Board, SMU Cox School of Business Formerly: Advisor to the Board, Invesco Advisers, Inc. (formerly known as Invesco Institutional (N.A.), Inc.); Chairman and Chief Executive Officer, Invesco Advisers, Inc. (registered investment adviser); Director, Chairman, Chief Executive Officer and President, Invesco Holding Company (US), Inc. (formerly IVZ Inc.) (holding company), Invesco Group Services, Inc. (service provider) and Invesco North American Holdings, Inc. (holding company); Director, Chief Executive Officer and President, Invesco Holding Company Limited (parent of Invesco and a global investment management firm); Director, Invesco Ltd.; Chairman, Investment Company Institute and President, Co-Chief Executive Officer, Co-President, Chief Operating Officer and Chief Financial Officer, Franklin Resources, Inc. (global investment management organization) | | 158 | | None |
Philip A. Taylor2 — 1954 Trustee and Senior Vice President | | 2006 | | Head of the Americas and Senior Managing Director, Invesco Ltd.; Director, Invesco Advisers, Inc. (formerly known as Invesco Institutional (N.A.), Inc.) (registered investment adviser); Director, Chairman, Chief Executive Officer and President, Invesco Management Group, Inc. (formerly known as Invesco Aim Management Group, Inc.) (financial services holding company); Director and Chairman, Invesco Investment Services, Inc. (formerly known as Invesco Aim Investment Services, Inc.) (registered transfer agent); Chief Executive Officer, Invesco Corporate Class Inc. (corporate mutual fund company); Director, Chairman and Chief Executive Officer, Invesco Canada Ltd. (formerly known as Invesco Trimark Ltd./Invesco Trimark Ltèe) (registered investment adviser and registered transfer agent); Trustee and Senior Vice President, The Invesco Funds; Director, Invesco Investment Advisers LLC (formerly known as Van Kampen Asset Management). Formerly: Co-Chairman, Co-President and Co-Chief Executive Officer, Invesco Advisers, Inc. (formerly known as Invesco Institutional (N.A.), Inc.) (registered investment adviser); Director, Chief Executive Officer and President, Van Kampen Exchange Corp; President and Principal Executive Officer, The Invesco Funds (other than AIM Treasurer’s Series Trust (Invesco Treasurer’s Series Trust), Short-Term Investments Trust and Invesco Management Trust); Executive Vice President, The Invesco Funds (AIM Treasurer’s Series Trust (Invesco Treasurer’s Series Trust), Short-Term Investments Trust and Invesco Management Trust only); Director and President, INVESCO Funds Group, Inc. (registered investment adviser and registered transfer agent); Director and Chairman, IVZ Distributors, Inc. (formerly known as INVESCO Distributors, Inc.) (registered broker dealer); Director, President and Chairman, Invesco Inc. (holding company), Invesco Canada Holdings Inc. (holding company), Trimark Investments Ltd./Placements Trimark Ltèe and Invesco Financial Services Ltd/Services Financiers Invesco Ltèe; Chief Executive Officer, Invesco Canada Fund Inc. (corporate mutual fund company); Director and Chairman, Van Kampen Investor Services Inc.; Director, Chief Executive Officer and President, 1371 Preferred Inc. (holding company) and Van Kampen Investments Inc.; Director and President, AIM GP Canada Inc. (general partner for limited partnerships) and Van Kampen Advisors, Inc.; Director and Chief Executive Officer, Invesco Trimark Dealer Inc. (registered broker dealer); Director, Invesco Distributors, Inc. (formerly known as Invesco Aim Distributors, Inc.) (registered broker dealer); Manager, Invesco PowerShares Capital Management LLC; Director, Chief Executive Officer and President, Invesco Advisers, Inc.; Director, Chairman, Chief Executive Officer and President, Invesco Aim Capital Management, Inc.; President, Invesco Trimark Dealer Inc. and Invesco Trimark Ltd./Invesco Trimark Ltèe; Director and President, AIM Trimark Corporate Class Inc. and AIM Trimark Canada Fund Inc.; Senior Managing Director, Invesco Holding Company Limited; Director and Chairman, Fund Management Company (former registered broker dealer); President and Principal Executive Officer, The Invesco Funds (AIM Treasurer’s Series Trust (Invesco Treasurer’s Series Trust), and Short-Term Investments Trust only); President, AIM Trimark Global Fund Inc. and AIM Trimark Canada Fund Inc. | | 158 | | None |
| 1 | Mr. Flanagan is considered an interested person (within the meaning of Section 2(a)(19) of the 1940 Act) of the Trust because he is an officer of the Adviser to the Trust, and an officer and a director of Invesco Ltd., ultimate parent of the Adviser. |
| 2 | Mr. Taylor is considered an interested person (within the meaning of Section 2(a)(19) of the 1940 Act) of the Trust because he is an officer and a director of the Adviser. |
Invesco V.I. Core Plus Bond Fund
Trustees and Officers—(continued)
| | | | | | | | |
Name, Year of Birth and
Position(s) Held with the Trust | | Trustee and/
or Officer Since | | Principal Occupation(s)
During Past 5 Years | | Number of
Funds in Fund
Complex
Overseen by
Trustee | | Other Directorship(s)
Held by Trustee During
Past 5 Years |
| Independent Trustees | | | | | | | | |
Bruce L. Crockett — 1944 Trustee and Chair | | 1993 | | Chairman, Crockett Technologies Associates (technology consulting company) Formerly: Director, Captaris (unified messaging provider); Director, President and Chief Executive Officer, COMSAT Corporation; Chairman, Board of Governors of INTELSAT (international communications company); ACE Limited (insurance company); Independent Directors Council and Investment Company Institute: Member of the Audit Committee, Investment Company Institute; Member of the Executive Committee and Chair of the Governance Committee, Independent Directors Council | | 158 | | Director and Chairman of the Audit Committee, ALPS (Attorneys Liability Protection Society) (insurance company); Director and Member of the Audit Committee and Compensation Committee, Ferroglobe PLC (metallurgical company) |
David C. Arch — 1945 Trustee | | 2010 | | Chairman of Blistex Inc. (consumer health care products manufacturer); Member, World Presidents’ Organization | | 158 | | Board member of the Illinois Manufacturers’ Association |
Jack M. Fields — 1952 Trustee | | 1997 | | Chief Executive Officer, Twenty First Century Group, Inc. (government affairs company); and Chairman, Discovery Learning Alliance (non-profit) Formerly: Owner and Chief Executive Officer, Dos Angeles Ranch L.P. (cattle, hunting, corporate entertainment); Director, Insperity, Inc. (formerly known as Administaff) (human resources provider); Chief Executive Officer, Texana Timber LP (sustainable forestry company); Director of Cross Timbers Quail Research Ranch (non-profit); and member of the U.S. House of Representatives | | 158 | | None |
Cynthia Hostetler — 1962 Trustee | | 2017 | | Non-Executive Director and Trustee of a number of public and private business corporations Formerly: Head of Investment Funds and Private Equity, Overseas Private Investment Corporation; President, First Manhattan Bancorporation, Inc.; Attorney, Simpson Thacher & Bartlett LLP | | 158 | | Vulcan Materials Company (construction materials company); Trilinc Global Impact Fund; Aberdeen Investment Funds (4 portfolios); Artio Global Investment LLC (mutual fund complex); Edgen Group, Inc. (specialized energy and infrastructure products distributor) |
Eli Jones — 1961 Trustee | | 2016 | | Professor and Dean, Mays Business School — Texas A&M University Formerly: Professor and Dean, Walton College of Business, University of Arkansas and E.J. Ourso College of Business, Louisiana State University; Director, Arvest Bank | | 158 | | Insperity, Inc. (formerly known as Administaff) (human resources provider) |
Prema Mathai-Davis — 1950 Trustee | | 1998 | | Retired. | | 158 | | None |
Teresa M. Ressel — 1962 Trustee | | 2017 | | Non-executive director and trustee of a number of public and private business corporations Formerly: Chief Financial Officer, Olayan America, The Olayan Group (international investor/commercial/industrial); Chief Executive Officer, UBS Securities LLC; Group Chief Operating Officer, Americas, UBS AG; Assistant Secretary for Management & Budget and CFO, US Department of the Treasury | | 158 | | Atlantic Power Corporation (power generation company); ON Semiconductor Corp. (semiconductor supplier) |
Ann Barnett Stern — 1957 Trustee | | 2017 | | President and Chief Executive Officer, Houston Endowment Inc. (private philanthropic institution) Formerly: Executive Vice President and General Counsel, Texas Children’s Hospital; Attorney, Beck, Redden and Secrest, LLP; Business Law Instructor, University of St. Thomas; Attorney, Andrews & Kurth LLP | | 158 | | Federal Reserve Bank of Dallas |
Raymond Stickel, Jr. — 1944 Trustee | | 2005 | | Retired. Formerly: Director, Mainstay VP Series Funds, Inc. (25 portfolios); Partner, Deloitte & Touche | | 158 | | None |
Robert C. Troccoli — 1949 Trustee | | 2016 | | Adjunct Professor, University of Denver — Daniels College of Business Formerly: Senior Partner, KPMG LLP | | 158 | | None |
Christopher L. Wilson — 1957 Trustee | | 2017 | | Non-executive director and trustee of a number of public and private business corporations Formerly: Managing Partner, CT2, LLC (investing and consulting firm); President/Chief Executive Officer, Columbia Funds, Bank of America Corporation; President/Chief Executive Officer, CDC IXIS Asset Management Services, Inc.; Principal & Director of Operations, Scudder Funds, Scudder, Stevens & Clark, Inc.; Assistant Vice President, Fidelity Investments | | 158 | | TD Asset Management USA Inc. (mutual fund complex) (22 portfolios); ISO New England, Inc. (non-profit organization managing regional electricity market) |
Invesco V.I. Core Plus Bond Fund
Trustees and Officers—(continued)
| | | | | | | | |
Name, Year of Birth and
Position(s) Held with the Trust | | Trustee and/
or Officer Since | | Principal Occupation(s)
During Past 5 Years | | Number of
Funds in Fund
Complex
Overseen by
Trustee | | Other Directorship(s)
Held by Trustee During
Past 5 Years |
| Other Officers | | | | | | | | |
Sheri Morris — 1964 President, Principal Executive Officer and Treasurer | | 1999 | | President, Principal Executive Officer and Treasurer, The Invesco Funds; Vice President, Invesco Advisers, Inc. (formerly known as Invesco Institutional (N.A.), Inc.) (registered investment adviser); and Vice President, PowerShares Exchange-Traded Fund Trust, PowerShares Exchange-Traded Fund Trust II, PowerShares India Exchange-Traded Fund Trust, PowerShares Actively Managed Exchange-Traded Fund Trust, PowerShares Actively Managed Exchange-Traded Commodity Fund Trust and PowerShares Exchange-Traded Self-Indexed Fund Trust Formerly: Vice President and Principal Financial Officer, The Invesco Funds; Vice President, Invesco Aim Advisers, Inc., Invesco Aim Capital Management, Inc. and Invesco Aim Private Asset Management, Inc.; Assistant Vice President and Assistant Treasurer, The Invesco Funds and Assistant Vice President, Invesco Advisers, Inc., Invesco Aim Capital Management, Inc. and Invesco Aim Private Asset Management, Inc.; and Treasurer, PowerShares Exchange-Traded Fund Trust, PowerShares Exchange-Traded Fund Trust II, PowerShares India Exchange-Traded Fund Trust and PowerShares Actively Managed Exchange-Traded Fund Trust | | N/A | | N/A |
Russell C. Burk — 1958 Senior Vice President and Senior Officer | | 2005 | | Senior Vice President and Senior Officer, The Invesco Funds | | N/A | | N/A |
John M. Zerr — 1962 Senior Vice President, Chief Legal Officer and Secretary | | 2006 | | Director, Senior Vice President, Secretary and General Counsel, Invesco Management Group, Inc. (formerly known as Invesco AIM Management Group, Inc.); Senior Vice President, Invesco Advisers, Inc. (formerly known as Invesco Institutional (N.A.), Inc.) (registered investment adviser); Senior Vice President and Secretary, Invesco Distributors, Inc. (formerly known as Invesco AIM Distributors, Inc.); Director, Vice President and Secretary, Invesco Investment Services, Inc. (formerly known as Invesco AIM Investment Services, Inc.) Senior Vice President, Chief Legal Officer and Secretary, The Invesco Funds; Managing Director, Invesco PowerShares Capital Management LLC; Director, Secretary and General Counsel, Invesco Investment Advisers LLC (formerly known as Van Kampen Asset Management); Secretary and General Counsel, Invesco Capital Markets, Inc. (formerly known as Van Kampen Funds Inc.) and Chief Legal Officer, PowerShares Exchange-Traded Fund Trust, PowerShares Exchange-Traded Fund Trust II, PowerShares India Exchange-Traded Fund Trust, PowerShares Actively Managed Exchange-Traded Fund Trust, PowerShares Actively Managed Exchange-Traded Commodity Fund Trust and PowerShares Exchange-Traded Self-Indexed Fund Trust; Manager and Secretary, Invesco Indexing LLC Formerly: Director, Secretary, General Counsel and Senior Vice President, Van Kampen Exchange Corp.; Director, Vice President and Secretary, IVZ Distributors, Inc. (formerly known as INVESCO Distributors, Inc.); Director and Vice President, INVESCO Funds Group, Inc.; Director and Vice President, Van Kampen Advisors Inc.; Director, Vice President, Secretary and General Counsel, Van Kampen Investor Services Inc.; Director, Invesco Distributors, Inc. (formerly known as Invesco AIM Distributors, Inc.); Director, Senior Vice President, General Counsel and Secretary, Invesco AIM Advisers, Inc. and Van Kampen Investments Inc.; Director, Vice President and Secretary, Fund Management Company; Director, Senior Vice President, Secretary, General Counsel and Vice President, Invesco AIM Capital Management, Inc.; Chief Operating Officer and General Counsel, Liberty Ridge Capital, Inc. (an investment adviser); Vice President and Secretary, PBHG Funds (an investment company) and PBHG Insurance Series Fund (an investment company); Chief Operating Officer, General Counsel and Secretary, Old Mutual Investment Partners (a broker-dealer); General Counsel and Secretary, Old Mutual Fund Services (an administrator) and Old Mutual Shareholder Services (a shareholder servicing center); Executive Vice President, General Counsel and Secretary, Old Mutual Capital, Inc. (an investment adviser); and Vice President and Secretary, Old Mutual Advisors Funds (an investment company) | | N/A | | N/A |
Gregory G. McGreevey — 1962 Senior Vice President | | 2012 | | Senior Managing Director, Invesco Ltd.; Director, Chairman, President, and Chief Executive Officer, Invesco Advisers, Inc. (formerly known as Invesco Institutional (N.A.), Inc.) (registered investment adviser); Senior Vice President, Invesco Management Group, Inc.; Director, Invesco Mortgage Capital, Inc. and Invesco Senior Secured Management, Inc.; and Senior Vice President, The Invesco Funds Formerly: Assistant Vice President, The Invesco Funds | | N/A | | N/A |
Kelli Gallegos — 1970 Vice President, Principal Financial Officer and Assistant Treasurer | | 2008 | | Vice President, Principal Financial Officer and Assistant Treasurer, The Invesco Funds; Assistant Treasurer, Invesco PowerShares Capital Management LLC, PowerShares Exchange-Traded Fund Trust, PowerShares Exchange-Traded Fund Trust II, PowerShares India Exchange-Traded Fund Trust, PowerShares Actively Managed Exchange-Traded Fund Trust, PowerShares Actively Managed Exchange-Traded Commodity Fund Trust and PowerShares Exchange-Traded Self-Indexed Fund Trust Formerly: Assistant Vice President, The Invesco Funds | | N/A | | N/A |
Invesco V.I. Core Plus Bond Fund
Trustees and Officers—(continued)
| | | | | | | | |
Name, Year of Birth and
Position(s) Held with the Trust | | Trustee and/
or Officer Since | | Principal Occupation(s)
During Past 5 Years | | Number of
Funds in Fund
Complex
Overseen by
Trustee | | Other Directorship(s)
Held by Trustee During
Past 5 Years |
| Other Officers—(continued) | | | | | | | | |
Tracy Sullivan — 1962 Vice President, Chief Tax Officer and Assistant Treasurer | | 2008 | | Vice President, Chief Tax Officer and Assistant Treasurer, The Invesco Funds; Assistant Treasurer, Invesco PowerShares Capital Management LLC, PowerShares Exchange-Traded Fund Trust, PowerShares Exchange-Traded Fund Trust II, PowerShares India Exchange-Traded Fund Trust, PowerShares Actively Managed Exchange-Traded Fund Trust, PowerShares Actively Managed Exchange-Traded Commodity Fund Trust and PowerShares Exchange-Traded Self-Indexed Fund Trust Formerly: Assistant Vice President, The Invesco Funds | | N/A | | N/A |
Crissie M. Wisdom — 1969 Anti-Money Laundering Compliance Officer | | 2013 | | Anti-Money Laundering Compliance Officer, Invesco Advisers, Inc. (formerly known as Invesco Institutional (N.A.), Inc.) (registered investment adviser), Invesco Capital Markets, Inc. (formerly known as Van Kampen Funds Inc.), Invesco Distributors, Inc., Invesco Investment Services, Inc., Invesco Management Group, Inc., The Invesco Funds, and PowerShares Exchange-Traded Fund Trust, PowerShares Exchange-Traded Fund Trust II, PowerShares India Exchange-Traded Fund Trust, PowerShares Actively Managed Exchange-Traded Fund Trust, PowerShares Actively Managed Exchange-Traded Commodity Fund Trust and PowerShares Exchange-Traded Self-Indexed Fund Trust; Anti-Money Laundering Compliance Officer and Bank Secrecy Act Officer, INVESCO National Trust Company and Invesco Trust Company; and Fraud Prevention Manager and Controls and Risk Analysis Manager for Invesco Investment Services, Inc. Formerly: Anti-Money Laundering Compliance Officer, Van Kampen Exchange Corp. | | N/A | | N/A |
Robert R. Leveille — 1969 Chief Compliance Officer | | 2016 | | Chief Compliance Officer, Invesco Advisers, Inc. (registered investment adviser); and Chief Compliance Officer, The Invesco Funds Formerly: Chief Compliance Officer, Putnam Investments and the Putnam Funds | | N/A | | N/A |
The Statement of Additional Information of the Trust includes additional information about the Fund’s Trustees and is available upon request, without charge, by calling 1.800.959.4246. Please refer to the Fund’s Statement of Additional Information for information on the Fund’s sub-advisers.
| | | | | | |
Office of the Fund 11 Greenway Plaza, Suite 1000 Houston, TX 77046-1173 | | Investment Adviser Invesco Advisers, Inc. 1555 Peachtree Street, N.E. Atlanta, GA 30309 | | Distributor Invesco Distributors, Inc. 11 Greenway Plaza, Suite 1000 Houston, TX 77046-1173 | | Auditors PricewaterhouseCoopers LLP 1000 Louisiana Street, Suite 5800 Houston, TX 77002-5678 |
| | | |
| | | | | | |
Counsel to the Fund Stradley Ronon Stevens & Young, LLP 2005 Market Street, Suite 2600 Philadelphia, PA 19103-7018 | | Counsel to the Independent Trustees Goodwin Procter LLP 901 New York Avenue, N.W. Washington, D.C. 20001 | | Transfer Agent Invesco Investment Services, Inc. 11 Greenway Plaza, Suite 1000 Houston, TX 77046-1173 | | Custodian State Street Bank and Trust Company 225 Franklin Street Boston, MA 02110-2801 |
Invesco V.I. Core Plus Bond Fund
| | | | |
| | |
 | | Annual Report to Shareholders | | December 31, 2017 |
| | |
| | Invesco V.I. Diversified Dividend Fund |

| | |
| | The Fund provides a complete list of its holdings four times in each fiscal year, at the quarter-ends. For the second and fourth quarters, the lists appear in the Fund’s semiannual and annual reports to shareholders. For the first and third quarters, the Fund files the lists with the Securities and Exchange Commission (SEC) on Form N-Q. The Fund’s Form N-Q filings are available on the SEC website, sec.gov. Copies of the Fund’s Forms N-Q may be reviewed and copied at the SEC Public Reference Room in Washington, D.C. You can obtain information on the operation of the Public Reference Room, including information about duplicating fee charges, by calling 202 551 8090 or 800 732 0330, or by electronic request at the following email address: publicinfo@sec.gov. The SEC file numbers for the Fund are 811-07452 and 033-57340. The Fund’s most recent portfolio holdings, as filed on Form N-Q, have also been made available to insurance companies issuing variable annuity contracts and variable life insurance policies (“variable products”) that invest in the Fund. A description of the policies and procedures that the Fund uses to determine how to vote proxies relating to portfolio securities is available without charge, upon request, from our Client Services department at 800 959 4246 or at invesco.com/proxyguidelines. The information is also available on the SEC website, sec.gov. Information regarding how the Fund voted proxies related to its portfolio securities during the most recent 12-month period ended June 30 is available at invesco.com/ proxysearch. The information is also available on the SEC website, sec.gov. Invesco Advisers, Inc. is an investment adviser; it provides investment advisory services to individual and institutional clients and does not sell securities. Invesco Distributors, Inc. is the US distributor for Invesco Ltd.’s retail mutual funds, exchange-traded funds and institutional money market funds. Both are wholly owned, indirect subsidiaries of Invesco Ltd. This report must be accompanied or preceded by a currently effective Fund prospectus and variable product prospectus, which contain more complete information, including sales charges and expenses. Investors should read each carefully before investing. NOT FDIC INSURED | MAY LOSE VALUE | NO BANK GUARANTEE |
| | Invesco Distributors, Inc. VIDDI-AR-1 02092018 0937 |
Management’s Discussion of Fund Performance
Performance summary
For the year ended December 31, 2017, Series I shares of Invesco V.I. Diversified Dividend Fund (the Fund) underperformed the Russell 1000 Value Index, the Fund’s style-specific benchmark.
Your Fund’s long-term performance appears later in this report.
Fund vs. Indexes
Total returns, 12/31/16 to 12/31/17, excluding variable product issuer charges.
If variable product issuer charges were included, returns would be lower.
| | | | | |
| Series I Shares | | | | 8.58 | % |
| Series II Shares | | | | 8.35 | |
| S&P 500 Index▼ (Broad Market Index) | | | | 21.83 | |
| Russell 1000 Value Index▼ (Style-Specific Index) | | | | 13.66 | |
| Lipper VUF Large-Cap Value Funds Index∎ (Peer Group Index) | | | | 14.65 | |
Source(s): ▼FactSet Research Systems Inc.; ∎Lipper Inc. | | | | | |
Market conditions and your Fund
The US economy saw continued expansion throughout the year ended December 31, 2017. Gross domestic product – the value of all goods and services produced in the US –increased in the first three quarters of 2017. Inflation remained subdued even as unemployment continued its multiyear decline.
Given signs of an improving economy, the US Federal Reserve (the Fed) raised interest rates three times during the reporting period, increasing the target rate by 25 basis points each time.1 (A basis point is 0.01%.) At the close of the reporting period, Fed policy remained accommodative, and the fed funds target rate stood at a range of 1.25% to 1.50%.1
The stock market rally that began after the 2016 presidential election continued throughout the reporting period, fueled by generally positive economic data, improved corporate earnings and increased consumer confidence. After much debate in Congress, a tax reform bill was signed into law in December 2017. While its enactment further strengthened stocks, its effect on the US economy remains
uncertain.
Within the S&P 500 Index, information technology (IT) was the best-performing sector for the year, while telecommunication services and energy were the worst-performing sectors. It is important to view the market’s performance within the context of a full market cycle. This cycle, which began in March 2009, is one of the longest expansions on record with one of the largest bull markets, despite a historically low recovery in revenue versus previous cycle troughs.2 We continue to remain focused on our assessment of each investment’s risk-reward profile.
During the year, our management discipline remained unchanged. Our total return approach continued to emphasize long-term capital appreciation, current income and capital preservation. We believe the Fund may serve as an equity foundation within a well-diversified asset allocation strategy, complementing more aggressive and cyclical investments. We look for dividend-paying companies with strong profitability, solid balance sheets and capital allocation policies that support sustained or increasing dividends and share repurchases. We perform extensive
fundamental research, incorporating both financial statement analysis and an assessment of the potential reward relative to the downside risk, to determine a fair valuation over our two- to three-year investment horizon for each stock. We believe this process may provide a valuable combination of dividend income, price appreciation and capital preservation. We also maintain a rigorous sell discipline and consider selling or reducing shares in stocks that no longer meet our investment criteria.
During the year, holdings in the financials sector were the largest contributors to the Fund’s performance. American Express and Hartford Financial Services were among the top individual contributors. The share price of American Express rose as the company’s co-branded card business stabilized amid a backdrop of technological and competitive industry changes. The company also showed strong top-line growth and raised its earnings guidance as it executed on its strategy to expand lending into the small and medium market channels. The company’s long-term chief executive officer also announced his retirement, putting an end to an overhang on the stock over succession plans. Hartford’s stock price appreciated following an expansion in earnings within its property and casualty operations and management’s renewed focus on improving underwriting results in its personal auto lines operation. The stock also benefited from management’s announced intention to sell its run-off life and annuity business following a favorable state regulatory ruling over divesting non-core businesses.
Consumer staples holding Heineken was also a large contributor to Fund performance during the year. The company benefited from its strategy to portray its products as “premium” beverages as well
| | |
| Portfolio Composition |
By sector | % of total net assets |
| | |
| |
| Consumer Staples | | 19.7% |
| Utilities | | 15.5 |
| Financials | | 14.0 |
| Industrials | | 8.9 |
| Energy | | 7.5 |
| Consumer Discretionary | | 7.2 |
| Health Care | | 6.7 |
| Telecommunication Services | | 5.5 |
| Materials | | 2.8 |
| Real Estate | | 1.5 |
| Information Technology | | 0.9 |
Money Market Funds Plus Other Assets Less Liabilities | | 9.8 |
| | |
| Top 10 Equity Holdings* |
% of total net assets |
| |
| 1. General Mills, Inc. | | 3.3% |
2. AT&T Inc. | | 3.0 |
3. Hartford Financial Services Group, Inc. (The) | | 2.9 |
4. Coca-Cola Co. (The) | | 2.6 |
5. Exelon Corp. | | 2.5 |
6. Suncor Energy, Inc. | | 2.3 |
7. PPL Corp. | | 2.3 |
8. Proctor & Gamble Co. (The) | | 2.0 |
9. TOTAL S.A. | | 2.0 |
10. Dominion Energy, Inc. | | 2.0 |
| | |
| Total Net Assets | | $679.7 million |
| |
| Total Number of Holdings* | | 71 |
The Fund’s holdings are subject to change, and there is no assurance that the Fund will continue to hold any particular security.
*Excluding money market fund holdings.
Data presented here are as of December 31, 2017.
Invesco V.I. Diversified Dividend Fund
as from stability in Mexico and strength in many emerging markets. Heineken also completed its acquisition of Punch Taverns in the UK.
Energy holding Nabors Industries was the largest detractor from the Fund’s performance during the year due to continued weakness in upstream drilling activity that further pressured rig profitability. We sold our position in the company by the end of the year. Consumer staples holding Campbell Soup was also a large detractor from Fund performance as the company saw slower growth during the year due to increased retail competition with the entry of online grocers and discounters. The company’s soup category also lost market share during the year and Campbell Soup announced it will acquire Snyder’s-Lance (not a Fund holding) to further shift its business mix to the growing snacks category.
Telecommunication services holding BT Group also detracted from the Fund’s performance during the year. The company’s stock price declined due to losses within its global services business, as well as the loss of several key public service contracts in the UK. The company also faced regulatory uncertainty regarding the independence of its infrastructure unit and pricing regulation of its products.
Within the Fund’s style-specific benchmark, IT, materials and financials were the best-performing sectors, while telecommunication services and energy were the worst-performing sectors during the year. The Fund’s underweight allocations to the IT and financials sectors detracted from the Fund’s performance relative to the style-specific benchmark. The Fund’s overweight allocation to the consumer staples sector also detracted from relative performance, as did the Fund’s large cash position in a rising market environment. While the Fund’s cash position was higher-than-normal for much of the year, it decreased and ended the reporting period closer to normal levels. Strong stock selection in and underweight allocation to the energy sector helped the Fund’s relative performance. The Fund used currency forward contracts for the purpose of hedging currency exposure of some of the non-US-based companies held in the portfolio and not for speculative purposes or leverage. The use of currency forward contracts had a very small negative impact on the Fund’s performance during the year.
The Fund has successfully navigated multiple market cycles over its history with a consistent long-term fundamentally-focused process that emphasizes capital appreciation, current income and capital preservation.
It has been our privilege to manage Invesco V.I. Diversified Dividend Fund, and we thank you for your continued investment.
| 1 | Source: US Federal Reserve |
| 2 | Source(s): National Bureau of Economic Research, Ned Davis Research and FactSet Research Systems Inc. |
The views and opinions expressed in management’s discussion of Fund performance are those of Invesco Advisers, Inc. These views and opinions are subject to change at any time based on factors such as market and economic conditions. These views and opinions may not be relied upon as investment advice or recommendations, or as an offer for a particular security. The information is not a complete analysis of every aspect of any market, country, industry, security or the Fund. Statements of fact are from sources considered reliable, but Invesco Advisers, Inc. makes no representation or warranty as to their completeness or accuracy. Although historical performance is no guarantee of future results, these insights may help you understand our investment management philosophy.
See important Fund and, if applicable, index disclosures later in this report.
| | |
 | | Meggan Walsh Chartered Financial Analyst, Portfolio Manager and Head of Invesco’s Dividend Value Team, is lead manager of |
| Invesco V.I. Diversified Dividend Fund. She joined Invesco in 1991. Ms. Walsh earned a BS in finance from the University of Maryland and an MBA from Loyola University Maryland. |
| | |
 | | Robert Botard Chartered Financial Analyst, Portfolio Manager, is manager of Invesco V.I. Diversified Dividend Fund. He joined |
| Invesco in 1993. Mr. Botard earned a BBA in finance and a BBA in international business from The University of Texas at Austin. He also earned a Master of International Management degree from the Thunderbird School of Global Management. |
| | |
 | | Kristina Bradshaw Chartered Financial Analyst, Portfolio Manager, is manager of Invesco V.I. Diversified Dividend Fund. She |
| joined Invesco in 2006. Ms. Bradshaw earned a BBA with honors from The University of Texas at Austin and an MBA from Stanford University’s Graduate School of Business. |
| | |
 | | Chris McMeans Chartered Financial Analyst, Portfolio Manager is manager of Invesco V.I. Diversified Dividend Fund. He |
| joined Invesco in 2008. Mr. McMeans earned a BA in economics from The University of Texas at Austin and an MBA with honors from the University of Houston. |
Invesco V.I. Diversified Dividend Fund
Your Fund’s Long-Term Performance
Results of a $10,000 Investment – Oldest Share Class(es)
Fund and index data from 12/31/07
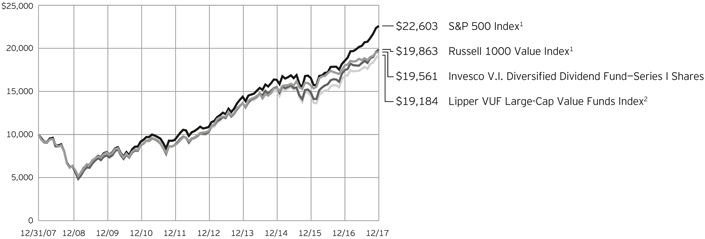
| 1 | Source: FactSet Research Systems Inc. |
Past performance cannot guarantee
comparable future results.
| | | | | |
| Average Annual Total Returns |
As of 12/31/17 | | | | | |
| |
| Series I Shares | | | | | |
| Inception (3/1/90) | | | | 8.24 | % |
| 10 Years | | | | 6.94 | |
| 5 Years | | | | 13.47 | |
| 1 Year | | | | 8.58 | |
| |
| Series II Shares | | | | | |
| Inception (6/5/00) | | | | 5.73 | % |
| 10 Years | | | | 6.68 | |
| 5 Years | | | | 13.21 | |
| 1 Year | | | | 8.35 | |
Effective June 1, 2010, Class X and Class Y shares of the predecessor fund, Morgan Stanley Variable Investment Dividend Growth Portfolio, advised by Morgan Stanley Investment Advisors Inc. were reorganized into Series I and Series II shares, respectively, of Invesco V.I. Dividend Growth Fund (renamed Invesco V.I. Diversified Dividend Fund on April 30, 2012). Returns shown above, prior to June 1, 2010, for Series I and Series II shares are blended returns of the predecessor fund and Invesco V.I. Dividend Growth Fund. Share class returns will differ from the predecessor fund because of different expenses.
The performance data quoted represent past performance and cannot guarantee comparable future
results; current performance may be lower or higher. Please contact your variable product issuer or financial adviser for the most recent month-end variable product performance. Performance figures reflect Fund expenses, reinvested distributions and changes in net asset value. Investment return and principal value will fluctuate so that you may have a gain or loss when you sell shares.
The net annual Fund operating expense ratio set forth in the most recent Fund prospectus as of the date of this report for Series I and Series II shares was 0.68% and 0.93%, respectively.1 The total annual Fund operating expense ratio set forth in the most recent Fund prospectus as of the date of this report for Series I and Series II shares was 0.70% and 0.95%, respectively. The expense ratios presented above may vary from the expense ratios presented in other sections of this report that are based on expenses incurred during the period covered by this report.
Invesco V.I. Diversified Dividend Fund, a series portfolio of AIM Variable Insurance Funds (Invesco Variable Insurance Funds), is currently offered through insurance companies issuing variable products. You cannot purchase
shares of the Fund directly. Performance figures given represent the Fund and are not intended to reflect actual variable product values. They do not reflect sales charges, expenses and fees assessed in connection with a variable product. Sales charges, expenses and fees, which are determined by the variable product issuers, will vary and will lower the total return.
The most recent month-end performance at the Fund level, excluding variable product charges, is available at 800 451 4246. As mentioned above, for the most recent month-end performance including variable product charges, please contact your variable product issuer or financial adviser.
Fund performance reflects any applicable fee waivers and/or expense reimbursements. Had the adviser not waived fees and/or reimbursed expenses currently or in the past, returns would have been lower. See current prospectus for more information.
| 1 | Total annual Fund operating expenses after any contractual fee waivers and/or expense reimbursements by the adviser in effect through at least June 30, 2019. See current prospectus for more information. |
Invesco V.I. Diversified Dividend Fund
Invesco V.I. Diversified Dividend Fund’s investment objective is to provide reasonable current income and long-term growth of income and capital.
| ∎ | | Unless otherwise stated, information presented in this report is as of December 31, 2017, and is based on total net assets. |
| ∎ | | Unless otherwise noted, all data provided by Invesco. |
Principal risks of investing in the Fund
Foreign securities risk. The Fund’s foreign investments may be adversely affected by political and social instability, changes in economic or taxation policies, difficulty in enforcing obligations, decreased liquidity or increased volatility. Foreign investments also involve the risk of the possible seizure, nationalization or expropriation of the issuer or foreign deposits (in which the Fund could lose its entire investments in a certain market) and the possible adoption of foreign governmental restrictions such as exchange controls. Unless the Fund has hedged its foreign securities risk, foreign securities risk also involves the risk of negative foreign currency rate fluctuations, which may cause the value of securities denominated in such foreign currency (or other instruments through which the Fund has exposure to foreign currencies) to decline in value. Currency exchange rates may fluctuate significantly over short periods of time. Currency hedging strategies, if used, are not always successful.
Management risk. The Fund is actively managed and depends heavily on the Adviser’s judgment about markets, interest rates or the attractiveness, relative values, liquidity, or potential appreciation of particular investments made for the Fund’s portfolio. The Fund could experience losses if these judgments prove to be incorrect. Additionally, legislative, regulatory, or tax developments may adversely affect management of the Fund and, therefore, the ability of the Fund to achieve its investment objective.
Market risk. The market values of the Fund’s investments, and therefore the value of the Fund’s shares, will go up and down, sometimes rapidly or unpredictably. Market risk may affect a single issuer, industry or section of the economy, or it may affect the market as a whole. Individual stock prices tend to go up and down more dramatically than those of certain other types of investments, such as bonds. During a general downturn in the financial markets, multiple asset classes may decline in value. When markets perform well, there can be no assurance that specific investments held by the Fund will rise in value.
Value investing style risk. A value investing style subjects the Fund to the risk that the valuations never improve or that
the returns on value equity securities are less than returns on other styles of investing or the overall stock market.
About indexes used in this report
The S&P 500® Index is an unmanaged index considered representative of the US stock market.
The Russell 1000® Value Index is an unmanaged index considered representative of large-cap value stocks. The Russell 1000 Value Index is a trademark/service mark of the Frank Russell Co. Russell® is a trademark of the Frank Russell Co.
The Lipper VUF Large-Cap Value Funds Index is an unmanaged index considered representative of large-cap value variable insurance underlying funds tracked by Lipper.
The Fund is not managed to track the performance of any particular index, including the index(es) described here, and consequently, the performance of the Fund may deviate significantly from the performance of the index(es).
A direct investment cannot be made in an index. Unless otherwise indicated, index results include reinvested dividends, and they do not reflect sales charges. Performance of the peer group, if applicable, reflects fund expenses; performance of a market index does not.
Other information
The returns shown in management’s discussion of Fund performance are based on net asset values calculated for shareholder transactions. Generally accepted accounting principles require adjustments to be made to the net assets of the Fund at period end for financial reporting purposes, and as such, the net asset values for shareholder transactions and the returns based on those net asset values may differ from the net asset values and returns reported in the Financial Highlights. Additionally, the returns and net asset values shown throughout this report are at the Fund level only and do not include variable product issuer charges. If such charges were included, the total returns would be lower.
Industry classifications used in this report are generally according to the Global Industry Classification Standard, which was developed by and is the exclusive property and a service mark of MSCI Inc. and Standard & Poor’s.
Invesco V.I. Diversified Dividend Fund
Schedule of Investments(a)
December 31, 2017
| | | | | | | | |
| | | Shares | | | Value | |
Common Stocks & Other Equity Interests–90.24% | |
| Aerospace & Defense–1.69% | |
General Dynamics Corp. | | | 37,195 | | | $ | 7,567,323 | |
Raytheon Co. | | | 20,998 | | | | 3,944,474 | |
| | | | | | | | 11,511,797 | |
|
| Air Freight & Logistics–1.27% | |
United Parcel Service, Inc.–Class B | | | 72,755 | | | | 8,668,758 | |
|
| Apparel Retail–0.74% | |
TJX Cos., Inc. (The) | | | 66,231 | | | | 5,064,022 | |
|
| Apparel, Accessories & Luxury Goods–1.02% | |
Columbia Sportswear Co. | | | 55,248 | | | | 3,971,226 | |
Tapestry, Inc. | | | 66,798 | | | | 2,954,476 | |
| | | | | | | | 6,925,702 | |
|
| Asset Management & Custody Banks–0.95% | |
Federated Investors, Inc.–Class B | | | 118,241 | | | | 4,266,135 | |
Legg Mason, Inc. | | | 52,022 | | | | 2,183,884 | |
| | | | | | | | 6,450,019 | |
|
| Brewers–1.63% | |
Heineken N.V. (Netherlands) | | | 106,407 | | | | 11,098,103 | |
|
| Consumer Finance–1.72% | |
American Express Co. | | | 118,035 | | | | 11,722,056 | |
|
| Data Processing & Outsourced Services–0.92% | |
Automatic Data Processing, Inc. | | | 53,635 | | | | 6,285,486 | |
|
| Electric Utilities–10.63% | |
American Electric Power Co., Inc. | | | 132,541 | | | | 9,751,041 | |
Duke Energy Corp. | | | 122,239 | | | | 10,281,522 | |
Entergy Corp. | | | 156,513 | | | | 12,738,593 | |
Exelon Corp. | | | 433,094 | | | | 17,068,235 | |
PPL Corp. | | | 497,947 | | | | 15,411,460 | |
SSE PLC (United Kingdom) | | | 391,525 | | | | 6,977,492 | |
| | | | | | | | 72,228,343 | |
|
| Electrical Components & Equipment–2.61% | |
ABB Ltd. (Switzerland) | | | 319,358 | | | | 8,541,717 | |
Emerson Electric Co. | | | 132,053 | | | | 9,202,774 | |
| | | | | | | | 17,744,491 | |
|
| Fertilizers & Agricultural Chemicals–0.42% | |
Agrium Inc. (Canada) | | | 24,654 | | | | 2,835,926 | |
|
| Food Distributors–1.37% | |
Sysco Corp. | | | 153,340 | | | | 9,312,338 | |
|
| General Merchandise Stores–1.80% | |
Target Corp. | | | 187,216 | | | | 12,215,844 | |
|
| Health Care Equipment–0.75% | |
Stryker Corp. | | | 33,035 | | | | 5,115,140 | |
| | | | | | | | |
| | | Shares | | | Value | |
| Hotels, Resorts & Cruise Lines–0.51% | |
Accor S.A. (France) | | | 66,962 | | | $ | 3,451,464 | |
|
| Household Products–3.37% | |
Kimberly-Clark Corp. | | | 77,015 | | | | 9,292,630 | |
Procter & Gamble Co. (The) | | | 148,489 | | | | 13,643,169 | |
| | | | | | | | 22,935,799 | |
|
| Housewares & Specialties–0.39% | |
Newell Brands, Inc. | | | 86,692 | | | | 2,678,783 | |
|
| Human Resource & Employment Services–0.51% | |
Robert Half International, Inc. | | | 61,913 | | | | 3,438,648 | |
|
| Industrial Conglomerates–0.82% | |
Siemens AG (Germany) | | | 40,057 | | | | 5,557,641 | |
|
| Industrial Machinery–2.02% | |
Flowserve Corp. | | | 217,346 | | | | 9,156,787 | |
Pentair PLC (United Kingdom) | | | 64,370 | | | | 4,545,809 | |
| | | | | | | | 13,702,596 | |
|
| Integrated Oil & Gas–5.05% | |
Royal Dutch Shell PLC–Class B (United Kingdom) | | | 156,588 | | | | 5,281,034 | |
Suncor Energy, Inc. (Canada) | | | 420,562 | | | | 15,441,910 | |
TOTAL S.A. (France) | | | 246,362 | | | | 13,592,537 | |
| | | | | | | | 34,315,481 | |
|
| Integrated Telecommunication Services–5.50% | |
AT&T Inc. | | | 516,142 | | | | 20,067,601 | |
BT Group PLC (United Kingdom) | | | 2,338,310 | | | | 8,561,254 | |
Deutsche Telekom AG (Germany) | | | 492,639 | | | | 8,736,407 | |
| | | | | | | | 37,365,262 | |
|
| Motorcycle Manufacturers–1.14% | |
Harley-Davidson, Inc. | | | 152,189 | | | | 7,743,376 | |
|
| Movies & Entertainment–0.81% | |
Time Warner Inc. | | | 60,055 | | | | 5,493,231 | |
|
| Multi-Line Insurance–2.85% | |
Hartford Financial Services Group, Inc. (The) | | | 343,711 | | | | 19,344,055 | |
|
| Multi-Utilities–4.82% | |
Consolidated Edison, Inc. | | | 129,380 | | | | 10,990,831 | |
Dominion Energy, Inc. | | | 167,392 | | | | 13,568,796 | |
Sempra Energy | | | 76,934 | | | | 8,225,783 | |
| | | | | | | | 32,785,410 | |
|
| Oil & Gas Equipment & Services–0.79% | |
Baker Hughes, a GE Co. | | | 170,830 | | | | 5,405,061 | |
|
| Oil & Gas Exploration & Production–1.66% | |
ConocoPhillips | | | 205,751 | | | | 11,293,672 | |
See accompanying Notes to Financial Statements which are an integral part of the financial statements.
Invesco V.I. Diversified Dividend Fund
| | | | | | | | |
| | | Shares | | | Value | |
| Packaged Foods & Meats–7.95% | |
Campbell Soup Co. | | | 178,918 | | | $ | 8,607,745 | |
Danone S.A. (France) | | | 55,581 | | | | 4,659,584 | |
General Mills, Inc. | | | 380,187 | | | | 22,541,287 | |
Kraft Heinz Co. (The) | | | 123,024 | | | | 9,566,346 | |
Mondelez International, Inc.–Class A | | | 202,287 | | | | 8,657,884 | |
| | | | | | | | 54,032,846 | |
|
| Paper Packaging–2.36% | |
Avery Dennison Corp. | | | 32,570 | | | | 3,740,990 | |
International Paper Co. | | | 142,190 | | | | 8,238,489 | |
Sonoco Products Co. | | | 75,988 | | | | 4,038,002 | |
| | | | | | | | 16,017,481 | |
|
| Personal Products–0.77% | |
L’Oreal S.A. (France) | | | 23,610 | | | | 5,230,103 | |
|
| Pharmaceuticals–5.94% | |
Bayer AG (Germany) | | | 53,211 | | | | 6,617,848 | |
Bristol-Myers Squibb Co. | | | 197,814 | | | | 12,122,042 | |
Eli Lilly and Co. | | | 120,924 | | | | 10,213,241 | |
Johnson & Johnson | | | 43,509 | | | | 6,079,078 | |
Merck & Co., Inc. | | | 95,461 | | | | 5,371,590 | |
| | | | | | | | 40,403,799 | |
|
| Property & Casualty Insurance–1.02% | |
Travelers Cos., Inc. (The) | | | 50,883 | | | | 6,901,770 | |
|
| Regional Banks–7.48% | |
Cullen/Frost Bankers, Inc. | | | 43,564 | | | | 4,123,333 | |
Fifth Third Bancorp | | | 274,235 | | | | 8,320,290 | |
KeyCorp | | | 334,908 | | | | 6,755,094 | |
M&T Bank Corp. | | | 67,426 | | | | 11,529,172 | |
PNC Financial Services Group, Inc. (The) | | | 61,238 | | | | 8,836,031 | |
| | | | | | | | |
| | | Shares | | | Value | |
| Regional Banks–(continued) | | | | | | | | |
Zions Bancorp. | | | 221,305 | | | $ | 11,248,933 | |
| | | | | | | | 50,812,853 | |
|
| Restaurants–0.80% | |
Darden Restaurants, Inc. | | | 56,895 | | | | 5,463,058 | |
|
| Soft Drinks–2.56% | |
Coca-Cola Co. (The) | | | 378,599 | | | | 17,370,122 | |
|
| Specialized REIT’s–1.53% | |
Weyerhaeuser Co. | | | 294,197 | | | | 10,373,386 | |
|
| Tobacco–2.07% | |
Altria Group, Inc. | | | 82,748 | | | | 5,909,035 | |
Philip Morris International Inc. | | | 77,556 | | | | 8,193,791 | |
| | | | | | | | 14,102,826 | |
Total Common Stocks & Other Equity Interests
(Cost $460,803,249) | | | | 613,396,748 | |
|
Money Market Funds–9.87% | |
Invesco Government & Agency Portfolio–Institutional Class, 1.18%(b) | | | 23,470,270 | | | | 23,470,270 | |
Invesco Liquid Assets Portfolio–Institutional Class, 1.40%(b) | | | 16,760,982 | | | | 16,762,658 | |
Invesco Treasury Portfolio–Institutional Class, 1.17%(b) | | | 26,823,166 | | | | 26,823,166 | |
Total Money Market Funds
(Cost $67,057,720) | | | | 67,056,094 | |
TOTAL INVESTMENTS IN SECURITIES–100.11%
(Cost $527,860,969) | | | | 680,452,842 | |
OTHER ASSETS LESS LIABILITIES–(0.11)% | | | | (735,643 | ) |
NET ASSETS–100.00% | | | $ | 679,717,199 | |
Investment Abbreviations:
| | |
| REIT | | – Real Estate Investment Trust |
Notes to Schedule of Investments:
| (a) | Industry and/or sector classifications used in this report are generally according to the Global Industry Classification Standard, which was developed by and is the exclusive property and a service mark of MSCI Inc. and Standard & Poor’s. |
| (b) | The money market fund and the Fund are affiliated by having the same investment adviser. The rate shown is the 7-day SEC standardized yield as of December 31, 2017. |
See accompanying Notes to Financial Statements which are an integral part of the financial statements.
Invesco V.I. Diversified Dividend Fund
| | | | | | | | | | | | | | | | | | | | | | |
| Open Forward Foreign Currency Contracts | |
Settlement
Date | | | | Contract to | | | Unrealized Appreciation (Depreciation) | |
| | Counterparty | | Deliver | | | Receive | | |
01/23/2018 | | Citigroup Global Markets Inc. | | | USD | | | | 44,921 | | | | CAD | | | | 57,153 | | | $ | 568 | |
01/23/2018 | | Citigroup Global Markets Inc. | | | USD | | | | 41,308 | | | | EUR | | | | 34,887 | | | | 616 | |
01/23/2018 | | JPMorgan Chase Bank, N.A. | | | USD | | | | 7,742,537 | | | | CAD | | | | 9,930,081 | | | | 161,007 | |
01/23/2018 | | Merrill Lynch International | | | USD | | | | 29,301 | | | | CAD | | | | 37,354 | | | | 430 | |
01/23/2018 | | State Street Bank and Trust Co. | | | USD | | | | 152,130 | | | | CAD | | | | 194,877 | | | | 2,977 | |
Subtotal — Appreciation | | | | | | | | | | | | | | | | | | | 165,598 | |
01/23/2018 | | Citigroup Global Markets Inc. | | | CAD | | | | 3,356,047 | | | | USD | | | | 2,632,122 | | | | (39,022 | ) |
01/23/2018 | | Citigroup Global Markets Inc. | | | EUR | | | | 6,121,709 | | | | USD | | | | 7,225,720 | | | | (130,748 | ) |
01/23/2018 | | JPMorgan Chase Bank, N.A. | | | CAD | | | | 5,100,260 | | | | USD | | | | 3,996,015 | | | | (63,381 | ) |
01/23/2018 | | JPMorgan Chase Bank, N.A. | | | EUR | | | | 6,351,938 | | | | USD | | | | 7,498,533 | | | | (134,601 | ) |
01/23/2018 | | Merrill Lynch International | | | EUR | | | | 6,100,603 | | | | USD | | | | 7,201,410 | | | | (129,696 | ) |
01/23/2018 | | State Street Bank and Trust Co. | | | CAD | | | | 3,356,047 | | | | USD | | | | 2,632,865 | | | | (38,279 | ) |
01/23/2018 | | State Street Bank and Trust Co. | | | EUR | | | | 6,269,005 | | | | USD | | | | 7,401,604 | | | | (131,869 | ) |
Subtotal — Depreciation | | | | | | | | | | | | | | | | | | | (667,596 | ) |
Total Forward Foreign Currency Contracts — Currency Risk | | | | | | | | | | | | | | | | | | $ | (501,998 | ) |
Currency Abbreviations:
| | |
| CAD | | – Canadian Dollar |
| EUR | | – Euro |
| USD | | – U.S. Dollar |
See accompanying Notes to Financial Statements which are an integral part of the financial statements.
Invesco V.I. Diversified Dividend Fund
Statement of Assets and Liabilities
December 31, 2017
Statement of Operations
For the year ended December 31, 2017
| | | | |
Assets: | | | | |
Investments in securities, at value (Cost $460,803,249) | | $ | 613,396,748 | |
Investments in affiliated money market funds, at value (Cost $67,057,720) | | | 67,056,094 | |
Other investments: | | | | |
Unrealized appreciation on forward foreign currency contracts outstanding | | | 165,598 | |
Foreign currencies, at value (Cost $5,100) | | | 6,413 | |
Receivable for: | | | | |
Investments sold | | | 550,488 | |
Fund shares sold | | | 141,323 | |
Dividends | | | 1,190,087 | |
Investment for trustee deferred compensation and retirement plans | | | 89,495 | |
Total assets | | | 682,596,246 | |
| |
Liabilities: | | | | |
Other investments: | | | | |
Unrealized depreciation on forward foreign currency contracts outstanding | | | 667,596 | |
Payable for: | | | | |
Investments purchased | | | 926,706 | |
Fund shares reacquired | | | 760,733 | |
Accrued fees to affiliates | | | 363,510 | |
Accrued trustees’ and officers’ fees and benefits | | | 833 | |
Accrued other operating expenses | | | 31,732 | |
Trustee deferred compensation and retirement plans | | | 127,937 | |
Total liabilities | | | 2,879,047 | |
Net assets applicable to shares outstanding | | $ | 679,717,199 | |
| |
Net assets consist of: | | | | |
Shares of beneficial interest | | $ | 494,584,389 | |
Undistributed net investment income | | | 13,200,591 | |
Undistributed net realized gain | | | 19,839,943 | |
Net unrealized appreciation | | | 152,092,276 | |
| | | $ | 679,717,199 | |
| |
Net Assets: | | | | |
Series I | | $ | 437,103,636 | |
Series II | | $ | 242,613,563 | |
|
Shares outstanding, no par value,
with an unlimited number of shares authorized: | |
Series I | | | 16,079,945 | |
Series II | | | 8,984,240 | |
Series I: | | | | |
Net asset value per share | | $ | 27.18 | |
Series II: | | | | |
Net asset value per share | | $ | 27.00 | |
| | | | |
Investment income: | | | | |
Dividends (net of foreign withholding taxes of $264,218) | | $ | 17,500,764 | |
Dividends from affiliated money market funds | | | 648,269 | |
Total investment income | | | 18,149,033 | |
| |
Expenses: | | | | |
Advisory fees | | | 3,134,430 | |
Administrative services fees | | | 1,004,014 | |
Custodian fees | | | 37,893 | |
Distribution fees — Series II | | | 578,739 | |
Transfer agent fees | | | 22,287 | |
Trustees’ and officers’ fees and benefits | | | 33,785 | |
Reports to shareholders | | | 69,156 | |
Professional services fees | | | 40,621 | |
Other | | | 8,542 | |
Total expenses | | | 4,929,467 | |
Less: Fees waived | | | (97,940 | ) |
Net expenses | | | 4,831,527 | |
Net investment income | | | 13,317,506 | |
| |
Realized and unrealized gain (loss) from: | | | | |
Net realized gain (loss) from: | | | | |
Investment securities | | | 25,838,951 | |
Foreign currencies | | | 1,769 | |
Forward foreign currency contracts | | | (1,875,503 | ) |
| | | | 23,965,217 | |
Change in net unrealized appreciation (depreciation) of: | | | | |
Investment securities | | | 18,187,786 | |
Foreign currencies | | | 481 | |
Forward foreign currency contracts | | | (784,599 | ) |
| | | | 17,403,668 | |
Net realized and unrealized gain | | | 41,368,885 | |
Net increase in net assets resulting from operations | | $ | 54,686,391 | |
See accompanying Notes to Financial Statements which are an integral part of the financial statements.
Invesco V.I. Diversified Dividend Fund
Statement of Changes in Net Assets
For the years ended December 31, 2017 and 2016
| | | | | | | | |
| | | 2017 | | | 2016 | |
Operations: | | | | | | | | |
Net investment income | | $ | 13,317,506 | | | $ | 10,874,801 | |
Net realized gain | | | 23,965,217 | | | | 25,956,331 | |
Change in net unrealized appreciation | | | 17,403,668 | | | | 40,354,776 | |
Net increase in net assets resulting from operations | | | 54,686,391 | | | | 77,185,908 | |
| | |
Distributions to shareholders from net investment income: | | | | | | | | |
Series I | | | (7,270,269 | ) | | | (5,214,115 | ) |
Series ll | | | (3,521,736 | ) | | | (2,189,930 | ) |
Total distributions from net investment income | | | (10,792,005 | ) | | | (7,404,045 | ) |
| | |
Distributions to shareholders from net realized gains: | | | | | | | | |
Series l | | | (14,902,165 | ) | | | — | |
Series ll | | | (8,103,670 | ) | | | — | |
Total distributions from net realized gains | | | (23,005,835 | ) | | | — | |
| | |
Share transactions–net: | | | | | | | | |
Series l | | | (16,772,830 | ) | | | 57,813,882 | |
Series ll | | | 20,130,628 | | | | 61,825,573 | |
Net increase in net assets resulting from share transactions | | | 3,357,798 | | | | 119,639,455 | |
Net increase in net assets | | | 24,246,349 | | | | 189,421,318 | |
| | |
Net assets: | | | | | | | | |
Beginning of year | | | 655,470,850 | | | | 466,049,532 | |
End of year (includes undistributed net investment income of $13,200,591 and $10,458,704, respectively) | | $ | 679,717,199 | | | $ | 655,470,850 | |
Notes to Financial Statements
December 31, 2017
NOTE 1—Significant Accounting Policies
Invesco V.I. Diversified Dividend Fund (the “Fund”) is a series portfolio of AIM Variable Insurance Funds (Invesco Variable Insurance Funds) (the “Trust”). The Trust is a Delaware statutory trust registered under the Investment Company Act of 1940, as amended (the “1940 Act”), as an open-end series management investment company consisting of twenty-four separate portfolios, (each constituting a “Fund”). The assets, liabilities and operations of each portfolio are accounted for separately. Information presented in these financial statements pertains only to the Fund. Matters affecting each Fund or class will be voted on exclusively by the shareholders of such Fund or class. Current Securities and Exchange Commission (“SEC”) guidance, however, requires participating insurance companies offering separate accounts to vote shares proportionally in accordance with the instructions of the contract owners whose investments are funded by shares of each Fund or class.
The Fund’s investment objective is to provide reasonable current income and long-term growth of income and capital.
The Fund currently offers two classes of shares, Series I and Series II, both of which are offered to insurance company separate accounts funding variable annuity contracts and variable life insurance policies (“variable products”).
The Fund is an investment company and accordingly follows the investment company accounting and reporting guidance in accordance with Financial Accounting Standards Board Accounting Standards Codification Topic 946, Financial Services — Investment Companies.
The following is a summary of the significant accounting policies followed by the Fund in the preparation of its financial statements.
| A. | Security Valuations — Securities, including restricted securities, are valued according to the following policy. |
A security listed or traded on an exchange (except convertible securities) is valued at its last sales price or official closing price as of the close of the customary trading session on the exchange where the security is principally traded, or lacking any sales or official closing price on a particular day, the security may be valued at the closing bid price on that day. Securities traded in the over-the-counter market are valued based on prices furnished by independent pricing services or market makers. When such securities are valued by an independent pricing service they may be considered fair valued. Futures contracts are valued at the final settlement price set by an exchange on which they are principally traded. Listed options are valued at the mean between the last bid and asked prices from the exchange on which they are principally traded. Options not listed on an exchange are valued by an independent source at the mean between the last bid and asked prices. For purposes of determining net asset value (“NAV”) per share, futures and option contracts generally are valued 15 minutes after the close of the customary trading session of the New York Stock Exchange (“NYSE”).
Invesco V.I. Diversified Dividend Fund
Investments in open-end and closed-end registered investment companies that do not trade on an exchange are valued at the end-of-day net asset value per share. Investments in open-end and closed-end registered investment companies that trade on an exchange are valued at the last sales price or official closing price as of the close of the customary trading session on the exchange where the security is principally traded.
Debt obligations (including convertible securities) and unlisted equities are fair valued using an evaluated quote provided by an independent pricing service. Evaluated quotes provided by the pricing service may be determined without exclusive reliance on quoted prices, and may reflect appropriate factors such as institution-size trading in similar groups of securities, developments related to specific securities, dividend rate (for unlisted equities), yield (for debt obligations), quality, type of issue, coupon rate (for debt obligations), maturity (for debt obligations), individual trading characteristics and other market data. Pricing services generally value debt obligations assuming orderly transactions of institutional round lot size, but a fund may hold or transact in the same securities in smaller, odd lot sizes. Odd lots often trade at lower prices than institutional round lots. Debt obligations are subject to interest rate and credit risks. In addition, all debt obligations involve some risk of default with respect to interest and/or principal payments.
Foreign securities’ (including foreign exchange contracts) prices are converted into U.S. dollar amounts using the applicable exchange rates as of the close of the NYSE. If market quotations are available and reliable for foreign exchange-traded equity securities, the securities will be valued at the market quotations. Because trading hours for certain foreign securities end before the close of the NYSE, closing market quotations may become unreliable. If between the time trading ends on a particular security and the close of the customary trading session on the NYSE, events occur that the investment adviser determines are significant and make the closing price unreliable, the Fund may fair value the security. If the event is likely to have affected the closing price of the security, the security will be valued at fair value in good faith using procedures approved by the Board of Trustees. Adjustments to closing prices to reflect fair value may also be based on a screening process of an independent pricing service to indicate the degree of certainty, based on historical data, that the closing price in the principal market where a foreign security trades is not the current value as of the close of the NYSE. Foreign securities’ prices meeting the approved degree of certainty that the price is not reflective of current value will be priced at the indication of fair value from the independent pricing service. Multiple factors may be considered by the independent pricing service in determining adjustments to reflect fair value and may include information relating to sector indices, American Depositary Receipts and domestic and foreign index futures. Foreign securities may have additional risks including exchange rate changes, potential for sharply devalued currencies and high inflation, political and economic upheaval, the relative lack of issuer information, relatively low market liquidity and the potential lack of strict financial and accounting controls and standards.
Securities for which market prices are not provided by any of the above methods may be valued based upon quotes furnished by independent sources. The last bid price may be used to value equity securities. The mean between the last bid and asked prices is used to value debt obligations, including corporate loans.
Securities for which market quotations are not readily available or became unreliable are valued at fair value as determined in good faith by or under the supervision of the Trust’s officers following procedures approved by the Board of Trustees. Issuer specific events, market trends, bid/asked quotes of brokers and information providers and other market data may be reviewed in the course of making a good faith determination of a security’s fair value.
The Fund may invest in securities that are subject to interest rate risk, meaning the risk that the prices will generally fall as interest rates rise and, conversely, the prices will generally rise as interest rates fall. Specific securities differ in their sensitivity to changes in interest rates depending on their individual characteristics. Changes in interest rates may result in increased market volatility, which may affect the value and/or liquidity of certain Fund investments.
Valuations change in response to many factors including the historical and prospective earnings of the issuer, the value of the issuer’s assets, general economic conditions, interest rates, investor perceptions and market liquidity. Because of the inherent uncertainties of valuation, the values reflected in the financial statements may materially differ from the value received upon actual sale of those investments.
| B. | Securities Transactions and Investment Income — Securities transactions are accounted for on a trade date basis. Realized gains or losses on sales are computed on the basis of specific identification of the securities sold. Interest income (net of withholding tax, if any) is recorded on the accrual basis from settlement date. Dividend income (net of withholding tax, if any) is recorded on the ex-dividend date. |
The Fund may periodically participate in litigation related to Fund investments. As such, the Fund may receive proceeds from litigation settlements. Any proceeds received are included in the Statement of Operations as realized gain (loss) for investments no longer held and as unrealized gain (loss) for investments still held.
Brokerage commissions and mark ups are considered transaction costs and are recorded as an increase to the cost basis of securities purchased and/or a reduction of proceeds on a sale of securities. Such transaction costs are included in the determination of net realized and unrealized gain (loss) from investment securities reported in the Statement of Operations and the Statement of Changes in Net Assets and the net realized and unrealized gains (losses) on securities per share in the Financial Highlights. Transaction costs are included in the calculation of the Fund’s net asset value and, accordingly, they reduce the Fund’s total returns. These transaction costs are not considered operating expenses and are not reflected in net investment income reported in the Statement of Operations and the Statement of Changes in Net Assets, or the net investment income per share and the ratios of expenses and net investment income reported in the Financial Highlights, nor are they limited by any expense limitation arrangements between the Fund and the investment adviser.
The Fund allocates income and realized and unrealized capital gains and losses to a class based on the relative net assets of each class.
| C. | Country Determination — For the purposes of making investment selection decisions and presentation in the Schedule of Investments, the investment adviser may determine the country in which an issuer is located and/or credit risk exposure based on various factors. These factors include the laws of the country under which the issuer is organized, where the issuer maintains a principal office, the country in which the issuer derives 50% or more of its total revenues and the country that has the primary market for the issuer’s securities, as well as other criteria. Among the other criteria that may be evaluated for making this determination are the country in which the issuer maintains 50% or more of its assets, the type of security, financial guarantees and enhancements, the nature of the collateral and the sponsor organization. Country of issuer and/or credit risk exposure has been determined to be the United States of America, unless otherwise noted. |
| D. | Distributions — Distributions from net investment income and net realized capital gain, if any, are generally declared and paid to separate accounts of participating insurance companies annually and recorded on the ex-dividend date. |
Invesco V.I. Diversified Dividend Fund
| E. | Federal Income Taxes — The Fund intends to comply with the requirements of Subchapter M of the Internal Revenue Code of 1986, as amended (the “Internal Revenue Code”), necessary to qualify as a regulated investment company and to distribute substantially all of the Fund’s taxable earnings to shareholders. As such, the Fund will not be subject to federal income taxes on otherwise taxable income (including net realized capital gain) that is distributed to shareholders. Therefore, no provision for federal income taxes is recorded in the financial statements. |
The Fund recognizes the tax benefits of uncertain tax positions only when the position is more likely than not to be sustained. Management has analyzed the Fund’s uncertain tax positions and concluded that no liability for unrecognized tax benefits should be recorded related to uncertain tax positions. Management is not aware of any tax positions for which it is reasonably possible that the total amounts of unrecognized tax benefits will change materially in the next 12 months.
The Fund files tax returns in the U.S. Federal jurisdiction and certain other jurisdictions. Generally, the Fund is subject to examinations by such taxing authorities for up to three years after the filing of the return for the tax period.
| F. | Expenses — Fees provided for under the Rule 12b-1 plan of a particular class of the Fund and which are directly attributable to that class are charged to the operations of such class. All other expenses are allocated among the classes based on relative net assets. |
| G. | Accounting Estimates — The preparation of financial statements in conformity with accounting principles generally accepted in the United States of America (“GAAP”) requires management to make estimates and assumptions that affect the reported amounts of assets and liabilities at the date of the financial statements and the reported amounts of revenues and expenses during the reporting period including estimates and assumptions related to taxation. Actual results could differ from those estimates by a significant amount. In addition, the Fund monitors for material events or transactions that may occur or become known after the period-end date and before the date the financial statements are released to print. |
| H. | Indemnifications — Under the Trust’s organizational documents, each Trustee, officer, employee or other agent of the Trust is indemnified against certain liabilities that may arise out of the performance of their duties to the Fund. Additionally, in the normal course of business, the Fund enters into contracts, including the Fund’s servicing agreements, that contain a variety of indemnification clauses. The Fund’s maximum exposure under these arrangements is unknown as this would involve future claims that may be made against the Fund that have not yet occurred. The risk of material loss as a result of such indemnification claims is considered remote. |
| I. | Foreign Currency Translations — Foreign currency is valued at the close of the NYSE based on quotations posted by banks and major currency dealers. Portfolio securities and other assets and liabilities denominated in foreign currencies are translated into U.S. dollar amounts at date of valuation. Purchases and sales of portfolio securities (net of foreign taxes withheld on disposition) and income items denominated in foreign currencies are translated into U.S. dollar amounts on the respective dates of such transactions. The Fund does not separately account for the portion of the results of operations resulting from changes in foreign exchange rates on investments and the fluctuations arising from changes in market prices of securities held. The combined results of changes in foreign exchange rates and the fluctuation of market prices on investments (net of estimated foreign tax withholding) are included with the net realized and unrealized gain or loss from investments in the Statement of Operations. Reported net realized foreign currency gains or losses arise from (1) sales of foreign currencies, (2) currency gains or losses realized between the trade and settlement dates on securities transactions, and (3) the difference between the amounts of dividends, interest, and foreign withholding taxes recorded on the Fund’s books and the U.S. dollar equivalent of the amounts actually received or paid. Net unrealized foreign currency gains and losses arise from changes in the fair values of assets and liabilities, other than investments in securities at fiscal period end, resulting from changes in exchange rates. |
The Fund may invest in foreign securities, which may be subject to foreign taxes on income, gains on investments or currency repatriation, a portion of which may be recoverable. Foreign taxes, if any, are recorded based on the tax regulations and rates that exist in the foreign markets in which the Fund invests and are shown in the Statement of Operations.
| J. | Forward Foreign Currency Contracts — The Fund may engage in foreign currency transactions either on a spot (i.e. for prompt delivery and settlement) basis, or through forward foreign currency contracts, to manage or minimize currency or exchange rate risk. |
The Fund may also enter into forward foreign currency contracts for the purchase or sale of a security denominated in a foreign currency in order to “lock in” the U.S. dollar price of that security, or the Fund may also enter into forward foreign currency contracts that do not provide for physical settlement of the two currencies, but instead are settled by a single cash payment calculated as the difference between the agreed upon exchange rate and the spot rate at settlement based upon an agreed upon notional amount (non-deliverable forwards). The Fund will set aside liquid assets in an amount equal to the daily mark-to-market obligation for forward foreign currency contracts.
A forward foreign currency contract is an obligation between two parties (“Counterparties”) to purchase or sell a specific currency for an agreed-upon price at a future date. The use of forward foreign currency contracts does not eliminate fluctuations in the price of the underlying securities the Fund owns or intends to acquire but establishes a rate of exchange in advance. Fluctuations in the value of these contracts are measured by the difference in the contract date and reporting date exchange rates and are recorded as unrealized appreciation (depreciation) until the contracts are closed. When the contracts are closed, realized gains (losses) are recorded. Realized and unrealized gains (losses) on the contracts are included in the Statement of Operations. The primary risks associated with forward foreign currency contracts include failure of the Counterparty to meet the terms of the contract and the value of the foreign currency changing unfavorably. These risks may be in excess of the amounts reflected in the Statement of Assets and Liabilities.
NOTE 2—Advisory Fees and Other Fees Paid to Affiliates
The Trust has entered into a master investment advisory agreement with Invesco Advisers, Inc. (the “Adviser” or “Invesco”). Under the terms of the investment advisory agreement, the Fund accrues daily and pays monthly an advisory fee to the Adviser based on the annual rate of the Fund’s average daily net assets as follows:
| | | | | | | | |
| Average Daily Net Assets | | Rate | |
First $250 million | | | 0 | .545% | | | | |
Next $750 million | | | 0 | .42% | | | | |
Next $1 billion | | | 0 | .395% | | | | |
Over $2 billion | | | 0 | .37% | | | | |
Invesco V.I. Diversified Dividend Fund
For the year ended December 31, 2017, the effective advisory fees incurred by the Fund was 0.47%.
Under the terms of a master sub-advisory agreement between the Adviser and each of Invesco Asset Management Deutschland GmbH, Invesco Asset Management Limited, Invesco Asset Management (Japan) Limited, Invesco Hong Kong Limited, Invesco Senior Secured Management, Inc. and Invesco Canada Ltd. and separate sub-advisory agreements with Invesco PowerShares Capital Management LLC and Invesco Asset Management (India) Private Limited (collectively, the “Affiliated Sub-Advisers”) the Adviser, not the Fund, will pay 40% of the fees paid to the Adviser to any such Affiliated Sub-Adviser(s) that provide(s) discretionary investment management services to the Fund based on the percentage of assets allocated to such Affiliated Sub-Adviser(s).
The Adviser has contractually agreed, through at least June 30, 2018, to waive advisory fees and/or reimburse expenses of all shares to the extent necessary to limit total annual fund operating expenses after fee waiver and/or expense reimbursement (excluding certain items discussed below) of Series I shares to 2.00% and Series II shares to 2.25% of average daily net assets (the “expense limits”). In determining the Adviser’s obligation to waive advisory fees and/or reimburse expenses, the following expenses are not taken into account, and could cause the total annual fund operating expenses after fee waiver and/or expense reimbursement to exceed the numbers reflected above: (1) interest; (2) taxes; (3) dividend expense on short sales; (4) extraordinary or non-routine items, including litigation expenses; and (5) expenses that the Fund has incurred but did not actually pay because of an expense offset arrangement. Unless Invesco continues the fee waiver agreement, it will terminate on June 30, 2018. During its term, the fee waiver agreement cannot be terminated or amended to increase the expense limits or reduce the advisory fee waiver without approval of the Board of Trustees. The Adviser did not waive fees and/or reimburse expenses during the period under these expense limits.
Further, the Adviser has contractually agreed, through at least June 30, 2019, to waive the advisory fee payable by the Fund in an amount equal to 100% of the net advisory fees the Adviser receives from the affiliated money market funds on investments by the Fund of uninvested cash in such affiliated money market funds.
For the year ended December 31, 2017, the Adviser waived advisory fees of $97,940.
The Trust has entered into a master administrative services agreement with Invesco pursuant to which the Fund has agreed to pay Invesco a fee for costs incurred in providing accounting services and fund administrative services to the Fund and to reimburse Invesco for fees paid to insurance companies that have agreed to provide certain administrative services to the Fund. These administrative services provided by the insurance companies may include, among other things: maintenance of master accounts with the Fund; tracking, recording and transmitting net purchase and redemption orders for Fund shares; maintaining and preserving records related to the purchase, redemption and other account activity of variable product owners; distributing copies of Fund documents such as prospectuses, proxy materials and periodic reports, to variable product owners, and responding to inquiries from variable product owners about the Fund. Pursuant to such agreement, for the year ended December 31, 2017, Invesco was paid $159,534 for accounting and fund administrative services and was reimbursed $844,480 for fees paid to insurance companies.
The Trust has entered into a transfer agency and service agreement with Invesco Investment Services, Inc. (“IIS”) pursuant to which the Fund has agreed to pay IIS a fee for providing transfer agency and shareholder services to the Fund and reimburse IIS for certain expenses incurred by IIS in the course of providing such services. For the year ended December 31, 2017, expenses incurred under the agreement are shown in the Statement of Operations as Transfer agent fees.
The Trust has entered into a master distribution agreement with Invesco Distributors, Inc. (“IDI”) to serve as the distributor for the Fund. The Trust has adopted a plan pursuant to Rule 12b-1 under the 1940 Act with respect to the Fund’s Series II shares (the “Plan”). The Fund, pursuant to the Plan, pays IDI compensation at the annual rate of 0.25% of the Fund’s average daily net assets of Series II shares. The fees are accrued daily and paid monthly. Of the Plan payments, up to 0.25% of the average daily net assets of the Series II shares may be paid to insurance companies who furnish continuing personal shareholder services to customers who purchase and own Series II shares of the Fund. For the year ended December 31, 2017, expenses incurred under the Plan are detailed in the Statement of Operations as Distribution fees.
Certain officers and trustees of the Trust are officers and directors of the Adviser, IIS and/or IDI.
NOTE 3—Additional Valuation Information
GAAP defines fair value as the price that would be received to sell an asset or paid to transfer a liability in an orderly transaction between market participants at the measurement date, under current market conditions. GAAP establishes a hierarchy that prioritizes the inputs to valuation methods, giving the highest priority to readily available unadjusted quoted prices in an active market for identical assets (Level 1) and the lowest priority to significant unobservable inputs (Level 3), generally when market prices are not readily available or are unreliable. Based on the valuation inputs, the securities or other investments are tiered into one of three levels. Changes in valuation methods may result in transfers in or out of an investment’s assigned level:
| | Level 1 — | Prices are determined using quoted prices in an active market for identical assets. |
| | Level 2 — | Prices are determined using other significant observable inputs. Observable inputs are inputs that other market participants may use in pricing a security. These may include quoted prices for similar securities, interest rates, prepayment speeds, credit risk, yield curves, loss severities, default rates, discount rates, volatilities and others. |
| | Level 3 — | Prices are determined using significant unobservable inputs. In situations where quoted prices or observable inputs are unavailable (for example, when there is little or no market activity for an investment at the end of the period), unobservable inputs may be used. Unobservable inputs reflect the Fund’s own assumptions about the factors market participants would use in determining fair value of the securities or instruments and would be based on the best available information. |
The following is a summary of the tiered valuation input levels, as of December 31, 2017. The level assigned to the securities valuations may not be an indication of the risk or liquidity associated with investing in those securities. Because of the inherent uncertainties of valuation, the values reflected in the financial statements may materially differ from the value received upon actual sale of those investments.
Invesco V.I. Diversified Dividend Fund
The Fund’s policy is to recognize transfers in and out of the valuation levels as of the end of the reporting period. During the year ended December 31, 2017, there were no material transfers between valuation levels.
| | | | | | | | | | | | | | | | |
| | | Level 1 | | | Level 2 | | | Level 3 | | | Total | |
| Investments in Securities | | | | | | | | | | | | |
Common Stocks & Other Equity Interests | | $ | 543,167,158 | | | $ | 70,229,590 | | | $ | — | | | $ | 613,396,748 | |
Money Market Funds | | | 67,056,094 | | | | — | | | | — | | | | 67,056,094 | |
Total Investments in Securities | | | 610,223,252 | | | | 70,229,590 | | | | — | | | | 680,452,842 | |
| Other Investments — Assets* | | | | | | | | | | | | |
Forward Foreign Currency Contracts | | | — | | | | 165,598 | | | | — | | | | 165,598 | |
| Other Investments — Liabilities* | | | | | | | | | | | | |
Forward Foreign Currency Contracts | | | — | | | | (667,596 | ) | | | — | | | | (667,596 | ) |
Total Other Investments | | | — | | | | (501,998 | ) | | | — | | | | (501,998 | ) |
Total Investments | | $ | 610,223,252 | | | $ | 69,727,592 | | | $ | — | | | $ | 679,950,844 | |
| * | Unrealized appreciation (depreciation). |
NOTE 4—Derivative Investments
The Fund may enter into an International Swaps and Derivatives Association Master Agreement (“ISDA Master Agreement”) under which a fund may trade OTC derivatives. An OTC transaction entered into under an ISDA Master Agreement typically involves a collateral posting arrangement, payment netting provisions and close-out netting provisions. These netting provisions allow for reduction of credit risk through netting of contractual obligations. The enforceability of the netting provisions of the ISDA Master Agreement depends on the governing law of the ISDA Master Agreement, among other factors.
For financial reporting purposes, the Fund does not offset OTC derivative assets or liabilities that are subject to ISDA Master Agreements in the Statement of Assets and Liabilities.
Value of Derivative Investments at Period-End
The table below summarizes the value of the Fund’s derivative investments, detailed by primary risk exposure, held as of December 31, 2017:
| | | | |
| | | Value | |
| Derivative Assets | | Currency
Risk | |
Unrealized appreciation on forward foreign currency contracts outstanding | | $ | 165,598 | |
Derivatives not subject to master netting agreements | | | — | |
Total Derivative Assets subject to master netting agreements | | $ | 165,598 | |
| |
| | | Value | |
| Derivative Liabilities | | Currency
Risk | |
Unrealized depreciation on forward foreign currency contracts outstanding | | $ | (667,596 | ) |
Derivatives not subject to master netting agreements | | | — | |
Total Derivative Liabilities subject to master netting agreements | | $ | (667,596 | ) |
Offsetting Assets and Liabilities
The table below reflects the Fund’s exposure to Counterparties subject to either an ISDA Master Agreement or other agreement for OTC derivative transactions as of December 31, 2017.
| | | | | | | | | | | | | | | | | | | | | | | | |
| | | Financial
Derivative
Assets | | | Financial
Derivative
Liabilities | | | | | | Collateral (Received)/Pledged | | | | |
| Counterparty | | Forward
Foreign Currency
Contracts | | | Forward
Foreign Currency
Contracts | | | Net Value of
Derivatives | | | Non-Cash | | | Cash | | | Net
Amount | |
Citigroup Global Markets Inc. | | $ | 1,184 | | | $ | (169,770 | ) | | $ | (168,586 | ) | | $ | — | | | $ | — | | | $ | (168,586 | ) |
JPMorgan Chase Bank, N.A. | | | 161,007 | | | | (197,982 | ) | | | (36,975 | ) | | | — | | | | — | | | | (36,975 | ) |
Merrill Lynch International | | | 430 | | | | (129,696 | ) | | | (129,266 | ) | | | — | | | | — | | | | (129,266 | ) |
State Street Bank and Trust Co. | | | 2,977 | | | | (170,148 | ) | | | (167,171 | ) | | | — | | | | — | | | | (167,171 | ) |
Total | | $ | 165,598 | | | $ | (667,596 | ) | | $ | (501,998 | ) | | $ | — | | | $ | — | | | $ | (501,998 | ) |
Invesco V.I. Diversified Dividend Fund
Effect of Derivative Investments for the year ended December 31, 2017
The table below summarizes the gains (losses) on derivative investments, detailed by primary risk exposure, recognized in earnings during the period:
| | | | |
| | | Location of Gain (Loss) on
Statement of Operations | |
| | | Currency Risk | |
Realized Gain (Loss): | | | | |
Forward foreign currency contracts | | $ | (1,875,503 | ) |
Change in Net Unrealized Appreciation (Depreciation): | | | | |
Forward foreign currency contracts | | | (784,599 | ) |
Total | | $ | (2,660,102 | ) |
The table below summarizes the average notional value of forward foreign currency contracts outstanding during the period.
| | | | |
| | | Forward
Foreign Currency
Contracts | |
Average notional value | | $ | 31,272,899 | |
NOTE 5—Trustees’ and Officers’ Fees and Benefits
Trustees’ and Officers’ Fees and Benefits include amounts accrued by the Fund to pay remuneration to certain Trustees and Officers of the Fund. Trustees have the option to defer compensation payable by the Fund, and Trustees’ and Officers’ Fees and Benefits also include amounts accrued by the Fund to fund such deferred compensation amounts. Those Trustees who defer compensation have the option to select various Invesco Funds in which their deferral accounts shall be deemed to be invested. Finally, certain current Trustees were eligible to participate in a retirement plan that provided for benefits to be paid upon retirement to Trustees over a period of time based on the number of years of service. The Fund may have certain former Trustees who also participate in a retirement plan and receive benefits under such plan. Trustees’ and Officers’ Fees and Benefits include amounts accrued by the Fund to fund such retirement benefits. Obligations under the deferred compensation and retirement plans represent unsecured claims against the general assets of the Fund.
NOTE 6—Cash Balances
The Fund is permitted to temporarily carry a negative or overdrawn balance in its account with State Street Bank and Trust Company, the custodian bank. Such balances, if any at period-end, are shown in the Statement of Assets and Liabilities under the payable caption Amount due custodian. To compensate the custodian bank for such overdrafts, the overdrawn Fund may either (1) leave funds as a compensating balance in the account so the custodian bank can be compensated by earning the additional interest; or (2) compensate by paying the custodian bank at a rate agreed upon by the custodian bank and Invesco, not to exceed the contractually agreed upon rate.
NOTE 7—Distributions to Shareholders and Tax Components of Net Assets
Tax Character of Distributions to Shareholders Paid During the Fiscal Years Ended December 31, 2017 and 2016:
| | | | | | | | |
| | | 2017 | | | 2016 | |
Ordinary income | | $ | 10,792,005 | | | $ | 7,404,045 | |
Long-term capital gain | | | 23,005,835 | | | | — | |
Total distributions | | $ | 33,797,840 | | | $ | 7,404,045 | |
Tax Components of Net Assets at Period-End:
| | | | |
| | | 2017 | |
Undistributed ordinary income | | $ | 13,314,207 | |
Undistributed long-term gain | | | 19,907,580 | |
Net unrealized appreciation — investments | | | 152,022,238 | |
Net unrealized appreciation — foreign currencies | | | 2,402 | |
Temporary book/tax differences | | | (113,617 | ) |
Shares of beneficial interest | | | 494,584,389 | |
Total net assets | | $ | 679,717,199 | |
The difference between book-basis and tax-basis unrealized appreciation (depreciation) is due to differences in the timing of recognition of gains and losses on investments for tax and book purposes. The Fund’s net unrealized appreciation difference is attributable primarily to wash sales and forward foreign currency contracts.
The temporary book/tax differences are a result of timing differences between book and tax recognition of income and/or expenses. The Fund’s temporary book/tax differences are the result of the trustee deferral of compensation and retirement plan benefits.
Capital loss carryforward is calculated and reported as of a specific date. Results of transactions and other activity after that date may affect the amount of capital loss carryforward actually available for the Fund to utilize. Capital losses generated in years beginning after December 22, 2010
Invesco V.I. Diversified Dividend Fund
can be carried forward for an unlimited period, whereas previous losses expire in eight tax years. Capital losses with an expiration period may not be used to offset capital gains until all net capital losses without an expiration date have been utilized. Capital loss carryforwards with no expiration date will retain their character as either short-term or long-term capital losses instead of as short-term capital losses as under prior law. The ability to utilize capital loss carryforwards in the future may be limited under the Internal Revenue Code and related regulations based on the results of future transactions.
The Fund does not have a capital loss carryforward as of December 31, 2017.
NOTE 8—Investment Transactions
The aggregate amount of investment securities (other than short-term securities, U.S. Treasury obligations and money market funds, if any) purchased and sold by the Fund during the year ended December 31, 2017 was $106,200,499 and $94,196,885, respectively. Cost of investments, including any derivatives, on a tax basis includes the adjustments for financial reporting purposes as of the most recently completed federal income tax reporting period-end.
| | | | |
| Unrealized Appreciation (Depreciation) of Investments on a Tax Basis | |
Aggregate unrealized appreciation of investments | | $ | 158,682,997 | |
Aggregate unrealized (depreciation) of investments | | | (6,660,759 | ) |
Net unrealized appreciation of investments | | $ | 152,022,238 | |
Cost of investments for tax purposes is $527,928,606.
NOTE 9—Reclassification of Permanent Differences
Primarily as a result of differing book/tax treatment of real estate investment trust distributions, on December 31, 2017, undistributed net investment income was increased by $216,386 and undistributed net realized gain was decreased by $216,386. This reclassification had no effect on the net assets of the Fund.
NOTE 10—Share Information
| | | | | | | | | | | | | | | | |
| | | Summary of Share Activity | |
| | | Years ended December 31, | |
| | | 2017(a) | | | 2016 | |
| | | Shares | | | Amount | | | Shares | | | Amount | |
Sold: | | | | | | | | | | | | | | | | |
Series I | | | 1,525,555 | | | $ | 41,126,302 | | | | 4,800,783 | | | $ | 118,506,697 | |
Series II | | | 1,317,421 | | | | 35,352,684 | | | | 3,129,929 | | | | 77,280,863 | |
| | | | |
Issued as reinvestment of dividends: | | | | | | | | | | | | | | | | |
Series I | | | 845,631 | | | | 22,172,434 | | | | 206,092 | | | | 5,214,115 | |
Series II | | | 446,102 | | | | 11,625,406 | | | | 86,971 | | | | 2,189,930 | |
| | | | |
Reacquired: | | | | | | | | | | | | | | | | |
Series I | | | (2,963,737 | ) | | | (80,071,566 | ) | | | (2,670,659 | ) | | | (65,906,930 | ) |
Series II | | | (998,279 | ) | | | (26,847,462 | ) | | | (717,830 | ) | | | (17,645,220 | ) |
Net increase in share activity | | | 172,693 | | | $ | 3,357,798 | | | | 4,835,286 | | | $ | 119,639,455 | |
| (a) | There are entities that are record owners of more than 5% of the outstanding shares of the Fund and in the aggregate own 65% of the outstanding shares of the Fund. The Fund and the Fund’s principal underwriter or adviser, are parties to participation agreements with these entities whereby these entities sell units of interest in separate accounts funding variable products that are invested in the Fund. The Fund, Invesco and/or Invesco affiliates may make payments to these entities, which are considered to be related to the Fund, for providing services to the Fund, Invesco and/or Invesco affiliates including but not limited to services such as, securities brokerage, third party record keeping and account servicing and administrative services. The Fund has no knowledge as to whether all or any portion of the shares owned of record by these entities are also owned beneficially. |
Invesco V.I. Diversified Dividend Fund
NOTE 11—Financial Highlights
The following schedule presents financial highlights for a share of the Fund outstanding throughout the periods indicated.
| | | | | | | | | | | | | | | | | | | | | | | | | | | | | | | | | | | | | | | | | | | | | | | | | | | | | | | | |
| | | Net asset
value,
beginning
of period | | | Net
investment
income(a) | | | Net gains
on securities
(both
realized and
unrealized) | | | Total from
investment
operations | | | Dividends
from net
investment
income | | | Distributions
from net
realized
gains | | | Total
distributions | | | Net asset
value, end
of period | | | Total
return(b) | | | Net assets,
end of period
(000’s omitted) | | | Ratio of
expenses
to average
net assets
with fee waivers
and/or expenses
absorbed | | | Ratio of
expenses
to average net
assets without
fee waivers
and/or expenses
absorbed | | | Ratio of net
investment
income to average
net assets | | | Portfolio
turnover(c) | |
Series I | | | | | | | | | | | | | | | | | | | | | | | | | | | | | | | | | | | | | | | | | | | | | | | | | | | | | | | | |
Year ended 12/31/17 | | | $26.38 | | | | $0.56 | | | | $1.65 | | | | $2.21 | | | | $(0.46) | | | $ | (0.95 | ) | | | $(1.41) | | | | $27.18 | | | | 8.58 | % | | $ | 437,104 | | | | 0.64 | %(d) | | | 0.65 | %(d) | | | 2.06 | %(d) | | | 16 | % |
Year ended 12/31/16 | | | 23.27 | | | | 0.50 | | | | 2.93 | | | | 3.43 | | | | (0.32 | ) | | | – | | | | (0.32 | ) | | | 26.38 | | | | 14.81 | | | | 439,857 | | | | 0.66 | | | | 0.68 | | | | 2.02 | | | | 14 | |
Year ended 12/31/15 | | | 23.21 | | | | 0.43 | | | | 0.04 | | | | 0.47 | | | | (0.41 | ) | | | – | | | | (0.41 | ) | | | 23.27 | | | | 2.07 | | | | 333,573 | | | | 0.70 | | | | 0.71 | | | | 1.84 | | | | 15 | |
Year ended 12/31/14 | | | 20.93 | | | | 0.40 | | | | 2.26 | | | | 2.66 | | | | (0.38 | ) | | | – | | | | (0.38 | ) | | | 23.21 | | | | 12.83 | | | | 330,370 | | | | 0.72 | | | | 0.73 | | | | 1.80 | | | | 6 | |
Year ended 12/31/13 | | | 16.34 | | | | 0.33 | | | | 4.70 | | | | 5.03 | | | | (0.44 | ) | | | – | | | | (0.44 | ) | | | 20.93 | | | | 31.04 | | | | 321,581 | | | | 0.71 | | | | 0.72 | | | | 1.76 | | | | 20 | |
Series II | | | | | | | | | | | | | | | | | | | | | | | | | | | | | | | | | | | | | | | | | | | | | | | | | | | | | | | | |
Year ended 12/31/17 | | | 26.23 | | | | 0.49 | | | | 1.64 | | | | 2.13 | | | | (0.41 | ) | | | (0.95 | ) | | | (1.36 | ) | | | 27.00 | | | | 8.31 | | | | 242,614 | | | | 0.89 | (d) | | | 0.90 | (d) | | | 1.81 | (d) | | | 16 | |
Year ended 12/31/16 | | | 23.16 | | | | 0.43 | | | | 2.92 | | | | 3.35 | | | | (0.28 | ) | | | – | | | | (0.28 | ) | | | 26.23 | | | | 14.54 | | | | 215,614 | | | | 0.91 | | | | 0.93 | | | | 1.77 | | | | 14 | |
Year ended 12/31/15 | | | 23.11 | | | | 0.37 | | | | 0.04 | | | | 0.41 | | | | (0.36 | ) | | | – | | | | (0.36 | ) | | | 23.16 | | | | 1.82 | | | | 132,477 | | | | 0.95 | | | | 0.96 | | | | 1.59 | | | | 15 | |
Year ended 12/31/14 | | | 20.85 | | | | 0.34 | | | | 2.25 | | | | 2.59 | | | | (0.33 | ) | | | – | | | | (0.33 | ) | | | 23.11 | | | | 12.54 | | | | 105,813 | | | | 0.97 | | | | 0.98 | | | | 1.55 | | | | 6 | |
Year ended 12/31/13 | | | 16.28 | | | | 0.29 | | | | 4.69 | | | | 4.98 | | | | (0.41 | ) | | | – | | | | (0.41 | ) | | | 20.85 | | | | 30.76 | | | | 97,628 | | | | 0.96 | | | | 0.97 | | | | 1.51 | | | | 20 | |
| (a) | Calculated using average shares outstanding. |
| (b) | Includes adjustments in accordance with accounting principles generally accepted in the United States of America and as such, the net asset value for financial reporting purposes and the returns based upon those net asset values may differ from the net asset value and returns for shareholder transactions. Total returns are not annualized for periods less than one year, if applicable and do not reflect charges assessed in connection with a variable product, which if included would reduce total returns. |
| (c) | Portfolio turnover is calculated at the fund level and is not annualized for periods less than one year, if applicable. |
| (d) | Ratios are based on average daily net assets (000’s omitted) of $440,393 and $231,496 for Series I and Series II shares, respectively. |
Invesco V.I. Diversified Dividend Fund
Report of Independent Registered Public Accounting Firm
To the Board of Trustees of AIM Variable Insurance Funds (Invesco Variable Insurance Funds)
and Shareholders of Invesco V.I. Diversified Dividend Fund
Opinion on the Financial Statements
We have audited the accompanying statement of assets and liabilities, including the schedule of investments, of Invesco V.I. Diversified Dividend Fund (one of the funds constituting AIM Variable Insurance Funds (Invesco Variable Insurance Funds), hereafter referred to as the “Fund”) as of December 31, 2017, the related statement of operations for the year ended December 31, 2017, the statement of changes in net assets for each of the two years in the period ended December 31, 2017, including the related notes, and the financial highlights for each of the five years in the period ended December 31, 2017 (collectively referred to as the “financial statements”). In our opinion, the financial statements present fairly, in all material respects, the financial position of the Fund as of December 31, 2017, the results of its operations for the year then ended, the changes in its net assets for each of the two years in the period ended December 31, 2017 and the financial highlights for each of the five years in the period ended December 31, 2017 in conformity with accounting principles generally accepted in the United States of America.
Basis for Opinion
These financial statements are the responsibility of the Fund’s management. Our responsibility is to express an opinion on the Fund’s financial statements based on our audits. We are a public accounting firm registered with the Public Company Accounting Oversight Board (United States) (“PCAOB”) and are required to be independent with respect to the Fund in accordance with the U.S. federal securities laws and the applicable rules and regulations of the Securities and Exchange Commission and the PCAOB.
We conducted our audits of these financial statements in accordance with the standards of the PCAOB. Those standards require that we plan and perform the audit to obtain reasonable assurance about whether the financial statements are free of material misstatement, whether due to error or fraud.
Our audits included performing procedures to assess the risks of material misstatement of the financial statements, whether due to error or fraud, and performing procedures that respond to those risks. Such procedures included examining, on a test basis, evidence regarding the amounts and disclosures in the financial statements. Our audits also included evaluating the accounting principles used and significant estimates made by management, as well as evaluating the overall presentation of the financial statements. Our procedures included confirmation of securities owned as of December 31, 2017 by correspondence with the custodian, transfer agent and brokers; when replies were not received from brokers, we performed other auditing procedures. We believe that our audits provide a reasonable basis for our opinion.
PricewaterhouseCoopers LLP
Houston, TX
February 14, 2018
We have served as the auditor of one or more of the investment companies in the Invesco/PowerShares group of investment companies since at least 1995. We have not determined the specific year we began serving as auditor.
Invesco V.I. Diversified Dividend Fund
Calculating your ongoing Fund expenses
Example
As a shareholder of the Fund, you incur ongoing costs, including management fees; distribution and/or service fees (12b-1); and other Fund expenses. This example is intended to help you understand your ongoing costs (in dollars) of investing in the Fund and to compare these costs with ongoing costs of investing in other mutual funds. The example is based on an investment of $1,000 invested at the beginning of the period and held for the entire period July 1, 2017 through December 31, 2017.
The actual and hypothetical expenses in the examples below do not represent the effect of any fees or other expenses assessed in connection with a variable product; if they did, the expenses shown would be higher while the ending account values shown would be lower.
Actual expenses
The table below provides information about actual account values and actual expenses. You may use the information in this table, together with the amount you invested, to estimate the expenses that you paid over the period. Simply divide your account value by $1,000 (for example, an $8,600 account value divided by $1,000 = 8.6), then multiply the result by the number in the table under the heading entitled “Actual Expenses Paid During Period” to estimate the expenses you paid on your account during this period.
Hypothetical example for comparison purposes
The table below also provides information about hypothetical account values and hypothetical expenses based on the Fund’s actual expense ratio and an assumed rate of return of 5% per year before expenses, which is not the Fund’s actual return.
The hypothetical account values and expenses may not be used to estimate the actual ending account balance or expenses you paid for the period. You may use this information to compare the ongoing costs of investing in the Fund and other funds. To do so, compare this 5% hypothetical example with the 5% hypothetical examples that appear in the shareholder reports of the other funds.
Please note that the expenses shown in the table are meant to highlight your ongoing costs. Therefore, the hypothetical information is useful in comparing ongoing costs, and will not help you determine the relative total costs of owning different funds.
| | | | | | | | | | | | | | | | | | | | | | | | |
| | | | | | ACTUAL | | | HYPOTHETICAL (5% annual return before expenses) | | | | |
| Class | | Beginning
Account Value
(07/01/17) | | | Ending
Account Value
(12/31/17)1 | | | Expenses
Paid During
Period2 | | | Ending
Account Value
(12/31/17) | | | Expenses
Paid During
Period2 | | | Annualized
Expense Ratio | |
| Series I | | $ | 1,000.00 | | | $ | 1,049.90 | | | $ | 3.26 | | | $ | 1,022.03 | | | $ | 3.21 | | | | 0.63 | % |
| Series II | | | 1,000.00 | | | | 1,049.10 | | | | 4.55 | | | | 1,020.77 | | | | 4.48 | | | | 0.88 | |
| 1 | The actual ending account value is based on the actual total return of the Fund for the period July 1, 2017 through December 31, 2017, after actual expenses and will differ from the hypothetical ending account value which is based on the Fund’s expense ratio and a hypothetical annual return of 5% before expenses. |
| 2 | Expenses are equal to the Fund’s annualized expense ratio as indicated above multiplied by the average account value over the period, multiplied by 184/365 to reflect the most recent fiscal half year. |
Invesco V.I. Diversified Dividend Fund
Tax Information
Form 1099-DIV, Form 1042-S and other year-end tax information provide shareholders with actual calendar year amounts that should be included in their tax returns. Shareholders should consult their tax advisors.
The following distribution information is being provided as required by the Internal Revenue Code or to meet a specific state’s requirement.
The Fund designates the following amounts or, if subsequently determined to be different, the maximum amount allowable for its fiscal year ended December 31, 2017:
| | | | |
Federal and State Income Tax | |
Long-Term Capital Gain Distributions | | $ | 23,005,835 | |
Corporate Dividends Received Deduction* | | | 100.00 | % |
U.S. Treasury Obligations* | | | 0.00 | % |
| | * | The above percentages are based on ordinary income dividends paid to shareholders during the Fund’s fiscal year. |
Invesco V.I. Diversified Dividend Fund
Trustees and Officers
The address of each trustee and officer is AIM Variable Insurance Funds (Invesco Variable Insurance Funds) (the “Trust”), 11 Greenway Plaza, Suite 1000, Houston, Texas 77046-1173. The trustees serve for the life of the Trust, subject to their earlier death, incapacitation, resignation, retirement or removal as more specifically provided in the Trust’s organizational documents. Each officer serves for a one year term or until their successors are elected and qualified. Column two below includes length of time served with predecessor entities, if any.
| | | | | | | | |
Name, Year of Birth and
Position(s) Held with the Trust | | Trustee and/
or Officer Since | | Principal Occupation(s)
During Past 5 Years | | Number of
Funds in Fund
Complex
Overseen by
Trustee | | Other Directorship(s)
Held by Trustee During
Past 5 Years |
| Interested Persons | | | | | | | | |
Martin L. Flanagan1 — 1960 Trustee | | 2007 | | Executive Director, Chief Executive Officer and President, Invesco Ltd. (ultimate parent of Invesco and a global investment management firm); Trustee, The Invesco Funds; Vice Chair, Investment Company Institute; and Member of Executive Board, SMU Cox School of Business Formerly: Advisor to the Board, Invesco Advisers, Inc. (formerly known as Invesco Institutional (N.A.), Inc.); Chairman and Chief Executive Officer, Invesco Advisers, Inc. (registered investment adviser); Director, Chairman, Chief Executive Officer and President, Invesco Holding Company (US), Inc. (formerly IVZ Inc.) (holding company), Invesco Group Services, Inc. (service provider) and Invesco North American Holdings, Inc. (holding company); Director, Chief Executive Officer and President, Invesco Holding Company Limited (parent of Invesco and a global investment management firm); Director, Invesco Ltd.; Chairman, Investment Company Institute and President, Co-Chief Executive Officer, Co-President, Chief Operating Officer and Chief Financial Officer, Franklin Resources, Inc. (global investment management organization) | | 158 | | None |
Philip A. Taylor2 — 1954 Trustee and Senior Vice President | | 2006 | | Head of the Americas and Senior Managing Director, Invesco Ltd.; Director, Invesco Advisers, Inc. (formerly known as Invesco Institutional (N.A.), Inc.) (registered investment adviser); Director, Chairman, Chief Executive Officer and President, Invesco Management Group, Inc. (formerly known as Invesco Aim Management Group, Inc.) (financial services holding company); Director and Chairman, Invesco Investment Services, Inc. (formerly known as Invesco Aim Investment Services, Inc.) (registered transfer agent); Chief Executive Officer, Invesco Corporate Class Inc. (corporate mutual fund company); Director, Chairman and Chief Executive Officer, Invesco Canada Ltd. (formerly known as Invesco Trimark Ltd./Invesco Trimark Ltèe) (registered investment adviser and registered transfer agent); Trustee and Senior Vice President, The Invesco Funds; Director, Invesco Investment Advisers LLC (formerly known as Van Kampen Asset Management). Formerly: Co-Chairman, Co-President and Co-Chief Executive Officer, Invesco Advisers, Inc. (formerly known as Invesco Institutional (N.A.), Inc.) (registered investment adviser); Director, Chief Executive Officer and President, Van Kampen Exchange Corp; President and Principal Executive Officer, The Invesco Funds (other than AIM Treasurer’s Series Trust (Invesco Treasurer’s Series Trust), Short-Term Investments Trust and Invesco Management Trust); Executive Vice President, The Invesco Funds (AIM Treasurer’s Series Trust (Invesco Treasurer’s Series Trust), Short-Term Investments Trust and Invesco Management Trust only); Director and President, INVESCO Funds Group, Inc. (registered investment adviser and registered transfer agent); Director and Chairman, IVZ Distributors, Inc. (formerly known as INVESCO Distributors, Inc.) (registered broker dealer); Director, President and Chairman, Invesco Inc. (holding company), Invesco Canada Holdings Inc. (holding company), Trimark Investments Ltd./Placements Trimark Ltèe and Invesco Financial Services Ltd/Services Financiers Invesco Ltèe; Chief Executive Officer, Invesco Canada Fund Inc. (corporate mutual fund company); Director and Chairman, Van Kampen Investor Services Inc.; Director, Chief Executive Officer and President, 1371 Preferred Inc. (holding company) and Van Kampen Investments Inc.; Director and President, AIM GP Canada Inc. (general partner for limited partnerships) and Van Kampen Advisors, Inc.; Director and Chief Executive Officer, Invesco Trimark Dealer Inc. (registered broker dealer); Director, Invesco Distributors, Inc. (formerly known as Invesco Aim Distributors, Inc.) (registered broker dealer); Manager, Invesco PowerShares Capital Management LLC; Director, Chief Executive Officer and President, Invesco Advisers, Inc.; Director, Chairman, Chief Executive Officer and President, Invesco Aim Capital Management, Inc.; President, Invesco Trimark Dealer Inc. and Invesco Trimark Ltd./Invesco Trimark Ltèe; Director and President, AIM Trimark Corporate Class Inc. and AIM Trimark Canada Fund Inc.; Senior Managing Director, Invesco Holding Company Limited; Director and Chairman, Fund Management Company (former registered broker dealer); President and Principal Executive Officer, The Invesco Funds (AIM Treasurer’s Series Trust (Invesco Treasurer’s Series Trust), and Short-Term Investments Trust only); President, AIM Trimark Global Fund Inc. and AIM Trimark Canada Fund Inc. | | 158 | | None |
| 1 | Mr. Flanagan is considered an interested person (within the meaning of Section 2(a)(19) of the 1940 Act) of the Trust because he is an officer of the Adviser to the Trust, and an officer and a director of Invesco Ltd., ultimate parent of the Adviser. |
| 2 | Mr. Taylor is considered an interested person (within the meaning of Section 2(a)(19) of the 1940 Act) of the Trust because he is an officer and a director of the Adviser. |
Invesco V.I. Diversified Dividend Fund
Trustees and Officers—(continued)
| | | | | | | | |
Name, Year of Birth and
Position(s) Held with the Trust | | Trustee and/
or Officer Since | | Principal Occupation(s)
During Past 5 Years | | Number of
Funds in Fund
Complex
Overseen by
Trustee | | Other Directorship(s)
Held by Trustee During
Past 5 Years |
| Independent Trustees | | | | | | | | |
Bruce L. Crockett — 1944 Trustee and Chair | | 1993 | | Chairman, Crockett Technologies Associates (technology consulting company) Formerly: Director, Captaris (unified messaging provider); Director, President and Chief Executive Officer, COMSAT Corporation; Chairman, Board of Governors of INTELSAT (international communications company); ACE Limited (insurance company); Independent Directors Council and Investment Company Institute: Member of the Audit Committee, Investment Company Institute; Member of the Executive Committee and Chair of the Governance Committee, Independent Directors Council | | 158 | | Director and Chairman of the Audit Committee, ALPS (Attorneys Liability Protection Society) (insurance company); Director and Member of the Audit Committee and Compensation Committee, Ferroglobe PLC (metallurgical company) |
David C. Arch — 1945 Trustee | | 2010 | | Chairman of Blistex Inc. (consumer health care products manufacturer); Member, World Presidents’ Organization | | 158 | | Board member of the Illinois Manufacturers’ Association |
Jack M. Fields — 1952 Trustee | | 1997 | | Chief Executive Officer, Twenty First Century Group, Inc. (government affairs company); and Chairman, Discovery Learning Alliance (non-profit) Formerly: Owner and Chief Executive Officer, Dos Angeles Ranch L.P. (cattle, hunting, corporate entertainment); Director, Insperity, Inc. (formerly known as Administaff) (human resources provider); Chief Executive Officer, Texana Timber LP (sustainable forestry company); Director of Cross Timbers Quail Research Ranch (non-profit); and member of the U.S. House of Representatives | | 158 | | None |
Cynthia Hostetler — 1962 Trustee | | 2017 | | Non-Executive Director and Trustee of a number of public and private business corporations Formerly: Head of Investment Funds and Private Equity, Overseas Private Investment Corporation; President, First Manhattan Bancorporation, Inc.; Attorney, Simpson Thacher & Bartlett LLP | | 158 | | Vulcan Materials Company (construction materials company); Trilinc Global Impact Fund; Aberdeen Investment Funds (4 portfolios); Artio Global Investment LLC (mutual fund complex); Edgen Group, Inc. (specialized energy and infrastructure products distributor) |
Eli Jones — 1961 Trustee | | 2016 | | Professor and Dean, Mays Business School — Texas A&M University Formerly: Professor and Dean, Walton College of Business, University of Arkansas and E.J. Ourso College of Business, Louisiana State University; Director, Arvest Bank | | 158 | | Insperity, Inc. (formerly known as Administaff) (human resources provider) |
Prema Mathai-Davis — 1950 Trustee | | 1998 | | Retired. | | 158 | | None |
Teresa M. Ressel — 1962 Trustee | | 2017 | | Non-executive director and trustee of a number of public and private business corporations Formerly: Chief Financial Officer, Olayan America, The Olayan Group (international investor/commercial/industrial); Chief Executive Officer, UBS Securities LLC; Group Chief Operating Officer, Americas, UBS AG; Assistant Secretary for Management & Budget and CFO, US Department of the Treasury | | 158 | | Atlantic Power Corporation (power generation company); ON Semiconductor Corp. (semiconductor supplier) |
Ann Barnett Stern — 1957 Trustee | | 2017 | | President and Chief Executive Officer, Houston Endowment Inc. (private philanthropic institution) Formerly: Executive Vice President and General Counsel, Texas Children’s Hospital; Attorney, Beck, Redden and Secrest, LLP; Business Law Instructor, University of St. Thomas; Attorney, Andrews & Kurth LLP | | 158 | | Federal Reserve Bank of Dallas |
Raymond Stickel, Jr. — 1944 Trustee | | 2005 | | Retired. Formerly: Director, Mainstay VP Series Funds, Inc. (25 portfolios); Partner, Deloitte & Touche | | 158 | | None |
Robert C. Troccoli — 1949 Trustee | | 2016 | | Adjunct Professor, University of Denver — Daniels College of Business Formerly: Senior Partner, KPMG LLP | | 158 | | None |
Christopher L. Wilson — 1957 Trustee | | 2017 | | Non-executive director and trustee of a number of public and private business corporations Formerly: Managing Partner, CT2, LLC (investing and consulting firm); President/Chief Executive Officer, Columbia Funds, Bank of America Corporation; President/Chief Executive Officer, CDC IXIS Asset Management Services, Inc.; Principal & Director of Operations, Scudder Funds, Scudder, Stevens & Clark, Inc.; Assistant Vice President, Fidelity Investments | | 158 | | TD Asset Management USA Inc. (mutual fund complex) (22 portfolios); ISO New England, Inc. (non-profit organization managing regional electricity market) |
Invesco V.I. Diversified Dividend Fund
Trustees and Officers—(continued)
| | | | | | | | |
Name, Year of Birth and
Position(s) Held with the Trust | | Trustee and/
or Officer Since | | Principal Occupation(s)
During Past 5 Years | | Number of
Funds in Fund
Complex
Overseen by
Trustee | | Other Directorship(s)
Held by Trustee During
Past 5 Years |
| Other Officers | | | | | | | | |
Sheri Morris — 1964 President, Principal Executive Officer and Treasurer | | 1999 | | President, Principal Executive Officer and Treasurer, The Invesco Funds; Vice President, Invesco Advisers, Inc. (formerly known as Invesco Institutional (N.A.), Inc.) (registered investment adviser); and Vice President, PowerShares Exchange-Traded Fund Trust, PowerShares Exchange-Traded Fund Trust II, PowerShares India Exchange-Traded Fund Trust, PowerShares Actively Managed Exchange-Traded Fund Trust, PowerShares Actively Managed Exchange-Traded Commodity Fund Trust and PowerShares Exchange-Traded Self-Indexed Fund Trust Formerly: Vice President and Principal Financial Officer, The Invesco Funds; Vice President, Invesco Aim Advisers, Inc., Invesco Aim Capital Management, Inc. and Invesco Aim Private Asset Management, Inc.; Assistant Vice President and Assistant Treasurer, The Invesco Funds and Assistant Vice President, Invesco Advisers, Inc., Invesco Aim Capital Management, Inc. and Invesco Aim Private Asset Management, Inc.; and Treasurer, PowerShares Exchange-Traded Fund Trust, PowerShares Exchange-Traded Fund Trust II, PowerShares India Exchange-Traded Fund Trust and PowerShares Actively Managed Exchange-Traded Fund Trust | | N/A | | N/A |
Russell C. Burk — 1958 Senior Vice President and Senior Officer | | 2005 | | Senior Vice President and Senior Officer, The Invesco Funds | | N/A | | N/A |
John M. Zerr — 1962 Senior Vice President, Chief Legal Officer and Secretary | | 2006 | | Director, Senior Vice President, Secretary and General Counsel, Invesco Management Group, Inc. (formerly known as Invesco AIM Management Group, Inc.); Senior Vice President, Invesco Advisers, Inc. (formerly known as Invesco Institutional (N.A.), Inc.) (registered investment adviser); Senior Vice President and Secretary, Invesco Distributors, Inc. (formerly known as Invesco AIM Distributors, Inc.); Director, Vice President and Secretary, Invesco Investment Services, Inc. (formerly known as Invesco AIM Investment Services, Inc.) Senior Vice President, Chief Legal Officer and Secretary, The Invesco Funds; Managing Director, Invesco PowerShares Capital Management LLC; Director, Secretary and General Counsel, Invesco Investment Advisers LLC (formerly known as Van Kampen Asset Management); Secretary and General Counsel, Invesco Capital Markets, Inc. (formerly known as Van Kampen Funds Inc.) and Chief Legal Officer, PowerShares Exchange-Traded Fund Trust, PowerShares Exchange-Traded Fund Trust II, PowerShares India Exchange-Traded Fund Trust, PowerShares Actively Managed Exchange-Traded Fund Trust, PowerShares Actively Managed Exchange-Traded Commodity Fund Trust and PowerShares Exchange-Traded Self-Indexed Fund Trust; Manager and Secretary, Invesco Indexing LLC Formerly: Director, Secretary, General Counsel and Senior Vice President, Van Kampen Exchange Corp.; Director, Vice President and Secretary, IVZ Distributors, Inc. (formerly known as INVESCO Distributors, Inc.); Director and Vice President, INVESCO Funds Group, Inc.; Director and Vice President, Van Kampen Advisors Inc.; Director, Vice President, Secretary and General Counsel, Van Kampen Investor Services Inc.; Director, Invesco Distributors, Inc. (formerly known as Invesco AIM Distributors, Inc.); Director, Senior Vice President, General Counsel and Secretary, Invesco AIM Advisers, Inc. and Van Kampen Investments Inc.; Director, Vice President and Secretary, Fund Management Company; Director, Senior Vice President, Secretary, General Counsel and Vice President, Invesco AIM Capital Management, Inc.; Chief Operating Officer and General Counsel, Liberty Ridge Capital, Inc. (an investment adviser); Vice President and Secretary, PBHG Funds (an investment company) and PBHG Insurance Series Fund (an investment company); Chief Operating Officer, General Counsel and Secretary, Old Mutual Investment Partners (a broker-dealer); General Counsel and Secretary, Old Mutual Fund Services (an administrator) and Old Mutual Shareholder Services (a shareholder servicing center); Executive Vice President, General Counsel and Secretary, Old Mutual Capital, Inc. (an investment adviser); and Vice President and Secretary, Old Mutual Advisors Funds (an investment company) | | N/A | | N/A |
Gregory G. McGreevey — 1962 Senior Vice President | | 2012 | | Senior Managing Director, Invesco Ltd.; Director, Chairman, President, and Chief Executive Officer, Invesco Advisers, Inc. (formerly known as Invesco Institutional (N.A.), Inc.) (registered investment adviser); Senior Vice President, Invesco Management Group, Inc.; Director, Invesco Mortgage Capital, Inc. and Invesco Senior Secured Management, Inc.; and Senior Vice President, The Invesco Funds Formerly: Assistant Vice President, The Invesco Funds | | N/A | | N/A |
Kelli Gallegos — 1970 Vice President, Principal Financial Officer and Assistant Treasurer | | 2008 | | Vice President, Principal Financial Officer and Assistant Treasurer, The Invesco Funds; Assistant Treasurer, Invesco PowerShares Capital Management LLC, PowerShares Exchange-Traded Fund Trust, PowerShares Exchange-Traded Fund Trust II, PowerShares India Exchange-Traded Fund Trust, PowerShares Actively Managed Exchange-Traded Fund Trust, PowerShares Actively Managed Exchange-Traded Commodity Fund Trust and PowerShares Exchange-Traded Self-Indexed Fund Trust Formerly: Assistant Vice President, The Invesco Funds | | N/A | | N/A |
Invesco V.I. Diversified Dividend Fund
Trustees and Officers—(continued)
| | | | | | | | |
Name, Year of Birth and
Position(s) Held with the Trust | | Trustee and/
or Officer Since | | Principal Occupation(s)
During Past 5 Years | | Number of
Funds in Fund
Complex
Overseen by
Trustee | | Other Directorship(s)
Held by Trustee During
Past 5 Years |
| Other Officers—(continued) | | | | | | | | |
Tracy Sullivan — 1962 Vice President, Chief Tax Officer and Assistant Treasurer | | 2008 | | Vice President, Chief Tax Officer and Assistant Treasurer, The Invesco Funds; Assistant Treasurer, Invesco PowerShares Capital Management LLC, PowerShares Exchange-Traded Fund Trust, PowerShares Exchange-Traded Fund Trust II, PowerShares India Exchange-Traded Fund Trust, PowerShares Actively Managed Exchange-Traded Fund Trust, PowerShares Actively Managed Exchange-Traded Commodity Fund Trust and PowerShares Exchange-Traded Self-Indexed Fund Trust Formerly: Assistant Vice President, The Invesco Funds | | N/A | | N/A |
Crissie M. Wisdom — 1969 Anti-Money Laundering Compliance Officer | | 2013 | | Anti-Money Laundering Compliance Officer, Invesco Advisers, Inc. (formerly known as Invesco Institutional (N.A.), Inc.) (registered investment adviser), Invesco Capital Markets, Inc. (formerly known as Van Kampen Funds Inc.), Invesco Distributors, Inc., Invesco Investment Services, Inc., Invesco Management Group, Inc., The Invesco Funds, and PowerShares Exchange-Traded Fund Trust, PowerShares Exchange-Traded Fund Trust II, PowerShares India Exchange-Traded Fund Trust, PowerShares Actively Managed Exchange-Traded Fund Trust, PowerShares Actively Managed Exchange-Traded Commodity Fund Trust and PowerShares Exchange-Traded Self-Indexed Fund Trust; Anti-Money Laundering Compliance Officer and Bank Secrecy Act Officer, INVESCO National Trust Company and Invesco Trust Company; and Fraud Prevention Manager and Controls and Risk Analysis Manager for Invesco Investment Services, Inc. Formerly: Anti-Money Laundering Compliance Officer, Van Kampen Exchange Corp. | | N/A | | N/A |
Robert R. Leveille — 1969 Chief Compliance Officer | | 2016 | | Chief Compliance Officer, Invesco Advisers, Inc. (registered investment adviser); and Chief Compliance Officer, The Invesco Funds Formerly: Chief Compliance Officer, Putnam Investments and the Putnam Funds | | N/A | | N/A |
The Statement of Additional Information of the Trust includes additional information about the Fund’s Trustees and is available upon request, without charge, by calling 1.800.959.4246. Please refer to the Fund’s Statement of Additional Information for information on the Fund’s sub-advisers.
| | | | | | |
Office of the Fund 11 Greenway Plaza, Suite 1000 Houston, TX 77046-1173 | | Investment Adviser Invesco Advisers, Inc. 1555 Peachtree Street, N.E. Atlanta, GA 30309 | | Distributor Invesco Distributors, Inc. 11 Greenway Plaza, Suite 1000 Houston, TX 77046-1173 | | Auditors PricewaterhouseCoopers LLP 1000 Louisiana Street, Suite 5800 Houston, TX 77002-5678 |
| | | |
| | | | | | |
Counsel to the Fund Stradley Ronon Stevens & Young, LLP 2005 Market Street, Suite 2600 Philadelphia, PA 19103-7018 | | Counsel to the Independent Trustees Goodwin Procter LLP 901 New York Avenue, N.W. Washington, D.C. 20001 | | Transfer Agent Invesco Investment Services, Inc. 11 Greenway Plaza, Suite 1000 Houston, TX 77046-1173 | | Custodian State Street Bank and Trust Company 225 Franklin Street Boston, MA 02110-2801 |
Invesco V.I. Diversified Dividend Fund
| | | | |
| | |
 | | Annual Report to Shareholders | | December 31, 2017 |
| | |
| | Invesco V.I. Equally-Weighted S&P 500 Fund |

| | |
| | The Fund provides a complete list of its holdings four times in each fiscal year, at the quarter-ends. For the second and fourth quarters, the lists appear in the Fund’s semiannual and annual reports to shareholders. For the first and third quarters, the Fund files the lists with the Securities and Exchange Commission (SEC) on Form N-Q. The Fund’s Form N-Q filings are available on the SEC website, sec.gov. Copies of the Fund’s Forms N-Q may be reviewed and copied at the SEC Public Reference Room in Washington, D.C. You can obtain information on the operation of the Public Reference Room, including information about duplicating fee charges, by calling 202 551 8090 or 800 732 0330, or by electronic request at the following email address: publicinfo@sec.gov. The SEC file numbers for the Fund are 811-07452 and 033-57340. The Fund’s most recent portfolio holdings, as filed on Form N-Q, have also been made available to insurance companies issuing variable annuity contracts and variable life insurance policies (“variable products”) that invest in the Fund. A description of the policies and procedures that the Fund uses to determine how to vote proxies relating to portfolio securities is available without charge, upon request, from our Client Services department at 800 959 4246 or at invesco.com/proxyguidelines. The information is also available on the SEC website, sec.gov. Information regarding how the Fund voted proxies related to its portfolio securities during the most recent 12-month period ended June 30 is available at invesco.com/ proxysearch. The information is also available on the SEC website, sec.gov. Invesco Advisers, Inc. is an investment adviser; it provides investment advisory services to individual and institutional clients and does not sell securities. Invesco Distributors, Inc. is the US distributor for Invesco Ltd.’s retail mutual funds, exchange-traded funds and institutional money market funds. Both are wholly owned, indirect subsidiaries of Invesco Ltd. This report must be accompanied or preceded by a currently effective Fund prospectus and variable product prospectus, which contain more complete information, including sales charges and expenses. Investors should read each carefully before investing. NOT FDIC INSURED | MAY LOSE VALUE | NO BANK GUARANTEE Invesco Distributors, Inc. MS-VIEWSP-AR-1 02072018 1148 |
Management’s Discussion of Fund Performance
Performance summary
For the year ended December 31, 2017, Series I shares of Invesco V.I. Equally- Weighted S&P 500 Fund (the Fund) underperformed the S&P 500 Index.
Your Fund’s long-term performance appears later in this report.
Fund vs. Indexes
Total returns, 12/31/16 to 12/31/17, excluding variable product issuer charges. If variable product issuer charges were included, returns would be lower.
If variable product issuer charges were included, returns would be lower.
| | | | | |
Series I Shares | | | | 18.58 | % |
Series II Shares | | | | 18.33 | |
S&P 500 Index▼ (Broad Market Index) | | | | 21.83 | |
S&P 500 Equal Weight Index▼ (Style-Specific Index) | | | | 18.90 | |
Lipper VUF Multi-Cap Core Funds Index∎ (Peer Group Index) | | | | 17.90 | |
Source(s): ▼FactSet Research Systems Inc.; ∎Lipper Inc. | | | | | |
Market conditions and your Fund
Despite highly destructive hurricanes that threatened to derail a years-long economic recovery, the US economy continued to expand throughout the year ended December 31, 2017. Gross domestic product – the value of all goods and services produced in the US – expanded in the first three quarters of 2017. Inflation remained subdued even as unemployment continued its multiyear decline.
Given signs of an improving economy, the US Federal Reserve (the Fed) raised interest rates three times during the reporting period, most recently in December 2017; each rate hike was 25 basis points.1 (A basis point is 0.01%.) The Fed pledged that “realized and expected economic conditions relative to its objectives of maximum employment and 2 percent inflation” will guide its future actions. At the close of the reporting period, Fed policy remained accommodative, and the fed funds target rate stood at a range of 1.25% to 1.50% – 75 basis points higher than at the start of the reporting period.1
Higher inventories and a worsening outlook caused oil prices and many energy stocks to decline during the first half of 2017. However, oil prices rose significantly in the second half of the reporting period as expectations for lower supplies increased, partly due to continued OPEC production cuts, and demand began normalizing.
Major US stock market indexes repeatedly hit all-time highs throughout the reporting period. The stock market rally that began after the 2016 presidential election continued throughout the reporting period, fueled by generally positive economic data, strong corporate earnings and improved consumer confidence. Finally, after much debate in Congress, a tax reform bill was signed into law in December 2017. While its enactment further strengthened stocks, its effect on the US economy remained uncertain.
Invesco V.I. Equally-Weighted S&P 500 Fund seeks total return through growth of capital and current income. The Fund invests in a diversified portfolio of common stocks represented in the S&P 500 Index. The Fund generally invests in
each common stock included in the S&P 500 Index in approximately equal proportions, which differs from the S&P 500 Index because stocks in the S&P 500 Index are represented in proportion to their market value or market capitalization. Due to the equally-weighted nature of the Fund and the capitalization-weighted nature of the S&P 500 Index, the Fund will lag when mega- and large-cap stocks outperform mid-cap stocks.
During the reporting period, sectors that contributed the most to the Fund’s absolute performance were the information technology (IT), industrials, health care, financials and consumer discretionary sectors. Relative to the S&P 500 Index, an underweight allocation in the consumer staples and telecommunication services sectors and an overweight allocation in the materials sector contributed to Fund results.
The consumer discretionary and IT sectors were the top detractors from the Fund’s relative performance. An overweight allocation in the consumer discretionary sector and an underweight allocation in the IT sector detracted from Fund results. In particular, underweight positions in Apple and Amazon.com led to relative underperformance due to the large weightings of these stocks in the S&P 500 Index coupled with their strong performance. In general, the Fund’s underweight exposure to mega-capitalization and overweight exposure to mid-capitalization stocks were key detractors.
The most significant contributor to the Fund’s absolute and relative return was NRG Energy, the largest independent US power producer. During the reporting period, the company announced its plan to raise as much as $4 billion through asset sales and slash debt by $13 billion, which sent shares surging.
| | |
| Portfolio Composition |
By sector | % of total net assets |
| | |
| |
| Consumer Discretionary | | 16.0% |
| Industrials | | 13.8 |
| Financials | | 13.2 |
| Information Technology | | 13.2 |
| Health Care | | 12.1 |
| Consumer Staples | | 6.8 |
| Energy | | 6.7 |
| Real Estate | | 6.5 |
| Utilities | | 5.2 |
| Materials | | 5.1 |
Telecommunication Services | | 0.6 |
Money Market Funds | | |
Plus Other Assets Less Liabilities | | 0.8 |
| | |
| Top 10 Equity Holdings* |
% of total net assets |
| |
| 1. Becton, Dickinson and Co. | | 0.3% |
2. Freeport-McMoRan Inc. | | 0.3 |
3. Akamai Technologies, Inc. | | 0.2 |
4. TechnipFMC PLC | | 0.2 |
5. CenturyLink Inc. | | 0.2 |
6. Anadarko Petroleum Corp. | | 0.2 |
7. Coty Inc.-Class A | | 0.2 |
8. Marathon Oil Corp. | | 0.2 |
9. Helmerich & Payne, Inc. | | 0.2 |
10. Arconic Inc. | | 0.2 |
| | |
| Total Net Assets | | $244.9 million |
| |
| Total Number of Holdings* | | 504 |
The Fund’s holdings are subject to change, and there is no assurance that the Fund will continue to hold any particular security.
*Excluding money market fund holdings.
Data presented here are as of December 31, 2017.
Invesco V.I. Equally-Weighted S&P 500 Fund
Range Resources was the largest absolute detractor from Fund performance for the reporting period. The company struggled as industry-specific issues hampered the company. Another key detractor was Envision Healthcare whose stock price was hurt by a failure to meet earnings estimates.
Please note, the Fund’s strategy is principally implemented through equity investments, but the Fund may also use S&P 500 futures contracts, which are derivative instruments used to gain exposure to the equity market. During the reporting period, the Fund invested in S&P 500 futures contracts, which generated a positive return and contributed to Fund performance. Derivatives can be a cost-effective way to gain exposure to asset classes. However, derivatives may amplify traditional investment risks through the creation of leverage and may be less liquid than traditional securities.
We welcome new investors who joined the Fund during the year and thank you for your investment in Invesco V.I. Equally-Weighted S&P 500 Fund.
| 1 | Source: US Federal Reserve |
The views and opinions expressed in management’s discussion of Fund performance are those of Invesco Advisers, Inc. These views and opinions are subject to change at any time based on factors such as market and economic conditions. These views and opinions may not be relied upon as investment advice or recommendations, or as an offer for a particular security. The information is not a complete analysis of every aspect of any market, country, industry, security or the Fund. Statements of fact are from sources considered reliable, but Invesco Advisers, Inc. makes no representation or warranty as to their completeness or accuracy. Although historical performance is no guarantee of future results, these insights may help you understand our investment management philosophy.
See important Fund and, if applicable, index disclosures later in this report.
| | |
 | | Anthony Munchak Chartered Financial Analyst, Portfolio Manager, is manager of Invesco V.I. Equally-Weighted S&P 500 |
| Fund. He joined Invesco in 2000. Mr. Munchak earned a BS and an MS in finance from Boston College and an MBA from Bentley College. |
| | |
 | | Glen Murphy Chartered Financial Analyst, Portfolio Manager, is manager of Invesco V.I. Equally-Weighted S&P 500 |
| Fund. He joined Invesco in 1995. Mr. Murphy earned a BA from the University of Massachusetts at Amherst and an MS in finance from Boston College. |
| | |
 | | Francis Orlando Chartered Financial Analyst, Portfolio Manager, is manager of Invesco V.I. Equally-Weighted S&P 500 |
| Fund. He joined Invesco in 1987. Mr. Orlando earned a BA in business administration from Merrimack College and an MBA from Boston University. |
| | |
 | | Daniel Tsai Chartered Financial Analyst, Portfolio Manager, is manager of Invesco V.I. Equally-Weighted S&P 500 |
| Fund. He joined Invesco in 2000. Mr. Tsai earned a BS in mechanical engineering from National Taiwan University, an MS in mechanical engineering from the University of Michigan and an MS in computer science from Wayne State University. |
| | |
 | | Anne Unflat Portfolio Manager, is manager of Invesco V.I. Equally-Weighted S&P 500 Fund. She joined |
| Invesco in 1988. Ms. Unflat earned a BA in economics from Queens College and an MBA in finance from St. John’s University. |
| | |
 | | Donna Chapman Wilson Portfolio Manager and Director of Portfolio Management, is manager of Invesco V.I. |
| Equally-Weighted S&P 500 Fund. She joined Invesco in 1997. Ms. Chapman Wilson earned a BA in economics from Hampton University and an MBA in finance from the Wharton School of the University of Pennsylvania. |
Invesco V.I. Equally-Weighted S&P 500 Fund
Your Fund’s Long-Term Performance
Results of a $10,000 Investment – Oldest Share Class(es)
Fund and index data from 12/31/07
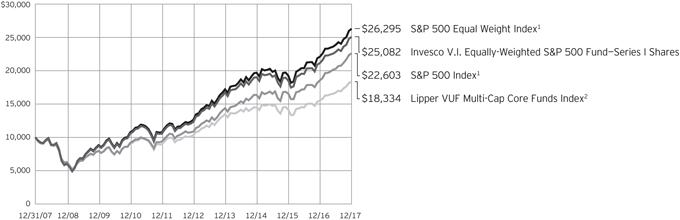
| 1 | Source: FactSet Research Systems Inc. |
Past performance cannot guarantee
comparable future results.
| | | | | |
| Average Annual Total Returns |
As of 12/31/17 | | | | | |
| |
| Series I Shares | | | | | |
| Inception (11/9/94) | | | | 10.94 | % |
| 10 Years | | | | 9.63 | |
| 5 Years | | | | 15.25 | |
| 1 Years | | | | 18.58 | |
| |
| Series II Shares | | | | | |
| Inception (7/24/00) | | | | 8.93 | % |
| 10 Years | | | | 9.36 | |
| 5 Years | | | | 14.97 | |
| 1 Year | | | | 18.33 | |
Effective June 1, 2010, Class X and Class Y shares of the predecessor fund, Morgan Stanley V.I. Select Dimensions Equally-Weighted S&P 500 Fund, advised by Morgan Stanley Investment Advisors Inc. were reorganized into Series I and Series II shares, respectively, of Invesco V.I. Select Dimensions Equally-Weighted S&P 500 Fund (renamed Invesco V.I. Equally-Weighted S&P 500 Fund on April 30, 2012). Returns shown above, prior to June 1, 2010, for Series I and Series II shares are blended returns of the predecessor fund and Invesco V.I. Equally-Weighted S&P 500 Fund. Share class returns will
differ from the predecessor fund because of different expenses.
The performance data quoted represent past performance and cannot guarantee comparable future results; current performance may be lower or higher. Please contact your variable product issuer or financial adviser for the most recent month-end variable product performance. Performance figures reflect Fund expenses, reinvested distributions and changes in net asset value. Investment return and principal value will fluctuate so that you may have a gain or loss when you sell shares.
The total annual Fund operating expense ratio set forth in the most recent Fund prospectus as of the date of this report for Series I and Series II shares was 0.39% and 0.64%, respectively. The expense ratios presented above may vary from the expense ratios presented in other sections of this report that are based on expenses incurred during the period covered by this report.
Invesco V.I. Equally-Weighted S&P 500 Fund, a series portfolio of AIM Variable Insurance Funds (Invesco
Variable Insurance Funds), is currently offered through insurance companies issuing variable products. You cannot purchase shares of the Fund directly. Performance figures given represent the Fund and are not intended to reflect actual variable product values. They do not reflect sales charges, expenses and fees assessed in connection with a variable product. Sales charges, expenses and fees, which are determined by the variable product issuers, will vary and will lower the total return.
The most recent month-end performance at the Fund level, excluding variable product charges, is available at 800 451 4246. As mentioned above, for the most recent month-end performance including variable product charges, please contact your variable product issuer or financial adviser.
Fund performance reflects any applicable fee waivers and/or expense reimbursements. Had the adviser not waived fees and/or reimbursed expenses currently or in the past, returns would have been lower. See current prospectus for more information.
Invesco V.I. Equally-Weighted S&P 500 Fund
Invesco V.I. Equally-Weighted S&P 500 Fund’s investment objective is to achieve a high level of total return on its assets through a combination of capital appreciation and current income.
| ⬛ | Unless otherwise stated, information presented in this report is as of December 31, 2017, and is based on total net assets. |
| ⬛ | Unless otherwise noted, all data provided by Invesco. |
Principal risks of investing in the Fund
Depositary receipts risk. Investing in depositary receipts involves the same risks as direct investments in foreign securities. In addition, the underlying issuers of certain depositary receipts are under no obligation to distribute shareholder communications or pass through any voting rights with respect to the deposited securities to the holders of such receipts. The Fund may therefore receive less timely information or have less control than if it invested directly in the foreign issuer.
Derivatives risk. The value of a derivative instrument depends largely on (and is derived from) the value of an underlying security, currency, commodity, interest rate, index or other asset (each referred to as an underlying asset). In addition to risks relating to the underlying assets, the use of derivatives may include other, possibly greater, risks, including counterparty, leverage and liquidity risks. Counterparty risk is the risk that the counterparty to the derivative contract will default on its obligation to pay the Fund the amount owed or otherwise perform under the derivative contract. Derivatives create leverage risk because they do not require payment up front equal to the economic exposure created by owning the derivative. As a result, an adverse change in the value of the underlying asset could result in the Fund sustaining a loss that is substantially greater than the amount invested in the derivative, which may make the Fund’s returns more volatile and increase the risk of loss. Derivative instruments may also be less liquid than more traditional investments and the Fund may be unable to sell or close out its derivative positions at a desirable time or price. This risk may be more acute under adverse market conditions, during which the Fund may be most in need of liquidating its derivative positions. Derivatives may also be harder to value, less tax efficient and subject to changing government regulation that could impact the Fund’s ability to use certain derivatives or their cost. Also, derivatives used for hedging or to gain or limit exposure to a particular market segment may not provide the expected benefits, particularly during adverse market conditions.
Emerging markets securities risk.
Emerging markets (also referred to as developing markets) are generally subject to greater market volatility, political, social and economic instability, uncertain
trading markets and more governmental limitations on foreign investment than more developed markets. In addition, companies operating in emerging markets may be subject to lower trading volume and greater price fluctuations than companies in more developed markets. Securities law and the enforcement of systems of taxation in many emerging market countries may change quickly and unpredictably. In addition, investments in emerging markets securities may also be subject to additional transaction costs, delays in settlement procedures, and lack of timely information.
Foreign securities risk. The Fund’s foreign investments may be adversely affected by political and social instability, changes in economic or taxation policies, difficulty in enforcing obligations, decreased liquidity or increased volatility. Foreign investments also involve the risk of the possible seizure, nationalization or expropriation of the issuer or foreign deposits (in which the Fund could lose its entire investments in a certain market) and the possible adoption of foreign governmental restrictions such as exchange controls. Unless the Fund has hedged its foreign securities risk, foreign securities risk also involves the risk of negative foreign currency rate fluctuations, which may cause the value of securities denominated in such foreign currency (or other instruments through which the Fund has exposure to foreign currencies) to decline in value. Currency exchange rates may fluctuate significantly over short periods of time. Currency hedging strategies, if used, are not always successful.
Indexing risk. The Fund is operated as a passively managed index fund and, therefore, the adverse performance of a particular security necessarily will not result in the elimination of the security from the Fund’s portfolio. Ordinarily, the Adviser will not sell the Fund’s portfolio securities except to reflect additions or deletions of the securities that comprise the Index, or as may be necessary to raise cash to pay Fund shareholders who sell Fund shares. As such, the Fund will be negatively affected by declines in the securities represented by the Index. Also, there is no guarantee that the Adviser will be able to correlate the Fund’s performance with that of the Index.
Market risk. The market values of the Fund’s investments, and therefore the value of the Fund’s shares, will go up and
down, sometimes rapidly or unpredictably. Market risk may affect a single issuer, industry or section of the economy, or it may affect the market as a whole. Individual stock prices tend to go up and down more dramatically than those of certain other types of investments, such as bonds. During a general downturn in the financial markets, multiple asset classes may decline in value. When markets perform well, there can be no assurance that specific investments held by the Fund will rise in value.
About indexes used in this report
The S&P 500® Index is an unmanaged index considered representative of the US stock market.
The S&P 500® Equal Weight Index is the equally weighted version of the S&P 500 Index.
The Lipper VUF Multi-Cap Core Funds Index is an unmanaged index considered representative of multicap core variable insurance underlying funds tracked by Lipper.
A direct investment cannot be made in an index. Unless otherwise indicated, index results include reinvested dividends, and they do not reflect sales charges. Performance of the peer group, if applicable, reflects fund expenses; performance of a market index does not.
Other information
The returns shown in management’s discussion of Fund performance are based on net asset values calculated for shareholder transactions. Generally accepted accounting principles require adjustments to be made to the net assets of the Fund at period end for financial reporting purposes, and as such, the net asset values for shareholder transactions and the returns based on those net asset values may differ from the net asset values and returns reported in the Financial Highlights. Additionally, the returns and net asset values shown throughout this report are at the Fund level only and do not include variable product issuer charges. If such charges were included, the total returns would be lower.
Industry classifications used in this report are generally according to the Global Industry Classification Standard, which was developed by and is the exclusive property and a service mark of MSCI Inc. and Standard & Poor’s.
Invesco V.I. Equally-Weighted S&P 500 Fund
Schedule of Investments(a)
December 31, 2017
| | | | | | | | |
| | | Shares | | | Value | |
Common Stocks & Other Equity Interests–99.21% | |
| Advertising–0.39% | |
Interpublic Group of Cos., Inc. (The) | | | 23,845 | | | $ | 480,715 | |
Omnicom Group Inc. | | | 6,561 | | | | 477,838 | |
| | | | | | | | 958,553 | |
|
| Aerospace & Defense–2.42% | |
Arconic Inc. | | | 19,704 | | | | 536,934 | |
Boeing Co. (The) | | | 1,686 | | | | 497,218 | |
General Dynamics Corp. | | | 2,407 | | | | 489,704 | |
Harris Corp. | | | 3,365 | | | | 476,652 | |
L3 Technologies, Inc. | | | 2,495 | | | | 493,636 | |
Lockheed Martin Corp. | | | 1,526 | | | | 489,922 | |
Northrop Grumman Corp. | | | 1,577 | | | | 483,997 | |
Raytheon Co. | | | 2,570 | | | | 482,775 | |
Rockwell Collins, Inc. | | | 3,581 | | | | 485,655 | |
Textron Inc. | | | 8,791 | | | | 497,483 | |
TransDigm Group, Inc. | | | 1,755 | | | | 481,958 | |
United Technologies Corp. | | | 3,926 | | | | 500,840 | |
| | | | | | | | 5,916,774 | |
|
| Agricultural & Farm Machinery–0.20% | |
Deere & Co. | | | 3,180 | | | | 497,702 | |
|
| Agricultural Products–0.19% | |
Archer-Daniels-Midland Co. | | | 11,615 | | | | 465,529 | |
|
| Air Freight & Logistics–0.80% | |
C.H. Robinson Worldwide, Inc.(b) | | | 5,464 | | | | 486,788 | |
Expeditors International of Washington, Inc. | | | 7,479 | | | | 483,816 | |
FedEx Corp. | | | 2,002 | | | | 499,579 | |
United Parcel Service, Inc.–Class B | | | 4,031 | | | | 480,294 | |
| | | | | | | | 1,950,477 | |
|
| Airlines–1.03% | |
Alaska Air Group, Inc. | | | 6,913 | | | | 508,175 | |
American Airlines Group Inc. | | | 9,450 | | | | 491,683 | |
Delta Air Lines, Inc. | | | 9,018 | | | | 505,008 | |
Southwest Airlines Co. | | | 7,613 | | | | 498,271 | |
United Continental Holdings Inc.(c) | | | 7,586 | | | | 511,296 | |
| | | | | | | | 2,514,433 | |
|
| Alternative Carriers–0.22% | |
CenturyLink Inc. | | | 32,866 | | | | 548,205 | |
|
| Apparel Retail–1.02% | |
Foot Locker, Inc. | | | 10,721 | | | | 502,600 | |
Gap, Inc. (The) | | | 14,396 | | | | 490,328 | |
L Brands, Inc. | | | 8,416 | | | | 506,812 | |
Ross Stores, Inc. | | | 6,269 | | | | 503,087 | |
TJX Cos., Inc. (The) | | | 6,525 | | | | 498,902 | |
| | | | | | | | 2,501,729 | |
|
| Apparel, Accessories & Luxury Goods–1.41% | |
Hanesbrands, Inc.(b) | | | 23,236 | | | | 485,865 | |
| | | | | | | | |
| | | Shares | | | Value | |
| Apparel, Accessories & Luxury Goods–(continued) | |
Michael Kors Holdings Ltd.(c) | | | 7,800 | | | $ | 491,010 | |
PVH Corp. | | | 3,560 | | | | 488,468 | |
Ralph Lauren Corp. | | | 4,731 | | | | 490,557 | |
Tapestry, Inc. | | | 11,409 | | | | 504,620 | |
Under Armour, Inc.–Class A(b)(c) | | | 18,617 | | | | 268,643 | |
Under Armour, Inc.–Class C(b)(c) | | | 18,736 | | | | 249,564 | |
VF Corp. | | | 6,572 | | | | 486,328 | |
| | | | | | | | 3,465,055 | |
|
| Application Software–1.56% | |
Adobe Systems Inc.(c) | | | 2,780 | | | | 487,167 | |
ANSYS, Inc.(c) | | | 3,299 | | | | 486,899 | |
Autodesk, Inc.(c) | | | 4,523 | | | | 474,146 | |
Cadence Design Systems, Inc.(c) | | | 11,068 | | | | 462,864 | |
Citrix Systems, Inc.(c) | | | 5,512 | | | | 485,056 | |
Intuit Inc. | | | 3,105 | | | | 489,907 | |
salesforce.com, inc.(c) | | | 4,672 | | | | 477,619 | |
Synopsys, Inc.(c) | | | 5,338 | | | | 455,011 | |
| | | | | | | | 3,818,669 | |
|
| Asset Management & Custody Banks–1.77% | |
Affiliated Managers Group, Inc. | | | 2,414 | | | | 495,473 | |
Ameriprise Financial, Inc. | | | 2,840 | | | | 481,295 | |
Bank of New York Mellon Corp. (The) | | | 8,818 | | | | 474,937 | |
BlackRock, Inc. | | | 939 | | | | 482,374 | |
Franklin Resources, Inc. | | | 10,793 | | | | 467,661 | |
Invesco Ltd.(d) | | | 12,799 | | | | 467,675 | |
Northern Trust Corp. | | | 4,950 | | | | 494,456 | |
State Street Corp. | | | 4,962 | | | | 484,341 | |
T. Rowe Price Group Inc. | | | 4,713 | | | | 494,535 | |
| | | | | | | | 4,342,747 | |
|
| Auto Parts & Equipment–0.38% | |
Aptiv PLC | | | 5,663 | | | | 480,392 | |
BorgWarner, Inc. | | | 8,968 | | | | 458,175 | |
| | | | | | | | 938,567 | |
|
| Automobile Manufacturers–0.39% | |
Ford Motor Co. | | | 38,236 | | | | 477,568 | |
General Motors Co. | | | 11,474 | | | | 470,319 | |
| | | | | | | | 947,887 | |
|
| Automotive Retail–0.77% | |
Advance Auto Parts, Inc. | | | 4,825 | | | | 481,004 | |
AutoZone, Inc.(c) | | | 667 | | | | 474,484 | |
CarMax, Inc.(c) | | | 7,144 | | | | 458,145 | |
O’Reilly Automotive, Inc.(c) | | | 1,920 | | | | 461,837 | |
| | | | | | | | 1,875,470 | |
|
| Biotechnology–1.77% | |
AbbVie Inc. | | | 5,040 | | | | 487,418 | |
Alexion Pharmaceuticals, Inc.(c) | | | 4,211 | | | | 503,594 | |
Amgen Inc. | | | 2,752 | | | | 478,573 | |
See accompanying Notes to Financial Statements which are an integral part of the financial statements.
Invesco V.I. Equally-Weighted S&P 500 Fund
| | | | | | | | |
| | | Shares | | | Value | |
| Biotechnology–(continued) | |
Biogen Inc.(c) | | | 1,479 | | | $ | 471,165 | |
Celgene Corp.(c) | | | 4,567 | | | | 476,612 | |
Gilead Sciences, Inc. | | | 6,495 | | | | 465,302 | |
Incyte Corp.(c) | | | 5,007 | | | | 474,213 | |
Regeneron Pharmaceuticals, Inc.(c) | | | 1,265 | | | | 475,589 | |
Vertex Pharmaceuticals Inc.(c) | | | 3,357 | | | | 503,080 | |
| | | | | | | | 4,335,546 | |
|
| Brewers–0.20% | |
Molson Coors Brewing Co.–Class B | | | 6,016 | | | | 493,733 | |
|
| Broadcasting–0.63% | |
CBS Corp.–Class B | | | 8,389 | | | | 494,951 | |
Discovery Communications, Inc.–Class A(b)(c) | | | 10,969 | | | | 245,486 | |
Discovery Communications, Inc.–Class C(c) | | | 14,482 | | | | 306,584 | |
Scripps Networks Interactive Inc.–Class A | | | 5,892 | | | | 503,059 | |
| | | | | | | | 1,550,080 | |
|
| Building Products–0.98% | |
A.O. Smith Corp. | | | 7,749 | | | | 474,859 | |
Allegion PLC | | | 5,849 | | | | 465,346 | |
Fortune Brands Home & Security, Inc. | | | 7,067 | | | | 483,665 | |
Johnson Controls International PLC | | | 12,888 | | | | 491,162 | |
Masco Corp. | | | 11,286 | | | | 495,907 | |
| | | | | | | | 2,410,939 | |
|
| Cable & Satellite–0.60% | |
Charter Communications, Inc.–Class A(c) | | | 1,485 | | | | 498,901 | |
Comcast Corp.–Class A | | | 12,704 | | | | 508,795 | |
DISH Network Corp.–Class A(c) | | | 9,923 | | | | 473,823 | |
| | | | | | | | 1,481,519 | |
|
| Casinos & Gaming–0.41% | |
MGM Resorts International | | | 14,530 | | | | 485,157 | |
Wynn Resorts Ltd. | | | 3,021 | | | | 509,310 | |
| | | | | | | | 994,467 | |
|
| Commodity Chemicals–0.20% | |
LyondellBasell Industries N.V.–Class A | | | 4,524 | | | | 499,088 | |
|
| Communications Equipment–0.79% | |
Cisco Systems, Inc. | | | 12,819 | | | | 490,968 | |
F5 Networks, Inc.(c) | | | 3,632 | | | | 476,591 | |
Juniper Networks, Inc. | | | 16,989 | | | | 484,186 | |
Motorola Solutions, Inc. | | | 5,224 | | | | 471,936 | |
| | | | | | | | 1,923,681 | |
|
| Computer & Electronics Retail–0.21% | |
Best Buy Co., Inc. | | | 7,558 | | | | 517,496 | |
|
| Construction & Engineering–0.59% | |
Fluor Corp. | | | 9,570 | | | | 494,290 | |
Jacobs Engineering Group Inc. | | | 7,037 | | | | 464,161 | |
Quanta Services, Inc.(c) | | | 12,236 | | | | 478,550 | |
| | | | | | | | 1,437,001 | |
|
| Construction Machinery & Heavy Trucks–0.61% | |
Caterpillar Inc. | | | 3,351 | | | | 528,051 | |
| | | | | | | | |
| | | Shares | | | Value | |
| Construction Machinery & Heavy Trucks–(continued) | |
Cummins Inc. | | | 2,823 | | | $ | 498,655 | |
PACCAR Inc. | | | 6,705 | | | | 476,591 | |
| | | | | | | | 1,503,297 | |
|
| Construction Materials–0.40% | |
Martin Marietta Materials, Inc. | | | 2,263 | | | | 500,214 | |
Vulcan Materials Co. | | | 3,830 | | | | 491,657 | |
| | | | | | | | 991,871 | |
|
| Consumer Electronics–0.19% | |
Garmin Ltd. | | | 7,742 | | | | 461,191 | |
|
| Consumer Finance–1.02% | |
American Express Co. | | | 4,909 | | | | 487,513 | |
Capital One Financial Corp. | | | 5,048 | | | | 502,680 | |
Discover Financial Services | | | 6,532 | | | | 502,441 | |
Navient Corp. | | | 37,786 | | | | 503,309 | |
Synchrony Financial | | | 12,857 | | | | 496,409 | |
| | | | | | | | 2,492,352 | |
|
| Copper–0.25% | |
Freeport-McMoRan Inc.(c) | | | 32,208 | | | | 610,664 | |
|
| Data Processing & Outsourced Services–2.19% | |
Alliance Data Systems Corp. | | | 2,067 | | | | 523,943 | |
Automatic Data Processing, Inc. | | | 4,154 | | | | 486,807 | |
Fidelity National Information Services, Inc. | | | 5,045 | | | | 474,684 | |
Fiserv, Inc.(c) | | | 3,660 | | | | 479,936 | |
Global Payments Inc. | | | 4,870 | | | | 488,169 | |
Mastercard Inc.–Class A | | | 3,216 | | | | 486,774 | |
Paychex, Inc. | | | 6,986 | | | | 475,607 | |
PayPal Holdings, Inc.(c) | | | 6,612 | | | | 486,775 | |
Total System Services, Inc. | | | 6,295 | | | | 497,871 | |
Visa Inc.–Class A | | | 4,281 | | | | 488,120 | |
Western Union Co. (The) | | | 24,865 | | | | 472,684 | |
| | | | | | | | 5,361,370 | |
|
| Department Stores–0.61% | |
Kohl’s Corp. | | | 9,685 | | | | 525,218 | |
Macy’s, Inc. | | | 18,687 | | | | 470,725 | |
Nordstrom, Inc.(b) | | | 10,531 | | | | 498,959 | |
| | | | | | | | 1,494,902 | |
|
| Distillers & Vintners–0.41% | |
Brown-Forman Corp.–Class B | | | 7,252 | | | | 497,995 | |
Constellation Brands, Inc.–Class A | | | 2,211 | | | | 505,368 | |
| | | | | | | | 1,003,363 | |
|
| Distributors–0.40% | |
Genuine Parts Co. | | | 5,097 | | | | 484,266 | |
LKQ Corp.(c) | | | 11,988 | | | | 487,552 | |
| | | | | | | | 971,818 | |
|
| Diversified Banks–0.98% | |
Bank of America Corp. | | | 16,596 | | | | 489,914 | |
Citigroup Inc. | | | 6,367 | | | | 473,768 | |
JPMorgan Chase & Co. | | | 4,574 | | | | 489,143 | |
See accompanying Notes to Financial Statements which are an integral part of the financial statements.
Invesco V.I. Equally-Weighted S&P 500 Fund
| | | | | | | | |
| | | Shares | | | Value | |
| Diversified Banks–(continued) | |
U.S. Bancorp | | | 8,708 | | | $ | 466,575 | |
Wells Fargo & Co. | | | 8,128 | | | | 493,126 | |
| | | | | | | | 2,412,526 | |
|
| Diversified Chemicals–0.40% | |
DowDuPont Inc. | | | 6,816 | | | | 485,436 | |
Eastman Chemical Co. | | | 5,243 | | | | 485,711 | |
| | | | | | | | 971,147 | |
|
| Diversified Support Services–0.19% | |
Cintas Corp. | | | 3,028 | | | | 471,853 | |
|
| Drug Retail–0.39% | |
CVS Health Corp. | | | 6,596 | | | | 478,210 | |
Walgreens Boots Alliance, Inc. | | | 6,738 | | | | 489,314 | |
| | | | | | | | 967,524 | |
|
| Electric Utilities–2.58% | |
Alliant Energy Corp. | | | 10,728 | | | | 457,120 | |
American Electric Power Co., Inc. | | | 6,266 | | | | 460,990 | |
Duke Energy Corp. | | | 5,484 | | | | 461,259 | |
Edison International | | | 6,714 | | | | 424,593 | |
Entergy Corp. | | | 5,741 | | | | 467,260 | |
Eversource Energy | | | 7,392 | | | | 467,027 | |
Exelon Corp. | | | 11,745 | | | | 462,870 | |
FirstEnergy Corp. | | | 14,685 | | | | 449,655 | |
NextEra Energy, Inc. | | | 3,031 | | | | 473,412 | |
PG&E Corp. | | | 9,018 | | | | 404,277 | |
Pinnacle West Capital Corp. | | | 5,324 | | | | 453,498 | |
PPL Corp. | | | 13,975 | | | | 432,526 | |
Southern Co. (The) | | | 9,442 | | | | 454,066 | |
Xcel Energy, Inc. | | | 9,416 | | | | 453,004 | |
| | | | | | | | 6,321,557 | |
|
| Electrical Components & Equipment–1.01% | |
Acuity Brands, Inc. | | | 2,811 | | | | 494,736 | |
AMETEK, Inc. | | | 6,720 | | | | 486,999 | |
Eaton Corp. PLC | | | 6,237 | | | | 492,785 | |
Emerson Electric Co. | | | 7,244 | | | | 504,834 | |
Rockwell Automation, Inc. | | | 2,507 | | | | 492,250 | |
| | | | | | | | 2,471,604 | |
|
| Electronic Components–0.39% | |
Amphenol Corp.–Class A | | | 5,406 | | | | 474,647 | |
Corning Inc. | | | 14,904 | | | | 476,779 | |
| | | | | | | | 951,426 | |
|
| Electronic Equipment & Instruments–0.20% | |
FLIR Systems, Inc. | | | 10,392 | | | | 484,475 | |
|
| Electronic Manufacturing Services–0.20% | |
TE Connectivity Ltd. | | | 5,098 | | | | 484,514 | |
|
| Environmental & Facilities Services–0.61% | |
Republic Services, Inc. | | | 7,401 | | | | 500,382 | |
Stericycle, Inc.(c) | | | 7,241 | | | | 492,316 | |
| | | | | | | | |
| | | Shares | | | Value | |
| Environmental & Facilities Services–(continued) | |
Waste Management, Inc. | | | 5,701 | | | $ | 491,996 | |
| | | | | | | | 1,484,694 | |
|
| Fertilizers & Agricultural Chemicals–0.83% | |
CF Industries Holdings, Inc. | | | 12,280 | | | | 522,391 | |
FMC Corp. | | | 5,438 | | | | 514,761 | |
Monsanto Co. | | | 4,109 | | | | 479,849 | |
Mosaic Co. (The) | | | 20,412 | | | | 523,772 | |
| | | | | | | | 2,040,773 | |
|
| Financial Exchanges & Data–1.16% | |
Cboe Global Markets, Inc. | | | 3,848 | | | | 479,422 | |
CME Group Inc.–Class A | | | 3,154 | | | | 460,642 | |
Intercontinental Exchange, Inc. | | | 6,797 | | | | 479,596 | |
Moody’s Corp. | | | 3,163 | | | | 466,891 | |
Nasdaq, Inc. | | | 6,119 | | | | 470,123 | |
S&P Global Inc. | | | 2,818 | | | | 477,369 | |
| | | | | | | | 2,834,043 | |
|
| Food Distributors–0.19% | |
Sysco Corp. | | | 7,697 | | | | 467,439 | |
|
| Food Retail–0.20% | |
Kroger Co. (The) | | | 18,072 | | | | 496,076 | |
|
| Footwear–0.20% | |
NIKE, Inc.–Class B | | | 7,865 | | | | 491,956 | |
|
| General Merchandise Stores–0.60% | |
Dollar General Corp. | | | 5,176 | | | | 481,420 | |
Dollar Tree, Inc.(c) | | | 4,461 | | | | 478,710 | |
Target Corp. | | | 7,856 | | | | 512,604 | |
| | | | | | | | 1,472,734 | |
|
| Gold–0.21% | |
Newmont Mining Corp. | | | 13,620 | | | | 511,022 | |
|
| Health Care Distributors–1.02% | |
AmerisourceBergen Corp. | | | 5,568 | | | | 511,254 | |
Cardinal Health, Inc. | | | 8,186 | | | | 501,556 | |
Henry Schein, Inc.(c) | | | 7,100 | | | | 496,148 | |
McKesson Corp. | | | 3,159 | | | | 492,646 | |
Patterson Cos. Inc.(b) | | �� | 13,593 | | | | 491,115 | |
| | | | | | | | 2,492,719 | |
|
| Health Care Equipment–2.81% | |
Abbott Laboratories | | | 8,823 | | | | 503,529 | |
Baxter International Inc. | | | 7,527 | | | | 486,545 | |
Becton, Dickinson and Co. | | | 2,928 | | | | 626,800 | |
Boston Scientific Corp.(c) | | | 18,709 | | | | 463,796 | |
Danaher Corp. | | | 5,174 | | | | 480,251 | |
Edwards Lifesciences Corp.(c) | | | 4,084 | | | | 460,308 | |
Hologic, Inc.(c) | | | 11,294 | | | | 482,818 | |
IDEXX Laboratories, Inc.(c) | | | 3,002 | | | | 469,453 | |
Intuitive Surgical, Inc.(c) | | | 1,269 | | | | 463,109 | |
Medtronic PLC | | | 5,947 | | | | 480,220 | |
ResMed Inc. | | | 5,607 | | | | 474,857 | |
See accompanying Notes to Financial Statements which are an integral part of the financial statements.
Invesco V.I. Equally-Weighted S&P 500 Fund
| | | | | | | | |
| | | Shares | | | Value | |
| Health Care Equipment–(continued) | |
Stryker Corp. | | | 3,185 | | | $ | 493,165 | |
Varian Medical Systems, Inc.(c) | | | 4,304 | | | | 478,390 | |
Zimmer Biomet Holdings, Inc. | | | 4,251 | | | | 512,968 | |
| | | | | | | | 6,876,209 | |
|
| Health Care Facilities–0.40% | |
HCA Healthcare, Inc.(c) | | | 5,687 | | | | 499,546 | |
Universal Health Services, Inc.–Class B | | | 4,321 | | | | 489,785 | |
| | | | | | | | 989,331 | |
|
| Health Care REIT’s–0.57% | |
HCP, Inc. | | | 18,004 | | | | 469,545 | |
Ventas, Inc. | | | 7,615 | | | | 456,976 | |
Welltower Inc. | | | 7,269 | | | | 463,544 | |
| | | | | | | | 1,390,065 | |
|
| Health Care Services–1.04% | |
DaVita Inc.(c) | | | 7,120 | | | | 514,420 | |
Envision Healthcare Corp.(c) | | | 15,034 | | | | 519,575 | |
Express Scripts Holding Co.(c) | | | 7,090 | | | | 529,198 | |
Laboratory Corp. of America Holdings(c) | | | 3,085 | | | | 492,088 | |
Quest Diagnostics Inc. | | | 4,982 | | | | 490,677 | |
| | | | | | | | 2,545,958 | |
|
| Health Care Supplies–0.57% | |
Align Technology, Inc.(c) | | | 2,021 | | | | 449,046 | |
Cooper Cos., Inc. (The) | | | 2,127 | | | | 463,431 | |
DENTSPLY SIRONA Inc. | | | 7,429 | | | | 489,051 | |
| | | | | | | | 1,401,528 | |
|
| Health Care Technology–0.19% | |
Cerner Corp.(c) | | | 6,846 | | | | 461,352 | |
|
| Home Entertainment Software–0.40% | |
Activision Blizzard, Inc. | | | 7,723 | | | | 489,020 | |
Electronic Arts Inc.(c) | | | 4,602 | | | | 483,486 | |
| | | | | | | | 972,506 | |
|
| Home Furnishings–0.40% | |
Leggett & Platt, Inc. | | | 10,413 | | | | 497,013 | |
Mohawk Industries, Inc.(c) | | | 1,718 | | | | 473,996 | |
| | | | | | | | 971,009 | |
|
| Home Improvement Retail–0.42% | |
Home Depot, Inc. (The) | | | 2,634 | | | | 499,222 | |
Lowe’s Cos., Inc. | | | 5,638 | | | | 523,996 | |
| | | | | | | | 1,023,218 | |
|
| Homebuilding–0.59% | |
D.R. Horton, Inc. | | | 9,494 | | | | 484,859 | |
Lennar Corp.–Class A | | | 7,754 | | | | 490,363 | |
PulteGroup Inc. | | | 14,138 | | | | 470,088 | |
| | | | | | | | 1,445,310 | |
|
| Hotel and Resort REIT’s–0.20% | |
Host Hotels & Resorts Inc. | | | 24,301 | | | | 482,375 | |
| | | | | | | | |
| | | Shares | | | Value | |
| Hotels, Resorts & Cruise Lines–1.18% | |
Carnival Corp. | | | 7,205 | | | $ | 478,196 | |
Hilton Worldwide Holdings Inc. | | | 6,150 | | | | 491,139 | |
Marriott International Inc.–Class A | | | 3,728 | | | | 506,001 | |
Norwegian Cruise Line Holdings Ltd.(c) | | | 8,761 | | | | 466,523 | |
Royal Caribbean Cruises Ltd. | | | 3,850 | | | | 459,228 | |
Wyndham Worldwide Corp. | | | 4,264 | | | | 494,070 | |
| | | | | | | | 2,895,157 | |
|
| Household Appliances–0.20% | |
Whirlpool Corp. | | | 2,843 | | | | 479,444 | |
|
| Household Products–1.01% | |
Church & Dwight Co., Inc. | | | 9,962 | | | | 499,794 | |
Clorox Co. (The) | | | 3,319 | | | | 493,668 | |
Colgate-Palmolive Co. | | | 6,575 | | | | 496,084 | |
Kimberly-Clark Corp. | | | 4,014 | | | | 484,329 | |
Procter & Gamble Co. (The) | | | 5,346 | | | | 491,190 | |
| | | | | | | | 2,465,065 | |
|
| Housewares & Specialties–0.20% | |
Newell Brands, Inc. | | | 15,573 | | | | 481,206 | |
|
| Human Resource & Employment Services–0.20% | |
Robert Half International, Inc. | | | 8,817 | | | | 489,696 | |
|
| Hypermarkets & Super Centers–0.40% | |
Costco Wholesale Corp. | | | 2,570 | | | | 478,328 | |
Wal-Mart Stores, Inc. | | | 5,009 | | | | 494,639 | |
| | | | | | | | 972,967 | |
|
| Independent Power Producers & Energy Traders–0.40% | |
AES Corp. (The) | | | 44,810 | | | | 485,292 | |
NRG Energy, Inc. | | | 17,067 | | | | 486,068 | |
| | | | | | | | 971,360 | |
|
| Industrial Conglomerates–0.78% | |
3M Co. | | | 2,023 | | | | 476,154 | |
General Electric Co. | | | 27,225 | | | | 475,076 | |
Honeywell International Inc. | | | 3,137 | | | | 481,090 | |
Roper Technologies, Inc. | | | 1,850 | | | | 479,150 | |
| | | | | | | | 1,911,470 | |
|
| Industrial Gases–0.40% | |
Air Products and Chemicals, Inc. | | | 2,995 | | | | 491,420 | |
Praxair, Inc. | | | 3,184 | | | | 492,501 | |
| | | | | | | | 983,921 | |
|
| Industrial Machinery–1.99% | |
Dover Corp. | | | 4,907 | | | | 495,558 | |
Flowserve Corp. | | | 11,444 | | | | 482,136 | |
Fortive Corp. | | | 6,542 | | | | 473,314 | |
Illinois Tool Works Inc. | | | 2,897 | | | | 483,364 | |
Ingersoll-Rand PLC | | | 5,511 | | | | 491,526 | |
Parker-Hannifin Corp. | | | 2,506 | | | | 500,147 | |
Pentair PLC (United Kingdom) | | | 6,892 | | | | 486,713 | |
Snap-on Inc. | | | 2,802 | | | | 488,389 | |
Stanley Black & Decker Inc. | | | 2,877 | | | | 488,198 | |
See accompanying Notes to Financial Statements which are an integral part of the financial statements.
Invesco V.I. Equally-Weighted S&P 500 Fund
| | | | | | | | |
| | | Shares | | | Value | |
| Industrial Machinery–(continued) | |
Xylem, Inc. | | | 7,070 | | | $ | 482,174 | |
| | | | | | | | 4,871,519 | |
|
| Industrial REIT’s–0.38% | |
Duke Realty Corp. | | | 17,275 | | | | 470,053 | |
Prologis, Inc. | | | 7,287 | | | | 470,084 | |
| | | | | | | | 940,137 | |
|
| Insurance Brokers–0.76% | |
Aon PLC | | | 3,481 | | | | 466,454 | |
Arthur J. Gallagher & Co. | | | 7,339 | | | | 464,412 | |
Marsh & McLennan Cos., Inc. | | | 5,735 | | | | 466,771 | |
Willis Towers Watson PLC | | | 3,101 | | | | 467,290 | |
| | | | | | | | 1,864,927 | |
|
| Integrated Oil & Gas–0.61% | |
Chevron Corp. | | | 4,020 | | | | 503,264 | |
Exxon Mobil Corp. | | | 5,835 | | | | 488,039 | |
Occidental Petroleum Corp. | | | 7,000 | | | | 515,620 | |
| | | | | | | | 1,506,923 | |
|
| Integrated Telecommunication Services–0.41% | |
AT&T Inc. | | | 13,126 | | | | 510,339 | |
Verizon Communications Inc. | | | 9,437 | | | | 499,500 | |
| | | | | | | | 1,009,839 | |
|
| Internet & Direct Marketing Retail–0.99% | |
Amazon.com, Inc.(c) | | | 414 | | | | 484,161 | |
Expedia, Inc. | | | 4,101 | | | | 491,177 | |
Netflix Inc.(c) | | | 2,564 | | | | 492,185 | |
Priceline Group Inc. (The)(c) | | | 280 | | | | 486,567 | |
TripAdvisor Inc.(b) (c) | | | 13,975 | | | | 481,579 | |
| | | | | | | | 2,435,669 | |
|
| Internet Software & Services–1.02% | |
Akamai Technologies, Inc.(c) | | | 8,533 | | | | 554,986 | |
Alphabet Inc.–Class A(c) | | | 230 | | | | 242,282 | |
Alphabet Inc.–Class C(c) | | | 233 | | | | 243,811 | |
eBay Inc.(c) | | | 12,805 | | | | 483,261 | |
Facebook, Inc.–Class A(c) | | | 2,698 | | | | 476,089 | |
VeriSign, Inc.(b) (c) | | | 4,266 | | | | 488,201 | |
| | | | | | | | 2,488,630 | |
|
| Investment Banking & Brokerage–0.98% | |
Charles Schwab Corp. (The) | | | 9,382 | | | | 481,953 | |
E*TRADE Financial Corp.(c) | | | 9,570 | | | | 474,385 | |
Goldman Sachs Group, Inc. (The) | | | 1,925 | | | | 490,413 | |
Morgan Stanley | | | 9,115 | | | | 478,264 | |
Raymond James Financial, Inc. | | | 5,397 | | | | 481,952 | |
| | | | | | | | 2,406,967 | |
|
| IT Consulting & Other Services–1.19% | |
Accenture PLC–Class A | | | 3,202 | | | | 490,194 | |
Cognizant Technology Solutions Corp.–Class A | | | 6,712 | | | | 476,686 | |
CSRA Inc. | | | 16,489 | | | | 493,351 | |
| | | | | | | | |
| | | Shares | | | Value | |
| IT Consulting & Other Services–(continued) | |
DXC Technology Co. | | | 5,041 | | | $ | 478,391 | |
Gartner, Inc.(c) | | | 3,994 | | | | 491,861 | |
International Business Machines Corp. | | | 3,114 | | | | 477,750 | |
| | | | | | | | 2,908,233 | |
|
| Leisure Products–0.40% | |
Hasbro, Inc. | | | 5,289 | | | | 480,717 | |
Mattel, Inc.(b) | | | 32,058 | | | | 493,052 | |
| | | | | | | | 973,769 | |
|
| Life & Health Insurance–1.54% | |
Aflac, Inc. | | | 5,477 | | | | 480,771 | |
Brighthouse Financial, Inc.(c) | | | 8,009 | | | | 469,648 | |
Lincoln National Corp. | | | 6,138 | | | | 471,828 | |
MetLife, Inc. | | | 8,968 | | | | 453,422 | |
Principal Financial Group, Inc. | | | 6,718 | | | | 474,022 | |
Prudential Financial, Inc. | | | 4,114 | | | | 473,028 | |
Torchmark Corp. | | | 5,370 | | | | 487,113 | |
Unum Group | | | 8,386 | | | | 460,307 | |
| | | | | | | | 3,770,139 | |
|
| Life Sciences Tools & Services–1.37% | |
Agilent Technologies, Inc. | | | 7,155 | | | | 479,170 | |
Illumina, Inc.(c) | | | 2,227 | | | | 486,577 | |
IQVIA Holdings Inc.(c) | | | 4,776 | | | | 467,570 | |
Mettler-Toledo International Inc.(c) | | | 773 | | | | 478,889 | |
PerkinElmer, Inc. | | | 6,787 | | | | 496,266 | |
Thermo Fisher Scientific, Inc. | | | 2,571 | | | | 488,182 | |
Waters Corp.(c) | | | 2,428 | | | | 469,065 | |
| | | | | | | | 3,365,719 | |
|
| Managed Health Care–1.16% | |
Aetna Inc. | | | 2,643 | | | | 476,771 | |
Anthem, Inc. | | | 2,143 | | | | 482,196 | |
Centene Corp.(c) | | | 4,777 | | | | 481,904 | |
Cigna Corp. | | | 2,307 | | | | 468,529 | |
Humana Inc. | | | 1,879 | | | | 466,123 | |
UnitedHealth Group Inc. | | | 2,152 | | | | 474,430 | |
| | | | | | | | 2,849,953 | |
|
| Metal & Glass Containers–0.19% | |
Ball Corp. | | | 12,174 | | | | 460,786 | |
|
| Motorcycle Manufacturers–0.20% | |
Harley-Davidson, Inc.(b) | | | 9,418 | | | | 479,188 | |
|
| Movies & Entertainment–0.81% | |
Time Warner Inc. | | | 5,326 | | | | 487,169 | |
Twenty-First Century Fox, Inc.–Class A | | | 10,245 | | | | 353,760 | |
Twenty-First Century Fox, Inc.–Class B | | | 4,303 | | | | 146,818 | |
Viacom Inc.–Class B | | | 16,460 | | | | 507,133 | |
Walt Disney Co. (The) | | | 4,642 | | | | 499,061 | |
| | | | | | | | 1,993,941 | |
|
| Multi-Line Insurance–0.80% | |
American International Group, Inc. | | | 8,101 | | | | 482,658 | |
See accompanying Notes to Financial Statements which are an integral part of the financial statements.
Invesco V.I. Equally-Weighted S&P 500 Fund
| | | | | | | | |
| | | Shares | | | Value | |
| Multi-Line Insurance–(continued) | |
Assurant, Inc. | | | 4,881 | | | $ | 492,200 | |
Hartford Financial Services Group, Inc. (The) | | | 8,738 | | | | 491,775 | |
Loews Corp. | | | 9,674 | | | | 483,990 | |
| | | | | | | | 1,950,623 | |
|
| Multi-Sector Holdings–0.40% | |
Berkshire Hathaway Inc.–Class B(c) | | | 2,462 | | | | 488,018 | |
Leucadia National Corp. | | | 18,472 | | | | 489,323 | |
| | | | | | | | 977,341 | |
|
| Multi-Utilities–2.05% | |
Ameren Corp. | | | 7,630 | | | | 450,094 | |
CenterPoint Energy, Inc. | | | 16,677 | | | | 472,960 | |
CMS Energy Corp. | | | 9,668 | | | | 457,296 | |
Consolidated Edison, Inc. | | | 5,431 | | | | 461,363 | |
Dominion Energy, Inc. | | | 5,751 | | | | 466,176 | |
DTE Energy Co. | | | 4,174 | | | | 456,886 | |
NiSource Inc. | | | 17,765 | | | | 456,028 | |
Public Service Enterprise Group Inc. | | | 9,284 | | | | 478,126 | |
SCANA Corp. | | | 10,531 | | | | 418,923 | |
Sempra Energy | | | 4,131 | | | | 441,687 | |
WEC Energy Group, Inc. | | | 6,991 | | | | 464,412 | |
| | | | | | | | 5,023,951 | |
|
| Office REIT’s–0.80% | |
Alexandria Real Estate Equities, Inc. | | | 3,708 | | | | 484,227 | |
Boston Properties, Inc. | | | 3,867 | | | | 502,826 | |
SL Green Realty Corp. | | | 4,718 | | | | 476,188 | |
Vornado Realty Trust | | | 6,261 | | | | 489,485 | |
| | | | | | | | 1,952,726 | |
|
| Oil & Gas Drilling–0.22% | |
Helmerich & Payne, Inc.(b) | | | 8,310 | | | | 537,158 | |
|
| Oil & Gas Equipment & Services–1.08% | |
Baker Hughes, a GE Co. | | | 15,933 | | | | 504,120 | |
Halliburton Co. | | | 10,960 | | | | 535,615 | |
National Oilwell Varco Inc. | | | 14,780 | | | | 532,376 | |
Schlumberger Ltd. | | | 7,588 | | | | 511,355 | |
TechnipFMC PLC (United Kingdom) | | | 17,629 | | | | 551,964 | |
| | | | | | | | 2,635,430 | |
|
| Oil & Gas Exploration & Production–3.38% | |
Anadarko Petroleum Corp. | | | 10,061 | | | | 539,672 | |
Apache Corp. | | | 11,846 | | | | 500,138 | |
Cabot Oil & Gas Corp. | | | 17,374 | | | | 496,897 | |
Chesapeake Energy Corp.(b)(c) | | | 131,021 | | | | 518,843 | |
Cimarex Energy Co. | | | 4,308 | | | | 525,619 | |
Concho Resources Inc.(c) | | | 3,438 | | | | 516,456 | |
ConocoPhillips | | | 9,349 | | | | 513,167 | |
Devon Energy Corp. | | | 12,671 | | | | 524,580 | |
EOG Resources, Inc. | | | 4,821 | | | | 520,234 | |
EQT Corp. | | | 8,551 | | | | 486,723 | |
Hess Corp. | | | 10,598 | | | | 503,087 | |
Marathon Oil Corp. | | | 31,825 | | | | 538,797 | |
| | | | | | | | |
| | | Shares | | | Value | |
| Oil & Gas Exploration & Production–(continued) | |
Newfield Exploration Co.(c) | | | 16,404 | | | $ | 517,218 | |
Noble Energy, Inc. | | | 17,897 | | | | 521,519 | |
Pioneer Natural Resources Co. | | | 3,092 | | | | 534,452 | |
Range Resources Corp. | | | 29,985 | | | | 511,544 | |
| | | | | | | | 8,268,946 | |
|
| Oil & Gas Refining & Marketing–0.81% | |
Andeavor | | | 4,341 | | | | 496,350 | |
Marathon Petroleum Corp. | | | 7,446 | | | | 491,287 | |
Phillips 66 | | | 4,861 | | | | 491,690 | |
Valero Energy Corp. | | | 5,511 | | | | 506,516 | |
| | | | | | | | 1,985,843 | |
|
| Oil & Gas Storage & Transportation–0.61% | |
Kinder Morgan, Inc. | | | 27,102 | | | | 489,733 | |
ONEOK, Inc. | | | 9,095 | | | | 486,128 | |
Williams Cos., Inc. (The) | | | 16,887 | | | | 514,885 | |
| | | | | | | | 1,490,746 | |
|
| Packaged Foods & Meats–2.18% | |
Campbell Soup Co.(b) | | | 9,850 | | | | 473,883 | |
Conagra Brands, Inc. | | | 12,943 | | | | 487,563 | |
General Mills, Inc. | | | 8,634 | | | | 511,910 | |
Hershey Co. (The) | | | 4,258 | | | | 483,326 | |
Hormel Foods Corp.(b) | | | 12,946 | | | | 471,105 | |
JM Smucker Co. (The) | | | 4,064 | | | | 504,911 | |
Kellogg Co. | | | 7,246 | | | | 492,583 | |
Kraft Heinz Co. (The) | | | 6,142 | | | | 477,602 | |
McCormick & Co., Inc. | | | 4,785 | | | | 487,639 | |
Mondelez International, Inc.–Class A | | | 11,304 | | | | 483,811 | |
Tyson Foods, Inc.–Class A | | | 5,769 | | | | 467,693 | |
| | | | | | | | 5,342,026 | |
|
| Paper Packaging–1.00% | |
Avery Dennison Corp. | | | 4,238 | | | | 486,777 | |
International Paper Co. | | | 8,471 | | | | 490,810 | |
Packaging Corp. of America | | | 4,073 | | | | 491,000 | |
Sealed Air Corp. | | | 10,088 | | | | 497,338 | |
WestRock Co. | | | 7,484 | | | | 473,064 | |
| | | | | | | | 2,438,989 | |
|
| Personal Products–0.42% | |
Coty Inc.–Class A | | | 27,117 | | | | 539,357 | |
Estee Lauder Cos. Inc. (The)–Class A | | | 3,837 | | | | 488,220 | |
| | | | | | | | 1,027,577 | |
|
| Pharmaceuticals–1.79% | |
Allergan PLC | | | 2,874 | | | | 470,129 | |
Bristol-Myers Squibb Co. | | | 7,724 | | | | 473,327 | |
Eli Lilly and Co. | | | 5,583 | | | | 471,540 | |
Johnson & Johnson | | | 3,429 | | | | 479,100 | |
Merck & Co., Inc. | | | 8,676 | | | | 488,198 | |
Mylan N.V.(c) | | | 12,467 | | | | 527,479 | |
Perrigo Co. PLC | | | 5,638 | | | | 491,408 | |
Pfizer Inc. | | | 13,490 | | | | 488,608 | |
See accompanying Notes to Financial Statements which are an integral part of the financial statements.
Invesco V.I. Equally-Weighted S&P 500 Fund
| | | | | | | | |
| | | Shares | | | Value | |
| Pharmaceuticals–(continued) | |
Zoetis Inc. | | | 6,707 | | | $ | 483,172 | |
| | | | | | | | 4,372,961 | |
|
| Property & Casualty Insurance–1.18% | |
Allstate Corp. (The)(e) | | | 4,724 | | | | 494,650 | |
Chubb Ltd. | | | 3,221 | | | | 470,685 | |
Cincinnati Financial Corp. | | | 6,479 | | | | 485,731 | |
Progressive Corp. (The) | | | 8,767 | | | | 493,757 | |
Travelers Cos., Inc. (The) | | | 3,604 | | | | 488,847 | |
XL Group Ltd. (Bermuda) | | | 13,076 | | | | 459,752 | |
| | | | | | | | 2,893,422 | |
|
| Publishing–0.19% | |
News Corp.–Class A | | | 22,013 | | | | 356,831 | |
News Corp.–Class B | | | 7,013 | | | | 116,416 | |
| | | | | | | | 473,247 | |
|
| Railroads–0.78% | |
CSX Corp. | | | 8,539 | | | | 469,730 | |
Kansas City Southern | | | 4,329 | | | | 455,497 | |
Norfolk Southern Corp. | | | 3,423 | | | | 495,993 | |
Union Pacific Corp. | | | 3,734 | | | | 500,730 | |
| | | | | | | | 1,921,950 | |
|
| Real Estate Services–0.20% | |
CBRE Group, Inc.–Class A(c) | | | 11,053 | | | | 478,705 | |
|
| Regional Banks–2.36% | |
BB&T Corp. | | | 9,679 | | | | 481,240 | |
Citizens Financial Group, Inc. | | | 11,551 | | | | 484,911 | |
Comerica Inc. | | | 5,651 | | | | 490,563 | |
Fifth Third Bancorp | | | 15,876 | | | | 481,678 | |
Huntington Bancshares Inc. | | | 32,468 | | | | 472,734 | |
KeyCorp | | | 24,240 | | | | 488,921 | |
M&T Bank Corp. | | | 2,810 | | | | 480,482 | |
People’s United Financial, Inc. | | | 25,592 | | | | 478,570 | |
PNC Financial Services Group, Inc. (The) | | | 3,352 | | | | 483,660 | |
Regions Financial Corp. | | | 28,228 | | | | 487,780 | |
SunTrust Banks, Inc. | | | 7,394 | | | | 477,578 | |
Zions Bancorp. | | | 9,466 | | | | 481,157 | |
| | | | | | | | 5,789,274 | |
|
| Reinsurance–0.21% | |
Everest Re Group, Ltd. | | | 2,282 | | | | 504,915 | |
|
| Research & Consulting Services–0.78% | |
Equifax Inc. | | | 4,106 | | | | 484,179 | |
IHS Markit Ltd.(c) | | | 10,575 | | | | 477,461 | |
Nielsen Holdings PLC | | | 12,704 | | | | 462,426 | |
Verisk Analytics, Inc.–Class A(c) | | | 5,029 | | | | 482,784 | |
| | | | | | | | 1,906,850 | |
|
| Residential REIT’s–1.16% | |
Apartment Investment & Management Co.–Class A | | | 10,925 | | | | 477,532 | |
AvalonBay Communities, Inc. | | | 2,651 | | | | 472,965 | |
| | | | | | | | |
| | | Shares | | | Value | |
| Residential REIT’s–(continued) | |
Equity Residential | | | 7,326 | | | $ | 467,179 | |
Essex Property Trust, Inc. | | | 1,973 | | | | 476,223 | |
Mid-America Apartment Communities, Inc. | | | 4,696 | | | | 472,230 | |
UDR, Inc. | | | 12,352 | | | | 475,799 | |
| | | | | | | | 2,841,928 | |
|
| Restaurants–0.98% | |
Chipotle Mexican Grill, Inc.(c) | | | 1,526 | | | | 441,060 | |
Darden Restaurants, Inc. | | | 5,586 | | | | 536,368 | |
McDonald’s Corp. | | | 2,787 | | | | 479,698 | |
Starbucks Corp. | | | 8,225 | | | | 472,362 | |
Yum! Brands, Inc. | | | 5,789 | | | | 472,440 | |
| | | | | | | | 2,401,928 | |
|
| Retail REIT’s–1.40% | |
Federal Realty Investment Trust | | | 3,700 | | | | 491,397 | |
GGP Inc. | | | 20,578 | | | | 481,319 | |
Kimco Realty Corp. | | | 26,361 | | | | 478,452 | |
Macerich Co. (The) | | | 7,332 | | | | 481,566 | |
Realty Income Corp. | | | 8,674 | | | | 494,591 | |
Regency Centers Corp. | | | 7,134 | | | | 493,530 | |
Simon Property Group, Inc. | | | 2,971 | | | | 510,240 | |
| | | | | | | | 3,431,095 | |
|
| Semiconductor Equipment–0.59% | |
Applied Materials, Inc. | | | 9,374 | | | | 479,199 | |
KLA-Tencor Corp. | | | 4,658 | | | | 489,416 | |
Lam Research Corp. | | | 2,592 | | | | 477,109 | |
| | | | | | | | 1,445,724 | |
|
| Semiconductors–2.39% | |
Advanced Micro Devices, Inc.(b)(c) | | | 48,506 | | | | 498,642 | |
Analog Devices, Inc. | | | 5,666 | | | | 504,444 | |
Broadcom Ltd. | | | 1,855 | | | | 476,550 | |
Intel Corp. | | | 11,122 | | | | 513,392 | |
Microchip Technology Inc. | | | 5,523 | | | | 485,361 | |
Micron Technology, Inc.(c) | | | 11,158 | | | | 458,817 | |
NVIDIA Corp. | | | 2,525 | | | | 488,587 | |
Qorvo, Inc.(c) | | | 7,102 | | | | 472,993 | |
QUALCOMM Inc. | | | 7,505 | | | | 480,470 | |
Skyworks Solutions, Inc. | | | 5,023 | | | | 476,934 | |
Texas Instruments Inc. | | | 4,935 | | | | 515,411 | |
Xilinx, Inc. | | | 7,034 | | | | 474,232 | |
| | | | | | | | 5,845,833 | |
|
| Soft Drinks–0.80% | |
Coca-Cola Co. (The) | | | 10,640 | | | | 488,163 | |
Dr Pepper Snapple Group, Inc. | | | 5,134 | | | | 498,306 | |
Monster Beverage Corp.(c) | | | 7,626 | | | | 482,650 | |
PepsiCo, Inc. | | | 4,135 | | | | 495,869 | |
| | | | | | | | 1,964,988 | |
|
| Specialized Consumer Services–0.19% | |
H&R Block, Inc. | | | 17,713 | | | | 464,435 | |
See accompanying Notes to Financial Statements which are an integral part of the financial statements.
Invesco V.I. Equally-Weighted S&P 500 Fund
| | | | | | | | |
| | | Shares | | | Value | |
| Specialized REIT’s–1.76% | |
American Tower Corp.–Class A | | | 3,384 | | | $ | 482,795 | |
Crown Castle International Corp. | | | 4,428 | | | | 491,552 | |
Digital Realty Trust, Inc. | | | 4,198 | | | | 478,152 | |
Equinix, Inc. | | | 1,067 | | | | 483,586 | |
Extra Space Storage Inc. | | | 5,594 | | | | 489,196 | |
Iron Mountain Inc. | | | 12,018 | | | | 453,439 | |
Public Storage | | | 2,298 | | | | 480,282 | |
SBA Communications Corp.–Class A(c) | | | 2,919 | | | | 476,848 | |
Weyerhaeuser Co. | | | 13,608 | | | | 479,818 | |
| | | | | | | | 4,315,668 | |
|
| Specialty Chemicals–0.98% | |
Albemarle Corp. | | | 3,691 | | | | 472,042 | |
Ecolab Inc. | | | 3,562 | | | | 477,949 | |
International Flavors & Fragrances Inc. | | | 3,150 | | | | 480,721 | |
PPG Industries, Inc. | | | 4,158 | | | | 485,738 | |
Sherwin-Williams Co. (The) | | | 1,179 | | | | 483,437 | |
| | | | | | | | 2,399,887 | |
|
| Specialty Stores–0.84% | |
Signet Jewelers Ltd.(b) | | | 9,059 | | | | 512,286 | |
Tiffany & Co. | | | 5,050 | | | | 524,948 | |
Tractor Supply Co. | | | 7,125 | | | | 532,594 | |
Ulta Beauty, Inc.(c) | | | 2,146 | | | | 479,974 | |
| | | | | | | | 2,049,802 | |
|
| Steel–0.21% | |
Nucor Corp. | | | 8,013 | | | | 509,467 | |
|
| Systems Software–0.97% | |
CA, Inc. | | | 14,400 | | | | 479,232 | |
Microsoft Corp. | | | 5,733 | | | | 490,401 | |
Oracle Corp. | | | 9,720 | | | | 459,561 | |
Red Hat, Inc.(c) | | | 3,848 | | | | 462,145 | |
Symantec Corp. | | | 17,232 | | | | 483,530 | |
| | | | | | | | 2,374,869 | |
|
| Technology Hardware, Storage & Peripherals–1.37% | |
Apple Inc. | | | 2,848 | | | | 481,967 | |
Hewlett Packard Enterprise Co. | | | 33,623 | | | | 482,826 | |
HP Inc. | | | 22,883 | | | | 480,772 | |
NetApp, Inc. | | | 8,275 | | | | 457,773 | |
Seagate Technology PLC(b) | | | 11,908 | | | | 498,231 | |
Western Digital Corp. | | | 5,919 | | | | 470,738 | |
Xerox Corp. | | | 16,293 | | | | 474,941 | |
| | | | | | | | 3,347,248 | |
| | | | | | | | |
| | | Shares | | | Value | |
| Tires & Rubber–0.20% | |
Goodyear Tire & Rubber Co. (The) | | | 15,185 | | | $ | 490,627 | |
|
| Tobacco–0.39% | |
Altria Group, Inc. | | | 6,739 | | | | 481,232 | |
Philip Morris International Inc. | | | 4,546 | | | | 480,285 | |
| | | | | | | | 961,517 | |
|
| Trading Companies & Distributors–0.61% | |
Fastenal Co. | | | 8,964 | | | | 490,241 | |
United Rentals, Inc.(c) | | | 2,940 | | | | 505,416 | |
W.W. Grainger, Inc. | | | 2,152 | | | | 508,410 | |
| | | | | | | | 1,504,067 | |
|
| Trucking–0.20% | |
J.B. Hunt Transport Services, Inc. | | | 4,284 | | | | 492,574 | |
|
| Water Utilities–0.20% | |
American Water Works Co., Inc. | | | 5,280 | | | | 483,067 | |
Total Common Stocks & Other Equity Interests
(Cost $170,495,748) | | | | 242,937,147 | |
|
Money Market Funds–0.52% | |
Invesco Government & Agency
Portfolio–Institutional Class, 1.18%(f) | | | 444,281 | | | | 444,281 | |
Invesco Liquid Assets
Portfolio–Institutional Class, 1.40%(f) | | | 317,250 | | | | 317,282 | |
Invesco Treasury Portfolio–Institutional Class, 1.17%(f) | | | 507,749 | | | | 507,749 | |
Total Money Market Funds
(Cost $1,269,312) | | | | 1,269,312 | |
TOTAL INVESTMENTS IN SECURITIES (excluding investments purchased with cash collateral from securities on loan)–99.73% (Cost $171,765,060) | | | | 244,206,459 | |
|
Investments Purchased with Cash
Collateral from Securities on Loan | |
| Money Market Funds–2.15% | |
Invesco Government & Agency Portfolio–Institutional Class, 1.18%
(Cost $5,262,494)(f)(g) | | | 5,262,494 | | | | 5,262,494 | |
TOTAL INVESTMENTS IN SECURITIES–101.88% (Cost $177,027,554) | | | | 249,468,953 | |
OTHER ASSETS LESS LIABILITIES–(1.88)% | | | | (4,606,912 | ) |
NET ASSETS–100.00% | | | $ | 244,862,041 | |
Investment Abbreviations:
| | |
| REIT | | – Real Estate Investment Trust |
See accompanying Notes to Financial Statements which are an integral part of the financial statements.
Invesco V.I. Equally-Weighted S&P 500 Fund
Notes to Schedule of Investments:
| (a) | Industry and/or sector classifications used in this report are generally according to the Global Industry Classification Standard, which was developed by and is the exclusive property and a service mark of MSCI Inc. and Standard & Poor’s. |
| (b) | All or a portion of this security was out on loan at December 31, 2017. |
| (c) | Non-income producing security. |
| (d) | The Fund’s Adviser is a subsidiary of Invesco Ltd. and therefore, Invesco Ltd. is considered to be affiliated with the Fund. The value of this security as of December 31, 2017 represented less than 1% of the Fund’s Net Assets. See Note 5. |
| (e) | All or a portion of the value was pledged as collateral to cover margin requirements for open futures contracts. See Note 1J. |
| (f) | The money market fund and the Fund are affiliated by having the same investment adviser. The rate shown is the 7-day SEC standardized yield as of December 31, 2017. |
| (g) | The security has been segregated to satisfy the commitment to return the cash collateral received in securities lending transactions upon the borrower’s return of the securities loaned. See Note 1I. |
| | | | | | | | | | | | | | | | | | | | |
| Open Futures Contracts — Equity Risk | |
| Long Futures Contracts | | Number of Contracts | | | Expiration
Month | | | Notional
Value | | | Value | | | Unrealized
Appreciation
(Depreciation) | |
E-Mini S&P 500 Index | | | 14 | | | | March-2018 | | | | $1,873,200 | | | | $(8,603) | | | | $(8,603) | |
| | | | | | | | | | | | | | | | | | | | |
See accompanying Notes to Financial Statements which are an integral part of the financial statements.
Invesco V.I. Equally-Weighted S&P 500 Fund
Statement of Assets and Liabilities
December 31, 2017
Statement of Operations
For the year ended December 31, 2017
| | | | |
Assets: | | | | |
Investments in securities, at value (Cost $170,185,526)* | | $ | 242,469,472 | |
Investments in affiliates, at value (Cost $6,842,028) | | | 6,999,481 | |
Cash | | | 3,554 | |
Receivable for: | | | | |
Investments sold | | | 480,360 | |
Fund shares sold | | | 257,966 | |
Dividends | | | 308,067 | |
Investment for trustee deferred compensation and retirement plans | | | 35,009 | |
Total assets | | | 250,553,909 | |
| |
Liabilities: | | | | |
Other investments: | | | | |
Variation margin payable — futures contracts | | | 6,541 | |
Payable for: | | | | |
Investments purchased | | | 157,557 | |
Collateral upon return of securities loaned | | | 5,262,494 | |
Fund shares reacquired | | | 68,866 | |
Accrued fees to affiliates | | | 116,804 | |
Accrued trustees’ and officers’ fees and benefits | | | 672 | |
Accrued other operating expenses | | | 41,634 | |
Trustee deferred compensation and retirement plans | | | 37,300 | |
Total liabilities | | | 5,691,868 | |
Net assets applicable to shares outstanding | | $ | 244,862,041 | |
| |
Net assets consist of: | | | | |
Shares of beneficial interest | | $ | 166,147,292 | |
Undistributed net investment income | | | 2,888,900 | |
Undistributed net realized gain | | | 3,393,053 | |
Net unrealized appreciation | | | 72,432,796 | |
| | | $ | 244,862,041 | |
| |
Net Assets: | | | | |
Series I | | $ | 127,462,050 | |
Series II | | $ | 117,399,991 | |
|
Shares outstanding, no par value,
with an unlimited number of shares authorized: | |
Series I | | | 6,412,256 | |
Series II | | | 6,068,342 | |
Series I: | | | | |
Net asset value per share | | $ | 19.88 | |
Series II: | | | | |
Net asset value per share | | $ | 19.35 | |
| * | At December 31, 2017, securities with an aggregate value of $5,062,871 were on loan to brokers. |
| | | | |
Investment income: | | | | |
Dividends (net of foreign withholding taxes of $329) | | $ | 3,714,428 | |
Dividends from affiliates (includes securities lending income of $2,706) | | | 41,262 | |
Total investment income | | | 3,755,690 | |
| |
Expenses: | | | | |
Advisory fees | | | 240,373 | |
Administrative services fees | | | 213,095 | |
Custodian fees | | | 36,013 | |
Distribution fees — Series II | | | 202,830 | |
Transfer agent fees | | | 3,710 | |
Trustees’ and officers’ fees and benefits | | | 23,604 | |
Licensing Fees | | | 48,181 | |
Reports to shareholders | | | 24,414 | |
Professional services fees | | | 38,713 | |
Other | | | 10,223 | |
Total expenses | | | 841,156 | |
Less: Fees waived | | | (3,433 | ) |
Net expenses | | | 837,723 | |
Net investment income | | | 2,917,967 | |
| |
Realized and unrealized gain from: | | | | |
Net realized gain from: | | | | |
Investment securities | | | 3,998,345 | |
Futures contracts | | | 518,573 | |
| | | | 4,516,918 | |
Change in net unrealized appreciation of: | | | | |
Investment securities | | | 26,885,075 | |
Futures contracts | | | 17,879 | |
| | | | 26,902,954 | |
Net realized and unrealized gain | | | 31,419,872 | |
Net increase in net assets resulting from operations | | $ | 34,337,839 | |
See accompanying Notes to Financial Statements which are an integral part of the financial statements.
Invesco V.I. Equally-Weighted S&P 500 Fund
Statement of Changes in Net Assets
For the years ended December 31, 2017 and 2016
| | | | | | | | |
| | | 2017 | | | 2016 | |
Operations: | |
Net investment income | | $ | 2,917,967 | | | $ | 1,637,645 | |
Net realized gain | | | 4,516,918 | | | | 4,366,614 | |
Change in net unrealized appreciation | | | 26,902,954 | | | | 11,005,344 | |
Net increase in net assets resulting from operations | | | 34,337,839 | | | | 17,009,603 | |
|
Distributions to shareholders from net investment income: | |
Series I | | | (959,664 | ) | | | (658,672 | ) |
Series ll | | | (684,524 | ) | | | (175,080 | ) |
Total distributions from net investment income | | | (1,644,188 | ) | | | (833,752 | ) |
|
Distributions to shareholders from net realized gains: | |
Series l | | | (2,321,226 | ) | | | (4,417,395 | ) |
Series ll | | | (1,911,306 | ) | | | (1,836,209 | ) |
Total distributions from net realized gains | | | (4,232,532 | ) | | | (6,253,604 | ) |
|
Share transactions–net: | |
Series l | | | (3,857,449 | ) | | | 79,882,936 | |
Series ll | | | 57,119,964 | | | | 6,716,713 | |
Net increase in net assets resulting from share transactions | | | 53,262,515 | | | | 86,599,649 | |
Net increase in net assets | | | 81,723,634 | | | | 96,521,896 | |
|
Net assets: | |
Beginning of year | | | 163,138,407 | | | | 66,616,511 | |
End of year (includes undistributed net investment income of $2,888,900 and $1,611,575, respectively) | | $ | 244,862,041 | | | $ | 163,138,407 | |
Notes to Financial Statements
December 31, 2017
NOTE 1—Significant Accounting Policies
Invesco V.I. Equally-Weighted S&P 500 Fund (the “Fund”) is a series portfolio of AIM Variable Insurance Funds (Invesco Variable Insurance Funds) (the “Trust”). The Trust is a Delaware statutory trust registered under the Investment Company Act of 1940, as amended (the “1940 Act”), as an open-end series management investment company consisting of twenty-four separate portfolios, (each constituting a “Fund”). The assets, liabilities and operations of each portfolio are accounted for separately. Information presented in these financial statements pertains only to the Fund. Matters affecting each Fund or class will be voted on exclusively by the shareholders of such Fund or class. Current Securities and Exchange Commission (“SEC”) guidance, however, requires participating insurance companies offering separate accounts to vote shares proportionally in accordance with the instructions of the contract owners whose investments are funded by shares of each Fund or class.
The Fund’s investment objective is to achieve a high level of total return on its assets through a combination of capital appreciation and current income.
The Fund currently offers two classes of shares, Series I and Series II, both of which are offered to insurance company separate accounts funding variable annuity contracts and variable life insurance policies (“variable products”).
The Fund is an investment company and accordingly follows the investment company accounting and reporting guidance in accordance with Financial Accounting Standards Board Accounting Standards Codification Topic 946, Financial Services — Investment Companies.
The following is a summary of the significant accounting policies followed by the Fund in the preparation of its financial statements.
| A. | Security Valuations — Securities, including restricted securities, are valued according to the following policy. |
A security listed or traded on an exchange (except convertible securities) is valued at its last sales price or official closing price as of the close of the customary trading session on the exchange where the security is principally traded, or lacking any sales or official closing price on a particular day, the security may be valued at the closing bid price on that day. Securities traded in the over-the-counter market are valued based on prices furnished by independent pricing services or market makers. When such securities are valued by an independent pricing service they may be considered fair valued. Futures contracts are valued at the final settlement price set by an exchange on which they are principally traded. Listed options are valued at the mean between the last bid and asked prices from the exchange on which they are principally traded. Options not listed on an exchange are valued by an independent source at the mean between the last bid and asked prices. For purposes of determining net asset value (“NAV”) per share, futures and option contracts generally are valued 15 minutes after the close of the customary trading session of the New York Stock Exchange (“NYSE”).
Invesco V.I. Equally-Weighted S&P 500 Fund
Investments in open-end and closed-end registered investment companies that do not trade on an exchange are valued at the end-of-day net asset value per share. Investments in open-end and closed-end registered investment companies that trade on an exchange are valued at the last sales price or official closing price as of the close of the customary trading session on the exchange where the security is principally traded.
Debt obligations (including convertible securities) and unlisted equities are fair valued using an evaluated quote provided by an independent pricing service. Evaluated quotes provided by the pricing service may be determined without exclusive reliance on quoted prices, and may reflect appropriate factors such as institution-size trading in similar groups of securities, developments related to specific securities, dividend rate (for unlisted equities), yield (for debt obligations), quality, type of issue, coupon rate (for debt obligations), maturity (for debt obligations), individual trading characteristics and other market data. Pricing services generally value debt obligations assuming orderly transactions of institutional round lot size, but a fund may hold or transact in the same securities in smaller, odd lot sizes. Odd lots often trade at lower prices than institutional round lots. Debt obligations are subject to interest rate and credit risks. In addition, all debt obligations involve some risk of default with respect to interest and/or principal payments.
Foreign securities’ (including foreign exchange contracts) prices are converted into U.S. dollar amounts using the applicable exchange rates as of the close of the NYSE. If market quotations are available and reliable for foreign exchange-traded equity securities, the securities will be valued at the market quotations. Because trading hours for certain foreign securities end before the close of the NYSE, closing market quotations may become unreliable. If between the time trading ends on a particular security and the close of the customary trading session on the NYSE, events occur that the investment adviser determines are significant and make the closing price unreliable, the Fund may fair value the security. If the event is likely to have affected the closing price of the security, the security will be valued at fair value in good faith using procedures approved by the Board of Trustees. Adjustments to closing prices to reflect fair value may also be based on a screening process of an independent pricing service to indicate the degree of certainty, based on historical data, that the closing price in the principal market where a foreign security trades is not the current value as of the close of the NYSE. Foreign securities’ prices meeting the approved degree of certainty that the price is not reflective of current value will be priced at the indication of fair value from the independent pricing service. Multiple factors may be considered by the independent pricing service in determining adjustments to reflect fair value and may include information relating to sector indices, American Depositary Receipts and domestic and foreign index futures. Foreign securities may have additional risks including exchange rate changes, potential for sharply devalued currencies and high inflation, political and economic upheaval, the relative lack of issuer information, relatively low market liquidity and the potential lack of strict financial and accounting controls and standards.
Securities for which market prices are not provided by any of the above methods may be valued based upon quotes furnished by independent sources. The last bid price may be used to value equity securities. The mean between the last bid and asked prices is used to value debt obligations, including corporate loans.
Securities for which market quotations are not readily available or became unreliable are valued at fair value as determined in good faith by or under the supervision of the Trust’s officers following procedures approved by the Board of Trustees. Issuer specific events, market trends, bid/asked quotes of brokers and information providers and other market data may be reviewed in the course of making a good faith determination of a security’s fair value.
The Fund may invest in securities that are subject to interest rate risk, meaning the risk that the prices will generally fall as interest rates rise and, conversely, the prices will generally rise as interest rates fall. Specific securities differ in their sensitivity to changes in interest rates depending on their individual characteristics. Changes in interest rates may result in increased market volatility, which may affect the value and/or liquidity of certain Fund investments.
Valuations change in response to many factors including the historical and prospective earnings of the issuer, the value of the issuer’s assets, general economic conditions, interest rates, investor perceptions and market liquidity. Because of the inherent uncertainties of valuation, the values reflected in the financial statements may materially differ from the value received upon actual sale of those investments.
| B. | Securities Transactions and Investment Income — Securities transactions are accounted for on a trade date basis. Realized gains or losses on sales are computed on the basis of specific identification of the securities sold. Interest income (net of withholding tax, if any) is recorded on the accrual basis from settlement date. Dividend income (net of withholding tax, if any) is recorded on the ex-dividend date. |
The Fund may periodically participate in litigation related to Fund investments. As such, the Fund may receive proceeds from litigation settlements. Any proceeds received are included in the Statement of Operations as realized gain (loss) for investments no longer held and as unrealized gain (loss) for investments still held.
Brokerage commissions and mark ups are considered transaction costs and are recorded as an increase to the cost basis of securities purchased and/or a reduction of proceeds on a sale of securities. Such transaction costs are included in the determination of net realized and unrealized gain (loss) from investment securities reported in the Statement of Operations and the Statement of Changes in Net Assets and the net realized and unrealized gains (losses) on securities per share in the Financial Highlights. Transaction costs are included in the calculation of the Fund’s net asset value and, accordingly, they reduce the Fund’s total returns. These transaction costs are not considered operating expenses and are not reflected in net investment income reported in the Statement of Operations and the Statement of Changes in Net Assets, or the net investment income per share and the ratios of expenses and net investment income reported in the Financial Highlights, nor are they limited by any expense limitation arrangements between the Fund and the investment adviser.
The Fund allocates income and realized and unrealized capital gains and losses to a class based on the relative net assets of each class.
| C. | Country Determination — For the purposes of making investment selection decisions and presentation in the Schedule of Investments, the investment adviser may determine the country in which an issuer is located and/or credit risk exposure based on various factors. These factors include the laws of the country under which the issuer is organized, where the issuer maintains a principal office, the country in which the issuer derives 50% or more of its total revenues and the country that has the primary market for the issuer’s securities, as well as other criteria. Among the other criteria that may be evaluated for making this determination are the country in which the issuer maintains 50% or more of its assets, the type of security, financial guarantees and enhancements, the nature of the collateral and the sponsor organization. Country of issuer and/or credit risk exposure has been determined to be the United States of America, unless otherwise noted. |
| D. | Distributions — Distributions from net investment income and net realized capital gain, if any, are generally declared and paid to separate accounts of participating insurance companies annually and recorded on the ex-dividend date. |
Invesco V.I. Equally-Weighted S&P 500 Fund
| E. | Federal Income Taxes — The Fund intends to comply with the requirements of Subchapter M of the Internal Revenue Code of 1986, as amended (the “Internal Revenue Code”), necessary to qualify as a regulated investment company and to distribute substantially all of the Fund’s taxable earnings to shareholders. As such, the Fund will not be subject to federal income taxes on otherwise taxable income (including net realized capital gain) that is distributed to shareholders. Therefore, no provision for federal income taxes is recorded in the financial statements. |
The Fund recognizes the tax benefits of uncertain tax positions only when the position is more likely than not to be sustained. Management has analyzed the Fund’s uncertain tax positions and concluded that no liability for unrecognized tax benefits should be recorded related to uncertain tax positions. Management is not aware of any tax positions for which it is reasonably possible that the total amounts of unrecognized tax benefits will change materially in the next 12 months.
The Fund files tax returns in the U.S. Federal jurisdiction and certain other jurisdictions. Generally, the Fund is subject to examinations by such taxing authorities for up to three years after the filing of the return for the tax period.
| F. | Expenses — Fees provided for under the Rule 12b-1 plan of a particular class of the Fund and which are directly attributable to that class are charged to the operations of such class. All other expenses are allocated among the classes based on relative net assets. |
| G. | Accounting Estimates — The preparation of financial statements in conformity with accounting principles generally accepted in the United States of America (“GAAP”) requires management to make estimates and assumptions that affect the reported amounts of assets and liabilities at the date of the financial statements and the reported amounts of revenues and expenses during the reporting period including estimates and assumptions related to taxation. Actual results could differ from those estimates by a significant amount. In addition, the Fund monitors for material events or transactions that may occur or become known after the period-end date and before the date the financial statements are released to print. |
| H. | Indemnifications — Under the Trust’s organizational documents, each Trustee, officer, employee or other agent of the Trust is indemnified against certain liabilities that may arise out of the performance of their duties to the Fund. Additionally, in the normal course of business, the Fund enters into contracts, including the Fund’s servicing agreements, that contain a variety of indemnification clauses. The Fund’s maximum exposure under these arrangements is unknown as this would involve future claims that may be made against the Fund that have not yet occurred. The risk of material loss as a result of such indemnification claims is considered remote. |
| I. | Securities Lending — The Fund may lend portfolio securities having a market value up to one-third of the Fund’s total assets. Such loans are secured by collateral equal to no less than the market value of the loaned securities determined daily by the securities lending provider. Such collateral will be cash or debt securities issued or guaranteed by the U.S. Government or any of its sponsored agencies. Cash collateral received in connection with these loans is invested in short-term money market instruments or affiliated money market funds and is shown as such on the Schedule of Investments. The Fund bears the risk of loss with respect to the investment of collateral. It is the Fund’s policy to obtain additional collateral from or return excess collateral to the borrower by the end of the next business day, following the valuation date of the securities loaned. Therefore, the value of the collateral held may be temporarily less than the value of the securities on loan. When loaning securities, the Fund retains certain benefits of owning the securities, including the economic equivalent of dividends or interest generated by the security. Lending securities entails a risk of loss to the Fund if, and to the extent that, the market value of the securities loaned were to increase and the borrower did not increase the collateral accordingly, and the borrower failed to return the securities. The securities loaned are subject to termination at the option of the borrower or the Fund. Upon termination, the borrower will return to the Fund the securities loaned and the Fund will return the collateral. Upon the failure of the borrower to return the securities, collateral may be liquidated and the securities may be purchased on the open market to replace the loaned securities. The Fund could experience delays and costs in gaining access to the collateral and the securities may lose value during the delay which could result in potential losses to the Fund. Some of these losses may be indemnified by the lending agent. The Fund bears the risk of any deficiency in the amount of the collateral available for return to the borrower due to any loss on the collateral invested. Dividends received on cash collateral investments for securities lending transactions, which are net of compensation to counterparties, are included in Dividends from affiliated money market funds on the Statement of Operations. The aggregate value of securities out on loan, if any, is shown as a footnote on the Statement of Assets and Liabilities. |
| J. | Futures Contracts — The Fund may enter into futures contracts to manage exposure to interest rate, equity and market price movements and/or currency risks. A futures contract is an agreement between two parties (“Counterparties”) to purchase or sell a specified underlying security, currency or commodity (or delivery of a cash settlement price, in the case of an index future) for a fixed price at a future date. The Fund currently invests only in exchange-traded futures and they are standardized as to maturity date and underlying financial instrument. Initial margin deposits required upon entering into futures contracts are satisfied by the segregation of specific securities or cash as collateral at the futures commission merchant (broker). During the period the futures contracts are open, changes in the value of the contracts are recognized as unrealized gains or losses by recalculating the value of the contracts on a daily basis. Subsequent or variation margin payments are received or made depending upon whether unrealized gains or losses are incurred. These amounts are reflected as receivables or payables on the Statement of Assets and Liabilities. When the contracts are closed or expire, the Fund recognizes a realized gain or loss equal to the difference between the proceeds from, or cost of, the closing transaction and the Fund’s basis in the contract. The net realized gain (loss) and the change in unrealized gain (loss) on futures contracts held during the period is included on the Statement of Operations. The primary risks associated with futures contracts are market risk and the absence of a liquid secondary market. If the Fund were unable to liquidate a futures contract and/or enter into an offsetting closing transaction, the Fund would continue to be subject to market risk with respect to the value of the contracts and continue to be required to maintain the margin deposits on the futures contracts. Futures contracts have minimal Counterparty risk since the exchange’s clearinghouse, as Counterparty to all exchange-traded futures, guarantees the futures against default. Risks may exceed amounts recognized in the Statement of Assets and Liabilities. |
| K. | Collateral — To the extent the Fund has designated or segregated a security as collateral and that security is subsequently sold, it is the Fund’s practice to replace such collateral no later than the next business day. |
Invesco V.I. Equally-Weighted S&P 500 Fund
NOTE 2—Advisory Fees and Other Fees Paid to Affiliates
The Trust has entered into a master investment advisory agreement with Invesco Advisers, Inc. (the “Adviser” or “Invesco”). Under the terms of the investment advisory agreement, the Fund accrues daily and pays monthly an advisory fee to the Adviser based on the annual rate of the Fund’s average daily net assets as follows:
| | | | |
| Average Daily Net Assets | | Rate | |
First $2 billion | | | 0.12% | |
Over $2 billion | | | 0.10% | |
For the year ended December 31, 2017, the effective advisory fees incurred by the Fund was 0.12%.
Under the terms of a master sub-advisory agreement between the Adviser and each of Invesco Asset Management Deutschland GmbH, Invesco Asset Management Limited, Invesco Asset Management (Japan) Limited, Invesco Hong Kong Limited, Invesco Senior Secured Management, Inc. and Invesco Canada Ltd. and separate sub-advisory agreements with Invesco PowerShares Capital Management LLC and Invesco Asset Management (India) Private Limited (collectively, the “Affiliated Sub-Advisers”) the Adviser, not the Fund, will pay 40% of the fees paid to the Adviser to any such Affiliated Sub-Adviser(s) that provide(s) discretionary investment management services to the Fund based on the percentage of assets allocated to such Affiliated Sub-Adviser(s).
The Adviser has contractually agreed, through at least June 30, 2018, to waive advisory fees and/or reimburse expenses of all shares to the extent necessary to limit total annual fund operating expenses after fee waiver and/or expense reimbursement (excluding certain items discussed below) of Series I shares to 2.00% and Series II shares to 2.25% of average daily net assets (the “expense limits”). In determining the Adviser’s obligation to waive advisory fees and/or reimburse expenses, the following expenses are not taken into account, and could cause the total annual fund operating expenses after fee waiver and/or expense reimbursement to exceed the numbers reflected above: (1) interest; (2) taxes; (3) dividend expense on short sales; (4) extraordinary or non-routine items, including litigation expenses; and (5) expenses that the Fund has incurred but did not actually pay because of an expense offset arrangement. Unless Invesco continues the fee waiver agreement, it will terminate on June 30, 2018. During its term, the fee waiver agreement cannot be terminated or amended to increase the expense limits or reduce the advisory fee waiver without approval of the Board of Trustees. The Adviser did not waive fees and/or reimburse expenses during the period under these expense limits.
Further, the Adviser has contractually agreed, through at least June 30, 2019, to waive the advisory fee payable by the Fund in an amount equal to 100% of the net advisory fees the Adviser receives from the affiliated money market funds on investments by the Fund of uninvested cash in such affiliated money market funds.
For the year ended December 31, 2017, the Adviser waived advisory fees of $3,433.
The Trust has entered into a master administrative services agreement with Invesco pursuant to which the Fund has agreed to pay Invesco a fee for costs incurred in providing accounting services and fund administrative services to the Fund and to reimburse Invesco for fees paid to insurance companies that have agreed to provide certain administrative services to the Fund. These administrative services provided by the insurance companies may include, among other things: maintenance of master accounts with the Fund; tracking, recording and transmitting net purchase and redemption orders for Fund shares; maintaining and preserving records related to the purchase, redemption and other account activity of variable product owners; distributing copies of Fund documents such as prospectuses, proxy materials and periodic reports, to variable product owners, and responding to inquiries from variable product owners about the Fund. Pursuant to such agreement, for the year ended December 31, 2017, Invesco was paid $50,000 for accounting and fund administrative services and was reimbursed $163,095 for fees paid to insurance companies.
The Trust has entered into a transfer agency and service agreement with Invesco Investment Services, Inc. (“IIS”) pursuant to which the Fund has agreed to pay IIS a fee for providing transfer agency and shareholder services to the Fund and reimburse IIS for certain expenses incurred by IIS in the course of providing such services. For the year ended December 31, 2017, expenses incurred under the agreement are shown in the Statement of Operations as Transfer agent fees.
The Trust has entered into a master distribution agreement with Invesco Distributors, Inc. (“IDI”) to serve as the distributor for the Fund. The Trust has adopted a plan pursuant to Rule 12b-1 under the 1940 Act with respect to the Fund’s Series II shares (the “Plan”). The Fund, pursuant to the Plan, pays IDI compensation at the annual rate of 0.25% of the Fund’s average daily net assets of Series II shares. The fees are accrued daily and paid monthly. Of the Plan payments, up to 0.25% of the average daily net assets of the Series II shares may be paid to insurance companies who furnish continuing personal shareholder services to customers who purchase and own Series II shares of the Fund. For the year ended December 31, 2017, expenses incurred under the Plan are detailed in the Statement of Operations as Distribution fees.
Certain officers and trustees of the Trust are officers and directors of the Adviser, IIS and/or IDI.
NOTE 3—Additional Valuation Information
GAAP defines fair value as the price that would be received to sell an asset or paid to transfer a liability in an orderly transaction between market participants at the measurement date, under current market conditions. GAAP establishes a hierarchy that prioritizes the inputs to valuation methods, giving the highest priority to readily available unadjusted quoted prices in an active market for identical assets (Level 1) and the lowest priority to significant unobservable inputs (Level 3), generally when market prices are not readily available or are unreliable. Based on the valuation inputs, the securities or other investments are tiered into one of three levels. Changes in valuation methods may result in transfers in or out of an investment’s assigned level:
| | Level 1 — | Prices are determined using quoted prices in an active market for identical assets. |
| | Level 2 — | Prices are determined using other significant observable inputs. Observable inputs are inputs that other market participants may use in pricing a security. These may include quoted prices for similar securities, interest rates, prepayment speeds, credit risk, yield curves, loss severities, default rates, discount rates, volatilities and others. |
| | Level 3 — | Prices are determined using significant unobservable inputs. In situations where quoted prices or observable inputs are unavailable (for example, when there is little or no market activity for an investment at the end of the period), unobservable inputs may be used. Unobservable inputs reflect the Fund’s own assumptions about the factors market participants would use in determining fair value of the securities or instruments and would be based on the best available information. |
Invesco V.I. Equally-Weighted S&P 500 Fund
The following is a summary of the tiered valuation input levels, as of December 31, 2017. The level assigned to the securities valuations may not be an indication of the risk or liquidity associated with investing in those securities. Because of the inherent uncertainties of valuation, the values reflected in the financial statements may materially differ from the value received upon actual sale of those investments.
The Fund’s policy is to recognize transfers in and out of the valuation levels as of the end of the reporting period. During the year ended December 31, 2017, there were no material transfers between valuation levels.
| | | | | | | | | | | | | | | | |
| | | Level 1 | | | Level 2 | | | Level 3 | | | Total | |
Investments in Securities | | | | | | | | | | | | | | | | |
Common Stocks & Other Equity Interests | | $ | 242,937,147 | | | $ | — | | | $ | — | | | $ | 242,937,147 | |
Money Market Funds | | | 6,531,806 | | | | — | | | | — | | | | 6,531,806 | |
Total Investments in Securities | | | 249,468,953 | | | | — | | | | — | | | | 249,468,953 | |
Other Investments — Liabilities | | | | | | | | | | | | | | | | |
Futures Contracts* | | | (8,603 | ) | | | — | | | | — | | | | (8,603 | ) |
Total Investments | | $ | 249,460,350 | | | $ | — | | | $ | — | | | $ | 249,460,350 | |
| * | Unrealized appreciation (depreciation). |
NOTE 4—Derivative Investments
The Fund may enter into an International Swaps and Derivatives Association Master Agreement (“ISDA Master Agreement”) under which a fund may trade OTC derivatives. An OTC transaction entered into under an ISDA Master Agreement typically involves a collateral posting arrangement, payment netting provisions and close-out netting provisions. These netting provisions allow for reduction of credit risk through netting of contractual obligations. The enforceability of the netting provisions of the ISDA Master Agreement depends on the governing law of the ISDA Master Agreement, among other factors.
For financial reporting purposes, the Fund does not offset OTC derivative assets or liabilities that are subject to ISDA Master Agreements in the Statement of Assets and Liabilities.
Value of Derivative Investments at Period-End
The table below summarizes the value of the Fund’s derivative investments, detailed by primary risk exposure, held as of December 31, 2017:
| | | | |
| | | Value | |
| Derivative Liabilities | | Equity Risk | |
Unrealized depreciation on futures contracts — Exchange-Traded(a) | | $ | (8,603 | ) |
Derivatives not subject to master netting agreements | | | 8,603 | |
Total Derivative Liabilities subject to master netting agreements | | $ | — | |
| (a) | Only current day’s variation margin receivable (payable) is reported within the Statement of Assets and Liabilities. |
Effect of Derivative Investments for the year ended December 31, 2017
The table below summarizes the gains (losses) on derivative investments, detailed by primary risk exposure, recognized in earnings during the period:
| | | | |
| | | Location of Gain on
Statement of Operations | |
| | Equity Risk | |
Realized Gain: | | | | |
Futures contracts | | $ | 518,573 | |
Change in Net Unrealized Appreciation: | | | | |
Futures contracts | | | 17,879 | |
Total | | $ | 536,452 | |
The table below summarizes the average notional value of futures contracts outstanding during the period.
| | | | |
| | | Futures
Contracts | |
Average notional value | | $ | 2,204,807 | |
NOTE 5—Investments in Affiliates
The Fund’s Adviser is a subsidiary of Invesco Ltd. and therefore, Invesco Ltd. is considered to be affiliated with the Fund. The following is a summary of the transactions in, and earnings from, investments in Invesco Ltd. for the year ended December 31, 2017.
| | | | | | | | | | | | | | | | | | | | | | | | | | | | |
| | | Value
12/31/16 | | | Purchases
at Cost | | | Proceeds
from Sales | | | Change in
Unrealized
Appreciation | | | Realized
Gain | | | Value
12/31/17 | | | Dividend
Income | |
Invesco Ltd. | | $ | 304,523 | | | $ | 153,623 | | | $ | (65,905 | ) | | $ | 73,529 | | | $ | 1,905 | | | $ | 467,675 | | | $ | 13,567 | |
Invesco V.I. Equally-Weighted S&P 500 Fund
NOTE 6—Trustees’ and Officers’ Fees and Benefits
Trustees’ and Officers’ Fees and Benefits include amounts accrued by the Fund to pay remuneration to certain Trustees and Officers of the Fund. Trustees have the option to defer compensation payable by the Fund, and Trustees’ and Officers’ Fees and Benefits also include amounts accrued by the Fund to fund such deferred compensation amounts. Those Trustees who defer compensation have the option to select various Invesco Funds in which their deferral accounts shall be deemed to be invested. Finally, certain current Trustees were eligible to participate in a retirement plan that provided for benefits to be paid upon retirement to Trustees over a period of time based on the number of years of service. The Fund may have certain former Trustees who also participate in a retirement plan and receive benefits under such plan. Trustees’ and Officers’ Fees and Benefits include amounts accrued by the Fund to fund such retirement benefits. Obligations under the deferred compensation and retirement plans represent unsecured claims against the general assets of the Fund.
NOTE 7—Cash Balances
The Fund is permitted to temporarily carry a negative or overdrawn balance in its account with State Street Bank and Trust Company, the custodian bank. Such balances, if any at period-end, are shown in the Statement of Assets and Liabilities under the payable caption Amount due custodian. To compensate the custodian bank for such overdrafts, the overdrawn Fund may either (1) leave funds as a compensating balance in the account so the custodian bank can be compensated by earning the additional interest; or (2) compensate by paying the custodian bank at a rate agreed upon by the custodian bank and Invesco, not to exceed the contractually agreed upon rate.
NOTE 8—Distributions to Shareholders and Tax Components of Net Assets
Tax Character of Distributions to Shareholders Paid During the Fiscal Years Ended December 31, 2017 and 2016:
| | | | | | | | |
| | | 2017 | | | 2016 | |
Ordinary income | | $ | 3,672,562 | | | $ | 985,991 | |
Long-term capital gain | | | 2,204,158 | | | | 6,101,365 | |
Total distributions | | $ | 5,876,720 | | | $ | 7,087,356 | |
Tax Components of Net Assets at Period-End:
| | | | |
| | | 2017 | |
Undistributed ordinary income | | $ | 5,388,610 | |
Undistributed long-term gain | | | 2,375,868 | |
Net unrealized appreciation — investments | | | 70,980,799 | |
Temporary book/tax differences | | | (30,528 | ) |
Shares of beneficial interest | | | 166,147,292 | |
Total net assets | | $ | 244,862,041 | |
The difference between book-basis and tax-basis unrealized appreciation (depreciation) is due to differences in the timing of recognition of gains and losses on investments for tax and book purposes. The Fund’s net unrealized appreciation difference is attributable primarily to wash sales.
The temporary book/tax differences are a result of timing differences between book and tax recognition of income and/or expenses. The Fund’s temporary book/tax differences are the result of the trustee deferral of compensation and retirement plan benefits.
Capital loss carryforward is calculated and reported as of a specific date. Results of transactions and other activity after that date may affect the amount of capital loss carryforward actually available for the Fund to utilize. Capital losses generated in years beginning after December 22, 2010 can be carried forward for an unlimited period, whereas previous losses expire in eight tax years. Capital losses with an expiration period may not be used to offset capital gains until all net capital losses without an expiration date have been utilized. Capital loss carryforwards with no expiration date will retain their character as either short-term or long-term capital losses instead of as short-term capital losses as under prior law. The ability to utilize capital loss carryforwards in the future may be limited under the Internal Revenue Code and related regulations based on the results of future transactions.
The Fund does not have a capital loss carryforward as of December 31, 2017.
NOTE 9—Investment Transactions
The aggregate amount of investment securities (other than short-term securities, U.S. Treasury obligations and money market funds, if any) purchased and sold by the Fund during the year ended December 31, 2017 was $94,637,723 and $43,555,555, respectively. Cost of investments, including any derivatives, on a tax basis includes the adjustments for financial reporting purposes as of the most recently completed federal income tax reporting period-end.
| | | | |
| Unrealized Appreciation (Depreciation) of Investments on a Tax Basis | |
Aggregate unrealized appreciation of investments | | $ | 74,132,361 | |
Aggregate unrealized (depreciation) of investments | | | (3,151,562 | ) |
Net unrealized appreciation of investments | | $ | 70,980,799 | |
Cost of investments for tax purposes is $178,479,551.
Invesco V.I. Equally-Weighted S&P 500 Fund
NOTE 10—Reclassification of Permanent Differences
Primarily as a result of differing book/tax treatment of return of capital, on December 31, 2017, undistributed net investment income was increased by $3,546, and shares of beneficial interest was decreased by $3,546. This reclassification had no effect on the net assets of the Fund.
NOTE 11—Share Information
| | | | | | | | | | | | | | | | |
| | | Summary of Share Activity | |
| | | Years ended December 31, | |
| | | 2017(a) | | | 2016 | |
| | | Shares | | | Amount | | | Shares | | | Amount | |
Sold: | | | | | | | | | | | | | | | | |
Series I | | | 441,919 | | | $ | 8,277,046 | | | | 5,223,200 | | | $ | 86,064,568 | |
Series II | | | 3,562,087 | | | | 64,459,112 | | | | 812,311 | | | | 13,189,348 | |
| | | | |
Issued as reinvestment of dividends: | | | | | | | | | | | | | | | | |
Series I | | | 177,345 | | | | 3,280,890 | | | | 305,052 | | | | 5,076,067 | |
Series II | | | 144,133 | | | | 2,595,830 | | | | 123,848 | | | | 2,011,289 | |
| | | | |
Reacquired: | | | | | | | | | | | | | | | | |
Series I | | | (830,573 | ) | | | (15,415,385 | ) | | | (674,054 | ) | | | (11,257,699 | ) |
Series II | | | (547,921 | ) | | | (9,934,978 | ) | | | (529,053 | ) | | | (8,483,924 | ) |
Net increase in share activity | | | 2,946,990 | | | $ | 53,262,515 | | | | 5,261,304 | | | $ | 86,599,649 | |
| (a) | There are entities that are record owners of more than 5% of the outstanding shares of the Fund and in the aggregate own 92% of the outstanding shares of the Fund. The Fund and the Fund’s principal underwriter or adviser, are parties to participation agreements with these entities whereby these entities sell units of interest in separate accounts funding variable products that are invested in the Fund. The Fund, Invesco and/or Invesco affiliates may make payments to these entities, which are considered to be related to the Fund, for providing services to the Fund, Invesco and/or Invesco affiliates including but not limited to services such as, securities brokerage, third party record keeping and account servicing and administrative services. The Fund has no knowledge as to whether all or any portion of the shares owned of record by these entities are also owned beneficially. |
NOTE 12—Financial Highlights
The following schedule presents financial highlights for a share of the Fund outstanding throughout the periods indicated.
| | | | | | | | | | | | | | | | | | | | | | | | | | | | | | | | | | | | | | | | | | | | | | | | | | | | | | | | |
| | | Net asset
value,
beginning
of period | | | Net
investment
income(a) | | | Net gains
(losses)
on securities
(both
realized and
unrealized) | | | Total from
investment
operations | | | Dividends
from net
investment
income | | | Distributions
from net
realized
gains | | | Total
distributions | | | Net asset
value, end
of period | | | Total
return(b) | | | Net assets,
end of period
(000’s omitted) | | | Ratio of
expenses
to average net assets
with fee waivers
and/or expenses
absorbed | | | Ratio of
expenses
to average net
assets without
fee waivers
and/or expenses
absorbed | | | Ratio of net
investment
income to average
net assets | | | Portfolio
turnover(c) | |
Series I | | | | | | | | | | | | | | | | | | | | | | | | | | | | | | | | | | | | | | | | | | | | | | | | | | | | | | | | |
Year ended 12/31/17 | | $ | 17.24 | | | $ | 0.29 | | | $ | 2.87 | | | $ | 3.16 | | | $ | (0.15 | ) | | $ | (0.37 | ) | | $ | (0.52 | ) | | $ | 19.88 | | | | 18.58 | % | | $ | 127,462 | | | | 0.32 | %(d) | | | 0.32 | %(d) | | | 1.55 | %(d) | | | 22 | % |
Year ended 12/31/16 | | | 15.81 | | | | 0.26 | | | | 1.96 | | | | 2.22 | | | | (0.10 | ) | | | (0.69 | ) | | | (0.79 | ) | | | 17.24 | | | | 14.24 | | | | 114,202 | | | | 0.39 | | | | 0.39 | | | | 1.56 | | | | 22 | |
Year ended 12/31/15 | | | 19.98 | | | | 0.26 | | | | (0.94 | ) | | | (0.68 | ) | | | (0.28 | ) | | | (3.21 | ) | | | (3.49 | ) | | | 15.81 | | | | (2.68 | ) | | | 27,974 | | | | 0.55 | | | | 0.55 | | | | 1.38 | | | | 25 | |
Year ended 12/31/14 | | | 21.18 | | | | 0.29 | | | | 2.41 | | | | 2.70 | | | | (0.33 | ) | | | (3.57 | ) | | | (3.90 | ) | | | 19.98 | | | | 13.88 | | | | 33,878 | | | | 0.59 | | | | 0.59 | | | | 1.34 | | | | 18 | |
Year ended 12/31/13 | | | 18.23 | | | | 0.24 | | | | 5.94 | | | | 6.18 | | | | (0.38 | ) | | | (2.85 | ) | | | (3.23 | ) | | | 21.18 | | | | 35.42 | | | | 38,144 | | | | 0.59 | | | | 0.59 | | | | 1.16 | | | | 18 | |
Series II | | | | | | | | | | | | | | | | | | | | | | | | | | | | | | | | | | | | | | | | | | | | | | | | | | | | | | | | |
Year ended 12/31/17 | | | 16.82 | | | | 0.24 | | | | 2.79 | | | | 3.03 | | | | (0.13 | ) | | | (0.37 | ) | | | (0.50 | ) | | | 19.35 | | | | 18.26 | | | | 117,400 | | | | 0.57 | (d) | | | 0.57 | (d) | | | 1.30 | (d) | | | 22 | |
Year ended 12/31/16 | | | 15.44 | | | | 0.21 | | | | 1.93 | | | | 2.14 | | | | (0.07 | ) | | | (0.69 | ) | | | (0.76 | ) | | | 16.82 | | | | 14.01 | | | | 48,936 | | | | 0.64 | | | | 0.64 | | | | 1.31 | | | | 22 | |
Year ended 12/31/15 | | | 19.60 | | | | 0.21 | | | | (0.92 | ) | | | (0.71 | ) | | | (0.24 | ) | | | (3.21 | ) | | | (3.45 | ) | | | 15.44 | | | | (2.92 | ) | | | 38,643 | | | | 0.80 | | | | 0.80 | | | | 1.13 | | | | 25 | |
Year ended 12/31/14 | | | 20.84 | | | | 0.23 | | | | 2.37 | | | | 2.60 | | | | (0.27 | ) | | | (3.57 | ) | | | (3.84 | ) | | | 19.60 | | | | 13.61 | | | | 37,205 | | | | 0.84 | | | | 0.84 | | | | 1.09 | | | | 18 | |
Year ended 12/31/13 | | | 17.98 | | | | 0.19 | | | | 5.84 | | | | 6.03 | | | | (0.32 | ) | | | (2.85 | ) | | | (3.17 | ) | | | 20.84 | | | | 35.04 | | | | 38,860 | | | | 0.84 | | | | 0.84 | | | | 0.91 | | | | 18 | |
| (a) | Calculated using average shares outstanding. |
| (b) | Includes adjustments in accordance with accounting principles generally accepted in the United States of America and as such, the net asset value for financial reporting purposes and the returns based upon those net asset values may differ from the net asset value and returns for shareholder transactions. Total returns are not annualized for periods less than one year, if applicable, and do not reflect charges assessed in connection with a variable product, which if included would reduce total returns. |
| (c) | Portfolio turnover is calculated at the fund level and is not annualized for periods less than one year, if applicable. |
| (d) | Ratios are based on average daily net assets (000’s omitted) of $119,179 and $81,132 for Series I and Series II shares, respectively. |
Invesco V.I. Equally-Weighted S&P 500 Fund
Report of Independent Registered Public Accounting Firm
To the Board of Trustees of AIM Variable Insurance Funds (Invesco Variable Insurance Funds) and Shareholders of Invesco V.I. Equally-Weighted S&P 500 Fund
Opinion on the Financial Statements
We have audited the accompanying statement of assets and liabilities, including the schedule of investments, of Invesco V.I. Equally-Weighted S&P 500 Fund (one of the funds constituting AIM Variable Insurance Funds (Invesco Variable Insurance Funds), hereafter referred to as the “Fund”) as of December 31, 2017, the related statement of operations for the year ended December 31, 2017, the statement of changes in net assets for each of the two years in the period ended December 31, 2017, including the related notes, and the financial highlights for each of the five years in the period ended December 31, 2017 (collectively referred to as the “financial statements”). In our opinion, the financial statements present fairly, in all material respects, the financial position of the Fund as of December 31, 2017, the results of its operations for the year then ended, the changes in its net assets for each of the two years in the period ended December 31, 2017 and the financial highlights for each of the five years in the period ended December 31, 2017 in conformity with accounting principles generally accepted in the United States of America.
Basis for Opinion
These financial statements are the responsibility of the Fund’s management. Our responsibility is to express an opinion on the Fund’s financial statements based on our audits. We are a public accounting firm registered with the Public Company Accounting Oversight Board (United States) (“PCAOB”) and are required to be independent with respect to the Fund in accordance with the U.S. federal securities laws and the applicable rules and regulations of the Securities and Exchange Commission and the PCAOB.
We conducted our audits of these financial statements in accordance with the standards of the PCAOB. Those standards require that we plan and perform the audit to obtain reasonable assurance about whether the financial statements are free of material misstatement, whether due to error or fraud.
Our audits included performing procedures to assess the risks of material misstatement of the financial statements, whether due to error or fraud, and performing procedures that respond to those risks. Such procedures included examining, on a test basis, evidence regarding the amounts and disclosures in the financial statements. Our audits also included evaluating the accounting principles used and significant estimates made by management, as well as evaluating the overall presentation of the financial statements. Our procedures included confirmation of securities owned as of December 31, 2017 by correspondence with the custodian, transfer agent and brokers; when replies were not received from brokers, we performed other auditing procedures. We believe that our audits provide a reasonable basis for our opinion.
PricewaterhouseCoopers LLP
Houston, TX
February 14, 2018
We have served as the auditor of one or more of the investment companies in the Invesco/PowerShares group of investment companies since at least 1995. We have not determined the specific year we began serving as auditor.
Invesco V.I. Equally-Weighted S&P 500 Fund
Calculating your ongoing Fund expenses
Example
As a shareholder of the Fund, you incur ongoing costs, including management fees; distribution and/or service fees (12b-1); and other Fund expenses. This example is intended to help you understand your ongoing costs (in dollars) of investing in the Fund and to compare these costs with ongoing costs of investing in other mutual funds. The example is based on an investment of $1,000 invested at the beginning of the period and held for the entire period July 1, 2017 through December 31, 2017.
The actual and hypothetical expenses in the examples below do not represent the effect of any fees or other expenses assessed in connection with a variable product; if they did, the expenses shown would be higher while the ending account values shown would be lower.
Actual expenses
The table below provides information about actual account values and actual expenses. You may use the information in this table, together with the amount you invested, to estimate the expenses that you paid over the period. Simply divide your account value by $1,000 (for example, an $8,600 account value divided by $1,000 = 8.6), then multiply the result by the number in the table under the heading entitled “Actual Expenses Paid During Period” to estimate the expenses you paid on your account during this period.
Hypothetical example for comparison purposes
The table below also provides information about hypothetical account values and hypothetical expenses based on the Fund’s actual expense ratio and an assumed rate of return of 5% per year before expenses, which is not the Fund’s actual return.
The hypothetical account values and expenses may not be used to estimate the actual ending account balance or expenses you paid for the period. You may use this information to compare the ongoing costs of investing in the Fund and other funds. To do so, compare this 5% hypothetical example with the 5% hypothetical examples that appear in the shareholder reports of the other funds.
Please note that the expenses shown in the table are meant to highlight your ongoing costs. Therefore, the hypothetical information is useful in comparing ongoing costs, and will not help you determine the relative total costs of owning different funds.
| | | | | | | | | | | | | | | | | | | | | | | | |
| | | | | | ACTUAL | | | HYPOTHETICAL (5% annual return before
expenses) | | | | |
| Class | | Beginning
Account Value
(07/01/17) | | | Ending
Account Value
(12/31/17)1 | | | Expenses
Paid During
Period2 | | | Ending Account Value
(12/31/17) | | | Expenses
Paid During
Period2 | | | Annualized
Expense Ratio | |
Series I | | $ | 1,000.00 | | | $ | 1,098.50 | | | $ | 1.59 | | | $ | 1,023.69 | | | $ | 1.53 | | | | 0.30 | % |
Series II | | | 1,000.00 | | | | 1,097.70 | | | | 2.91 | | | | 1,022.43 | | | | 2.80 | | | | 0.55 | |
| 1 | The actual ending account value is based on the actual total return of the Fund for the period July 1, 2017 through December 31, 2017, after actual expenses and will differ from the hypothetical ending account value which is based on the Fund’s expense ratio and a hypothetical annual return of 5% before expenses. |
| 2 | Expenses are equal to the Fund’s annualized expense ratio as indicated above multiplied by the average account value over the period, multiplied by 184/365 to reflect the most recent fiscal half year. |
Invesco V.I. Equally-Weighted S&P 500 Fund
Tax Information
Form 1099-DIV, Form 1042-S and other year-end tax information provide shareholders with actual calendar year amounts that should be included in their tax returns. Shareholders should consult their tax advisors.
The following distribution information is being provided as required by the Internal Revenue Code or to meet a specific state’s requirement.
The Fund designates the following amounts or, if subsequently determined to be different, the maximum amount allowable for its fiscal year ended December 31, 2017:
| | | | |
Federal and State Income Tax | |
Long-Term Capital Gain Distributions | | $ | 2,204,158 | |
Corporate Dividends Received Deduction* | | | 47.11 | % |
U.S. Treasury Obligations* | | | 0.00 | % |
| | * | The above percentages are based on ordinary income dividends paid to shareholders during the Fund’s fiscal year. |
Invesco V.I. Equally-Weighted S&P 500 Fund
Trustees and Officers
The address of each trustee and officer is AIM Variable Insurance Funds (Invesco Variable Insurance Funds) (the “Trust”), 11 Greenway Plaza, Suite 1000, Houston, Texas 77046-1173. The trustees serve for the life of the Trust, subject to their earlier death, incapacitation, resignation, retirement or removal as more specifically provided in the Trust’s organizational documents. Each officer serves for a one year term or until their successors are elected and qualified. Column two below includes length of time served with predecessor entities, if any.
| | | | | | | | |
Name, Year of Birth and
Position(s) Held with the Trust | | Trustee and/
or Officer Since | | Principal Occupation(s)
During Past 5 Years | | Number of
Funds in Fund
Complex
Overseen by
Trustee | | Other Directorship(s)
Held by Trustee During
Past 5 Years |
| Interested Persons | | | | | | | | |
Martin L. Flanagan1 — 1960 Trustee | | 2007 | | Executive Director, Chief Executive Officer and President, Invesco Ltd. (ultimate parent of Invesco and a global investment management firm); Trustee, The Invesco Funds; Vice Chair, Investment Company Institute; and Member of Executive Board, SMU Cox School of Business Formerly: Advisor to the Board, Invesco Advisers, Inc. (formerly known as Invesco Institutional (N.A.), Inc.); Chairman and Chief Executive Officer, Invesco Advisers, Inc. (registered investment adviser); Director, Chairman, Chief Executive Officer and President, Invesco Holding Company (US), Inc. (formerly IVZ Inc.) (holding company), Invesco Group Services, Inc. (service provider) and Invesco North American Holdings, Inc. (holding company); Director, Chief Executive Officer and President, Invesco Holding Company Limited (parent of Invesco and a global investment management firm); Director, Invesco Ltd.; Chairman, Investment Company Institute and President, Co-Chief Executive Officer, Co-President, Chief Operating Officer and Chief Financial Officer, Franklin Resources, Inc. (global investment management organization) | | 158 | | None |
Philip A. Taylor2 — 1954 Trustee and Senior Vice President | | 2006 | | Head of the Americas and Senior Managing Director, Invesco Ltd.; Director, Invesco Advisers, Inc. (formerly known as Invesco Institutional (N.A.), Inc.) (registered investment adviser); Director, Chairman, Chief Executive Officer and President, Invesco Management Group, Inc. (formerly known as Invesco Aim Management Group, Inc.) (financial services holding company); Director and Chairman, Invesco Investment Services, Inc. (formerly known as Invesco Aim Investment Services, Inc.) (registered transfer agent); Chief Executive Officer, Invesco Corporate Class Inc. (corporate mutual fund company); Director, Chairman and Chief Executive Officer, Invesco Canada Ltd. (formerly known as Invesco Trimark Ltd./Invesco Trimark Ltèe) (registered investment adviser and registered transfer agent); Trustee and Senior Vice President, The Invesco Funds; Director, Invesco Investment Advisers LLC (formerly known as Van Kampen Asset Management). Formerly: Co-Chairman, Co-President and Co-Chief Executive Officer, Invesco Advisers, Inc. (formerly known as Invesco Institutional (N.A.), Inc.) (registered investment adviser); Director, Chief Executive Officer and President, Van Kampen Exchange Corp; President and Principal Executive Officer, The Invesco Funds (other than AIM Treasurer’s Series Trust (Invesco Treasurer’s Series Trust), Short-Term Investments Trust and Invesco Management Trust); Executive Vice President, The Invesco Funds (AIM Treasurer’s Series Trust (Invesco Treasurer’s Series Trust), Short-Term Investments Trust and Invesco Management Trust only); Director and President, INVESCO Funds Group, Inc. (registered investment adviser and registered transfer agent); Director and Chairman, IVZ Distributors, Inc. (formerly known as INVESCO Distributors, Inc.) (registered broker dealer); Director, President and Chairman, Invesco Inc. (holding company), Invesco Canada Holdings Inc. (holding company), Trimark Investments Ltd./Placements Trimark Ltèe and Invesco Financial Services Ltd/Services Financiers Invesco Ltèe; Chief Executive Officer, Invesco Canada Fund Inc. (corporate mutual fund company); Director and Chairman, Van Kampen Investor Services Inc.; Director, Chief Executive Officer and President, 1371 Preferred Inc. (holding company) and Van Kampen Investments Inc.; Director and President, AIM GP Canada Inc. (general partner for limited partnerships) and Van Kampen Advisors, Inc.; Director and Chief Executive Officer, Invesco Trimark Dealer Inc. (registered broker dealer); Director, Invesco Distributors, Inc. (formerly known as Invesco Aim Distributors, Inc.) (registered broker dealer); Manager, Invesco PowerShares Capital Management LLC; Director, Chief Executive Officer and President, Invesco Advisers, Inc.; Director, Chairman, Chief Executive Officer and President, Invesco Aim Capital Management, Inc.; President, Invesco Trimark Dealer Inc. and Invesco Trimark Ltd./Invesco Trimark Ltèe; Director and President, AIM Trimark Corporate Class Inc. and AIM Trimark Canada Fund Inc.; Senior Managing Director, Invesco Holding Company Limited; Director and Chairman, Fund Management Company (former registered broker dealer); President and Principal Executive Officer, The Invesco Funds (AIM Treasurer’s Series Trust (Invesco Treasurer’s Series Trust), and Short-Term Investments Trust only); President, AIM Trimark Global Fund Inc. and AIM Trimark Canada Fund Inc. | | 158 | | None |
| 1 | Mr. Flanagan is considered an interested person (within the meaning of Section 2(a)(19) of the 1940 Act) of the Trust because he is an officer of the Adviser to the Trust, and an officer and a director of Invesco Ltd., ultimate parent of the Adviser. |
| 2 | Mr. Taylor is considered an interested person (within the meaning of Section 2(a)(19) of the 1940 Act) of the Trust because he is an officer and a director of the Adviser. |
Invesco V.I. Equally-Weighted S&P 500 Fund
Trustees and Officers—(continued)
| | | | | | | | |
Name, Year of Birth and
Position(s) Held with the Trust | | Trustee and/
or Officer Since | | Principal Occupation(s)
During Past 5 Years | | Number of
Funds in Fund
Complex
Overseen by
Trustee | | Other Directorship(s)
Held by Trustee During
Past 5 Years |
| Independent Trustees | | | | | | | | |
Bruce L. Crockett — 1944 Trustee and Chair | | 1993 | | Chairman, Crockett Technologies Associates (technology consulting company) Formerly: Director, Captaris (unified messaging provider); Director, President and Chief Executive Officer, COMSAT Corporation; Chairman, Board of Governors of INTELSAT (international communications company); ACE Limited (insurance company); Independent Directors Council and Investment Company Institute: Member of the Audit Committee, Investment Company Institute; Member of the Executive Committee and Chair of the Governance Committee, Independent Directors Council | | 158 | | Director and Chairman of the Audit Committee, ALPS (Attorneys Liability Protection Society) (insurance company); Director and Member of the Audit Committee and Compensation Committee, Ferroglobe PLC (metallurgical company) |
David C. Arch — 1945 Trustee | | 2010 | | Chairman of Blistex Inc. (consumer health care products manufacturer); Member, World Presidents’ Organization | | 158 | | Board member of the Illinois Manufacturers’ Association |
Jack M. Fields — 1952 Trustee | | 1997 | | Chief Executive Officer, Twenty First Century Group, Inc. (government affairs company); and Chairman, Discovery Learning Alliance (non-profit) Formerly: Owner and Chief Executive Officer, Dos Angeles Ranch L.P. (cattle, hunting, corporate entertainment); Director, Insperity, Inc. (formerly known as Administaff) (human resources provider); Chief Executive Officer, Texana Timber LP (sustainable forestry company); Director of Cross Timbers Quail Research Ranch (non-profit); and member of the U.S. House of Representatives | | 158 | | None |
Cynthia Hostetler — 1962 Trustee | | 2017 | | Non-Executive Director and Trustee of a number of public and private business corporations Formerly: Head of Investment Funds and Private Equity, Overseas Private Investment Corporation; President, First Manhattan Bancorporation, Inc.; Attorney, Simpson Thacher & Bartlett LLP | | 158 | | Vulcan Materials Company (construction materials company); Trilinc Global Impact Fund; Aberdeen Investment Funds (4 portfolios); Artio Global Investment LLC (mutual fund complex); Edgen Group, Inc. (specialized energy and infrastructure products distributor) |
Eli Jones — 1961 Trustee | | 2016 | | Professor and Dean, Mays Business School — Texas A&M University Formerly: Professor and Dean, Walton College of Business, University of Arkansas and E.J. Ourso College of Business, Louisiana State University; Director, Arvest Bank | | 158 | | Insperity, Inc. (formerly known as Administaff) (human resources provider) |
Prema Mathai-Davis — 1950 Trustee | | 1998 | | Retired. | | 158 | | None |
Teresa M. Ressel — 1962 Trustee | | 2017 | | Non-executive director and trustee of a number of public and private business corporations Formerly: Chief Financial Officer, Olayan America, The Olayan Group (international investor/commercial/industrial); Chief Executive Officer, UBS Securities LLC; Group Chief Operating Officer, Americas, UBS AG; Assistant Secretary for Management & Budget and CFO, US Department of the Treasury | | 158 | | Atlantic Power Corporation (power generation company); ON Semiconductor Corp. (semiconductor supplier) |
Ann Barnett Stern — 1957 Trustee | | 2017 | | President and Chief Executive Officer, Houston Endowment Inc. (private philanthropic institution) Formerly: Executive Vice President and General Counsel, Texas Children’s Hospital; Attorney, Beck, Redden and Secrest, LLP; Business Law Instructor, University of St. Thomas; Attorney, Andrews & Kurth LLP | | 158 | | Federal Reserve Bank of Dallas |
Raymond Stickel, Jr. — 1944 Trustee | | 2005 | | Retired. Formerly: Director, Mainstay VP Series Funds, Inc. (25 portfolios); Partner, Deloitte & Touche | | 158 | | None |
Robert C. Troccoli — 1949 Trustee | | 2016 | | Adjunct Professor, University of Denver — Daniels College of Business Formerly: Senior Partner, KPMG LLP | | 158 | | None |
Christopher L. Wilson — 1957 Trustee | | 2017 | | Non-executive director and trustee of a number of public and private business corporations Formerly: Managing Partner, CT2, LLC (investing and consulting firm); President/Chief Executive Officer, Columbia Funds, Bank of America Corporation; President/Chief Executive Officer, CDC IXIS Asset Management Services, Inc.; Principal & Director of Operations, Scudder Funds, Scudder, Stevens & Clark, Inc.; Assistant Vice President, Fidelity Investments | | 158 | | TD Asset Management USA Inc. (mutual fund complex) (22 portfolios); ISO New England, Inc. (non-profit organization managing regional electricity market) |
Invesco V.I. Equally-Weighted S&P 500 Fund
Trustees and Officers—(continued)
| | | | | | | | |
Name, Year of Birth and
Position(s) Held with the Trust | | Trustee and/
or Officer Since | | Principal Occupation(s)
During Past 5 Years | | Number of
Funds in Fund
Complex
Overseen by
Trustee | | Other Directorship(s)
Held by Trustee During
Past 5 Years |
| Other Officers | | | | | | | | |
Sheri Morris — 1964 President, Principal Executive Officer and Treasurer | | 1999 | | President, Principal Executive Officer and Treasurer, The Invesco Funds; Vice President, Invesco Advisers, Inc. (formerly known as Invesco Institutional (N.A.), Inc.) (registered investment adviser); and Vice President, PowerShares Exchange-Traded Fund Trust, PowerShares Exchange-Traded Fund Trust II, PowerShares India Exchange-Traded Fund Trust, PowerShares Actively Managed Exchange-Traded Fund Trust, PowerShares Actively Managed Exchange-Traded Commodity Fund Trust and PowerShares Exchange-Traded Self-Indexed Fund Trust Formerly: Vice President and Principal Financial Officer, The Invesco Funds; Vice President, Invesco Aim Advisers, Inc., Invesco Aim Capital Management, Inc. and Invesco Aim Private Asset Management, Inc.; Assistant Vice President and Assistant Treasurer, The Invesco Funds and Assistant Vice President, Invesco Advisers, Inc., Invesco Aim Capital Management, Inc. and Invesco Aim Private Asset Management, Inc.; and Treasurer, PowerShares Exchange-Traded Fund Trust, PowerShares Exchange-Traded Fund Trust II, PowerShares India Exchange-Traded Fund Trust and PowerShares Actively Managed Exchange-Traded Fund Trust | | N/A | | N/A |
Russell C. Burk — 1958 Senior Vice President and Senior Officer | | 2005 | | Senior Vice President and Senior Officer, The Invesco Funds | | N/A | | N/A |
John M. Zerr — 1962 Senior Vice President, Chief Legal Officer and Secretary | | 2006 | | Director, Senior Vice President, Secretary and General Counsel, Invesco Management Group, Inc. (formerly known as Invesco AIM Management Group, Inc.); Senior Vice President, Invesco Advisers, Inc. (formerly known as Invesco Institutional (N.A.), Inc.) (registered investment adviser); Senior Vice President and Secretary, Invesco Distributors, Inc. (formerly known as Invesco AIM Distributors, Inc.); Director, Vice President and Secretary, Invesco Investment Services, Inc. (formerly known as Invesco AIM Investment Services, Inc.) Senior Vice President, Chief Legal Officer and Secretary, The Invesco Funds; Managing Director, Invesco PowerShares Capital Management LLC; Director, Secretary and General Counsel, Invesco Investment Advisers LLC (formerly known as Van Kampen Asset Management); Secretary and General Counsel, Invesco Capital Markets, Inc. (formerly known as Van Kampen Funds Inc.) and Chief Legal Officer, PowerShares Exchange-Traded Fund Trust, PowerShares Exchange-Traded Fund Trust II, PowerShares India Exchange-Traded Fund Trust, PowerShares Actively Managed Exchange-Traded Fund Trust, PowerShares Actively Managed Exchange-Traded Commodity Fund Trust and PowerShares Exchange-Traded Self-Indexed Fund Trust; Manager and Secretary, Invesco Indexing LLC Formerly: Director, Secretary, General Counsel and Senior Vice President, Van Kampen Exchange Corp.; Director, Vice President and Secretary, IVZ Distributors, Inc. (formerly known as INVESCO Distributors, Inc.); Director and Vice President, INVESCO Funds Group, Inc.; Director and Vice President, Van Kampen Advisors Inc.; Director, Vice President, Secretary and General Counsel, Van Kampen Investor Services Inc.; Director, Invesco Distributors, Inc. (formerly known as Invesco AIM Distributors, Inc.); Director, Senior Vice President, General Counsel and Secretary, Invesco AIM Advisers, Inc. and Van Kampen Investments Inc.; Director, Vice President and Secretary, Fund Management Company; Director, Senior Vice President, Secretary, General Counsel and Vice President, Invesco AIM Capital Management, Inc.; Chief Operating Officer and General Counsel, Liberty Ridge Capital, Inc. (an investment adviser); Vice President and Secretary, PBHG Funds (an investment company) and PBHG Insurance Series Fund (an investment company); Chief Operating Officer, General Counsel and Secretary, Old Mutual Investment Partners (a broker-dealer); General Counsel and Secretary, Old Mutual Fund Services (an administrator) and Old Mutual Shareholder Services (a shareholder servicing center); Executive Vice President, General Counsel and Secretary, Old Mutual Capital, Inc. (an investment adviser); and Vice President and Secretary, Old Mutual Advisors Funds (an investment company) | | N/A | | N/A |
Gregory G. McGreevey — 1962 Senior Vice President | | 2012 | | Senior Managing Director, Invesco Ltd.; Director, Chairman, President, and Chief Executive Officer, Invesco Advisers, Inc. (formerly known as Invesco Institutional (N.A.), Inc.) (registered investment adviser); Senior Vice President, Invesco Management Group, Inc.; Director, Invesco Mortgage Capital, Inc. and Invesco Senior Secured Management, Inc.; and Senior Vice President, The Invesco Funds Formerly: Assistant Vice President, The Invesco Funds | | N/A | | N/A |
Kelli Gallegos — 1970 Vice President, Principal Financial Officer and Assistant Treasurer | | 2008 | | Vice President, Principal Financial Officer and Assistant Treasurer, The Invesco Funds; Assistant Treasurer, Invesco PowerShares Capital Management LLC, PowerShares Exchange-Traded Fund Trust, PowerShares Exchange-Traded Fund Trust II, PowerShares India Exchange-Traded Fund Trust, PowerShares Actively Managed Exchange-Traded Fund Trust, PowerShares Actively Managed Exchange-Traded Commodity Fund Trust and PowerShares Exchange-Traded Self-Indexed Fund Trust Formerly: Assistant Vice President, The Invesco Funds | | N/A | | N/A |
Invesco V.I. Equally-Weighted S&P 500 Fund
Trustees and Officers—(continued)
| | | | | | | | |
Name, Year of Birth and
Position(s) Held with the Trust | | Trustee and/
or Officer Since | | Principal Occupation(s)
During Past 5 Years | | Number of
Funds in Fund
Complex
Overseen by
Trustee | | Other Directorship(s)
Held by Trustee During
Past 5 Years |
| Other Officers—(continued) | | | | | | | | |
Tracy Sullivan — 1962 Vice President, Chief Tax Officer and Assistant Treasurer | | 2008 | | Vice President, Chief Tax Officer and Assistant Treasurer, The Invesco Funds; Assistant Treasurer, Invesco PowerShares Capital Management LLC, PowerShares Exchange-Traded Fund Trust, PowerShares Exchange-Traded Fund Trust II, PowerShares India Exchange-Traded Fund Trust, PowerShares Actively Managed Exchange-Traded Fund Trust, PowerShares Actively Managed Exchange-Traded Commodity Fund Trust and PowerShares Exchange-Traded Self-Indexed Fund Trust Formerly: Assistant Vice President, The Invesco Funds | | N/A | | N/A |
Crissie M. Wisdom — 1969 Anti-Money Laundering Compliance Officer | | 2013 | | Anti-Money Laundering Compliance Officer, Invesco Advisers, Inc. (formerly known as Invesco Institutional (N.A.), Inc.) (registered investment adviser), Invesco Capital Markets, Inc. (formerly known as Van Kampen Funds Inc.), Invesco Distributors, Inc., Invesco Investment Services, Inc., Invesco Management Group, Inc., The Invesco Funds, and PowerShares Exchange-Traded Fund Trust, PowerShares Exchange-Traded Fund Trust II, PowerShares India Exchange-Traded Fund Trust, PowerShares Actively Managed Exchange-Traded Fund Trust, PowerShares Actively Managed Exchange-Traded Commodity Fund Trust and PowerShares Exchange-Traded Self-Indexed Fund Trust; Anti-Money Laundering Compliance Officer and Bank Secrecy Act Officer, INVESCO National Trust Company and Invesco Trust Company; and Fraud Prevention Manager and Controls and Risk Analysis Manager for Invesco Investment Services, Inc. Formerly: Anti-Money Laundering Compliance Officer, Van Kampen Exchange Corp. | | N/A | | N/A |
Robert R. Leveille — 1969 Chief Compliance Officer | | 2016 | | Chief Compliance Officer, Invesco Advisers, Inc. (registered investment adviser); and Chief Compliance Officer, The Invesco Funds Formerly: Chief Compliance Officer, Putnam Investments and the Putnam Funds | | N/A | | N/A |
The Statement of Additional Information of the Trust includes additional information about the Fund’s Trustees and is available upon request, without charge, by calling 1.800.959.4246. Please refer to the Fund’s Statement of Additional Information for information on the Fund’s sub-advisers.
| | | | | | |
Office of the Fund 11 Greenway Plaza, Suite 1000 Houston, TX 77046-1173 | | Investment Adviser Invesco Advisers, Inc. 1555 Peachtree Street, N.E. Atlanta, GA 30309 | | Distributor Invesco Distributors, Inc. 11 Greenway Plaza, Suite 1000 Houston, TX 77046-1173 | | Auditors PricewaterhouseCoopers LLP 1000 Louisiana Street, Suite 5800 Houston, TX 77002-5678 |
| | | |
| | | | | | |
Counsel to the Fund Stradley Ronon Stevens & Young, LLP 2005 Market Street, Suite 2600 Philadelphia, PA 19103-7018 | | Counsel to the Independent Trustees Goodwin Procter LLP 901 New York Avenue, N.W. Washington, D.C. 20001 | | Transfer Agent Invesco Investment Services, Inc. 11 Greenway Plaza, Suite 1000 Houston, TX 77046-1173 | | Custodian State Street Bank and Trust Company 225 Franklin Street Boston, MA 02110-2801 |
Invesco V.I. Equally-Weighted S&P 500 Fund
| | | | |
| | |
 | | Annual Report to Shareholders | | December 31, 2017 |
| | |
| | Invesco V.I. Equity and Income Fund |

| | |
| | The Fund provides a complete list of its holdings four times in each fiscal year, at the quarter-ends. For the second and fourth quarters, the lists appear in the Fund’s semiannual and annual reports to shareholders. For the first and third quarters, the Fund files the lists with the Securities and Exchange Commission (SEC) on Form N-Q. The Fund’s Form N-Q filings are available on the SEC website, sec.gov. Copies of the Fund’s Forms N-Q may be reviewed and copied at the SEC Public Reference Room in Washington, D.C. You can obtain information on the operation of the Public Reference Room, including information about duplicating fee charges, by calling 202 551 8090 or 800 732 0330, or by electronic request at the following email address: publicinfo@sec.gov. The SEC file numbers for the Fund are 811-07452 and 033-57340. The Fund’s most recent portfolio holdings, as filed on Form N-Q, have also been made available to insurance companies issuing variable annuity contracts and variable life insurance policies (“variable products”) that invest in the Fund. A description of the policies and procedures that the Fund uses to determine how to vote proxies relating to portfolio securities is available without charge, upon request, from our Client Services department at 800 959 4246 or at invesco.com/proxyguidelines. The information is also available on the SEC website, sec.gov. Information regarding how the Fund voted proxies related to its portfolio securities during the most recent 12-month period ended June 30 is available at invesco.com/proxysearch. The information is also available on the SEC website, sec.gov. Invesco Advisers, Inc. is an investment adviser; it provides investment advisory services to individual and institutional clients and does not sell securities. Invesco Distributors, Inc. is the US distributor for Invesco Ltd.’s retail mutual funds, exchange-traded funds and institutional money market funds. Both are wholly owned, indirect subsidiaries of Invesco Ltd. This report must be accompanied or preceded by a currently effective Fund prospectus and variable product prospectus, which contain more complete information, including sales charges and expenses. Investors should read each carefully before investing. NOT FDIC INSURED | MAY LOSE VALUE | NO BANK GUARANTEE |
| | | | |
| | Invesco Distributors, Inc. | | VK-VIEQI-AR-1 02092018 1037 |
Management’s Discussion of Fund Performance
Performance summary
For the year ended December 31, 2017, Series I shares of Invesco V.I. Equity and Income Fund (the Fund) underperformed the Russell 1000 Value Index.
Your Fund’s long-term performance appears later in this report.
Fund vs. Indexes
Total returns, 12/31/16 to 12/31/17, excluding variable product issuer charges.
If variable product issuer charges were included, returns would be lower.
| | | | | |
| Series I Shares | | | | 11.03 | % |
| Series II Shares | | | | 10.78 | |
| Russell 1000 Value Index▼ (Broad Market Index) | | | | 13.66 | |
| Bloomberg Barclays U.S. Government/Credit Index▼ (Style-Specific Index) | | | | 4.00 | |
| Lipper VUF Mixed-Asset Target Allocation Growth Funds Index∎ (Peer Group Index) | | | | 16.46 | |
Source(s): ▼FactSet Research Systems Inc.; ∎Lipper Inc. | | | | | |
Market conditions and your Fund
Despite highly destructive hurricanes that threatened to derail a years-long economic recovery, the US economy continued to expand throughout the year ended December 31, 2017. Gross domestic product – the value of all goods and services produced in the US – expanded in the first three quarters of 2017. Inflation remained subdued even as unemployment continued its multiyear decline.
Given signs of an improving economy, the US Federal Reserve (the Fed) raised interest rates three times during the reporting period, most recently in December 2017; each rate hike was 25 basis points. (A basis point is 0.01%.) The Fed pledged that “realized and expected economic conditions relative to its objectives of maximum employment and 2 percent inflation” will guide its future actions. At the close of the reporting period, Fed policy remained accommodative, and the fed funds target rate stood at a range of 1.25% to 1.50%.1
Higher inventories and a worsening outlook caused oil prices and many energy stocks to decline during the first half of 2017. However, oil prices rose signifi-
cantly in the second half of the reporting period as expectations for lower supplies increased, partly due to continued OPEC production cuts, and demand began normalizing.
Major US stock market indexes repeatedly hit all-time highs throughout the reporting period. The stock market rally that began after the 2016 presidential election continued throughout the reporting period, fueled by generally positive economic data, strong corporate earnings and improved consumer confidence. Finally, after much debate in Congress, a tax reform bill was signed into law in December 2017. While its enactment further strengthened stocks, its effect on the US economy remained uncertain.
For the reporting period as a whole, financials, consumer discretionary and telecommunication services were the strongest-performing sectors for the Fund, while consumer staples and materials were the weakest-performing sectors for the Fund, relative to the Russell 1000 Value Index.
The financials sector was the largest contributor to the Fund’s performance versus the Russell 1000 Value Index due to strong stock selection in and over-
weight exposure to the sector. Specifically, Citigroup, Bank of America and Morgan Stanley were the Fund’s top contributors. These companies benefited from investor optimism about future interest rates, an improving economy and lower corporate tax rates. Financials also benefited when the Fed’s Comprehensive Capital Analysis and Review was better than expected, providing a favorable view of the financial strength of US banks and their ability to return capital to their shareholders.
Stock selection in the consumer discretionary sector also benefited the Fund’s performance relative to the Russell 1000 Value Index. Carnival was a key contributor in this sector. The stock performed well and posted a return of over 30% for the reporting period, leading the cruise operator to raise its outlook after reporting better pricing and strong forward-booking volumes for 2017. Michael Kors also contributed to the Fund’s relative results. Mid-year, the company reported better-than-expected results and a better revenue outlook due to fewer promotions and increased sales within its high-end product lines.
Stock selection in the telecommunication services sector, as well as underweight exposure to the sector relative to the Russell 1000 Value Index, contributed to relative Fund performance. The Fund’s lack of exposure to some of the weaker names in the sector, namely AT&T, helped on a relative basis as the sector posted negative returns for the year. Similarly, the Fund’s lack of exposure to the real estate sector contributed to relative returns. The Fund remained materially underweight in these sectors because we believed they were overvalued, as investors have driven up stock prices in a quest for yield in a low-interest rate environment.
| | |
| Portfolio Composition |
By security type | % of total net assets |
| | |
| |
| Common Stocks & Other Equity Interests | | 64.5% |
| Bonds & Notes | | 16.4 |
| U.S. Treasury Securities | | 11.5 |
Security Types Each Less Than 1% of Portfolio | | 0.6 |
Money Market Funds Plus Other Assets Less Liabilities | | 7.0 |
| | |
| Top 10 Equity Holdings* |
% of total net assets |
| |
| 1. Citigroup Inc. | | 3.8% |
2. Bank of America Corp. | | 3.2 |
3. JPMorgan Chase & Co. | | 2.7 |
4. Morgan Stanley | | 2.1 |
5. Citizens Financial Group, Inc. | | 1.7 |
6. Royal Dutch Shell PLC-Class A | | 1.5 |
7. Oracle Corp. | | 1.5 |
8. Occidental Petroleum Corp. | | 1.3 |
9. Devon Energy Corp. | | 1.3 |
10. Apache Corp. | | 1.2 |
| | |
| Total Net Assets | | $1.6 million |
| |
| Total Number of Holdings* | | 378 |
The Fund’s holdings are subject to change, and there is no assurance that the Fund will continue to hold any particular security.
*Excluding money market fund holdings.
Data presented here are as of December 31, 2017.
Invesco V.I. Equity and Income Fund
Stock selection within the industrials sector contributed to the Fund’s performance relative to the Russell 1000 Value Index. CSX, a rail-based transportation services firm, was one of the top contributors as the stock posted a return of over 50% for the year. Early in 2017, the company announced the arrival of Hunter Harrison, a highly respected chief executive officer (CEO) within the industry, and the stock rallied on investors’ expectations of improved profitability. Mr. Harrison passed away in December; however, the company quickly appointed a new experienced CEO with a history of working with Mr. Harrison for many years. Material underweight exposure to General Electric was also a driver of relative Fund performance as the stock posted a negative return for the year. We sold our position in the company during the reporting period.
Stock selection within the consumer staples sector was a large detractor from relative Fund performance for the year. Specifically, Walgreens Boots Alliance posted a negative return for the year after rumors emerged that Amazon (not a Fund holding) may be entering the pharmacy space, driving investor concerns.
Stock selection in the materials sector also detracted from the Fund’s performance versus the Russell 1000 Value Index. Within the sector, the largest detractor was The Mosaic Company, a phosphate and potash supplier. During the first half of 2017, the stock price fell after the company reported sales and profits down sharply year over year. Operating earnings were down due to lower phosphate and potash prices caused by excessive supply.
The Fund’s underweight allocation to the utilities sector also detracted from performance versus the Russell 1000 Value Index. The Fund remained materially underweight in this sector because we believed it to be overvalued.
The Fund uses high grade bonds as a source of income and to dampen return volatility. Although the bond portion of the Fund posted positive returns for the reporting period, bonds generally underperformed equities and detracted from Fund performance versus the Russell 1000 Value Index. Similarly, the Fund’s allocation to convertible securities also posted positive returns on an absolute basis, but detracted from relative performance
as convertibles underperformed the Russell 1000 Value Index. The Fund’s cash position was a detractor in a strong equity market, as would be expected.
We used currency forward contracts for the purpose of hedging currency exposure of non-US-based companies held in the portfolio. Currency forward contracts were used solely for the purpose of hedging and not for speculative purposes or leverage. The use of currency forward contracts had a negative impact on the Fund’s performance, largely due to the weakness of the US dollar compared to the foreign currencies in which the Fund’s non-US holdings were denominated.
At the end of the reporting period, the Fund’s largest overweight exposures relative to the Russell 1000 Value Index were in the financials and energy sectors, while the largest underweight exposures were in the real estate and utilities sectors.
Thank you for your investment in Invesco V.I. Equity and Income Fund and for sharing our long-term investment horizon.
| 1 | Source: US Federal Reserve |
The views and opinions expressed in management’s discussion of Fund performance are those of Invesco Advisers, Inc. These views and opinions are subject to change at any time based on factors such as market and economic conditions. These views and opinions may not be relied upon as investment advice or recommendations, or as an offer for a particular security. The information is not a complete analysis of every aspect of any market, country, industry, security or the Fund. Statements of fact are from sources considered reliable, but Invesco Advisers, Inc. makes no representation or warranty as to their completeness or accuracy. Although historical performance is no guarantee of future results, these insights may help you understand our investment management philosophy.
See important Fund and, if applicable, index disclosures later in this report.
| | |
 | | Thomas Bastian |
| | Chartered Financial Analyst, Portfolio Manager, is lead manager of Invesco V.I. Equity and Income |
| Fund. He joined Invesco in 2010. Mr. Bastian earned a BA in accounting from St. John’s University and an MBA in finance from the University of Michigan. |
| | |
 | | Chuck Burge Portfolio Manager, is manager of Invesco V.I. Equity and Income Fund. He joined Invesco in 2002.Mr. Burge earned a |
| BS in economics from Texas A&M University and an MBA in finance and accounting from Rice University. |
| | |
 | | Brian Jurkash Portfolio Manager, is manager of Invesco V.I. Equity and Income Fund. He joined Invesco in 2000. Mr. Jurkash earned |
| a BBA degree in finance from Stephen F. Austin State University and an MBA in finance from the University of Houston. |
| | |
 | | Sergio Marcheli Portfolio Manager, is manager of Invesco V.I. Equity and Income Fund. He joined Invesco in 2010. Mr. Marcheli |
| earned a BBA from the University of Houston and an MBA from the University of St. Thomas. |
| | |
 | | Matthew Titus Chartered Financial Analyst, Portfolio Manager, is manager of Invesco V.I. Equity and Income Fund. He joined |
| Invesco in 2016. Mr. Titus earned a bachelor’s degree in accounting and economics from Luther College in Decorah, Iowa, and an MBA from Ohio State University. |
Invesco V.I. Equity and Income Fund
Your Fund’s Long-Term Performance
Results of a $10,000 Investment - Oldest Share Class(es)
Fund and index data from 12/31/07
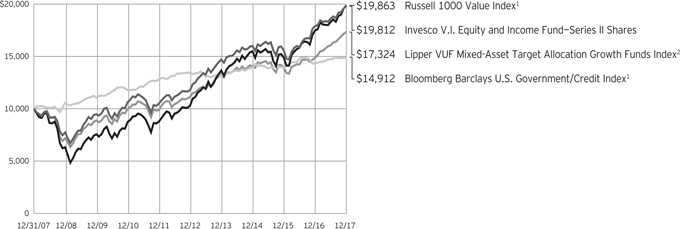
| 1 | Source: FactSet Research Systems Inc. |
Past performance cannot guarantee
comparable future results.
| | | | | |
| Average Annual Total Returns |
As of 12/31/17 | | | | | |
| |
| Series I Shares | | | | | |
| 10 Years | | | | 7.24 | % |
| 5 Years | | | | 11.26 | |
| 1 Year | | | | 11.03 | |
| |
| Series II Shares | | | | | |
| Inception (4/30/03) | | | | 8.33 | % |
| 10 Years | | | | 7.08 | |
| 5 Years | | | | 10.98 | |
| 1 Year | | | | 10.78 | |
Effective June 1, 2010, Class II shares of the predecessor fund, Universal Institutional Funds Equity and Income Portfolio, advised by Morgan Stanley Investment Management Inc. were reorganized into Series II shares of Invesco Van Kampen V.I. Equity and Income Fund (renamed Invesco V.I. Equity and Income Fund on April 29, 2013). Returns shown above, prior to June 1, 2010, for Series II shares are blended returns of the predecessor fund and Invesco V.I. Equity and Income Fund. Share class returns will differ from the predecessor fund because of different expenses.
Series I shares incepted on June 1, 2010. Series I shares performance shown prior to that date is that of the predecessor fund’s Class II shares and includes the 12b-1 fees applicable to
the predecessor fund’s Class II shares.
The performance data quoted represent past performance and cannot guarantee comparable future results; current performance may be lower or higher. Please contact your variable product issuer or financial adviser for the most recent month-end variable product performance. Performance figures reflect Fund expenses, reinvested distributions and changes in net asset value. Investment return and principal value will fluctuate so that you may have a gain or loss when you sell shares.
The net annual Fund operating expense ratio set forth in the most recent Fund prospectus as of the date of this report for Series I and Series II shares was 0.58% and 0.83%, respectively.1 The total annual Fund operating expense ratio set forth in the most recent Fund prospectus as of the date of this report for Series I and Series II shares was 0.59% and 0.84%, respectively. The expense ratios presented above may vary from the expense ratios presented in other sections of this report that are based on expenses incurred during the period covered by this report.
Invesco V.I. Equity and Income Fund, a series portfolio of AIM Variable Insurance Funds (Invesco
Variable Insurance Funds), is currently offered through insurance companies issuing variable products. You cannot purchase shares of the Fund directly. Performance figures given represent the Fund and are not intended to reflect actual variable product values. They do not reflect sales charges, expenses and fees assessed in connection with a variable product. Sales charges, expenses and fees, which are determined by the variable product issuers, will vary and will lower the total return.
The most recent month-end performance at the Fund level, excluding variable product charges, is available at 800 451 4246. As mentioned above, for the most recent month-end performance including variable product charges, please contact your variable product issuer or financial adviser.
Fund performance reflects any applicable fee waivers and/or expense reimbursements. Had the adviser not waived fees and/or reimbursed expenses currently or in the past, returns would have been lower. See current prospectus for more information.
| 1 | Total annual Fund operating expenses after any contractual fee waivers and/or expense reimbursements by the adviser in effect through at least June 30, 2019. See current prospectus for more information. |
Invesco V.I. Equity and Income Fund
Invesco V.I. Equity and Income Fund’s investment objectives are both capital appreciation and current income.
| ∎ | | Unless otherwise stated, information presented in this report is as of December 31, 2017, and is based on total net assets. |
| ∎ | | Unless otherwise noted, all data provided by Invesco. |
Principal risks of investing in the Fund
Active trading risk. Active trading of portfolio securities may result in added expenses and a lower return.
Changing fixed income market conditions risk. The current low interest rate environment was created in part by the Federal Reserve Board (FRB) and certain foreign central banks keeping the federal funds and equivalent foreign rates near, at or below zero. Increases in the federal funds and equivalent foreign rates may expose fixed income markets to heightened volatility and reduced liquidity for certain fixed income investments, particularly those with longer maturities. In addition, decreases in fixed income dealer market-making capacity may also potentially lead to heightened volatility and reduced liquidity in the fixed income markets. As a result, the value of the Fund’s investments and share price may decline. Changes in central bank policies could also result in higher than normal shareholder redemptions, which could potentially increase portfolio turnover and the Fund’s transaction costs.
Convertible securities risk. The market values of convertible securities are affected by market interest rates, the risk of actual issuer default on interest or principal payments and the value of the underlying common stock into which the convertible security may be converted. Additionally, a convertible security is subject to the same types of market and issuer risks as apply to the underlying common stock. In addition, certain convertible securities are subject to involuntary conversions and may undergo principal write-downs upon the occurrence of certain triggering events, and, as a result, are subject to an increased risk of loss. Convertible securities may be rated below investment grade.
Debt securities risk. The prices of debt securities held by the Fund will be affected by changes in interest rates, the cred-itworthiness of the issuer and other factors. An increase in prevailing interest rates typically causes the value of existing debt securities to fall and often has a greater impact on longer-duration debt securities and higher quality debt securities. Falling interest rates will cause the Fund to reinvest the proceeds of debt securities that have been repaid by the issuer at lower interest rates. Falling interest
rates may also reduce the Fund’s distributable income because interest payments on floating rate debt instruments held by the Fund will decline. The Fund could lose money on investments in debt securities if the issuer or borrower fails to meet its obligations to make interest payments and/or to repay principal in a timely manner. Changes in an issuer’s financial strength, the market’s perception of such strength or in the credit rating of the issuer or the security may affect the value of debt securities. The Adviser’s credit analysis may fail to anticipate such changes, which could result in buying a debt security at an inopportune time or failing to sell a debt security in advance of a price decline or other credit event.
Depositary receipts risk. Investing in depositary receipts involves the same risks as direct investments in foreign securities. In addition, the underlying issuers of certain depositary receipts are under no obligation to distribute shareholder communications or pass through any voting rights with respect to the deposited securities to the holders of such receipts. The Fund may therefore receive less timely information or have less control than if it invested directly in the foreign issuer.
Derivatives risk. The value of a derivative instrument depends largely on (and is derived from) the value of an underlying security, currency, commodity, interest rate, index or other asset (each referred to as an underlying asset). In addition to risks relating to the underlying assets, the use of derivatives may include other, possibly greater, risks, including counterparty, leverage and liquidity risks. Counterparty risk is the risk that the counterparty to the derivative contract will default on its obligation to pay the Fund the amount owed or otherwise perform under the derivative contract. Derivatives create leverage risk because they do not require payment up front equal to the economic exposure created by owning the derivative. As a result, an adverse change in the value of the underlying asset could result in the Fund sustaining a loss that is substantially greater than the amount invested in the derivative, which may make the Fund’s returns more volatile and increase the risk of loss. Derivative instruments may also be less liquid than more traditional investments and the Fund may be unable to sell or close out its derivative positions
at a desirable time or price. This risk may be more acute under adverse market conditions, during which the Fund may be most in need of liquidating its derivative positions. Derivatives may also be harder to value, less tax efficient and subject to changing government regulation that could impact the Fund’s ability to use certain derivatives or their cost. Also, derivatives used for hedging or to gain or limit exposure to a particular market segment may not provide the expected benefits, particularly during adverse market conditions.
Foreign securities risk. The Fund’s foreign investments may be adversely affected by political and social instability, changes in economic or taxation policies, difficulty in enforcing obligations, decreased liquidity or increased volatility. Foreign investments also involve the risk of the possible seizure, nationalization or expropriation of the issuer or foreign deposits (in which the Fund could lose its entire investments in a certain market) and the possible adoption of foreign governmental restrictions such as exchange controls. Unless the Fund has hedged its foreign securities risk, foreign securities risk also involves the risk of negative foreign currency rate fluctuations, which may cause the value of securities denominated in such foreign currency (or other instruments through which the Fund has exposure to foreign currencies) to decline in value. Currency exchange rates may fluctuate significantly over short periods of time. Currency hedging strategies, if used, are not always successful.
Management risk. The Fund is actively managed and depends heavily on the Adviser’s judgment about markets, interest rates or the attractiveness, relative values, liquidity, or potential appreciation of particular investments made for the Fund’s portfolio. The Fund could experience losses if these judgments prove to be incorrect. Additionally, legislative, regulatory, or tax developments may adversely affect management of the Fund and, therefore, the ability of the Fund to achieve its investment objective.
Market risk. The market values of the Fund’s investments, and therefore the value of the Fund’s shares, will go up and down, sometimes rapidly or unpredictably. Market risk may affect a single issuer, industry or section of the economy, or it may affect the market as a whole. Individual
Invesco V.I. Equity and Income Fund
stock prices tend to go up and down more dramatically than those of certain other types of investments, such as bonds. During a general downturn in the financial markets, multiple asset classes may decline in value. When markets perform well, there can be no assurance that specific investments held by the Fund will rise in value.
Preferred securities risk. Preferred securities are subject to issuer-specific and market risks applicable generally to equity securities. Preferred securities also may be subordinated to bonds or other debt instruments, subjecting them to a greater risk of non-payment, may be less liquid than many other securities, such as common stocks, and generally offer no voting rights with respect to the issuer.
Real estate investment trust risk/real estate risk. Investments in real estate related instruments may be affected by economic, legal, cultural, environmental or technological factors that affect property values, rents or occupancies of real estate related to the Fund’s holdings. Shares of real estate related companies, which tend to be small- and mid-cap companies, may be more volatile and less liquid.
Small- and mid-capitalization companies risks. Small- and mid-capitalization companies tend to be more vulnerable to changing market conditions, may have little or no operating history or track record of success, and may have more limited product lines and markets, less experienced management and fewer financial resources than larger companies. These companies’ securities may be more volatile and less liquid than those of more established companies, and their returns may vary, sometimes significantly, from the overall securities market.
Value investing style risk. A value investing style subjects the Fund to the risk that the valuations never improve or that the returns on value equity securities are less than returns on other styles of investing or the overall stock market.
Warrants risk. Warrants may be significantly less valuable or worthless on their expiration date and may also be postponed or terminated early, resulting in a partial or total loss. Warrants may also be illiquid.
Zero coupon or pay-in-kind securities risk. The value, interest rates, and liquidity of non-cash paying instruments, such
as zero coupon and pay-in-kind securities, are subject to greater fluctuation than other types of securities. The higher yields and interest rates on pay-in-kind securities reflect the payment deferral and increased credit risk associated with such instruments and that such investments may represent a higher credit risk than loans that periodically pay interest.
About indexes used in this report
The Russell 1000® Value Index is an unmanaged index considered representative of large-cap value stocks. The Russell 1000 Value Index is a trademark/service mark of the Frank Russell Co. Russell® is a trademark of the Frank Russell Co.
The Bloomberg Barclays U.S. Government/Credit Index is a broad-based benchmark that includes investment-grade, US dollar-denominated, fixed-rate Treasuries, government-related and corporate securities.
The Lipper VUF Mixed-Asset Target Allocation Growth Funds Index is an unmanaged index considered representative of mixed-asset target allocation growth variable insurance underlying funds tracked by Lipper.
The Fund is not managed to track the performance of any particular index, including the index(es) described here, and consequently, the performance of the Fund may deviate significantly from the performance of the index(es).
A direct investment cannot be made in an index. Unless otherwise indicated, index results include reinvested dividends, and they do not reflect sales charges. Performance of the peer group, if applicable, reflects fund expenses; performance of a market index does not.
Other information
The returns shown in management’s discussion of Fund performance are based on net asset values calculated for shareholder transactions. Generally accepted accounting principles require adjustments to be made to the net assets of the Fund at period end for financial reporting purposes, and as such, the net asset values for shareholder transactions and the returns based on those net asset values may differ from the net asset values and returns reported in the Financial Highlights. Additionally, the returns and net asset values shown throughout this
report are at the Fund level only and do not include variable product issuer charges. If such charges were included, the total returns would be lower.
Industry classifications used in this report are generally according to the Global Industry Classification Standard, which was developed by and is the exclusive property and a service mark of MSCI Inc. and Standard & Poor’s.
Invesco V.I. Equity and Income Fund
Schedule of Investments(a)
December 31, 2017
| | | | | | | | |
| | | Shares | | | Value | |
Common Stocks & Other Equity Interests–64.47% | |
| Aerospace & Defense–1.02% | | | | | |
General Dynamics Corp. | | | 78,667 | | | $ | 16,004,801 | |
|
| Apparel, Accessories & Luxury Goods–0.48% | |
Michael Kors Holdings Ltd.(b) | | | 120,732 | | | | 7,600,079 | |
|
| Asset Management & Custody Banks–1.80% | |
Northern Trust Corp. | | | 120,120 | | | | 11,998,787 | |
State Street Corp. | | | 166,008 | | | | 16,204,041 | |
| | | | | | | | 28,202,828 | |
| |
| Automobile Manufacturers–1.23% | | | | | |
General Motors Co. | | | 471,659 | | | | 19,333,302 | |
| |
| Biotechnology–0.45% | | | | | |
Amgen Inc. | | | 40,995 | | | | 7,129,030 | |
| |
| Broadcasting–0.18% | | | | | |
CBS Corp.–Class B | | | 48,165 | | | | 2,841,735 | |
| |
| Building Products–0.68% | | �� | | | |
Johnson Controls International PLC | | | 281,220 | | | | 10,717,294 | |
| |
| Cable & Satellite–1.48% | | | | | |
Charter Communications, Inc.–Class A(b) | | | 27,442 | | | | 9,219,414 | |
Comcast Corp.–Class A | | | 350,755 | | | | 14,047,738 | |
| | | | | | | | 23,267,152 | |
| |
| Communications Equipment–1.86% | | | | | |
Cisco Systems, Inc. | | | 495,494 | | | | 18,977,420 | |
Juniper Networks, Inc. | | | 360,832 | | | | 10,283,712 | |
| | | | | | | | 29,261,132 | |
|
| Data Processing & Outsourced Services–0.41% | |
PayPal Holdings, Inc.(b) | | | 87,119 | | | | 6,413,701 | |
| |
| Diversified Banks–9.65% | | | | | |
Bank of America Corp. | | | 1,697,193 | | | | 50,101,137 | |
Citigroup Inc. | | | 802,206 | | | | 59,692,149 | |
JPMorgan Chase & Co. | | | 390,101 | | | | 41,717,401 | |
| | | | | | | | 151,510,687 | |
| |
| Diversified Metals & Mining–0.54% | | | | | |
BHP Billiton Ltd. (Australia) | | | 367,928 | | | | 8,468,519 | |
| |
| Drug Retail–2.28% | | | | | |
CVS Health Corp. | | | 255,727 | | | | 18,540,208 | |
Walgreens Boots Alliance, Inc. | | | 237,768 | | | | 17,266,712 | |
| | | | | | | | 35,806,920 | |
| |
| Electric Utilities–0.27% | | | | | |
FirstEnergy Corp. | | | 137,512 | | | | 4,210,617 | |
| |
| Fertilizers & Agricultural Chemicals–1.02% | | | | | |
Agrium Inc. (Canada) | | | 68,978 | | | | 7,932,470 | |
| | | | | | | | |
| | | Shares | | | Value | |
| Fertilizers & Agricultural Chemicals–(continued) | |
Mosaic Co. (The) | | | 314,988 | | | $ | 8,082,592 | |
| | | | | | | | 16,015,062 | |
| |
| Health Care Distributors–0.86% | | | | | |
McKesson Corp. | | | 86,869 | | | | 13,547,221 | |
| |
| Health Care Equipment–1.47% | | | | | |
Baxter International Inc. | | | 156,251 | | | | 10,100,065 | |
Medtronic PLC | | | 160,954 | | | | 12,997,035 | |
| | | | | | | | 23,097,100 | |
| |
| Home Improvement Retail–0.80% | | | | | |
Kingfisher PLC (United Kingdom) | | | 2,741,988 | | | | 12,501,512 | |
| |
| Hotels, Resorts & Cruise Lines–1.22% | | | | | |
Carnival Corp. | | | 288,537 | | | | 19,150,201 | |
| |
| Industrial Machinery–0.82% | | | | | |
Ingersoll-Rand PLC | | | 144,432 | | | | 12,881,890 | |
| |
| Insurance Brokers–1.89% | | | | | |
Aon PLC | | | 96,558 | | | | 12,938,772 | |
Marsh & McLennan Cos., Inc. | | | 88,587 | | | | 7,210,096 | |
Willis Towers Watson PLC | | | 62,700 | | | | 9,448,263 | |
| | | | | | | | 29,597,131 | |
| |
| Integrated Oil & Gas–3.58% | | | | | |
Occidental Petroleum Corp. | | | 286,352 | | | | 21,092,688 | |
Royal Dutch Shell PLC–Class A (United Kingdom) | | | 709,306 | | | | 23,749,324 | |
TOTAL S.A. (France) | | | 207,114 | | | | 11,427,107 | |
| | | | | | | | 56,269,119 | |
|
| Integrated Telecommunication Services–0.64% | |
Orange S.A. (France) | | | 142,929 | | | | 2,480,126 | |
Verizon Communications Inc. | | | 144,217 | | | | 7,633,406 | |
| | | | | | | | 10,113,532 | |
| |
| Internet Software & Services–0.93% | | | | | |
eBay Inc.(b) | | | 384,617 | | | | 14,515,446 | |
| |
| Investment Banking & Brokerage–3.70% | | | | | |
Charles Schwab Corp. (The) | | | 216,882 | | | | 11,141,228 | |
Goldman Sachs Group, Inc. (The) | | | 54,001 | | | | 13,757,295 | |
Morgan Stanley | | | 631,110 | | | | 33,114,342 | |
| | | | | | | | 58,012,865 | |
| |
| IT Consulting & Other Services–0.85% | | | | | |
Cognizant Technology Solutions Corp.–Class A | | | 188,524 | | | | 13,388,974 | |
| |
| Managed Health Care–0.69% | | | | | |
Anthem, Inc. | | | 47,756 | | | | 10,745,578 | |
| |
| Multi-Line Insurance–1.04% | | | | | |
American International Group, Inc. | | | 274,155 | | | | 16,334,155 | |
See accompanying Notes to Financial Statements which are an integral part of the financial statements.
Invesco V.I. Equity and Income Fund
| | | | | | | | |
| | | Shares | | | Value | |
| Oil & Gas Equipment & Services–1.67% | | | | | |
Baker Hughes, a GE Co. | | | 246,691 | | | $ | 7,805,303 | |
TechnipFMC PLC (United Kingdom) | | | 585,524 | | | | 18,332,757 | |
| | | | | | | | 26,138,060 | |
|
| Oil & Gas Exploration & Production–4.63% | |
Anadarko Petroleum Corp. | | | 285,763 | | | | 15,328,327 | |
Apache Corp. | | | 462,182 | | | | 19,513,324 | |
Canadian Natural Resources Ltd. (Canada) | | | 481,688 | | | | 17,214,914 | |
Devon Energy Corp. | | | 500,027 | | | | 20,701,118 | |
| | | | | | | | 72,757,683 | |
|
| Other Diversified Financial Services–0.56% | |
Voya Financial, Inc. | | | 178,843 | | | | 8,847,363 | |
|
| Packaged Foods & Meats–0.79% | |
Mondelez International, Inc.–Class A | | | 291,365 | | | | 12,470,422 | |
| |
| Pharmaceuticals–3.86% | | | | | |
Bristol-Myers Squibb Co. | | | 138,477 | | | | 8,485,870 | |
Merck & Co., Inc. | | | 233,334 | | | | 13,129,704 | |
Novartis AG (Switzerland) | | | 138,581 | | | | 11,720,286 | |
Pfizer Inc. | | | 490,780 | | | | 17,776,052 | |
Sanofi (France) | | | 110,312 | | | | 9,497,866 | |
| | | | | | | | 60,609,778 | |
| |
| Railroads–1.07% | | | | | |
CSX Corp. | | | 305,464 | | | | 16,803,575 | |
| |
| Regional Banks–5.20% | | | | | |
Citizens Financial Group, Inc. | | | 652,029 | | | | 27,372,178 | |
Comerica Inc. | | | 94,852 | | | | 8,234,102 | |
Fifth Third Bancorp | | | 589,985 | | | | 17,900,145 | |
First Horizon National Corp. | | | 440,327 | | | | 8,802,137 | |
PNC Financial Services Group, Inc. (The) | | | 133,922 | | | | 19,323,605 | |
| | | | | | | | 81,632,167 | |
| |
| Semiconductors–1.75% | | | | | |
Intel Corp. | | | 285,142 | | | | 13,162,155 | |
QUALCOMM Inc. | | | 224,279 | | | | 14,358,341 | |
| | | | | | | | 27,520,496 | |
| |
| Systems Software–1.47% | | | | | |
Oracle Corp. | | | 488,572 | | | | 23,099,684 | |
| |
| Tobacco–1.12% | | | | | |
Philip Morris International Inc. | | | 166,468 | | | | 17,587,344 | |
|
| Wireless Telecommunication Services–0.51% | |
Vodafone Group PLC–ADR (United Kingdom) | | | 249,308 | | | | 7,952,925 | |
Total Common Stocks & Other Equity Interests
(Cost $691,609,804) | | | | 1,012,357,080 | |
| | | | | | | | |
| | | Principal
Amount | | | Value | |
Bonds & Notes–16.46% | | | | | |
| Aerospace & Defense–0.30% | | | | | |
BAE Systems Holdings Inc. (United Kingdom), Sr. Unsec. Gtd. Notes, 2.85%, 12/15/2020(c) | | $ | 288,000 | | | $ | 289,471 | |
Northrop Grumman Corp., Sr. Unsec. Global Notes, 1.75%, 06/01/2018 | | | 3,530,000 | | | | 3,527,935 | |
Precision Castparts Corp., Sr. Unsec. Global Notes,
1.25%, 01/15/2018 | | | 590,000 | | | | 589,828 | |
2.50%, 01/15/2023 | | | 365,000 | | | | 362,893 | |
| | | | | | | | 4,770,127 | |
| |
| Agricultural & Farm Machinery–0.08% | | | | | |
Deere & Co., Sr. Unsec. Notes, 2.60%, 06/08/2022 | | | 1,275,000 | | | | 1,277,008 | |
| |
| Agricultural Products–0.02% | | | | | |
Ingredion Inc., Sr. Unsec. Notes, 6.63%, 04/15/2037 | | | 255,000 | | | | 329,223 | |
| |
| Air Freight & Logistics–0.12% | | | | | |
FedEx Corp.,
Sr. Unsec. Gtd. Bonds, 4.90%, 01/15/2034 | | | 440,000 | | | | 499,871 | |
Sr. Unsec. Gtd. Notes,
5.10%, 01/15/2044 | | | 910,000 | | | | 1,062,145 | |
United Parcel Service, Inc., Sr. Unsec. Notes, 3.40%, 11/15/2046 | | | 258,000 | | | | 249,963 | |
| | | | | | | | 1,811,979 | |
| |
| Airlines–0.12% | | | | | |
American Airlines Pass Through Trust, Series 2014-1, Class A, Sr. Sec. First Lien Pass Through Ctfs.,
3.70%, 04/01/2028 | | | 373,815 | | | | 383,161 | |
Continental Airlines Pass Through Trust, | | | | | | | | |
Series 2010-1, Class A, Sr. Sec. First Lien Pass Through Ctfs., 4.75%, 01/12/2021 | | | 192,384 | | | | 201,941 | |
Series 2012-1, Class A, Sr. Sec. First Lien Pass Through Ctfs., 4.15%, 04/11/2024 | | | 397,043 | | | | 415,903 | |
Delta Air Lines Pass Through Trust, Series 2010-1, Class A, Sr. Sec. First Lien Pass Through Ctfs., 6.20%, 01/02/2020 | | | 97,991 | | | | 99,705 | |
United Airlines Pass Through Trust, Series 2014-2, Class A, Sr. Sec. First Lien Pass Through Ctfs., 3.75%, 09/03/2026 | | | 482,487 | | | | 500,532 | |
Virgin Australia Pass Through Trust (Australia), Series 2013-1, Class A, Sec. Gtd. Pass Through Ctfs., 5.00%, 04/23/2025(c) | | | 303,868 | | | | 316,782 | |
| | | | | | | | 1,918,024 | |
| |
| Application Software–0.55% | | | | | |
Citrix Systems, Inc., Sr. Unsec. Conv. Bonds, 0.50%, 04/15/2019 | | | 2,171,000 | | | | 2,812,802 | |
See accompanying Notes to Financial Statements which are an integral part of the financial statements.
Invesco V.I. Equity and Income Fund
| | | | | | | | |
| | | Principal
Amount | | | Value | |
| Application Software–(continued) | | | | | |
Nuance Communications, Inc., Sr. Unsec. Conv. Bonds, 1.00%, 12/15/2022(d) | | $ | 2,703,000 | | | $ | 2,593,191 | |
RealPage, Inc., Sr. Unsec. Conv. Notes, 1.50%, 11/15/2022(c) | | | 690,000 | | | | 857,325 | |
Workday, Inc., Sr. Unsec. Conv. Notes, 0.25%, 10/01/2022(c) | | | 2,389,000 | | | | 2,368,096 | |
| | | | | | | | 8,631,414 | |
| |
| Asset Management & Custody Banks–0.11% | | | | | |
Apollo Management Holdings L.P., Sr. Unsec. Gtd. Notes, 4.00%, 05/30/2024(c) | | | 425,000 | | | | 435,375 | |
Brookfield Asset Management Inc. (Canada), Sr. Unsec. Notes, 4.00%, 01/15/2025 | | | 460,000 | | | | 472,673 | |
Carlyle Holdings Finance LLC, Sr. Unsec. Gtd. Notes, 3.88%, 02/01/2023(c) | | | 395,000 | | | | 404,704 | |
KKR Group Finance Co. III LLC, Sr. Unsec. Gtd. Bonds, 5.13%, 06/01/2044(c) | | | 315,000 | | | | 349,669 | |
| | | | | | | | 1,662,421 | |
| |
| Automobile Manufacturers–0.19% | | | | | |
Daimler Finance North America LLC (Germany), Sr. Unsec. Gtd. Notes, 1.88%, 01/11/2018(c) | | | 555,000 | | | | 554,982 | |
Ford Motor Credit Co. LLC, Sr. Unsec. Global Notes,
3.10%, 05/04/2023 | | | 267,000 | | | | 265,755 | |
3.81%, 01/09/2024 | | | 445,000 | | | | 454,785 | |
4.13%, 08/04/2025 | | | 687,000 | | | | 711,492 | |
General Motors Co., Sr. Unsec. Global Notes, 6.60%, 04/01/2036 | | | 397,000 | | | | 484,749 | |
General Motors Financial Co., Inc., Sr. Unsec. Gtd. Global Notes, 5.25%, 03/01/2026 | | | 503,000 | | | | 553,874 | |
| | | | | | | | 3,025,637 | |
| |
| Automotive Retail–0.07% | | | | | |
Advance Auto Parts, Inc., Sr. Unsec. Gtd. Notes, | | | | | | | | |
4.50%, 12/01/2023 | | | 660,000 | | | | 694,665 | |
5.75%, 05/01/2020 | | | 399,000 | | | | 425,384 | |
| | | | | | | | 1,120,049 | |
| |
| Biotechnology–0.54% | | | | | |
AbbVie Inc., Sr. Unsec. Global Notes, 4.50%, 05/14/2035 | | | 720,000 | | | | 792,657 | |
BioMarin Pharmaceutical Inc., Sr. Unsec. Sub. Conv. Notes, 1.50%, 10/15/2020 | | | 2,388,000 | | | | 2,840,227 | |
Celgene Corp., Sr. Unsec. Global Notes, | | | | | | | | |
4.00%, 08/15/2023 | | | 485,000 | | | | 510,822 | |
4.63%, 05/15/2044 | | | 1,390,000 | | | | 1,487,465 | |
Gilead Sciences, Inc., Sr. Unsec. Global Notes, 4.40%, 12/01/2021 | | | 492,000 | | | | 524,952 | |
| | | | | | | | |
| | | Principal
Amount | | | Value | |
| Biotechnology–(continued) | | | | | | | | |
Neurocrine Biosciences, Inc., Sr. Unsec. Conv. Notes, 2.25%, 05/15/2024(c) | | $ | 1,853,000 | | | $ | 2,370,682 | |
| | | | | | | | 8,526,805 | |
| |
| Brewers–0.35% | | | | | |
Anheuser-Busch InBev Finance, Inc. (Belgium), Sr. Unsec. Gtd. Global Notes, | | | | | | | | |
2.65%, 02/01/2021 | | | 625,000 | | | | 628,531 | |
3.30%, 02/01/2023 | | | 593,000 | | | | 607,414 | |
4.70%, 02/01/2036 | | | 1,005,000 | | | | 1,130,524 | |
4.90%, 02/01/2046 | | | 1,122,000 | | | | 1,304,433 | |
Heineken NV (Netherlands), Sr. Unsec. Notes, 3.50%, 01/29/2028(c) | | | 1,000,000 | | | | 1,022,009 | |
Molson Coors Brewing Co., Sr. Unsec. Gtd. Global Notes, | | | | | | | | |
1.45%, 07/15/2019 | | | 341,000 | | | | 336,834 | |
4.20%, 07/15/2046 | | | 395,000 | | | | 403,808 | |
| | | | | | | | 5,433,553 | |
| |
| Broadcasting–0.76% | | | | | |
Liberty Interactive LLC, Sr. Unsec. Conv. Deb., 1.75%, 10/05/2023(c)(d) | | | 2,357,000 | | | | 2,732,647 | |
Liberty Media Corp., | | | | | |
Sr. Unsec. Conv. Deb., 2.25%, 10/05/2021(d) | | | 1,538,000 | | | | 1,609,132 | |
Sr. Unsec. Conv. Notes, 1.38%, 10/15/2023 | | | 6,063,000 | | | | 7,007,009 | |
Liberty Formula One Sr. Unsec. Conv. Notes, 1.00%, 01/30/2023(c) | | | 570,000 | | | | 639,113 | |
| | | | | | | | 11,987,901 | |
| |
| Cable & Satellite–0.50% | | | | | |
Charter Communications Operating, LLC/Charter Communications Operating Capital Corp., Sr. Sec. Gtd. First Lien Global Notes, 4.46%, 07/23/2022 | | | 1,065,000 | | | | 1,112,136 | |
Comcast Corp.,
Sr. Unsec. Gtd. Global Notes, 5.70%, 05/15/2018 | | | 445,000 | | | | 451,328 | |
Sr. Unsec. Gtd. Notes, 6.45%, 03/15/2037 | | | 305,000 | | | | 412,011 | |
DISH Network Corp., Sr. Unsec. Conv. Bonds, 3.38%, 08/15/2026 | | | 4,954,000 | | | | 5,402,956 | |
NBCUniversal Media LLC, Sr. Unsec. Gtd. Global Notes, | | | | | | | | |
5.15%, 04/30/2020 | | | 175,000 | | | | 186,498 | |
5.95%, 04/01/2041 | | | 215,000 | | | | 280,616 | |
| | | | | | | | 7,845,545 | |
| |
| Commodity Chemicals–0.06% | | | | | |
Basell Finance Co. B.V. (Netherlands), Sr. Unsec. Gtd. Deb., 8.10%, 03/15/2027(c) | | | 745,000 | | | | 989,941 | |
See accompanying Notes to Financial Statements which are an integral part of the financial statements.
Invesco V.I. Equity and Income Fund
| | | | | | | | |
| | | Principal
Amount | | | Value | |
| Communications Equipment–0.55% | | | | | |
Ciena Corp., Sr. Unsec. Conv. Bonds, 4.00%, 12/15/2020 | | $ | 1,610,000 | | | $ | 2,105,075 | |
Finisar Corp., Sr. Unsec. Conv. Bonds, 0.50%, 12/15/2021(d) | | | 1,114,000 | | | | 1,038,805 | |
Viavi Solutions Inc.,
Sr. Unsec. Conv. Deb., | | | | | |
0.63%, 08/15/2018(d) | | | 3,377,000 | | | | 3,486,753 | |
Sr. Unsec. Conv. Notes, 1.00%, 03/01/2024(c) | | | 1,986,000 | | | | 1,967,381 | |
| | | | | | | | 8,598,014 | |
| |
| Consumer Finance–0.06% | | | | | |
American Express Co., Unsec. Sub. Global Notes, 3.63%, 12/05/2024 | | | 336,000 | | | | 346,171 | |
Synchrony Financial, Sr. Unsec. Global Notes, 3.95%, 12/01/2027 | | | 600,000 | | | | 598,513 | |
| | | | | | | | 944,684 | |
|
| Data Processing & Outsourced Services–0.26% | |
Blackhawk Network Holdings, Inc., Sr. Unsec. Conv. Bonds, 1.50%, 01/15/2022 | | | 3,275,000 | | | | 3,342,547 | |
Visa Inc., Sr. Unsec. Global Notes, 4.15%, 12/14/2035 | | | 670,000 | | | | 744,763 | |
| | | | | | | | 4,087,310 | |
| |
| Diversified Banks–1.17% | | | | | |
ANZ New Zealand (Int’l) Ltd. (New Zealand), Sr. Unsec. Gtd. Notes, 2.88%, 01/25/2022(c) | | | 350,000 | | | | 351,078 | |
Australia and New Zealand Banking Group Ltd. (Australia), Sr. Unsec. Medium-Term Global Notes, 2.30%, 06/01/2021 | | | 713,000 | | | | 707,179 | |
Bank of America Corp.,
Sr. Unsec. Medium-Term Global Notes, | | | | | | | | |
3.50%, 04/19/2026 | | | 615,000 | | | | 629,289 | |
5.65%, 05/01/2018 | | | 350,000 | | | | 354,193 | |
Sr. Unsec. Medium-Term Notes, 3.25%, 10/21/2027 | | | 565,000 | | | | 561,189 | |
BBVA Bancomer S.A. (Mexico), Sr. Unsec. Notes, 4.38%, 04/10/2024(c) | | | 700,000 | | | | 731,500 | |
Citigroup Inc.,
Sr. Unsec. Global Notes, 3.67%, 07/24/2028 | | | 545,000 | | | | 553,432 | |
Unsec. Sub. Global Notes, | | | | | | | | |
5.30%, 05/06/2044 | | | 250,000 | | | | 296,039 | |
6.68%, 09/13/2043 | | | 815,000 | | | | 1,131,053 | |
Unsec. Sub. Notes, 4.75%, 05/18/2046 | | | 375,000 | | | | 414,681 | |
Commonwealth Bank of Australia (Australia), Sr. Unsec. Notes, 2.25%, 03/10/2020(c) | | | 1,085,000 | | | | 1,081,941 | |
HBOS PLC (United Kingdom), Unsec. Sub. Medium-Term Global Notes, 6.75%, 05/21/2018(c) | | | 325,000 | | | | 330,541 | |
| | | | | | | | |
| | | Principal
Amount | | | Value | |
| Diversified Banks–(continued) | | | | | |
JPMorgan Chase & Co.,
Sr. Unsec. Global Notes, | | | | | | | | |
3.20%, 06/15/2026 | | $ | 415,000 | | | $ | 415,123 | |
4.26%, 02/22/2048 | | | 525,000 | | | | 569,164 | |
4.50%, 01/24/2022 | | | 80,000 | | | | 85,642 | |
Unsec. Sub. Global Notes, 4.25%, 10/01/2027 | | | 345,000 | | | | 367,310 | |
Series V, Jr. Unsec. Sub. Global Notes, 5.00%(e) | | | 640,000 | | | | 651,923 | |
Mizuho Financial Group Cayman 3 Ltd. (Japan), Unsec. Gtd. Sub. Notes, 4.60%, 03/27/2024(c) | | | 200,000 | | | | 211,729 | |
National Australia Bank Ltd. (Australia), Sr. Unsec. Medium-Term Global Notes, | | | | | | | | |
2.00%, 01/14/2019 | | | 930,000 | | | | 928,482 | |
Sr. Unsec. Notes, | | | | | | | | |
1.88%, 07/12/2021 | | | 945,000 | | | | 925,230 | |
3.50%, 01/10/2027(c) | | | 1,055,000 | | | | 1,079,631 | |
Société Générale S.A. (France), Sr. Unsec. Notes, 2.63%, 09/16/2020(c) | | | 890,000 | | | | 892,615 | |
Unsec. Sub. Notes, 5.00%,
01/17/2024(c) | | | 735,000 | | | | 785,548 | |
Standard Chartered PLC (United Kingdom), Sr. Unsec. Notes, 3.05%, 01/15/2021(c) | | | 680,000 | | | | 686,338 | |
Sumitomo Mitsui Banking Corp. (Japan), Sr. Unsec. Gtd. Medium-Term Global Notes, 2.65%, 07/23/2020 | | | 715,000 | | | | 718,602 | |
U.S. Bancorp, Series W, Unsec. Sub. Medium-Term Notes, 3.10%, 04/27/2026 | | | 295,000 | | | | 293,164 | |
Wells Fargo & Co.,
Sr. Unsec. Medium-Term Global Notes, 1.50%, 01/16/2018 | | | 180,000 | | | | 179,982 | |
Sr. Unsec. Medium-Term Notes, 3.55%, 09/29/2025 | | | 655,000 | | | | 672,849 | |
Unsec. Sub. Medium-Term Notes, | | | | | | | | |
4.10%, 06/03/2026 | | | 450,000 | | | | 472,260 | |
4.65%, 11/04/2044 | | | 1,200,000 | | | | 1,310,541 | |
| | | | | | | | 18,388,248 | |
| |
| Diversified Capital Markets–0.55% | | | | | |
Credit Suisse AG (Switzerland), Sr. Unsec. Conv. Medium-Term Notes, 0.50%, 06/24/2024(c) | | | 7,880,000 | | | | 7,814,596 | |
Unsec. Sub. Notes, 6.50%,
08/08/2023(c) | | | 686,000 | | | | 769,263 | |
| | | | | | | | 8,583,859 | |
| |
| Diversified Chemicals–0.05% | | | | | |
Eastman Chemical Co., Sr. Unsec. Global Notes, 2.70%, 01/15/2020 | | | 795,000 | | | | 800,464 | |
| |
| Diversified Metals & Mining–0.02% | | | | | |
Rio Tinto Finance USA Ltd. (United Kingdom), Sr. Unsec. Gtd. Global Notes, 7.13%, 07/15/2028 | | | 200,000 | | | | 264,415 | |
See accompanying Notes to Financial Statements which are an integral part of the financial statements.
Invesco V.I. Equity and Income Fund
| | | | | | | | |
| | | Principal
Amount | | | Value | |
| Drug Retail–0.15% | | | | | |
CVS Health Corp., Sr. Unsec. Global Bonds, 3.38%, 08/12/2024 | | $ | 375,000 | | | $ | 377,479 | |
CVS Pass Through Trust, Sr. Sec. First Lien Global Pass Through Ctfs., 6.04%, 12/10/2028 | | | 804,411 | | | | 895,283 | |
Walgreens Boots Alliance Inc., Sr. Unsec. Global Notes, | | | | | | | | |
3.30%, 11/18/2021 | | | 602,000 | | | | 612,515 | |
4.50%, 11/18/2034 | | | 444,000 | | | | 464,659 | |
| | | | | | | | 2,349,936 | |
| |
| Electric Utilities–0.26% | | | | | |
Duke Energy Corp., Sr. Unsec. Global Notes, 2.10%, 06/15/2018 | | | 1,250,000 | | | | 1,250,458 | |
Electricite de France S.A. (France), | | | | | |
Jr. Unsec. Sub. Notes, 5.63%(c)(e) | | | 745,000 | | | | 772,006 | |
Sr. Unsec. Notes, | | | | | | | | |
4.60%, 01/27/2020(c) | | | 150,000 | | | | 157,043 | |
4.88%, 01/22/2044(c) | | | 930,000 | | | | 1,036,427 | |
NextEra Energy Capital Holdings Inc., Sr. Unsec. Gtd. Deb., 3.55%, 05/01/2027 | | | 569,000 | | | | 580,564 | |
Ohio Power Co., Series M, Sr. Unsec. Notes, 5.38%, 10/01/2021 | | | 200,000 | | | | 219,970 | |
PPL Electric Utilities Corp., Sr. Sec. First Mortgage Bonds, 6.25%, 05/15/2039 | | | 50,000 | | | | 68,843 | |
Virginia Electric & Power Co., Sr. Unsec. Notes, 5.00%, 06/30/2019 | | | 15,000 | | | | 15,565 | |
| | | | | | | | 4,100,876 | |
| |
| Environmental & Facilities Services–0.03% | | | | | |
Waste Management, Inc., Sr. Unsec. Gtd. Global Notes, 3.90%, 03/01/2035 | | | 469,000 | | | | 492,861 | |
| |
| Fertilizers & Agricultural Chemicals–0.02% | | | | | |
Monsanto Co., Sr. Unsec. Global Notes, 2.13%, 07/15/2019 | | | 305,000 | | | | 304,010 | |
| |
| Financial Exchanges & Data–0.06% | | | | | |
Moody’s Corp., Sr. Unsec. Global Notes, 4.50%, 09/01/2022 | | | 935,000 | | | | 1,002,706 | |
| |
| Food Retail–0.01% | | | | | |
Alimentation Couche-Tard Inc. (Canada), Sr. Unsec. Gtd. Notes, 4.50%, 07/26/2047(c) | | | 120,000 | | | | 125,294 | |
| |
| Gas Utilities–0.04% | | | | | |
NiSource Finance Corp., Sr. Unsec. Gtd. Global Notes, 4.38%, 05/15/2047 | | | 616,000 | | | | 677,406 | |
| |
| General Merchandise Stores–0.02% | | | | | |
Dollar General Corp., Sr. Unsec. Global Notes, 3.25%, 04/15/2023 | | | 365,000 | | | | 370,297 | |
| |
| Health Care Distributors–0.07% | | | | | |
McKesson Corp., Sr. Unsec. Global Notes, 2.28%, 03/15/2019 | | | 1,095,000 | | | | 1,095,448 | |
| | | | | | | | |
| | | Principal
Amount | | | Value | |
| Health Care Equipment–0.80% | | | | | |
Becton, Dickinson and Co.,
Sr. Unsec. Global Notes, | | | | | | | | |
4.88%, 05/15/2044 | | $ | 750,000 | | | $ | 803,874 | |
Sr. Unsec. Notes, 2.68%, 12/15/2019 | | | 274,000 | | | | 275,087 | |
DexCom, Inc., Sr. Unsec. Conv. Notes, 0.75%, 05/15/2022(c) | | | 2,591,000 | | | | 2,446,876 | |
Edwards Lifesciences Corp., Sr. Unsec. Global Notes, 2.88%, 10/15/2018 | | | 731,000 | | | | 736,070 | |
Insulet Corp., Sr. Unsec. Conv. Notes, 1.38%, 11/15/2024(c) | | | 476,000 | | | | 483,437 | |
Medtronic, Inc., Sr. Unsec. Gtd. Global Notes, | | | | | | | | |
3.15%, 03/15/2022 | | | 1,076,000 | | | | 1,102,604 | |
4.38%, 03/15/2035 | | | 358,000 | | | | 404,050 | |
4.63%, 03/15/2044 | | | 525,000 | | | | 602,213 | |
NuVasive, Inc., Sr. Unsec. Conv. Bonds, 2.25%, 03/15/2021 | | | 1,880,000 | | | | 2,213,700 | |
Wright Medical Group N.V., Sr. Unsec. Conv. Bonds, 2.25%, 11/15/2021 | | | 986,000 | | | | 1,205,385 | |
Wright Medical Group, Inc., Sr. Unsec. Gtd. Conv. Bonds, 2.00%, 02/15/2020 | | | 2,203,000 | | | | 2,270,467 | |
| | | | | | | | 12,543,763 | |
| |
| Health Care REIT’s–0.08% | | | | | |
HCP, Inc., Sr. Unsec. Global Notes, | | | | | | | | |
3.88%, 08/15/2024 | | | 505,000 | | | | 517,511 | |
4.20%, 03/01/2024 | | | 480,000 | | | | 502,729 | |
Ventas Realty L.P., Sr. Unsec. Gtd. Notes, 5.70%, 09/30/2043 | | | 215,000 | | | | 262,419 | |
| | | | | | | | 1,282,659 | |
| |
| Health Care Services–0.09% | | | | | |
Express Scripts Holding Co., Sr. Unsec. Gtd. Global Notes, 2.25%, 06/15/2019 | | | 575,000 | | | | 574,222 | |
Laboratory Corp. of America Holdings, Sr. Unsec. Notes, | | | | | | | | |
3.20%, 02/01/2022 | | | 602,000 | | | | 614,278 | |
4.70%, 02/01/2045 | | | 264,000 | | | | 286,449 | |
| | | | | | | | 1,474,949 | |
| |
| Home Improvement Retail–0.04% | | | | | |
Home Depot, Inc. (The), Sr. Unsec. Global Notes, 2.00%, 04/01/2021 | | | 631,000 | | | | 625,012 | |
| |
| Homebuilding–0.07% | | | | | |
MDC Holdings, Inc., Sr. Unsec. Gtd. Notes, 6.00%, 01/15/2043 | | | 1,050,000 | | | | 1,031,625 | |
| |
| Hotel and Resort REIT’s–0.03% | | | | | |
Hospitality Properties Trust, Sr. Unsec. Notes, | | | | | | | | |
4.50%, 06/15/2023 | | | 270,000 | | | | 282,591 | |
5.00%, 08/15/2022 | | | 200,000 | | | | 213,598 | |
| | | | | | | | 496,189 | |
See accompanying Notes to Financial Statements which are an integral part of the financial statements.
Invesco V.I. Equity and Income Fund
| | | | | | | | |
| | | Principal
Amount | | | Value | |
| Housewares & Specialties–0.03% | | | | | |
Tupperware Brands Corp., Sr. Unsec. Gtd. Global Notes, 4.75%, 06/01/2021 | | $ | 475,000 | | | $ | 501,073 | |
| |
| Insurance Brokers–0.02% | | | | | |
Willis North America, Inc., Sr. Unsec. Gtd. Global Notes, 3.60%, 05/15/2024 | | | 250,000 | | | | 254,449 | |
| |
| Integrated Oil & Gas–0.29% | | | | | |
Chevron Corp., Sr. Unsec. Global Notes, | | | | | | | | |
1.37%, 03/02/2018 | | | 1,428,000 | | | | 1,427,079 | |
1.72%, 06/24/2018 | | | 520,000 | | | | 520,034 | |
Husky Energy Inc. (Canada), Sr. Unsec. Global Notes, 3.95%, 04/15/2022 | | | 300,000 | | | | 310,640 | |
Occidental Petroleum Corp., Sr. Unsec. Global Notes, 3.40%, 04/15/2026 | | | 365,000 | | | | 374,100 | |
Petróleos Mexicanos (Mexico), Sr. Unsec. Gtd. Global Notes, 4.88%, 01/24/2022 | | | 570,000 | | | | 595,507 | |
Shell International Finance B.V. (Netherlands), Sr. Unsec. Gtd. Global Notes, 4.00%, 05/10/2046 | | | 897,000 | | | | 956,908 | |
Suncor Energy Inc. (Canada), Sr. Unsec. Notes, 3.60%, 12/01/2024 | | | 334,000 | | | | 341,764 | |
| | | | | | | | 4,526,032 | |
|
| Integrated Telecommunication Services–0.57% | |
AT&T Inc.,
Sr. Unsec. Global Notes, | | | | | | | | |
3.00%, 06/30/2022 | | | 520,000 | | | | 521,384 | |
3.40%, 05/15/2025 | | | 289,000 | | | | 284,522 | |
4.50%, 05/15/2035 | | | 463,000 | | | | 461,322 | |
4.80%, 06/15/2044 | | | 935,000 | | | | 927,461 | |
4.90%, 08/14/2037 | | | 1,987,000 | | | | 2,021,021 | |
5.15%, 03/15/2042 | | | 90,000 | | | | 93,635 | |
5.35%, 09/01/2040 | | | 101,000 | | | | 106,861 | |
Sr. Unsec. Notes, | | | | | | | | |
4.30%, 02/15/2030(c) | | | 348,000 | | | | 348,409 | |
5.15%, 11/15/2046(c) | | | 140,000 | | | | 143,502 | |
Telefónica Emisiones, S.A.U. (Spain), Sr. Unsec. Gtd. Global Notes, | | | | | | | | |
5.21%, 03/08/2047 | | | 700,000 | | | | 796,840 | |
7.05%, 06/20/2036 | | | 360,000 | | | | 484,061 | |
Verizon Communications Inc., Sr. Unsec. Global Notes, | | | | | | | | |
4.13%, 08/15/2046 | | | 83,000 | | | | 76,917 | |
4.40%, 11/01/2034 | | | 325,000 | | | | 331,937 | |
4.52%, 09/15/2048 | | | 1,073,000 | | | | 1,059,902 | |
4.81%, 03/15/2039 | | | 503,000 | | | | 527,616 | |
5.01%, 08/21/2054 | | | 694,000 | | | | 711,550 | |
| | | | | | | | 8,896,940 | |
| |
| Internet & Direct Marketing Retail–0.35% | | | | | |
Ctrip.com International, Ltd. (China), Sr. Unsec. Conv. Bonds, 1.25%, 09/15/2019(d) | | | 2,992,000 | | | | 3,063,060 | |
| | | | | | | | |
| | | Principal
Amount | | | Value | |
| Internet & Direct Marketing Retail–(continued) | |
Liberty Expedia Holdings, Inc., Sr. Unsec. Conv. Deb., 1.00%, 07/05/2022(c)(d) | | $ | 1,574,000 | | | $ | 1,577,935 | |
QVC, Inc., Sr. Sec. Gtd. First Lien Global Notes, 5.45%, 08/15/2034 | | | 880,000 | | | | 885,879 | |
| | | | | | | | 5,526,874 | |
| |
| Internet Software & Services–0.12% | | | | | |
eBay Inc., Sr. Unsec. Global Notes, 2.50%, 03/09/2018 | | | 1,865,000 | | | | 1,866,822 | |
| |
| Investment Banking & Brokerage–1.20% | | | | | |
Goldman Sachs Group, Inc. (The), Sr. Unsec. Global Notes, | | | | | | | | |
4.02%, 10/31/2038 | | | 550,000 | | | | 566,346 | |
5.25%, 07/27/2021 | | | 400,000 | | | | 433,686 | |
Unsec. Sub. Notes, 4.25%, 10/21/2025 | | | 552,000 | | | | 577,345 | |
Series 0000, Sr. Unsec. Exchangeable Basket-Linked Conv. Medium-Term Notes, 1.00%, 09/28/2020(c)(f) | | | 6,230,000 | | | | 10,454,999 | |
GS Finance Corp., Series 0001, Sr. Unsec. Conv. Medium-Term Notes, 0.25%, 07/08/2024 | | | 5,920,000 | | | | 6,117,432 | |
Morgan Stanley, Sr. Unsec. Medium-Term Global Notes, 4.00%, 07/23/2025 | | | 680,000 | | | | 712,520 | |
| | | | | | | | 18,862,328 | |
| |
| IT Consulting & Other Services–0.03% | | | | | |
DXC Technology Co., Sr. Unsec. Global Notes, 4.45%, 09/18/2022 | | | 490,000 | | | | 516,187 | |
| |
| Life & Health Insurance–0.52% | | | | | |
Athene Global Funding, Sec. Notes, | | | | | | | | |
2.88%, 10/23/2018(c) | | | 624,000 | | | | 627,356 | |
4.00%, 01/25/2022(c) | | | 1,220,000 | | | | 1,259,482 | |
Jackson National Life Global Funding, Sr. Sec. Notes, | | | | | | | | |
2.10%, 10/25/2021(c) | | | 525,000 | | | | 515,335 | |
3.25%, 01/30/2024(c) | | | 480,000 | | | | 485,099 | |
Metropolitan Life Global Funding I, Sec. Notes, 2.05%, 06/12/2020(c) | | | 590,000 | | | | 585,888 | |
Nationwide Financial Services Inc., Sr. Unsec. Notes, 5.30%, 11/18/2044(c) | | | 910,000 | | | | 1,082,732 | |
Prudential Financial, Inc., Jr. Unsec. Sub. Global Notes, 8.88%, 06/15/2068 | | | 1,915,000 | | | | 1,971,971 | |
Sr. Unsec. Notes, | | | | | | | | |
3.91%, 12/07/2047(c) | | | 155,000 | | | | 158,363 | |
3.94%, 12/07/2049(c) | | | 496,000 | | | | 507,830 | |
Reliance Standard Life Global Funding II, Sr. Sec. First Lien Notes, 3.05%, 01/20/2021(c) | | | 465,000 | | | | 471,479 | |
Teachers Insurance and Annuity Association of America, Unsec. Sub. Notes, 4.27%, 05/15/2047(c) | | | 498,000 | | | | 527,494 | |
| | | | | | | | 8,193,029 | |
See accompanying Notes to Financial Statements which are an integral part of the financial statements.
Invesco V.I. Equity and Income Fund
| | | | | | | | |
| | | Principal
Amount | | | Value | |
| Movies & Entertainment–0.10% | | | | | |
Live Nation Entertainment, Inc., Sr. Unsec. Conv. Bonds, 2.50%, 05/15/2019 | | $ | 1,203,000 | | | $ | 1,558,637 | |
| |
| Multi-Line Insurance–0.11% | | | | | |
American Financial Group, Inc., Sr. Unsec. Notes, 4.50%, 06/15/2047 | | | 520,000 | | | | 542,435 | |
American International Group, Inc., Sr. Unsec. Global Notes, | | | | | | | | |
2.30%, 07/16/2019 | | | 385,000 | | | | 384,819 | |
4.38%, 01/15/2055 | | | 720,000 | | | | 735,960 | |
| | | | | | | | 1,663,214 | |
| |
| Office REIT’s–0.05% | | | | | |
Government Properties Income Trust, Sr. Unsec. Global Notes, 4.00%, 07/15/2022 | | | 730,000 | | | | 735,064 | |
| |
| Office Services & Supplies–0.02% | | | | | |
Pitney Bowes Inc., Sr. Unsec. Global Notes, 4.63%, 03/15/2024 | | | 374,000 | | | | 342,210 | |
| |
| Oil & Gas Drilling–0.18% | | | | | |
Ensco Jersey Finance Ltd., Sr. Unsec. Gtd. Conv. Bonds, 3.00%, 01/31/2024 | | | 2,100,000 | | | | 1,874,250 | |
Nabors Industries Inc., Sr. Unsec. Gtd. Conv. Notes, 0.75%, 01/15/2024(c) | | | 1,150,000 | | | | 884,063 | |
| | | | | | | | 2,758,313 | |
| |
| Oil & Gas Equipment & Services–0.27% | | | | | |
Helix Energy Solutions Group, Inc., Sr. Unsec. Conv. Notes, 4.25%, 05/01/2022 | | | 1,105,000 | | | | 1,103,619 | |
Weatherford International Ltd., Sr. Unsec. Gtd. Conv. Notes, 5.88%, 07/01/2021 | | | 2,952,000 | | | | 3,206,610 | |
| | | | | | | | 4,310,229 | |
| |
| Oil & Gas Exploration & Production–0.34% | | | | | |
Anadarko Petroleum Corp., Sr. Unsec. Notes, 6.60%, 03/15/2046 | | | 443,000 | | | | 571,415 | |
Chesapeake Energy Corp., Sr. Unsec. Gtd. Conv. Notes, 5.50%, 09/15/2026(c) | | | 1,042,000 | | | | 954,081 | |
Concho Resources Inc., Sr. Unsec. Gtd. Global Notes, | | | | | | | | |
3.75%, 10/01/2027 | | | 488,000 | | | | 494,620 | |
4.88%, 10/01/2047 | | | 539,000 | | | | 591,302 | |
ConocoPhillips Co., Sr. Unsec. Gtd. Global Notes, | | | | | | | | |
2.88%, 11/15/2021 | | | 859,000 | | | | 869,652 | |
4.15%, 11/15/2034 | | | 921,000 | | | | 980,895 | |
Noble Energy, Inc., Sr. Unsec. Global Notes, 5.25%, 11/15/2043 | | | 830,000 | | | | 922,246 | |
| | | | | | | | 5,384,211 | |
| | | | | | | | |
| | | Principal
Amount | | | Value | |
| Oil & Gas Storage & Transportation–0.57% | | | | | |
Andeavor Logistics LP/ Tesoro Logistics Finance Corp., Sr. Unsec. Gtd. Global Notes, 5.20%, 12/01/2047 | | $ | 690,000 | | | $ | 721,782 | |
Enable Midstream Partners, LP, Sr. Unsec. Global Notes, 2.40%, 05/15/2019 | | | 440,000 | | | | 437,584 | |
Enbridge Inc. (Canada), Sr. Unsec. Global Notes, 5.50%, 12/01/2046 | | | 424,000 | | | | 511,386 | |
Energy Transfer, LP, Sr. Unsec. Notes, 4.90%, 03/15/2035 | | | 357,000 | | | | 353,932 | |
Enterprise Products Operating LLC, Sr. Unsec. Gtd. Global Bonds, 6.45%, 09/01/2040 | | | 25,000 | | | | 32,497 | |
Sr. Unsec. Gtd. Global Notes, 5.25%, 01/31/2020 | | | 155,000 | | | | 163,727 | |
Sr. Unsec. Gtd. Notes, 2.55%, 10/15/2019 | | | 370,000 | | | | 371,279 | |
Series N, Sr. Unsec. Gtd. Notes, 6.50%, 01/31/2019 | | | 245,000 | | | | 256,068 | |
Kinder Morgan Inc., Sr. Unsec. Gtd. Notes, 5.30%, 12/01/2034 | | | 422,000 | | | | 451,146 | |
MPLX LP,
Sr. Unsec. Global Bonds, 4.50%, 07/15/2023 | | | 1,820,000 | | | | 1,924,851 | |
Sr. Unsec. Global Notes, 5.50%, 02/15/2023 | | | 745,000 | | | | 767,596 | |
Plains All American Pipeline L.P./ PAA Finance Corp., Sr. Unsec. Global Notes, 3.65%, 06/01/2022 | | | 355,000 | | | | 357,369 | |
Spectra Energy Partners, L.P., Sr. Unsec. Global Notes, 4.50%, 03/15/2045 | | | 536,000 | | | | 555,050 | |
Sunoco Logistics Partners Operations L.P., Sr. Unsec. Gtd. Notes, | | | | | | | | |
5.30%, 04/01/2044 | | | 645,000 | | | | 639,834 | |
5.50%, 02/15/2020 | | | 535,000 | | | | 563,853 | |
Texas Eastern Transmission L.P., Sr. Unsec. Notes, 7.00%, 07/15/2032 | | | 185,000 | | | | 236,828 | |
Western Gas Partners, LP, Sr. Unsec. Notes, 5.45%, 04/01/2044 | | | 600,000 | | | | 639,322 | |
| | | | | | | | 8,984,104 | |
| |
| Other Diversified Financial Services–0.20% | | | | | |
ERAC USA Finance LLC, Sr. Unsec. Gtd. Notes, 2.35%, 10/15/2019(c) | | | 935,000 | | | | 932,633 | |
MassMutual Global Funding II,
Sec. Notes, 2.00%, 04/15/2021(c) | | | 945,000 | | | | 930,636 | |
Sr. Sec. Notes, 2.10%, 08/02/2018(c) | | | 975,000 | | | | 976,354 | |
SMBC Aviation Capital Finance DAC (Ireland), Sr. Unsec. Gtd. Notes, 2.65%, 07/15/2021(c) | | | 315,000 | | | | 310,019 | |
| | | | | | | | 3,149,642 | |
| |
| Packaged Foods & Meats–0.06% | | | | | |
General Mills, Inc., Sr. Unsec. Global Notes, 2.20%, 10/21/2019 | | | 850,000 | | | | 850,062 | |
See accompanying Notes to Financial Statements which are an integral part of the financial statements.
Invesco V.I. Equity and Income Fund
| | | | | | | | |
| | | Principal
Amount | | | Value | |
| Packaged Foods & Meats–(continued) | | | | | |
Mead Johnson Nutrition Co. (United Kingdom), Sr. Unsec. Gtd. Global Notes, 4.13%, 11/15/2025 | | $ | 64,000 | | | $ | 67,929 | |
| | | | | | | | 917,991 | |
| |
| Paper Packaging–0.10% | | | | | |
International Paper Co., Sr. Unsec. Global Notes, 6.00%, 11/15/2041 | | | 245,000 | | | | 307,478 | |
Packaging Corp. of America, Sr. Unsec. Global Notes, 4.50%, 11/01/2023 | | | 1,139,000 | | | | 1,226,641 | |
| | | | | | | | 1,534,119 | |
| |
| Pharmaceuticals–0.53% | | | | | |
Allergan Funding SCS, Sr. Unsec. Gtd. Global Notes, 4.85%, 06/15/2044 | | | 950,000 | | | | 1,019,889 | |
Bayer US Finance LLC (Germany), Sr. Unsec. Gtd. Notes, | | | | | | | | |
2.38%, 10/08/2019(c) | | | 2,270,000 | | | | 2,271,595 | |
3.00%, 10/08/2021(c) | | | 590,000 | | | | 596,309 | |
GlaxoSmithKline Capital Inc. (United Kingdom), Sr. Unsec. Gtd. Global Bonds, | | | | | | | | |
5.65%, 05/15/2018 | | | 75,000 | | | | 76,036 | |
6.38%, 05/15/2038 | | | 70,000 | | | | 98,871 | |
Jazz Investments I Ltd., Sr. Unsec. Gtd. Conv. Bonds, 1.88%, 08/15/2021 | | | 1,455,000 | | | | 1,463,184 | |
Medicines Co. (The), Sr. Unsec. Conv. Bonds, 2.75%, 07/15/2023 | | | 938,000 | | | | 862,374 | |
Merck Sharp & Dohme Corp., Sr. Unsec. Gtd. Global Notes, 5.00%, 06/30/2019 | | | 280,000 | | | | 292,047 | |
Mylan N.V., Sr. Unsec. Gtd. Global Notes, 3.15%, 06/15/2021 | | | 431,000 | | | | 433,708 | |
Pacira Pharmaceuticals, Inc., Sr. Unsec. Conv. Notes, 2.38%, 04/01/2022(c) | | | 792,000 | | | | 831,600 | |
Zoetis Inc., Sr. Unsec. Global Notes, 4.70%, 02/01/2043 | | | 365,000 | | | | 409,250 | |
| | | | | | | | 8,354,863 | |
| |
| Property & Casualty Insurance–0.30% | | | | | |
Allstate Corp. (The), Sr. Unsec. Bonds, 3.28%, 12/15/2026 | | | 320,000 | | | | 325,347 | |
CNA Financial Corp., Sr. Unsec. Global Bonds, 5.88%, 08/15/2020 | | | 325,000 | | | | 351,735 | |
Liberty Mutual Group Inc., Sr. Unsec. Gtd. Bonds, 4.85%, 08/01/2044(c) | | | 975,000 | | | | 1,086,870 | |
Markel Corp., Sr. Unsec. Notes, 5.00%, 03/30/2043 | | | 385,000 | | | | 433,387 | |
Old Republic International Corp., Sr. Unsec. Conv. Notes, 3.75%, 03/15/2018 | | | 970,000 | | | | 1,349,512 | |
Travelers Cos., Inc. (The), Sr. Unsec. Global Notes, 4.60%, 08/01/2043 | | | 665,000 | | | | 768,918 | |
WR Berkley Corp., Sr. Unsec. Global Notes, 4.63%, 03/15/2022 | | | 420,000 | | | | 447,349 | |
| | | | | | | | 4,763,118 | |
| | | | | | | | |
| | | Principal
Amount | | | Value | |
| Railroads–0.19% | | | | | |
Burlington Northern Santa Fe, LLC, Sr. Unsec. Deb., 5.15%, 09/01/2043 | | $ | 991,000 | | | $ | 1,227,075 | |
CSX Corp., Sr. Unsec. Notes, 5.50%, 04/15/2041 | | | 380,000 | | | | 470,907 | |
Union Pacific Corp.,
Sr. Unsec. Global Notes, 3.65%, 02/15/2024 | | | 101,000 | | | | 106,227 | |
Sr. Unsec. Notes, | | | | | | | | |
4.15%, 01/15/2045 | | | 440,000 | | | | 476,430 | |
4.85%, 06/15/2044 | | | 570,000 | | | | 676,337 | |
| | | | | | | | 2,956,976 | |
| |
| Regional Banks–0.05% | | | | | |
Citizens Financial Group, Inc., Sr. Unsec. Global Notes, 2.38%, 07/28/2021 | | | 455,000 | | | | 449,379 | |
SunTrust Banks, Inc., Unsec. Sub. Global Notes, 3.30%, 05/15/2026 | | | 385,000 | | | | 381,891 | |
| | | | | | | | 831,270 | |
| |
| Reinsurance–0.03% | | | | | |
Reinsurance Group of America, Inc., Sr. Unsec. Medium-Term Notes, 4.70%, 09/15/2023 | | | 386,000 | | | | 414,519 | |
| |
| Renewable Electricity–0.04% | | | | | |
Oglethorpe Power Corp., Sr. Sec. First Mortgage Bonds, 4.55%, 06/01/2044 | | | 581,000 | | | | 610,926 | |
| |
| Semiconductors–0.60% | | | | | |
Broadcom Corp./Broadcom Cayman Finance Ltd., Sr. Unsec. Gtd. Notes, 3.63%, 01/15/2024(c) | | | 1,435,000 | | | | 1,428,567 | |
Microchip Technology Inc., Sr. Unsec. Sub. Conv. Notes, 1.63%, 02/15/2027(c) | | | 2,180,000 | | | | 2,565,587 | |
Micron Technology, Inc., Series G, Sr. Unsec. Conv. Global Bonds, 3.00%, 11/15/2028(d) | | | 1,566,000 | | | | 2,265,806 | |
ON Semiconductor Corp., Sr. Unsec. Gtd. Conv. Bonds, 1.00%, 12/01/2020 | | | 1,702,000 | | | | 2,180,688 | |
Silicon Laboratories Inc.,
Sr. Unsec. Conv. Notes, 1.38%, 03/01/2022(c) | | | 619,000 | | | | 715,332 | |
Texas Instruments Inc., Sr. Unsec. Notes, 2.63%, 05/15/2024 | | | 230,000 | | | | 228,321 | |
| | | | | | | | 9,384,301 | |
| |
| Specialized Finance–0.34% | | | | | |
AerCap Ireland Capital DAC/AerCap Global Aviation Trust (Netherlands), Sr. Unsec. Gtd. Global Notes, 3.95%, 02/01/2022 | | | 385,000 | | | | 397,119 | |
Air Lease Corp., Sr. Unsec. Global Notes, | | | | | | | | |
2.63%, 09/04/2018 | | | 1,150,000 | | | | 1,153,575 | |
3.00%, 09/15/2023 | | | 649,000 | | | | 644,707 | |
4.25%, 09/15/2024 | | | 430,000 | | | | 451,764 | |
See accompanying Notes to Financial Statements which are an integral part of the financial statements.
Invesco V.I. Equity and Income Fund
| | | | | | | | |
| | | Principal
Amount | | | Value | |
| Specialized Finance–(continued) | | | | | |
Aviation Capital Group LLC,
Sr. Unsec. Notes, | | | | | | | | |
2.88%, 09/17/2018(c) | | $ | 745,000 | | | $ | 747,611 | |
2.88%, 01/20/2022(c) | | | 1,115,000 | | | | 1,115,013 | |
4.88%, 10/01/2025(c) | | | 735,000 | | | | 799,594 | |
| | | | | | | | 5,309,383 | |
| |
| Specialized REIT’s–0.26% | | | | | |
Crown Castle International Corp., Sr. Unsec. Global Notes, 4.75%, 05/15/2047 | | | 50,000 | | | | 52,799 | |
Crown Castle Towers LLC, Sr. Sec. Gtd. First Lien Notes, | | | | | | | | |
4.88%, 08/15/2020(c) | | | 538,000 | | | | 562,951 | |
6.11%, 01/15/2020(c) | | | 770,000 | | | | 811,962 | |
EPR Properties, Sr. Unsec. Gtd. Global Notes, 4.75%, 12/15/2026 | | | 2,145,000 | | | | 2,205,082 | |
Life Storage, LP, Sr. Unsec. Gtd. Global Notes, 3.50%, 07/01/2026 | | | 444,000 | | | | 433,087 | |
| | | | | | | | 4,065,881 | |
| |
| Specialty Chemicals–0.01% | | | | | |
Sherwin-Williams Co. (The), Sr. Unsec. Global Notes, 4.50%, 06/01/2047 | | | 170,000 | | | | 186,472 | |
| |
| Systems Software–0.25% | | | | | |
FireEye, Inc.,
Series A, Sr. Unsec. Conv. Bonds, 1.00%, 06/01/2020(d) | | | 1,163,000 | | | | 1,091,766 | |
Series B, Sr. Unsec. Conv. Bonds, 1.63%, 06/01/2022(d) | | | 1,163,000 | | | | 1,068,506 | |
Microsoft Corp., Sr. Unsec. Global Notes, 3.50%, 02/12/2035 | | | 403,000 | | | | 419,806 | |
Oracle Corp., Sr. Unsec. Global Notes, 1.90%, 09/15/2021 | | | 1,285,000 | | | | 1,265,257 | |
| | | | | | | | 3,845,335 | |
| |
| Technology Distributors–0.05% | | | | | |
Avnet, Inc., Sr. Unsec. Global Notes, 4.63%, 04/15/2026 | | | 705,000 | | | | 728,156 | |
|
| Technology Hardware, Storage & Peripherals–0.28% | |
Apple Inc., Sr. Unsec. Global Notes, | | | | | | | | |
2.15%, 02/09/2022 | | | 716,000 | | | | 707,019 | |
3.35%, 02/09/2027 | | | 335,000 | | | | 343,462 | |
Dell International LLC/ EMC Corp., Sr. Sec. Gtd. First Lien Notes, | | | | | | | | |
5.45%, 06/15/2023(c) | | | 645,000 | | | | 697,716 | |
8.35%, 07/15/2046(c) | | | 14,000 | | | | 18,084 | |
SanDisk Corp., Sr. Unsec. Gtd. Conv. Bonds, 0.50%, 10/15/2020 | | | 2,520,000 | | | | 2,378,804 | |
Seagate HDD Cayman, Sr. Unsec. Gtd. Global Bonds, 5.75%, 12/01/2034 | | | 299,000 | | | | 287,859 | |
| | | | | | | | 4,432,944 | |
| |
| Tobacco–0.12% | | | | | |
Philip Morris International Inc., Sr. Unsec. Global Notes, | | | | | | | | |
3.60%, 11/15/2023 | | | 405,000 | | | | 419,419 | |
4.88%, 11/15/2043 | | | 1,210,000 | | | | 1,384,046 | |
| | | | | | | | 1,803,465 | |
| | | | | | | | |
| | | Principal
Amount | | | Value | |
| Wireless Telecommunication Services–0.08% | |
América Móvil, S.A.B. de C.V. (Mexico), Sr. Unsec. Global Notes, 4.38%, 07/16/2042 | | $ | 600,000 | | | $ | 638,896 | |
Rogers Communications Inc. (Canada), Sr. Unsec. Gtd. Global Notes, 4.50%, 03/15/2043 | | | 585,000 | | | | 629,500 | |
| | | | | | | | 1,268,396 | |
Total Bonds & Notes
(Cost $241,606,185) | | | | | | | 258,407,125 | |
| |
U.S. Treasury Securities–11.47% | | | | | |
| U.S. Treasury Bills–0.00% | | | | | |
1.11%, 02/01/2018(g)(h) | | | 45,000 | | | | 44,953 | |
| |
| U.S. Treasury Notes–10.35% | | | | | |
1.25%, 01/31/2019 | | | 19,275,000 | | | | 19,155,794 | |
3.63%, 08/15/2019 | | | 1,525,000 | | | | 1,567,516 | |
3.38%, 11/15/2019 | | | 300,000 | | | | 308,268 | |
1.75%, 11/30/2019 | | | 71,210,000 | | | | 71,030,394 | |
3.63%, 02/15/2020 | | | 46,000 | | | | 47,649 | |
2.63%, 11/15/2020 | | | 600,000 | | | | 610,847 | |
1.88%, 12/15/2020 | | | 24,675,000 | | | | 24,604,178 | |
2.00%, 11/30/2022 | | | 18,076,500 | | | | 17,911,546 | |
2.13%, 11/30/2024 | | | 11,000,400 | | | | 10,854,878 | |
2.25%, 11/15/2027 | | | 16,652,400 | | | | 16,414,870 | |
| | | | | | | | 162,505,940 | |
| |
| U.S. Treasury Bonds–1.12% | | | | | |
4.50%, 02/15/2036 | | | 4,000,000 | | | | 5,147,257 | |
4.50%, 08/15/2039 | | | 40,000 | | | | 52,219 | |
4.38%, 05/15/2040 | | | 80,000 | | | | 103,085 | |
2.75%, 08/15/2047 | | | 12,207,000 | | | | 12,211,158 | |
| | | | | | | | 17,513,719 | |
Total U.S. Treasury Securities
(Cost $179,898,994) | | | | 180,064,612 | |
| | |
| | |
Shares | | | | |
Preferred Stocks–0.50% | | | | | |
Asset Management & Custody
Banks–0.19% | |
AMG Capital Trust II, $2.58 Conv. Pfd. | | | 47,000 | | | | 2,981,563 | |
| |
| Diversified Banks–0.02% | | | | | |
Wells Fargo & Co., Series Q, 5.85% Pfd. | | | 12,000 | | | | 324,000 | |
|
| Oil & Gas Storage & Transportation–0.29% | |
El Paso Energy Capital Trust I, $2.38 Conv. Pfd. | | | 95,499 | | | | 4,540,022 | |
Total Preferred Stocks
(Cost $6,118,550) | | | | 7,845,585 | |
See accompanying Notes to Financial Statements which are an integral part of the financial statements.
Invesco V.I. Equity and Income Fund
| | | | | | | | |
| | | Principal
Amount | | | Value | |
U.S. Government Sponsored Agency
Securities–0.13% | |
| Federal Home Loan Mortgage Corp. (FHLMC)–0.13% | |
Unsec. Global Notes, | | | | | | | | |
4.88%, 06/13/2018 | | $ | 1,000,000 | | | $ | 1,014,552 | |
6.75%, 03/15/2031 | | | 750,000 | | | | 1,073,696 | |
Total U.S. Government Sponsored Agency Securities
(Cost $1,979,348) | | | | 2,088,248 | |
|
U.S. Government Sponsored Agency
Mortgage-Backed Securities–0.00% | |
| Federal Home Loan Mortgage Corp. (FHLMC)–0.00% | |
Pass Through Ctfs. , 5.50%, 02/01/2037 | | | 26 | | | | 29 | |
|
| Federal National Mortgage Association (FNMA)–0.00% | |
Pass Through Ctfs., | | | | | |
5.50%, 03/01/2021 | | | 63 | | | | 65 | |
8.00%, 08/01/2021 | | | 118 | | | | 118 | |
9.50%, 04/01/2030 | | | 2,154 | | | | 2,487 | |
| | | | | | | | 2,670 | |
Total U.S. Government Sponsored Agency Mortgage-Backed Securities
(Cost $2,597) | | | | 2,699 | |
| | | | | | | | |
| | |
Shares | | | Value | |
| Money Market Funds–6.69% | | | | | |
Invesco Government & Agency
Portfolio–Institutional Class, 1.18%(i) | | | 36,794,431 | | | $ | 36,794,431 | |
Invesco Liquid Assets
Portfolio–Institutional Class, 1.40%(i) | | | 26,276,613 | | | | 26,279,241 | |
Invesco Treasury Portfolio–Institutional Class, 1.17%(i) | | | 42,050,778 | | | | 42,050,778 | |
Total Money Market Funds
(Cost $105,126,511) | | | | 105,124,450 | |
TOTAL INVESTMENTS IN SECURITIES–99.72%
(Cost $1,226,341,989) | | | | 1,565,889,799 | |
OTHER ASSETS LESS LIABILITIES–0.28% | | | | | | | 4,368,088 | |
NET ASSETS–100.00% | | | | | | $ | 1,570,257,887 | |
Investment Abbreviations:
| | |
| ADR | | – American Depositary Receipt |
| Conv. | | – Convertible |
| Ctfs. | | – Certificates |
| Deb. | | – Debentures |
| Gtd. | | – Guaranteed |
| Jr. | | – Junior |
| Pfd. | | – Preferred |
| REIT | | – Real Estate Investment Trust |
| Sec. | | – Secured |
| Sr. | | – Senior |
| Sub. | | – Subordinated |
| Unsec. | | – Unsecured |
Notes to Schedule of Investments:
| (a) | Industry and/or sector classifications used in this report are generally according to the Global Industry Classification Standard, which was developed by and is the exclusive property and a service mark of MSCI Inc. and Standard & Poor’s. |
| (b) | Non-income producing security. |
| (c) | Security purchased or received in a transaction exempt from registration under the Securities Act of 1933, as amended (the “1933 Act”). The security may be resold pursuant to an exemption from registration under the 1933 Act, typically to qualified institutional buyers. The aggregate value of these securities at December 31, 2017 was $73,036,520, which represented 4.65% of the Fund’s Net Assets. |
| (d) | Security has an irrevocable call by the issuer or mandatory put by the holder. Maturity date reflects such call or put. |
| (e) | Perpetual bond with no specified maturity date. |
| (f) | Exchangeable for a basket of five common stocks. |
| (g) | Security traded on a discount basis. The interest rate shown represents the discount rate at the time of purchase by the Fund. |
| (h) | All or a portion of the value was pledged as collateral to cover margin requirements for open futures contracts. See Note 1K. |
| (i) | The money market fund and the Fund are affiliated by having the same investment adviser. The rate shown is the 7-day SEC standardized yield as of December 31, 2017. |
| | | | | | | | | | | | | | | | | | | | |
| Open Futures Contracts | |
| Short Futures Contracts | | Number of
Contracts | | | Expiration
Month | | | Notional
Value | | | Value | | | Unrealized
Appreciation | |
U.S. Treasury 5 Year Notes | | | 23 | | | | March-2018 | | | $ | (2,671,773 | ) | | $ | 14,710 | | | $ | 14,710 | |
U.S. Treasury 10 Year Notes | | | 17 | | | | March-2018 | | | | (2,108,797 | ) | | | 14,171 | | | | 14,171 | |
Total Futures Contracts—Interest Rate Risk | | | | | | | | | | | | | | $ | 28,881 | | | $ | 28,881 | |
See accompanying Notes to Financial Statements which are an integral part of the financial statements.
Invesco V.I. Equity and Income Fund
| | | | | | | | | | | | | | | | | | | | | | |
| Open Forward Foreign Currency Contracts | |
Settlement
Date | | Counterparty | | Contract to | | | Unrealized
Appreciation
(Depreciation) | |
| | | Deliver | | | Receive | | |
01/19/2018 | | State Street Bank and Trust Co. | | | USD | | | | 34,733 | | | | AUD | | | | 45,313 | | | $ | 622 | |
01/19/2018 | | State Street Bank and Trust Co. | | | USD | | | | 70,943 | | | | CAD | | | | 91,186 | | | | 1,629 | |
01/19/2018 | | State Street Bank and Trust Co. | | | USD | | | | 51,547 | | | | CHF | | | | 50,571 | | | | 440 | |
01/19/2018 | | State Street Bank and Trust Co. | | | USD | | | | 103,152 | | | | EUR | | | | 87,120 | | | | 1,513 | |
01/19/2018 | | State Street Bank and Trust Co. | | | USD | | | | 100,137 | | | | GBP | | | | 74,555 | | | | 595 | |
Subtotal | | | | | | | | | | | | | | | | | | | | | 4,799 | |
01/19/2018 | | Bank of New York Mellon (The) | | | AUD | | | | 3,837,013 | | | | USD | | | | 2,898,864 | | | | (94,949 | ) |
01/19/2018 | | Bank of New York Mellon (The) | | | CAD | | | | 8,086,255 | | | | USD | | | | 6,283,026 | | | | (152,579 | ) |
01/19/2018 | | Bank of New York Mellon (The) | | | CHF | | | | 4,338,306 | | | | USD | | | | 4,384,342 | | | | (75,388 | ) |
01/19/2018 | | Bank of New York Mellon (The) | | | EUR | | | | 7,529,140 | | | | USD | | | | 8,864,057 | | | | (181,433 | ) |
01/19/2018 | | Bank of New York Mellon (The) | | | GBP | | | | 12,014,972 | | | | USD | | | | 16,051,222 | | | | (182,261 | ) |
01/19/2018 | | State Street Bank and Trust Co. | | | AUD | | | | 3,837,044 | | | | USD | | | | 2,899,968 | | | | (93,868 | ) |
01/19/2018 | | State Street Bank and Trust Co. | | | CAD | | | | 8,086,766 | | | | USD | | | | 6,284,986 | | | | (151,026 | ) |
01/19/2018 | | State Street Bank and Trust Co. | | | CHF | | | | 4,338,285 | | | | USD | | | | 4,384,294 | | | | (75,414 | ) |
01/19/2018 | | State Street Bank and Trust Co. | | | EUR | | | | 7,529,136 | | | | USD | | | | 8,868,682 | | | | (176,802 | ) |
01/19/2018 | | State Street Bank and Trust Co. | | | GBP | | | | 12,015,049 | | | | USD | | | | 16,052,370 | | | | (181,217 | ) |
Subtotal | | | | | | | | | | | | | | | | | | | | | (1,364,937 | ) |
Total Forward Foreign Currency Contracts—Currency Risk | | | $ | (1,360,138 | ) |
Abbreviations:
| | |
| AUD | | – Australian Dollar |
| CAD | | – Canadian Dollar |
| CHF | | – Swiss Franc |
| EUR | | – Euro |
| GBP | | – British Pound Sterling |
| USD | | – U.S. Dollar |
See accompanying Notes to Financial Statements which are an integral part of the financial statements.
Invesco V.I. Equity and Income Fund
Statement of Assets and Liabilities
December 31, 2017
Statement of Operations
For the year ended December 31, 2017
| | | | |
Assets: | | | | |
Investments in securities, at value
(Cost $1,121,215,478) | | $ | 1,460,765,349 | |
Investments in affiliated money market funds, at value (Cost $105,126,511) | | | 105,124,450 | |
Other investments: | | | | |
Unrealized appreciation on forward foreign currency contracts outstanding | | | 4,799 | |
Cash | | | 65,555 | |
Foreign currencies, at value (Cost $1,293) | | | 1,310 | |
Receivable for: | | | | |
Investments sold | | | 3,308,637 | |
Fund shares sold | | | 278,875 | |
Dividends and interest | | | 4,324,186 | |
Investment for trustee deferred compensation and retirement plans | | | 159,152 | |
Total assets | | | 1,574,032,313 | |
| |
Liabilities: | | | | |
Other investments: | | | | |
Variation margin payable — futures contracts | | | 5,609 | |
Unrealized depreciation on forward foreign currency contracts outstanding | | | 1,364,937 | |
Payable for: | | | | |
Fund shares reacquired | | | 766,963 | |
Accrued fees to affiliates | | | 1,405,098 | |
Accrued trustees’ and officers’ fees and benefits | | | 1,128 | |
Accrued other operating expenses | | | 54,242 | |
Trustee deferred compensation and retirement plans | | | 176,449 | |
Total liabilities | | | 3,774,426 | |
Net assets applicable to shares outstanding | | $ | 1,570,257,887 | |
| |
Net assets consist of: | | | | |
Shares of beneficial interest | | $ | 1,146,936,044 | |
Undistributed net investment income | | | 25,543,663 | |
Undistributed net realized gain | | | 59,553,747 | |
Net unrealized appreciation | | | 338,224,433 | |
| | | $ | 1,570,257,887 | |
|
Net Assets: | |
Series I | | $ | 184,768,368 | |
Series II | | $ | 1,385,489,519 | |
|
Shares outstanding, no par value,
with an unlimited number of shares authorized: | |
Series I | | | 9,706,245 | |
Series II | | | 73,125,173 | |
Series I: | | | | |
Net asset value per share | | $ | 19.04 | |
Series II: | | | | |
Net asset value per share | | $ | 18.95 | |
| | | | |
Investment income: | | | | |
Dividends (net of foreign withholding taxes of $563,677) | | $ | 26,438,376 | |
Dividends from affiliated money market funds | | | 718,201 | |
Interest | | | 10,455,371 | |
Total investment income | | | 37,611,948 | |
| |
Expenses: | | | | |
Advisory fees | | | 5,688,222 | |
Administrative services fees | | | 2,444,548 | |
Custodian fees | | | 60,125 | |
Distribution fees — Series II | | | 3,364,856 | |
Transfer agent fees | | | 33,763 | |
Trustees’ and officers’ fees and benefits | | | 41,386 | |
Reports to shareholders | | | 147,407 | |
Professional services fees | | | 61,345 | |
Other | | | 26,213 | |
Total expenses | | | 11,867,865 | |
Less: Fees waived | | | (95,906 | ) |
Net expenses | | | 11,771,959 | |
Net investment income | | | 25,839,989 | |
| |
Realized and unrealized gain (loss) from: | | | | |
Net realized gain (loss) from: | | | | |
Investment securities | | | 73,869,412 | |
Foreign currencies | | | 14,355 | |
Forward foreign currency contracts | | | (2,799,889 | ) |
Futures contracts | | | (36,340 | ) |
| | | | 71,047,538 | |
Change in net unrealized appreciation (depreciation) of: | | | | |
Investment securities | | | 61,888,633 | |
Foreign currencies | | | 4,492 | |
Forward foreign currency contracts | | | (2,881,369 | ) |
Futures contracts | | | 6,191 | |
| | | | 59,017,947 | |
Net realized and unrealized gain | | | 130,065,485 | |
Net increase in net assets resulting from operations | | $ | 155,905,474 | |
See accompanying Notes to Financial Statements which are an integral part of the financial statements.
Invesco V.I. Equity and Income Fund
Statement of Changes in Net Assets
For the years ended December 31, 2017 and 2016
| | | | | | | | |
| | | 2017 | | | 2016 | |
Operations: | | | | | | | | |
Net investment income | | $ | 25,839,989 | | | $ | 20,269,520 | |
Net realized gain | | | 71,047,538 | | | | 30,804,197 | |
Change in net unrealized appreciation | | | 59,017,947 | | | | 136,794,055 | |
Net increase in net assets resulting from operations | | | 155,905,474 | | | | 187,867,772 | |
| | |
Distributions to shareholders from net investment income: | | | | | | | | |
Series I | | | (2,908,928 | ) | | | (2,492,252 | ) |
Series ll | | | (19,584,973 | ) | | | (20,095,211 | ) |
Total distributions from net investment income | | | (22,493,901 | ) | | | (22,587,463 | ) |
| | |
Distributions to shareholders from net realized gains: | | | | | | | | |
Series l | | | (3,156,537 | ) | | | (4,168,661 | ) |
Series ll | | | (24,461,379 | ) | | | (38,839,725 | ) |
Total distributions from net realized gains | | | (27,617,916 | ) | | | (43,008,386 | ) |
| | |
Share transactions–net: | | | | | | | | |
Series l | | | 14,958,314 | | | | 48,906,569 | |
Series ll | | | (22,591,494 | ) | | | 75,370,163 | |
Net increase (decrease) in net assets resulting from share transactions | | | (7,633,180 | ) | | | 124,276,732 | |
Net increase in net assets | | | 98,160,477 | | | | 246,548,655 | |
| | |
Net assets: | | | | | | | | |
Beginning of year | | | 1,472,097,410 | | | | 1,225,548,755 | |
End of year (includes undistributed net investment income of $25,543,663 and $17,107,128, respectively) | | $ | 1,570,257,887 | | | $ | 1,472,097,410 | |
Notes to Financial Statements
December 31, 2017
NOTE 1—Significant Accounting Policies
Invesco V.I. Equity and Income Fund (the “Fund”) is a series portfolio of AIM Variable Insurance Funds (Invesco Variable Insurance Funds) (the “Trust”). The Trust is a Delaware statutory trust registered under the Investment Company Act of 1940, as amended (the “1940 Act”), as an open-end series management investment company consisting of twenty-four separate portfolios, (each constituting a “Fund”). The assets, liabilities and operations of each portfolio are accounted for separately. Information presented in these financial statements pertains only to the Fund. Matters affecting each Fund or class will be voted on exclusively by the shareholders of such Fund or class. Current Securities and Exchange Commission (“SEC”) guidance, however, requires participating insurance companies offering separate accounts to vote shares proportionally in accordance with the instructions of the contract owners whose investments are funded by shares of each Fund or class.
The Fund’s investment objectives are both capital appreciation and current income.
The Fund currently offers two classes of shares, Series I and Series II, both of which are offered to insurance company separate accounts funding variable annuity contracts and variable life insurance policies (“variable products”).
The Fund is an investment company and accordingly follows the investment company accounting and reporting guidance in accordance with Financial Accounting Standards Board Accounting Standards Codification Topic 946, Financial Services — Investment Companies.
The following is a summary of the significant accounting policies followed by the Fund in the preparation of its financial statements.
| A. | Security Valuations — Securities, including restricted securities, are valued according to the following policy. |
Debt obligations (including convertible securities) and unlisted equities are fair valued using an evaluated quote provided by an independent pricing service. Evaluated quotes provided by the pricing service may be determined without exclusive reliance on quoted prices, and may reflect appropriate factors such as institution-size trading in similar groups of securities, developments related to specific securities, dividend rate (for unlisted equities), yield (for debt obligations), quality, type of issue, coupon rate (for debt obligations), maturity (for debt obligations), individual trading characteristics and other market data. Pricing services generally value debt obligations assuming orderly transactions of institutional round lot size, but a fund may hold or transact in the same securities in smaller, odd lot sizes. Odd lots often trade at lower prices than institutional round lots. Debt obligations are subject to interest rate and credit risks. In addition, all debt obligations involve some risk of default with respect to interest and/or principal payments.
A security listed or traded on an exchange (except convertible securities) is valued at its last sales price or official closing price as of the close of the customary trading session on the exchange where the security is principally traded, or lacking any sales or official closing price on a particular day, the security may be valued at the closing bid price on that day. Securities traded in the over-the-counter market are valued based on prices furnished by independent pricing services or market makers. When such securities are valued by an independent pricing service they
Invesco V.I. Equity and Income Fund
may be considered fair valued. Futures contracts are valued at the final settlement price set by an exchange on which they are principally traded. Listed options are valued at the mean between the last bid and asked prices from the exchange on which they are principally traded. Options not listed on an exchange are valued by an independent source at the mean between the last bid and asked prices. For purposes of determining net asset value (“NAV”) per share, futures and option contracts generally are valued 15 minutes after the close of the customary trading session of the New York Stock Exchange (“NYSE”).
Investments in open-end and closed-end registered investment companies that do not trade on an exchange are valued at the end-of-day net asset value per share. Investments in open-end and closed-end registered investment companies that trade on an exchange are valued at the last sales price or official closing price as of the close of the customary trading session on the exchange where the security is principally traded.
Foreign securities’ (including foreign exchange contracts) prices are converted into U.S. dollar amounts using the applicable exchange rates as of the close of the NYSE. If market quotations are available and reliable for foreign exchange-traded equity securities, the securities will be valued at the market quotations. Because trading hours for certain foreign securities end before the close of the NYSE, closing market quotations may become unreliable. If between the time trading ends on a particular security and the close of the customary trading session on the NYSE, events occur that the investment adviser determines are significant and make the closing price unreliable, the Fund may fair value the security. If the event is likely to have affected the closing price of the security, the security will be valued at fair value in good faith using procedures approved by the Board of Trustees. Adjustments to closing prices to reflect fair value may also be based on a screening process of an independent pricing service to indicate the degree of certainty, based on historical data, that the closing price in the principal market where a foreign security trades is not the current value as of the close of the NYSE. Foreign securities’ prices meeting the approved degree of certainty that the price is not reflective of current value will be priced at the indication of fair value from the independent pricing service. Multiple factors may be considered by the independent pricing service in determining adjustments to reflect fair value and may include information relating to sector indices, American Depositary Receipts and domestic and foreign index futures. Foreign securities may have additional risks including exchange rate changes, potential for sharply devalued currencies and high inflation, political and economic upheaval, the relative lack of issuer information, relatively low market liquidity and the potential lack of strict financial and accounting controls and standards.
Securities for which market prices are not provided by any of the above methods may be valued based upon quotes furnished by independent sources. The last bid price may be used to value equity securities. The mean between the last bid and asked prices is used to value debt obligations, including corporate loans.
Securities for which market quotations are not readily available or became unreliable are valued at fair value as determined in good faith by or under the supervision of the Trust’s officers following procedures approved by the Board of Trustees. Issuer specific events, market trends, bid/asked quotes of brokers and information providers and other market data may be reviewed in the course of making a good faith determination of a security’s fair value.
The Fund may invest in securities that are subject to interest rate risk, meaning the risk that the prices will generally fall as interest rates rise and, conversely, the prices will generally rise as interest rates fall. Specific securities differ in their sensitivity to changes in interest rates depending on their individual characteristics. Changes in interest rates may result in increased market volatility, which may affect the value and/or liquidity of certain Fund investments.
Valuations change in response to many factors including the historical and prospective earnings of the issuer, the value of the issuer’s assets, general economic conditions, interest rates, investor perceptions and market liquidity. Because of the inherent uncertainties of valuation, the values reflected in the financial statements may materially differ from the value received upon actual sale of those investments.
| B. | Securities Transactions and Investment Income — Securities transactions are accounted for on a trade date basis. Realized gains or losses on sales are computed on the basis of specific identification of the securities sold. Interest income (net of withholding tax, if any) is recorded on the accrual basis from settlement date. Bond premiums and discounts are amortized and/or accreted over the lives of the respective securities. Pay-in-kind interest income and non-cash dividend income received in the form of securities in-lieu of cash are recorded at the fair value of the securities received. Paydown gains and losses on mortgage and asset-backed securities are recorded as adjustments to interest income. Dividend income (net of withholding tax, if any) is recorded on the ex-dividend date. |
The Fund may periodically participate in litigation related to Fund investments. As such, the Fund may receive proceeds from litigation settlements. Any proceeds received are included in the Statement of Operations as realized gain (loss) for investments no longer held and as unrealized gain (loss) for investments still held.
Brokerage commissions and mark ups are considered transaction costs and are recorded as an increase to the cost basis of securities purchased and/or a reduction of proceeds on a sale of securities. Such transaction costs are included in the determination of net realized and unrealized gain (loss) from investment securities reported in the Statement of Operations and the Statement of Changes in Net Assets and the net realized and unrealized gains (losses) on securities per share in the Financial Highlights. Transaction costs are included in the calculation of the Fund’s net asset value and, accordingly, they reduce the Fund’s total returns. These transaction costs are not considered operating expenses and are not reflected in net investment income reported in the Statement of Operations and the Statement of Changes in Net Assets, or the net investment income per share and the ratios of expenses and net investment income reported in the Financial Highlights, nor are they limited by any expense limitation arrangements between the Fund and the investment adviser.
The Fund allocates income and realized and unrealized capital gains and losses to a class based on the relative net assets of each class.
| C. | Country Determination — For the purposes of making investment selection decisions and presentation in the Schedule of Investments, the investment adviser may determine the country in which an issuer is located and/or credit risk exposure based on various factors. These factors include the laws of the country under which the issuer is organized, where the issuer maintains a principal office, the country in which the issuer derives 50% or more of its total revenues and the country that has the primary market for the issuer’s securities, as well as other criteria. Among the other criteria that may be evaluated for making this determination are the country in which the issuer maintains 50% or more of its assets, the type of security, financial guarantees and enhancements, the nature of the collateral and the sponsor organization. Country of issuer and/or credit risk exposure has been determined to be the United States of America, unless otherwise noted. |
| D. | Distributions — Distributions from net investment income and net realized capital gain, if any, are generally declared and paid to separate accounts of participating insurance companies annually and recorded on the ex-dividend date. |
Invesco V.I. Equity and Income Fund
| E. | Federal Income Taxes — The Fund intends to comply with the requirements of Subchapter M of the Internal Revenue Code of 1986, as amended (the “Internal Revenue Code”), necessary to qualify as a regulated investment company and to distribute substantially all of the Fund’s taxable earnings to shareholders. As such, the Fund will not be subject to federal income taxes on otherwise taxable income (including net realized capital gain) that is distributed to shareholders. Therefore, no provision for federal income taxes is recorded in the financial statements. |
The Fund recognizes the tax benefits of uncertain tax positions only when the position is more likely than not to be sustained. Management has analyzed the Fund’s uncertain tax positions and concluded that no liability for unrecognized tax benefits should be recorded related to uncertain tax positions. Management is not aware of any tax positions for which it is reasonably possible that the total amounts of unrecognized tax benefits will change materially in the next 12 months.
The Fund files tax returns in the U.S. Federal jurisdiction and certain other jurisdictions. Generally, the Fund is subject to examinations by such taxing authorities for up to three years after the filing of the return for the tax period.
| F. | Expenses — Fees provided for under the Rule 12b-1 plan of a particular class of the Fund and which are directly attributable to that class are charged to the operations of such class. All other expenses are allocated among the classes based on relative net assets. |
| G. | Accounting Estimates — The preparation of financial statements in conformity with accounting principles generally accepted in the United States of America (“GAAP”) requires management to make estimates and assumptions that affect the reported amounts of assets and liabilities at the date of the financial statements and the reported amounts of revenues and expenses during the reporting period including estimates and assumptions related to taxation. Actual results could differ from those estimates by a significant amount. In addition, the Fund monitors for material events or transactions that may occur or become known after the period-end date and before the date the financial statements are released to print. |
| H. | Indemnifications — Under the Trust’s organizational documents, each Trustee, officer, employee or other agent of the Trust is indemnified against certain liabilities that may arise out of the performance of their duties to the Fund. Additionally, in the normal course of business, the Fund enters into contracts, including the Fund’s servicing agreements, that contain a variety of indemnification clauses. The Fund’s maximum exposure under these arrangements is unknown as this would involve future claims that may be made against the Fund that have not yet occurred. The risk of material loss as a result of such indemnification claims is considered remote. |
| I. | Foreign Currency Translations — Foreign currency is valued at the close of the NYSE based on quotations posted by banks and major currency dealers. Portfolio securities and other assets and liabilities denominated in foreign currencies are translated into U.S. dollar amounts at date of valuation. Purchases and sales of portfolio securities (net of foreign taxes withheld on disposition) and income items denominated in foreign currencies are translated into U.S. dollar amounts on the respective dates of such transactions. The Fund does not separately account for the portion of the results of operations resulting from changes in foreign exchange rates on investments and the fluctuations arising from changes in market prices of securities held. The combined results of changes in foreign exchange rates and the fluctuation of market prices on investments (net of estimated foreign tax withholding) are included with the net realized and unrealized gain or loss from investments in the Statement of Operations. Reported net realized foreign currency gains or losses arise from (1) sales of foreign currencies, (2) currency gains or losses realized between the trade and settlement dates on securities transactions, and (3) the difference between the amounts of dividends, interest, and foreign withholding taxes recorded on the Fund’s books and the U.S. dollar equivalent of the amounts actually received or paid. Net unrealized foreign currency gains and losses arise from changes in the fair values of assets and liabilities, other than investments in securities at fiscal period end, resulting from changes in exchange rates. |
The Fund may invest in foreign securities, which may be subject to foreign taxes on income, gains on investments or currency repatriation, a portion of which may be recoverable. Foreign taxes, if any, are recorded based on the tax regulations and rates that exist in the foreign markets in which the Fund invests and are shown in the Statement of Operations.
| J. | Forward Foreign Currency Contracts — The Fund may engage in foreign currency transactions either on a spot (i.e. for prompt delivery and settlement) basis, or through forward foreign currency contracts, to manage or minimize currency or exchange rate risk. |
The Fund may also enter into forward foreign currency contracts for the purchase or sale of a security denominated in a foreign currency in order to “lock in” the U.S. dollar price of that security, or the Fund may also enter into forward foreign currency contracts that do not provide for physical settlement of the two currencies, but instead are settled by a single cash payment calculated as the difference between the agreed upon exchange rate and the spot rate at settlement based upon an agreed upon notional amount (non-deliverable forwards). The Fund will set aside liquid assets in an amount equal to the daily mark-to-market obligation for forward foreign currency contracts.
A forward foreign currency contract is an obligation between two parties (“Counterparties”) to purchase or sell a specific currency for an agreed-upon price at a future date. The use of forward foreign currency contracts does not eliminate fluctuations in the price of the underlying securities the Fund owns or intends to acquire but establishes a rate of exchange in advance. Fluctuations in the value of these contracts are measured by the difference in the contract date and reporting date exchange rates and are recorded as unrealized appreciation (depreciation) until the contracts are closed. When the contracts are closed, realized gains (losses) are recorded. Realized and unrealized gains (losses) on the contracts are included in the Statement of Operations. The primary risks associated with forward foreign currency contracts include failure of the Counterparty to meet the terms of the contract and the value of the foreign currency changing unfavorably. These risks may be in excess of the amounts reflected in the Statement of Assets and Liabilities.
| K. | Futures Contracts — The Fund may enter into futures contracts to manage exposure to interest rate, equity and market price movements and/or currency risks. A futures contract is an agreement between Counterparties to purchase or sell a specified underlying security, currency or commodity (or delivery of a cash settlement price, in the case of an index future) for a fixed price at a future date. The Fund currently invests only in exchange-traded futures and they are standardized as to maturity date and underlying financial instrument. Initial margin deposits required upon entering into futures contracts are satisfied by the segregation of specific securities or cash as collateral at the futures commission merchant (broker). During the period the futures contracts are open, changes in the value of the contracts are recognized as unrealized gains or losses by recalculating the value of the contracts on a daily basis. Subsequent or variation margin payments are received or made depending upon whether unrealized gains or losses are incurred. These amounts are reflected as receivables or payables on the Statement of Assets and Liabilities. When the contracts are closed or expire, the Fund recognizes a realized gain or loss equal to the difference between the proceeds from, or cost of, the closing transaction and the Fund’s basis in the contract. The net realized gain (loss) and the change in unrealized gain (loss) on futures contracts held during the period is included on the Statement of Operations. The primary risks associated with futures contracts are |
Invesco V.I. Equity and Income Fund
| | market risk and the absence of a liquid secondary market. If the Fund were unable to liquidate a futures contract and/or enter into an offsetting closing transaction, the Fund would continue to be subject to market risk with respect to the value of the contracts and continue to be required to maintain the margin deposits on the futures contracts. Futures contracts have minimal Counterparty risk since the exchange’s clearinghouse, as Counterparty to all exchange-traded futures, guarantees the futures against default. Risks may exceed amounts recognized in the Statement of Assets and Liabilities. |
| L. | Collateral — To the extent the Fund has designated or segregated a security as collateral and that security is subsequently sold, it is the Fund’s practice to replace such collateral no later than the next business day. |
NOTE 2—Advisory Fees and Other Fees Paid to Affiliates
The Trust has entered into a master investment advisory agreement with Invesco Advisers, Inc. (the “Adviser” or “Invesco”). Under the terms of the investment advisory agreement, the Fund accrues daily and pays monthly an advisory fee to the Adviser based on the annual rate of the Fund’s average daily net assets as follows:
| | | | |
| Average Daily Net Assets | | Rate | |
First $150 million | | | 0.50% | |
Next $100 million | | | 0.45% | |
Next $100 million | | | 0.40% | |
Over $350 million | | | 0.35% | |
For the year ended December 31, 2017, the effective advisory fees incurred by the Fund was 0.37%.
Under the terms of a master sub-advisory agreement between the Adviser and each of Invesco Asset Management Deutschland GmbH, Invesco Asset Management Limited, Invesco Asset Management (Japan) Limited, Invesco Hong Kong Limited, Invesco Senior Secured Management, Inc. and Invesco Canada Ltd. and separate sub-advisory agreements with Invesco PowerShares Capital Management LLC and Invesco Asset Management (India) Private Limited (collectively, the “Affiliated Sub-Advisers”) the Adviser, not the Fund, will pay 40% of the fees paid to the Adviser to any such Affiliated Sub-Adviser(s) that provide(s) discretionary investment management services to the Fund based on the percentage of assets allocated to such Affiliated Sub-Adviser(s).
The Adviser has contractually agreed, through at least June 30, 2018, to waive advisory fees and/or reimburse expenses of all shares to the extent necessary to limit total annual fund operating expenses after fee waiver and/or expense reimbursement (excluding certain items discussed below) of Series I shares to 1.50% and Series II shares to 1.75% of average daily net assets (the “expense limits”). In determining the Adviser’s obligation to waive advisory fees and/or reimburse expenses, the following expenses are not taken into account, and could cause the total annual fund operating expenses after fee waiver and/or expense reimbursement to exceed the numbers reflected above: (1) interest; (2) taxes; (3) dividend expense on short sales; (4) extraordinary or non-routine items, including litigation expenses; and (5) expenses that the Fund has incurred but did not actually pay because of an expense offset arrangement. Unless Invesco continues the fee waiver agreement, it will terminate on June 30, 2018. During its term, the fee waiver agreement cannot be terminated or amended to increase the expense limits or reduce the advisory fee waiver without approval of the Board of Trustees. The Adviser did not waive fees and/or reimburse expenses during the period under these expense limits.
Further, the Adviser has contractually agreed, through at least June 30, 2019, to waive the advisory fee payable by the Fund in an amount equal to 100% of the net advisory fees the Adviser receives from the affiliated money market funds on investments by the Fund of uninvested cash in such affiliated money market funds.
For the year ended December 31, 2017, the Adviser waived advisory fees of $95,906.
The Trust has entered into a master administrative services agreement with Invesco pursuant to which the Fund has agreed to pay Invesco a fee for costs incurred in providing accounting services and fund administrative services to the Fund and to reimburse Invesco for fees paid to insurance companies that have agreed to provide certain administrative services to the Fund. These administrative services provided by the insurance companies may include, among other things: maintenance of master accounts with the Fund; tracking, recording and transmitting net purchase and redemption orders for Fund shares; maintaining and preserving records related to the purchase, redemption and other account activity of variable product owners; distributing copies of Fund documents such as prospectuses, proxy materials and periodic reports, to variable product owners, and responding to inquiries from variable product owners about the Fund. Pursuant to such agreement, for the year ended December 31, 2017, Invesco was paid $352,348 for accounting and fund administrative services and was reimbursed $2,092,200 for fees paid to insurance companies.
The Trust has entered into a transfer agency and service agreement with Invesco Investment Services, Inc. (“IIS”) pursuant to which the Fund has agreed to pay IIS a fee for providing transfer agency and shareholder services to the Fund and reimburse IIS for certain expenses incurred by IIS in the course of providing such services. For the year ended December 31, 2017, expenses incurred under the agreement are shown in the Statement of Operations as Transfer agent fees.
The Trust has entered into a master distribution agreement with Invesco Distributors, Inc. (“IDI”) to serve as the distributor for the Fund. The Trust has adopted a plan pursuant to Rule 12b-1 under the 1940 Act with respect to the Fund’s Series II shares (the “Plan”). The Fund, pursuant to the Plan, pays IDI compensation at the annual rate of 0.25% of the Fund’s average daily net assets of Series II shares. The fees are accrued daily and paid monthly. Of the Plan payments, up to 0.25% of the average daily net assets of the Series II shares may be paid to insurance companies who furnish continuing personal shareholder services to customers who purchase and own Series II shares of the Fund. For the year ended December 31, 2017, expenses incurred under the Plan are detailed in the Statement of Operations as Distribution fees.
For the year ended December 31, 2017, the Fund incurred $3,925 in brokerage commissions with Invesco Capital Markets, Inc., an affiliate of the Adviser and IDI, for portfolio transactions executed on behalf of the Fund.
Certain officers and trustees of the Trust are officers and directors of the Adviser, IIS and/or IDI.
Invesco V.I. Equity and Income Fund
NOTE 3—Additional Valuation Information
GAAP defines fair value as the price that would be received to sell an asset or paid to transfer a liability in an orderly transaction between market participants at the measurement date, under current market conditions. GAAP establishes a hierarchy that prioritizes the inputs to valuation methods, giving the highest priority to readily available unadjusted quoted prices in an active market for identical assets (Level 1) and the lowest priority to significant unobservable inputs (Level 3), generally when market prices are not readily available or are unreliable. Based on the valuation inputs, the securities or other investments are tiered into one of three levels. Changes in valuation methods may result in transfers in or out of an investment’s assigned level:
| | Level 1 — | Prices are determined using quoted prices in an active market for identical assets. |
| | Level 2 — | Prices are determined using other significant observable inputs. Observable inputs are inputs that other market participants may use in pricing a security. These may include quoted prices for similar securities, interest rates, prepayment speeds, credit risk, yield curves, loss severities, default rates, discount rates, volatilities and others. |
| | Level 3 — | Prices are determined using significant unobservable inputs. In situations where quoted prices or observable inputs are unavailable (for example, when there is little or no market activity for an investment at the end of the period), unobservable inputs may be used. Unobservable inputs reflect the Fund’s own assumptions about the factors market participants would use in determining fair value of the securities or instruments and would be based on the best available information. |
The following is a summary of the tiered valuation input levels, as of December 31, 2017. The level assigned to the securities valuations may not be an indication of the risk or liquidity associated with investing in those securities. Because of the inherent uncertainties of valuation, the values reflected in the financial statements may materially differ from the value received upon actual sale of those investments.
The Fund’s policy is to recognize transfers in and out of the valuation levels as of the end of the reporting period. During the year ended December 31, 2017, there were no material transfers between valuation levels.
| | | | | | | | | | | | | | | | |
| | | Level 1 | | | Level 2 | | | Level 3 | | | Total | |
Investments in Securities | | | | | | | | | | | | | | | | |
Common Stocks & Other Equity Interests | | $ | 980,483,462 | | | $ | 31,873,618 | | | $ | — | | | $ | 1,012,357,080 | |
Bonds & Notes | | | — | | | | 258,407,125 | | | | — | | | | 258,407,125 | |
U.S. Treasury Securities | | | — | | | | 180,064,612 | | | | — | | | | 180,064,612 | |
Preferred Stocks | | | 4,864,022 | | | | 2,981,563 | | | | — | | | | 7,845,585 | |
U.S. Government Sponsored Agency Securities | | | — | | | | 2,088,248 | | | | — | | | | 2,088,248 | |
U.S. Government Sponsored Agency Mortgaged-Backed Securities | | | — | | | | 2,699 | | | | — | | | | 2,699 | |
Money Market Funds | | | 105,124,450 | | | | — | | | | — | | | | 105,124,450 | |
Total Investments in Securities | | | 1,090,471,934 | | | | 475,417,865 | | | | — | | | | 1,565,889,799 | |
Other Investments — Assets* | | | | | | | | | | | | | | | | |
Forward Foreign Currency Contracts | | | — | | | | 4,799 | | | | — | | | | 4,799 | |
Futures Contracts | | | 28,881 | | | | — | | | | — | | | | 28,881 | |
| | | | 28,881 | | | | 4,799 | | | | — | | | | 33,680 | |
Other Investments — Liabilities* | | | | | | | | | | | | | | | | |
Forward Foreign Currency Contracts | | | — | | | | (1,364,937 | ) | | | — | | | | (1,364,937 | ) |
Total Other Investments | | | 28,881 | | | | (1,360,138 | ) | | | — | | | | (1,331,257 | ) |
Total Investments | | $ | 1,090,500,815 | | | $ | 474,057,727 | | | $ | — | | | $ | 1,564,558,542 | |
| * | Unrealized appreciation (depreciation). |
NOTE 4—Derivative Investments
The Fund may enter into an International Swaps and Derivatives Association Master Agreement (“ISDA Master Agreement”) under which a fund may trade OTC derivatives. An OTC transaction entered into under an ISDA Master Agreement typically involves a collateral posting arrangement, payment netting provisions and close-out netting provisions. These netting provisions allow for reduction of credit risk through netting of contractual obligations. The enforceability of the netting provisions of the ISDA Master Agreement depends on the governing law of the ISDA Master Agreement, among other factors.
For financial reporting purposes, the Fund does not offset OTC derivative assets or liabilities that are subject to ISDA Master Agreements in the Statement of Assets and Liabilities.
Value of Derivative Investments at Period-End
The table below summarizes the value of the Fund’s derivative investments, detailed by primary risk exposure, held as of December 31, 2017:
| | | | | | | | | | | | |
| | | Value | |
| Derivative Assets | | Currency
Risk | | | Interest
Rate Risk | | | Total | |
Unrealized appreciation on futures contracts—Exchange-Traded(a) | | $ | — | | | $ | 28,881 | | | $ | 28,881 | |
Unrealized appreciation on forward foreign currency contracts outstanding | | | 4,799 | | | | — | | | | 4,799 | |
Total Derivative Assets | | | 4,799 | | | | 28,881 | | | | 33,680 | |
Derivatives not subject to master netting agreements | | | — | | | | (28,881 | ) | | | (28,881 | ) |
Total Derivative Assets subject to master netting agreements | | $ | 4,799 | | | $ | — | | | $ | 4,799 | |
Invesco V.I. Equity and Income Fund
| | | | | | | | | | | | |
| | | Value | |
| Derivative Liabilities | | Currency
Risk | | | Interest
Rate Risk | | | Total | |
Unrealized depreciation on forward foreign currency contracts outstanding | | $ | (1,364,937 | ) | | $ | — | | | $ | (1,364,937 | ) |
Derivatives not subject to master netting agreements | | | — | | | | — | | | | — | |
Total Derivative Liabilities subject to master netting agreements | | $ | (1,364,937 | ) | | $ | — | | | $ | (1,364,937 | ) |
| (a) | The daily variation margin receivable (payable) at period-end is recorded in the Statement of Assets and Liabilities. |
Offsetting Assets and Liabilities
The table below reflects the Fund’s exposure to Counterparties subject to either an ISDA Master Agreement or other agreement for OTC derivative transactions as of December 31, 2017.
| | | | | | | | | | | | | | | | | | | | | | | | |
| | | Financial
Derivative
Assets | | | Financial
Derivative
Liabilities | | | Net Value of
Derivatives | | | Collateral
(Received)/Pledged | | | Net
Amount | |
| Counterparty | | Forward
Foreign Currency
Contracts | | | Forward
Foreign Currency
Contracts | | | | Non-Cash | | | Cash | | |
Bank of Mellon New York (The) | | $ | — | | | $ | (686,610 | ) | | $ | (686,610 | ) | | $ | — | | | $ | — | | | $ | (686,610 | ) |
State Street Bank and Trust Co. | | | 4,799 | | | | (678,327 | ) | | | (673,528 | ) | | | — | | | | — | | | | (673,528 | ) |
Total | | $ | 4,799 | | | $ | (1,364,937 | ) | | $ | (1,360,138 | ) | | $ | — | | | $ | — | | | $ | (1,360,138 | ) |
Effect of Derivative Investments for the year ended December 31, 2017
The table below summarizes the gains (losses) on derivative investments, detailed by primary risk exposure, recognized in earnings during the period:
| | | | | | | | | | | | |
| | | Location of Gain (Loss) on
Statement of Operations | |
| | | Currency
Risk | | | Interest
Rate Risk | | | Total | |
Realized Gain (Loss): | | | | | | | | | | | | |
Forward foreign currency contracts | | $ | (2,799,889 | ) | | $ | — | | | $ | (2,799,889 | ) |
Futures contracts | | | — | | | | (36,340 | ) | | | (36,340 | ) |
Change in Net Unrealized Appreciation (Depreciation): | | | | | | | | | | | | |
Forward foreign currency contracts | | | (2,881,369 | ) | | | — | | | | (2,881,369 | ) |
Futures contracts | | | — | | | | 6,191 | | | | 6,191 | |
Total | | $ | (5,681,258 | ) | | $ | (30,149 | ) | | $ | (5,711,407 | ) |
The table below summarizes the average notional value of forward foreign currency contracts and futures contracts outstanding during the period.
| | | | | | | | |
| | | Forward
Foreign Currency
Contracts | | | Futures
Contracts | |
Average notional value | | $ | 84,640,801 | | | $ | 5,279,938 | |
NOTE 5—Trustees’ and Officers’ Fees and Benefits
Trustees’ and Officers’ Fees and Benefits include amounts accrued by the Fund to pay remuneration to certain Trustees and Officers of the Fund. Trustees have the option to defer compensation payable by the Fund, and Trustees’ and Officers’ Fees and Benefits also include amounts accrued by the Fund to fund such deferred compensation amounts. Those Trustees who defer compensation have the option to select various Invesco Funds in which their deferral accounts shall be deemed to be invested. Finally, certain current Trustees were eligible to participate in a retirement plan that provided for benefits to be paid upon retirement to Trustees over a period of time based on the number of years of service. The Fund may have certain former Trustees who also participate in a retirement plan and receive benefits under such plan. Trustees’ and Officers’ Fees and Benefits include amounts accrued by the Fund to fund such retirement benefits. Obligations under the deferred compensation and retirement plans represent unsecured claims against the general assets of the Fund.
NOTE 6—Cash Balances
The Fund is permitted to temporarily carry a negative or overdrawn balance in its account with State Street Bank and Trust Company, the custodian bank. Such balances, if any at period-end, are shown in the Statement of Assets and Liabilities under the payable caption Amount due custodian. To compensate the custodian bank for such overdrafts, the overdrawn Fund may either (1) leave funds as a compensating balance in the account so the custodian bank can be compensated by earning the additional interest; or (2) compensate by paying the custodian bank at a rate agreed upon by the custodian bank and Invesco, not to exceed the contractually agreed upon rate.
Invesco V.I. Equity and Income Fund
NOTE 7—Distributions to Shareholders and Tax Components of Net Assets
Tax Character of Distributions to Shareholders Paid During the Fiscal Years Ended December 31, 2017 and 2016:
| | | | | | | | |
| | | 2017 | | | 2016 | |
Ordinary income | | $ | 22,493,901 | | | $ | 22,587,463 | |
Long-term capital gain | | | 27,617,916 | | | | 43,008,386 | |
Total distributions | | $ | 50,111,817 | | | $ | 65,595,849 | |
Tax Components of Net Assets at Period-End:
| | | | |
| | | 2017 | |
Undistributed ordinary income | | $ | 28,549,182 | |
Undistributed long-term gain | | | 62,482,969 | |
Net unrealized appreciation — investments | | | 332,433,812 | |
Net unrealized appreciation — foreign currencies | | | 7,880 | |
Temporary book/tax differences | | | (152,000 | ) |
Shares of beneficial interest | | | 1,146,936,044 | |
Total net assets | | $ | 1,570,257,887 | |
The difference between book-basis and tax-basis unrealized appreciation (depreciation) is due to differences in the timing of recognition of gains and losses on investments for tax and book purposes. The Fund’s net unrealized appreciation difference is attributable primarily to wash sales, book to tax accretion and amortization differences, contingent payment debt instruments, forward foreign currency contracts and futures contracts.
The temporary book/tax differences are a result of timing differences between book and tax recognition of income and/or expenses. The Fund’s temporary book/tax differences are the result of the trustee deferral of compensation and retirement plan benefits.
Capital loss carryforward is calculated and reported as of a specific date. Results of transactions and other activity after that date may affect the amount of capital loss carryforward actually available for the Fund to utilize. Capital losses generated in years beginning after December 22, 2010 can be carried forward for an unlimited period, whereas previous losses expire in eight tax years. Capital losses with an expiration period may not be used to offset capital gains until all net capital losses without an expiration date have been utilized. Capital loss carryforwards with no expiration date will retain their character as either short-term or long-term capital losses instead of as short-term capital losses as under prior law. The ability to utilize capital loss carryforwards in the future may be limited under the Internal Revenue Code and related regulations based on the results of future transactions.
The Fund does not have a capital loss carryforward as of December 31, 2017.
NOTE 8—Investment Transactions
The aggregate amount of investment securities (other than short-term securities, U.S. Treasury obligations and money market funds, if any) purchased and sold by the Fund during the year ended December 31, 2017 was $258,274,272 and $363,856,806, respectively. During the same period, purchases and sales of U.S. Treasury obligations were $1,442,850,956 and $1,408,831,089, respectively. Cost of investments, including any derivatives, on a tax basis includes the adjustments for financial reporting purposes as of the most recently completed federal income tax reporting period-end.
| | | | |
| Unrealized Appreciation (Depreciation) of Investments on a Tax Basis | |
Aggregate unrealized appreciation of investments | | $ | 353,233,814 | |
Aggregate unrealized (depreciation) of investments | | | (20,800,002 | ) |
Net unrealized appreciation of investments | | $ | 332,433,812 | |
Cost of investments for tax purposes is $1,232,124,730.
NOTE 9—Reclassification of Permanent Differences
Primarily as a result of differing book/tax treatment of contingent payment debt instruments, bond premiums and sale of securities with deemed dividends, on December 31, 2017, undistributed net investment income was increased by $5,090,447 and undistributed net realized gain was decreased by $5,090,447. This reclassification had no effect on the net assets of the Fund.
Invesco V.I. Equity and Income Fund
NOTE 10—Share Information
| | | | | | | | | | | | | | | | |
| | | Summary of Share Activity | |
| | | Years ended December 31, | |
| | | 2017(a) | | | 2016 | |
| | | Shares | | | Amount | | | Shares | | | Amount | |
Sold: | | | | | | | | | | | | | | | | |
Series I | | | 1,444,387 | | | $ | 26,450,705 | | | | 3,385,579 | | | $ | 56,340,459 | |
Series II | | | 3,955,635 | | | | 72,128,100 | | | | 11,160,205 | | | | 184,995,192 | |
| | | | |
Issued as reinvestment of dividends: | | | | | | | | | | | | | | | | |
Series I | | | 331,991 | | | | 6,065,465 | | | | 401,502 | | | | 6,660,913 | |
Series II | | | 2,420,129 | | | | 44,046,353 | | | | 3,565,332 | | | | 58,934,936 | |
| | | | |
Reacquired: | | | | | | | | | | | | | | | | |
Series I | | | (955,203 | ) | | | (17,557,856 | ) | | | (835,357 | ) | | | (14,094,803 | ) |
Series II | | | (7,581,250 | ) | | | (138,765,947 | ) | | | (10,264,860 | ) | | | (168,559,965 | ) |
Net increase (decrease) in share activity | | | (384,311 | ) | | $ | (7,633,180 | ) | | | 7,412,401 | | | $ | 124,276,732 | |
| (a) | There are entities that are record owners of more than 5% of the outstanding shares of the Fund and in the aggregate own 77% of the outstanding shares of the Fund. The Fund and the Fund’s principal underwriter or adviser, are parties to participation agreements with these entities whereby these entities sell units of interest in separate accounts funding variable products that are invested in the Fund. The Fund, Invesco and/or Invesco affiliates may make payments to these entities, which are considered to be related to the Fund, for providing services to the Fund, Invesco and/or Invesco affiliates including but not limited to services such as, securities brokerage, third party record keeping and account servicing and administrative services. The Fund has no knowledge as to whether all or any portion of the shares owned of record by these entities are also owned beneficially. |
Invesco V.I. Equity and Income Fund
NOTE 11—Financial Highlights
The following schedule presents financial highlights for a share of the Fund outstanding throughout the periods indicated.
| | | | | | | | | | | | | | | | | | | | | | | | | | | | | | | | | | | | | | | | | | | | | | | | | | | | | | | | |
| | | Net asset
value,
beginning
of period | | | Net
investment
income(a) | | | Net gains
(losses)
on securities
(both
realized and
unrealized) | | | Total from
investment
operations | | | Dividends
from net
investment
income | | | Distributions
from net
realized
gains | | | Total
distributions | | | Net asset
value, end
of period | | | Total
return(b) | | | Net assets,
end of period
(000’s omitted) | | | Ratio of
expenses
to average
net assets
with fee waivers
and/or expenses
absorbed | | | Ratio of
expenses
to average net
assets without
fee waivers
and/or expenses
absorbed | | | Ratio of net
investment
income
to average
net assets | | | Portfolio
turnover(c) | |
Series I | | | | | | | | | | | | | | | | | | | | | | | | | | | | | | | | | | | | | | | | | | | | | | | | | | | | | | | | |
Year ended 12/31/17 | | $ | 17.76 | | | $ | 0.35 | (d) | | $ | 1.58 | | | $ | 1.93 | | | $ | (0.31 | ) | | $ | (0.34 | ) | | $ | (0.65 | ) | | $ | 19.04 | | | | 11.03 | % | | $ | 184,768 | | | | 0.55 | %(e) | | | 0.56 | %(e) | | | 1.93 | %(d)(e) | | | 119 | % |
Year ended 12/31/16 | | | 16.23 | | | | 0.29 | | | | 2.10 | | | | 2.39 | | | | (0.32 | ) | | | (0.54 | ) | | | (0.86 | ) | | | 17.76 | | | | 15.12 | | | | 157,774 | | | | 0.60 | | | | 0.61 | | | | 1.78 | | | | 101 | |
Year ended 12/31/15 | | | 18.93 | | | | 0.28 | | | | (0.78 | ) | | | (0.50 | ) | | | (0.49 | ) | | | (1.71 | ) | | | (2.20 | ) | | | 16.23 | | | | (2.29 | ) | | | 96,287 | | | | 0.64 | | | | 0.65 | | | | 1.55 | | | | 87 | |
Year ended 12/31/14 | | | 18.58 | | | | 0.37 | (f) | | | 1.28 | | | | 1.65 | | | | (0.35 | ) | | | (0.95 | ) | | | (1.30 | ) | | | 18.93 | | | | 9.03 | | | | 72,391 | | | | 0.66 | | | | 0.67 | | | | 1.92 | (f) | | | 85 | |
Year ended 12/31/13 | | | 15.08 | | | | 0.27 | | | | 3.51 | | | | 3.78 | | | | (0.28 | ) | | | — | | | | (0.28 | ) | | | 18.58 | | | | 25.18 | | | | 60,288 | | | | 0.66 | | | | 0.67 | | | | 1.59 | | | | 41 | |
Series II | | | | | | | | | | | | | | | | | | | | | | | | | | | | | | | | | | | | | | | | | | | | | | | | | | | | | | | | |
Year ended 12/31/17 | | | 17.68 | | | | 0.31 | (d) | | | 1.57 | | | | 1.88 | | | | (0.27 | ) | | | (0.34 | ) | | | (0.61 | ) | | | 18.95 | | | | 10.78 | | | | 1,385,490 | | | | 0.80 | (e) | | | 0.81 | (e) | | | 1.68 | (d)(e) | | | 119 | |
Year ended 12/31/16 | | | 16.16 | | | | 0.25 | | | | 2.09 | | | | 2.34 | | | | (0.28 | ) | | | (0.54 | ) | | | (0.82 | ) | | | 17.68 | | | | 14.84 | | | | 1,314,323 | | | | 0.85 | | | | 0.86 | | | | 1.53 | | | | 101 | |
Year ended 12/31/15 | | | 18.86 | | | | 0.23 | | | | (0.78 | ) | | | (0.55 | ) | | | (0.44 | ) | | | (1.71 | ) | | | (2.15 | ) | | | 16.16 | | | | (2.58 | ) | | | 1,129,261 | | | | 0.89 | | | | 0.90 | | | | 1.30 | | | | 87 | |
Year ended 12/31/14 | | | 18.52 | | | | 0.32 | (f) | | | 1.28 | | | | 1.60 | | | | (0.31 | ) | | | (0.95 | ) | | | (1.26 | ) | | | 18.86 | | | | 8.77 | | | | 1,290,920 | | | | 0.91 | | | | 0.92 | | | | 1.67 | (f) | | | 85 | |
Year ended 12/31/13 | | | 15.05 | | | | 0.23 | | | | 3.50 | | | | 3.73 | | | | (0.26 | ) | | | — | | | | (0.26 | ) | | | 18.52 | | | | 24.88 | | | | 1,244,045 | | | | 0.91 | | | | 0.92 | | | | 1.34 | | | | 41 | |
| (a) | Calculated using average shares outstanding. |
| (b) | Includes adjustments in accordance with accounting principles generally accepted in the United States of America and as such, the net asset value for financial reporting purposes and the returns based upon those net asset values may differ from the net asset value and returns for shareholder transactions. Total returns are not annualized for periods less than one year, if applicable, and do not reflect charges assessed in connection with a variable product, which if included would reduce total returns. |
| (c) | Portfolio turnover is calculated at the fund level and is not annualized for periods less than one year, if applicable. |
| (d) | Net investment income per share and the ratio of net investment income to average net assets includes significant dividends received during the year ended December 31, 2017. Net investment income per share and the ratio of net investment income to average net assets excluding the significant dividends are $0.30 and 1.64% and $0.26 and 1.39% for Series I and Series II shares, respectively. |
| (e) | Ratios are based on average daily net assets (000’s omitted) of $172,121 and $1,345,942 for Series I and Series II shares, respectively. |
| (f) | Net investment income per share and the ratio of net investment income to average net assets includes significant dividends received during the year ended December 31, 2014. Net investment income per share and the ratio of net investment income to average net assets excluding the significant dividends are $0.27 and 1.41% and $0.22 and 1.16% for Series I and Series II shares, respectively. |
Invesco V.I. Equity and Income Fund
Report of Independent Registered Public Accounting Firm
To the Board of Trustees of AIM Variable Insurance Funds (Invesco Variable Insurance Funds)
and Shareholders of Invesco V.I. Equity & Income Fund
Opinion on the Financial Statements
We have audited the accompanying statement of assets and liabilities, including the schedule of investments, of Invesco V.I. Equity & Income Fund (one of the funds constituting AIM Variable Insurance Funds (Invesco Variable Insurance Funds), hereafter referred to as the “Fund”) as of December 31, 2017, the related statement of operations for the year ended December 31, 2017, the statement of changes in net assets for each of the two years in the period ended December 31, 2017, including the related notes, and the financial highlights for each of the five years in the period ended December 31, 2017 (collectively referred to as the “financial statements”). In our opinion, the financial statements present fairly, in all material respects, the financial position of the Fund as of December 31, 2017, the results of its operations for the year then ended, the changes in its net assets for each of the two years in the period ended December 31, 2017 and the financial highlights for each of the five years in the period ended December 31, 2017 in conformity with accounting principles generally accepted in the United States of America.
Basis for Opinion
These financial statements are the responsibility of the Fund’s management. Our responsibility is to express an opinion on the Fund’s financial statements based on our audits. We are a public accounting firm registered with the Public Company Accounting Oversight Board (United States) (“PCAOB”) and are required to be independent with respect to the Fund in accordance with the U.S. federal securities laws and the applicable rules and regulations of the Securities and Exchange Commission and the PCAOB.
We conducted our audits of these financial statements in accordance with the standards of the PCAOB. Those standards require that we plan and perform the audit to obtain reasonable assurance about whether the financial statements are free of material misstatement, whether due to error or fraud.
Our audits included performing procedures to assess the risks of material misstatement of the financial statements, whether due to error or fraud, and performing procedures that respond to those risks. Such procedures included examining, on a test basis, evidence regarding the amounts and disclosures in the financial statements. Our audits also included evaluating the accounting principles used and significant estimates made by management, as well as evaluating the overall presentation of the financial statements. Our procedures included confirmation of securities owned as of December 31, 2017 by correspondence with the custodian, transfer agent and brokers; when replies were not received from brokers, we performed other auditing procedures. We believe that our audits provide a reasonable basis for our opinion.
PricewaterhouseCoopers LLP
Houston, TX
February 14, 2018
We have served as the auditor of one or more of the investment companies in the Invesco/PowerShares group of investment companies since at least 1995. We have not determined the specific year we began serving as auditor.
Invesco V.I. Equity and Income Fund
Calculating your ongoing Fund expenses
Example
As a shareholder of the Fund, you incur ongoing costs, including management fees; distribution and/or service fees (12b-1); and other Fund expenses. This example is intended to help you understand your ongoing costs (in dollars) of investing in the Fund and to compare these costs with ongoing costs of investing in other mutual funds. The example is based on an investment of $1,000 invested at the beginning of the period and held for the entire period July 1, 2017 through December 31, 2017.
The actual and hypothetical expenses in the examples below do not represent the effect of any fees or other expenses assessed in connection with a variable product; if they did, the expenses shown would be higher while the ending account values shown would be lower.
Actual expenses
The table below provides information about actual account values and actual expenses. You may use the information in this table, together with the amount you invested, to estimate the expenses that you paid over the period. Simply divide your account value by $1,000 (for example, an $8,600 account value divided by $1,000 = 8.6), then multiply the result by the number in the table under the heading entitled “Actual Expenses Paid During Period” to estimate the expenses you paid on your account during this period.
Hypothetical example for comparison purposes
The table below also provides information about hypothetical account values and hypothetical expenses based on the Fund’s actual expense ratio and an assumed rate of return of 5% per year before expenses, which is not the Fund’s actual return.
The hypothetical account values and expenses may not be used to estimate the actual ending account balance or expenses you paid for the period. You may use this information to compare the ongoing costs of investing in the Fund and other funds. To do so, compare this 5% hypothetical example with the 5% hypothetical examples that appear in the shareholder reports of the other funds.
Please note that the expenses shown in the table are meant to highlight your ongoing costs. Therefore, the hypothetical information is useful in comparing ongoing costs, and will not help you determine the relative total costs of owning different funds.
| | | | | | | | | | | | | | | | | | | | | | | | |
Class | | Beginning
Account Value
(07/01/17) | | | ACTUAL | | | HYPOTHETICAL (5% annual return before
expenses) | | | Annualized
Expense
Ratio | |
| | | Ending
Account Value
(12/31/17)1 | | | Expenses
Paid During
Period2 | | | Ending
Account Value
(12/31/17) | | | Expenses
Paid During
Period2 | | |
| Series I | | $ | 1,000.00 | | | $ | 1,066.50 | | | $ | 2.81 | | | $ | 1,022.48 | | | $ | 2.75 | | | | 0.54 | % |
| Series II | | | 1,000.00 | | | | 1,065.00 | | | | 4.11 | | | | 1,021.22 | | | | 4.02 | | | | 0.79 | |
| 1 | The actual ending account value is based on the actual total return of the Fund for the period July 1, 2017 through December 31, 2017, after actual expenses and will differ from the hypothetical ending account value which is based on the Fund’s expense ratio and a hypothetical annual return of 5% before expenses. |
| 2 | Expenses are equal to the Fund’s annualized expense ratio as indicated above multiplied by the average account value over the period, multiplied by 184/365 to reflect the most recent fiscal half year. |
Invesco V.I. Equity and Income Fund
Tax Information
Form 1099-DIV, Form 1042-S and other year–end tax information provide shareholders with actual calendar year amounts that should be included in their tax returns. Shareholders should consult their tax advisors.
The following distribution information is being provided as required by the Internal Revenue Code or to meet a specific state’s requirement.
The Fund designates the following amounts or, if subsequently determined to be different, the maximum amount allowable for its fiscal year ended December 31, 2017:
| | | | |
Federal and State Income Tax | |
Long-Term Capital Gain Distributions | | $ | 27,617,916 | |
Corporate Dividends Received Deduction* | | | 68.58 | % |
U.S. Treasury Obligations* | | | 6.79 | % |
| | * | The above percentages are based on ordinary income dividends paid to shareholders during the Fund’s fiscal year. |
Invesco V.I. Equity and Income Fund
Trustees and Officers
The address of each trustee and officer is AIM Variable Insurance Funds (Invesco Variable Insurance Funds) (the “Trust”), 11 Greenway Plaza, Suite 1000, Houston, Texas 77046-1173. The trustees serve for the life of the Trust, subject to their earlier death, incapacitation, resignation, retirement or removal as more specifically provided in the Trust’s organizational documents. Each officer serves for a one year term or until their successors are elected and qualified. Column two below includes length of time served with predecessor entities, if any.
| | | | | | | | |
Name, Year of Birth and
Position(s) Held with the Trust | | Trustee and/
or Officer Since | | Principal Occupation(s)
During Past 5 Years | | Number of
Funds in Fund
Complex
Overseen by
Trustee | | Other Directorship(s)
Held by Trustee During
Past 5 Years |
| Interested Persons | | | | | | | | |
Martin L. Flanagan1 — 1960 Trustee | | 2007 | | Executive Director, Chief Executive Officer and President, Invesco Ltd. (ultimate parent of Invesco and a global investment management firm); Trustee, The Invesco Funds; Vice Chair, Investment Company Institute; and Member of Executive Board, SMU Cox School of Business Formerly: Advisor to the Board, Invesco Advisers, Inc. (formerly known as Invesco Institutional (N.A.), Inc.); Chairman and Chief Executive Officer, Invesco Advisers, Inc. (registered investment adviser); Director, Chairman, Chief Executive Officer and President, Invesco Holding Company (US), Inc. (formerly IVZ Inc.) (holding company), Invesco Group Services, Inc. (service provider) and Invesco North American Holdings, Inc. (holding company); Director, Chief Executive Officer and President, Invesco Holding Company Limited (parent of Invesco and a global investment management firm); Director, Invesco Ltd.; Chairman, Investment Company Institute and President, Co-Chief Executive Officer, Co-President, Chief Operating Officer and Chief Financial Officer, Franklin Resources, Inc. (global investment management organization) | | 158 | | None |
Philip A. Taylor2 — 1954 Trustee and Senior Vice President | | 2006 | | Head of the Americas and Senior Managing Director, Invesco Ltd.; Director, Invesco Advisers, Inc. (formerly known as Invesco Institutional (N.A.), Inc.) (registered investment adviser); Director, Chairman, Chief Executive Officer and President, Invesco Management Group, Inc. (formerly known as Invesco Aim Management Group, Inc.) (financial services holding company); Director and Chairman, Invesco Investment Services, Inc. (formerly known as Invesco Aim Investment Services, Inc.) (registered transfer agent); Chief Executive Officer, Invesco Corporate Class Inc. (corporate mutual fund company); Director, Chairman and Chief Executive Officer, Invesco Canada Ltd. (formerly known as Invesco Trimark Ltd./Invesco Trimark Ltèe) (registered investment adviser and registered transfer agent); Trustee and Senior Vice President, The Invesco Funds; Director, Invesco Investment Advisers LLC (formerly known as Van Kampen Asset Management). Formerly: Co-Chairman, Co-President and Co-Chief Executive Officer, Invesco Advisers, Inc. (formerly known as Invesco Institutional (N.A.), Inc.) (registered investment adviser); Director, Chief Executive Officer and President, Van Kampen Exchange Corp; President and Principal Executive Officer, The Invesco Funds (other than AIM Treasurer’s Series Trust (Invesco Treasurer’s Series Trust), Short-Term Investments Trust and Invesco Management Trust); Executive Vice President, The Invesco Funds (AIM Treasurer’s Series Trust (Invesco Treasurer’s Series Trust), Short-Term Investments Trust and Invesco Management Trust only); Director and President, INVESCO Funds Group, Inc. (registered investment adviser and registered transfer agent); Director and Chairman, IVZ Distributors, Inc. (formerly known as INVESCO Distributors, Inc.) (registered broker dealer); Director, President and Chairman, Invesco Inc. (holding company), Invesco Canada Holdings Inc. (holding company), Trimark Investments Ltd./Placements Trimark Ltèe and Invesco Financial Services Ltd/Services Financiers Invesco Ltèe; Chief Executive Officer, Invesco Canada Fund Inc. (corporate mutual fund company); Director and Chairman, Van Kampen Investor Services Inc.; Director, Chief Executive Officer and President, 1371 Preferred Inc. (holding company) and Van Kampen Investments Inc.; Director and President, AIM GP Canada Inc. (general partner for limited partnerships) and Van Kampen Advisors, Inc.; Director and Chief Executive Officer, Invesco Trimark Dealer Inc. (registered broker dealer); Director, Invesco Distributors, Inc. (formerly known as Invesco Aim Distributors, Inc.) (registered broker dealer); Manager, Invesco PowerShares Capital Management LLC; Director, Chief Executive Officer and President, Invesco Advisers, Inc.; Director, Chairman, Chief Executive Officer and President, Invesco Aim Capital Management, Inc.; President, Invesco Trimark Dealer Inc. and Invesco Trimark Ltd./Invesco Trimark Ltèe; Director and President, AIM Trimark Corporate Class Inc. and AIM Trimark Canada Fund Inc.; Senior Managing Director, Invesco Holding Company Limited; Director and Chairman, Fund Management Company (former registered broker dealer); President and Principal Executive Officer, The Invesco Funds (AIM Treasurer’s Series Trust (Invesco Treasurer’s Series Trust), and Short-Term Investments Trust only); President, AIM Trimark Global Fund Inc. and AIM Trimark Canada Fund Inc. | | 158 | | None |
| 1 | Mr. Flanagan is considered an interested person (within the meaning of Section 2(a)(19) of the 1940 Act) of the Trust because he is an officer of the Adviser to the Trust, and an officer and a director of Invesco Ltd., ultimate parent of the Adviser. |
| 2 | Mr. Taylor is considered an interested person (within the meaning of Section 2(a)(19) of the 1940 Act) of the Trust because he is an officer and a director of the Adviser. |
Invesco V.I. Equity and Income Fund
Trustees and Officers—(continued)
| | | | | | | | |
Name, Year of Birth and
Position(s) Held with the Trust | | Trustee and/
or Officer Since | | Principal Occupation(s)
During Past 5 Years | | Number of
Funds in Fund
Complex
Overseen by
Trustee | | Other Directorship(s)
Held by Trustee During
Past 5 Years |
| Independent Trustees | | | | | | | | |
Bruce L. Crockett — 1944 Trustee and Chair | | 1993 | | Chairman, Crockett Technologies Associates (technology consulting company) Formerly: Director, Captaris (unified messaging provider); Director, President and Chief Executive Officer, COMSAT Corporation; Chairman, Board of Governors of INTELSAT (international communications company); ACE Limited (insurance company); Independent Directors Council and Investment Company Institute: Member of the Audit Committee, Investment Company Institute; Member of the Executive Committee and Chair of the Governance Committee, Independent Directors Council | | 158 | | Director and Chairman of the Audit Committee, ALPS (Attorneys Liability Protection Society) (insurance company); Director and Member of the Audit Committee and Compensation Committee, Ferroglobe PLC (metallurgical company) |
David C. Arch — 1945 Trustee | | 2010 | | Chairman of Blistex Inc. (consumer health care products manufacturer); Member, World Presidents’ Organization | | 158 | | Board member of the Illinois Manufacturers’ Association |
Jack M. Fields — 1952 Trustee | | 1997 | | Chief Executive Officer, Twenty First Century Group, Inc. (government affairs company); and Chairman, Discovery Learning Alliance (non-profit) Formerly: Owner and Chief Executive Officer, Dos Angeles Ranch L.P. (cattle, hunting, corporate entertainment); Director, Insperity, Inc. (formerly known as Administaff) (human resources provider); Chief Executive Officer, Texana Timber LP (sustainable forestry company); Director of Cross Timbers Quail Research Ranch (non-profit); and member of the U.S. House of Representatives | | 158 | | None |
Cynthia Hostetler — 1962 Trustee | | 2017 | | Non-Executive Director and Trustee of a number of public and private business corporations Formerly: Head of Investment Funds and Private Equity, Overseas Private Investment Corporation; President, First Manhattan Bancorporation, Inc.; Attorney, Simpson Thacher & Bartlett LLP | | 158 | | Vulcan Materials Company (construction materials company); Trilinc Global Impact Fund; Aberdeen Investment Funds (4 portfolios); Artio Global Investment LLC (mutual fund complex); Edgen Group, Inc. (specialized energy and infrastructure products distributor) |
Eli Jones — 1961 Trustee | | 2016 | | Professor and Dean, Mays Business School — Texas A&M University Formerly: Professor and Dean, Walton College of Business, University of Arkansas and E.J. Ourso College of Business, Louisiana State University; Director, Arvest Bank | | 158 | | Insperity, Inc. (formerly known as Administaff) (human resources provider) |
Prema Mathai-Davis — 1950 Trustee | | 1998 | | Retired. | | 158 | | None |
Teresa M. Ressel — 1962 Trustee | | 2017 | | Non-executive director and trustee of a number of public and private business corporations Formerly: Chief Financial Officer, Olayan America, The Olayan Group (international investor/commercial/industrial); Chief Executive Officer, UBS Securities LLC; Group Chief Operating Officer, Americas, UBS AG; Assistant Secretary for Management & Budget and CFO, US Department of the Treasury | | 158 | | Atlantic Power Corporation (power generation company); ON Semiconductor Corp. (semiconductor supplier) |
Ann Barnett Stern — 1957 Trustee | | 2017 | | President and Chief Executive Officer, Houston Endowment Inc. (private philanthropic institution) Formerly: Executive Vice President and General Counsel, Texas Children’s Hospital; Attorney, Beck, Redden and Secrest, LLP; Business Law Instructor, University of St. Thomas; Attorney, Andrews & Kurth LLP | | 158 | | Federal Reserve Bank of Dallas |
Raymond Stickel, Jr. — 1944 Trustee | | 2005 | | Retired. Formerly: Director, Mainstay VP Series Funds, Inc. (25 portfolios); Partner, Deloitte & Touche | | 158 | | None |
Robert C. Troccoli — 1949 Trustee | | 2016 | | Adjunct Professor, University of Denver — Daniels College of Business Formerly: Senior Partner, KPMG LLP | | 158 | | None |
Christopher L. Wilson — 1957 Trustee | | 2017 | | Non-executive director and trustee of a number of public and private business corporations Formerly: Managing Partner, CT2, LLC (investing and consulting firm); President/Chief Executive Officer, Columbia Funds, Bank of America Corporation; President/Chief Executive Officer, CDC IXIS Asset Management Services, Inc.; Principal & Director of Operations, Scudder Funds, Scudder, Stevens & Clark, Inc.; Assistant Vice President, Fidelity Investments | | 158 | | TD Asset Management USA Inc. (mutual fund complex) (22 portfolios); ISO New England, Inc. (non-profit organization managing regional electricity market) |
Invesco V.I. Equity and Income Fund
Trustees and Officers—(continued)
| | | | | | | | |
Name, Year of Birth and
Position(s) Held with the Trust | | Trustee and/
or Officer Since | | Principal Occupation(s)
During Past 5 Years | | Number of
Funds in Fund
Complex
Overseen by
Trustee | | Other Directorship(s)
Held by Trustee During
Past 5 Years |
| Other Officers | | | | | | | | |
Sheri Morris — 1964 President, Principal Executive Officer and Treasurer | | 1999 | | President, Principal Executive Officer and Treasurer, The Invesco Funds; Vice President, Invesco Advisers, Inc. (formerly known as Invesco Institutional (N.A.), Inc.) (registered investment adviser); and Vice President, PowerShares Exchange-Traded Fund Trust, PowerShares Exchange-Traded Fund Trust II, PowerShares India Exchange-Traded Fund Trust, PowerShares Actively Managed Exchange-Traded Fund Trust, PowerShares Actively Managed Exchange-Traded Commodity Fund Trust and PowerShares Exchange-Traded Self-Indexed Fund Trust Formerly: Vice President and Principal Financial Officer, The Invesco Funds; Vice President, Invesco Aim Advisers, Inc., Invesco Aim Capital Management, Inc. and Invesco Aim Private Asset Management, Inc.; Assistant Vice President and Assistant Treasurer, The Invesco Funds and Assistant Vice President, Invesco Advisers, Inc., Invesco Aim Capital Management, Inc. and Invesco Aim Private Asset Management, Inc.; and Treasurer, PowerShares Exchange-Traded Fund Trust, PowerShares Exchange-Traded Fund Trust II, PowerShares India Exchange-Traded Fund Trust and PowerShares Actively Managed Exchange-Traded Fund Trust | | N/A | | N/A |
Russell C. Burk — 1958 Senior Vice President and Senior Officer | | 2005 | | Senior Vice President and Senior Officer, The Invesco Funds | | N/A | | N/A |
John M. Zerr — 1962 Senior Vice President, Chief Legal Officer and Secretary | | 2006 | | Director, Senior Vice President, Secretary and General Counsel, Invesco Management Group, Inc. (formerly known as Invesco AIM Management Group, Inc.); Senior Vice President, Invesco Advisers, Inc. (formerly known as Invesco Institutional (N.A.), Inc.) (registered investment adviser); Senior Vice President and Secretary, Invesco Distributors, Inc. (formerly known as Invesco AIM Distributors, Inc.); Director, Vice President and Secretary, Invesco Investment Services, Inc. (formerly known as Invesco AIM Investment Services, Inc.) Senior Vice President, Chief Legal Officer and Secretary, The Invesco Funds; Managing Director, Invesco PowerShares Capital Management LLC; Director, Secretary and General Counsel, Invesco Investment Advisers LLC (formerly known as Van Kampen Asset Management); Secretary and General Counsel, Invesco Capital Markets, Inc. (formerly known as Van Kampen Funds Inc.) and Chief Legal Officer, PowerShares Exchange-Traded Fund Trust, PowerShares Exchange-Traded Fund Trust II, PowerShares India Exchange-Traded Fund Trust, PowerShares Actively Managed Exchange-Traded Fund Trust, PowerShares Actively Managed Exchange-Traded Commodity Fund Trust and PowerShares Exchange-Traded Self-Indexed Fund Trust; Manager and Secretary, Invesco Indexing LLC Formerly: Director, Secretary, General Counsel and Senior Vice President, Van Kampen Exchange Corp.; Director, Vice President and Secretary, IVZ Distributors, Inc. (formerly known as INVESCO Distributors, Inc.); Director and Vice President, INVESCO Funds Group, Inc.; Director and Vice President, Van Kampen Advisors Inc.; Director, Vice President, Secretary and General Counsel, Van Kampen Investor Services Inc.; Director, Invesco Distributors, Inc. (formerly known as Invesco AIM Distributors, Inc.); Director, Senior Vice President, General Counsel and Secretary, Invesco AIM Advisers, Inc. and Van Kampen Investments Inc.; Director, Vice President and Secretary, Fund Management Company; Director, Senior Vice President, Secretary, General Counsel and Vice President, Invesco AIM Capital Management, Inc.; Chief Operating Officer and General Counsel, Liberty Ridge Capital, Inc. (an investment adviser); Vice President and Secretary, PBHG Funds (an investment company) and PBHG Insurance Series Fund (an investment company); Chief Operating Officer, General Counsel and Secretary, Old Mutual Investment Partners (a broker-dealer); General Counsel and Secretary, Old Mutual Fund Services (an administrator) and Old Mutual Shareholder Services (a shareholder servicing center); Executive Vice President, General Counsel and Secretary, Old Mutual Capital, Inc. (an investment adviser); and Vice President and Secretary, Old Mutual Advisors Funds (an investment company) | | N/A | | N/A |
Gregory G. McGreevey — 1962 Senior Vice President | | 2012 | | Senior Managing Director, Invesco Ltd.; Director, Chairman, President, and Chief Executive Officer, Invesco Advisers, Inc. (formerly known as Invesco Institutional (N.A.), Inc.) (registered investment adviser); Senior Vice President, Invesco Management Group, Inc.; Director, Invesco Mortgage Capital, Inc. and Invesco Senior Secured Management, Inc.; and Senior Vice President, The Invesco Funds Formerly: Assistant Vice President, The Invesco Funds | | N/A | | N/A |
Kelli Gallegos — 1970 Vice President, Principal Financial Officer and Assistant Treasurer | | 2008 | | Vice President, Principal Financial Officer and Assistant Treasurer, The Invesco Funds; Assistant Treasurer, Invesco PowerShares Capital Management LLC, PowerShares Exchange-Traded Fund Trust, PowerShares Exchange-Traded Fund Trust II, PowerShares India Exchange-Traded Fund Trust, PowerShares Actively Managed Exchange-Traded Fund Trust, PowerShares Actively Managed Exchange-Traded Commodity Fund Trust and PowerShares Exchange-Traded Self-Indexed Fund Trust Formerly: Assistant Vice President, The Invesco Funds | | N/A | | N/A |
Invesco V.I. Equity and Income Fund
Trustees and Officers—(continued)
| | | | | | | | |
Name, Year of Birth and
Position(s) Held with the Trust | | Trustee and/
or Officer Since | | Principal Occupation(s)
During Past 5 Years | | Number of
Funds in Fund
Complex
Overseen by
Trustee | | Other Directorship(s)
Held by Trustee During
Past 5 Years |
| Other Officers—(continued) | | | | | | | | |
Tracy Sullivan — 1962 Vice President, Chief Tax Officer and Assistant Treasurer | | 2008 | | Vice President, Chief Tax Officer and Assistant Treasurer, The Invesco Funds; Assistant Treasurer, Invesco PowerShares Capital Management LLC, PowerShares Exchange-Traded Fund Trust, PowerShares Exchange-Traded Fund Trust II, PowerShares India Exchange-Traded Fund Trust, PowerShares Actively Managed Exchange-Traded Fund Trust, PowerShares Actively Managed Exchange-Traded Commodity Fund Trust and PowerShares Exchange-Traded Self-Indexed Fund Trust Formerly: Assistant Vice President, The Invesco Funds | | N/A | | N/A |
Crissie M. Wisdom — 1969 Anti-Money Laundering Compliance Officer | | 2013 | | Anti-Money Laundering Compliance Officer, Invesco Advisers, Inc. (formerly known as Invesco Institutional (N.A.), Inc.) (registered investment adviser), Invesco Capital Markets, Inc. (formerly known as Van Kampen Funds Inc.), Invesco Distributors, Inc., Invesco Investment Services, Inc., Invesco Management Group, Inc., The Invesco Funds, and PowerShares Exchange-Traded Fund Trust, PowerShares Exchange-Traded Fund Trust II, PowerShares India Exchange-Traded Fund Trust, PowerShares Actively Managed Exchange-Traded Fund Trust, PowerShares Actively Managed Exchange-Traded Commodity Fund Trust and PowerShares Exchange-Traded Self-Indexed Fund Trust; Anti-Money Laundering Compliance Officer and Bank Secrecy Act Officer, INVESCO National Trust Company and Invesco Trust Company; and Fraud Prevention Manager and Controls and Risk Analysis Manager for Invesco Investment Services, Inc. Formerly: Anti-Money Laundering Compliance Officer, Van Kampen Exchange Corp. | | N/A | | N/A |
Robert R. Leveille — 1969 Chief Compliance Officer | | 2016 | | Chief Compliance Officer, Invesco Advisers, Inc. (registered investment adviser); and Chief Compliance Officer, The Invesco Funds Formerly: Chief Compliance Officer, Putnam Investments and the Putnam Funds | | N/A | | N/A |
The Statement of Additional Information of the Trust includes additional information about the Fund’s Trustees and is available upon request, without charge, by calling 1.800.959.4246. Please refer to the Fund’s Statement of Additional Information for information on the Fund’s sub-advisers.
| | | | | | |
Office of the Fund 11 Greenway Plaza, Suite 1000 Houston, TX 77046-1173 | | Investment Adviser Invesco Advisers, Inc. 1555 Peachtree Street, N.E. Atlanta, GA 30309 | | Distributor Invesco Distributors, Inc. 11 Greenway Plaza, Suite 1000 Houston, TX 77046-1173 | | Auditors PricewaterhouseCoopers LLP 1000 Louisiana Street, Suite 5800 Houston, TX 77002-5678 |
| | | |
| | | | | | |
Counsel to the Fund Stradley Ronon Stevens & Young, LLP 2005 Market Street, Suite 2600 Philadelphia, PA 19103-7018 | | Counsel to the Independent Trustees Goodwin Procter LLP 901 New York Avenue, N.W. Washington, D.C. 20001 | | Transfer Agent Invesco Investment Services, Inc. 11 Greenway Plaza, Suite 1000 Houston, TX 77046-1173 | | Custodian State Street Bank and Trust Company 225 Franklin Street Boston, MA 02110-2801 |
Invesco V.I. Equity and Income Fund
| | | | |
| | |
 | | Annual Report to Shareholders | | December 31, 2017 |
| | |
| | Invesco V.I. Global Core Equity Fund |

| | |
| | The Fund provides a complete list of its holdings four times in each fiscal year, at the quarter-ends. For the second and fourth quarters, the lists appear in the Fund’s semiannual and annual reports to shareholders. For the first and third quarters, the Fund files the lists with the Securities and Exchange Commission (SEC) on Form N-Q. The Fund’s Form N-Q filings are available on the SEC website, sec.gov. Copies of the Fund’s Forms N-Q may be reviewed and copied at the SEC Public Reference Room in Washington, D.C. You can obtain information on the operation of the Public Reference Room, including information about duplicating fee charges, by calling 202 551 8090 or 800 732 0330, or by electronic request at the following email address: publicinfo@sec.gov. The SEC file numbers for the Fund are 811-07452 and 033-57340. The Fund’s most recent portfolio holdings, as filed on Form N-Q, have also been made available to insurance companies issuing variable annuity contracts and variable life insurance policies (“variable products”) that invest in the Fund. A description of the policies and procedures that the Fund uses to determine how to vote proxies relating to portfolio securities is available without charge, upon request, from our Client Services department at 800 959 4246 or at invesco.com/proxyguidelines. The information is also available on the SEC website, sec.gov. Information regarding how the Fund voted proxies related to its portfolio securities during the most recent 12-month period ended June 30 is available at invesco.com/ proxysearch. The information is also available on the SEC website, sec.gov. Invesco Advisers, Inc. is an investment adviser; it provides investment advisory services to individual and institutional clients and does not sell securities. Invesco Distributors, Inc. is the US distributor for Invesco Ltd.’s retail mutual funds, exchange-traded funds and institutional money market funds. Both are wholly owned, indirect subsidiaries of Invesco Ltd. This report must be accompanied or preceded by a currently effective Fund prospectus and variable product prospectus, which contain more complete information, including sales charges and expenses. Investors should read each carefully before investing. NOT FDIC INSURED | MAY LOSE VALUE | NO BANK GUARANTEE |
| |
| | Invesco Distributors, Inc. VIGCE-AR-1 02072018 1324 |
Management’s Discussion of Fund Performance
Performance summary
For the year ended December 31, 2017, Series I shares of Invesco V.I. Global Core
Equity Fund (the Fund) outperformed the MSCI World Index, the Fund’s broad market/style-specific benchmark.
Your Fund’s long-term performance appears later in this report.
Fund vs. Indexes
Total returns, 12/31/16 to 12/31/17, excluding variable product issuer charges.
If variable product issuer charges were included, returns would be lower.
| | | | | |
| Series I Shares | | | | 22.90 | % |
| Series II Shares | | | | 22.60 | |
| MSCI World Index▼ (Broad Market/Style-Specific Index) | | | | 22.40 | |
| Lipper VUF Global Multi-Cap value Funds Classification Average∎ (Peer Group) | | | | 15.77 | |
| |
Source(s): ▼FactSet Research Systems Inc.; ∎Lipper Inc. | | | | | |
Market conditions and your Fund
Global equity markets delivered positive, and in many cases double-digit, returns over the year ended December 31, 2017. These gains were broadly driven by firming global economic growth, as well as stronger corporate fundamentals. After trailing international markets for the first three quarters of the year, the US equity market outperformed international markets in the fourth quarter. US equity markets received a boost from the prospect of sweeping individual and corporate tax cuts, with a final tax bill approved by Congress in December.
In developed markets, the US Federal Reserve (the Fed) met in December and increased the benchmark fed funds target rate by 0.25% to a target range of 1.25 to 1.50%. Combined with two other interest rate increases earlier in 2017, the Fed’s decision reflects a more constructive outlook for the US economy. In contrast, the European Central Bank held rates steady at 0% throughout 2017 and maintained its generous bond buying program through at least September 2018, or beyond, until it sees a sustained adjustment in the path of inflation.
Most emerging markets continued to perform well during 2017. In addition to the improving global economic outlook, other positive tailwinds included reduced expectations for a major shift in US trade policy as well as stronger oil prices. Oil moved higher on production restraint by OPEC and Russia, benefiting commodity-driven emerging markets.
At the close of 2017, equity market valuations in developed and emerging markets appeared relatively full in absolute terms, but non-US equity markets were trading at a material discount to the US. In sum, while valuations were not cheap, recent earnings growth and upward earnings revisions improved in many non-US developed markets. Interestingly, while 2017 marked the eighth year of the global bull market, we saw a shift in leadership as international stocks outperformed US stocks for the year. Prior to 2017, international stocks had trailed US stocks for four consecutive years and in six of the last seven years.
During the year, stock selection in the consumer discretionary, energy, financials, materials and telecommunication services sectors benefited Fund performance relative to the broad market/
style-specific benchmark. In addition, stock selection in and underweight exposure to the consumer staples and utilities sectors contributed to Fund performance, as did stock selection in and overweight exposure to the industrials sector. The largest detractors from Fund performance relative to the broad market/style-specific benchmark included stock selection in the health care and information technology (IT) sectors, as well as underweight exposure to the latter.
From a geographic perspective, stock selection in Australia and the UK was beneficial to the Fund’s relative performance, as was stock selection in and mild overweight exposure to Hong Kong, Japan and Singapore. Exposure to select emerging markets, as well as overweight exposure to the Netherlands, also benefited Fund performance. Finally, the Fund’s use of forward foreign currency contracts to hedge against adverse movements in the foreign currencies in which portfolio securities are denominated provided slightly positive absolute returns. Conversely, stock selection in Canada, France, Germany and, most notably, the US, detracted from the Fund’s relative performance.
The largest individual contributor during the reporting period was Qantas Airways. The company benefited from a strong domestic market share based on an industry-leading loyalty program and its strong position at the slot-constrained Sydney airport. In addition, AIA Group, a leading Asian insurer based in Hong Kong, experienced solid gains from improved economic prospects in emerging markets and robust sales trends, particularly within China. Also contributing to the Fund’s performance versus the broad market/style-specific benchmark was Sherwin Williams. The company benefited from increased activity in homebuilding and remodeling, which drove strong revenue growth.
| | | | | |
| Portfolio Composition |
| By country | | | | % of total net assets | |
| | | | | |
| |
| United States | | | | 43.6 | % |
| Japan | | | | 12.8 | |
| United Kingdom | | | | 11.8 | |
| Switzerland | | | | 5.2 | |
| Italy | | | | 4.8 | |
| Netherlands | | | | 3.2 | |
| Hong Kong | | | | 2.2 | |
| Australia | | | | 2.1 | |
| Germany | | | | 2.1 | |
| Countries each less than 2.0% of portfolio | | | | 12.1 | |
| Money Market Funds | | | | | |
| Plus Other Assets Less Liabilities | | | | 0.1 | |
| | | | | |
| Top 10 Equity Holdings |
| | | | % of total net assets | |
| | | | | | | |
| | |
| 1. | | Royal Dutch Shell PLC-Class A-ADR | | | | 3.7 | % |
| 2. | | Chevron Corp. | | | | 3.3 | |
| 3. | | UBS Group AG | | | | 3.1 | |
| 4. | | Alphabet Inc.-Class C | | | | 2.8 | |
| 5. | | Asahi Group Holdings, Ltd. | | | | 2.7 | |
| 6. | | First Republic Bank | | | | 2.6 | |
| 7. | | Enel S.p.A. | | | | 2.5 | |
| 8. | | AIA Group Ltd. | | | | 2.3 | |
| 9. | | NIKE, Inc.-Class B | | | | 2.2 | |
| 10. | | Siemens AG | | | | 2.1 | |
| | | | | |
| Total Net Assets | | | $ | 86.8 million | |
| |
| Total Number of Holdings | | | | 67 | |
The Fund’s holdings are subject to change, and there is no assurance that the Fund will continue to hold any particular security.
Data presented here are as of December 31, 2017.
Invesco V.I. Global Core Equity Fund
Detracting from the Fund’s performance for the reporting period was Luxembourg-based steel company Arcelor-Mittal. During the year, the company delivered several positive earnings reports. However, its share price declined due to fluctuating steel prices and unimpressive free cash flow levels. Another stock that experienced a setback despite reporting solid earnings results was Shire. During the year, the company struggled amid generic pricing pressure in the US. Finally, shares of Allergan fell as a result of an unfavorable federal court decision on patent protections for Restasis, one of its top-selling drugs.
At the close of the reporting period, our largest overweight positions relative to the MSCI World Index were in the energy, financials and industrials sectors. The Fund also had a slight overweight position in the telecommunication services sector. The largest underweight positions were in the consumer staples, IT, real estate and utilities sectors.
As always, the Fund focuses on companies that provide an attractive return on invested capital, trade at attractive valuations and have high-quality management teams with a long-term perspective. In short, we seek to take advantage of the market’s volatile behavior and short-term focus. We believe our conservative approach should position the Fund to navigate the evolving economic backdrop.
We thank you for your continued investment in Invesco V.I. Global Core Equity Fund.
The views and opinions expressed in management’s discussion of Fund performance are those of Invesco Advisers, Inc. These views and opinions are subject to change at any time based on factors such as market and economic conditions. These views and opinions may not be relied upon as investment advice or recommendations, or as an offer for a particular security. The information is not a complete analysis of every aspect of any market, country, industry, security or the Fund. Statements of fact are from sources considered reliable, but Invesco Advisers, Inc. makes no representation or warranty as to their completeness or accuracy. Although historical performance is no guarantee of future results, these insights may help you understand our investment management philosophy.
See important Fund and, if applicable, index disclosures later in this report.
| | |
 | | Erik Esselink Portfolio Manager, is manager of Invesco V.I. Global Core Equity Fund. He joined Invesco in 2007. Mr. Esselink |
| earned a bachelor of science degree from the Rotterdam School of Economics, where he studied commercial economics. |
| | |
 | | Jeffrey Everett Chartered Financial Analyst, Portfolio Manager and Co-Chief Investment Officer of Invesco’s Global Core |
| Equity Team, is manager of Invesco V.I. Global Core Equity Fund. He joined Invesco in 2016. Mr. Everett earned a bachelor’s degree in finance from Pennsylvania State University. |
Assisted by Invesco’s Global Core Equity Team
Invesco V.I. Global Core Equity Fund
Your Fund’s Long-Term Performance
Results of a $10,000 Investment – Oldest Share Class(es)
Fund and index data from 12/31/07
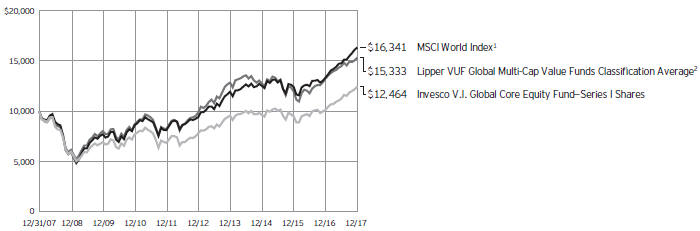
| 1 | Source: FactSet Research Systems Inc. |
Past performance cannot guarantee comparable future results.
| | | | | |
| Average Annual Total Returns | | |
As of 12/31/17 | | | | | |
| |
| Series I Shares | | | | | |
| Inception (1/2/97) | | | | 5.45 | % |
| 10 Years | | | | 2.23 | |
| 5 Years | | | | 9.80 | |
| 1 Year | | | | 22.90 | |
| |
| Series II Shares | | | | | |
| 10 Years | | | | 1.97 | % |
| 5 Years | | | | 9.55 | |
| 1 Year | | | | 22.60 | |
Effective June 1, 2010, Class I shares of the predecessor fund, Universal Funds Global Value Equity Portfolio, advised by Morgan Stanley Investment Management Inc. were reorganized into Series I shares of Invesco Van Kampen V.I. Global Value Equity Fund (renamed Invesco V.I. Global Core Equity Fund on April 30, 2012). Returns shown above, prior to June 1, 2010, for Series I shares are blended returns of the predecessor fund and Invesco V.I. Global Value Equity Fund Share class returns will differ from the predecessor fund because of different expenses.
Series II shares incepted on June 1, 2010. Series II share performance shown prior to that date is that of the predecessor fund’s Class I shares restated to reflect the higher 12b-1 fees applicable to Series II shares.
The performance data quoted represent past performance and cannot guarantee comparable future results; current performance may be lower or higher. Please contact your variable product issuer or financial adviser for the most recent month-end variable product performance. Performance figures reflect Fund expenses, reinvested distributions and changes in net asset value. Investment return and principal value will fluctuate so that you may have a gain or loss when you sell shares.
The total annual Fund operating expense ratio set forth in the most recent Fund prospectus as of the date of this report for Series I and Series II shares was 1.05% and 1.30%, respectively. The expense ratios presented above may vary from the expense ratios presented in other sections of this report that are based on expenses incurred during the period covered by this report.
Invesco V.I. Global Core Equity Fund, a series portfolio of AIM Variable Insurance Funds (Invesco Variable Insurance Funds), is currently offered through insurance companies issuing variable products. You cannot purchase shares of the Fund directly. Performance figures given represent
the Fund and are not intended to reflect actual variable product values. They do not reflect sales charges, expenses and fees assessed in connection with a variable product. Sales charges, expenses and fees, which are determined by the variable product issuers, will vary and will lower the total return.
The most recent month-end performance at the Fund level, excluding variable product charges, is available at 800 451 4246. As mentioned above, for the most recent month-end performance including variable product charges, please contact your variable product issuer or financial adviser.
Fund performance reflects any applicable fee waivers and/or expense reimbursements. Had the adviser not waived fees and/or reimbursed expenses currently or in the past, returns would have been lower. See current prospectus for more information.
Invesco V.I. Global Core Equity Fund
Invesco V.I. Global Core Equity Fund’s investment objective is long-term capital appreciation by investing primarily in equity securities of issuers throughout the world, including US issuers.
| ∎ | | Unless otherwise stated, information presented in this report is as of December 31, 2017, and is based on total net assets. |
| ∎ | | Unless otherwise noted, all data provided by Invesco. |
Principal risks of investing in the Fund
Depositary receipts risk. Investing in depositary receipts involves the same risks as direct investments in foreign securities. In addition, the underlying issuers of certain depositary receipts are under no obligation to distribute shareholder communications or pass through any voting rights with respect to the deposited securities to the holders of such receipts. The Fund may therefore receive less timely information or have less control than if it invested directly in the foreign issuer.
Derivatives risk. The value of a derivative instrument depends largely on (and is derived from) the value of an underlying security, currency, commodity, interest rate, index or other asset (each referred to as an underlying asset). In addition to risks relating to the underlying assets, the use of derivatives may include other, possibly greater, risks, including counterparty, leverage and liquidity risks. Counterparty risk is the risk that the counterparty to the derivative contract will default on its obligation to pay the Fund the amount owed or otherwise perform under the derivative contract. Derivatives create leverage risk because they do not require payment up front equal to the economic exposure created by owning the derivative. As a result, an adverse change in the value of the underlying asset could result in the Fund sustaining a loss that is substantially greater than the amount invested in the derivative, which may make the Fund’s returns more volatile and increase the risk of loss. Derivative instruments may also be less liquid than more traditional investments and the Fund may be unable to sell or close out its derivative positions at a desirable time or price. This risk may be more acute under adverse market conditions, during which the Fund may be most in need of liquidating its derivative positions. Derivatives may also be harder to value, less tax efficient and subject to changing government regulation that could impact the Fund’s ability to use certain derivatives or their cost. Also, derivatives used for hedging or to gain or limit exposure to a particular market segment may not provide the
expected benefits, particularly during adverse market conditions.
Emerging markets securities risk.
Emerging markets (also referred to as developing markets) are generally subject to greater market volatility, political, social and economic instability, uncertain trading markets and more governmental limitations on foreign investment than more developed markets. In addition, companies operating in emerging markets may be subject to lower trading volume and greater price fluctuations than companies in more developed markets. Securities law and the enforcement of systems of taxation in many emerging market countries may change quickly and unpredictably. In addition, investments in emerging markets securities may also be subject to additional transaction costs, delays in settlement procedures, and lack of timely information.
Foreign securities risk. The Fund’s foreign investments may be adversely affected by political and social instability, changes in economic or taxation policies, difficulty in enforcing obligations, decreased liquidity or increased volatility. Foreign investments also involve the risk of the possible seizure, nationalization or expropriation of the issuer or foreign deposits (in which the Fund could lose its entire investments in a certain market) and the possible adoption of foreign governmental restrictions such as exchange controls. Unless the Fund has hedged its foreign securities risk, foreign securities risk also involves the risk of negative foreign currency rate fluctuations, which may cause the value of securities denominated in such foreign currency (or other instruments through which the Fund has exposure to foreign currencies) to decline in value. Currency exchange rates may fluctuate significantly over short periods of time. Currency hedging strategies, if used, are not always successful.
Geographic focus risk. The Fund may from time to time invest a substantial amount of its assets in securities of issuers located in a single country or a limited number of countries. Adverse economic, political or social conditions in those countries may therefore have a significant negative impact on the Fund’s investment performance.
Investing in the European Union risk. Investments in certain countries in the European Union are susceptible to high economic
risks associated with high levels of debt, such as investments in sovereign debt of Greece, Italy and Spain. Efforts of the member states to further unify their economic and monetary policies may increase the potential for the downward movement of one member state’s market to cause a similar effect on other member states’ markets. Separately, the European Union faces issues involving its membership, structure, procedures and policies. The exit of one or more member states from the European Union, such as the United Kingdom (UK) which has announced its intention to exit, would place its currency and banking system in jeopardy. The exit by the UK or other member states will likely result in increased volatility, illiquidity and potentially lower economic growth in the affected markets, which will adversely affect the Fund’s investments.
Management risk. The Fund is actively managed and depends heavily on the Adviser’s judgment about markets, interest rates or the attractiveness, relative values, liquidity, or potential appreciation of particular investments made for the Fund’s portfolio. The Fund could experience losses if these judgments prove to be incorrect. Additionally, legislative, regulatory, or tax developments may adversely affect management of the Fund and, therefore, the ability of the Fund to achieve its investment objective.
Market risk. The market values of the Fund’s investments, and therefore the value of the Fund’s shares, will go up and down, sometimes rapidly or unpredictably. Market risk may affect a single issuer, industry or section of the economy, or it may affect the market as a whole. Individual stock prices tend to go up and down more dramatically than those of certain other types of investments, such as bonds. During a general downturn in the financial markets, multiple asset classes may decline in value. When markets perform well, there can be no assurance that specific investments held by the Fund will rise in value.
Preferred securities risk. Preferred securities are subject to issuer-specific and market risks applicable generally to equity securities. Preferred securities also may be subordinated to bonds or other debt instruments, subjecting them to a
Invesco V.I. Global Core Equity Fund
greater risk of non-payment, may be less liquid than many other securities, such as common stocks, and generally offer no voting rights with respect to the issuer.
Small- and mid-capitalization companies risks. Small- and mid-capitalization companies tend to be more vulnerable to changing market conditions, may have little or no operating history or track record of success, and may have more limited product lines and markets, less experienced management and fewer financial resources than larger companies. These companies’ securities may be more volatile and less liquid than those of more established companies, and their returns may vary, sometimes significantly, from the overall securities market.
About indexes used in this report
The MSCI World IndexSM is an unmanaged index considered representative of stocks of developed countries. The index is computed using the net return, which withholds applicable taxes for non-resident investors.
The Lipper VUF Global Multi-Cap Value Funds Classification Average represents an average of all variable insurance underlying funds in the Lipper Global Multi Cap Value Funds classification.
The Fund is not managed to track the performance of any particular index, including the index(es) described here, and consequently, the performance of the Fund may deviate significantly from the performance of the index(es).
A direct investment cannot be made in an index. Unless otherwise indicated, index results include reinvested dividends, and they do not reflect sales charges. Performance of the peer group, if applicable, reflects fund expenses; performance of a market index does not.
Other information
The returns shown in management’s discussion of Fund performance are based on net asset values calculated for shareholder transactions. Generally accepted accounting principles require adjustments to be made to the net assets of the Fund at period end for financial reporting purposes, and as such, the net asset values for shareholder transactions and the returns based on those net asset values may differ from the net asset values and returns reported in the Financial Highlights. Additionally, the returns and net asset values shown throughout this report are at the Fund level only and do not include variable product issuer charges. If such charges were included, the total returns would be lower.
Industry classifications used in this report are generally according to the Global Industry Classification Standard, which was developed by and is the exclusive property and a service mark of MSCI Inc. and Standard & Poor’s.
Invesco V.I. Global Core Equity Fund
Schedule of Investments
December 31, 2017
| | | | | | | | |
| | | Shares | | | Value | |
Common Stocks & Other Equity Interests–99.90% | |
| Australia–2.09% | |
Brambles Ltd. | | | 112,527 | | | $ | 882,079 | |
Qantas Airways Ltd. | | | 238,120 | | | | 934,712 | |
| | | | | | | | 1,816,791 | |
|
| Brazil–1.53% | |
Banco do Brasil S.A. | | | 53,400 | | | | 510,967 | |
Petróleo Brasileiro S.A.–ADR(a) | | | 79,001 | | | | 812,920 | |
| | | | | | | | 1,323,887 | |
|
| China–0.92% | |
Baidu, Inc.–ADR(a) | | | 3,403 | | | | 797,017 | |
|
| France–0.98% | |
LVMH Moet Hennessy Louis Vuitton S.E. | | | 2,888 | | | | 848,315 | |
|
| Germany–2.12% | |
Siemens AG | | | 13,247 | | | | 1,837,933 | |
|
| Hong Kong–2.25% | |
AIA Group Ltd. | | | 229,200 | | | | 1,955,251 | |
|
| Ireland–1.44% | |
James Hardie Industries PLC | | | 71,063 | | | | 1,250,893 | |
|
| Italy–4.79% | |
Banca Mediolanum S.p.A. | | | 111,740 | | | | 965,822 | |
Enel S.p.A. | | | 346,563 | | | | 2,130,098 | |
Prysmian S.p.A. | | | 32,531 | | | | 1,061,244 | |
| | | | | | | | 4,157,164 | |
|
| Japan–12.85% | |
Asahi Group Holdings, Ltd. | | | 47,200 | | | | 2,341,777 | |
Daito Trust Construction Co., Ltd. | | | 6,400 | | | | 1,305,050 | |
Hitachi, Ltd. | | | 190,000 | | | | 1,478,093 | |
KDDI Corp. | | | 59,800 | | | | 1,488,498 | |
Komatsu Ltd. | | | 46,200 | | | | 1,672,172 | |
ORIX Corp. | | | 47,900 | | | | 809,670 | |
Seven & i Holdings Co., Ltd. | | | 22,700 | | | | 943,500 | |
Shimano Inc. | | | 7,900 | | | | 1,111,343 | |
| | | | | | | | 11,150,103 | |
|
| Luxembourg–1.58% | |
ArcelorMittal(a) | | | 42,246 | | | | 1,368,089 | |
|
| Netherlands–3.16% | |
ING Groep N.V. | | | 93,942 | | | | 1,728,537 | |
Randstad Holding N.V. | | | 16,591 | | | | 1,017,915 | |
| | | | | | | | 2,746,452 | |
|
| Norway–1.18% | |
Orkla ASA | | | 96,361 | | | | 1,021,808 | |
|
| Singapore–0.98% | |
DBS Group Holdings Ltd. | | | 46,000 | | | | 851,694 | |
| | | | | | | | |
| | | Shares | | | Value | |
| South Africa–0.71% | |
Naspers Ltd.–Class N | | | 2,218 | | | $ | 618,651 | |
|
| Sweden–1.47% | |
Svenska Handelsbanken AB–Class A | | | 93,468 | | | | 1,276,043 | |
|
| Switzerland–5.24% | |
ABB Ltd. | | | 32,306 | | | | 864,073 | |
Glencore PLC | | | 181,081 | | | | 953,462 | |
UBS Group AG | | | 148,375 | | | | 2,726,693 | |
| | | | | | | | 4,544,228 | |
|
| Taiwan–1.28% | |
Taiwan Semiconductor Manufacturing Co. Ltd. | | | 144,000 | | | | 1,107,454 | |
|
| United Kingdom–11.77% | |
Imperial Brands PLC | | | 20,843 | | | | 890,917 | |
Just Eat PLC(a) | | | 98,630 | | | | 1,034,625 | |
Liberty Global PLC–Series A(a) | | | 36,670 | | | | 1,314,253 | |
Rio Tinto PLC | | | 24,469 | | | | 1,291,355 | |
Royal Dutch Shell PLC–Class A–ADR | | | 47,771 | | | | 3,186,803 | |
St. James’s Place PLC | | | 94,112 | | | | 1,555,579 | |
Vodafone Group PLC–ADR | | | 29,324 | | | | 935,436 | |
| | | | | | | | 10,208,968 | |
|
| United States–43.56% | |
Allergan PLC | | | 6,251 | | | | 1,022,538 | |
Alphabet Inc.–Class C(a) | | | 2,305 | | | | 2,411,952 | |
American Express Co. | | | 18,468 | | | | 1,834,057 | |
Aptiv PLC | | | 13,214 | | | | 1,120,944 | |
Biogen Inc.(a) | | | 3,783 | | | | 1,205,150 | |
BioMarin Pharmaceutical Inc.(a) | | | 7,875 | | | | 702,214 | |
Celgene Corp.(a) | | | 15,486 | | | | 1,616,119 | |
Chevron Corp. | | | 22,530 | | | | 2,820,531 | |
Cognizant Technology Solutions Corp.–Class A | | | 15,976 | | | | 1,134,615 | |
Colfax Corp.(a) | | | 24,912 | | | | 987,013 | |
Comcast Corp.–Class A | | | 32,404 | | | | 1,297,780 | |
Concho Resources Inc.(a) | | | 8,631 | | | | 1,296,549 | |
Delphi Technologies PLC(a) | | | 4,404 | | | | 231,078 | |
Delta Air Lines, Inc. | | | 31,664 | | | | 1,773,184 | |
eBay Inc.(a) | | | 36,273 | | | | 1,368,943 | |
EPAM Systems, Inc.(a) | | | 9,953 | | | | 1,069,251 | |
Facebook, Inc.–Class A(a) | | | 7,180 | | | | 1,266,983 | |
First Republic Bank | | | 25,963 | | | | 2,249,434 | |
HCA Healthcare, Inc.(a) | | | 14,476 | | | | 1,271,572 | |
Marsh & McLennan Cos., Inc. | | | 13,002 | | | | 1,058,233 | |
Moody’s Corp. | | | 2,816 | | | | 415,670 | |
NIKE, Inc.–Class B | | | 29,989 | | | | 1,875,812 | |
Oracle Corp. | | | 25,660 | | | | 1,213,205 | |
Priceline Group Inc. (The)(a) | | | 893 | | | | 1,551,802 | |
Progressive Corp. (The) | | | 12,055 | | | | 678,938 | |
Sherwin-Williams Co. (The) | | | 2,739 | | | | 1,123,099 | |
See accompanying Notes to Financial Statements which are an integral part of the financial statements.
Invesco V.I. Global Core Equity Fund
| | | | | | | | |
| | | Shares | | | Value | |
| United States–(continued) | |
Shire PLC–ADR | | | 5,108 | | | $ | 792,353 | |
United Technologies Corp. | | | 13,662 | | | | 1,742,861 | |
Zimmer Biomet Holdings, Inc. | | | 5,446 | | | | 657,169 | |
| | | | | | | | 37,789,049 | |
TOTAL INVESTMENTS IN SECURITIES–99.90%
(Cost $70,612,773) | | | | 86,669,790 | |
OTHER ASSETS LESS LIABILITIES–0.10% | | | | | | | 89,440 | |
NET ASSETS–100.00% | | | | | | $ | 86,759,230 | |
Investment Abbreviations:
| | |
| ADR | | – American Depositary Receipt |
Notes to Schedule of Investments:
| (a) | Non-income producing security. |
| | | | | | | | | | | | | | | | | | | | | | |
| Open Forward Foreign Currency Contracts | |
| | | | | Contract to | | | Unrealized
Appreciation
(Depreciation) | |
Settlement Date | | Counterparty | | Deliver | | | Receive | | |
02/13/2018 | | Barclays Bank PLC | | | USD | | | | 2,017,725 | | | | GBP | | | | 1,500,000 | | | $ | 10,499 | |
02/13/2018 | | Goldman Sachs International | | | JPY | | | | 202,000,000 | | | | USD | | | | 1,847,271 | | | | 50,498 | |
02/13/2018 | | JPMorgan Chase Bank, N.A. | | | JPY | | | | 202,000,000 | | | | USD | | | | 1,846,970 | | | | 50,197 | |
Subtotal | | | | | | | | | | | | | | | | | | | 111,194 | |
02/13/2018 | | Barclays Bank PLC | | | GBP | | | | 1,500,000 | | | | USD | | | | 1,972,184 | | | | (56,040 | ) |
Total Forward Foreign Currency Contracts — Currency Risk | | | | | | | | | | | | | | | | | | $ | 55,154 | |
Abbreviations:
| | |
| GBP | | – British Pound Sterling |
| JPY | | – Japanese Yen |
| USD | | – U.S. Dollar |
See accompanying Notes to Financial Statements which are an integral part of the financial statements.
Invesco V.I. Global Core Equity Fund
Statement of Assets and Liabilities
December 31, 2017
Statement of Operations
For the year ended December 31, 2017
| | | | |
Assets: | | | | |
Investments in securities, at value (Cost $70,612,773) | | $ | 86,669,790 | |
Other investments: | | | | |
Unrealized appreciation on forward foreign currency contracts outstanding | | | 111,194 | �� |
Foreign currencies, at value (Cost $164,553) | | | 167,035 | |
Receivable for: | | | | |
Investments sold | | | 206,827 | |
Fund shares sold | | | 9,362 | |
Dividends | | | 96,334 | |
Investment for trustee deferred compensation and retirement plans | | | 40,455 | |
Total assets | | | 87,300,997 | |
| |
Liabilities: | | | | |
Other investments: | | | | |
Unrealized depreciation on forward foreign currency contracts outstanding | | | 56,040 | |
Payable for: | | | | |
Investments purchased | | | 32,076 | |
Fund shares reacquired | | | 25,307 | |
Amount due custodian | | | 303,102 | |
Accrued fees to affiliates | | | 41,312 | |
Accrued trustees’ and officers’ fees and benefits | | | 631 | |
Accrued other operating expenses | | | 40,391 | |
Trustee deferred compensation and retirement plans | | | 42,908 | |
Total liabilities | | | 541,767 | |
Net assets applicable to shares outstanding | | $ | 86,759,230 | |
| |
Net assets consist of: | | | | |
Shares of beneficial interest | | $ | 70,054,194 | |
Undistributed net investment income | | | 691,138 | |
Undistributed net realized gain (loss) | | | (101,600 | ) |
Net unrealized appreciation | | | 16,115,498 | |
| | | $ | 86,759,230 | |
| |
Net Assets: | | | | |
Series I | | $ | 73,715,942 | |
Series II | | $ | 13,043,288 | |
|
Shares outstanding, no par value,
with an unlimited number of shares authorized: | |
Series I | | | 6,871,244 | |
Series II | | | 1,215,855 | |
Series I: | | | | |
Net asset value per share | | $ | 10.73 | |
Series II: | | | | |
Net asset value per share | | $ | 10.73 | |
| | | | |
Investment income: | | | | |
Dividends (net of foreign withholding taxes of $138,747) | | $ | 1,591,998 | |
Dividends from affiliated money market funds (includes securities lending income of $8,550) | | | 11,544 | |
Total investment income | | | 1,603,542 | |
| |
Expenses: | | | | |
Advisory fees | | | 540,127 | |
Administrative services fees | | | 170,856 | |
Custodian fees | | | 28,879 | |
Distribution fees — Series II | | | 31,686 | |
Transfer agent fees | | | 11,610 | |
Trustees’ and officers’ fees and benefits | | | 21,800 | |
Reports to shareholders | | | 13,588 | |
Professional services fees | | | 48,498 | |
Other | | | 4,656 | |
Total expenses | | | 871,700 | |
Less: Fees waived | | | (469 | ) |
Net expenses | | | 871,231 | |
Net investment income | | | 732,311 | |
| |
Realized and unrealized gain (loss) from: | | | | |
Net realized gain (loss) from: | | | | |
Investment securities | | | 4,628,757 | |
Foreign currencies | | | 17,676 | |
Forward foreign currency contracts | | | (45,882 | ) |
| | | | 4,600,551 | |
Change in net unrealized appreciation (depreciation) of: | | | | |
Investment securities | | | 11,387,536 | |
Foreign currencies | | | 11,066 | |
Forward foreign currency contracts | | | (166,155 | ) |
| | | | 11,232,447 | |
Net realized and unrealized gain | | | 15,832,998 | |
Net increase in net assets resulting from operations | | $ | 16,565,309 | |
See accompanying Notes to Financial Statements which are an integral part of the financial statements.
Invesco V.I. Global Core Equity Fund
Statement of Changes in Net Assets
For the years ended December 31, 2017 and 2016
| | | | | | | | |
| | | 2017 | | | 2016 | |
Operations: | | | | | | | | |
Net investment income | | $ | 732,311 | | | $ | 814,541 | |
Net realized gain (loss) | | | 4,600,551 | | | | (1,489,662 | ) |
Change in net unrealized appreciation | | | 11,232,447 | | | | 5,373,049 | |
Net increase in net assets resulting from operations | | | 16,565,309 | | | | 4,697,928 | |
| | |
Distributions to shareholders from net investment income: | | | | | | | | |
Series I | | | (788,459 | ) | | | (635,642 | ) |
Series ll | | | (112,894 | ) | | | (91,204 | ) |
Total distributions from net investment income | | | (901,353 | ) | | | (726,846 | ) |
| | |
Share transactions–net: | | | | | | | | |
Series l | | | (1,609,008 | ) | | | (6,324,862 | ) |
Series ll | | | (1,728,127 | ) | | | (1,667,057 | ) |
Net increase (decrease) in net assets resulting from share transactions | | | (3,337,135 | ) | | | (7,991,919 | ) |
Net increase (decrease) in net assets | | | 12,326,821 | | | | (4,020,837 | ) |
| | |
Net assets: | | | | | | | | |
Beginning of year | | | 74,432,409 | | | | 78,453,246 | |
End of year (includes undistributed net investment income of $691,138 and $833,613, respectively) | | $ | 86,759,230 | | | $ | 74,432,409 | |
Notes to Financial Statements
December 31, 2017
NOTE 1—Significant Accounting Policies
Invesco V.I. Global Core Equity Fund (the “Fund”) is a series portfolio of AIM Variable Insurance Funds (Invesco Variable Insurance Funds) (the “Trust”). The Trust is a Delaware statutory trust registered under the Investment Company Act of 1940, as amended (the “1940 Act”), as an open-end series management investment company consisting of twenty-four separate portfolios, (each constituting a “Fund”). The assets, liabilities and operations of each portfolio are accounted for separately. Information presented in these financial statements pertains only to the Fund. Matters affecting each Fund or class will be voted on exclusively by the shareholders of such Fund or class. Current Securities and Exchange Commission (“SEC”) guidance, however, requires participating insurance companies offering separate accounts to vote shares proportionally in accordance with the instructions of the contract owners whose investments are funded by shares of each Fund or class.
The Fund’s investment objective is long-term capital appreciation by investing primarily in equity securities of issuers throughout the world, including U.S. issuers.
The Fund currently offers two classes of shares, Series I and Series II, both of which are offered to insurance company separate accounts funding variable annuity contracts and variable life insurance policies (“variable products”).
The Fund is an investment company and accordingly follows the investment company accounting and reporting guidance in accordance with Financial Accounting Standards Board Accounting Standards Codification Topic 946, Financial Services — Investment Companies.
The following is a summary of the significant accounting policies followed by the Fund in the preparation of its financial statements.
| A. | Security Valuations — Securities, including restricted securities, are valued according to the following policy. |
A security listed or traded on an exchange (except convertible securities) is valued at its last sales price or official closing price as of the close of the customary trading session on the exchange where the security is principally traded, or lacking any sales or official closing price on a particular day, the security may be valued at the closing bid price on that day. Securities traded in the over-the-counter market are valued based on prices furnished by independent pricing services or market makers. When such securities are valued by an independent pricing service they may be considered fair valued. Futures contracts are valued at the final settlement price set by an exchange on which they are principally traded. Listed options are valued at the mean between the last bid and asked prices from the exchange on which they are principally traded. Options not listed on an exchange are valued by an independent source at the mean between the last bid and asked prices. For purposes of determining net asset value (“NAV”) per share, futures and option contracts generally are valued 15 minutes after the close of the customary trading session of the New York Stock Exchange (“NYSE”).
Investments in open-end and closed-end registered investment companies that do not trade on an exchange are valued at the end-of-day net asset value per share. Investments in open-end and closed-end registered investment companies that trade on an exchange are valued at the last sales price or official closing price as of the close of the customary trading session on the exchange where the security is principally traded.
Debt obligations (including convertible securities) and unlisted equities are fair valued using an evaluated quote provided by an independent pricing service. Evaluated quotes provided by the pricing service may be determined without exclusive reliance on quoted prices, and may reflect appropriate factors such as institution-size trading in similar groups of securities, developments related to specific securities, dividend rate (for unlisted equities), yield (for debt obligations), quality, type of issue, coupon rate (for debt obligations), maturity (for debt obligations), individual
Invesco V.I. Global Core Equity Fund
trading characteristics and other market data. Pricing services generally value debt obligations assuming orderly transactions of institutional round lot size, but a fund may hold or transact in the same securities in smaller, odd lot sizes. Odd lots often trade at lower prices than institutional round lots. Debt obligations are subject to interest rate and credit risks. In addition, all debt obligations involve some risk of default with respect to interest and/or principal payments.
Foreign securities’ (including foreign exchange contracts) prices are converted into U.S. dollar amounts using the applicable exchange rates as of the close of the NYSE. If market quotations are available and reliable for foreign exchange-traded equity securities, the securities will be valued at the market quotations. Because trading hours for certain foreign securities end before the close of the NYSE, closing market quotations may become unreliable. If between the time trading ends on a particular security and the close of the customary trading session on the NYSE, events occur that the investment adviser determines are significant and make the closing price unreliable, the Fund may fair value the security. If the event is likely to have affected the closing price of the security, the security will be valued at fair value in good faith using procedures approved by the Board of Trustees. Adjustments to closing prices to reflect fair value may also be based on a screening process of an independent pricing service to indicate the degree of certainty, based on historical data, that the closing price in the principal market where a foreign security trades is not the current value as of the close of the NYSE. Foreign securities’ prices meeting the approved degree of certainty that the price is not reflective of current value will be priced at the indication of fair value from the independent pricing service. Multiple factors may be considered by the independent pricing service in determining adjustments to reflect fair value and may include information relating to sector indices, American Depositary Receipts and domestic and foreign index futures. Foreign securities may have additional risks including exchange rate changes, potential for sharply devalued currencies and high inflation, political and economic upheaval, the relative lack of issuer information, relatively low market liquidity and the potential lack of strict financial and accounting controls and standards.
Securities for which market prices are not provided by any of the above methods may be valued based upon quotes furnished by independent sources. The last bid price may be used to value equity securities. The mean between the last bid and asked prices is used to value debt obligations, including corporate loans.
Securities for which market quotations are not readily available or became unreliable are valued at fair value as determined in good faith by or under the supervision of the Trust’s officers following procedures approved by the Board of Trustees. Issuer specific events, market trends, bid/asked quotes of brokers and information providers and other market data may be reviewed in the course of making a good faith determination of a security’s fair value.
The Fund may invest in securities that are subject to interest rate risk, meaning the risk that the prices will generally fall as interest rates rise and, conversely, the prices will generally rise as interest rates fall. Specific securities differ in their sensitivity to changes in interest rates depending on their individual characteristics. Changes in interest rates may result in increased market volatility, which may affect the value and/or liquidity of certain Fund investments.
Valuations change in response to many factors including the historical and prospective earnings of the issuer, the value of the issuer’s assets, general economic conditions, interest rates, investor perceptions and market liquidity. Because of the inherent uncertainties of valuation, the values reflected in the financial statements may materially differ from the value received upon actual sale of those investments.
| B. | Securities Transactions and Investment Income — Securities transactions are accounted for on a trade date basis. Realized gains or losses on sales are computed on the basis of specific identification of the securities sold. Interest income (net of withholding tax, if any) is recorded on the accrual basis from settlement date. Dividend income (net of withholding tax, if any) is recorded on the ex-dividend date. |
The Fund may periodically participate in litigation related to Fund investments. As such, the Fund may receive proceeds from litigation settlements. Any proceeds received are included in the Statement of Operations as realized gain (loss) for investments no longer held and as unrealized gain (loss) for investments still held.
Brokerage commissions and mark ups are considered transaction costs and are recorded as an increase to the cost basis of securities purchased and/or a reduction of proceeds on a sale of securities. Such transaction costs are included in the determination of net realized and unrealized gain (loss) from investment securities reported in the Statement of Operations and the Statement of Changes in Net Assets and the net realized and unrealized gains (losses) on securities per share in the Financial Highlights. Transaction costs are included in the calculation of the Fund’s net asset value and, accordingly, they reduce the Fund’s total returns. These transaction costs are not considered operating expenses and are not reflected in net investment income reported in the Statement of Operations and the Statement of Changes in Net Assets, or the net investment income per share and the ratios of expenses and net investment income reported in the Financial Highlights, nor are they limited by any expense limitation arrangements between the Fund and the investment adviser.
The Fund allocates income and realized and unrealized capital gains and losses to a class based on the relative net assets of each class.
| C. | Country Determination — For the purposes of making investment selection decisions and presentation in the Schedule of Investments, the investment adviser may determine the country in which an issuer is located and/or credit risk exposure based on various factors. These factors include the laws of the country under which the issuer is organized, where the issuer maintains a principal office, the country in which the issuer derives 50% or more of its total revenues and the country that has the primary market for the issuer’s securities, as well as other criteria. Among the other criteria that may be evaluated for making this determination are the country in which the issuer maintains 50% or more of its assets, the type of security, financial guarantees and enhancements, the nature of the collateral and the sponsor organization. Country of issuer and/or credit risk exposure has been determined to be the United States of America, unless otherwise noted. |
| D. | Distributions — Distributions from net investment income and net realized capital gain, if any, are generally declared and paid to separate accounts of participating insurance companies annually and recorded on the ex-dividend date. |
| E. | Federal Income Taxes — The Fund intends to comply with the requirements of Subchapter M of the Internal Revenue Code of 1986, as amended (the “Internal Revenue Code���), necessary to qualify as a regulated investment company and to distribute substantially all of the Fund’s taxable earnings to shareholders. As such, the Fund will not be subject to federal income taxes on otherwise taxable income (including net realized capital gain) that is distributed to shareholders. Therefore, no provision for federal income taxes is recorded in the financial statements. |
The Fund recognizes the tax benefits of uncertain tax positions only when the position is more likely than not to be sustained. Management has analyzed the Fund’s uncertain tax positions and concluded that no liability for unrecognized tax benefits should be recorded related to uncertain tax positions. Management is not aware of any tax positions for which it is reasonably possible that the total amounts of unrecognized tax benefits will change materially in the next 12 months.
Invesco V.I. Global Core Equity Fund
The Fund files tax returns in the U.S. Federal jurisdiction and certain other jurisdictions. Generally, the Fund is subject to examinations by such taxing authorities for up to three years after the filing of the return for the tax period.
| F. | Expenses — Fees provided for under the Rule 12b-1 plan of a particular class of the Fund and which are directly attributable to that class are charged to the operations of such class. All other expenses are allocated among the classes based on relative net assets. |
| G. | Accounting Estimates — The preparation of financial statements in conformity with accounting principles generally accepted in the United States of America (“GAAP”) requires management to make estimates and assumptions that affect the reported amounts of assets and liabilities at the date of the financial statements and the reported amounts of revenues and expenses during the reporting period including estimates and assumptions related to taxation. Actual results could differ from those estimates by a significant amount. In addition, the Fund monitors for material events or transactions that may occur or become known after the period-end date and before the date the financial statements are released to print. |
| H. | Indemnifications — Under the Trust’s organizational documents, each Trustee, officer, employee or other agent of the Trust is indemnified against certain liabilities that may arise out of the performance of their duties to the Fund. Additionally, in the normal course of business, the Fund enters into contracts, including the Fund’s servicing agreements, that contain a variety of indemnification clauses. The Fund’s maximum exposure under these arrangements is unknown as this would involve future claims that may be made against the Fund that have not yet occurred. The risk of material loss as a result of such indemnification claims is considered remote. |
| I. | Securities Lending — The Fund may lend portfolio securities having a market value up to one-third of the Fund’s total assets. Such loans are secured by collateral equal to no less than the market value of the loaned securities determined daily by the securities lending provider. Such collateral will be cash or debt securities issued or guaranteed by the U.S. Government or any of its sponsored agencies. Cash collateral received in connection with these loans is invested in short-term money market instruments or affiliated money market funds and is shown as such on the Schedule of Investments. The Fund bears the risk of loss with respect to the investment of collateral. It is the Fund’s policy to obtain additional collateral from or return excess collateral to the borrower by the end of the next business day, following the valuation date of the securities loaned. Therefore, the value of the collateral held may be temporarily less than the value of the securities on loan. When loaning securities, the Fund retains certain benefits of owning the securities, including the economic equivalent of dividends or interest generated by the security. Lending securities entails a risk of loss to the Fund if, and to the extent that, the market value of the securities loaned were to increase and the borrower did not increase the collateral accordingly, and the borrower failed to return the securities. The securities loaned are subject to termination at the option of the borrower or the Fund. Upon termination, the borrower will return to the Fund the securities loaned and the Fund will return the collateral. Upon the failure of the borrower to return the securities, collateral may be liquidated and the securities may be purchased on the open market to replace the loaned securities. The Fund could experience delays and costs in gaining access to the collateral and the securities may lose value during the delay which could result in potential losses to the Fund. Some of these losses may be indemnified by the lending agent. The Fund bears the risk of any deficiency in the amount of the collateral available for return to the borrower due to any loss on the collateral invested. Dividends received on cash collateral investments for securities lending transactions, which are net of compensation to counterparties, are included in Dividends from affiliated money market funds on the Statement of Operations. The aggregate value of securities out on loan, if any, is shown as a footnote on the Statement of Assets and Liabilities. |
| J. | Foreign Currency Translations — Foreign currency is valued at the close of the NYSE based on quotations posted by banks and major currency dealers. Portfolio securities and other assets and liabilities denominated in foreign currencies are translated into U.S. dollar amounts at date of valuation. Purchases and sales of portfolio securities (net of foreign taxes withheld on disposition) and income items denominated in foreign currencies are translated into U.S. dollar amounts on the respective dates of such transactions. The Fund does not separately account for the portion of the results of operations resulting from changes in foreign exchange rates on investments and the fluctuations arising from changes in market prices of securities held. The combined results of changes in foreign exchange rates and the fluctuation of market prices on investments (net of estimated foreign tax withholding) are included with the net realized and unrealized gain or loss from investments in the Statement of Operations. Reported net realized foreign currency gains or losses arise from (1) sales of foreign currencies, (2) currency gains or losses realized between the trade and settlement dates on securities transactions, and (3) the difference between the amounts of dividends, interest, and foreign withholding taxes recorded on the Fund’s books and the U.S. dollar equivalent of the amounts actually received or paid. Net unrealized foreign currency gains and losses arise from changes in the fair values of assets and liabilities, other than investments in securities at fiscal period end, resulting from changes in exchange rates. |
The Fund may invest in foreign securities, which may be subject to foreign taxes on income, gains on investments or currency repatriation, a portion of which may be recoverable. Foreign taxes, if any, are recorded based on the tax regulations and rates that exist in the foreign markets in which the Fund invests and are shown in the Statement of Operations.
| K. | Forward Foreign Currency Contracts — The Fund may engage in foreign currency transactions either on a spot (i.e. for prompt delivery and settlement) basis, or through forward foreign currency contracts, to manage or minimize currency or exchange rate risk. |
The Fund may also enter into forward foreign currency contracts for the purchase or sale of a security denominated in a foreign currency in order to “lock in” the U.S. dollar price of that security, or the Fund may also enter into forward foreign currency contracts that do not provide for physical settlement of the two currencies, but instead are settled by a single cash payment calculated as the difference between the agreed upon exchange rate and the spot rate at settlement based upon an agreed upon notional amount (non-deliverable forwards). The Fund will set aside liquid assets in an amount equal to the daily mark-to-market obligation for forward foreign currency contracts.
A forward foreign currency contract is an obligation between two parties (“Counterparties”) to purchase or sell a specific currency for an agreed-upon price at a future date. The use of forward foreign currency contracts does not eliminate fluctuations in the price of the underlying securities the Fund owns or intends to acquire but establishes a rate of exchange in advance. Fluctuations in the value of these contracts are measured by the difference in the contract date and reporting date exchange rates and are recorded as unrealized appreciation (depreciation) until the contracts are closed. When the contracts are closed, realized gains (losses) are recorded. Realized and unrealized gains (losses) on the contracts are included in the Statement of Operations. The primary risks associated with forward foreign currency contracts include failure of the Counterparty to meet the terms of the contract and the value of the foreign currency changing unfavorably. These risks may be in excess of the amounts reflected in the Statement of Assets and Liabilities.
Invesco V.I. Global Core Equity Fund
NOTE 2—Advisory Fees and Other Fees Paid to Affiliates
The Trust has entered into a master investment advisory agreement with Invesco Advisers, Inc. (the “Adviser” or “Invesco”). Under the terms of the investment advisory agreement, the Fund accrues daily and pays monthly an advisory fee to the Adviser based on the annual rate of the Fund’s average daily net assets as follows:
| | | | | | | | |
| Average Daily Net Assets | | Rate | |
First $1 billion | | | 0 | .67% | | | | |
Next $500 million | | | 0 | .645% | | | | |
Next $1 billion | | | 0 | .62% | | | | |
Next $1 billion | | | 0 | .595% | | | | |
Next $1 billion | | | 0 | .57% | | | | |
Over $4.5 billion | | | 0 | .545% | | | | |
For the year ended December 31, 2017, the effective advisory fees incurred by the Fund was 0.67%.
Under the terms of a master sub-advisory agreement between the Adviser and each of Invesco Asset Management Deutschland GmbH, Invesco Asset Management Limited, Invesco Asset Management (Japan) Limited, Invesco Hong Kong Limited, Invesco Senior Secured Management, Inc. and Invesco Canada Ltd. and separate sub-advisory agreements with Invesco PowerShares Capital Management LLC and Invesco Asset Management (India) Private Limited (collectively, the “Affiliated Sub-Advisers”) the Adviser, not the Fund, will pay 40% of the fees paid to the Adviser to any such Affiliated Sub-Adviser(s) that provide(s) discretionary investment management services to the Fund based on the percentage of assets allocated to such Affiliated Sub-Adviser(s).
The Adviser has contractually agreed, through at least June 30, 2018, to waive advisory fees and/or reimburse expenses of all shares to the extent necessary to limit total annual fund operating expenses after fee waiver and/or expense reimbursement (excluding certain items discussed below) of Series I shares to 2.25% and Series II shares to 2.50% of average daily net assets (the “expense limits”). In determining the Adviser’s obligation to waive advisory fees and/or reimburse expenses, the following expenses are not taken into account, and could cause the total annual fund operating expenses after fee waiver and/or expense reimbursement to exceed the numbers reflected above: (1) interest; (2) taxes; (3) dividend expense on short sales; (4) extraordinary or non-routine items, including litigation expenses; and (5) expenses that the Fund has incurred but did not actually pay because of an expense offset arrangement. Unless Invesco continues the fee waiver agreement, it will terminate on June 30, 2018. During its term, the fee waiver agreement cannot be terminated or amended to increase the expense limits or reduce the advisory fee waiver without approval of the Board of Trustees. The Adviser did not waive fees and/or reimburse expenses during the period under these expense limits.
The Adviser has contractually agreed, through at least June 30, 2019, to waive the advisory fee payable by the Fund in an amount equal to 100% of the net advisory fees the Adviser receives from the affiliated money market funds on investments by the Fund of uninvested cash in such affiliated money market funds.
For the year ended December 31, 2017, the Adviser waived advisory fees of $469.
The Trust has entered into a master administrative services agreement with Invesco pursuant to which the Fund has agreed to pay Invesco a fee for costs incurred in providing accounting services and fund administrative services to the Fund and to reimburse Invesco for fees paid to insurance companies that have agreed to provide certain administrative services to the Fund. These administrative services provided by the insurance companies may include, among other things: maintenance of master accounts with the Fund; tracking, recording and transmitting net purchase and redemption orders for Fund shares; maintaining and preserving records related to the purchase, redemption and other account activity of variable product owners; distributing copies of Fund documents such as prospectuses, proxy materials and periodic reports, to variable product owners, and responding to inquiries from variable product owners about the Fund. Pursuant to such agreement, for the year ended December 31, 2017, Invesco was paid $50,000 for accounting and fund administrative services and was reimbursed $120,856 for fees paid to insurance companies.
The Trust has entered into a transfer agency and service agreement with Invesco Investment Services, Inc. (“IIS”) pursuant to which the Fund has agreed to pay IIS a fee for providing transfer agency and shareholder services to the Fund and reimburse IIS for certain expenses incurred by IIS in the course of providing such services. For the year ended December 31, 2017, expenses incurred under the agreement are shown in the Statement of Operations as Transfer agent fees.
The Trust has entered into a master distribution agreement with Invesco Distributors, Inc. (“IDI”) to serve as the distributor for the Fund. The Trust has adopted a plan pursuant to Rule 12b-1 under the 1940 Act with respect to the Fund’s Series II shares (the “Plan”). The Fund, pursuant to the Plan, pays IDI compensation at the annual rate of 0.25% of the Fund’s average daily net assets of Series II shares. The fees are accrued daily and paid monthly. Of the Plan payments, up to 0.25% of the average daily net assets of the Series II shares may be paid to insurance companies who furnish continuing personal shareholder services to customers who purchase and own Series II shares of the Fund. For the year ended December 31, 2017, expenses incurred under the Plan are detailed in the Statement of Operations as Distribution fees.
Certain officers and trustees of the Trust are officers and directors of the Adviser, IIS and/or IDI.
Invesco V.I. Global Core Equity Fund
NOTE 3—Additional Valuation Information
GAAP defines fair value as the price that would be received to sell an asset or paid to transfer a liability in an orderly transaction between market participants at the measurement date, under current market conditions. GAAP establishes a hierarchy that prioritizes the inputs to valuation methods, giving the highest priority to readily available unadjusted quoted prices in an active market for identical assets (Level 1) and the lowest priority to significant unobservable inputs (Level 3), generally when market prices are not readily available or are unreliable. Based on the valuation inputs, the securities or other investments are tiered into one of three levels. Changes in valuation methods may result in transfers in or out of an investment’s assigned level:
| | Level 1 — | Prices are determined using quoted prices in an active market for identical assets. |
| | Level 2 — | Prices are determined using other significant observable inputs. Observable inputs are inputs that other market participants may use in pricing a security. These may include quoted prices for similar securities, interest rates, prepayment speeds, credit risk, yield curves, loss severities, default rates, discount rates, volatilities and others. |
| | Level 3 — | Prices are determined using significant unobservable inputs. In situations where quoted prices or observable inputs are unavailable (for example, when there is little or no market activity for an investment at the end of the period), unobservable inputs may be used. Unobservable inputs reflect the Fund’s own assumptions about the factors market participants would use in determining fair value of the securities or instruments and would be based on the best available information. |
The following is a summary of the tiered valuation input levels, as of December 31, 2017. The level assigned to the securities valuations may not be an indication of the risk or liquidity associated with investing in those securities. Because of the inherent uncertainties of valuation, the values reflected in the financial statements may materially differ from the value received upon actual sale of those investments.
The Fund’s policy is to recognize transfers in and out of the valuation levels as of the end of the reporting period. During the year ended December 31, 2017, there were transfers from Level 1 to Level 2 of $4,455,230 and from Level 2 to Level 1 of $5,115,921, due to foreign fair value adjustments.
| | | | | | | | | | | | | | | | |
| | | Level 1 | | | Level 2 | | | Level 3 | | | Total | |
| Investments in Securities | | | | | | | | | | | | |
Australia | | $ | — | | | $ | 1,816,791 | | | $ | — | | | $ | 1,816,791 | |
Brazil | | | 812,920 | | | | 510,967 | | | | — | | | | 1,323,887 | |
China | | | 797,017 | | | | — | | | | — | | | | 797,017 | |
France | | | — | | | | 848,315 | | | | — | | | | 848,315 | |
Germany | | | — | | | | 1,837,933 | | | | — | | | | 1,837,933 | |
Hong Kong | | | 1,955,251 | | | | — | | | | — | | | | 1,955,251 | |
Ireland | | | — | | | | 1,250,893 | | | | — | | | | 1,250,893 | |
Italy | | | 1,061,244 | | | | 3,095,920 | | | | — | | | | 4,157,164 | |
Japan | | | 9,672,010 | | | | 1,478,093 | | | | — | | | | 11,150,103 | |
Luxembourg | | | — | | | | 1,368,089 | | | | — | | | | 1,368,089 | |
Netherland | | | — | | | | 2,746,452 | | | | — | | | | 2,746,452 | |
Norway | | | 1,021,808 | | | | — | | | | — | | | | 1,021,808 | |
Singapore | | | — | | | | 851,694 | | | | — | | | | 851,694 | |
South Africa | | | 618,651 | | | | — | | | | — | | | | 618,651 | |
Sweden | | | — | | | | 1,276,043 | | | | — | | | | 1,276,043 | |
Switzerland | | | 953,462 | | | | 3,590,766 | | | | — | | | | 4,544,228 | |
Taiwan | | | — | | | | 1,107,454 | | | | — | | | | 1,107,454 | |
United Kingdom | | | 6,327,409 | | | | 3,881,559 | | | | — | | | | 10,208,968 | |
United States | | | 37,789,049 | | | | — | | | | — | | | | 37,789,049 | |
Total Investments in Securities | | | 61,008,821 | | | | 25,660,969 | | | | — | | | | 86,669,790 | |
Other Investments — Assets* | | | | | | | | | | | | | | | | |
Forward Foreign Currency Contracts | | | — | | | | 111,194 | | | | — | | | | 111,194 | |
Other Investments — Liabilities* | | | | | | | | | | | | | | | | |
Forward Foreign Currency Contracts | | | — | | | | (56,040 | ) | | | — | | | | (56,040 | ) |
Total Other Investments | | | | | | | 55,154 | | | | | | | | 55,154 | |
Total Investments | | $ | 61,008,821 | | | $ | 25,716,123 | | | $ | — | | | $ | 86,724,944 | |
| * | Unrealized appreciation (depreciation). |
NOTE 4—Derivative Investments
The Fund may enter into an International Swaps and Derivatives Association Master Agreement (“ISDA Master Agreement”) under which a fund may trade OTC derivatives. An OTC transaction entered into under an ISDA Master Agreement typically involves a collateral posting arrangement, payment netting provisions and close-out netting provisions. These netting provisions allow for reduction of credit risk through netting of contractual obligations. The enforceability of the netting provisions of the ISDA Master Agreement depends on the governing law of the ISDA Master Agreement, among other factors.
Invesco V.I. Global Core Equity Fund
For financial reporting purposes, the Fund does not offset OTC derivative assets or liabilities that are subject to ISDA Master Agreements in the Statement of Assets and Liabilities.
Value of Derivative Investments at Period-End
The table below summarizes the value of the Fund’s derivative investments, detailed by primary risk exposure, held as of December 31, 2017:
| | | | |
| | | Value | |
| Derivative Assets | | Currency
Risk | |
Unrealized appreciation on forward foreign currency contracts outstanding | | $ | 111,194 | |
Derivatives not subject to master netting agreements | | | — | |
Total Derivative Assets subject to master netting agreements | | $ | 111,194 | |
| | | | |
| | | Value | |
| Derivative Liabilities | | Currency
Risk | |
Unrealized depreciation on forward foreign currency contracts outstanding | | $ | (56,040 | ) |
Derivatives not subject to master netting agreements | | | — | |
Total Derivative Liabilities subject to master netting agreements | | $ | (56,040 | ) |
Offsetting Assets and Liabilities
The table below reflects the Fund’s exposure to Counterparties subject to either an ISDA Master Agreement or other agreement for OTC derivative transactions as of December 31, 2017.
| | | | | | | | | | | | | | | | | | | | | | | | |
| | | Financial
Derivative Assets | | | Financial
Derivative Liabilities | | | | | | Collateral (Received)/Pledged | | | | |
| Counterparty | | Forward
Foreign Currency
Contracts | | | Forward Foreign Currency
Contracts | | | Net Value of
Derivatives | | | Non-Cash | | | Cash | | | Net
Amount | |
Barclays Bank PLC | | $ | 10,499 | | | $ | (56,040 | ) | | $ | (45,541 | ) | | $ | — | | | $ | — | | | $ | (45,541 | ) |
Goldman Sachs International | | | 50,498 | | | | — | | | | 50,498 | | | | — | | | | — | | | | 50,498 | |
J.P, Morgan Chase Bank, N.A. | | | 50,197 | | | | — | | | | 50,197 | | | | — | | | | — | | | | 50,197 | |
Total | | $ | 111,194 | | | $ | (56,040 | ) | | $ | 55,154 | | | $ | — | | | $ | — | | | $ | 55,154 | |
Effect of Derivative Investments for the year ended December 31, 2017
The table below summarizes the gains (losses) on derivative investments, detailed by primary risk exposure, recognized in earnings during the period:
| | | | |
| | | Location of Gain (Loss) on
Statement of Operations | |
| | | Currency Risk | |
Realized Gain (Loss): | | | | |
Forward foreign currency contracts | | $ | (45,882 | ) |
Change in Net Unrealized Appreciation (Depreciation): | | | | |
Forward foreign currency contracts | | | (166,155 | ) |
Total | | $ | (212,037 | ) |
The table below summarizes the average notional value of forward foreign currency contracts outstanding during the period.
| | | | |
| | | Forward Foreign Currency
Contracts | |
Average notional value | | $ | 5,752,276 | |
NOTE 5—Security Transactions with Affiliated Funds
The Fund is permitted to purchase or sell securities from or to certain other Invesco Funds under specified conditions outlined in procedures adopted by the Board of Trustees of the Trust. The procedures have been designed to ensure that any purchase or sale of securities by the Trust from or to another fund or portfolio that is or could be considered an affiliate by virtue of having a common investment adviser (or affiliated investment advisers), common Trustees and/or common officers complies with Rule 17a-7 of the 1940 Act. Further, as defined under the procedures, each transaction is effected at the current market price. Pursuant to these procedures, for the year ended December 31, 2017, the Fund engaged in securities purchases of $246,805.
Invesco V.I. Global Core Equity Fund
NOTE 6—Trustees’ and Officers’ Fees and Benefits
Trustees’ and Officers’ Fees and Benefits include amounts accrued by the Fund to pay remuneration to certain Trustees and Officers of the Fund. Trustees have the option to defer compensation payable by the Fund, and Trustees’ and Officers’ Fees and Benefits also include amounts accrued by the Fund to fund such deferred compensation amounts. Those Trustees who defer compensation have the option to select various Invesco Funds in which their deferral accounts shall be deemed to be invested. Finally, certain current Trustees were eligible to participate in a retirement plan that provided for benefits to be paid upon retirement to Trustees over a period of time based on the number of years of service. The Fund may have certain former Trustees who also participate in a retirement plan and receive benefits under such plan. Trustees’ and Officers’ Fees and Benefits include amounts accrued by the Fund to fund such retirement benefits. Obligations under the deferred compensation and retirement plans represent unsecured claims against the general assets of the Fund.
NOTE 7—Cash Balances
The Fund is permitted to temporarily carry a negative or overdrawn balance in its account with State Street Bank and Trust Company, the custodian bank. Such balances, if any at period-end, are shown in the Statement of Assets and Liabilities under the payable caption Amount due custodian. To compensate the custodian bank for such overdrafts, the overdrawn Fund may either (1) leave funds as a compensating balance in the account so the custodian bank can be compensated by earning the additional interest; or (2) compensate by paying the custodian bank at a rate agreed upon by the custodian bank and Invesco, not to exceed the contractually agreed upon rate.
NOTE 8—Distributions to Shareholders and Tax Components of Net Assets
Tax Character of Distributions to Shareholders Paid During the Fiscal Years Ended December 31, 2017 and 2016:
| | | | | | | | |
| | | 2017 | | | 2016 | |
Ordinary income | | $ | 901,353 | | | $ | 726,846 | |
Tax Components of Net Assets at Period-End:
| | | | |
| | | 2017 | |
Undistributed ordinary income | | $ | 789,427 | |
Net unrealized appreciation — investments | | | 15,947,443 | |
Net unrealized appreciation — foreign currencies | | | 3,327 | |
Temporary book/tax differences | | | (35,161 | ) |
Shares of beneficial interest | | | 70,054,194 | |
Total net assets | | $ | 86,759,230 | |
The difference between book-basis and tax-basis unrealized appreciation (depreciation) is due to differences in the timing of recognition of gains and losses on investments for tax and book purposes. The Fund’s net unrealized appreciation difference is attributable primarily to wash sales, forward foreign currency contracts and passive foreign investment companies.
The temporary book/tax differences are a result of timing differences between book and tax recognition of income and/or expenses. The Fund’s temporary book/tax differences are the result of the trustee deferral of compensation and retirement plan benefits.
Capital loss carryforward is calculated and reported as of a specific date. Results of transactions and other activity after that date may affect the amount of capital loss carryforward actually available for the Fund to utilize. Capital losses generated in years beginning after December 22, 2010 can be carried forward for an unlimited period, whereas previous losses expire in eight tax years. Capital losses with an expiration period may not be used to offset capital gains until all net capital losses without an expiration date have been utilized. Capital loss carryforwards with no expiration date will retain their character as either short-term or long-term capital losses instead of as short-term capital losses as under prior law. The ability to utilize capital loss carryforwards in the future may be limited under the Internal Revenue Code and related regulations based on the results of future transactions.
The Fund does not have a capital loss carryforward as of December 31, 2017.
NOTE 9—Investment Transactions
The aggregate amount of investment securities (other than short-term securities, U.S. Treasury obligations and money market funds, if any) purchased and sold by the Fund during the year ended December 31, 2017 was $55,553,014 and $57,426,469, respectively. Cost of investments, including any derivatives, on a tax basis includes the adjustments for financial reporting purposes as of the most recently completed federal income tax reporting period-end.
| | | | |
| Unrealized Appreciation (Depreciation) of Investments on a Tax Basis | |
Aggregate unrealized appreciation of investments | | $ | 16,703,944 | |
Aggregate unrealized (depreciation) of investments | | | (756,501 | ) |
Net unrealized appreciation of investments | | $ | 15,947,443 | |
Cost of investments for tax purposes is $70,777,501.
Invesco V.I. Global Core Equity Fund
NOTE 10—Reclassification of Permanent Differences
Primarily as a result of differing book/tax treatment of expired capital loss carryforward, on December 31, 2017, undistributed net investment income was increased by $26,567, undistributed net realized gain (loss) was increased by $2,587,287 and shares of beneficial interest was decreased by $2,613,854. This reclassification had no effect on the net assets of the Fund.
NOTE 11—Share Information
| | | | | | | | | | | | | | | | |
| | | Summary of Share Activity | |
| | | Years ended December 31, | |
| | | 2017(a) | | | 2016 | |
| | | Shares | | | Amount | | | Shares | | | Amount | |
Sold: | | | | | | | | | | | | | | | | |
Series I | | | 830,159 | | | $ | 8,058,908 | | | | 392,398 | | | $ | 3,370,814 | |
Series II | | | 6,745 | | | | 66,624 | | | | 24,893 | | | | 212,975 | |
| | | | |
Issued as reinvestment of dividends: | | | | | | | | | | | | | | | | |
Series I | | | 77,528 | | | | 788,459 | | | | 71,260 | | | | 635,642 | |
Series II | | | 11,087 | | | | 112,756 | | | | 10,214 | | | | 91,204 | |
| | | | |
Reacquired: | | | | | | | | | | | | | | | | |
Series I | | | (1,075,643 | ) | | | (10,456,375 | ) | | | (1,224,711 | ) | | | (10,331,318 | ) |
Series II | | | (195,837 | ) | | | (1,907,507 | ) | | | (232,258 | ) | | | (1,971,236 | ) |
Net increase (decrease) in share activity | | | (345,961 | ) | | $ | (3,337,135 | ) | | | (958,204 | ) | | $ | (7,991,919 | ) |
| (a) | There are entities that are record owners of more than 5% of the outstanding shares of the Fund and in the aggregate own 85% of the outstanding shares of the Fund. The Fund and the Fund’s principal underwriter or adviser, are parties to participation agreements with these entities whereby these entities sell units of interest in separate accounts funding variable products that are invested in the Fund. The Fund, Invesco and/or Invesco affiliates may make payments to these entities, which are considered to be related to the Fund, for providing services to the Fund, Invesco and/or Invesco affiliates including but not limited to services such as, securities brokerage, third party record keeping and account servicing and administrative services. The Fund has no knowledge as to whether all or any portion of the shares owned of record by these entities are also owned beneficially. |
NOTE 12—Financial Highlights
The following schedule presents financial highlights for a share of the Fund outstanding throughout the periods indicated.
| | | | | | | | | | | | | | | | | | | | | | | | | | | | | | | | | | | | | | | | | | | | | | | | | | | | | | | | |
| | | Net asset
value,
beginning
of period | | | Net
investment
income(a) | | | Net gains
(losses)
on securities
(both
realized and
unrealized) | | | Total from
investment
operations | | | Dividends
from net
investment
income | | | Distributions
from net
realized
gains | | | Total
distributions | | | Net asset
value, end
of period | | | Total
return(b) | | | Net assets,
end of period
(000’s omitted) | | | Ratio of
expenses
to average
net assets
with fee waivers
and/or expenses
absorbed | | | Ratio of
expenses
to average net
assets without
fee waivers
and/or expenses
absorbed | | | Ratio of net
investment
income
to average
net assets | | | Portfolio
turnover(c) | |
Series I | | | | | | | | | | | | | | | | | | | | | | | | | | | | | | | | | | | | | | | | | | | | | | | | | | | | | | | | |
Year ended 12/31/17 | | $ | 8.83 | | | $ | 0.09 | | | $ | 1.93 | | | $ | 2.02 | | | $ | (0.12 | ) | | $ | – | | | $ | (0.12 | ) | | $ | 10.73 | | | | 22.90 | % | | $ | 73,716 | | | | 1.04 | %(d) | | | 1.04 | %(d) | | | 0.95 | %(d) | | | 69 | % |
Year ended 12/31/16 | | | 8.35 | | | | 0.10 | | | | 0.47 | | | | 0.57 | | | | (0.09 | ) | | | – | | | | (0.09 | ) | | | 8.83 | | | | 6.81 | | | | 62,130 | | | | 1.05 | | | | 1.05 | | | | 1.14 | | | | 47 | |
Year ended 12/31/15 | | | 8.94 | | | | 0.09 | | | | (0.23 | ) | | | (0.14 | ) | | | (0.13 | ) | | | (0.32 | ) | | | (0.45 | ) | | | 8.35 | | | | (1.42 | ) | | | 65,167 | | | | 1.06 | | | | 1.06 | | | | 0.98 | | | | 75 | |
Year ended 12/31/14 | | | 9.06 | | | | 0.12 | | | | (0.05 | ) | | | 0.07 | | | | (0.19 | ) | | | – | | | | (0.19 | ) | | | 8.94 | | | | 0.69 | | | | 73,816 | | | | 1.06 | | | | 1.06 | | | | 1.26 | | | | 123 | |
Year ended 12/31/13 | | | 7.54 | | | | 0.15 | | | | 1.54 | | | | 1.69 | | | | (0.17 | ) | | | – | | | | (0.17 | ) | | | 9.06 | | | | 22.50 | | | | 83,982 | | | | 1.08 | | | | 1.08 | | | | 1.81 | | | | 32 | |
Series II | | | | | | | | | | | | | | | | | | | | | | | | | | | | | | | | | | | | | | | | | | | | | | | | | | | | | | | | |
Year ended 12/31/17 | | | 8.83 | | | | 0.07 | | | | 1.92 | | | | 1.99 | | | | (0.09 | ) | | | – | | | | (0.09 | ) | | | 10.73 | | | | 22.60 | | | | 13,043 | | | | 1.29 | (d) | | | 1.29 | (d) | | | 0.70 | (d) | | | 69 | |
Year ended 12/31/16 | | | 8.35 | | | | 0.07 | | | | 0.47 | | | | 0.54 | | | | (0.06 | ) | | | – | | | | (0.06 | ) | | | 8.83 | | | | 6.50 | | | | 12,302 | | | | 1.30 | | | | 1.30 | | | | 0.89 | | | | 47 | |
Year ended 12/31/15 | | | 8.93 | | | | 0.07 | | | | (0.23 | ) | | | (0.16 | ) | | | (0.10 | ) | | | (0.32 | ) | | | (0.42 | ) | | | 8.35 | | | | (1.65 | ) | | | 13,286 | | | | 1.31 | | | | 1.31 | | | | 0.73 | | | | 75 | |
Year ended 12/31/14 | | | 9.04 | | | | 0.10 | | | | (0.05 | ) | | | 0.05 | | | | (0.16 | ) | | | – | | | | (0.16 | ) | | | 8.93 | | | | 0.48 | | | | 16,010 | | | | 1.31 | | | | 1.31 | | | | 1.01 | | | | 123 | |
Year ended 12/31/13 | | | 7.52 | | | | 0.13 | | | | 1.53 | | | | 1.66 | | | | (0.14 | ) | | | – | | | | (0.14 | ) | | | 9.04 | | | | 22.25 | | | | 21,279 | | | | 1.33 | | | | 1.33 | | | | 1.56 | | | | 32 | |
| (a) | Calculated using average shares outstanding. |
| (b) | Includes adjustments in accordance with accounting principles generally accepted in the United States of America and as such, the net asset value for financial reporting purposes and the returns based upon those net asset values may differ from the net asset value and returns for shareholder transactions. Total returns are not annualized for periods less than one year, if applicable, and do not reflect charges assessed in connection with a variable product, which if included would reduce total returns. |
| (c) | Portfolio turnover is calculated at the fund level and is not annualized for periods less than one year, if applicable. |
| (d) | Ratios are based on average daily net assets (000’s omitted) of $67,941 and $12,675 for Series I and Series II shares, respectively. |
Invesco V.I. Global Core Equity Fund
Report of Independent Registered Public Accounting Firm
To the Board of Trustees of AIM Variable Insurance Funds (Invesco Variable Insurance Funds) and Shareholders of Invesco V.I. Global Core Equity Fund
Opinion on the Financial Statements
We have audited the accompanying statement of assets and liabilities, including the schedule of investments, of Invesco V.I. Global Core Equity Fund (one of the funds constituting AIM Variable Insurance Funds (Invesco Variable Insurance Funds), hereafter referred to as the “Fund”) as of December 31, 2017, the related statement of operations for the year ended December 31, 2017, the statement of changes in net assets for each of the two years in the period ended December 31, 2017, including the related notes, and the financial highlights for each of the five years in the period ended December 31, 2017 (collectively referred to as the “financial statements”). In our opinion, the financial statements present fairly, in all material respects, the financial position of the Fund as of December 31, 2017, the results of its operations for the year then ended, the changes in its net assets for each of the two years in the period ended December 31, 2017 and the financial highlights for each of the five years in the period ended December 31, 2017 in conformity with accounting principles generally accepted in the United States of America.
Basis for Opinion
These financial statements are the responsibility of the Fund’s management. Our responsibility is to express an opinion on the Fund’s financial statements based on our audits. We are a public accounting firm registered with the Public Company Accounting Oversight Board (United States) (“PCAOB”) and are required to be independent with respect to the Fund in accordance with the U.S. federal securities laws and the applicable rules and regulations of the Securities and Exchange Commission and the PCAOB.
We conducted our audits of these financial statements in accordance with the standards of the PCAOB. Those standards require that we plan and perform the audit to obtain reasonable assurance about whether the financial statements are free of material misstatement, whether due to error or fraud.
Our audits included performing procedures to assess the risks of material misstatement of the financial statements, whether due to error or fraud, and performing procedures that respond to those risks. Such procedures included examining, on a test basis, evidence regarding the amounts and disclosures in the financial statements. Our audits also included evaluating the accounting principles used and significant estimates made by management, as well as evaluating the overall presentation of the financial statements. Our procedures included confirmation of securities owned as of December 31, 2017 by correspondence with the custodian, transfer agent and brokers; when replies were not received from brokers, we performed other auditing procedures. We believe that our audits provide a reasonable basis for our opinion.
PricewaterhouseCoopers LLP
Houston, TX
February 14, 2018
We have served as the auditor of one or more of the investment companies in the Invesco/PowerShares group of investment companies since at least 1995. We have not determined the specific year we began serving as auditor.
Invesco V.I. Global Core Equity Fund
Calculating your ongoing Fund expenses
Example
As a shareholder of the Fund, you incur ongoing costs, including management fees; distribution and/or service fees (12b-1); and other Fund expenses. This example is intended to help you understand your ongoing costs (in dollars) of investing in the Fund and to compare these costs with ongoing costs of investing in other mutual funds. The example is based on an investment of $1,000 invested at the beginning of the period and held for the entire period July 1, 2017 through December 31, 2017.
The actual and hypothetical expenses in the examples below do not represent the effect of any fees or other expenses assessed in connection with a variable product; if they did, the expenses shown would be higher while the ending account values shown would be lower.
Actual expenses
The table below provides information about actual account values and actual expenses. You may use the information in this table, together with the amount you invested, to estimate the expenses that you paid over the period. Simply divide your account value by $1,000 (for example, an $8,600 account value divided by $1,000 = 8.6), then multiply the result by the number in the table under the heading entitled “Actual Expenses Paid During Period” to estimate the expenses you paid on your account during this period.
Hypothetical example for comparison purposes
The table below also provides information about hypothetical account values and hypothetical expenses based on the Fund’s actual expense ratio and an assumed rate of return of 5% per year before expenses, which is not the Fund’s actual return.
The hypothetical account values and expenses may not be used to estimate the actual ending account balance or expenses you paid for the period. You may use this information to compare the ongoing costs of investing in the Fund and other funds. To do so, compare this 5% hypothetical example with the 5% hypothetical examples that appear in the shareholder reports of the other funds.
Please note that the expenses shown in the table are meant to highlight your ongoing costs. Therefore, the hypothetical information is useful in comparing ongoing costs, and will not help you determine the relative total costs of owning different funds.
| | | | | | | | | | | | | | | | | | | | | | | | |
| Class | | Beginning
Account Value
(07/01/17) | | | Actual | | | HYPOTHETICAL
(5% annual return before
expenses) | | | Annualized
Expense
Ratio | |
| | | Ending
Account Value
(12/31/17)1 | | | Expenses
Paid During
Period2 | | | Ending
Account Value
(12/31/17) | | | Expenses
Paid During
Period2 | | |
| Series I | | $ | 1,000.00 | | | $ | 1,106.20 | | | $ | 5.47 | | | $ | 1,020.01 | | | $ | 5.24 | | | | 1.03 | % |
| Series II | | | 1,000.00 | | | | 1,105.80 | | | | 6.79 | | | | 1,018.75 | | | | 6.51 | | | | 1.28 | |
| 1 | The actual ending account value is based on the actual total return of the Fund for the period July 1, 2017 through December 31, 2017, after actual expenses and will differ from the hypothetical ending account value which is based on the Fund’s expense ratio and a hypothetical annual return of 5% before expenses. |
| 2 | Expenses are equal to the Fund’s annualized expense ratio as indicated above multiplied by the average account value over the period, multiplied by 184/365 to reflect the most recent fiscal half year. |
Invesco V.I. Global Core Equity Fund
Tax Information
Form 1099-DIV, Form 1042-S and other year-end tax information provide shareholders with actual calendar year amounts that should be included in their tax returns. Shareholders should consult their tax advisors.
The following distribution information is being provided as required by the Internal Revenue Code or to meet a specific state’s requirement.
The Fund designates the following amounts or, if subsequently determined to be different, the maximum amount allowable for its fiscal year ended December 31, 2017:
| | | | | | | | |
Federal and State Income Tax | |
Corporate Dividends Received Deduction* | | | 60.99 | % | | | | |
U.S. Treasury Obligations* | | | 0.00 | % | | | | |
| | * | The above percentages are based on ordinary income dividends paid to shareholders during the Fund’s fiscal year. |
Invesco V.I. Global Core Equity Fund
Trustees and Officers
The address of each trustee and officer is AIM Variable Insurance Funds (Invesco Variable Insurance Funds) (the “Trust”), 11 Greenway Plaza, Suite 1000, Houston, Texas 77046-1173. The trustees serve for the life of the Trust, subject to their earlier death, incapacitation, resignation, retirement or removal as more specifically provided in the Trust’s organizational documents. Each officer serves for a one year term or until their successors are elected and qualified. Column two below includes length of time served with predecessor entities, if any.
| | | | | | | | |
Name, Year of Birth and
Position(s) Held with the Trust | | Trustee and/
or Officer Since | | Principal Occupation(s)
During Past 5 Years | | Number of
Funds in Fund
Complex
Overseen by
Trustee | | Other Directorship(s)
Held by Trustee During
Past 5 Years |
| Interested Persons | | | | | | | | |
Martin L. Flanagan1 — 1960 Trustee | | 2007 | | Executive Director, Chief Executive Officer and President, Invesco Ltd. (ultimate parent of Invesco and a global investment management firm); Trustee, The Invesco Funds; Vice Chair, Investment Company Institute; and Member of Executive Board, SMU Cox School of Business Formerly: Advisor to the Board, Invesco Advisers, Inc. (formerly known as Invesco Institutional (N.A.), Inc.); Chairman and Chief Executive Officer, Invesco Advisers, Inc. (registered investment adviser); Director, Chairman, Chief Executive Officer and President, Invesco Holding Company (US), Inc. (formerly IVZ Inc.) (holding company), Invesco Group Services, Inc. (service provider) and Invesco North American Holdings, Inc. (holding company); Director, Chief Executive Officer and President, Invesco Holding Company Limited (parent of Invesco and a global investment management firm); Director, Invesco Ltd.; Chairman, Investment Company Institute and President, Co-Chief Executive Officer, Co-President, Chief Operating Officer and Chief Financial Officer, Franklin Resources, Inc. (global investment management organization) | | 158 | | None |
Philip A. Taylor2 — 1954 Trustee and Senior Vice President | | 2006 | | Head of the Americas and Senior Managing Director, Invesco Ltd.; Director, Invesco Advisers, Inc. (formerly known as Invesco Institutional (N.A.), Inc.) (registered investment adviser); Director, Chairman, Chief Executive Officer and President, Invesco Management Group, Inc. (formerly known as Invesco Aim Management Group, Inc.) (financial services holding company); Director and Chairman, Invesco Investment Services, Inc. (formerly known as Invesco Aim Investment Services, Inc.) (registered transfer agent); Chief Executive Officer, Invesco Corporate Class Inc. (corporate mutual fund company); Director, Chairman and Chief Executive Officer, Invesco Canada Ltd. (formerly known as Invesco Trimark Ltd./Invesco Trimark Ltèe) (registered investment adviser and registered transfer agent); Trustee and Senior Vice President, The Invesco Funds; Director, Invesco Investment Advisers LLC (formerly known as Van Kampen Asset Management). Formerly: Co-Chairman, Co-President and Co-Chief Executive Officer, Invesco Advisers, Inc. (formerly known as Invesco Institutional (N.A.), Inc.) (registered investment adviser); Director, Chief Executive Officer and President, Van Kampen Exchange Corp; President and Principal Executive Officer, The Invesco Funds (other than AIM Treasurer’s Series Trust (Invesco Treasurer’s Series Trust), Short-Term Investments Trust and Invesco Management Trust); Executive Vice President, The Invesco Funds (AIM Treasurer’s Series Trust (Invesco Treasurer’s Series Trust), Short-Term Investments Trust and Invesco Management Trust only); Director and President, INVESCO Funds Group, Inc. (registered investment adviser and registered transfer agent); Director and Chairman, IVZ Distributors, Inc. (formerly known as INVESCO Distributors, Inc.) (registered broker dealer); Director, President and Chairman, Invesco Inc. (holding company), Invesco Canada Holdings Inc. (holding company), Trimark Investments Ltd./Placements Trimark Ltèe and Invesco Financial Services Ltd/Services Financiers Invesco Ltèe; Chief Executive Officer, Invesco Canada Fund Inc. (corporate mutual fund company); Director and Chairman, Van Kampen Investor Services Inc.; Director, Chief Executive Officer and President, 1371 Preferred Inc. (holding company) and Van Kampen Investments Inc.; Director and President, AIM GP Canada Inc. (general partner for limited partnerships) and Van Kampen Advisors, Inc.; Director and Chief Executive Officer, Invesco Trimark Dealer Inc. (registered broker dealer); Director, Invesco Distributors, Inc. (formerly known as Invesco Aim Distributors, Inc.) (registered broker dealer); Manager, Invesco PowerShares Capital Management LLC; Director, Chief Executive Officer and President, Invesco Advisers, Inc.; Director, Chairman, Chief Executive Officer and President, Invesco Aim Capital Management, Inc.; President, Invesco Trimark Dealer Inc. and Invesco Trimark Ltd./Invesco Trimark Ltèe; Director and President, AIM Trimark Corporate Class Inc. and AIM Trimark Canada Fund Inc.; Senior Managing Director, Invesco Holding Company Limited; Director and Chairman, Fund Management Company (former registered broker dealer); President and Principal Executive Officer, The Invesco Funds (AIM Treasurer’s Series Trust (Invesco Treasurer’s Series Trust), and Short-Term Investments Trust only); President, AIM Trimark Global Fund Inc. and AIM Trimark Canada Fund Inc. | | 158 | | None |
| 1 | Mr. Flanagan is considered an interested person (within the meaning of Section 2(a)(19) of the 1940 Act) of the Trust because he is an officer of the Adviser to the Trust, and an officer and a director of Invesco Ltd., ultimate parent of the Adviser. |
| 2 | Mr. Taylor is considered an interested person (within the meaning of Section 2(a)(19) of the 1940 Act) of the Trust because he is an officer and a director of the Adviser. |
Invesco V.I. Global Core Equity Fund
Trustees and Officers—(continued)
| | | | | | | | |
Name, Year of Birth and
Position(s) Held with the Trust | | Trustee and/
or Officer Since | | Principal Occupation(s)
During Past 5 Years | | Number of
Funds in Fund
Complex
Overseen by
Trustee | | Other Directorship(s)
Held by Trustee During
Past 5 Years |
| Independent Trustees | | | | | | | | |
Bruce L. Crockett — 1944 Trustee and Chair | | 1993 | | Chairman, Crockett Technologies Associates (technology consulting company) Formerly: Director, Captaris (unified messaging provider); Director, President and Chief Executive Officer, COMSAT Corporation; Chairman, Board of Governors of INTELSAT (international communications company); ACE Limited (insurance company); Independent Directors Council and Investment Company Institute: Member of the Audit Committee, Investment Company Institute; Member of the Executive Committee and Chair of the Governance Committee, Independent Directors Council | | 158 | | Director and Chairman of the Audit Committee, ALPS (Attorneys Liability Protection Society) (insurance company); Director and Member of the Audit Committee and Compensation Committee, Ferroglobe PLC (metallurgical company) |
David C. Arch — 1945 Trustee | | 2010 | | Chairman of Blistex Inc. (consumer health care products manufacturer); Member, World Presidents’ Organization | | 158 | | Board member of the Illinois Manufacturers’ Association |
Jack M. Fields — 1952 Trustee | | 1997 | | Chief Executive Officer, Twenty First Century Group, Inc. (government affairs company); and Chairman, Discovery Learning Alliance (non-profit) Formerly: Owner and Chief Executive Officer, Dos Angeles Ranch L.P. (cattle, hunting, corporate entertainment); Director, Insperity, Inc. (formerly known as Administaff) (human resources provider); Chief Executive Officer, Texana Timber LP (sustainable forestry company); Director of Cross Timbers Quail Research Ranch (non-profit); and member of the U.S. House of Representatives | | 158 | | None |
Cynthia Hostetler — 1962 Trustee | | 2017 | | Non-Executive Director and Trustee of a number of public and private business corporations Formerly: Head of Investment Funds and Private Equity, Overseas Private Investment Corporation; President, First Manhattan Bancorporation, Inc.; Attorney, Simpson Thacher & Bartlett LLP | | 158 | | Vulcan Materials Company (construction materials company); Trilinc Global Impact Fund; Aberdeen Investment Funds (4 portfolios); Artio Global Investment LLC (mutual fund complex); Edgen Group, Inc. (specialized energy and infrastructure products distributor) |
Eli Jones — 1961 Trustee | | 2016 | | Professor and Dean, Mays Business School — Texas A&M University Formerly: Professor and Dean, Walton College of Business, University of Arkansas and E.J. Ourso College of Business, Louisiana State University; Director, Arvest Bank | | 158 | | Insperity, Inc. (formerly known as Administaff) (human resources provider) |
Prema Mathai-Davis — 1950 Trustee | | 1998 | | Retired. | | 158 | | None |
Teresa M. Ressel — 1962 Trustee | | 2017 | | Non-executive director and trustee of a number of public and private business corporations Formerly: Chief Financial Officer, Olayan America, The Olayan Group (international investor/commercial/industrial); Chief Executive Officer, UBS Securities LLC; Group Chief Operating Officer, Americas, UBS AG; Assistant Secretary for Management & Budget and CFO, US Department of the Treasury | | 158 | | Atlantic Power Corporation (power generation company); ON Semiconductor Corp. (semiconductor supplier) |
Ann Barnett Stern — 1957 Trustee | | 2017 | | President and Chief Executive Officer, Houston Endowment Inc. (private philanthropic institution) Formerly: Executive Vice President and General Counsel, Texas Children’s Hospital; Attorney, Beck, Redden and Secrest, LLP; Business Law Instructor, University of St. Thomas; Attorney, Andrews & Kurth LLP | | 158 | | Federal Reserve Bank of Dallas |
Raymond Stickel, Jr. — 1944 Trustee | | 2005 | | Retired. Formerly: Director, Mainstay VP Series Funds, Inc. (25 portfolios); Partner, Deloitte & Touche | | 158 | | None |
Robert C. Troccoli — 1949 Trustee | | 2016 | | Adjunct Professor, University of Denver — Daniels College of Business Formerly: Senior Partner, KPMG LLP | | 158 | | None |
Christopher L. Wilson — 1957 Trustee | | 2017 | | Non-executive director and trustee of a number of public and private business corporations Formerly: Managing Partner, CT2, LLC (investing and consulting firm); President/Chief Executive Officer, Columbia Funds, Bank of America Corporation; President/Chief Executive Officer, CDC IXIS Asset Management Services, Inc.; Principal & Director of Operations, Scudder Funds, Scudder, Stevens & Clark, Inc.; Assistant Vice President, Fidelity Investments | | 158 | | TD Asset Management USA Inc. (mutual fund complex) (22 portfolios); ISO New England, Inc. (non-profit organization managing regional electricity market) |
Invesco V.I. Global Core Equity Fund
Trustees and Officers—(continued)
| | | | | | | | |
Name, Year of Birth and
Position(s) Held with the Trust | | Trustee and/
or Officer Since | | Principal Occupation(s)
During Past 5 Years | | Number of
Funds in Fund
Complex
Overseen by
Trustee | | Other Directorship(s)
Held by Trustee During
Past 5 Years |
| Other Officers | | | | | | | | |
Sheri Morris — 1964 President, Principal Executive Officer and Treasurer | | 1999 | | President, Principal Executive Officer and Treasurer, The Invesco Funds; Vice President, Invesco Advisers, Inc. (formerly known as Invesco Institutional (N.A.), Inc.) (registered investment adviser); and Vice President, PowerShares Exchange-Traded Fund Trust, PowerShares Exchange-Traded Fund Trust II, PowerShares India Exchange-Traded Fund Trust, PowerShares Actively Managed Exchange-Traded Fund Trust, PowerShares Actively Managed Exchange-Traded Commodity Fund Trust and PowerShares Exchange-Traded Self-Indexed Fund Trust Formerly: Vice President and Principal Financial Officer, The Invesco Funds; Vice President, Invesco Aim Advisers, Inc., Invesco Aim Capital Management, Inc. and Invesco Aim Private Asset Management, Inc.; Assistant Vice President and Assistant Treasurer, The Invesco Funds and Assistant Vice President, Invesco Advisers, Inc., Invesco Aim Capital Management, Inc. and Invesco Aim Private Asset Management, Inc.; and Treasurer, PowerShares Exchange-Traded Fund Trust, PowerShares Exchange-Traded Fund Trust II, PowerShares India Exchange-Traded Fund Trust and PowerShares Actively Managed Exchange-Traded Fund Trust | | N/A | | N/A |
Russell C. Burk — 1958 Senior Vice President and Senior Officer | | 2005 | | Senior Vice President and Senior Officer, The Invesco Funds | | N/A | | N/A |
John M. Zerr — 1962 Senior Vice President, Chief Legal Officer and Secretary | | 2006 | | Director, Senior Vice President, Secretary and General Counsel, Invesco Management Group, Inc. (formerly known as Invesco AIM Management Group, Inc.); Senior Vice President, Invesco Advisers, Inc. (formerly known as Invesco Institutional (N.A.), Inc.) (registered investment adviser); Senior Vice President and Secretary, Invesco Distributors, Inc. (formerly known as Invesco AIM Distributors, Inc.); Director, Vice President and Secretary, Invesco Investment Services, Inc. (formerly known as Invesco AIM Investment Services, Inc.) Senior Vice President, Chief Legal Officer and Secretary, The Invesco Funds; Managing Director, Invesco PowerShares Capital Management LLC; Director, Secretary and General Counsel, Invesco Investment Advisers LLC (formerly known as Van Kampen Asset Management); Secretary and General Counsel, Invesco Capital Markets, Inc. (formerly known as Van Kampen Funds Inc.) and Chief Legal Officer, PowerShares Exchange-Traded Fund Trust, PowerShares Exchange-Traded Fund Trust II, PowerShares India Exchange-Traded Fund Trust, PowerShares Actively Managed Exchange-Traded Fund Trust, PowerShares Actively Managed Exchange-Traded Commodity Fund Trust and PowerShares Exchange-Traded Self-Indexed Fund Trust; Manager and Secretary, Invesco Indexing LLC Formerly: Director, Secretary, General Counsel and Senior Vice President, Van Kampen Exchange Corp.; Director, Vice President and Secretary, IVZ Distributors, Inc. (formerly known as INVESCO Distributors, Inc.); Director and Vice President, INVESCO Funds Group, Inc.; Director and Vice President, Van Kampen Advisors Inc.; Director, Vice President, Secretary and General Counsel, Van Kampen Investor Services Inc.; Director, Invesco Distributors, Inc. (formerly known as Invesco AIM Distributors, Inc.); Director, Senior Vice President, General Counsel and Secretary, Invesco AIM Advisers, Inc. and Van Kampen Investments Inc.; Director, Vice President and Secretary, Fund Management Company; Director, Senior Vice President, Secretary, General Counsel and Vice President, Invesco AIM Capital Management, Inc.; Chief Operating Officer and General Counsel, Liberty Ridge Capital, Inc. (an investment adviser); Vice President and Secretary, PBHG Funds (an investment company) and PBHG Insurance Series Fund (an investment company); Chief Operating Officer, General Counsel and Secretary, Old Mutual Investment Partners (a broker-dealer); General Counsel and Secretary, Old Mutual Fund Services (an administrator) and Old Mutual Shareholder Services (a shareholder servicing center); Executive Vice President, General Counsel and Secretary, Old Mutual Capital, Inc. (an investment adviser); and Vice President and Secretary, Old Mutual Advisors Funds (an investment company) | | N/A | | N/A |
Gregory G. McGreevey — 1962 Senior Vice President | | 2012 | | Senior Managing Director, Invesco Ltd.; Director, Chairman, President, and Chief Executive Officer, Invesco Advisers, Inc. (formerly known as Invesco Institutional (N.A.), Inc.) (registered investment adviser); Senior Vice President, Invesco Management Group, Inc.; Director, Invesco Mortgage Capital, Inc. and Invesco Senior Secured Management, Inc.; and Senior Vice President, The Invesco Funds Formerly: Assistant Vice President, The Invesco Funds | | N/A | | N/A |
Kelli Gallegos — 1970 Vice President, Principal Financial Officer and Assistant Treasurer | | 2008 | | Vice President, Principal Financial Officer and Assistant Treasurer, The Invesco Funds; Assistant Treasurer, Invesco PowerShares Capital Management LLC, PowerShares Exchange-Traded Fund Trust, PowerShares Exchange-Traded Fund Trust II, PowerShares India Exchange-Traded Fund Trust, PowerShares Actively Managed Exchange-Traded Fund Trust, PowerShares Actively Managed Exchange-Traded Commodity Fund Trust and PowerShares Exchange-Traded Self-Indexed Fund Trust Formerly: Assistant Vice President, The Invesco Funds | | N/A | | N/A |
Invesco V.I. Global Core Equity Fund
Trustees and Officers—(continued)
| | | | | | | | |
Name, Year of Birth and
Position(s) Held with the Trust | | Trustee and/
or Officer Since | | Principal Occupation(s)
During Past 5 Years | | Number of
Funds in Fund
Complex
Overseen by
Trustee | | Other Directorship(s)
Held by Trustee During
Past 5 Years |
| Other Officers—(continued) | | | | | | | | |
Tracy Sullivan — 1962 Vice President, Chief Tax Officer and Assistant Treasurer | | 2008 | | Vice President, Chief Tax Officer and Assistant Treasurer, The Invesco Funds; Assistant Treasurer, Invesco PowerShares Capital Management LLC, PowerShares Exchange-Traded Fund Trust, PowerShares Exchange-Traded Fund Trust II, PowerShares India Exchange-Traded Fund Trust, PowerShares Actively Managed Exchange-Traded Fund Trust, PowerShares Actively Managed Exchange-Traded Commodity Fund Trust and PowerShares Exchange-Traded Self-Indexed Fund Trust Formerly: Assistant Vice President, The Invesco Funds | | N/A | | N/A |
Crissie M. Wisdom — 1969 Anti-Money Laundering Compliance Officer | | 2013 | | Anti-Money Laundering Compliance Officer, Invesco Advisers, Inc. (formerly known as Invesco Institutional (N.A.), Inc.) (registered investment adviser), Invesco Capital Markets, Inc. (formerly known as Van Kampen Funds Inc.), Invesco Distributors, Inc., Invesco Investment Services, Inc., Invesco Management Group, Inc., The Invesco Funds, and PowerShares Exchange-Traded Fund Trust, PowerShares Exchange-Traded Fund Trust II, PowerShares India Exchange-Traded Fund Trust, PowerShares Actively Managed Exchange-Traded Fund Trust, PowerShares Actively Managed Exchange-Traded Commodity Fund Trust and PowerShares Exchange-Traded Self-Indexed Fund Trust; Anti-Money Laundering Compliance Officer and Bank Secrecy Act Officer, INVESCO National Trust Company and Invesco Trust Company; and Fraud Prevention Manager and Controls and Risk Analysis Manager for Invesco Investment Services, Inc. Formerly: Anti-Money Laundering Compliance Officer, Van Kampen Exchange Corp. | | N/A | | N/A |
Robert R. Leveille — 1969 Chief Compliance Officer | | 2016 | | Chief Compliance Officer, Invesco Advisers, Inc. (registered investment adviser); and Chief Compliance Officer, The Invesco Funds Formerly: Chief Compliance Officer, Putnam Investments and the Putnam Funds | | N/A | | N/A |
The Statement of Additional Information of the Trust includes additional information about the Fund’s Trustees and is available upon request, without charge, by calling 1.800.959.4246. Please refer to the Fund’s Statement of Additional Information for information on the Fund’s sub-advisers.
| | | | | | |
Office of the Fund 11 Greenway Plaza, Suite 1000 Houston, TX 77046-1173 | | Investment Adviser Invesco Advisers, Inc. 1555 Peachtree Street, N.E. Atlanta, GA 30309 | | Distributor Invesco Distributors, Inc. 11 Greenway Plaza, Suite 1000 Houston, TX 77046-1173 | | Auditors PricewaterhouseCoopers LLP 1000 Louisiana Street, Suite 5800 Houston, TX 77002-5678 |
| | | |
| | | | | | |
Counsel to the Fund Stradley Ronon Stevens & Young, LLP 2005 Market Street, Suite 2600 Philadelphia, PA 19103-7018 | | Counsel to the Independent Trustees Goodwin Procter LLP 901 New York Avenue, N.W. Washington, D.C. 20001 | | Transfer Agent Invesco Investment Services, Inc. 11 Greenway Plaza, Suite 1000 Houston, TX 77046-1173 | | Custodian State Street Bank and Trust Company 225 Franklin Street Boston, MA 02110-2801 |
Invesco V.I. Global Core Equity Fund
| | | | |
| | |
 | | Annual Report to Shareholders | | December 31, 2017 |
| | |
| | Invesco V.I. Global Health Care Fund |

| | |
| | The Fund provides a complete list of its holdings four times in each fiscal year, at the quarter-ends. For the second and fourth quarters, the lists appear in the Fund’s semiannual and annual reports to shareholders. For the first and third quarters, the Fund files the lists with the Securities and Exchange Commission (SEC) on Form N-Q. The Fund’s Form N-Q filings are available on the SEC website, sec.gov. Copies of the Fund’s Forms N-Q may be reviewed and copied at the SEC Public Reference Room in Washington, D.C. You can obtain information on the operation of the Public Reference Room, including information about duplicating fee charges, by calling 202 551 8090 or 800 732 0330, or by electronic request at the following email address: publicinfo@sec.gov. The SEC file numbers for the Fund are 811-07452 and 033-57340. The Fund’s most recent portfolio holdings, as filed on Form N-Q, have also been made available to insurance companies issuing variable annuity contracts and variable life insurance policies (“variable products”) that invest in the Fund. A description of the policies and procedures that the Fund uses to determine how to vote proxies relating to portfolio securities is available without charge, upon request, from our Client Services department at 800 959 4246 or at invesco.com/proxyguidelines. The information is also available on the SEC website, sec.gov. Information regarding how the Fund voted proxies related to its portfolio securities during the most recent 12-month period ended June 30 is available at invesco.com/ proxysearch. The information is also available on the SEC website, sec.gov. Invesco Advisers, Inc. is an investment adviser; it provides investment advisory services to individual and institutional clients and does not sell securities. Invesco Distributors, Inc. is the US distributor for Invesco Ltd.’s retail mutual funds, exchange-traded funds and institutional money market funds. Both are wholly owned, indirect subsidiaries of Invesco Ltd. This report must be accompanied or preceded by a currently effective Fund prospectus and variable product prospectus, which contain more complete information, including sales charges and expenses. Investors should read each carefully before investing. NOT FDIC INSURED | MAY LOSE VALUE | NO BANK GUARANTEE Invesco Distributors, Inc. I-VIGHC-AR-1 02122018 1554 |
Management’s Discussion of Fund Performance
Performance summary
For the year ended December 31, 2017, Series I shares of Invesco V.I. Global
Health Care Fund (the Fund) lagged the MSCI World Health Care Index, the Fund’s style-specific benchmark.
Your Fund’s long-term performance appears later in this report.
Fund vs. Indexes
Total returns, 12/31/16 to 12/31/17, excluding variable product issuer charges.
If variable product issuer charges were included, returns would be lower.
| | | | | |
| Series I Shares | | | | 15.83 | % |
| Series II Shares | | | | 15.55 | |
| MSCI World Index▼ (Broad Market Index) | | | | 22.40 | |
| MSCI World Health Care Index▼ (Style-Specific Index) | | | | 19.80 | |
| Lipper VUF Health/Biotechnology Funds Classification Average∎ (Peer Group) | | | | 22.45 | |
Source(s): ▼FactSet Research Systems Inc.; ∎Lipper Inc.
Market conditions and your Fund
Global equity markets delivered positive, and in many cases double-digit, returns over the year ended December 31, 2017. These gains were broadly driven by firming global economic growth, as well as stronger corporate fundamentals. After trailing international markets for the first three quarters of the year, US equity markets outperformed international markets in the fourth quarter. US equity markets received a boost from the prospect of sweeping individual and corporate tax cuts, with a final tax bill approved by Congress in December 2017.
In developed markets, the US Federal Reserve (the Fed) met in December and increased the benchmark fed funds target rate by 0.25% to a target range of 1.25% to 1.50%.1 Combined with two other interest rate increases earlier in 2017, the Fed’s decision reflects a more constructive outlook for the US economy. In contrast, the European Central Bank held rates steady at 0% throughout 2017 and maintained its generous bond buying program through at least September 2018, or beyond, until it sees a sustained adjustment in the path of inflation.
Most emerging markets continued to perform well during 2017. In addition to the improving global economic outlook, other positive tailwinds included reduced expectations for a major shift in US trade policy as well as stronger oil prices. Oil moved higher on production restraint by OPEC and Russia, benefiting commodity-driven emerging markets.
At the close of 2017, equity market valuations in developed and emerging markets appeared relatively full in absolute terms, but non-US equity markets were trading at a material discount to the US. In sum, while valuations were not cheap, recent earnings growth and upward earnings revisions improved in many non-US developed markets. Interestingly, while 2017 marked the eighth year of the global bull market, we saw a shift in leadership as international stocks outperformed US stocks for the year. Prior to 2017, international stocks had trailed US stocks for four consecutive years and in six of the last seven years.
In this environment, the MSCI World Index gained 22.40%, and health care stocks, as represented by the MSCI World Health Care Index, returned 19.80% for the reporting period.
Security selection in the biotechnology industry was the primary driver of the Fund’s underperformance relative to the style-specific benchmark during the reporting period. However, the industry also held a number of the Fund’s largest individual contributors and detractors. The Fund’s top contributor for the year was
Vertex Pharmaceuticals, a company focused on developing and commercializing therapies for the treatment of cystic fibrosis. The company’s share price increased sharply following the release of positive results from a late-stage clinical trial for its combination drug therapy for cystic fibrosis. Conversely, UK-based biotechnology firm Shire was a significant detractor from Fund performance during the year. Shares of Shire suffered due to investor concerns about increased competition within the company’s hematology franchise.
The Fund’s underweight exposure to the health care equipment industry and overweight exposure to the health care services industry also detracted from Fund performance relative to the style-specific benchmark. The Fund’s only holding in health care services, Envision Healthcare, was a significant detractor from relative returns for the reporting period. Though Envision reported strong revenues in its fiscal third quarter, its earnings declined and the company reduced its outlook for the following quarter, which sent its share price sharply lower.
The Fund’s cash position, while less than 3% on average during the reporting period, also detracted from Fund performance in the strong equity market environment.
Underweight exposure to – as well as stock selection in – the pharmaceuticals industry were the largest contributors to the Fund’s relative return as the industry lagged the Fund’s style-specific benchmark for the year. However, the industry
| | | | | |
| Portfolio Composition |
| By country | | | | % of total net assets | |
| | | | | |
| |
| United States | | | | 77.9 | % |
| Switzerland | | | | 5.8 | |
| Germany | | | | 2.6 | |
| Japan | | | | 2.0 | |
| Denmark | | | | 2.0 | |
| Countries each less than 2% of portfolio | | | | 4.7 | |
Money Market Funds Plus Other Assets Less Liabilities | | | | 5.0 | |
| | | | | |
| Top 10 Equity Holdings* |
| | | | % of total net assets | |
| | | | | |
| |
| 1. Celgene Corp. | | | | 4.9 | % |
| 2. Thermo Fisher Scientific, Inc. | | | | 4.3 | |
| 3. Novartis AG-ADR | | | | 4.2 | |
| 4. UnitedHealth Group Inc. | | | | 3.9 | |
| 5. Bristol-Myers Squibb Co. | | | | 3.4 | |
| 6. Zimmer Biomet Holdings, Inc. | | | | 3.2 | |
| 7. Eli Lilly and Co. | | | | 3.2 | |
| 8. Shire PLC-ADR | | | | 2.7 | |
| 9. Alexion Pharmaceuticals, Inc. | | | | 2.6 | |
| 10. BioMarin Pharmaceutical Inc. | | | | 2.6 | |
| | | | | |
| Total Net Assets | | | $ | 211.3 million | |
| |
| Total Number of Holdings* | | | | 66 | |
The Fund’s holdings are subject to change, and there is no assurance that the Fund will continue to hold any particular security.
*Excluding money market fund holdings.
Data presented here are as of December 31, 2017.
Invesco V.I. Global Health Care Fund
also included a number of the Fund’s largest individual detractors including Endo International and Teva Pharmaceuticals. Pricing pressures and increased competition within the generic drug market negatively affected share prices of both companies during the year. We sold our position in Endo International during the reporting period.
The Fund’s overweight exposure to the managed health care industry also contributed to Fund returns relative to the style-specific benchmark. Two of the Fund’s largest individual contributors for the year were managed health care companies Aetna and UnitedHealth Group. Aetna’s share price rose sharply late in the reporting period following an announcement that CVS Health (not a Fund holding) was in talks to buy the insurer for more than $66 billion. Pending regulatory approval, the deal should close in the latter half of 2018.
The Fund’s underweight exposure to the health care services industry and overweight exposure to the life science tools and services industry aided performance. The Fund’s outperformance in the life science tools and services industry was primarily due to Thermo Fisher Scientific, a company that markets scientific instruments and lab equipment. During the year the company reported strong earnings coupled with a favorable outlook for underlying business trends.
During the year, we trimmed our exposure to a number of pharmaceutical and biotechnology holdings and increased our exposure to managed care, health care equipment and health care supplies companies. The Fund’s largest industry exposure and relative overweight exposure was in the biotechnology industry where, in our opinion, valuations were attractive, growth was robust and pipelines were strong. We believed many of the Fund’s biotechnology holdings had the potential to be acquired, but the market seemed to underappreciate this possibility. In our view, US tax reform legislation could set the stage for additional mergers or acquisitions within the biotechnology industry.
Similarly, it is our view that any clarification of the Trump administration’s policies about drug pricing would lift a major sector overhang and enable biotechnology stocks to trade more on their intrinsic value. In our opinion, this development may also trigger a rotation out of health care devices and areas of health care services in which the Fund has underweight exposure relative to its style-specific benchmark.
As always, thank you for your continued investment in Invesco V.I. Global Health Care Fund.
1 Source: US Federal Reserve
The views and opinions expressed in management’s discussion of Fund performance are those of Invesco Advisers, Inc. These views and opinions are subject to change at any time based on factors such as market and economic conditions. These views and opinions may not be relied upon as investment advice or recommendations, or as an offer for a particular security. The information is not a complete analysis of every aspect of any market, country, industry, security or the Fund. Statements of fact are from sources considered reliable, but Invesco Advisers, Inc. makes no representation or warranty as to their completeness or accuracy. Although historical performance is no guarantee of future results, these insights may help you understand our investment management philosophy.
See important Fund and, if applicable, index disclosures later in this report.
| | |
 | | Derek Taner Chartered Financial Analyst, Portfolio Manager, is manager of Invesco V.I. Global Health Care Fund. He joined Invesco in |
| 2005. Mr. Taner earned a BS in business administration with an emphasis in accounting and finance and an MBA from the University of California, Berkeley Haas School of Business. |
| | |
 | | Henry Wu Portfolio Manager, is manager of Invesco V.I. Global Health Care Fund. He joined Invesco in 2014. Mr. Wu earned a BS |
| degree, with honors, in biological sciences and an MS degree in engineering-economic systems and operations research from Stanford University. He also earned an MBA from Harvard University. |
Invesco V.I. Global Health Care Fund
Your Fund’s Long-Term Performance
Results of a $10,000 Investment – Oldest Share Class(es)
Fund and index data from 12/31/07
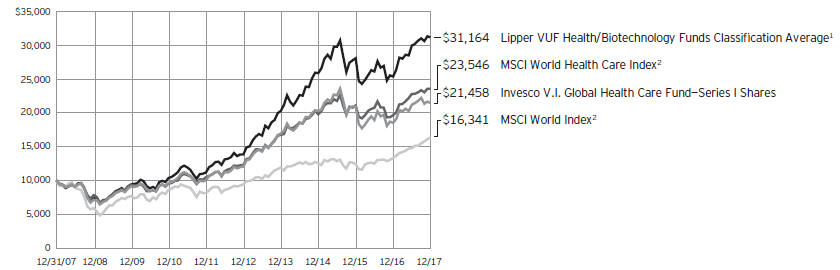
| 2 | Source: FactSet Research Systems Inc. |
Past performance cannot guarantee comparable future results.
| | | | | |
| Average Annual Total Returns |
As of 12/31/17 | | | | | |
| |
| Series I Shares | | | | | |
| Inception (5/21/97) | | | | 8.48 | % |
| 10 Years | | | | 7.93 | |
| 5 Years | | | | 12.21 | |
| 1 Year | | | | 15.83 | |
| |
| Series II Shares | | | | | |
| Inception (4/30/04) | | | | 7.66 | % |
| 10 Years | | | | 7.67 | |
| 5 Years | | | | 11.93 | |
| 1 Year | | | | 15.55 | |
The performance of the Fund’s Series I and Series II share classes will differ primarily due to different class expenses.
The performance data quoted represent past performance and cannot guarantee comparable future results; current performance may be lower or higher. Please contact your variable product issuer or financial adviser for the most recent month-end variable product performance. Performance figures reflect Fund expenses, reinvested distributions and changes in
net asset value. Investment return and principal value will fluctuate so that you may have a gain or loss when you sell shares.
The total annual Fund operating expense ratio set forth in the most recent Fund prospectus as of the date of this report for Series I and Series II shares was 0.99% and 1.24%, respectively. The expense ratios presented above may vary from the expense ratios presented in other sections of this report that are based on expenses incurred during the period covered by this report.
Invesco V.I. Global Health Care Fund, a series portfolio of AIM Variable Insurance Funds (Invesco Variable Insurance Funds), is currently offered through insurance companies issuing variable products. You cannot purchase shares of the Fund directly. Performance figures given represent the Fund and are not intended to reflect actual variable product values. They do not reflect sales charges, expenses and
fees assessed in connection with a variable product. Sales charges, expenses and fees, which are determined by the variable product issuers, will vary and will lower the total return.
The most recent month-end performance at the Fund level, excluding variable product charges, is available at 800 451 4246. As mentioned above, for the most recent month-end performance including variable product charges, please contact your variable product issuer or financial adviser.
Fund performance reflects any applicable fee waivers and/or expense reimbursements. Had the adviser not waived fees and/or reimbursed expenses currently or in the past, returns would have been lower. See current prospectus for more information.
Invesco V.I. Global Health Care Fund
Invesco V.I. Global Health Care Fund’s investment objective is long-term growth of capital.
| ∎ | | Unless otherwise stated, information presented in this report is as of December 31, 2017, and is based on total net assets. |
| ∎ | | Unless otherwise noted, all data provided by Invesco. |
Principal risks of investing in the Fund
Convertible securities risk. The market values of convertible securities are affected by market interest rates, the risk of actual issuer default on interest or principal payments and the value of the underlying common stock into which the convertible security may be converted. Additionally, a convertible security is subject to the same types of market and issuer risks as apply to the underlying common stock. In addition, certain convertible securities are subject to involuntary conversions and may undergo principal write-downs upon the occurrence of certain triggering events, and, as a result, are subject to an increased risk of loss. Convertible securities may be rated below investment grade.
Depositary receipts risk. Investing in depositary receipts involves the same risks as direct investments in foreign securities. In addition, the underlying issuers of certain depositary receipts are under no obligation to distribute shareholder communications or pass through any voting rights with respect to the deposited securities to the holders of such receipts. The Fund may therefore receive less timely information or have less control than if it invested directly in the foreign issuer.
Derivatives risk. The value of a derivative instrument depends largely on (and is derived from) the value of an underlying security, currency, commodity, interest rate, index or other asset (each referred to as an underlying asset). In addition to risks relating to the underlying assets, the use of derivatives may include other, possibly greater, risks, including counterparty, leverage and liquidity risks. Counterparty risk is the risk that the counterparty to the derivative contract will default on its obligation to pay the Fund the amount owed or otherwise perform under the derivative contract. Derivatives create leverage risk because they do not require payment up front equal to the economic exposure created by owning the derivative. As a result, an adverse change in the value of the underlying asset could result in the Fund sustaining a loss that is substantially greater than the amount invested in the derivative, which may make the Fund’s
returns more volatile and increase the risk of loss. Derivative instruments may also be less liquid than more traditional investments and the Fund may be unable to sell or close out its derivative positions at a desirable time or price. This risk may be more acute under adverse market conditions, during which the Fund may be most in need of liquidating its derivative positions. Derivatives may also be harder to value, less tax efficient and subject to changing government regulation that could impact the Fund’s ability to use certain derivatives or their cost. Also, derivatives used for hedging or to gain or limit exposure to a particular market segment may not provide the expected benefits, particularly during adverse market conditions.
Emerging markets securities risk.
Emerging markets (also referred to as developing markets) are generally subject to greater market volatility, political, social and economic instability, uncertain trading markets and more governmental limitations on foreign investment than more developed markets. In addition, companies operating in emerging markets may be subject to lower trading volume and greater price fluctuations than companies in more developed markets. Securities law and the enforcement of systems of taxation in many emerging market countries may change quickly and unpredictably. In addition, investments in emerging markets securities may also be subject to additional transaction costs, delays in settlement procedures, and lack of timely information.
Foreign securities risk. The Fund’s foreign investments may be adversely affected by political and social instability, changes in economic or taxation policies, difficulty in enforcing obligations, decreased liquidity or increased volatility. Foreign investments also involve the risk of the possible seizure, nationalization or expropriation of the issuer or foreign deposits (in which the Fund could lose its entire investments in a certain market) and the possible adoption of foreign governmental restrictions such as exchange controls. Unless the Fund has hedged its foreign securities risk, foreign securities risk also involves the risk of negative foreign currency rate fluctuations, which may cause the value of securities denominated in such foreign currency (or other
instruments through which the Fund has exposure to foreign currencies) to decline in value. Currency exchange rates may fluctuate significantly over short periods of time. Currency hedging strategies, if used, are not always successful.
Geographic focus risk. The Fund may from time to time invest a substantial amount of its assets in securities of issuers located in a single country or a limited number of countries. Adverse economic, political or social conditions in those countries may therefore have a significant negative impact on the Fund’s investment performance.
Health care sector risk. The Fund will concentrate its investments in the securities of domestic and foreign issuers in the health care sector. The health care sector is subject to significant government regulations, increases or decreases in the cost of medical products and services, and competitive forces that could negatively impact a health care company’s profitability. The health care sector may also be affected by government health care programs.
Management risk. The Fund is actively managed and depends heavily on the Adviser’s judgment about markets, interest rates or the attractiveness, relative values, liquidity, or potential appreciation of particular investments made for the Fund’s portfolio. The Fund could experience losses if these judgments prove to be incorrect. Additionally, legislative, regulatory, or tax developments may adversely affect management of the Fund and, therefore, the ability of the Fund to achieve its investment objective.
Market risk. The market values of the Fund’s investments, and therefore the value of the Fund’s shares, will go up and down, sometimes rapidly or unpredictably. Market risk may affect a single issuer, industry or section of the economy, or it may affect the market as a whole. Individual stock prices tend to go up and down more dramatically than those of certain other types of investments, such as bonds. During a general downturn in the financial markets, multiple asset classes may decline in value. When markets perform well, there can be no assurance that specific investments held by the Fund will rise in value.
Preferred securities risk. Preferred securities are subject to issuer-specific and
Invesco V.I. Global Health Care Fund
market risks applicable generally to equity securities. Preferred securities also may be subordinated to bonds or other debt instruments, subjecting them to a greater risk of non-payment, may be less liquid than many other securities, such as common stocks, and generally offer no voting rights with respect to the issuer.
Small- and mid-capitalization companies risks. Small- and mid-capitalization companies tend to be more vulnerable to changing market conditions, may have little or no operating history or track record of success, and may have more limited product lines and markets, less experienced management and fewer financial resources than larger companies. These companies’ securities may be more volatile and less liquid than those of more established companies, and their returns may vary, sometimes significantly, from the overall securities market.
About indexes used in this report
The MSCI World IndexSM is an unmanaged index considered representative of stocks of developed countries. The index is computed using the net return, which withholds applicable taxes for non-resident investors.
The MSCI World Health Care Index is an unmanaged index considered representative of health care stocks of developed countries. The index is computed using the net return, which withholds applicable taxes for non-resident investors.
The Lipper VUF Health/Biotechnology Funds Classification Average represents an average of all variable insurance underlying funds in the Lipper Health/Biotechnology Funds classification.
The Fund is not managed to track the performance of any particular index, including the index(es) described here, and consequently, the performance of the Fund may deviate significantly from the performance of the index(es).
A direct investment cannot be made in an index. Unless otherwise indicated, index results include reinvested dividends, and they do not reflect sales charges. Performance of the peer group, if applicable, reflects fund expenses; performance of a market index does not.
Other information
The returns shown in management’s discussion of Fund performance are based on net asset values calculated for shareholder transactions. Generally accepted accounting principles require adjustments to be made to the net assets of the Fund at period end for financial reporting purposes, and as such, the net asset values for shareholder transactions and the returns based on those net asset values may differ from the net asset values and returns reported in the Financial Highlights. Additionally, the returns and net asset values shown throughout this report are at the Fund level only and do not include variable product issuer charges. If such charges were included, the total returns would be lower.
Industry classifications used in this report are generally according to the Global Industry Classification Standard, which was developed by and is the exclusive property and a service mark of MSCI Inc. and Standard & Poor’s.
Invesco V.I. Global Health Care Fund
Schedule of Investments(a)
December 31, 2017
| | | | | | | | |
| | | Shares | | | Value | |
Common Stocks & Other Equity Interests–94.97% | |
| Biotechnology–29.60% | |
ACADIA Pharmaceuticals Inc.(b) | | | 28,948 | | | $ | 871,624 | |
Alexion Pharmaceuticals, Inc.(b) | | | 46,143 | | | | 5,518,241 | |
Array BioPharma Inc.(b) | | | 145,735 | | | | 1,865,408 | |
BioCryst Pharmaceuticals, Inc.(b) | | | 105,438 | | | | 517,701 | |
Biogen Inc.(b) | | | 16,246 | | | | 5,175,488 | |
BioMarin Pharmaceutical Inc.(b) | | | 61,840 | | | | 5,514,273 | |
bluebird bio, Inc.(b) | | | 9,680 | | | | 1,724,008 | |
Celgene Corp.(b) | | | 99,864 | | | | 10,421,807 | |
Clovis Oncology Inc.(b) | | | 35,993 | | | | 2,447,524 | |
DBV Technologies S.A.–ADR (France)(b) | | | 54,631 | | | | 1,343,923 | |
Exact Sciences Corp.(b) | | | 50,128 | | | | 2,633,725 | |
Heron Therapeutics, Inc.(b) | | | 59,818 | | | | 1,082,706 | |
Incyte Corp.(b) | | | 21,874 | | | | 2,071,687 | |
Loxo Oncology, Inc.(b) | | | 12,268 | | | | 1,032,720 | |
Neurocrine Biosciences, Inc.(b) | | | 27,465 | | | | 2,131,009 | |
Prothena Corp. PLC (Ireland)(b) | | | 26,044 | | | | 976,390 | |
REGENXBIO Inc.(b) | | | 30,816 | | | | 1,024,632 | |
Sarepta Therapeutics, Inc.(b) | | | 28,938 | | | | 1,610,110 | |
Seattle Genetics, Inc.(b) | | | 32,815 | | | | 1,755,602 | |
Shire PLC–ADR | | | 36,987 | | | | 5,737,423 | |
TESARO, Inc.(b) | | | 17,482 | | | | 1,448,733 | |
Ultragenyx Pharmaceutical Inc.(b) | | | 26,399 | | | | 1,224,386 | |
Vertex Pharmaceuticals Inc.(b) | | | 29,359 | | | | 4,399,740 | |
| | | | | | | | 62,528,860 | |
|
| Drug Retail–0.69% | |
Raia Drogasil S.A. (Brazil) | | | 52,760 | | | | 1,457,737 | |
|
| Health Care Equipment–9.63% | |
Boston Scientific Corp.(b) | | | 126,187 | | | | 3,128,176 | |
Edwards Lifesciences Corp.(b) | | | 18,407 | | | | 2,074,653 | |
Koninklijke Philips N.V. (Netherlands) | | | 62,453 | | | | 2,363,327 | |
Olympus Corp. (Japan) | | | 54,100 | | | | 2,071,476 | |
ResMed Inc. | | | 12,358 | | | | 1,046,599 | |
Wright Medical Group N.V.(b) | | | 133,421 | | | | 2,961,946 | |
Zimmer Biomet Holdings, Inc. | | | 55,533 | | | | 6,701,167 | |
| | | | | | | | 20,347,344 | |
|
| Health Care Facilities–1.70% | |
HCA Healthcare, Inc.(b) | | | 25,681 | | | | 2,255,819 | |
Tenet Healthcare Corp.(b) | | | 88,079 | | | | 1,335,278 | |
| | | | | | | | 3,591,097 | |
|
| Health Care Services–0.77% | |
Envision Healthcare Corp.(b) | | | 46,918 | | | | 1,621,486 | |
|
| Health Care Supplies–3.69% | |
Align Technology, Inc.(b) | | | 11,245 | | | | 2,498,527 | |
DENTSPLY SIRONA Inc. | | | 80,597 | | | | 5,305,700 | |
| | | | | | | | 7,804,227 | |
| | | | | | | | |
| | | Shares | | | Value | |
| Health Care Technology–0.07% | |
HMS Holdings Corp.(b) | | | 8,742 | | | $ | 148,177 | |
|
| Life Sciences Tools & Services–6.19% | |
Agilent Technologies, Inc. | | | 16,755 | | | | 1,122,082 | |
Illumina, Inc.(b) | | | 13,383 | | | | 2,924,052 | |
Thermo Fisher Scientific, Inc. | | | 47,545 | | | | 9,027,845 | |
| | | | | | | | 13,073,979 | |
|
| Managed Health Care–14.31% | |
Aetna Inc. | | | 11,944 | | | | 2,154,578 | |
Anthem, Inc. | | | 17,080 | | | | 3,843,171 | |
Centene Corp.(b) | | | 31,396 | | | | 3,167,229 | |
Cigna Corp. | | | 20,499 | | | | 4,163,142 | |
HealthEquity, Inc.(b) | | | 26,253 | | | | 1,224,965 | |
Humana Inc. | | | 20,656 | | | | 5,124,134 | |
Molina Healthcare, Inc.(b) | | | 16,008 | | | | 1,227,493 | |
Qualicorp S.A. (Brazil) | | | 109,000 | | | | 1,020,076 | |
UnitedHealth Group Inc. | | | 37,677 | | | | 8,306,271 | |
| | | | | | | | 30,231,059 | |
|
| Pharmaceuticals–28.32% | |
Aclaris Therapeutics, Inc.(b) | | | 60,430 | | | | 1,490,204 | |
Aerie Pharmaceuticals, Inc.(b) | | | 33,132 | | | | 1,979,637 | |
Allergan PLC | | | 20,970 | | | | 3,430,272 | |
AstraZeneca PLC–ADR (United Kingdom) | | | 75,990 | | | | 2,636,853 | |
Bayer AG (Germany) | | | 43,684 | | | | 5,432,976 | |
Bristol-Myers Squibb Co. | | | 118,588 | | | | 7,267,073 | |
Dermira, Inc.(b) | | | 54,815 | | | | 1,524,405 | |
Eli Lilly and Co. | | | 79,108 | | | | 6,681,462 | |
Jazz Pharmaceuticals PLC(b) | | | 11,848 | | | | 1,595,333 | |
Merck & Co., Inc. | | | 86,073 | | | | 4,843,328 | |
Nippon Shinyaku Co., Ltd. (Japan) | | | 30,200 | | | | 2,244,052 | |
Novartis AG–ADR (Switzerland) | | | 105,015 | | | | 8,817,059 | |
Novo Nordisk A/S–Class B (Denmark) | | | 79,789 | | | | 4,288,689 | |
Odonate Therapeutics, Inc.(b) | | | 42,585 | | | | 1,064,625 | |
Roche Holding AG (Switzerland) | | | 13,150 | | | | 3,326,978 | |
Supernus Pharmaceuticals Inc.(b) | | | 37,348 | | | | 1,488,318 | |
Zogenix, Inc.(b) | | | 43,177 | | | | 1,729,239 | |
| | | | | | | | 59,840,503 | |
Total Common Stocks & Other Equity Interests
(Cost $173,339,004) | | | | 200,644,469 | |
See accompanying Notes to Financial Statements which are an integral part of the financial statements.
Invesco V.I. Global Health Care Fund
| | | | | | | | |
| | | Shares | | | Value | |
Money Market Funds–5.02% | |
Invesco Government & Agency Portfolio– Institutional Class,
1.18%(c) | | | 3,713,402 | | | $ | 3,713,402 | |
Invesco Liquid Assets Portfolio–
Institutional Class, 1.40%(c) | | | 2,651,917 | | | | 2,652,182 | |
Invesco Treasury Portfolio–
Institutional Class, 1.17%(c) | | | 4,243,887 | | | | 4,243,887 | |
Total Money Market Funds
(Cost $10,609,713) | | | | 10,609,471 | |
TOTAL INVESTMENTS IN SECURITIES–99.99% (Cost $183,948,717) | | | | 211,253,940 | |
OTHER ASSETS LESS LIABILITIES–0.01% | | | | 24,890 | |
NET ASSETS–100.00% | | | | | | $ | 211,278,830 | |
Investment Abbreviations:
| | |
| ADR | | – American Depositary Receipt |
Notes to Schedule of Investments:
| (a) | Industry and/or sector classifications used in this report are generally according to the Global Industry Classification Standard, which was developed by and is the exclusive property and a service mark of MSCI Inc. and Standard & Poor’s. |
| (b) | Non-income producing security. |
| (c) | The money market fund and the Fund are affiliated by having the same investment adviser. The rate shown is the 7-day SEC standardized yield as of December 31, 2017. |
See accompanying Notes to Financial Statements which are an integral part of the financial statements.
Invesco V.I. Global Health Care Fund
Statement of Assets and Liabilities
December 31, 2017
Statement of Operations
For the year ended December 31, 2017
| | | | |
Assets: | | | | |
Investments in securities, at value (Cost $173,339,004) | | $ | 200,644,469 | |
Investments in affiliated money market funds, at value (Cost $10,609,713) | | | 10,609,471 | |
Foreign currencies, at value (Cost $196,091) | | | 189,142 | |
Receivable for: | | | | |
Fund shares sold | | | 76,393 | |
Dividends | | | 280,980 | |
Investment for trustee deferred compensation and retirement plans | | | 78,595 | |
Other assets | | | 14,345 | |
Total assets | | | 211,893,395 | |
| |
Liabilities: | | | | |
Payable for: | | | | |
Investments purchased | | | 28,625 | |
Fund shares reacquired | | | 321,159 | |
Accrued fees to affiliates | | | 127,512 | |
Accrued trustees’ and officers’ fees and benefits | | | 823 | |
Accrued other operating expenses | | | 48,117 | |
Trustee deferred compensation and retirement plans | | | 88,329 | |
Total liabilities | | | 614,565 | |
Net assets applicable to shares outstanding | | $ | 211,278,830 | |
| |
Net assets consist of: | | | | |
Shares of beneficial interest | | $ | 158,776,230 | |
Undistributed net investment income (loss) | | | (75,640 | ) |
Undistributed net realized gain | | | 25,276,969 | |
Net unrealized appreciation | | | 27,301,271 | |
| | | $ | 211,278,830 | |
| |
Net Assets: | | | | |
Series I | | $ | 144,038,364 | |
Series II | | $ | 67,240,466 | |
|
Shares outstanding, no par value,
with an unlimited number of shares authorized: | |
Series I | | | 5,447,855 | |
Series II | | | 2,663,365 | |
Series I: | | | | |
Net asset value per share | | $ | 26.44 | |
Series II: | | | | |
Net asset value per share | | $ | 25.25 | |
| | | | |
Investment income: | | | | |
Dividends (net of foreign withholding taxes of $112,950) | | $ | 2,020,585 | |
Dividends from affiliated money market funds | | | 38,734 | |
Total investment income | | | 2,059,319 | |
| |
Expenses: | | | | |
Advisory fees | | | 1,654,617 | |
Administrative services fees | | | 386,276 | |
Custodian fees | | | 17,413 | |
Distribution fees — Series II | | | 176,800 | |
Transfer agent fees | | | 38,859 | |
Trustees’ and officers’ fees and benefits | | | 23,798 | |
Reports to shareholders | | | 35,183 | |
Professional services fees | | | 58,584 | |
Other | | | 5,272 | |
Total expenses | | | 2,396,802 | |
Less: Fees waived | | | (4,890 | ) |
Net expenses | | | 2,391,912 | |
Net investment income (loss) | | | (332,593 | ) |
| |
Realized and unrealized gain (loss) from: | | | | |
Net realized gain (loss) from: | | | | |
Investment securities (includes net gains from securities sold to affiliates of $489,260) | | | 25,725,678 | |
Foreign currencies | | | (12,377 | ) |
| | | | 25,713,301 | |
Change in net unrealized appreciation of: | | | | |
Investment securities | | | 6,959,264 | |
Foreign currencies | | | 6,353 | |
| | | | 6,965,617 | |
Net realized and unrealized gain | | | 32,678,918 | |
Net increase in net assets resulting from operations | | $ | 32,346,325 | |
See accompanying Notes to Financial Statements which are an integral part of the financial statements.
Invesco V.I. Global Health Care Fund
Statement of Changes in Net Assets
For the years ended December 31, 2017 and 2016
| | | | | | | | |
| | | 2017 | | | 2016 | |
Operations: | | | | | | | | |
Net investment income (loss) | | $ | (332,593 | ) | | $ | 586,472 | |
Net realized gain | | | 25,713,301 | | | | 11,179,577 | |
Change in net unrealized appreciation (depreciation) | | | 6,965,617 | | | | (46,634,315 | ) |
Net increase (decrease) in net assets resulting from operations | | | 32,346,325 | | | | (34,868,266 | ) |
| | |
Distributions to shareholders from net investment income: | | | | | | | | |
Series I | | | (542,045 | ) | | | — | |
Series ll | | | (59,680 | ) | | | — | |
Total distributions from net investment income | | | (601,725 | ) | | | — | |
| | |
Distributions to shareholders from net realized gains: | | | | | | | | |
Series l | | | (7,529,290 | ) | | | (24,359,518 | ) |
Series ll | | | (3,703,036 | ) | | | (12,160,811 | ) |
Total distributions from net realized gains | | | (11,232,326 | ) | | | (36,520,329 | ) |
| | |
Share transactions–net: | | | | | | | | |
Series l | | | (15,342,320 | ) | | | (16,391,139 | ) |
Series ll | | | (8,488,857 | ) | | | (10,597,292 | ) |
Net increase (decrease) in net assets resulting from share transactions | | | (23,831,177 | ) | | | (26,988,431 | ) |
Net increase (decrease) in net assets | | | (3,318,903 | ) | | | (98,377,026 | ) |
| | |
Net assets: | | | | | | | | |
Beginning of year | | | 214,597,733 | | | | 312,974,759 | |
End of year (includes undistributed net investment income (loss) of $(75,640) and $519,244, respectively) | | $ | 211,278,830 | | | $ | 214,597,733 | |
Notes to Financial Statements
December 31, 2017
NOTE 1—Significant Accounting Policies
Invesco V.I. Global Health Care Fund (the “Fund”) is a series portfolio of AIM Variable Insurance Funds (Invesco Variable Insurance Funds) (the “Trust”). The Trust is a Delaware statutory trust registered under the Investment Company Act of 1940, as amended (the “1940 Act”), as an open-end series management investment company consisting of twenty-four separate portfolios, (each constituting a “Fund”). The assets, liabilities and operations of each portfolio are accounted for separately. Information presented in these financial statements pertains only to the Fund. Matters affecting each Fund or class will be voted on exclusively by the shareholders of such Fund or class. Current Securities and Exchange Commission (“SEC”) guidance, however, requires participating insurance companies offering separate accounts to vote shares proportionally in accordance with the instructions of the contract owners whose investments are funded by shares of each Fund or class.
The Fund’s investment objective is long-term growth of capital.
The Fund currently offers two classes of shares, Series I and Series II, both of which are offered to insurance company separate accounts funding variable annuity contracts and variable life insurance policies (“variable products”).
The Fund is an investment company and accordingly follows the investment company accounting and reporting guidance in accordance with Financial Accounting Standards Board Accounting Standards Codification Topic 946, Financial Services — Investment Companies.
The following is a summary of the significant accounting policies followed by the Fund in the preparation of its financial statements.
| A. | Security Valuations — Securities, including restricted securities, are valued according to the following policy. |
A security listed or traded on an exchange (except convertible securities) is valued at its last sales price or official closing price as of the close of the customary trading session on the exchange where the security is principally traded, or lacking any sales or official closing price on a particular day, the security may be valued at the closing bid price on that day. Securities traded in the over-the-counter market are valued based on prices furnished by independent pricing services or market makers. When such securities are valued by an independent pricing service they may be considered fair valued. Futures contracts are valued at the final settlement price set by an exchange on which they are principally traded. Listed options are valued at the mean between the last bid and asked prices from the exchange on which they are principally traded. Options not listed on an exchange are valued by an independent source at the mean between the last bid and asked prices. For purposes of determining net asset value (“NAV”) per share, futures and option contracts generally are valued 15 minutes after the close of the customary trading session of the New York Stock Exchange (“NYSE”).
Investments in open-end and closed-end registered investment companies that do not trade on an exchange are valued at the end-of-day net asset value per share. Investments in open-end and closed-end registered investment companies that trade on an exchange are valued at the last sales price or official closing price as of the close of the customary trading session on the exchange where the security is principally traded.
Invesco V.I. Global Health Care Fund
Debt obligations (including convertible securities) and unlisted equities are fair valued using an evaluated quote provided by an independent pricing service. Evaluated quotes provided by the pricing service may be determined without exclusive reliance on quoted prices, and may reflect appropriate factors such as institution-size trading in similar groups of securities, developments related to specific securities, dividend rate (for unlisted equities), yield (for debt obligations), quality, type of issue, coupon rate (for debt obligations), maturity (for debt obligations), individual trading characteristics and other market data. Pricing services generally value debt obligations assuming orderly transactions of institutional round lot size, but a fund may hold or transact in the same securities in smaller, odd lot sizes. Odd lots often trade at lower prices than institutional round lots. Debt obligations are subject to interest rate and credit risks. In addition, all debt obligations involve some risk of default with respect to interest and/or principal payments.
Foreign securities’ (including foreign exchange contracts) prices are converted into U.S. dollar amounts using the applicable exchange rates as of the close of the NYSE. If market quotations are available and reliable for foreign exchange-traded equity securities, the securities will be valued at the market quotations. Because trading hours for certain foreign securities end before the close of the NYSE, closing market quotations may become unreliable. If between the time trading ends on a particular security and the close of the customary trading session on the NYSE, events occur that the investment adviser determines are significant and make the closing price unreliable, the Fund may fair value the security. If the event is likely to have affected the closing price of the security, the security will be valued at fair value in good faith using procedures approved by the Board of Trustees. Adjustments to closing prices to reflect fair value may also be based on a screening process of an independent pricing service to indicate the degree of certainty, based on historical data, that the closing price in the principal market where a foreign security trades is not the current value as of the close of the NYSE. Foreign securities’ prices meeting the approved degree of certainty that the price is not reflective of current value will be priced at the indication of fair value from the independent pricing service. Multiple factors may be considered by the independent pricing service in determining adjustments to reflect fair value and may include information relating to sector indices, American Depositary Receipts and domestic and foreign index futures. Foreign securities may have additional risks including exchange rate changes, potential for sharply devalued currencies and high inflation, political and economic upheaval, the relative lack of issuer information, relatively low market liquidity and the potential lack of strict financial and accounting controls and standards.
Securities for which market prices are not provided by any of the above methods may be valued based upon quotes furnished by independent sources. The last bid price may be used to value equity securities. The mean between the last bid and asked prices is used to value debt obligations, including corporate loans.
Securities for which market quotations are not readily available or became unreliable are valued at fair value as determined in good faith by or under the supervision of the Trust’s officers following procedures approved by the Board of Trustees. Issuer specific events, market trends, bid/asked quotes of brokers and information providers and other market data may be reviewed in the course of making a good faith determination of a security’s fair value.
The Fund may invest in securities that are subject to interest rate risk, meaning the risk that the prices will generally fall as interest rates rise and, conversely, the prices will generally rise as interest rates fall. Specific securities differ in their sensitivity to changes in interest rates depending on their individual characteristics. Changes in interest rates may result in increased market volatility, which may affect the value and/or liquidity of certain Fund investments.
Valuations change in response to many factors including the historical and prospective earnings of the issuer, the value of the issuer’s assets, general economic conditions, interest rates, investor perceptions and market liquidity. Because of the inherent uncertainties of valuation, the values reflected in the financial statements may materially differ from the value received upon actual sale of those investments.
| B. | Securities Transactions and Investment Income — Securities transactions are accounted for on a trade date basis. Realized gains or losses on sales are computed on the basis of specific identification of the securities sold. Interest income (net of withholding tax, if any) is recorded on the accrual basis from settlement date. Dividend income (net of withholding tax, if any) is recorded on the ex-dividend date. |
The Fund may periodically participate in litigation related to Fund investments. As such, the Fund may receive proceeds from litigation settlements. Any proceeds received are included in the Statement of Operations as realized gain (loss) for investments no longer held and as unrealized gain (loss) for investments still held.
Brokerage commissions and mark ups are considered transaction costs and are recorded as an increase to the cost basis of securities purchased and/or a reduction of proceeds on a sale of securities. Such transaction costs are included in the determination of net realized and unrealized gain (loss) from investment securities reported in the Statement of Operations and the Statement of Changes in Net Assets and the net realized and unrealized gains (losses) on securities per share in the Financial Highlights. Transaction costs are included in the calculation of the Fund’s net asset value and, accordingly, they reduce the Fund’s total returns. These transaction costs are not considered operating expenses and are not reflected in net investment income reported in the Statement of Operations and the Statement of Changes in Net Assets, or the net investment income per share and the ratios of expenses and net investment income reported in the Financial Highlights, nor are they limited by any expense limitation arrangements between the Fund and the investment adviser.
The Fund allocates income and realized and unrealized capital gains and losses to a class based on the relative net assets of each class.
| C. | Country Determination — For the purposes of making investment selection decisions and presentation in the Schedule of Investments, the investment adviser may determine the country in which an issuer is located and/or credit risk exposure based on various factors. These factors include the laws of the country under which the issuer is organized, where the issuer maintains a principal office, the country in which the issuer derives 50% or more of its total revenues and the country that has the primary market for the issuer’s securities, as well as other criteria. Among the other criteria that may be evaluated for making this determination are the country in which the issuer maintains 50% or more of its assets, the type of security, financial guarantees and enhancements, the nature of the collateral and the sponsor organization. Country of issuer and/or credit risk exposure has been determined to be the United States of America, unless otherwise noted. |
| D. | Distributions — Distributions from net investment income and net realized capital gain, if any, are generally declared and paid to separate accounts of participating insurance companies annually and recorded on the ex-dividend date. |
| E. | Federal Income Taxes — The Fund intends to comply with the requirements of Subchapter M of the Internal Revenue Code of 1986, as amended (the “Internal Revenue Code”), necessary to qualify as a regulated investment company and to distribute substantially all of the Fund’s taxable earnings to shareholders. As such, the Fund will not be subject to federal income taxes on otherwise taxable income (including net realized capital gain) that is distributed to shareholders. Therefore, no provision for federal income taxes is recorded in the financial statements. |
Invesco V.I. Global Health Care Fund
The Fund recognizes the tax benefits of uncertain tax positions only when the position is more likely than not to be sustained. Management has analyzed the Fund’s uncertain tax positions and concluded that no liability for unrecognized tax benefits should be recorded related to uncertain tax positions. Management is not aware of any tax positions for which it is reasonably possible that the total amounts of unrecognized tax benefits will change materially in the next 12 months.
The Fund files tax returns in the U.S. Federal jurisdiction and certain other jurisdictions. Generally, the Fund is subject to examinations by such taxing authorities for up to three years after the filing of the return for the tax period.
| F. | Expenses — Fees provided for under the Rule 12b-1 plan of a particular class of the Fund and which are directly attributable to that class are charged to the operations of such class. All other expenses are allocated among the classes based on relative net assets. |
| G. | Accounting Estimates — The preparation of financial statements in conformity with accounting principles generally accepted in the United States of America (“GAAP”) requires management to make estimates and assumptions that affect the reported amounts of assets and liabilities at the date of the financial statements and the reported amounts of revenues and expenses during the reporting period including estimates and assumptions related to taxation. Actual results could differ from those estimates by a significant amount. In addition, the Fund monitors for material events or transactions that may occur or become known after the period-end date and before the date the financial statements are released to print. |
| H. | Indemnifications — Under the Trust’s organizational documents, each Trustee, officer, employee or other agent of the Trust is indemnified against certain liabilities that may arise out of the performance of their duties to the Fund. Additionally, in the normal course of business, the Fund enters into contracts, including the Fund’s servicing agreements, that contain a variety of indemnification clauses. The Fund’s maximum exposure under these arrangements is unknown as this would involve future claims that may be made against the Fund that have not yet occurred. The risk of material loss as a result of such indemnification claims is considered remote. |
| I. | Foreign Currency Translations — Foreign currency is valued at the close of the NYSE based on quotations posted by banks and major currency dealers. Portfolio securities and other assets and liabilities denominated in foreign currencies are translated into U.S. dollar amounts at date of valuation. Purchases and sales of portfolio securities (net of foreign taxes withheld on disposition) and income items denominated in foreign currencies are translated into U.S. dollar amounts on the respective dates of such transactions. The Fund does not separately account for the portion of the results of operations resulting from changes in foreign exchange rates on investments and the fluctuations arising from changes in market prices of securities held. The combined results of changes in foreign exchange rates and the fluctuation of market prices on investments (net of estimated foreign tax withholding) are included with the net realized and unrealized gain or loss from investments in the Statement of Operations. Reported net realized foreign currency gains or losses arise from (1) sales of foreign currencies, (2) currency gains or losses realized between the trade and settlement dates on securities transactions, and (3) the difference between the amounts of dividends, interest, and foreign withholding taxes recorded on the Fund’s books and the U.S. dollar equivalent of the amounts actually received or paid. Net unrealized foreign currency gains and losses arise from changes in the fair values of assets and liabilities, other than investments in securities at fiscal period end, resulting from changes in exchange rates. |
The Fund may invest in foreign securities, which may be subject to foreign taxes on income, gains on investments or currency repatriation, a portion of which may be recoverable. Foreign taxes, if any, are recorded based on the tax regulations and rates that exist in the foreign markets in which the Fund invests and are shown in the Statement of Operations.
| J. | Forward Foreign Currency Contracts — The Fund may engage in foreign currency transactions either on a spot (i.e. for prompt delivery and settlement) basis, or through forward foreign currency contracts, to manage or minimize currency or exchange rate risk. |
The Fund may also enter into forward foreign currency contracts for the purchase or sale of a security denominated in a foreign currency in order to “lock in” the U.S. dollar price of that security, or the Fund may also enter into forward foreign currency contracts that do not provide for physical settlement of the two currencies, but instead are settled by a single cash payment calculated as the difference between the agreed upon exchange rate and the spot rate at settlement based upon an agreed upon notional amount (non-deliverable forwards). The Fund will set aside liquid assets in an amount equal to the daily mark-to-market obligation for forward foreign currency contracts.
A forward foreign currency contract is an obligation between two parties (“Counterparties”) to purchase or sell a specific currency for an agreed-upon price at a future date. The use of forward foreign currency contracts does not eliminate fluctuations in the price of the underlying securities the Fund owns or intends to acquire but establishes a rate of exchange in advance. Fluctuations in the value of these contracts are measured by the difference in the contract date and reporting date exchange rates and are recorded as unrealized appreciation (depreciation) until the contracts are closed. When the contracts are closed, realized gains (losses) are recorded. Realized and unrealized gains (losses) on the contracts are included in the Statement of Operations. The primary risks associated with forward foreign currency contracts include failure of the Counterparty to meet the terms of the contract and the value of the foreign currency changing unfavorably. These risks may be in excess of the amounts reflected in the Statement of Assets and Liabilities.
| K. | Other Risks — The Fund’s performance is vulnerable to factors affecting the health care industry, including government regulation, obsolescence caused by scientific advances and technological innovations. |
Invesco V.I. Global Health Care Fund
NOTE 2—Advisory Fees and Other Fees Paid to Affiliates
The Trust has entered into a master investment advisory agreement with Invesco Advisers, Inc. (the “Adviser” or “Invesco”). Under the terms of the investment advisory agreement, the Fund accrues daily and pays monthly an advisory fee to the Adviser based on the annual rate of the Fund’s average daily net assets as follows:
| | | | |
| Average Daily Net Assets | | Rate | |
First $250 million | | | 0.75% | |
Next $250 million | | | 0.74% | |
Next $500 million | | | 0.73% | |
Next $1.5 billion | | | 0.72% | |
Next $2.5 billion | | | 0.71% | |
Next $2.5 billion | | | 0.70% | |
Next $2.5 billion | | | 0.69% | |
Over $10 billion | | | 0.68% | |
For the year ended December 31, 2017, the effective advisory fees incurred by the Fund was 0.75%.
Under the terms of a master sub-advisory agreement between the Adviser and each of Invesco Asset Management Deutschland GmbH, Invesco Asset Management Limited, Invesco Asset Management (Japan) Limited, Invesco Hong Kong Limited, Invesco Senior Secured Management, Inc. and Invesco Canada Ltd. and separate sub-advisory agreements with Invesco PowerShares Capital Management LLC and Invesco Asset Management (India) Private Limited (collectively, the “Affiliated Sub-Advisers”) the Adviser, not the Fund, will pay 40% of the fees paid to the Adviser to any such Affiliated Sub-Adviser(s) that provide(s) discretionary investment management services to the Fund based on the percentage of assets allocated to such Affiliated Sub-Adviser(s).
The Adviser has contractually agreed, through at least June 30, 2018, to waive advisory fees and/or reimburse expenses of all shares to the extent necessary to limit total annual fund operating expenses after fee waiver and/or expense reimbursement (excluding certain items discussed below) of Series I shares to 2.00% and Series II shares to 2.25% of average daily net assets (the “expense limits”). In determining the Adviser’s obligation to waive advisory fees and/or reimburse expenses, the following expenses are not taken into account, and could cause the total annual fund operating expenses after fee waiver and/or expense reimbursement to exceed the numbers reflected above: (1) interest; (2) taxes; (3) dividend expense on short sales; (4) extraordinary or non-routine items, including litigation expenses; and (5) expenses that the Fund has incurred but did not actually pay because of an expense offset arrangement. Unless Invesco continues the fee waiver agreement, it will terminate on June 30, 2018. During its term, the fee waiver agreement cannot be terminated or amended to increase the expense limits or reduce the advisory fee waiver without approval of the Board of Trustees. The Adviser did not waive fees and/or reimburse expenses during the period under these expense limits.
Further, the Adviser has contractually agreed, through at least June 30, 2019, to waive the advisory fee payable by the Fund in an amount equal to 100% of the net advisory fees the Adviser receives from the affiliated money market funds on investments by the Fund of uninvested cash in such affiliated money market funds.
For the year ended December 31, 2017, the Adviser waived advisory fees of $4,890.
The Trust has entered into a master administrative services agreement with Invesco pursuant to which the Fund has agreed to pay Invesco a fee for costs incurred in providing accounting services and fund administrative services to the Fund and to reimburse Invesco for fees paid to insurance companies that have agreed to provide certain administrative services to the Fund. These administrative services provided by the insurance companies may include, among other things: maintenance of master accounts with the Fund; tracking, recording and transmitting net purchase and redemption orders for Fund shares; maintaining and preserving records related to the purchase, redemption and other account activity of variable product owners; distributing copies of Fund documents such as prospectuses, proxy materials and periodic reports, to variable product owners, and responding to inquiries from variable product owners about the Fund. Pursuant to such agreement, for the year ended December 31, 2017, Invesco was paid $55,741 for accounting and fund administrative services and was reimbursed $330,535 for fees paid to insurance companies.
The Trust has entered into a transfer agency and service agreement with Invesco Investment Services, Inc. (“IIS”) pursuant to which the Fund has agreed to pay IIS a fee for providing transfer agency and shareholder services to the Fund and reimburse IIS for certain expenses incurred by IIS in the course of providing such services. For the year ended December 31, 2017, expenses incurred under the agreement are shown in the Statement of Operations as Transfer agent fees.
The Trust has entered into a master distribution agreement with Invesco Distributors, Inc. (“IDI”) to serve as the distributor for the Fund. The Trust has adopted a plan pursuant to Rule 12b-1 under the 1940 Act with respect to the Fund’s Series II shares (the “Plan”). The Fund, pursuant to the Plan, pays IDI compensation at the annual rate of 0.25% of the Fund’s average daily net assets of Series II shares. The fees are accrued daily and paid monthly. Of the Plan payments, up to 0.25% of the average daily net assets of the Series II shares may be paid to insurance companies who furnish continuing personal shareholder services to customers who purchase and own Series II shares of the Fund. For the year ended December 31, 2017, expenses incurred under the Plan are detailed in the Statement of Operations as Distribution fees.
For the year ended December 31, 2017, the Fund incurred $1,875 in brokerage commissions with Invesco Capital Markets, Inc., an affiliate of the Adviser and IDI, for portfolio transactions executed on behalf of the Fund.
Certain officers and trustees of the Trust are officers and directors of the Adviser, IIS and/or IDI.
Invesco V.I. Global Health Care Fund
NOTE 3—Additional Valuation Information
GAAP defines fair value as the price that would be received to sell an asset or paid to transfer a liability in an orderly transaction between market participants at the measurement date, under current market conditions. GAAP establishes a hierarchy that prioritizes the inputs to valuation methods, giving the highest priority to readily available unadjusted quoted prices in an active market for identical assets (Level 1) and the lowest priority to significant unobservable inputs (Level 3), generally when market prices are not readily available or are unreliable. Based on the valuation inputs, the securities or other investments are tiered into one of three levels. Changes in valuation methods may result in transfers in or out of an investment’s assigned level:
| | Level 1 — | Prices are determined using quoted prices in an active market for identical assets. |
| | Level 2 — | Prices are determined using other significant observable inputs. Observable inputs are inputs that other market participants may use in pricing a security. These may include quoted prices for similar securities, interest rates, prepayment speeds, credit risk, yield curves, loss severities, default rates, discount rates, volatilities and others. |
| | Level 3 — | Prices are determined using significant unobservable inputs. In situations where quoted prices or observable inputs are unavailable (for example, when there is little or no market activity for an investment at the end of the period), unobservable inputs may be used. Unobservable inputs reflect the Fund’s own assumptions about the factors market participants would use in determining fair value of the securities or instruments and would be based on the best available information. |
The following is a summary of the tiered valuation input levels, as of December 31, 2017. The level assigned to the securities valuations may not be an indication of the risk or liquidity associated with investing in those securities. Because of the inherent uncertainties of valuation, the values reflected in the financial statements may materially differ from the value received upon actual sale of those investments.
The Fund’s policy is to recognize transfers in and out of the valuation levels as of the end of the reporting period. During the year ended December 31, 2017, there were transfers from Level 1 to Level 2 of $9,134,765 and from Level 2 to Level 1 of $3,326,978, due to foreign fair value adjustments.
| | | | | | | | | | | | | | | | |
| | | Level 1 | | | Level 2 | | | Level 3 | | | Total | |
| Investment in Securities | | | | | | | | | | | | |
Common Stocks & Other Equity Interests | | $ | 185,149,539 | | | $ | 15,494,930 | | | $ | — | | | $ | 200,644,469 | |
Money Market Funds | | | 10,609,471 | | | | — | | | | — | | | | 10,609,471 | |
Total Investments | | $ | 195,759,010 | | | $ | 15,494,930 | | | $ | — | | | $ | 211,253,940 | |
NOTE 4—Security Transactions with Affiliated Funds
The Fund is permitted to purchase or sell securities from or to certain other Invesco Funds under specified conditions outlined in procedures adopted by the Board of Trustees of the Trust. The procedures have been designed to ensure that any purchase or sale of securities by the Fund from or to another fund or portfolio that is or could be considered an affiliate by virtue of having a common investment adviser (or affiliated investment advisers), common Trustees and/or common officers complies with Rule 17a-7 of the 1940 Act. Further, as defined under the procedures, each transaction is effected at the current market price. Pursuant to these procedures, for the year ended December 31, 2017, the Fund engaged in securities sales of $1,995,358, which resulted in net realized gains of $489,260.
NOTE 5—Trustees’ and Officers’ Fees and Benefits
Trustees’ and Officers’ Fees and Benefits include amounts accrued by the Fund to pay remuneration to certain Trustees and Officers of the Fund. Trustees have the option to defer compensation payable by the Fund, and Trustees’ and Officers’ Fees and Benefits also include amounts accrued by the Fund to fund such deferred compensation amounts. Those Trustees who defer compensation have the option to select various Invesco Funds in which their deferral accounts shall be deemed to be invested. Finally, certain current Trustees were eligible to participate in a retirement plan that provided for benefits to be paid upon retirement to Trustees over a period of time based on the number of years of service. The Fund may have certain former Trustees who also participate in a retirement plan and receive benefits under such plan. Trustees’ and Officers’ Fees and Benefits include amounts accrued by the Fund to fund such retirement benefits. Obligations under the deferred compensation and retirement plans represent unsecured claims against the general assets of the Fund.
NOTE 6—Cash Balances
The Fund is permitted to temporarily carry a negative or overdrawn balance in its account with State Street Bank and Trust Company, the custodian bank. Such balances, if any at period-end, are shown in the Statement of Assets and Liabilities under the payable caption Amount due custodian. To compensate the custodian bank for such overdrafts, the overdrawn Fund may either (1) leave funds as a compensating balance in the account so the custodian bank can be compensated by earning the additional interest; or (2) compensate by paying the custodian bank at a rate agreed upon by the custodian bank and Invesco, not to exceed the contractually agreed upon rate.
Invesco V.I. Global Health Care Fund
NOTE 7—Distributions to Shareholders and Tax Components of Net Assets
Tax Character of Distributions to Shareholders Paid During the Fiscal Years Ended December 31, 2017 and 2016:
| | | | | | | | |
| | | 2017 | | | 2016 | |
Ordinary income | | $ | 601,725 | | | $ | 5,118,845 | |
Long-term capital gain | | | 11,232,326 | | | | 31,401,484 | |
Total distributions | | $ | 11,834,051 | | | $ | 36,520,329 | |
Tax Components of Net Assets at Period-End:
| | | | |
| | | 2017 | |
Undistributed ordinary income | | $ | 280,029 | |
Undistributed long-term gain | | | 25,062,197 | |
Net unrealized appreciation — investments | | | 27,239,966 | |
Net unrealized appreciation (depreciation) — foreign currencies | | | (3,952 | ) |
Temporary book/tax differences | | | (75,640 | ) |
Shares of beneficial interest | | | 158,776,230 | |
Total net assets | | $ | 211,278,830 | |
The difference between book-basis and tax-basis unrealized appreciation (depreciation) is due to differences in the timing of recognition of gains and losses on investments for tax and book purposes. The Fund’s net unrealized appreciation difference is attributable primarily to wash sales.
The temporary book/tax differences are a result of timing differences between book and tax recognition of income and/or expenses. The Fund’s temporary book/tax differences are the result of the trustee deferral of compensation and retirement plan benefits.
Capital loss carryforward is calculated and reported as of a specific date. Results of transactions and other activity after that date may affect the amount of capital loss carryforward actually available for the Fund to utilize. Capital losses generated in years beginning after December 22, 2010 can be carried forward for an unlimited period, whereas previous losses expire in eight tax years. Capital losses with an expiration period may not be used to offset capital gains until all net capital losses without an expiration date have been utilized. Capital loss carryforwards with no expiration date will retain their character as either short-term or long-term capital losses instead of as short-term capital losses as under prior law. The ability to utilize capital loss carryforwards in the future may be limited under the Internal Revenue Code and related regulations based on the results of future transactions.
The Fund does not have a capital loss carryforward as of December 31, 2017.
NOTE 8—Investment Transactions
The aggregate amount of investment securities (other than short-term securities, U.S. Treasury obligations and money market funds, if any) purchased and sold by the Fund during the year ended December 31, 2017 was $79,103,870 and $119,328,478, respectively. Cost of investments, including any derivatives, on a tax basis includes the adjustments for financial reporting purposes as of the most recently completed federal income tax reporting period-end.
| | | | |
| Unrealized Appreciation (Depreciation) of Investments on a Tax Basis | |
Aggregate unrealized appreciation of investments | | $ | 38,418,131 | |
Aggregate unrealized (depreciation) of investments | | | (11,178,165 | ) |
Net unrealized appreciation of investments | | $ | 27,239,966 | |
Cost of investments for tax purposes is $184,013,974.
NOTE 9—Reclassification of Permanent Differences
Primarily as a result of differing book/tax treatment of net operating loss and foreign currency transactions, on December 31, 2017, undistributed net investment income (loss) was increased by $339,434 and undistributed net realized gain was decreased by $339,434. This reclassification had no effect on the net assets of the Fund.
Invesco V.I. Global Health Care Fund
NOTE 10—Share Information
| | | | | | | | | | | | | | | | |
| | | Summary of Share Activity | |
| | | Years ended December 31, | |
| | | 2017(a) | | | 2016 | |
| | | Shares | | | Amount | | | Shares | | | Amount | |
Sold: | | | | | | | | | | | | | | | | |
Series I | | | 570,966 | | | $ | 15,191,152 | | | | 712,448 | | | $ | 19,800,449 | |
Series II | | | 122,136 | | | | 3,109,327 | | | | 173,821 | | | | 4,619,231 | |
| | | | |
Issued as reinvestment of dividends: | | | | | | | | | | | | | | | | |
Series I | | | 300,385 | | | | 8,071,335 | | | | 924,811 | | | | 24,359,518 | |
Series II | | | 146,580 | | | | 3,762,716 | | | | 482,189 | | | | 12,160,811 | |
| | | | |
Reacquired: | | | | | | | | | | | | | | | | |
Series I | | | (1,453,869 | ) | | | (38,604,807 | ) | | | (2,206,286 | ) | | | (60,551,106 | ) |
Series II | | | (604,171 | ) | | | (15,360,900 | ) | | | (1,033,250 | ) | | | (27,377,334 | ) |
Net increase (decrease) in share activity | | | (917,973 | ) | | $ | (23,831,177 | ) | | | (946,267 | ) | | $ | (26,988,431 | ) |
| (a) | There are entities that are record owners of more than 5% of the outstanding shares of the Fund and in the aggregate own 54% of the outstanding shares of the Fund. The Fund and the Fund’s principal underwriter or adviser, are parties to participation agreements with these entities whereby these entities sell units of interest in separate accounts funding variable products that are invested in the Fund. The Fund, Invesco and/or Invesco affiliates may make payments to these entities, which are considered to be related to the Fund, for providing services to the Fund, Invesco and/or Invesco affiliates including but not limited to services such as, securities brokerage, third party record keeping and account servicing and administrative services. The Fund has no knowledge as to whether all or any portion of the shares owned of record by these entities are also owned beneficially. |
NOTE 11—Financial Highlights
The following schedule presents financial highlights for a share of the Fund outstanding throughout the periods indicated.
| | | | | | | | | | | | | | | | | | | | | | | | | | | | | | | | | | | | | | | | | | | | | | | | | | | | | | | | |
| | | Net asset
value,
beginning
of period | | | Net
investment
income
(loss)(a) | | | Net gains
(losses)
on securities
(both
realized and
unrealized) | | | Total from
investment
operations | | | Dividends
from net
investment
income | | | Distributions
from net
realized
gains | | | Total
distributions | | | Net asset
value, end
of period | | | Total
return(b) | | | Net assets,
end of period
(000’s omitted) | | | Ratio of
expenses
to average
net assets
with fee waivers
and/or expenses
absorbed | | | Ratio of
expenses
to average net
assets without
fee waivers
and/or expenses
absorbed | | | Ratio of net
investment
income
(loss)
to average
net assets | | | Portfolio
turnover(c) | |
Series I | | | | | | | | | | | | | | | | | | | | | | | | | | | | | | | | | | | | | | | | | | | | | | | | | | | | | | | | |
Year ended 12/31/17 | | $ | 24.11 | | | $ | (0.02 | ) | | $ | 3.86 | | | $ | 3.84 | | | $ | (0.10 | ) | | $ | (1.41 | ) | | $ | (1.51 | ) | | $ | 26.44 | | | | 15.83 | % | | $ | 144,038 | | | | 1.01 | %(d) | | | 1.01 | %(d) | | | (0.08 | )%(d) | | | 37 | % |
Year ended 12/31/16 | | | 31.75 | | | | 0.09 | | | | (3.36 | ) | | | (3.27 | ) | | | — | | | | (4.37 | ) | | | (4.37 | ) | | | 24.11 | | | | (11.46 | ) | | | 145,408 | | | | 1.04 | | | | 1.04 | | | | 0.31 | | | | 23 | |
Year ended 12/31/15 | | | 33.78 | | | | 0.00 | | | | 1.08 | | | | 1.08 | | | | — | | | | (3.11 | ) | | | (3.11 | ) | | | 31.75 | | | | 3.16 | | | | 209,511 | | | | 1.06 | | | | 1.07 | | | | 0.01 | | | | 42 | |
Year ended 12/31/14 | | | 29.32 | | | | (0.00 | ) | | | 5.71 | | | | 5.71 | | | | — | | | | (1.25 | ) | | | (1.25 | ) | | | 33.78 | | | | 19.67 | | | | 220,561 | | | | 1.08 | | | | 1.09 | | | | (0.01 | ) | | | 29 | |
Year ended 12/31/13 | | | 21.00 | | | | 0.01 | | | | 8.49 | | | | 8.50 | | | | (0.18 | ) | | | — | | | | (0.18 | ) | | | 29.32 | | | | 40.54 | | | | 180,535 | | | | 1.09 | | | | 1.10 | | | | 0.03 | | | | 32 | |
Series II | | | | | | | | | | | | | | | | | | | | | | | | | | | | | | | | | | | | | | | | | | | | | | | | | | | | | | | | |
Year ended 12/31/17 | | | 23.07 | | | | (0.08 | ) | | | 3.69 | | | | 3.61 | | | | (0.02 | ) | | | (1.41 | ) | | | (1.43 | ) | | | 25.25 | | | | 15.55 | | | | 67,240 | | | | 1.26 | (d) | | | 1.26 | (d) | | | (0.33 | )(d) | | | 37 | |
Year ended 12/31/16 | | | 30.65 | | | | 0.02 | | | | (3.23 | ) | | | (3.21 | ) | | | — | | | | (4.37 | ) | | | (4.37 | ) | | | 23.07 | | | | (11.69 | ) | | | 69,190 | | | | 1.29 | | | | 1.29 | | | | 0.06 | | | | 23 | |
Year ended 12/31/15 | | | 32.80 | | | | (0.08 | ) | | | 1.04 | | | | 0.96 | | | | — | | | | (3.11 | ) | | | (3.11 | ) | | | 30.65 | | | | 2.89 | | | | 103,464 | | | | 1.31 | | | | 1.32 | | | | (0.24 | ) | | | 42 | |
Year ended 12/31/14 | | | 28.57 | | | | (0.08 | ) | | | 5.56 | | | | 5.48 | | | | — | | | | (1.25 | ) | | | (1.25 | ) | | | 32.80 | | | | 19.38 | | | | 78,070 | | | | 1.33 | | | | 1.34 | | | | (0.26 | ) | | | 29 | |
Year ended 12/31/13 | | | 20.49 | | | | (0.05 | ) | | | 8.27 | | | | 8.22 | | | | (0.14 | ) | | | — | | | | (0.14 | ) | | | 28.57 | | | | 40.16 | | | | 58,488 | | | | 1.34 | | | | 1.35 | | | | (0.22 | ) | | | 32 | |
| (a) | Calculated using average shares outstanding. |
| (b) | Includes adjustments in accordance with accounting principles generally accepted in the United States of America and as such, the net asset value for financial reporting purposes and the returns based upon those net asset values may differ from the net asset value and returns for shareholder transactions. Total returns are not annualized for periods less than one year, if applicable, and do not reflect charges assessed in connection with a variable product, which if included would reduce total returns. |
| (c) | Portfolio turnover is calculated at the fund level and is not annualized for periods less than one year, if applicable. |
| (d) | Ratios are based on average daily net assets (000’s omitted) of $149,896, $70,720 Series I and Series II shares, respectively. |
Invesco V.I. Global Health Care Fund
Report of Independent Registered Public Accounting Firm
To the Board of Trustees of AIM Variable Insurance Funds (Invesco Variable Insurance Funds) and Shareholders of Invesco V.I. Global Health Care Fund
Opinion on the Financial Statements
We have audited the accompanying statement of assets and liabilities, including the schedule of investments, of Invesco V.I. Global Health Care Fund (one of the funds constituting AIM Variable Insurance Funds (Invesco Variable Insurance Funds), hereafter referred to as the “Fund”) as of December 31, 2017, the related statement of operations for the year ended December 31, 2017, the statement of changes in net assets for each of the two years in the period ended December 31, 2017, including the related notes, and the financial highlights for each of the five years in the period ended December 31, 2017 (collectively referred to as the “financial statements”). In our opinion, the financial statements present fairly, in all material respects, the financial position of the Fund as of December 31, 2017, the results of its operations for the year then ended, the changes in its net assets for each of the two years in the period ended December 31, 2017 and the financial highlights for each of the five years in the period ended December 31, 2017 in conformity with accounting principles generally accepted in the United States of America.
Basis for Opinion
These financial statements are the responsibility of the Fund’s management. Our responsibility is to express an opinion on the Fund’s financial statements based on our audits. We are a public accounting firm registered with the Public Company Accounting Oversight Board (United States) (“PCAOB”) and are required to be independent with respect to the Fund in accordance with the U.S. federal securities laws and the applicable rules and regulations of the Securities and Exchange Commission and the PCAOB.
We conducted our audits of these financial statements in accordance with the standards of the PCAOB. Those standards require that we plan and perform the audit to obtain reasonable assurance about whether the financial statements are free of material misstatement, whether due to error or fraud.
Our audits included performing procedures to assess the risks of material misstatement of the financial statements, whether due to error or fraud, and performing procedures that respond to those risks. Such procedures included examining, on a test basis, evidence regarding the amounts and disclosures in the financial statements. Our audits also included evaluating the accounting principles used and significant estimates made by management, as well as evaluating the overall presentation of the financial statements. Our procedures included confirmation of securities owned as of December 31, 2017 by correspondence with the custodian, transfer agent and brokers; when replies were not received from brokers, we performed other auditing procedures. We believe that our audits provide a reasonable basis for our opinion.
PricewaterhouseCoopers LLP
Houston, TX
February 14, 2018
We have served as the auditor of one or more of the investment companies in the Invesco/PowerShares group of investment companies since at least 1995. We have not determined the specific year we began serving as auditor.
Invesco V.I. Global Health Care Fund
Calculating your ongoing Fund expenses
Example
As a shareholder of the Fund, you incur ongoing costs, including management fees; distribution and/or service fees (12b-1); and other Fund expenses. This example is intended to help you understand your ongoing costs (in dollars) of investing in the Fund and to compare these costs with ongoing costs of investing in other mutual funds. The example is based on an investment of $1,000 invested at the beginning of the period and held for the entire period July 1, 2017 through December 31, 2017.
The actual and hypothetical expenses in the examples below do not represent the effect of any fees or other expenses assessed in connection with a variable product; if they did, the expenses shown would be higher while the ending account values shown would be lower.
Actual expenses
The table below provides information about actual account values and actual expenses. You may use the information in this table, together with the amount you invested, to estimate the expenses that you paid over the period. Simply divide your account value by $1,000 (for example, an $8,600 account value divided by $1,000 = 8.6), then multiply the result by the number in the table under the heading entitled “Actual Expenses Paid During Period” to estimate the expenses you paid on your account during this period.
Hypothetical example for comparison purposes
The table below also provides information about hypothetical account values and hypothetical expenses based on the Fund’s actual expense ratio and an assumed rate of return of 5% per year before expenses, which is not the Fund’s actual return.
The hypothetical account values and expenses may not be used to estimate the actual ending account balance or expenses you paid for the period. You may use this information to compare the ongoing costs of investing in the Fund and other funds. To do so, compare this 5% hypothetical example with the 5% hypothetical examples that appear in the shareholder reports of the other funds.
Please note that the expenses shown in the table are meant to highlight your ongoing costs. Therefore, the hypothetical information is useful in comparing ongoing costs, and will not help you determine the relative total costs of owning different funds.
| | | | | | | | | | | | | | | | | | | | | | | | |
| Class | | Beginning
Account Value
(07/01/17) | | | ACTUAL | | | HYPOTHETICAL
(5% annual return before
expenses) | | | | |
| | | Ending
Account Value
(12/31/17)1 | | | Expenses
Paid During
Period2 | | | Ending
Account Value
(12/31/17) | | | Expenses
Paid During
Period2 | | | Annualized
Expense
Ratio | |
Series I | | $ | 1,000.00 | | | $ | 1,012.20 | | | $ | 5.07 | | | $ | 1,020.16 | | | $ | 5.09 | | | | 1.00 | % |
Series II | | | 1,000.00 | | | | 1,010.90 | | | | 6.34 | | | | 1,018.90 | | | | 6.36 | | | | 1.25 | |
| 1 | The actual ending account value is based on the actual total return of the Fund for the period July 1, 2017 through December 31, 2017, after actual expenses and will differ from the hypothetical ending account value which is based on the Fund’s expense ratio and a hypothetical annual return of 5% before expenses. |
| 2 | Expenses are equal to the Fund’s annualized expense ratio as indicated above multiplied by the average account value over the period, multiplied by 184/365 to reflect the most recent fiscal half year. |
Invesco V.I. Global Health Care Fund
Tax Information
Form 1099-DIV, Form 1042-S and other year-end tax information provide shareholders with actual calendar year amounts that should be included in their tax returns. Shareholders should consult their tax advisors.
The following distribution information is being provided as required by the Internal Revenue Code or to meet a specific state’s requirement.
The Fund designates the following amounts or, if subsequently determined to be different, the maximum amount allowable for its fiscal year ended December 31, 2017:
| | | | |
Federal and State Income Tax | | | |
Long-Term Capital Gain Distributions | | $ | 11,232,326 | |
Corporate Dividends Received Deduction* | | | 100 | % |
U.S. Treasury Obligations* | | | 0.00 | % |
| | * | The above percentages are based on ordinary income dividends paid to shareholders during the Fund’s fiscal year. |
Invesco V.I. Global Health Care Fund
Trustees and Officers
The address of each trustee and officer is AIM Variable Insurance Funds (Invesco Variable Insurance Funds) (the “Trust”), 11 Greenway Plaza, Suite 1000, Houston, Texas 77046-1173. The trustees serve for the life of the Trust, subject to their earlier death, incapacitation, resignation, retirement or removal as more specifically provided in the Trust’s organizational documents. Each officer serves for a one year term or until their successors are elected and qualified. Column two below includes length of time served with predecessor entities, if any.
| | | | | | | | |
Name, Year of Birth and
Position(s) Held with the Trust | | Trustee and/
or Officer Since | | Principal Occupation(s)
During Past 5 Years | | Number of
Funds in Fund
Complex
Overseen by
Trustee | | Other Directorship(s)
Held by Trustee During
Past 5 Years |
| Interested Persons | | | | | | | | |
Martin L. Flanagan1 — 1960 Trustee | | 2007 | | Executive Director, Chief Executive Officer and President, Invesco Ltd. (ultimate parent of Invesco and a global investment management firm); Trustee, The Invesco Funds; Vice Chair, Investment Company Institute; and Member of Executive Board, SMU Cox School of Business Formerly: Advisor to the Board, Invesco Advisers, Inc. (formerly known as Invesco Institutional (N.A.), Inc.); Chairman and Chief Executive Officer, Invesco Advisers, Inc. (registered investment adviser); Director, Chairman, Chief Executive Officer and President, Invesco Holding Company (US), Inc. (formerly IVZ Inc.) (holding company), Invesco Group Services, Inc. (service provider) and Invesco North American Holdings, Inc. (holding company); Director, Chief Executive Officer and President, Invesco Holding Company Limited (parent of Invesco and a global investment management firm); Director, Invesco Ltd.; Chairman, Investment Company Institute and President, Co-Chief Executive Officer, Co-President, Chief Operating Officer and Chief Financial Officer, Franklin Resources, Inc. (global investment management organization) | | 158 | | None |
Philip A. Taylor2 — 1954 Trustee and Senior Vice President | | 2006 | | Head of the Americas and Senior Managing Director, Invesco Ltd.; Director, Invesco Advisers, Inc. (formerly known as Invesco Institutional (N.A.), Inc.) (registered investment adviser); Director, Chairman, Chief Executive Officer and President, Invesco Management Group, Inc. (formerly known as Invesco Aim Management Group, Inc.) (financial services holding company); Director and Chairman, Invesco Investment Services, Inc. (formerly known as Invesco Aim Investment Services, Inc.) (registered transfer agent); Chief Executive Officer, Invesco Corporate Class Inc. (corporate mutual fund company); Director, Chairman and Chief Executive Officer, Invesco Canada Ltd. (formerly known as Invesco Trimark Ltd./Invesco Trimark Ltèe) (registered investment adviser and registered transfer agent); Trustee and Senior Vice President, The Invesco Funds; Director, Invesco Investment Advisers LLC (formerly known as Van Kampen Asset Management). Formerly: Co-Chairman, Co-President and Co-Chief Executive Officer, Invesco Advisers, Inc. (formerly known as Invesco Institutional (N.A.), Inc.) (registered investment adviser); Director, Chief Executive Officer and President, Van Kampen Exchange Corp; President and Principal Executive Officer, The Invesco Funds (other than AIM Treasurer’s Series Trust (Invesco Treasurer’s Series Trust), Short-Term Investments Trust and Invesco Management Trust); Executive Vice President, The Invesco Funds (AIM Treasurer’s Series Trust (Invesco Treasurer’s Series Trust), Short-Term Investments Trust and Invesco Management Trust only); Director and President, INVESCO Funds Group, Inc. (registered investment adviser and registered transfer agent); Director and Chairman, IVZ Distributors, Inc. (formerly known as INVESCO Distributors, Inc.) (registered broker dealer); Director, President and Chairman, Invesco Inc. (holding company), Invesco Canada Holdings Inc. (holding company), Trimark Investments Ltd./Placements Trimark Ltèe and Invesco Financial Services Ltd/Services Financiers Invesco Ltèe; Chief Executive Officer, Invesco Canada Fund Inc. (corporate mutual fund company); Director and Chairman, Van Kampen Investor Services Inc.; Director, Chief Executive Officer and President, 1371 Preferred Inc. (holding company) and Van Kampen Investments Inc.; Director and President, AIM GP Canada Inc. (general partner for limited partnerships) and Van Kampen Advisors, Inc.; Director and Chief Executive Officer, Invesco Trimark Dealer Inc. (registered broker dealer); Director, Invesco Distributors, Inc. (formerly known as Invesco Aim Distributors, Inc.) (registered broker dealer); Manager, Invesco PowerShares Capital Management LLC; Director, Chief Executive Officer and President, Invesco Advisers, Inc.; Director, Chairman, Chief Executive Officer and President, Invesco Aim Capital Management, Inc.; President, Invesco Trimark Dealer Inc. and Invesco Trimark Ltd./Invesco Trimark Ltèe; Director and President, AIM Trimark Corporate Class Inc. and AIM Trimark Canada Fund Inc.; Senior Managing Director, Invesco Holding Company Limited; Director and Chairman, Fund Management Company (former registered broker dealer); President and Principal Executive Officer, The Invesco Funds (AIM Treasurer’s Series Trust (Invesco Treasurer’s Series Trust), and Short-Term Investments Trust only); President, AIM Trimark Global Fund Inc. and AIM Trimark Canada Fund Inc. | | 158 | | None |
| 1 | Mr. Flanagan is considered an interested person (within the meaning of Section 2(a)(19) of the 1940 Act) of the Trust because he is an officer of the Adviser to the Trust, and an officer and a director of Invesco Ltd., ultimate parent of the Adviser. |
| 2 | Mr. Taylor is considered an interested person (within the meaning of Section 2(a)(19) of the 1940 Act) of the Trust because he is an officer and a director of the Adviser. |
Invesco V.I. Global Health Care Fund
Trustees and Officers—(continued)
| | | | | | | | |
Name, Year of Birth and
Position(s) Held with the Trust | | Trustee and/
or Officer Since | | Principal Occupation(s)
During Past 5 Years | | Number of
Funds in Fund
Complex
Overseen by
Trustee | | Other Directorship(s)
Held by Trustee During
Past 5 Years |
| Independent Trustees | | | | | | | | |
Bruce L. Crockett — 1944 Trustee and Chair | | 1993 | | Chairman, Crockett Technologies Associates (technology consulting company) Formerly: Director, Captaris (unified messaging provider); Director, President and Chief Executive Officer, COMSAT Corporation; Chairman, Board of Governors of INTELSAT (international communications company); ACE Limited (insurance company); Independent Directors Council and Investment Company Institute: Member of the Audit Committee, Investment Company Institute; Member of the Executive Committee and Chair of the Governance Committee, Independent Directors Council | | 158 | | Director and Chairman of the Audit Committee, ALPS (Attorneys Liability Protection Society) (insurance company); Director and Member of the Audit Committee and Compensation Committee, Ferroglobe PLC (metallurgical company) |
David C. Arch — 1945 Trustee | | 2010 | | Chairman of Blistex Inc. (consumer health care products manufacturer); Member, World Presidents’ Organization | | 158 | | Board member of the Illinois Manufacturers’ Association |
Jack M. Fields — 1952 Trustee | | 1997 | | Chief Executive Officer, Twenty First Century Group, Inc. (government affairs company); and Chairman, Discovery Learning Alliance (non-profit) Formerly: Owner and Chief Executive Officer, Dos Angeles Ranch L.P. (cattle, hunting, corporate entertainment); Director, Insperity, Inc. (formerly known as Administaff) (human resources provider); Chief Executive Officer, Texana Timber LP (sustainable forestry company); Director of Cross Timbers Quail Research Ranch (non-profit); and member of the U.S. House of Representatives | | 158 | | None |
Cynthia Hostetler — 1962 Trustee | | 2017 | | Non-Executive Director and Trustee of a number of public and private business corporations Formerly: Head of Investment Funds and Private Equity, Overseas Private Investment Corporation; President, First Manhattan Bancorporation, Inc.; Attorney, Simpson Thacher & Bartlett LLP | | 158 | | Vulcan Materials Company (construction materials company); Trilinc Global Impact Fund; Aberdeen Investment Funds (4 portfolios); Artio Global Investment LLC (mutual fund complex); Edgen Group, Inc. (specialized energy and infrastructure products distributor) |
Eli Jones — 1961 Trustee | | 2016 | | Professor and Dean, Mays Business School — Texas A&M University Formerly: Professor and Dean, Walton College of Business, University of Arkansas and E.J. Ourso College of Business, Louisiana State University; Director, Arvest Bank | | 158 | | Insperity, Inc. (formerly known as Administaff) (human resources provider) |
Prema Mathai-Davis — 1950 Trustee | | 1998 | | Retired. | | 158 | | None |
Teresa M. Ressel — 1962 Trustee | | 2017 | | Non-executive director and trustee of a number of public and private business corporations Formerly: Chief Financial Officer, Olayan America, The Olayan Group (international investor/commercial/industrial); Chief Executive Officer, UBS Securities LLC; Group Chief Operating Officer, Americas, UBS AG; Assistant Secretary for Management & Budget and CFO, US Department of the Treasury | | 158 | | Atlantic Power Corporation (power generation company); ON Semiconductor Corp. (semiconductor supplier) |
Ann Barnett Stern — 1957 Trustee | | 2017 | | President and Chief Executive Officer, Houston Endowment Inc. (private philanthropic institution) Formerly: Executive Vice President and General Counsel, Texas Children’s Hospital; Attorney, Beck, Redden and Secrest, LLP; Business Law Instructor, University of St. Thomas; Attorney, Andrews & Kurth LLP | | 158 | | Federal Reserve Bank of Dallas |
Raymond Stickel, Jr. — 1944 Trustee | | 2005 | | Retired. Formerly: Director, Mainstay VP Series Funds, Inc. (25 portfolios); Partner, Deloitte & Touche | | 158 | | None |
Robert C. Troccoli — 1949 Trustee | | 2016 | | Adjunct Professor, University of Denver — Daniels College of Business Formerly: Senior Partner, KPMG LLP | | 158 | | None |
Christopher L. Wilson — 1957 Trustee | | 2017 | | Non-executive director and trustee of a number of public and private business corporations Formerly: Managing Partner, CT2, LLC (investing and consulting firm); President/Chief Executive Officer, Columbia Funds, Bank of America Corporation; President/Chief Executive Officer, CDC IXIS Asset Management Services, Inc.; Principal & Director of Operations, Scudder Funds, Scudder, Stevens & Clark, Inc.; Assistant Vice President, Fidelity Investments | | 158 | | TD Asset Management USA Inc. (mutual fund complex) (22 portfolios); ISO New England, Inc. (non-profit organization managing regional electricity market) |
Invesco V.I. Global Health Care Fund
Trustees and Officers—(continued)
| | | | | | | | |
Name, Year of Birth and
Position(s) Held with the Trust | | Trustee and/
or Officer Since | | Principal Occupation(s)
During Past 5 Years | | Number of
Funds in Fund
Complex
Overseen by
Trustee | | Other Directorship(s)
Held by Trustee During
Past 5 Years |
| Other Officers | | | | | | | | |
Sheri Morris — 1964 President, Principal Executive Officer and Treasurer | | 1999 | | President, Principal Executive Officer and Treasurer, The Invesco Funds; Vice President, Invesco Advisers, Inc. (formerly known as Invesco Institutional (N.A.), Inc.) (registered investment adviser); and Vice President, PowerShares Exchange-Traded Fund Trust, PowerShares Exchange-Traded Fund Trust II, PowerShares India Exchange-Traded Fund Trust, PowerShares Actively Managed Exchange-Traded Fund Trust, PowerShares Actively Managed Exchange-Traded Commodity Fund Trust and PowerShares Exchange-Traded Self-Indexed Fund Trust Formerly: Vice President and Principal Financial Officer, The Invesco Funds; Vice President, Invesco Aim Advisers, Inc., Invesco Aim Capital Management, Inc. and Invesco Aim Private Asset Management, Inc.; Assistant Vice President and Assistant Treasurer, The Invesco Funds and Assistant Vice President, Invesco Advisers, Inc., Invesco Aim Capital Management, Inc. and Invesco Aim Private Asset Management, Inc.; and Treasurer, PowerShares Exchange-Traded Fund Trust, PowerShares Exchange-Traded Fund Trust II, PowerShares India Exchange-Traded Fund Trust and PowerShares Actively Managed Exchange-Traded Fund Trust | | N/A | | N/A |
Russell C. Burk — 1958 Senior Vice President and Senior Officer | | 2005 | | Senior Vice President and Senior Officer, The Invesco Funds | | N/A | | N/A |
John M. Zerr — 1962 Senior Vice President, Chief Legal Officer and Secretary | | 2006 | | Director, Senior Vice President, Secretary and General Counsel, Invesco Management Group, Inc. (formerly known as Invesco AIM Management Group, Inc.); Senior Vice President, Invesco Advisers, Inc. (formerly known as Invesco Institutional (N.A.), Inc.) (registered investment adviser); Senior Vice President and Secretary, Invesco Distributors, Inc. (formerly known as Invesco AIM Distributors, Inc.); Director, Vice President and Secretary, Invesco Investment Services, Inc. (formerly known as Invesco AIM Investment Services, Inc.) Senior Vice President, Chief Legal Officer and Secretary, The Invesco Funds; Managing Director, Invesco PowerShares Capital Management LLC; Director, Secretary and General Counsel, Invesco Investment Advisers LLC (formerly known as Van Kampen Asset Management); Secretary and General Counsel, Invesco Capital Markets, Inc. (formerly known as Van Kampen Funds Inc.) and Chief Legal Officer, PowerShares Exchange-Traded Fund Trust, PowerShares Exchange-Traded Fund Trust II, PowerShares India Exchange-Traded Fund Trust, PowerShares Actively Managed Exchange-Traded Fund Trust, PowerShares Actively Managed Exchange-Traded Commodity Fund Trust and PowerShares Exchange-Traded Self-Indexed Fund Trust; Manager and Secretary, Invesco Indexing LLC Formerly: Director, Secretary, General Counsel and Senior Vice President, Van Kampen Exchange Corp.; Director, Vice President and Secretary, IVZ Distributors, Inc. (formerly known as INVESCO Distributors, Inc.); Director and Vice President, INVESCO Funds Group, Inc.; Director and Vice President, Van Kampen Advisors Inc.; Director, Vice President, Secretary and General Counsel, Van Kampen Investor Services Inc.; Director, Invesco Distributors, Inc. (formerly known as Invesco AIM Distributors, Inc.); Director, Senior Vice President, General Counsel and Secretary, Invesco AIM Advisers, Inc. and Van Kampen Investments Inc.; Director, Vice President and Secretary, Fund Management Company; Director, Senior Vice President, Secretary, General Counsel and Vice President, Invesco AIM Capital Management, Inc.; Chief Operating Officer and General Counsel, Liberty Ridge Capital, Inc. (an investment adviser); Vice President and Secretary, PBHG Funds (an investment company) and PBHG Insurance Series Fund (an investment company); Chief Operating Officer, General Counsel and Secretary, Old Mutual Investment Partners (a broker-dealer); General Counsel and Secretary, Old Mutual Fund Services (an administrator) and Old Mutual Shareholder Services (a shareholder servicing center); Executive Vice President, General Counsel and Secretary, Old Mutual Capital, Inc. (an investment adviser); and Vice President and Secretary, Old Mutual Advisors Funds (an investment company) | | N/A | | N/A |
Gregory G. McGreevey — 1962 Senior Vice President | | 2012 | | Senior Managing Director, Invesco Ltd.; Director, Chairman, President, and Chief Executive Officer, Invesco Advisers, Inc. (formerly known as Invesco Institutional (N.A.), Inc.) (registered investment adviser); Senior Vice President, Invesco Management Group, Inc.; Director, Invesco Mortgage Capital, Inc. and Invesco Senior Secured Management, Inc.; and Senior Vice President, The Invesco Funds Formerly: Assistant Vice President, The Invesco Funds | | N/A | | N/A |
Kelli Gallegos — 1970 Vice President, Principal Financial Officer and Assistant Treasurer | | 2008 | | Vice President, Principal Financial Officer and Assistant Treasurer, The Invesco Funds; Assistant Treasurer, Invesco PowerShares Capital Management LLC, PowerShares Exchange-Traded Fund Trust, PowerShares Exchange-Traded Fund Trust II, PowerShares India Exchange-Traded Fund Trust, PowerShares Actively Managed Exchange-Traded Fund Trust, PowerShares Actively Managed Exchange-Traded Commodity Fund Trust and PowerShares Exchange-Traded Self-Indexed Fund Trust Formerly: Assistant Vice President, The Invesco Funds | | N/A | | N/A |
Invesco V.I. Global Health Care Fund
Trustees and Officers—(continued)
| | | | | | | | |
Name, Year of Birth and
Position(s) Held with the Trust | | Trustee and/
or Officer Since | | Principal Occupation(s)
During Past 5 Years | | Number of
Funds in Fund
Complex
Overseen by
Trustee | | Other Directorship(s)
Held by Trustee During
Past 5 Years |
| Other Officers—(continued) | | | | | | | | |
Tracy Sullivan — 1962 Vice President, Chief Tax Officer and Assistant Treasurer | | 2008 | | Vice President, Chief Tax Officer and Assistant Treasurer, The Invesco Funds; Assistant Treasurer, Invesco PowerShares Capital Management LLC, PowerShares Exchange-Traded Fund Trust, PowerShares Exchange-Traded Fund Trust II, PowerShares India Exchange-Traded Fund Trust, PowerShares Actively Managed Exchange-Traded Fund Trust, PowerShares Actively Managed Exchange-Traded Commodity Fund Trust and PowerShares Exchange-Traded Self-Indexed Fund Trust Formerly: Assistant Vice President, The Invesco Funds | | N/A | | N/A |
Crissie M. Wisdom — 1969 Anti-Money Laundering Compliance Officer | | 2013 | | Anti-Money Laundering Compliance Officer, Invesco Advisers, Inc. (formerly known as Invesco Institutional (N.A.), Inc.) (registered investment adviser), Invesco Capital Markets, Inc. (formerly known as Van Kampen Funds Inc.), Invesco Distributors, Inc., Invesco Investment Services, Inc., Invesco Management Group, Inc., The Invesco Funds, and PowerShares Exchange-Traded Fund Trust, PowerShares Exchange-Traded Fund Trust II, PowerShares India Exchange-Traded Fund Trust, PowerShares Actively Managed Exchange-Traded Fund Trust, PowerShares Actively Managed Exchange-Traded Commodity Fund Trust and PowerShares Exchange-Traded Self-Indexed Fund Trust; Anti-Money Laundering Compliance Officer and Bank Secrecy Act Officer, INVESCO National Trust Company and Invesco Trust Company; and Fraud Prevention Manager and Controls and Risk Analysis Manager for Invesco Investment Services, Inc. Formerly: Anti-Money Laundering Compliance Officer, Van Kampen Exchange Corp. | | N/A | | N/A |
Robert R. Leveille — 1969 Chief Compliance Officer | | 2016 | | Chief Compliance Officer, Invesco Advisers, Inc. (registered investment adviser); and Chief Compliance Officer, The Invesco Funds Formerly: Chief Compliance Officer, Putnam Investments and the Putnam Funds | | N/A | | N/A |
The Statement of Additional Information of the Trust includes additional information about the Fund’s Trustees and is available upon request, without charge, by calling 1.800.959.4246. Please refer to the Fund’s Statement of Additional Information for information on the Fund’s sub-advisers.
| | | | | | |
Office of the Fund 11 Greenway Plaza, Suite 1000 Houston, TX 77046-1173 | | Investment Adviser Invesco Advisers, Inc. 1555 Peachtree Street, N.E. Atlanta, GA 30309 | | Distributor Invesco Distributors, Inc. 11 Greenway Plaza, Suite 1000 Houston, TX 77046-1173 | | Auditors PricewaterhouseCoopers LLP 1000 Louisiana Street, Suite 5800 Houston, TX 77002-5678 |
| | | |
| | | | | | |
Counsel to the Fund Stradley Ronon Stevens & Young, LLP 2005 Market Street, Suite 2600 Philadelphia, PA 19103-7018 | | Counsel to the Independent Trustees Goodwin Procter LLP 901 New York Avenue, N.W. Washington, D.C. 20001 | | Transfer Agent Invesco Investment Services, Inc. 11 Greenway Plaza, Suite 1000 Houston, TX 77046-1173 | | Custodian State Street Bank and Trust Company 225 Franklin Street Boston, MA 02110-2801 |
Invesco V.I. Global Health Care Fund
| | | | |
| | |
 | | Annual Report to Shareholders | | December 31, 2017 |
| | |
| | Invesco V.I. Global Real Estate Fund |

| | |
| | The Fund provides a complete list of its holdings four times in each fiscal year, at the quarter-ends. For the second and fourth quarters, the lists appear in the Fund’s semiannual and annual reports to shareholders. For the first and third quarters, the Fund files the lists with the Securities and Exchange Commission (SEC) on Form N-Q. The Fund’s Form N-Q filings are available on the SEC website, sec.gov. Copies of the Fund’s Forms N-Q may be reviewed and copied at the SEC Public Reference Room in Washington, D.C. You can obtain information on the operation of the Public Reference Room, including information about duplicating fee charges, by calling 202 551 8090 or 800 732 0330, or by electronic request at the following email address: publicinfo@sec.gov. The SEC file numbers for the Fund are 811-07452 and 033-57340. The Fund’s most recent portfolio holdings, as filed on Form N-Q, have also been made available to insurance companies issuing variable annuity contracts and variable life insurance policies (“variable products”) that invest in the Fund. A description of the policies and procedures that the Fund uses to determine how to vote proxies relating to portfolio securities is available without charge, upon request, from our Client Services department at 800 959 4246 or at invesco.com/proxyguidelines. The information is also available on the SEC website, sec.gov. Information regarding how the Fund voted proxies related to its portfolio securities during the most recent 12-month period ended June 30 is available at invesco.com/ proxysearch. The information is also available on the SEC website, sec.gov. Invesco Advisers, Inc. is an investment adviser; it provides investment advisory services to individual and institutional clients and does not sell securities. Invesco Distributors, Inc. is the US distributor for Invesco Ltd.’s retail mutual funds, exchange-traded funds and institutional money market funds. Both are wholly owned, indirect subsidiaries of Invesco Ltd. This report must be accompanied or preceded by a currently effective Fund prospectus and variable product prospectus, which contain more complete information, including sales charges and expenses. Investors should read each carefully before investing. NOT FDIC INSURED | MAY LOSE VALUE | NO BANK GUARANTEE |
| |
| | Invesco Distributors, Inc. VIGRE-AR-1 02082018 1425 |
Management’s Discussion of Fund Performance
Performance summary
For the year ended December 31, 2017, Series I shares of Invesco V.I. Global Real Estate Fund (the Fund) underperformed the Fund’s style-specific benchmark, the Custom Invesco Global Real Estate Index.
Your Fund’s long-term performance appears later in this report.
Fund vs. Indexes
Total returns, 12/31/16 to 12/31/17, excluding variable product issuer charges.
If variable product issuer charges were included, returns would be lower.
| | | | | |
| Series I Shares | | | | 13.05 | % |
| Series II Shares | | | | 12.73 | |
| MSCI World Index▼ (Broad Market Index) | | | | 22.40 | |
| Custom Invesco Global Real Estate Index∎ (Style-Specific Index) | | | | 13.99 | |
| Lipper VUF Real Estate Funds Classification Average◆ (Peer Group) | | | | 5.45 | |
Source(s): ▼FactSet Research Systems Inc.; ∎Invesco, FactSet Research Systems Inc.; ◆Lipper Inc. | | | | | |
Market conditions and your Fund
Global equity markets delivered positive, and in many cases double-digit, returns over the year ended December 31, 2017. These gains were driven by firming global economic growth, as well as stronger corporate fundamentals. After trailing international markets for the first three quarters of the year, the US equity market outperformed international markets in the fourth quarter. US equity markets received a boost from the prospect of sweeping individual and corporate tax cuts, with a final tax bill approved by Congress in December.
In developed markets, the US Federal Reserve (the Fed) met in December and increased the benchmark fed funds target rate by 0.25% to a target range of 1.25% to 1.50%. Combined with two earlier interest rate increases in 2017, the Fed’s decision reflected a more constructive outlook for the US economy. In contrast, the European Central Bank held rates steady at 0% throughout 2017 and maintained its generous bond buying program through at least September 2018,
or beyond, until it sees a sustained adjustment in the rate of inflation.
Most emerging markets continued to perform well during 2017. In addition to the improving global economic outlook, other tailwinds included reduced expectations for a major shift in US trade policy as well as stronger oil prices. Oil prices moved higher on production restraint by OPEC and Russia, benefiting commodity-driven emerging markets.
From a real estate investment perspective, the slowing application or slow normalization of monetary stimulus has proved supportive of the asset class. The world sought real assets and income in 2017. Capital flows and allocations to real estate remained very positive in 2017. However, the current real estate investment cycle is now nearly a decade old and, as such, is maturing. This suggests lower levels of rental growth and an environment in which better business models are likely to deliver better performance. New construction, which can become an issue in the maturing phase of a real estate investment cycle, is still under control in most parts of the world and
most landlords continue to retain some degree of pricing power. Further, the real estate sector ended 2017 trading, on average, at a small discount to net asset value, which is slightly wider than long term average.
Key contributors to the Fund’s performance versus its style-specific bench-mark included security selection in the US and the UK. Overweight exposure to Germany and Ireland, security selection in Canada and the United Arab Emirates, as well as underweight exposure in Turkey and Mexico, also contributed to the Fund’s relative return.
Primary detractors from relative Fund performance included security selection in Japan, Hong Kong and India. A lack of holdings in Austria and a combination of security selection and overweight exposure in France and Australia also detracted from the Fund’s relative return. Security selection and underweight exposure in China also detracted.
Top contributors to the Fund’s absolute performance included Vonovia and Prologis. Vonovia has exposure to favorable supply and demand fundamentals for residential assets in Germany and was expected to generate above-average growth. Prologis owns a portfolio of high quality industrial assets that are primarily located in global gateway markets. We believed Prologis would post above-average cash flow growth driven by favorable industrial fundamentals and a robust development pipeline.
Top detractors from the Fund’s absolute performance included Mitsubishi Estate and Brixmor Property Group. Mitsubishi Estate owns and develops a high-quality portfolio of primarily office assets in central Tokyo – assets we believed may benefit from healthy and growing demand. Brixmor Property
| | | | | |
| Portfolio Composition |
By country | % of total net assets | | |
| |
| United States | | | | 46.4% | |
| Japan | | | | 8.9 | |
| Hong Kong | | | | 7.6 | |
| China | | | | 5.4 | |
| Australia | | | | 4.9 | |
| Germany | | | | 4.5 | |
| United Kingdom | | | | 4.5 | |
| France | | | | 3.7 | |
| Canada | | | | 2.6 | |
| Singapore | | | | 2.2 | |
| Countries each with less than 2% of portfolio | | | | 8.3 | |
Money Market Funds Plus Other Assets Less Liabilities | | | | 1.0 | |
| | |
| Top 10 Equity Holdings* |
% of total net assets |
| |
1. Simon Property Group, Inc. | | 3.2% |
2. Prologis, Inc. | | 2.5 |
3. Boston Properties, Inc. | | 2.4 |
4. Public Storage | | 2.3 |
5. Mitsui Fudosan Co., Ltd. | | 2.0 |
6. Equity Residential | | 1.9 |
7. Unibail-Rodamco S.E. | | 1.9 |
8. Scentre Group | | 1.8 |
9. Vonovia S.E. | | 1.7 |
10. Sun Hung Kai Properties Ltd. | | 1.7 |
| | |
| Total Net Assets | | $418.3 million |
| |
| Total Number of Holdings* | | 167 |
The Fund’s holdings are subject to change, and there is no assurance that the Fund will continue to hold any particular security.
*Excluding money market fund holdings.
Data presented here are as of December 31, 2017.
Invesco V.I. Global Real Estate Fund
Group, which owns shopping centers across the US, was trading at an attractive valuation relative to peers and was expected to deliver above-average cash flow and earnings growth.
Significant purchases during the year included a new position in New World Development, a major developer of residential and commercial properties in Hong Kong and China. We reduced our previously overweight position in Simon Property Group following strong performance among Class A regional mall companies given greater attention from private equity investors and activists.
At the close of the year, the Fund had a modest underweight allocation to the US relative to its style-specific benchmark. In the US, the Fund remained focused on companies with above-average cash flow growth rates, stronger balance sheets and reasonable valuations. This was reflected in our overweight exposure to the infrastructure, single family rental and data center sectors.
At the close of the year, the Fund had a moderate underweight position in the Asia Pacific region, with a focus on stocks with company-specific catalysts and favorable local relative values. In Japan, we reduced our exposure to Japanese Real Estate Investment Trusts, as their share price performance continued to be impacted by capital outflows. The Fund held an overweight allocation to Japanese developers, but rotated weightings between holdings after changes in relative value opportunities.
The Fund ended 2017 with small overweight exposure to the European region. Key overweight exposures included the German residential and Irish office sectors due to their greater fundamental opportunities. The Fund was overweight in France, where we saw favorable yields and valuations, particularly in the stocks of high-quality mall landlords. The Fund’s largest underweight exposures in the region included UK large-cap real estate investment trusts (REITs), with their diversified office and retail asset exposures, as well as Belgium and Austria, where fundamentals were weaker.
Systematic factors have been key drivers of real estate performance in recent years. We do not believe these drivers will disappear in 2018, but we do believe that market performance may be more affected by fundamental and stock-specific factors. We believe that different levels of cyclical maturity and policy and political activity are expected to impact specific fundamental paths for real estate and localized market pricing of listed real estate in the year ahead.
In Asia, we believe real estate demand improvement is likely to continue on the back of synchronized global economic recovery. Brexit still presents an uncertain growth path for the UK. We expect some fundamental decline in 2018, although many low-leveraged UK REITs seem priced to reflect this. In continental Europe, economic growth is expected to be maintained with a slowdown in quantitative easing likely to allow bond yields to slowly rise. The potential for political surprises remains high in Europe; however, we anticipate 2018 should be more stable than recent years. In North America, property market fundamentals are expected to remain positive but growth is likely to decelerate as supply has begun to meet demand levels in many markets and sectors. Non-traditional sectors, such as infrastructure and data centers, offer the best prospects for growth as demand continues to outpace new supply, we believe.
Overall, throughout the year, we maintained a bias toward sectors with better relative growth prospects, companies with higher-quality assets, supply-constrained real estate markets and companies with generally lower-leveraged balance sheets. In an environment in which risk-free rates may continue to modestly rise over the mid-term, we maintained a bias toward companies with above-average earnings growth prospects.
We thank you for your continued investment in Invesco V.I. Global Real Estate Fund.
The views and opinions expressed in management’s discussion of Fund performance are those of Invesco Advisers, Inc. These views and opinions are subject to change at any time based on factors such as market and economic conditions. These views and opinions may not be relied upon as investment advice or recommendations, or as an offer for a particular security. The information is not a complete analysis of every aspect of any market, country, industry, security or the Fund. Statements of fact are from sources considered reliable, but Invesco Advisers, Inc. makes no representation or warranty as to their completeness or accuracy. Although historical performance is no guarantee of future results, these insights may help you understand our investment management philosophy.
See important Fund and, if applicable, index disclosures later in this report.
| | |
 | | Joe Rodriguez, Jr. Portfolio Manager, is lead manager of Invesco V.I. Global Real Estate Fund. He is Head of Global Securities |
| with Invesco Real Estate, where he oversees all phases of the unit, including securities research and administration. Mr. Rodriguez joined Invesco in 1990. He earned a BBA in economics and finance and an MBA in finance from Baylor University. |
| | |
 | | Mark Blackburn Chartered Financial Analyst, Portfolio Manager, is manager of Invesco V.I. Global Real Estate Fund. He joined |
| Invesco in 1998. Mr. Blackburn earned a BS in accounting from Louisiana State University and an MBA from Southern Methodist University. He is also a Certified Public Accountant. |
| | |
 | | James Cowen Portfolio Manager, is manager of Invesco V.I. Global Real Estate Fund. He joined Invesco in 2000. Mr. Cowen |
| earned a Master of Town and Country Planning degree from the University of Manchester and a Master of Philosophy degree in land economy from Cambridge University. |
| | |
 | | Paul Curbo Chartered Financial Analyst, Portfolio Manager, is manager of Invesco V.I. Global Real Estate Fund. He joined |
| Invesco in 1998. Mr. Curbo earned a BBA in finance from The University of Texas at Austin. |
| | |
 | | Darin Turner Portfolio Manager, is manager of Invesco V.I. Global Real Estate Fund. He joined Invesco in 2005. Mr. Turner |
| earned a BBA in finance from Baylor University, an MS in real estate from The University of Texas at Arlington and an MBA specializing in investments from Southern Methodist University. |
| | |
 | | Ping-Ying Wang Chartered Financial Analyst, Portfolio Manager, is manager of Invesco V.I. Global Real Estate Fund. She joined |
| Invesco in 1998. Ms. Wang earned a BS in international finance from the People’s University of China and a PhD in finance from The University of Texas at Dallas. |
Invesco V.I. Global Real Estate Fund
Your Fund’s Long-Term Performance
Results of a $10,000 Investment – Oldest Share Class(es)
Fund and index data from 12/31/07

| 2 | Source: FactSet Research Systems Inc. |
| 3 | Source(s): Invesco, FactSet Research Systems Inc. |
Past performance cannot guarantee
comparable future results.
| | | | | |
| Average Annual Total Returns |
As of 12/31/17 | | | | | |
| |
| Series I Shares | | | | | |
| Inception (3/31/98) | | | | 8.01 | % |
| 10 Years | | | | 3.21 | |
| 5 Years | | | | 6.00 | |
| 1 Year | | | | 13.05 | |
| |
| Series II Shares | | | | | |
| Inception (4/30/04) | | | | 8.00 | % |
| 10 Years | | | | 2.96 | |
| 5 Years | | | | 5.72 | |
| 1 Year | | | | 12.73 | |
The performance of the Fund’s Series I and Series II share classes will differ primarily due to different class expenses.
The performance data quoted represent past performance and cannot guarantee comparable future results; current performance may be lower or higher. Please contact your variable product issuer or financial adviser for the most recent month-end variable product performance. Performance
figures reflect Fund expenses, reinvested distributions and changes in net asset value. Investment return and principal value will fluctuate so that you may have a gain or loss when you sell shares.
The total annual Fund operating expense ratio set forth in the most recent Fund prospectus as of the date of this report for Series I and Series II shares was 1.01% and 1.26%, respectively. The expense ratios presented above may vary from the expense ratios presented in other sections of this report that are based on expenses incurred during the period covered by this report.
Invesco V.I. Global Real Estate Fund, a series portfolio of AIM Variable Insurance Funds (Invesco Variable Insurance Funds), is currently offered through insurance companies issuing variable products. You cannot purchase shares of the Fund directly.
Performance figures given represent the Fund and are not intended to reflect actual variable product values. They do not reflect sales charges, expenses and fees assessed in connection with a variable product. Sales charges, expenses and fees, which are determined by the variable product issuers, will vary and will lower the total return.
The most recent month-end performance at the Fund level, excluding variable product charges, is available at 800 451 4246. As mentioned above, for the most recent month-end performance including variable product charges, please contact your variable product issuer or financial adviser.
Fund performance reflects any applicable fee waivers and/or expense reimbursements. Had the adviser not waived fees and/or reimbursed expenses currently or in the past, returns would have been lower. See current prospectus for more information.
Invesco V.I. Global Real Estate Fund
Invesco V.I. Global Real Estate Fund’s investment objective is total return through growth of capital and current income.
| ∎ | | Unless otherwise stated, information presented in this report is as of December 31, 2017, and is based on total net assets. |
| ∎ | | Unless otherwise noted, all data provided by Invesco. |
Principal risks of investing in the Fund
Convertible securities risk. The market values of convertible securities are affected by market interest rates, the risk of actual issuer default on interest or principal payments and the value of the underlying common stock into which the convertible security may be converted. Additionally, a convertible security is subject to the same types of market and issuer risks as apply to the underlying common stock. In addition, certain convertible securities are subject to involuntary conversions and may undergo principal write-downs upon the occurrence of certain triggering events, and, as a result, are subject to an increased risk of loss. Convertible securities may be rated below investment grade.
Debt securities risk. The prices of debt securities held by the Fund will be affected by changes in interest rates, the creditworthiness of the issuer and other factors. An increase in prevailing interest rates typically causes the value of existing debt securities to fall and often has a greater impact on longer-duration debt securities and higher quality debt securities. Falling interest rates will cause the Fund to reinvest the proceeds of debt securities that have been repaid by the issuer at lower interest rates. Falling interest rates may also reduce the Fund’s distributable income because interest payments on floating rate debt instruments held by the Fund will decline. The Fund could lose money on investments in debt securities if the issuer or borrower fails to meet its obligations to make interest payments and/or to repay principal in a timely manner. Changes in an issuer’s financial strength, the market’s perception of such strength or in the credit rating of the issuer or the security may affect the value of debt securities. The Adviser’s credit analysis may fail to anticipate such changes, which could result in buying a debt security at an inopportune time or failing to sell a debt security in advance of a price decline or other credit event.
Derivatives risk. The value of a derivative instrument depends largely on (and is derived from) the value of an underlying security, currency, commodity, interest rate, index or other asset (each referred to as an underlying asset). In addition to risks relating to the underlying
assets, the use of derivatives may include other, possibly greater, risks, including counterparty, leverage and liquidity risks. Counterparty risk is the risk that the counterparty to the derivative contract will default on its obligation to pay the Fund the amount owed or otherwise perform under the derivative contract. Derivatives create leverage risk because they do not require payment up front equal to the economic exposure created by owning the derivative. As a result, an adverse change in the value of the underlying asset could result in the Fund sustaining a loss that is substantially greater than the amount invested in the derivative, which may make the Fund’s returns more volatile and increase the risk of loss. Derivative instruments may also be less liquid than more traditional investments and the Fund may be unable to sell or close out its derivative positions at a desirable time or price. This risk may be more acute under adverse market conditions, during which the Fund may be most in need of liquidating its derivative positions. Derivatives may also be harder to value, less tax efficient and subject to changing government regulation that could impact the Fund’s ability to use certain derivatives or their cost. Also, derivatives used for hedging or to gain or limit exposure to a particular market segment may not provide the expected benefits, particularly during adverse market conditions.
Emerging markets securities risk. Emerging markets (also referred to as developing markets) are generally subject to greater market volatility, political, social and economic instability, uncertain trading markets and more governmental limitations on foreign investment than more developed markets. In addition, companies operating in emerging markets may be subject to lower trading volume and greater price fluctuations than companies in more developed markets. Securities law and the enforcement of systems of taxation in many emerging market countries may change quickly and unpredictably. In addition, investments in emerging markets securities may also be subject to additional transaction costs, delays in settlement procedures, and lack of timely information.
Foreign securities risk. The Fund’s foreign investments may be adversely
affected by political and social instability, changes in economic or taxation policies, difficulty in enforcing obligations, decreased liquidity or increased volatility. Foreign investments also involve the risk of the possible seizure, nationalization or expropriation of the issuer or foreign deposits (in which the Fund could lose its entire investments in a certain market) and the possible adoption of foreign governmental restrictions such as exchange controls. Unless the Fund has hedged its foreign securities risk, foreign securities risk also involves the risk of negative foreign currency rate fluctuations, which may cause the value of securities denominated in such foreign currency (or other instruments through which the Fund has exposure to foreign currencies) to decline in value. Currency exchange rates may fluctuate significantly over short periods of time. Currency hedging strategies, if used, are not always successful.
Geographic focus risk. The Fund may from time to time invest a substantial amount of its assets in securities of issuers located in a single country or a limited number of countries. Adverse economic, political or social conditions in those countries may therefore have a significant negative impact on the Fund’s investment performance.
High yield debt securities (junk bond) risk. Investments in high yield debt securities (“junk bonds”) and other lower-rated securities will subject the Fund to substantial risk of loss. These securities are considered to be speculative with respect to the issuer’s ability to pay interest and principal when due, are more susceptible to default or decline in market value and are less liquid than investment grade debt securities. Prices of high yield debt securities tend to be very volatile.
Management risk. The Fund is actively managed and depends heavily on the Adviser’s judgment about markets, interest rates or the attractiveness, relative values, liquidity, or potential appreciation of particular investments made for the Fund’s portfolio. The Fund could experience losses if these judgments prove to be incorrect. Additionally, legislative, regulatory, or tax developments may adversely affect management of the Fund and, therefore, the ability of the Fund to achieve its investment objective.
Invesco V.I. Global Real Estate Fund
Market risk. The market values of the Fund’s investments, and therefore the value of the Fund’s shares, will go up and down, sometimes rapidly or unpredictably. Market risk may affect a single issuer, industry or section of the economy, or it may affect the market as a whole. Individual stock prices tend to go up and down more dramatically than those of certain other types of investments, such as bonds. During a general downturn in the financial markets, multiple asset classes may decline in value. When markets perform well, there can be no assurance that specific investments held by the Fund will rise in value.
Mortgage- and asset-backed securities risk. Mortgage- and asset-backed securities, including collateralized debt obligations and collateralized mortgage obligations, are subject to prepayment or call risk, which is the risk that a borrower’s payments may be received earlier or later than expected due to changes in prepayment rates on underlying loans. This could result in the Fund reinvesting these early payments at lower interest rates, thereby reducing the Fund’s income. Mortgage- and asset-backed securities also are subject to extension risk, which is the risk that an unexpected rise in interest rates could reduce the rate of prepayments, causing the price of the mortgage- and asset-backed securities and the Fund’s share price to fall. An unexpectedly high rate of defaults on the mortgages held by a mortgage pool may adversely affect the value of mortgage-backed securities and could result in losses to the Fund. The Fund may invest in mortgage pools that include subprime mortgages, which are loans made to borrowers with weakened credit histories or with lower capacity to make timely payments on their mortgages. Privately issued mortgage-related securities are not subject to the same underwriting requirements as those with government or government-sponsored entity guarantees and, therefore, mortgage loans underlying privately issued mortgage-related securities may have less favorable collateral, credit risk or other underwriting characteristics, and wider variances in interest rate, term, size, purpose and borrower characteristics.
Preferred securities risk. Preferred securities are subject to issuer-specific and market risks applicable generally to equity securities. Preferred securities also may be subordinated to bonds or other debt instruments, subjecting them to a greater risk of non-payment, may be less liquid than many other securities, such as common stocks, and generally offer no
voting rights with respect to the issuer.
REIT risk/real estate risk. The Fund concentrates its investments in the securities of real estate and real estate related companies. Investments in real estate related instruments may be affected by economic, legal, cultural, environmental or technological factors that affect property values, rents or occupancies of real estate related to the Fund’s holdings. Shares of real estate related companies, which tend to be small- and mid-cap companies, may be more volatile and less liquid than larger companies. If a real estate related company defaults on certain types of debt obligations, the Fund may own real estate directly, which involves additional risks such as environmental liabilities; difficulty in valuing and selling the real estate; and economic or regulatory changes.
Short position risk. Because the Fund’s potential loss on a short position arises from increases in the value of the asset sold short, the Fund will incur a loss on a short position, which is theoretically unlimited, if the price of the asset sold short increases from the short sale price. The counterparty to a short position or other market factors may prevent the Fund from closing out a short position at a desirable time or price and may reduce or eliminate any gain or result in a loss. In a rising market, the Fund’s short positions will cause the Fund to underperform the overall market and its peers that do not engage in shorting. If the Fund holds both long and short positions, and both positions decline simultaneously, the short positions will not provide any buffer (hedge) from declines in value of the Fund’s long positions. Certain types of short positions involve leverage, which may exaggerate any losses, potentially more than the actual cost of the investment, and will increase the volatility of the Fund’s returns.
Small- and mid-capitalization companies risks. Small- and mid-capitalization companies tend to be more vulnerable to changing market conditions, may have little or no operating history or track record of success, and may have more limited product lines and markets, less experienced management and fewer financial resources than larger companies. These companies’ securities may be more volatile and less liquid than those of more established companies, and their returns may vary, sometimes significantly, from the overall securities market.
About indexes used in this report
The MSCI World IndexSM is an unmanaged index considered representative of stocks of developed countries. The index is computed
using the net return, which withholds applicable taxes for non-resident investors.
The Custom Invesco Global Real Estate Index is composed of the FTSE EPRA/NAREIT Developed Index (gross) from Fund inception through February, 17, 2005; the FTSE EPRA/NAREIT Developed Index (net) from February 18, 2005, through June 30, 2014; and the FTSE EPRA/NAREIT Global Index (net) from July 1, 2014.
The Lipper VUF Real Estate Funds Classification Average represents an average of all variable insurance underlying funds in the Lipper Real Estate Funds classification.
The FTSE EPRA/NAREIT Developed Index is an unmanaged index considered representative of listed real estate companies and REITs worldwide.
The FTSE EPRA/NAREIT Global Index is a free float, market capitalization weighted real estate index designed to represent publicly traded equity REITs and listed property companies in 38 countries worldwide, covering both developed and emerging markets.
The Fund is not managed to track the performance of any particular index, including the index(es) described here, and consequently, the performance of the Fund may deviate significantly from the performance of the index(es).
A direct investment cannot be made in an index. Unless otherwise indicated, index results include reinvested dividends, and they do not reflect sales charges. Performance of the peer group, if applicable, reflects fund expenses; performance of a market index does not.
Other information
CPA® and Certified Public Accountant® are trademarks owned by the American Institute of Certified Public Accountants.
The returns shown in management’s discussion of Fund performance are based on net asset values calculated for shareholder transactions. Generally accepted accounting principles require adjustments to be made to the net assets of the Fund at period end for financial reporting purposes, and as such, the net asset values for shareholder transactions and the returns based on those net asset values may differ from the net asset values and returns reported in the Financial Highlights. Additionally, the returns and net asset values shown throughout this report are at the Fund level only and do not include variable product issuer charges. If such charges were included, the total returns would be lower.
Invesco V.I. Global Real Estate Fund
Schedule of Investments
December 31, 2017
| | | | | | | | |
| | | Shares | | | Value | |
Real Estate Investment Trust, Common Stocks & Other Equity Interests–98.98% | |
| Australia–4.92% | |
Dexus | | | 303,505 | | | $ | 2,304,767 | |
Goodman Group | | | 660,102 | | | | 4,326,775 | |
GPT Group (The) | | | 674,106 | | | | 2,683,396 | |
Mirvac Group | | | 1,215,653 | | | | 2,222,368 | |
Scentre Group | | | 2,319,270 | | | | 7,568,256 | |
Westfield Corp. | | | 202,013 | | | | 1,495,724 | |
| | | | | | | | 20,601,286 | |
|
| Brazil–0.65% | |
BR Malls Participacoes S.A. | | | 325,525 | | | | 1,250,999 | |
BR Properties S.A. | | | 140,400 | | | | 449,280 | |
MRV Engenharia e Participacoes S.A. | | | 124,900 | | | | 567,093 | |
Multiplan Empreendimentos Imobiliarios S.A. | | | 21,600 | | | | 462,322 | |
| | | | | | | | 2,729,694 | |
|
| Canada–2.57% | |
Allied Properties REIT | | | 71,600 | | | | 2,397,110 | |
Canadian Apartment Properties REIT | | | 61,703 | | | | 1,832,092 | |
Chartwell Retirement Residences | | | 101,096 | | | | 1,307,838 | |
H&R REIT | | | 86,600 | | | | 1,471,697 | |
Killam Apartment REIT | | | 93,300 | | | | 1,055,554 | |
RioCan REIT | | | 105,600 | | | | 2,046,635 | |
SmartCentres REIT | | | 25,500 | | | | 627,102 | |
| | | | | | | | 10,738,028 | |
|
| Chile–0.11% | |
Parque Arauco S.A. | | | 148,621 | | | | 460,476 | |
|
| China–5.41% | |
Agile Group Holdings Ltd. | | | 576,000 | | | | 874,369 | |
CapitaLand Retail China Trust | | | 213,700 | | | | 258,837 | |
China Evergrande Group(a) | | | 766,000 | | | | 2,623,443 | |
China Jinmao Holdings Group Ltd. | | | 1,820,000 | | | | 798,434 | |
China Overseas Land & Investment Ltd. | | | 766,000 | | | | 2,465,781 | |
China Resources Land Ltd. | | | 446,444 | | | | 1,311,153 | |
China Vanke Co., Ltd.–Class H | | | 374,200 | | | | 1,490,076 | |
CIFI Holdings (Group) Co. Ltd. | | | 1,358,000 | | | | 816,021 | |
Country Garden Holdings Co. Ltd. | | | 1,680,000 | | | | 3,192,138 | |
Guangzhou R&F Properties Co. Ltd.–Class H | | | 533,600 | | | | 1,203,398 | |
KWG Property Holding Ltd. | | | 585,000 | | | | 680,588 | |
Logan Property Holdings Co. Ltd. | | | 558,000 | | | | 575,025 | |
Longfor Properties Co. Ltd. | | | 613,500 | | | | 1,537,500 | |
Shenzhen Investment Ltd. | | | 579,900 | | | | 239,963 | |
Shimao Property Holdings Ltd. | | | 704,000 | | | | 1,531,826 | |
SOHO China Ltd. | | | 703,500 | | | | 411,498 | |
Sunac China Holdings Ltd. | | | 544,000 | | | | 2,242,414 | |
Yanlord Land Group Ltd. | | | 300,500 | | | | 363,970 | |
| | | | | | | | 22,616,434 | |
| | | | | | | | |
| | | Shares | | | Value | |
| France–3.67% | |
ICADE | | | 23,683 | | | $ | 2,328,030 | |
Klepierre S.A. | | | 112,488 | | | | 4,948,422 | |
Unibail-Rodamco S.E. | | | 31,996 | | | | 8,061,648 | |
| | | | | | | | 15,338,100 | |
|
| Germany–4.52% | |
Deutsche Wohnen S.E | | | 64,341 | | | | 2,805,211 | |
Grand City Properties S.A. | | | 223,118 | | | | 5,247,831 | |
LEG Immobilien AG | | | 31,305 | | | | 3,573,022 | |
Vonovia S.E. | | | 147,444 | | | | 7,298,195 | |
| | | | | | | | 18,924,259 | |
|
| Hong Kong–7.59% | |
CK Asset Holdings Ltd. | | | 539,800 | | | | 4,718,906 | |
Hang Lung Properties Ltd. | | | 1,160,000 | | | | 2,830,786 | |
Hongkong Land Holdings Ltd. | | | 267,400 | | | | 1,880,322 | |
Kerry Properties Ltd. | | | 145,500 | | | | 654,600 | |
Link REIT | | | 460,500 | | | | 4,270,274 | |
New World Development Co. Ltd. | | | 3,046,000 | | | | 4,577,051 | |
Sun Hung Kai Properties Ltd. | | | 432,000 | | | | 7,196,140 | |
Swire Properties Ltd. | | | 782,000 | | | | 2,522,290 | |
Wharf (Holdings) Ltd. (The) | | | 306,000 | | | | 1,057,482 | |
Wharf Real Estate Investment Co. Ltd.(a) | | | 305,000 | | | | 2,029,976 | |
| | | | | | | | 31,737,827 | |
|
| India–0.16% | |
Ascendas India Trust | | | 776,700 | | | | 667,817 | |
|
| Indonesia–0.50% | |
PT Bumi Serpong Damai Tbk | | | 224,000 | | | | 28,093 | |
PT Ciputra Development Tbk | | | 18,352,838 | | | | 1,604,435 | |
PT Pakuwon Jati Tbk | | | 8,840,100 | | | | 446,733 | |
| | | | | | | | 2,079,261 | |
|
| Ireland–0.39% | |
Green REIT PLC | | | 871,704 | | | | 1,626,329 | |
|
| Japan–8.87% | |
Activia Properties, Inc. | | | 227 | | | | 949,929 | |
Advance Residence Investment Corp. | | | 392 | | | | 964,083 | |
AEON REIT Investment Corp. | | | 803 | | | | 844,550 | |
Daiwa House REIT Investment Corp. | | | 380 | | | | 902,867 | |
Daiwa Office Investment Corp. | | | 397 | | | | 2,092,997 | |
Fukuoka REIT Corp. | | | 204 | | | | 304,542 | |
GLP J-REIT(b) | | | 213 | | | | 230,160 | |
GLP J-REIT | | | 1,665 | | | | 1,799,137 | |
Hulic Co., Ltd. | | | 178,100 | | | | 1,993,784 | |
Hulic Reit, Inc. | | | 607 | | | | 883,536 | |
Japan Hotel REIT Investment Corp. | | | 3,336 | | | | 2,238,410 | |
Japan Logistics Fund Inc. | | | 318 | | | | 586,495 | |
Japan Real Estate Investment Corp. | | | 475 | | | | 2,255,481 | |
Mitsubishi Estate Co., Ltd. | | | 304,900 | | | | 5,297,990 | |
See accompanying Notes to Financial Statements which are an integral part of the financial statements.
Invesco V.I. Global Real Estate Fund
| | | | | | | | |
| | | Shares | | | Value | |
| Japan–(continued) | |
Mitsui Fudosan Co., Ltd. | | | 378,800 | | | $ | 8,489,128 | |
Mitsui Fudosan Logistics Park Inc. | | | 119 | | | | 377,677 | |
Nippon Building Fund Inc. | | | 325 | | | | 1,589,376 | |
Sumitomo Realty & Development Co., Ltd. | | | 109,000 | | | | 3,577,836 | |
Tokyo Tatemono Co., Ltd. | | | 127,900 | | | | 1,725,835 | |
| | | | | | | | 37,103,813 | |
|
| Malaysia–0.45% | |
IOI Properties Group Bhd. | | | 1,274,700 | | | | 582,774 | |
KLCCP Stapled Group | | | 254,600 | | | | 543,616 | |
Mah Sing Group Bhd. | | | 2,091,500 | | | | 749,456 | |
| | | | | | | | 1,875,846 | |
|
| Malta–0.00% | |
BGP Holdings PLC
(Acquired 08/06/2009; Cost $0)(a)(b)(c) | | | 3,053,090 | | | | 0 | |
|
| Mexico–0.49% | |
Fibra Uno Administracion S.A. de C.V. | | | 855,700 | | | | 1,266,327 | |
Macquarie Mexico Real Estate Management S.A. de C.V. | | | 556,200 | | | | 586,558 | |
PLA Administradora Industrial, S. de R.L. de C.V. | | | 132,000 | | | | 200,178 | |
| | | | | | | | 2,053,063 | |
|
| Philippines–0.87% | |
Ayala Land, Inc. | | | 1,764,100 | | | | 1,574,671 | |
Robinsons Land Corp. | | | 1,417,500 | | | | 604,487 | |
SM Prime Holdings Inc. | | | 1,936,200 | | | | 1,456,520 | |
| | | | | | | | 3,635,678 | |
|
| Singapore–2.22% | |
Ascendas REIT | | | 919,700 | | | | 1,870,343 | |
CapitaLand Mall Trust | | | 864,300 | | | | 1,376,418 | |
City Developments Ltd. | | | 461,800 | | | | 4,294,465 | |
Mapletree Commercial Trust | | | 502,500 | | | | 608,636 | |
UOL Group Ltd. | | | 173,000 | | | | 1,147,297 | |
| | | | | | | | 9,297,159 | |
|
| South Africa–1.01% | |
Growthpoint Properties Ltd. | | | 906,443 | | | | 2,026,430 | |
Hyprop Investments Ltd. | | | 120,503 | | | | 1,142,444 | |
SA Corporate Real Estate Ltd. | | | 2,709,555 | | | | 1,053,373 | |
| | | | | | | | 4,222,247 | |
|
| Spain–0.67% | |
Inmobiliaria Colonial SOCIMI, S.A. | | | 115,486 | | | | 1,145,206 | |
Merlin Properties SOCIMI, S.A. | | | 123,491 | | | | 1,671,813 | |
| | | | | | | | 2,817,019 | |
|
| Sweden–1.44% | |
Castellum AB | | | 126,010 | | | | 2,125,178 | |
Hufvudstaden AB–Class A | | | 151,661 | | | | 2,426,776 | |
Wihlborgs Fastigheter AB | | | 62,030 | | | | 1,481,922 | |
| | | | | | | | 6,033,876 | |
| | | | | | | | |
| | | Shares | | | Value | |
| Switzerland–0.71% | |
Swiss Prime Site AG | | | 32,327 | | | $ | 2,983,415 | |
|
| Thailand–0.64% | |
Central Pattana PCL | | | 730,300 | | | | 1,909,223 | |
Central Pattana PCL–NVDR | | | 37,600 | | | | 98,297 | |
Supalai PCL | | | 287,300 | | | | 209,109 | |
Supalai PCL–NVDR | | | 543,200 | | | | 395,364 | |
Supalai PCL–Wts., expiring 10/19/2018(a) | | | 135,800 | | | | 80,074 | |
| | | | | | | | 2,692,067 | |
|
| Turkey–0.11% | |
Emlak Konut Gayrimenkul Yatirim Ortakligi A.S.(a) | | | 604,207 | | | | 447,927 | |
|
| United Arab Emirates–0.13% | |
Emaar Malls PJSC | | | 938,247 | | | | 544,067 | |
|
| United Kingdom–4.51% | |
Big Yellow Group PLC | | | 83,097 | | | | 975,486 | |
Derwent London PLC | | | 47,829 | | | | 2,013,415 | |
Great Portland Estates PLC | | | 262,547 | | | | 2,440,489 | |
Land Securities Group PLC | | | 253,109 | | | | 3,432,572 | |
LondonMetric Property PLC | | | 563,933 | | | | 1,416,141 | |
SEGRO PLC | | | 425,170 | | | | 3,369,509 | |
Tritax Big Box REIT PLC | | | 1,257,984 | | | | 2,528,924 | |
UNITE Group PLC (The) | | | 249,193 | | | | 2,708,306 | |
| | | | | | | | 18,884,842 | |
|
| United States–46.37% | |
Acadia Realty Trust | | | 56,554 | | | | 1,547,317 | |
Alexandria Real Estate Equities, Inc. | | | 7,038 | | | | 919,092 | |
American Campus Communities, Inc. | | | 66,713 | | | | 2,737,234 | |
American Homes 4 Rent–Class A | | | 140,133 | | | | 3,060,505 | |
American Tower Corp.–Class A | | | 16,176 | | | | 2,307,830 | |
Apple Hospitality REIT, Inc. | | | 149,026 | | | | 2,922,400 | |
AvalonBay Communities, Inc. | | | 25,140 | | | | 4,485,227 | |
Boston Properties, Inc. | | | 76,533 | | | | 9,951,586 | |
Brandywine Realty Trust | | | 127,591 | | | | 2,320,880 | |
Brixmor Property Group, Inc. | | | 129,828 | | | | 2,422,590 | |
Columbia Property Trust, Inc. | | | 80,848 | | | | 1,855,462 | |
Cousins Properties, Inc. | | | 322,338 | | | | 2,981,626 | |
Crown Castle International Corp. | | | 17,104 | | | | 1,898,715 | |
Digital Realty Trust, Inc. | | | 13,665 | | | | 1,556,443 | |
EastGroup Properties, Inc. | | | 7,155 | | | | 632,359 | |
Education Realty Trust, Inc. | | | 74,178 | | | | 2,590,296 | |
Equinix, Inc. | | | 4,996 | | | | 2,264,287 | |
Equity Residential | | | 126,996 | | | | 8,098,535 | |
Essex Property Trust, Inc. | | | 23,368 | | | | 5,640,334 | |
Extra Space Storage Inc. | | | 50,784 | | | | 4,441,061 | |
Federal Realty Investment Trust | | | 44,653 | | | | 5,930,365 | |
GGP Inc. | | | 177,352 | | | | 4,148,263 | |
HCP, Inc. | | | 81,009 | | | | 2,112,715 | |
Healthcare Realty Trust, Inc. | | | 167,127 | | | | 5,368,119 | |
Host Hotels & Resorts Inc. | | | 182,268 | | | | 3,618,020 | |
See accompanying Notes to Financial Statements which are an integral part of the financial statements.
Invesco V.I. Global Real Estate Fund
| | | | | | | | |
| | | Shares | | | Value | |
| United States–(continued) | |
Hudson Pacific Properties Inc. | | | 189,428 | | | $ | 6,487,909 | |
Invitation Homes Inc. | | | 86,236 | | | | 2,032,583 | |
Kilroy Realty Corp. | | | 31,576 | | | | 2,357,148 | |
Liberty Property Trust | | | 121,475 | | | | 5,224,640 | |
Macerich Co. (The) | | | 55,720 | | | | 3,659,690 | |
Mid-America Apartment Communities, Inc. | | | 34,385 | | | | 3,457,756 | |
National Health Investors, Inc. | | | 34,707 | | | | 2,616,214 | |
National Retail Properties, Inc. | | | 74,277 | | | | 3,203,567 | |
Park Hotels & Resorts Inc. | | | 111,820 | | | | 3,214,825 | |
Pebblebrook Hotel Trust | | | 41,950 | | | | 1,559,281 | |
Physicians Realty Trust | | | 49,931 | | | | 898,259 | |
Prologis, Inc. | | | 162,581 | | | | 10,488,100 | |
Public Storage | | | 46,701 | | | | 9,760,509 | |
QTS Realty Trust, Inc.–Class A | | | 78,725 | | | | 4,263,746 | |
Realty Income Corp. | | | 84,112 | | | | 4,796,066 | |
Regency Centers Corp. | | | 32,838 | | | | 2,271,733 | |
Retail Opportunity Investments Corp. | | | 115,787 | | | | 2,309,951 | |
Simon Property Group, Inc. | | | 78,352 | | | | 13,456,172 | |
SL Green Realty Corp. | | | 20,121 | | | | 2,030,813 | |
Sun Communities, Inc. | | | 45,215 | | | | 4,195,048 | |
Sunstone Hotel Investors, Inc. | | | 127,002 | | | | 2,099,343 | |
Terreno Realty Corp. | | | 36,592 | | | | 1,282,916 | |
| | | | | | | | |
| | | Shares | | | Value | |
| United States–(continued) | |
Ventas, Inc. | | | 64,148 | | | $ | 3,849,521 | |
Vornado Realty Trust | | | 78,592 | | | | 6,144,323 | |
Washington REIT | | | 48,624 | | | | 1,513,179 | |
Welltower Inc. | | | 78,071 | | | | 4,978,588 | |
| | | | | | | | 193,963,141 | |
Total Real Estate Investment Trust, Common Stocks & Other Equity Interests (Cost $353,126,608) | | | | 414,073,671 | |
|
Money Market Funds–0.17% | |
Invesco Government & Agency Portfolio–Institutional Class, 1.18%(d) | | | 244,314 | | | | 244,314 | |
Invesco Liquid Assets Portfolio– Institutional Class, 1.40%(d) | | | 174,493 | | | | 174,510 | |
Invesco Treasury Portfolio–Institutional Class, 1.17%(d) | | | 279,217 | | | | 279,217 | |
Total Money Market Funds
(Cost $698,041) | | | | 698,041 | |
TOTAL INVESTMENTS IN SECURITIES–99.15%
(Cost $353,824,649) | | | | 414,771,712 | |
OTHER ASSETS LESS LIABILITIES–0.85% | | | | 3,540,812 | |
NET ASSETS–100.00% | | | | | | $ | 418,312,524 | |
Investment Abbreviations:
| | |
| NVDR | | – Non-Voting Depositary Receipt |
| REIT | | – Real Estate Investment Trust |
| Wts. | | – Warrants |
Notes to Schedule of Investments:
| (a) | Non-income producing security. |
| (b) | Security purchased or received in a transaction exempt from registration under the Securities Act of 1933, as amended (the “1933 Act”). The security may be resold pursuant to an exemption from registration under the 1933 Act, typically to qualified institutional buyers. The aggregate value of these securities at December 31, 2017 was $230,160, which represented less than 1% of the Fund’s Net Assets. |
| (c) | Security valued using significant unobservable inputs (Level 3). See Note 3. |
| (d) | The money market fund and the Fund are affiliated by having the same investment adviser. The rate shown is the 7-day SEC standardized yield as of December 31, 2017. |
See accompanying Notes to Financial Statements which are an integral part of the financial statements.
Invesco V.I. Global Real Estate Fund
Statement of Assets and Liabilities
December 31, 2017
Statement of Operations
For the year ended December 31, 2017
| | | | |
Assets: | | | | |
Investments in securities, at value (Cost $353,126,608) | | $ | 414,073,671 | |
Investments in affiliated money market funds, at value and cost | | | 698,041 | |
Cash | | | 118,893 | |
Foreign currencies, at value (Cost $1,361,759) | | | 1,385,258 | |
Receivable for: | | | | |
Investments sold | | | 2,501,478 | |
Fund shares sold | | | 101,550 | |
Dividends | | | 1,419,278 | |
Investment for trustee deferred compensation and retirement plans | | | 71,051 | |
Other assets | | | 901 | |
Total assets | | | 420,370,121 | |
| |
Liabilities: | | | | |
Payable for: | | | | |
Investments purchased | | | 1,255,752 | |
Fund shares reacquired | | | 195,661 | |
Accrued foreign taxes | | | 120,177 | |
Accrued fees to affiliates | | | 319,396 | |
Accrued trustees’ and officers’ fees and benefits | | | 742 | |
Accrued other operating expenses | | | 85,415 | |
Trustee deferred compensation and retirement plans | | | 80,454 | |
Total liabilities | | | 2,057,597 | |
Net assets applicable to shares outstanding | | $ | 418,312,524 | |
| |
Net assets consist of: | | | | |
Shares of beneficial interest | | $ | 353,290,223 | |
Undistributed net investment income | | | 3,481,441 | |
Undistributed net realized gain | | | 566,569 | |
Net unrealized appreciation | | | 60,974,291 | |
| | | $ | 418,312,524 | |
| |
Net Assets: | | | | |
Series I | | $ | 158,229,205 | |
Series II | | $ | 260,083,319 | |
|
Shares outstanding, no par value,
with an unlimited number of shares authorized: | |
Series I | | | 9,101,551 | |
Series II | | | 15,428,305 | |
Series I: | | | | |
Net asset value per share | | $ | 17.38 | |
Series II: | | | | |
Net asset value per share | | $ | 16.86 | |
| | | | |
Investment income: | | | | |
Dividends (net of foreign withholding taxes of $619,959) | | $ | 14,481,542 | |
Dividends from affiliated money market funds | | | 30,880 | |
Total investment income | | | 14,512,422 | |
| |
Expenses: | | | | |
Advisory fees | | | 2,967,717 | |
Administrative services fees | | | 692,760 | |
Custodian fees | | | 192,179 | |
Distribution fees — Series II | | | 607,394 | |
Transfer agent fees | | | 38,787 | |
Trustees’ and officers’ fees and benefits | | | 26,350 | |
Reports to shareholders | | | 52,624 | |
Professional services fees | | | 63,220 | |
Other | | | 13,433 | |
Total expenses | | | 4,654,464 | |
Less: Fees waived | | | (5,001 | ) |
Net expenses | | | 4,649,463 | |
Net investment income | | | 9,862,959 | |
| |
Realized and unrealized gain from: | | | | |
Net realized gain from: | | | | |
Investment securities | | | 7,544,171 | |
Foreign currencies | | | 14,964 | |
| | | | 7,559,135 | |
Change in net unrealized appreciation of: | | | | |
Investment securities | | | 29,832,428 | |
Foreign currencies | | | 48,590 | |
| | | | 29,881,018 | |
Net realized and unrealized gain | | | 37,440,153 | |
Net increase in net assets resulting from operations | | $ | 47,303,112 | |
See accompanying Notes to Financial Statements which are an integral part of the financial statements.
Invesco V.I. Global Real Estate Fund
Statement of Changes in Net Assets
For the years ended December 31, 2017 and 2016
| | | | | | | | |
| | | 2017 | | | 2016 | |
Operations: | | | | | | | | |
Net investment income | | $ | 9,862,959 | | | $ | 6,742,282 | |
Net realized gain | | | 7,559,135 | | | | 10,069,841 | |
Change in net unrealized appreciation (depreciation) | | | 29,881,018 | | | | (7,718,085 | ) |
Net increase in net assets resulting from operations | | | 47,303,112 | | | | 9,094,038 | |
| | |
Distributions to shareholders from net investment income: | | | | | | | | |
Series I | | | (4,949,175 | ) | | | (2,467,652 | ) |
Series ll | | | (7,647,921 | ) | | | (3,330,972 | ) |
Total distributions from net investment income | | | (12,597,096 | ) | | | (5,798,624 | ) |
| | |
Distributions to shareholders from net realized gains: | | | | | | | | |
Series l | | | (2,511,786 | ) | | | (2,886,843 | ) |
Series ll | | | (4,167,052 | ) | | | (4,517,031 | ) |
Total distributions from net realized gains | | | (6,678,838 | ) | | | (7,403,874 | ) |
| | |
Share transactions–net: | | | | | | | | |
Series l | | | (502,416 | ) | | | (62,147,357 | ) |
Series ll | | | 26,512,911 | | | | 13,734,445 | |
Net increase (decrease) in net assets resulting from share transactions | | | 26,010,495 | | | | (48,412,912 | ) |
Net increase (decrease) in net assets | | | 54,037,673 | | | | (52,521,372 | ) |
| | |
Net assets: | | | | | | | | |
Beginning of year | | | 364,274,851 | | | | 416,796,223 | |
End of year (includes undistributed net investment income of $3,481,441 and $3,664,608, respectively) | | $ | 418,312,524 | | | $ | 364,274,851 | |
Notes to Financial Statements
December 31, 2017
NOTE 1—Significant Accounting Policies
Invesco V.I. Global Real Estate Fund (the “Fund”) is a series portfolio of AIM Variable Insurance Funds (Invesco Variable Insurance Funds) (the “Trust”). The Trust is a Delaware statutory trust registered under the Investment Company Act of 1940, as amended (the “1940 Act”), as an open-end series management investment company consisting of twenty-four separate portfolios, (each constituting a “Fund”). The assets, liabilities and operations of each portfolio are accounted for separately. Information presented in these financial statements pertains only to the Fund. Matters affecting each Fund or class will be voted on exclusively by the shareholders of such Fund or class. Current Securities and Exchange Commission (“SEC”) guidance, however, requires participating insurance companies offering separate accounts to vote shares proportionally in accordance with the instructions of the contract owners whose investments are funded by shares of each Fund or class.
The Fund’s investment objective is total return through growth of capital and current income.
The Fund currently offers two classes of shares, Series I and Series II, both of which are offered to insurance company separate accounts funding variable annuity contracts and variable life insurance policies (“variable products”).
The Fund is an investment company and accordingly follows the investment company accounting and reporting guidance in accordance with Financial Accounting Standards Board Accounting Standards Codification Topic 946, Financial Services — Investment Companies.
The following is a summary of the significant accounting policies followed by the Fund in the preparation of its financial statements.
| A. | Security Valuations — Securities, including restricted securities, are valued according to the following policy. |
A security listed or traded on an exchange (except convertible securities) is valued at its last sales price or official closing price as of the close of the customary trading session on the exchange where the security is principally traded, or lacking any sales or official closing price on a particular day, the security may be valued at the closing bid price on that day. Securities traded in the over-the-counter market are valued based on prices furnished by independent pricing services or market makers. When such securities are valued by an independent pricing service they may be considered fair valued. Futures contracts are valued at the final settlement price set by an exchange on which they are principally traded. Listed options are valued at the mean between the last bid and asked prices from the exchange on which they are principally traded. Options not listed on an exchange are valued by an independent source at the mean between the last bid and asked prices. For purposes of determining net asset value (“NAV”) per share, futures and option contracts generally are valued 15 minutes after the close of the customary trading session of the New York Stock Exchange (“NYSE”).
Investments in open-end and closed-end registered investment companies that do not trade on an exchange are valued at the end-of-day net asset value per share. Investments in open-end and closed-end registered investment companies that trade on an exchange are valued at the last sales price or official closing price as of the close of the customary trading session on the exchange where the security is principally traded.
Invesco V.I. Global Real Estate Fund
Debt obligations (including convertible securities) and unlisted equities are fair valued using an evaluated quote provided by an independent pricing service. Evaluated quotes provided by the pricing service may be determined without exclusive reliance on quoted prices, and may reflect appropriate factors such as institution-size trading in similar groups of securities, developments related to specific securities, dividend rate (for unlisted equities), yield (for debt obligations), quality, type of issue, coupon rate (for debt obligations), maturity (for debt obligations), individual trading characteristics and other market data. Pricing services generally value debt obligations assuming orderly transactions of institutional round lot size, but a fund may hold or transact in the same securities in smaller, odd lot sizes. Odd lots often trade at lower prices than institutional round lots. Debt obligations are subject to interest rate and credit risks. In addition, all debt obligations involve some risk of default with respect to interest and/or principal payments.
Foreign securities’ (including foreign exchange contracts) prices are converted into U.S. dollar amounts using the applicable exchange rates as of the close of the NYSE. If market quotations are available and reliable for foreign exchange-traded equity securities, the securities will be valued at the market quotations. Because trading hours for certain foreign securities end before the close of the NYSE, closing market quotations may become unreliable. If between the time trading ends on a particular security and the close of the customary trading session on the NYSE, events occur that the investment adviser determines are significant and make the closing price unreliable, the Fund may fair value the security. If the event is likely to have affected the closing price of the security, the security will be valued at fair value in good faith using procedures approved by the Board of Trustees.
Adjustments to closing prices to reflect fair value may also be based on a screening process of an independent pricing service to indicate the degree of certainty, based on historical data, that the closing price in the principal market where a foreign security trades is not the current value as of the close of the NYSE. Foreign securities’ prices meeting the approved degree of certainty that the price is not reflective of current value will be priced at the indication of fair value from the independent pricing service. Multiple factors may be considered by the independent pricing service in determining adjustments to reflect fair value and may include information relating to sector indices, American Depositary Receipts and domestic and foreign index futures. Foreign securities may have additional risks including exchange rate changes, potential for sharply devalued currencies and high inflation, political and economic upheaval, the relative lack of issuer information, relatively low market liquidity and the potential lack of strict financial and accounting controls and standards.
Securities for which market prices are not provided by any of the above methods may be valued based upon quotes furnished by independent sources. The last bid price may be used to value equity securities. The mean between the last bid and asked prices is used to value debt obligations, including corporate loans.
Securities for which market quotations are not readily available or became unreliable are valued at fair value as determined in good faith by or under the supervision of the Trust’s officers following procedures approved by the Board of Trustees. Issuer specific events, market trends, bid/asked quotes of brokers and information providers and other market data may be reviewed in the course of making a good faith determination of a security’s fair value.
The Fund may invest in securities that are subject to interest rate risk, meaning the risk that the prices will generally fall as interest rates rise and, conversely, the prices will generally rise as interest rates fall. Specific securities differ in their sensitivity to changes in interest rates depending on their individual characteristics. Changes in interest rates may result in increased market volatility, which may affect the value and/or liquidity of certain Fund investments.
Valuations change in response to many factors including the historical and prospective earnings of the issuer, the value of the issuer’s assets, general economic conditions, interest rates, investor perceptions and market liquidity. Because of the inherent uncertainties of valuation, the values reflected in the financial statements may materially differ from the value received upon actual sale of those investments.
| B. | Securities Transactions and Investment Income — Securities transactions are accounted for on a trade date basis. Realized gains or losses on sales are computed on the basis of specific identification of the securities sold. Interest income (net of withholding tax, if any) is recorded on the accrual basis from settlement date. Dividend income (net of withholding tax, if any) is recorded on the ex-dividend date. |
The Fund may periodically participate in litigation related to Fund investments. As such, the Fund may receive proceeds from litigation settlements. Any proceeds received are included in the Statement of Operations as realized gain (loss) for investments no longer held and as unrealized gain (loss) for investments still held.
Brokerage commissions and mark ups are considered transaction costs and are recorded as an increase to the cost basis of securities purchased and/or a reduction of proceeds on a sale of securities. Such transaction costs are included in the determination of net realized and unrealized gain (loss) from investment securities reported in the Statement of Operations and the Statement of Changes in Net Assets and the net realized and unrealized gains (losses) on securities per share in the Financial Highlights. Transaction costs are included in the calculation of the Fund’s net asset value and, accordingly, they reduce the Fund’s total returns. These transaction costs are not considered operating expenses and are not reflected in net investment income reported in the Statement of Operations and the Statement of Changes in Net Assets, or the net investment income per share and the ratios of expenses and net investment income reported in the Financial Highlights, nor are they limited by any expense limitation arrangements between the Fund and the investment adviser.
The Fund recharacterizes distributions received from REIT investments based on information provided by the REIT into the following categories: ordinary income, long-term and short-term capital gains, and return of capital. If information is not available on a timely basis from the REIT, the recharacterization will be based on available information which may include the previous year’s allocation. If new or additional information becomes available from the REIT at a later date, a recharacterization will be made in the following year. The Fund records as dividend income the amount recharacterized as ordinary income and as realized gain the amount recharacterized as capital gain in the Statement of Operations, and the amount recharacterized as return of capital as a reduction of the cost of the related investment. These recharacterizations are reflected in the accompanying financial statements.
The Fund allocates income and realized and unrealized capital gains and losses to a class based on the relative net assets of each class.
| C. | Country Determination — For the purposes of making investment selection decisions and presentation in the Schedule of Investments, the investment adviser may determine the country in which an issuer is located and/or credit risk exposure based on various factors. These factors include the laws of the country under which the issuer is organized, where the issuer maintains a principal office, the country in which the issuer derives 50% or more of its total revenues and the country that has the primary market for the issuer’s securities, as well as other criteria. Among the other criteria that may be evaluated for making this determination are the country in which the issuer maintains 50% or more of its |
Invesco V.I. Global Real Estate Fund
| | assets, the type of security, financial guarantees and enhancements, the nature of the collateral and the sponsor organization. Country of issuer and/or credit risk exposure has been determined to be the United States of America, unless otherwise noted. |
| D. | Distributions — Distributions from net investment income and net realized capital gain, if any, are generally declared and paid to separate accounts of participating insurance companies annually and recorded on the ex-dividend date. |
| E. | Federal Income Taxes — The Fund intends to comply with the requirements of Subchapter M of the Internal Revenue Code of 1986, as amended (the “Internal Revenue Code”), necessary to qualify as a regulated investment company and to distribute substantially all of the Fund’s taxable earnings to shareholders. As such, the Fund will not be subject to federal income taxes on otherwise taxable income (including net realized capital gain) that is distributed to shareholders. Therefore, no provision for federal income taxes is recorded in the financial statements. |
The Fund recognizes the tax benefits of uncertain tax positions only when the position is more likely than not to be sustained. Management has analyzed the Fund’s uncertain tax positions and concluded that no liability for unrecognized tax benefits should be recorded related to uncertain tax positions. Management is not aware of any tax positions for which it is reasonably possible that the total amounts of unrecognized tax benefits will change materially in the next 12 months.
The Fund files tax returns in the U.S. Federal jurisdiction and certain other jurisdictions. Generally, the Fund is subject to examinations by such taxing authorities for up to three years after the filing of the return for the tax period.
| F. | Expenses — Fees provided for under the Rule 12b-1 plan of a particular class of the Fund and which are directly attributable to that class are charged to the operations of such class. All other expenses are allocated among the classes based on relative net assets. |
| G. | Accounting Estimates — The preparation of financial statements in conformity with accounting principles generally accepted in the United States of America (“GAAP”) requires management to make estimates and assumptions that affect the reported amounts of assets and liabilities at the date of the financial statements and the reported amounts of revenues and expenses during the reporting period including estimates and assumptions related to taxation. Actual results could differ from those estimates by a significant amount. In addition, the Fund monitors for material events or transactions that may occur or become known after the period-end date and before the date the financial statements are released to print. |
| H. | Indemnifications — Under the Trust’s organizational documents, each Trustee, officer, employee or other agent of the Trust is indemnified against certain liabilities that may arise out of the performance of their duties to the Fund. Additionally, in the normal course of business, the Fund enters into contracts, including the Fund’s servicing agreements, that contain a variety of indemnification clauses. The Fund’s maximum exposure under these arrangements is unknown as this would involve future claims that may be made against the Fund that have not yet occurred. The risk of material loss as a result of such indemnification claims is considered remote. |
| I. | Foreign Currency Translations — Foreign currency is valued at the close of the NYSE based on quotations posted by banks and major currency dealers. Portfolio securities and other assets and liabilities denominated in foreign currencies are translated into U.S. dollar amounts at date of valuation. Purchases and sales of portfolio securities (net of foreign taxes withheld on disposition) and income items denominated in foreign currencies are translated into U.S. dollar amounts on the respective dates of such transactions. The Fund does not separately account for the portion of the results of operations resulting from changes in foreign exchange rates on investments and the fluctuations arising from changes in market prices of securities held. The combined results of changes in foreign exchange rates and the fluctuation of market prices on investments (net of estimated foreign tax withholding) are included with the net realized and unrealized gain or loss from investments in the Statement of Operations. Reported net realized foreign currency gains or losses arise from (1) sales of foreign currencies, (2) currency gains or losses realized between the trade and settlement dates on securities transactions, and (3) the difference between the amounts of dividends, interest, and foreign withholding taxes recorded on the Fund’s books and the U.S. dollar equivalent of the amounts actually received or paid. Net unrealized foreign currency gains and losses arise from changes in the fair values of assets and liabilities, other than investments in securities at fiscal period end, resulting from changes in exchange rates. |
The Fund may invest in foreign securities, which may be subject to foreign taxes on income, gains on investments or currency repatriation, a portion of which may be recoverable. Foreign taxes, if any, are recorded based on the tax regulations and rates that exist in the foreign markets in which the Fund invests and are shown in the Statement of Operations.
| J. | Forward Foreign Currency Contracts — The Fund may engage in foreign currency transactions either on a spot (i.e. for prompt delivery and settlement) basis, or through forward foreign currency contracts, to manage or minimize currency or exchange rate risk. |
The Fund may also enter into forward foreign currency contracts for the purchase or sale of a security denominated in a foreign currency in order to “lock in” the U.S. dollar price of that security, or the Fund may also enter into forward foreign currency contracts that do not provide for physical settlement of the two currencies, but instead are settled by a single cash payment calculated as the difference between the agreed upon exchange rate and the spot rate at settlement based upon an agreed upon notional amount (non-deliverable forwards). The Fund will set aside liquid assets in an amount equal to the daily mark-to-market obligation for forward foreign currency contracts.
A forward foreign currency contract is an obligation between two parties (“Counterparties”) to purchase or sell a specific currency for an agreed-upon price at a future date. The use of forward foreign currency contracts does not eliminate fluctuations in the price of the underlying securities the Fund owns or intends to acquire but establishes a rate of exchange in advance. Fluctuations in the value of these contracts are measured by the difference in the contract date and reporting date exchange rates and are recorded as unrealized appreciation (depreciation) until the contracts are closed. When the contracts are closed, realized gains (losses) are recorded. Realized and unrealized gains (losses) on the contracts are included in the Statement of Operations. The primary risks associated with forward foreign currency contracts include failure of the Counterparty to meet the terms of the contract and the value of the foreign currency changing unfavorably. These risks may be in excess of the amounts reflected in the Statement of Assets and Liabilities.
| K. | Other Risks — The Fund’s investments are concentrated in a comparatively narrow segment of the economy. Consequently, the Fund may tend to be more volatile than other mutual funds, and the value of the Fund’s investments may tend to rise and fall more rapidly. |
Because the Fund concentrates its assets in the real estate industry, an investment in the Fund will be closely linked to the performance of the real estate markets. Property values may fall due to increasing vacancies or declining rents resulting from economic, legal, cultural or technological developments.
Invesco V.I. Global Real Estate Fund
NOTE 2—Advisory Fees and Other Fees Paid to Affiliates
The Trust has entered into a master investment advisory agreement with Invesco Advisers, Inc. (the “Adviser” or “Invesco”). Under the terms of the investment advisory agreement, the Fund accrues daily and pays monthly an advisory fee to the Adviser based on the annual rate of the Fund’s average daily net assets as follows:
| | | | |
| Average Daily Net Assets | | Rate | |
First $250 million | | | 0.75% | |
Next $250 million | | | 0.74% | |
Next $500 million | | | 0.73% | |
Next $1.5 billion | | | 0.72% | |
Next $2.5 billion | | | 0.71% | |
Next $2.5 billion | | | 0.70% | |
Next $2.5 billion | | | 0.69% | |
Over $10 billion | | | 0.68% | |
For the year ended December 31, 2017, the effective advisory fees incurred by the Fund was 0.75%.
Under the terms of a master sub-advisory agreement between the Adviser and each of Invesco Asset Management Deutschland GmbH, Invesco Asset Management Limited, Invesco Asset Management (Japan) Limited, Invesco Hong Kong Limited, Invesco Senior Secured Management, Inc. and Invesco Canada Ltd. and separate sub-advisory agreements with Invesco PowerShares Capital Management LLC and Invesco Asset Management (India) Private Limited (collectively, the “Affiliated Sub-Advisers”) the Adviser, not the Fund, will pay 40% of the fees paid to the Adviser to any such Affiliated Sub-Adviser(s) that provide(s) discretionary investment management services to the Fund based on the percentage of assets allocated to such Affiliated Sub-Adviser(s).
The Adviser has contractually agreed, through at least June 30, 2018, to waive advisory fees and/or reimburse expenses of all shares to the extent necessary to limit total annual fund operating expenses after fee waiver and/or expense reimbursement (excluding certain items discussed below) of Series I shares to 2.00% and Series II shares to 2.25% of average daily net assets (the “expense limits”). In determining the Adviser’s obligation to waive advisory fees and/or reimburse expenses, the following expenses are not taken into account, and could cause the total annual fund operating expenses after fee waiver and/or expense reimbursement to exceed the numbers reflected above: (1) interest; (2) taxes; (3) dividend expense on short sales; (4) extraordinary or non-routine items, including litigation expenses; and (5) expenses that the Fund has incurred but did not actually pay because of an expense offset arrangement. Unless Invesco continues the fee waiver agreement, it will terminate on June 30, 2018. During its term, the fee waiver agreement cannot be terminated or amended to increase the expense limits or reduce the advisory fee waiver without approval of the Board of Trustees. The Adviser did not waive fees and/or reimburse expenses during the period under these expense limits.
Further, the Adviser has contractually agreed, through at least June 30, 2019, to waive the advisory fee payable by the Fund in an amount equal to 100% of the net advisory fees the Adviser receives from the affiliated money market funds on investments by the Fund of uninvested cash in such affiliated money market funds.
For the year ended December 31, 2017, the Adviser waived advisory fees of $5,001.
The Trust has entered into a master administrative services agreement with Invesco pursuant to which the Fund has agreed to pay Invesco a fee for costs incurred in providing accounting services and fund administrative services to the Fund and to reimburse Invesco for fees paid to insurance companies that have agreed to provide certain administrative services to the Fund. These administrative services provided by the insurance companies may include, among other things: maintenance of master accounts with the Fund; tracking, recording and transmitting net purchase and redemption orders for Fund shares; maintaining and preserving records related to the purchase, redemption and other account activity of variable product owners; distributing copies of Fund documents such as prospectuses, proxy materials and periodic reports, to variable product owners, and responding to inquiries from variable product owners about the Fund. Pursuant to such agreement, for the year ended December 31, 2017, Invesco was paid $96,463 for accounting and fund administrative services and was reimbursed $596,297 for fees paid to insurance companies.
The Trust has entered into a transfer agency and service agreement with Invesco Investment Services, Inc. (“IIS”) pursuant to which the Fund has agreed to pay IIS a fee for providing transfer agency and shareholder services to the Fund and reimburse IIS for certain expenses incurred by IIS in the course of providing such services. For the year ended December 31, 2017, expenses incurred under the agreement are shown in the Statement of Operations as Transfer agent fees.
The Trust has entered into a master distribution agreement with Invesco Distributors, Inc. (“IDI”) to serve as the distributor for the Fund. The Trust has adopted a plan pursuant to Rule 12b-1 under the 1940 Act with respect to the Fund’s Series II shares (the “Plan”). The Fund, pursuant to the Plan, pays IDI compensation at the annual rate of 0.25% of the Fund’s average daily net assets of Series II shares. The fees are accrued daily and paid monthly. Of the Plan payments, up to 0.25% of the average daily net assets of the Series II shares may be paid to insurance companies who furnish continuing personal shareholder services to customers who purchase and own Series II shares of the Fund. For the year ended December 31, 2017, expenses incurred under the Plan are detailed in the Statement of Operations as Distribution fees.
Certain officers and trustees of the Trust are officers and directors of the Adviser, IIS and/or IDI.
Invesco V.I. Global Real Estate Fund
NOTE 3—Additional Valuation Information
GAAP defines fair value as the price that would be received to sell an asset or paid to transfer a liability in an orderly transaction between market participants at the measurement date, under current market conditions. GAAP establishes a hierarchy that prioritizes the inputs to valuation methods, giving the highest priority to readily available unadjusted quoted prices in an active market for identical assets (Level 1) and the lowest priority to significant unobservable inputs (Level 3), generally when market prices are not readily available or are unreliable. Based on the valuation inputs, the securities or other investments are tiered into one of three levels. Changes in valuation methods may result in transfers in or out of an investment’s assigned level:
| | Level 1 — | Prices are determined using quoted prices in an active market for identical assets. |
| | Level 2 — | Prices are determined using other significant observable inputs. Observable inputs are inputs that other market participants may use in pricing a security. These may include quoted prices for similar securities, interest rates, prepayment speeds, credit risk, yield curves, loss severities, default rates, discount rates, volatilities and others. |
| | Level 3 — | Prices are determined using significant unobservable inputs. In situations where quoted prices or observable inputs are unavailable (for example, when there is little or no market activity for an investment at the end of the period), unobservable inputs may be used. Unobservable inputs reflect the Fund’s own assumptions about the factors market participants would use in determining fair value of the securities or instruments and would be based on the best available information. |
The following is a summary of the tiered valuation input levels, as of December 31, 2017. The level assigned to the securities valuations may not be an indication of the risk or liquidity associated with investing in those securities. Because of the inherent uncertainties of valuation, the values reflected in the financial statements may materially differ from the value received upon actual sale of those investments.
The Fund’s policy is to recognize transfers in and out of the valuation levels as of the end of the reporting period. During the year ended December 31, 2017, there were transfers from Level 1 to Level 2 of $26,976,158 and from Level 2 to Level 1 of $49,763,727, due to foreign fair value adjustments.
| | | | | | | | | | | | | | | | |
| | | Level 1 | | | Level 2 | | | Level 3 | | | Total | |
Investments in Securities | | | | | | | | | | | | | | | | |
Australia | | $ | 1,495,724 | | | $ | 19,105,562 | | | $ | — | | | $ | 20,601,286 | |
Brazil | | | 2,729,694 | | | | — | | | | — | | | | 2,729,694 | |
Canada | | | 10,738,028 | | | | — | | | | — | | | | 10,738,028 | |
Chile | | | 460,476 | | | | — | | | | — | | | | 460,476 | |
China | | | 8,647,179 | | | | 13,969,255 | | | | — | | | | 22,616,434 | |
France | | | 15,338,100 | | | | — | | | | — | | | | 15,338,100 | |
Germany | | | — | | | | 18,924,259 | | | | — | | | | 18,924,259 | |
Hong Kong | | | 19,830,579 | | | | 11,907,248 | | | | — | | | | 31,737,827 | |
India | | | 667,817 | | | | — | | | | — | | | | 667,817 | |
Indonesia | | | 2,079,261 | | | | — | | | | — | | | | 2,079,261 | |
Ireland | | | 1,626,329 | | | | — | | | | — | | | | 1,626,329 | |
Japan | | | 21,151,465 | | | | 15,952,348 | | | | — | | | | 37,103,813 | |
Malaysia | | | 1,875,846 | | | | — | | | | — | | | | 1,875,846 | |
Malta | | | — | | | | — | | | | 0 | | | | 0 | |
Mexico | | | 2,053,063 | | | | — | | | | — | | | | 2,053,063 | |
Philippines | | | 1,456,520 | | | | 2,179,158 | | | | — | | | | 3,635,678 | |
Singapore | | | 5,002,694 | | | | 4,294,465 | | | | — | | | | 9,297,159 | |
South Africa | | | 4,222,247 | | | | — | | | | — | | | | 4,222,247 | |
Spain | | | — | | | | 2,817,019 | | | | — | | | | 2,817,019 | |
Sweden | | | — | | | | 6,033,876 | | | | — | | | | 6,033,876 | |
Switzerland | | | — | | | | 2,983,415 | | | | — | | | | 2,983,415 | |
Thailand | | | 684,547 | | | | 2,007,520 | | | | — | | | | 2,692,067 | |
Turkey | | | 447,927 | | | | — | | | | — | | | | 447,927 | |
United Arab Emirates | | | 544,067 | | | | — | | | | — | | | | 544,067 | |
United Kingdom | | | 15,452,270 | | | | 3,432,572 | | | | — | | | | 18,884,842 | |
United States | | | 193,963,141 | | | | — | | | | — | | | | 193,963,141 | |
Money Market Funds | | | 698,041 | | | | — | | | | — | | | | 698,041 | |
Total Investments | | $ | 311,165,015 | | | $ | 103,606,697 | | | $ | 0 | | | $ | 414,771,712 | |
Invesco V.I. Global Real Estate Fund
NOTE 4—Trustees’ and Officers’ Fees and Benefits
Trustees’ and Officers’ Fees and Benefits include amounts accrued by the Fund to pay remuneration to certain Trustees and Officers of the Fund. Trustees have the option to defer compensation payable by the Fund, and Trustees’ and Officers’ Fees and Benefits also include amounts accrued by the Fund to fund such deferred compensation amounts. Those Trustees who defer compensation have the option to select various Invesco Funds in which their deferral accounts shall be deemed to be invested. Finally, certain current Trustees were eligible to participate in a retirement plan that provided for benefits to be paid upon retirement to Trustees over a period of time based on the number of years of service. The Fund may have certain former Trustees who also participate in a retirement plan and receive benefits under such plan. Trustees’ and Officers’ Fees and Benefits include amounts accrued by the Fund to fund such retirement benefits. Obligations under the deferred compensation and retirement plans represent unsecured claims against the general assets of the Fund.
NOTE 5—Cash Balances
The Fund is permitted to temporarily carry a negative or overdrawn balance in its account with State Street Bank and Trust Company, the custodian bank. Such balances, if any at period-end, are shown in the Statement of Assets and Liabilities under the payable caption Amount due custodian. To compensate the custodian bank for such overdrafts, the overdrawn Fund may either (1) leave funds as a compensating balance in the account so the custodian bank can be compensated by earning the additional interest; or (2) compensate by paying the custodian bank at a rate agreed upon by the custodian bank and Invesco, not to exceed the contractually agreed upon rate.
NOTE 6—Distributions to Shareholders and Tax Components of Net Assets
Tax Character of Distributions to Shareholders Paid During the Fiscal Years Ended December 31, 2017 and 2016:
| | | | | | | | |
| | | 2017 | | | 2016 | |
Ordinary income | | $ | 12,597,096 | | | $ | 5,798,624 | |
Long-term capital gain | | | 6,678,838 | | | | 7,403,874 | |
Total distributions | | $ | 19,275,934 | | | $ | 13,202,498 | |
Tax Components of Net Assets at Period-End:
| | | | |
| | | 2017 | |
Undistributed ordinary income | | $ | 14,356,284 | |
Undistributed long-term gain | | | 4,506,305 | |
Net unrealized appreciation — investments | | | 46,201,008 | |
Net unrealized appreciation — foreign currencies | | | 27,227 | |
Temporary book/tax differences | | | (68,523 | ) |
Shares of beneficial interest | | | 353,290,223 | |
Total net assets | | $ | 418,312,524 | |
The difference between book-basis and tax-basis unrealized appreciation (depreciation) is due to differences in the timing of recognition of gains and losses on investments for tax and book purposes. The Fund’s net unrealized appreciation difference is attributable primarily to wash sales and the tax treatment of passive foreign investment companies.
The temporary book/tax differences are a result of timing differences between book and tax recognition of income and/or expenses. The Fund’s temporary book/tax differences are the result of the trustee deferral of compensation and retirement plan benefits.
Capital loss carryforward is calculated and reported as of a specific date. Results of transactions and other activity after that date may affect the amount of capital loss carryforward actually available for the Fund to utilize. Capital losses generated in years beginning after December 22, 2010 can be carried forward for an unlimited period, whereas previous losses expire in eight tax years. Capital losses with an expiration period may not be used to offset capital gains until all net capital losses without an expiration date have been utilized. Capital loss carryforwards with no expiration date will retain their character as either short-term or long-term capital losses instead of as short-term capital losses as under prior law. The ability to utilize capital loss carryforwards in the future may be limited under the Internal Revenue Code and related regulations based on the results of future transactions.
The Fund does not have a capital loss carryforward as of December 31, 2017.
Invesco V.I. Global Real Estate Fund
NOTE 7—Investment Transactions
The aggregate amount of investment securities (other than short-term securities, U.S. Treasury obligations and money market funds, if any) purchased and sold by the Fund during the year ended December 31, 2017 was $214,779,487 and $195,473,059, respectively. Cost of investments, including any derivatives, on a tax basis includes the adjustments for financial reporting purposes as of the most recently completed federal income tax reporting period-end.
| | | | |
| Unrealized Appreciation (Depreciation) of Investments on a Tax Basis | |
Aggregate unrealized appreciation of investments | | $ | 53,174,106 | |
Aggregate unrealized (depreciation) of investments | | | (6,973,098 | ) |
Net unrealized appreciation of investments | | $ | 46,201,008 | |
Cost of investments for tax purposes is $368,570,704. | | | | |
NOTE 8—Reclassification of Permanent Differences
Primarily as a result of differing book/tax treatment of foreign currency transactions, and passive foreign investment companies, on December 31, 2017, undistributed net investment income was increased by $2,550,970 and undistributed net realized gain was decreased by $2,550,970. This reclassification had no effect on the net assets of the Fund.
NOTE 9—Share Information
| | | | | | | | | | | | | | | | |
| | | Summary of Share Activity | |
| | | Years ended December 31, | |
| | | 2017(a) | | | 2016 | |
| | | Shares | | | Amount | | | Shares | | | Amount | |
Sold: | | | | | | | | | | | | | | | | |
Series I | | | 1,590,286 | | | $ | 26,867,883 | | | | 1,866,923 | | | $ | 31,090,102 | |
Series II | | | 2,922,326 | | | | 48,002,807 | | | | 2,573,469 | | | | 42,010,957 | |
| | | | |
Issued as reinvestment of dividends: | | | | | | | | | | | | | | | | |
Series I | | | 441,738 | | | | 7,460,961 | | | | 307,377 | | | | 5,354,495 | |
Series II | | | 720,865 | | | | 11,814,973 | | | | 463,556 | | | | 7,848,003 | |
| | | | |
Reacquired: | | | | | | | | | | | | | | | | |
Series I | | | (2,054,075 | ) | | | (34,831,260 | ) | | | (5,815,971 | ) | | | (98,591,954 | ) |
Series II | | | (2,037,490 | ) | | | (33,304,869 | ) | | | (2,288,818 | ) | | | (36,124,515 | ) |
Net increase (decrease) in share activity | | | 1,583,650 | | | $ | 26,010,495 | | | | (2,893,464 | ) | | $ | (48,412,912 | ) |
| (a) | There are entities that are record owners of more than 5% of the outstanding shares of the Fund and in the aggregate own 59% of the outstanding shares of the Fund. The Fund and the Fund’s principal underwriter or adviser, are parties to participation agreements with these entities whereby these entities sell units of interest in separate accounts funding variable products that are invested in the Fund. The Fund, Invesco and/or Invesco affiliates may make payments to these entities, which are considered to be related to the Fund, for providing services to the Fund, Invesco and/or Invesco affiliates including but not limited to services such as, securities brokerage, third party record keeping and account servicing and administrative services. The Fund has no knowledge as to whether all or any portion of the shares owned of record by these entities are also owned beneficially. |
Invesco V.I. Global Real Estate Fund
NOTE 10—Financial Highlights
The following schedule presents financial highlights for a share of the Fund outstanding throughout the periods indicated.
| | | | | | | | | | | | | | | | | | | | | | | | | | | | | | | | | | | | | | | | | | | | | | | | | | | | | | | | |
| | | Net asset
value,
beginning
of period | | | Net
investment
income(a) | | | Net gains
(losses)
on securities
(both
realized and
unrealized) | | | Total from
investment
operations | | | Dividends
from net
investment
income | | | Distributions
from net
realized
gains | | | Total
distributions | | | Net asset
value, end
of period | | | Total
return(b) | | | Net assets,
end of period
(000’s omitted) | | | Ratio of
expenses
to average net assets
with fee waivers
and/or expenses
absorbed | | | Ratio of
expenses
to average net
assets without
fee waivers
and/or expenses
absorbed | | | Ratio of net
investment
income to average
net assets | | | Portfolio
turnover(c) | |
Series I | | | | | | | | | | | | | | | | | | | | | | | | | | | | | | | | | | | | | | | | | | | | | | | | | | | | | | | | |
Year ended 12/31/17 | | $ | 16.15 | | | $ | 0.45 | (d) | | $ | 1.62 | | | $ | 2.07 | | | $ | (0.56 | ) | | $ | (0.28 | ) | | $ | (0.84 | ) | | $ | 17.38 | | | | 12.98 | % | | $ | 158,229 | | | | 1.02 | %(e) | | | 1.02 | %(e) | | | 2.63 | %(d)(e) | | | 50 | % |
Year ended 12/31/16 | | | 16.36 | | | | 0.30 | | | | 0.08 | | | | 0.38 | | | | (0.27 | ) | | | (0.32 | ) | | | (0.59 | ) | | | 16.15 | | | | 2.04 | | | | 147,382 | | | | 1.05 | | | | 1.05 | | | | 1.81 | | | | 66 | |
Year ended 12/31/15 | | | 17.24 | | | | 0.31 | | | | (0.59 | ) | | | (0.28 | ) | | | (0.60 | ) | | | — | | | | (0.60 | ) | | | 16.36 | | | | (1.48 | ) | | | 208,796 | | | | 1.11 | | | | 1.11 | | | | 1.79 | | | | 72 | |
Year ended 12/31/14 | | | 15.29 | | | | 0.33 | | | | 1.89 | | | | 2.22 | | | | (0.27 | ) | | | — | | | | (0.27 | ) | | | 17.24 | | | | 14.62 | | | | 209,829 | | | | 1.10 | | | | 1.10 | | | | 1.99 | | | | 44 | |
Year ended 12/31/13 | | | 15.47 | | | | 0.22 | | | | 0.21 | | | | 0.43 | | | | (0.61 | ) | | | — | | | | (0.61 | ) | | | 15.29 | | | | 2.71 | | | | 189,835 | | | | 1.10 | | | | 1.10 | | | | 1.41 | | | | 49 | |
Series II | | | | | | | | | | | | | | | | | | | | | | | | | | | | | | | | | | | | | �� | | | | | | | | | | | | | | | | | | | |
Year ended 12/31/17 | | | 15.69 | | | | 0.39 | (d) | | | 1.58 | | | | 1.97 | | | | (0.52 | ) | | | (0.28 | ) | | | (0.80 | ) | | | 16.86 | | | | 12.73 | | | | 260,083 | | | | 1.27 | (e) | | | 1.27 | (e) | | | 2.38 | (d)(e) | | | 50 | |
Year ended 12/31/16 | | | 15.91 | | | | 0.25 | | | | 0.08 | | | | 0.33 | | | | (0.23 | ) | | | (0.32 | ) | | | (0.55 | ) | | | 15.69 | | | | 1.82 | | | | 216,893 | | | | 1.30 | | | | 1.30 | | | | 1.56 | | | | 66 | |
Year ended 12/31/15 | | | 16.79 | | | | 0.26 | | | | (0.58 | ) | | | (0.32 | ) | | | (0.56 | ) | | | — | | | | (0.56 | ) | | | 15.91 | | | | (1.74 | ) | | | 208,000 | | | | 1.36 | | | | 1.36 | | | | 1.54 | | | | 72 | |
Year ended 12/31/14 | | | 14.90 | | | | 0.28 | | | | 1.84 | | | | 2.12 | | | | (0.23 | ) | | | — | | | | (0.23 | ) | | | 16.79 | | | | 14.34 | | | | 200,299 | | | | 1.35 | | | | 1.35 | | | | 1.74 | | | | 44 | |
Year ended 12/31/13 | | | 15.11 | | | | 0.18 | | | | 0.20 | | | | 0.38 | | | | (0.59 | ) | | | — | | | | (0.59 | ) | | | 14.90 | | | | 2.44 | | | | 170,145 | | | | 1.35 | | | | 1.35 | | | | 1.16 | | | | 49 | |
| (a) | Calculated using average shares outstanding. |
| (b) | Includes adjustments in accordance with accounting principles generally accepted in the United States of America and as such, the net asset value for financial reporting purposes and the returns based upon those net asset values may differ from the net asset value and returns for shareholder transactions. Total returns are not annualized for periods less than one year, if applicable, and do not reflect charges assessed in connection with a variable product, which if included would reduce total returns. |
| (c) | Portfolio turnover is calculated at the fund level and is not annualized for periods less than one year, if applicable. |
| (d) | Net investment income per share and the ratio of net investment income to average net assets includes significant dividends received during the period. Net investment income per share and the ratio of net investment income to average net assets excluding the significant dividends are $0.38 and 2.18% and $0.32 and 1.93% for Series I and Series II shares, respectively. |
| (e) | Ratios are based on average daily net assets (000’s omitted) of $154,707 and $242,958 for Series I and Series II shares, respectively. |
Invesco V.I. Global Real Estate Fund
Report of Independent Registered Public Accounting Firm
To the Board of Trustees of AIM Variable Insurance Funds (Invesco Variable Insurance Funds)
and Shareholders of Invesco V.I. Global Real Estate Fund
Opinion on the Financial Statements
We have audited the accompanying statement of assets and liabilities, including the schedule of investments, of Invesco V.I. Global Real Estate Fund (one of the funds constituting AIM Variable Insurance Funds (Invesco Variable Insurance Funds), hereafter referred to as the “Fund”) as of December 31, 2017, the related statement of operations for the year ended December 31, 2017, the statement of changes in net assets for each of the two years in the period ended December 31, 2017, including the related notes, and the financial highlights for each of the five years in the period ended December 31, 2017 (collectively referred to as the “financial statements”). In our opinion, the financial statements present fairly, in all material respects, the financial position of the Fund as of December 31, 2017, the results of its operations for the year then ended, the changes in its net assets for each of the two years in the period ended December 31, 2017 and the financial highlights for each of the five years in the period ended December 31, 2017 in conformity with accounting principles generally accepted in the United States of America.
Basis for Opinion
These financial statements are the responsibility of the Fund’s management. Our responsibility is to express an opinion on the Fund’s financial statements based on our audits. We are a public accounting firm registered with the Public Company Accounting Oversight Board (United States) (“PCAOB”) and are required to be independent with respect to the Fund in accordance with the U.S. federal securities laws and the applicable rules and regulations of the Securities and Exchange Commission and the PCAOB.
We conducted our audits of these financial statements in accordance with the standards of the PCAOB. Those standards require that we plan and perform the audit to obtain reasonable assurance about whether the financial statements are free of material misstatement, whether due to error or fraud.
Our audits included performing procedures to assess the risks of material misstatement of the financial statements, whether due to error or fraud, and performing procedures that respond to those risks. Such procedures included examining, on a test basis, evidence regarding the amounts and disclosures in the financial statements. Our audits also included evaluating the accounting principles used and significant estimates made by management, as well as evaluating the overall presentation of the financial statements. Our procedures included confirmation of securities owned as of December 31, 2017 by correspondence with the custodian, transfer agent and brokers; when replies were not received from brokers, we performed other auditing procedures. We believe that our audits provide a reasonable basis for our opinion.
PricewaterhouseCoopers LLP
Houston, TX
February 14, 2018
We have served as the auditor of one or more of the investment companies in the Invesco/PowerShares group of investment companies since at least 1995. We have not determined the specific year we began serving as auditor.
Invesco V.I. Global Real Estate Fund
Calculating your ongoing Fund expenses
Example
As a shareholder of the Fund, you incur ongoing costs, including management fees; distribution and/or service fees (12b-1); and other Fund expenses. This example is intended to help you understand your ongoing costs (in dollars) of investing in the Fund and to compare these costs with ongoing costs of investing in other mutual funds. The example is based on an investment of $1,000 invested at the beginning of the period and held for the entire period July 1, 2017 through December 31, 2017.
The actual and hypothetical expenses in the examples below do not represent the effect of any fees or other expenses assessed in connection with a variable product; if they did, the expenses shown would be higher while the ending account values shown would be lower.
Actual expenses
The table below provides information about actual account values and actual expenses. You may use the information in this table, together with the amount you invested, to estimate the expenses that you paid over the period. Simply divide your account value by $1,000 (for example, an $8,600 account value divided by $1,000 = 8.6), then multiply the result by the number in the table under the heading entitled “Actual Expenses Paid During Period” to estimate the expenses you paid on your account during this period.
Hypothetical example for comparison purposes
The table below also provides information about hypothetical account values and hypothetical expenses based on the Fund’s actual expense ratio and an assumed rate of return of 5% per year before expenses, which is not the Fund’s actual return.
The hypothetical account values and expenses may not be used to estimate the actual ending account balance or expenses you paid for the period. You may use this information to compare the ongoing costs of investing in the Fund and other funds. To do so, compare this 5% hypothetical example with the 5% hypothetical examples that appear in the shareholder reports of the other funds.
Please note that the expenses shown in the table are meant to highlight your ongoing costs. Therefore, the hypothetical information is useful in comparing ongoing costs, and will not help you determine the relative total costs of owning different funds.
| | | | | | | | | | | | | | | | | | | | | | | | |
Class | | Beginning
Account Value
(07/01/17) | | | ACTUAL | | | HYPOTHETICAL
(5% annual return before
expenses) | | | Annualized
Expense Ratio | |
| | | Ending
Account Value
(12/31/17)1 | | | Expenses
Paid During
Period2 | | | Ending
Account Value
(12/31/17) | | | Expenses
Paid During
Period 2 | | |
Series I | | $ | 1,000.00 | | | $ | 1,064.60 | | | $ | 5.26 | | | $ | 1,020.11 | | | $ | 5.14 | | | | 1.01 | % |
Series II | | | 1,000.00 | | | | 1,062.90 | | | | 6.55 | | | | 1,018.85 | | | | 6.41 | | | | 1.26 | |
| 1 | The actual ending account value is based on the actual total return of the Fund for the period July 1, 2017 through December 31, 2017, after actual expenses and will differ from the hypothetical ending account value which is based on the Fund’s expense ratio and a hypothetical annual return of 5% before expenses. |
| 2 | Expenses are equal to the Fund’s annualized expense ratio as indicated above multiplied by the average account value over the period, multiplied by 184/365 to reflect the most recent fiscal half year. |
Invesco V.I. Global Real Estate Fund
Tax Information
Form 1099-DIV, Form 1042-S and other year-end tax information provide shareholders with actual calendar year amounts that should be included in their tax returns. Shareholders should consult their tax advisors.
The following distribution information is being provided as required by the Internal Revenue Code or to meet a specific state’s requirement.
The Fund designates the following amounts or, if subsequently determined to be different, the maximum amount allowable for its fiscal year ended December 31, 2017:
| | | | |
Federal and State Income Tax | | | |
Long-Term Capital Gain Distributions | | $ | 6,678,838 | |
Corporate Dividends Received Deduction* | | | 0.00 | % |
U.S. Treasury Obligations* | | | 0.00 | % |
| | * | The above percentages are based on ordinary income dividends paid to shareholders during the Fund’s fiscal year. |
Invesco V.I. Global Real Estate Fund
Trustees and Officers
The address of each trustee and officer is AIM Variable Insurance Funds (Invesco Variable Insurance Funds) (the “Trust”), 11 Greenway Plaza, Suite 1000, Houston, Texas 77046-1173. The trustees serve for the life of the Trust, subject to their earlier death, incapacitation, resignation, retirement or removal as more specifically provided in the Trust’s organizational documents. Each officer serves for a one year term or until their successors are elected and qualified. Column two below includes length of time served with predecessor entities, if any.
| | | | | | | | |
Name, Year of Birth and
Position(s) Held with the Trust | | Trustee and/
or Officer Since | | Principal Occupation(s)
During Past 5 Years | | Number of
Funds in Fund
Complex
Overseen by
Trustee | | Other Directorship(s)
Held by Trustee During
Past 5 Years |
| Interested Persons | | | | | | | | |
Martin L. Flanagan1 — 1960 Trustee | | 2007 | | Executive Director, Chief Executive Officer and President, Invesco Ltd. (ultimate parent of Invesco and a global investment management firm); Trustee, The Invesco Funds; Vice Chair, Investment Company Institute; and Member of Executive Board, SMU Cox School of Business Formerly: Advisor to the Board, Invesco Advisers, Inc. (formerly known as Invesco Institutional (N.A.), Inc.); Chairman and Chief Executive Officer, Invesco Advisers, Inc. (registered investment adviser); Director, Chairman, Chief Executive Officer and President, Invesco Holding Company (US), Inc. (formerly IVZ Inc.) (holding company), Invesco Group Services, Inc. (service provider) and Invesco North American Holdings, Inc. (holding company); Director, Chief Executive Officer and President, Invesco Holding Company Limited (parent of Invesco and a global investment management firm); Director, Invesco Ltd.; Chairman, Investment Company Institute and President, Co-Chief Executive Officer, Co-President, Chief Operating Officer and Chief Financial Officer, Franklin Resources, Inc. (global investment management organization) | | 158 | | None |
Philip A. Taylor2 — 1954 Trustee and Senior Vice President | | 2006 | | Head of the Americas and Senior Managing Director, Invesco Ltd.; Director, Invesco Advisers, Inc. (formerly known as Invesco Institutional (N.A.), Inc.) (registered investment adviser); Director, Chairman, Chief Executive Officer and President, Invesco Management Group, Inc. (formerly known as Invesco Aim Management Group, Inc.) (financial services holding company); Director and Chairman, Invesco Investment Services, Inc. (formerly known as Invesco Aim Investment Services, Inc.) (registered transfer agent); Chief Executive Officer, Invesco Corporate Class Inc. (corporate mutual fund company); Director, Chairman and Chief Executive Officer, Invesco Canada Ltd. (formerly known as Invesco Trimark Ltd./Invesco Trimark Ltèe) (registered investment adviser and registered transfer agent); Trustee and Senior Vice President, The Invesco Funds; Director, Invesco Investment Advisers LLC (formerly known as Van Kampen Asset Management). Formerly: Co-Chairman, Co-President and Co-Chief Executive Officer, Invesco Advisers, Inc. (formerly known as Invesco Institutional (N.A.), Inc.) (registered investment adviser); Director, Chief Executive Officer and President, Van Kampen Exchange Corp; President and Principal Executive Officer, The Invesco Funds (other than AIM Treasurer’s Series Trust (Invesco Treasurer’s Series Trust), Short-Term Investments Trust and Invesco Management Trust); Executive Vice President, The Invesco Funds (AIM Treasurer’s Series Trust (Invesco Treasurer’s Series Trust), Short-Term Investments Trust and Invesco Management Trust only); Director and President, INVESCO Funds Group, Inc. (registered investment adviser and registered transfer agent); Director and Chairman, IVZ Distributors, Inc. (formerly known as INVESCO Distributors, Inc.) (registered broker dealer); Director, President and Chairman, Invesco Inc. (holding company), Invesco Canada Holdings Inc. (holding company), Trimark Investments Ltd./Placements Trimark Ltèe and Invesco Financial Services Ltd/Services Financiers Invesco Ltèe; Chief Executive Officer, Invesco Canada Fund Inc. (corporate mutual fund company); Director and Chairman, Van Kampen Investor Services Inc.; Director, Chief Executive Officer and President, 1371 Preferred Inc. (holding company) and Van Kampen Investments Inc.; Director and President, AIM GP Canada Inc. (general partner for limited partnerships) and Van Kampen Advisors, Inc.; Director and Chief Executive Officer, Invesco Trimark Dealer Inc. (registered broker dealer); Director, Invesco Distributors, Inc. (formerly known as Invesco Aim Distributors, Inc.) (registered broker dealer); Manager, Invesco PowerShares Capital Management LLC; Director, Chief Executive Officer and President, Invesco Advisers, Inc.; Director, Chairman, Chief Executive Officer and President, Invesco Aim Capital Management, Inc.; President, Invesco Trimark Dealer Inc. and Invesco Trimark Ltd./Invesco Trimark Ltèe; Director and President, AIM Trimark Corporate Class Inc. and AIM Trimark Canada Fund Inc.; Senior Managing Director, Invesco Holding Company Limited; Director and Chairman, Fund Management Company (former registered broker dealer); President and Principal Executive Officer, The Invesco Funds (AIM Treasurer’s Series Trust (Invesco Treasurer’s Series Trust), and Short-Term Investments Trust only); President, AIM Trimark Global Fund Inc. and AIM Trimark Canada Fund Inc. | | 158 | | None |
| 1 | Mr. Flanagan is considered an interested person (within the meaning of Section 2(a)(19) of the 1940 Act) of the Trust because he is an officer of the Adviser to the Trust, and an officer and a director of Invesco Ltd., ultimate parent of the Adviser. |
| 2 | Mr. Taylor is considered an interested person (within the meaning of Section 2(a)(19) of the 1940 Act) of the Trust because he is an officer and a director of the Adviser. |
Invesco V.I. Global Real Estate Fund
Trustees and Officers—(continued)
| | | | | | | | |
Name, Year of Birth and
Position(s) Held with the Trust | | Trustee and/
or Officer Since | | Principal Occupation(s)
During Past 5 Years | | Number of
Funds in Fund
Complex
Overseen by
Trustee | | Other Directorship(s)
Held by Trustee During
Past 5 Years |
| Independent Trustees | | | | | | | | |
Bruce L. Crockett — 1944 Trustee and Chair | | 1993 | | Chairman, Crockett Technologies Associates (technology consulting company) Formerly: Director, Captaris (unified messaging provider); Director, President and Chief Executive Officer, COMSAT Corporation; Chairman, Board of Governors of INTELSAT (international communications company); ACE Limited (insurance company); Independent Directors Council and Investment Company Institute: Member of the Audit Committee, Investment Company Institute; Member of the Executive Committee and Chair of the Governance Committee, Independent Directors Council | | 158 | | Director and Chairman of the Audit Committee, ALPS (Attorneys Liability Protection Society) (insurance company); Director and Member of the Audit Committee and Compensation Committee, Ferroglobe PLC (metallurgical company) |
David C. Arch — 1945 Trustee | | 2010 | | Chairman of Blistex Inc. (consumer health care products manufacturer); Member, World Presidents’ Organization | | 158 | | Board member of the Illinois Manufacturers’ Association |
Jack M. Fields — 1952 Trustee | | 1997 | | Chief Executive Officer, Twenty First Century Group, Inc. (government affairs company); and Chairman, Discovery Learning Alliance (non-profit) Formerly: Owner and Chief Executive Officer, Dos Angeles Ranch L.P. (cattle, hunting, corporate entertainment); Director, Insperity, Inc. (formerly known as Administaff) (human resources provider); Chief Executive Officer, Texana Timber LP (sustainable forestry company); Director of Cross Timbers Quail Research Ranch (non-profit); and member of the U.S. House of Representatives | | 158 | | None |
Cynthia Hostetler — 1962 Trustee | | 2017 | | Non-Executive Director and Trustee of a number of public and private business corporations Formerly: Head of Investment Funds and Private Equity, Overseas Private Investment Corporation; President, First Manhattan Bancorporation, Inc.; Attorney, Simpson Thacher & Bartlett LLP | | 158 | | Vulcan Materials Company (construction materials company); Trilinc Global Impact Fund; Aberdeen Investment Funds (4 portfolios); Artio Global Investment LLC (mutual fund complex); Edgen Group, Inc. (specialized energy and infrastructure products distributor) |
Eli Jones — 1961 Trustee | | 2016 | | Professor and Dean, Mays Business School — Texas A&M University Formerly: Professor and Dean, Walton College of Business, University of Arkansas and E.J. Ourso College of Business, Louisiana State University; Director, Arvest Bank | | 158 | | Insperity, Inc. (formerly known as Administaff) (human resources provider) |
Prema Mathai-Davis — 1950 Trustee | | 1998 | | Retired. | | 158 | | None |
Teresa M. Ressel — 1962 Trustee | | 2017 | | Non-executive director and trustee of a number of public and private business corporations Formerly: Chief Financial Officer, Olayan America, The Olayan Group (international investor/commercial/industrial); Chief Executive Officer, UBS Securities LLC; Group Chief Operating Officer, Americas, UBS AG; Assistant Secretary for Management & Budget and CFO, US Department of the Treasury | | 158 | | Atlantic Power Corporation (power generation company); ON Semiconductor Corp. (semiconductor supplier) |
Ann Barnett Stern — 1957 Trustee | | 2017 | | President and Chief Executive Officer, Houston Endowment Inc. (private philanthropic institution) Formerly: Executive Vice President and General Counsel, Texas Children’s Hospital; Attorney, Beck, Redden and Secrest, LLP; Business Law Instructor, University of St. Thomas; Attorney, Andrews & Kurth LLP | | 158 | | Federal Reserve Bank of Dallas |
Raymond Stickel, Jr. — 1944 Trustee | | 2005 | | Retired. Formerly: Director, Mainstay VP Series Funds, Inc. (25 portfolios); Partner, Deloitte & Touche | | 158 | | None |
Robert C. Troccoli — 1949 Trustee | | 2016 | | Adjunct Professor, University of Denver — Daniels College of Business Formerly: Senior Partner, KPMG LLP | | 158 | | None |
Christopher L. Wilson — 1957 Trustee | | 2017 | | Non-executive director and trustee of a number of public and private business corporations Formerly: Managing Partner, CT2, LLC (investing and consulting firm); President/Chief Executive Officer, Columbia Funds, Bank of America Corporation; President/Chief Executive Officer, CDC IXIS Asset Management Services, Inc.; Principal & Director of Operations, Scudder Funds, Scudder, Stevens & Clark, Inc.; Assistant Vice President, Fidelity Investments | | 158 | | TD Asset Management USA Inc. (mutual fund complex) (22 portfolios); ISO New England, Inc. (non-profit organization managing regional electricity market) |
Invesco V.I. Global Real Estate Fund
Trustees and Officers—(continued)
| | | | | | | | |
Name, Year of Birth and
Position(s) Held with the Trust | | Trustee and/
or Officer Since | | Principal Occupation(s)
During Past 5 Years | | Number of
Funds in Fund
Complex
Overseen by
Trustee | | Other Directorship(s)
Held by Trustee During
Past 5 Years |
| Other Officers | | | | | | | | |
Sheri Morris — 1964 President, Principal Executive Officer and Treasurer | | 1999 | | President, Principal Executive Officer and Treasurer, The Invesco Funds; Vice President, Invesco Advisers, Inc. (formerly known as Invesco Institutional (N.A.), Inc.) (registered investment adviser); and Vice President, PowerShares Exchange-Traded Fund Trust, PowerShares Exchange-Traded Fund Trust II, PowerShares India Exchange-Traded Fund Trust, PowerShares Actively Managed Exchange-Traded Fund Trust, PowerShares Actively Managed Exchange-Traded Commodity Fund Trust and PowerShares Exchange-Traded Self-Indexed Fund Trust Formerly: Vice President and Principal Financial Officer, The Invesco Funds; Vice President, Invesco Aim Advisers, Inc., Invesco Aim Capital Management, Inc. and Invesco Aim Private Asset Management, Inc.; Assistant Vice President and Assistant Treasurer, The Invesco Funds and Assistant Vice President, Invesco Advisers, Inc., Invesco Aim Capital Management, Inc. and Invesco Aim Private Asset Management, Inc.; and Treasurer, PowerShares Exchange-Traded Fund Trust, PowerShares Exchange-Traded Fund Trust II, PowerShares India Exchange-Traded Fund Trust and PowerShares Actively Managed Exchange-Traded Fund Trust | | N/A | | N/A |
Russell C. Burk — 1958 Senior Vice President and Senior Officer | | 2005 | | Senior Vice President and Senior Officer, The Invesco Funds | | N/A | | N/A |
John M. Zerr — 1962 Senior Vice President, Chief Legal Officer and Secretary | | 2006 | | Director, Senior Vice President, Secretary and General Counsel, Invesco Management Group, Inc. (formerly known as Invesco AIM Management Group, Inc.); Senior Vice President, Invesco Advisers, Inc. (formerly known as Invesco Institutional (N.A.), Inc.) (registered investment adviser); Senior Vice President and Secretary, Invesco Distributors, Inc. (formerly known as Invesco AIM Distributors, Inc.); Director, Vice President and Secretary, Invesco Investment Services, Inc. (formerly known as Invesco AIM Investment Services, Inc.) Senior Vice President, Chief Legal Officer and Secretary, The Invesco Funds; Managing Director, Invesco PowerShares Capital Management LLC; Director, Secretary and General Counsel, Invesco Investment Advisers LLC (formerly known as Van Kampen Asset Management); Secretary and General Counsel, Invesco Capital Markets, Inc. (formerly known as Van Kampen Funds Inc.) and Chief Legal Officer, PowerShares Exchange-Traded Fund Trust, PowerShares Exchange-Traded Fund Trust II, PowerShares India Exchange-Traded Fund Trust, PowerShares Actively Managed Exchange-Traded Fund Trust, PowerShares Actively Managed Exchange-Traded Commodity Fund Trust and PowerShares Exchange-Traded Self-Indexed Fund Trust; Manager and Secretary, Invesco Indexing LLC Formerly: Director, Secretary, General Counsel and Senior Vice President, Van Kampen Exchange Corp.; Director, Vice President and Secretary, IVZ Distributors, Inc. (formerly known as INVESCO Distributors, Inc.); Director and Vice President, INVESCO Funds Group, Inc.; Director and Vice President, Van Kampen Advisors Inc.; Director, Vice President, Secretary and General Counsel, Van Kampen Investor Services Inc.; Director, Invesco Distributors, Inc. (formerly known as Invesco AIM Distributors, Inc.); Director, Senior Vice President, General Counsel and Secretary, Invesco AIM Advisers, Inc. and Van Kampen Investments Inc.; Director, Vice President and Secretary, Fund Management Company; Director, Senior Vice President, Secretary, General Counsel and Vice President, Invesco AIM Capital Management, Inc.; Chief Operating Officer and General Counsel, Liberty Ridge Capital, Inc. (an investment adviser); Vice President and Secretary, PBHG Funds (an investment company) and PBHG Insurance Series Fund (an investment company); Chief Operating Officer, General Counsel and Secretary, Old Mutual Investment Partners (a broker-dealer); General Counsel and Secretary, Old Mutual Fund Services (an administrator) and Old Mutual Shareholder Services (a shareholder servicing center); Executive Vice President, General Counsel and Secretary, Old Mutual Capital, Inc. (an investment adviser); and Vice President and Secretary, Old Mutual Advisors Funds (an investment company) | | N/A | | N/A |
Gregory G. McGreevey — 1962 Senior Vice President | | 2012 | | Senior Managing Director, Invesco Ltd.; Director, Chairman, President, and Chief Executive Officer, Invesco Advisers, Inc. (formerly known as Invesco Institutional (N.A.), Inc.) (registered investment adviser); Senior Vice President, Invesco Management Group, Inc.; Director, Invesco Mortgage Capital, Inc. and Invesco Senior Secured Management, Inc.; and Senior Vice President, The Invesco Funds Formerly: Assistant Vice President, The Invesco Funds | | N/A | | N/A |
Kelli Gallegos — 1970 Vice President, Principal Financial Officer and Assistant Treasurer | | 2008 | | Vice President, Principal Financial Officer and Assistant Treasurer, The Invesco Funds; Assistant Treasurer, Invesco PowerShares Capital Management LLC, PowerShares Exchange-Traded Fund Trust, PowerShares Exchange-Traded Fund Trust II, PowerShares India Exchange-Traded Fund Trust, PowerShares Actively Managed Exchange-Traded Fund Trust, PowerShares Actively Managed Exchange-Traded Commodity Fund Trust and PowerShares Exchange-Traded Self-Indexed Fund Trust Formerly: Assistant Vice President, The Invesco Funds | | N/A | | N/A |
Invesco V.I. Global Real Estate Fund
Trustees and Officers—(continued)
| | | | | | | | |
Name, Year of Birth and
Position(s) Held with the Trust | | Trustee and/
or Officer Since | | Principal Occupation(s)
During Past 5 Years | | Number of
Funds in Fund
Complex
Overseen by
Trustee | | Other Directorship(s)
Held by Trustee During
Past 5 Years |
| Other Officers—(continued) | | | | | | | | |
Tracy Sullivan — 1962 Vice President, Chief Tax Officer and Assistant Treasurer | | 2008 | | Vice President, Chief Tax Officer and Assistant Treasurer, The Invesco Funds; Assistant Treasurer, Invesco PowerShares Capital Management LLC, PowerShares Exchange-Traded Fund Trust, PowerShares Exchange-Traded Fund Trust II, PowerShares India Exchange-Traded Fund Trust, PowerShares Actively Managed Exchange-Traded Fund Trust, PowerShares Actively Managed Exchange-Traded Commodity Fund Trust and PowerShares Exchange-Traded Self-Indexed Fund Trust Formerly: Assistant Vice President, The Invesco Funds | | N/A | | N/A |
Crissie M. Wisdom — 1969 Anti-Money Laundering Compliance Officer | | 2013 | | Anti-Money Laundering Compliance Officer, Invesco Advisers, Inc. (formerly known as Invesco Institutional (N.A.), Inc.) (registered investment adviser), Invesco Capital Markets, Inc. (formerly known as Van Kampen Funds Inc.), Invesco Distributors, Inc., Invesco Investment Services, Inc., Invesco Management Group, Inc., The Invesco Funds, and PowerShares Exchange-Traded Fund Trust, PowerShares Exchange-Traded Fund Trust II, PowerShares India Exchange-Traded Fund Trust, PowerShares Actively Managed Exchange-Traded Fund Trust, PowerShares Actively Managed Exchange-Traded Commodity Fund Trust and PowerShares Exchange-Traded Self-Indexed Fund Trust; Anti-Money Laundering Compliance Officer and Bank Secrecy Act Officer, INVESCO National Trust Company and Invesco Trust Company; and Fraud Prevention Manager and Controls and Risk Analysis Manager for Invesco Investment Services, Inc. Formerly: Anti-Money Laundering Compliance Officer, Van Kampen Exchange Corp. | | N/A | | N/A |
Robert R. Leveille — 1969 Chief Compliance Officer | | 2016 | | Chief Compliance Officer, Invesco Advisers, Inc. (registered investment adviser); and Chief Compliance Officer, The Invesco Funds Formerly: Chief Compliance Officer, Putnam Investments and the Putnam Funds | | N/A | | N/A |
The Statement of Additional Information of the Trust includes additional information about the Fund’s Trustees and is available upon request, without charge, by calling 1.800.959.4246. Please refer to the Fund’s Statement of Additional Information for information on the Fund’s sub-advisers.
| | | | | | |
Office of the Fund 11 Greenway Plaza, Suite 1000 Houston, TX 77046-1173 | | Investment Adviser Invesco Advisers, Inc. 1555 Peachtree Street, N.E. Atlanta, GA 30309 | | Distributor Invesco Distributors, Inc. 11 Greenway Plaza, Suite 1000 Houston, TX 77046-1173 | | Auditors PricewaterhouseCoopers LLP 1000 Louisiana Street, Suite 5800 Houston, TX 77002-5678 |
| | | |
| | | | | | |
Counsel to the Fund Stradley Ronon Stevens & Young, LLP 2005 Market Street, Suite 2600 Philadelphia, PA 19103-7018 | | Counsel to the Independent Trustees Goodwin Procter LLP 901 New York Avenue, N.W. Washington, D.C. 20001 | | Transfer Agent Invesco Investment Services, Inc. 11 Greenway Plaza, Suite 1000 Houston, TX 77046-1173 | | Custodian State Street Bank and Trust Company 225 Franklin Street Boston, MA 02110-2801 |
Invesco V.I. Global Real Estate Fund
| | | | |
| | |
 | | Annual Report to Shareholders | | December 31, 2017 |
| | |
| | Invesco V.I. Government Money Market Fund |

| | |
| | The Fund provides a complete list of its holdings four times in each fiscal year, at the quarter-ends. For the second and fourth quarters, the lists appear in the Fund’s semiannual and annual reports to shareholders. For the first and third quarters, the Fund files the lists with the Securities and Exchange Commission (SEC) on Form N-Q. The Fund’s Form N-Q filings are available on the SEC website, sec.gov. Copies of the Fund’s Forms N-Q may be reviewed and copied at the SEC Public Reference Room in Washington, D.C. You can obtain information on the operation of the Public Reference Room, including information about duplicating fee charges, by calling 202 551 8090 or 800 732 0330, or by electronic request at the following email address: publicinfo@sec.gov. The SEC file numbers for the Fund are 811-07452 and 033-57340. The Fund’s most recent portfolio holdings, as filed on Form N-Q, have also been made available to insurance companies issuing variable annuity contracts and variable life insurance policies (“variable products”) that invest in the Fund. A description of the policies and procedures that the Fund uses to determine how to vote proxies relating to portfolio securities is available without charge, upon request, from our Client Services department at 800 959 4246 or at invesco.com/proxyguidelines. The information is also available on the SEC website, sec.gov. Information regarding how the Fund voted proxies related to its portfolio securities during the most recent 12-month period ended June 30 is available at invesco.com/ proxysearch. The information is also available on the SEC website, sec.gov. Invesco Advisers, Inc. is an investment adviser; it provides investment advisory services to individual and institutional clients and does not sell securities. Invesco Distributors, Inc. is the US distributor for Invesco Ltd.’s retail mutual funds, exchange-traded funds and institutional money market funds. Both are wholly owned, indirect subsidiaries of Invesco Ltd. This report must be accompanied or preceded by a currently effective Fund prospectus and variable product prospectus, which contain more complete information, including sales charges and expenses. Investors should read each carefully before investing. NOT FDIC INSURED | MAY LOSE VALUE | NO BANK GUARANTEE |
| |
| | Invesco Distributors, Inc. VIGMKT-AR-1 02072018 1117 |
Management’s Discussion
Fund information
This annual report for Invesco V.I. Government Money Market Fund (the Fund) covers the year ended December 31, 2017.
As of December 31, 2017, the Fund’s net assets totaled $741.9 million. As of the same date, the Fund’s weighted average maturity was 20 days and the Fund’s weighted average life was 105 days.
Weighted average maturity (WAM) is an average of the maturities of all securities held in the portfolio, weighted by each security’s percentage of net assets. The days to maturity for WAM is the lower of the stated maturity date or next interest rate reset date. WAM reflects how a portfolio would react to interest rate changes.
Weighted average life (WAL) is an average of all the maturities of all securities held in the portfolio, weighted by each security’s percentage of net assets. The days to maturity for WAL is the lower of the stated maturity date or next demand feature date. WAL reflects how a portfolio would react to deterio-rating credit (widening spreads) or tightening liquidity conditions.
Market conditions affecting money market funds
The largest development affecting money market funds and the money market fund industry in 2017 was the US Federal Reserve’s (the Fed) three interest rate hikes.
Money market investors benefited from the Fed’s decision to increase the fed funds rate by 0.75% in 2017.1 Three 0.25% hikes in March, June and December raised the fed funds rate to a target level of 1.25% to 1.50%.1 Since 2006, there have now been five separate 0.25% rate hikes.1 The Fed’s “dot plot,” a key function of the Federal Open Market Committee’s (FOMC) Summary of Economic Projections, shows that the FOMC expects the fed funds target rate to be in a range of 2.00% to 2.25% by the end of 2018.1 This range would represent an increase of 0.75% from current levels. The ongoing positive health of the US economy, with low unemployment and moderate economic growth, provided the basis for the Fed’s decisions. Relatively benign inflation levels may allow the Fed to be less aggressive with its rate hikes in the near future.
At the close of the year, the US continued to be an outlier in terms of base rate borrowing costs as most major central banks continued to maintain interest rates at, near or below zero to fuel inflation and spur economic growth. Many major central banks, including the European Central Bank, the Bank of Japan and the Reserve Bank of Australia, kept their base borrowing rates unchanged during 2017. The Bank of England and the Bank of Canada were the only other major central banks to increase their key rates in 2017.
On November 2, President Donald Trump nominated Jerome Powell to chair the Fed, ending speculation that Janet Yellen might be nominated for a second term. The Chair of the Board of Governors of the Federal Reserve System is nominated by the president; if confirmed by the Senate, he or she serves a four-year term. The chair may be appointed for several consecutive terms. Powell, a member of the Fed’s board of governors since 2012, is largely expected to stay the course with regard to monetary policy as he has largely voted in line with Yellen during his tenure.
For over 35 years, Invesco Global Liquidity has been a core business for Invesco. We believe in a disciplined investment process, high credit quality solutions, distinguished client engagement and consistent performance.
| 1 | Source: US Federal Reserve |
The views and opinions expressed in management’s discussion of Fund performance are those of Invesco Advisers, Inc. These views and opinions are subject to change at any time based on factors such as market and economic conditions. These views and opinions may not be relied upon as investment advice or recommendations, or as an offer for a particular security. The information is not a complete analysis of every aspect of any market, country, industry, security or the Fund. Statements of fact are from sources considered reliable, but Invesco Advisers, Inc. makes no representation or warranty as to their completeness or accuracy. Although historical performance is no guarantee of future results, these insights may help you understand our investment management philosophy.
See important Fund and, if applicable, index disclosures later in this report.
Team managed by Invesco Advisers, Inc.
You could lose money by investing in the Fund. Although the Fund seeks to preserve your investment at $1.00 per share, it cannot guarantee it will do so. An investment in the Fund is not insured or guaranteed by the Federal Deposit Insurance Corporation or any other government agency. The Fund’s sponsor has no legal obligation to provide financial support to the Fund, and you should not expect that the sponsor will provide financial support to the Fund at any time.
| | | | | |
| Portfolio Composition by Maturity |
In days, as of 12/31/17 | | | | % of total net assets | |
| |
| 1 – 7 | | | | 54.9% | |
| 8 – 30 | | | | 4.9 | |
| 31 – 60 | | | | 4.5 | |
| 61 – 90 | | | | 9.5 | |
| 91 – 180 | | | | 5.4 | |
| 181+ | | | | 20.8 | |
The number of days to maturity of each holding is determined in accordance with the provisions of Rule 2a-7 of the Investment Company Act of 1940.
Invesco V.I. Government Money Market Fund
Invesco V.I. Government Money Market Fund’s investment objective is to provide current income consistent with preservation of capital and liquidity.
| ∎ | | Unless otherwise stated, information presented in this report is as of December 31, 2017, and is based on total net assets. |
| ∎ | | Unless otherwise noted, all data provided by Invesco. |
Principal risks of investing in the Fund
Debt securities risk. The prices of debt securities held by the Fund will be affected by changes in interest rates, the credit-worthiness of the issuer and other factors. An increase in prevailing interest rates typically causes the value of existing debt securities to fall and often has a greater impact on longer-duration debt securities and higher quality debt securities. Falling interest rates will cause the Fund to reinvest the proceeds of debt securities that have been repaid by the issuer at lower interest rates. Falling interest rates may also reduce the Fund’s distributable income because interest payments on floating rate debt instruments held by the Fund will decline. The Fund could lose money on investments in debt securities if the issuer or borrower fails to meet its obligations to make interest payments and/or to repay principal in a timely manner. Changes in an issuer’s financial strength, the market’s perception of such strength or in the credit rating of the issuer or the security may affect the value of debt securities. The Adviser’s credit analysis may fail to anticipate such changes, which could result in buying a debt security at an inopportune time or failing to sell a debt security in advance of a price decline or other credit event.
Management risk. The Fund is actively managed and depends heavily on the Adviser’s judgment about markets, interest rates or the attractiveness, relative values, liquidity, or potential appreciation of particular investments made for the Fund’s portfolio. The Fund could experience losses if these judgments prove to be incorrect. Additionally, legislative, regulatory, or tax developments may adversely affect management of the Fund and, therefore, the ability of the Fund to achieve its investment objective.
Market risk. The market values of the Fund’s investments, and therefore the value of the Fund’s shares, will go up and down, sometimes rapidly or unpredictably. Market risk may affect a single issuer, industry or section of the economy, or it may affect the market as a whole. Individual stock prices tend to go up and down more dramatically than those of certain other types of investments, such as bonds. During a general downturn in
the financial markets, multiple asset classes may decline in value. When markets perform well, there can be no assurance that specific investments held by the Fund will rise in value.
Money market fund risk. Although the Fund seeks to preserve the value of your investment at $1.00 per share, you may lose money by investing in the Fund. The share price of money market funds can fall below the $1.00 share price. The Fund’s sponsor has no legal obligation to provide financial support to the Fund, and you should not rely on or expect that the sponsor will enter into support agreements or take other actions to provide financial support to the Fund or maintain the Fund’s $1.00 share price at any time. The credit quality of the Fund’s holdings can change rapidly in certain markets, and the default of a single holding could have an adverse impact on the Fund’s share price. The Fund’s share price can also be negatively affected during periods of high redemption pressures, illiquid markets, and/or significant market volatility. Furthermore, amendments to money market fund regulations could impact the Fund’s operations and possibly negatively impact its return. While the Board of Trustees may implement procedures to impose a fee upon the sale of your shares or temporarily suspend your ability to sell shares in the future if the Fund’s liquidity falls below required minimums because of market conditions or other factors, the Board has not elected to do so at this time. Should the Board elect to do so, such change would only become effective after shareholders were provided with specific advance notice of the change in the Fund’s policy and provided with the opportunity to redeem their shares in accordance with Rule 2a-7 before the policy change became effective.
Repurchase agreement risk. If the seller of a repurchase agreement defaults or otherwise does not fulfill its obligations, the Fund may incur delays and losses arising from selling the underlying securities, enforcing its rights, or declining collateral value.
US government obligations risk. Obligations of US government agencies and authorities receive varying levels of support and may not be backed by the full faith and credit of the US government, which could affect the Fund’s ability to recover
should they default. No assurance can be given that the US government will provide financial support to its agencies and authorities if it is not obligated by law to do so.
Yield risk. The Fund’s yield will vary as the short-term securities in its portfolio mature or are sold and the proceeds are reinvested in other securities. When interest rates are very low, the Fund’s expenses could absorb all or a portion of the Fund’s income and yield. Additionally, inflation may outpace and diminish investment returns over time.
Invesco V.I. Government Money Market Fund
Schedule of Investments
December 31, 2017
| | | | | | | | | | | | | | | | |
| | | Interest
Rate | | | Maturity
Date | | | Principal
Amount
(000) | | | Value | |
U.S. Government Sponsored Agency Securities–31.02% | |
| Federal Farm Credit Bank (FFCB)–3.02% | |
Unsec. Bonds (1 mo. USD LIBOR + 0.03%)(a) | | | 1.52 | % | | | 01/17/2018 | | | $ | 5,715 | | | $ | 5,714,943 | |
Unsec. Bonds (3 mo. USD LIBOR – 0.03%)(a) | | | 1.46 | % | | | 03/02/2018 | | | | 5,000 | | | | 5,001,323 | |
Unsec. Bonds (3 mo. USD LIBOR – 0.05%)(a) | | | 1.62 | % | | | 03/26/2018 | | | | 1,200 | | | | 1,200,718 | |
Unsec. Bonds (1 mo. USD LIBOR + 0.02%)(a) | | | 1.51 | % | | | 05/17/2018 | | | | 3,000 | | | | 3,000,000 | |
Unsec. Bonds (3 mo. USD LIBOR + 0.02%)(a) | | | 1.47 | % | | | 05/22/2018 | | | | 2,500 | | | | 2,503,197 | |
Unsec. Bonds (1 mo. USD LIBOR – 0.06%)(a) | | | 1.31 | % | | | 12/04/2019 | | | | 5,000 | | | | 4,999,749 | |
| | | | | | | | | | | | | | | | 22,419,930 | |
|
| Federal Home Loan Bank (FHLB)–24.56% | |
Unsec. Bonds (3 mo. USD LIBOR – 0.07%)(a) | | | 1.31 | % | | | 01/26/2018 | | | | 3,000 | | | | 3,000,207 | |
Unsec. Global Bonds (3 mo. USD LIBOR – 0.15%)(a) | | | 1.30 | % | | | 02/23/2018 | | | | 4,000 | | | | 4,000,000 | |
Unsec. Bonds (3 mo. USD LIBOR – 0.16%)(a) | | | 1.30 | % | | | 02/26/2018 | | | | 2,000 | | | | 2,000,646 | |
Unsec. Disc. Notes(b) | | | 1.40 | % | | | 03/26/2018 | | | | 1,251 | | | | 1,246,962 | |
Unsec. Global Bonds (3 mo. USD LIBOR – 0.18%)(a) | | | 1.50 | % | | | 03/26/2018 | | | | 5,000 | | | | 5,000,000 | |
Unsec. Disc. Notes(b) | | | 1.39 | % | | | 03/28/2018 | | | | 15,000 | | | | 14,950,771 | |
Unsec. Bonds (3 mo. USD LIBOR – 0.26%)(a) | | | 1.10 | % | | | 04/13/2018 | | | | 5,000 | | | | 4,999,989 | |
Unsec. Bonds (3 mo. USD LIBOR – 0.26%)(a) | | | 1.10 | % | | | 04/13/2018 | | | | 3,000 | | | | 2,999,990 | |
Unsec. Bonds (3 mo. USD LIBOR – 0.27%)(a) | | | 1.09 | % | | | 04/23/2018 | | | | 4,000 | | | | 3,999,938 | |
Unsec. Global Bonds (3 mo. USD LIBOR – 0.35%)(a) | | | 1.06 | % | | | 05/14/2018 | | | | 10,000 | | | | 9,998,532 | |
Unsec. Bonds (1 mo. USD LIBOR – 0.11%)(a) | | | 1.26 | % | | | 08/01/2018 | | | | 5,000 | | | | 5,000,000 | |
Unsec. Bonds (3 mo. USD LIBOR – 0.31%)(a) | | | 1.11 | % | | | 08/15/2018 | | | | 12,000 | | | | 11,997,238 | |
Unsec. Bonds (1 mo. USD LIBOR – 0.13%)(a) | | | 1.30 | % | | | 10/10/2018 | | | | 3,000 | | | | 3,000,000 | |
Unsec. Bonds (1 mo. USD LIBOR – 0.13%)(a) | | | 1.30 | % | | | 10/10/2018 | | | | 10,000 | | | | 10,000,000 | |
Unsec. Bonds (1 mo. USD LIBOR – 0.13%)(a) | | | 1.25 | % | | | 11/05/2018 | | | | 12,000 | | | | 12,000,000 | |
Unsec. Bonds (1 mo. USD LIBOR – 0.13%)(a) | | | 1.30 | % | | | 11/09/2018 | | | | 3,000 | | | | 3,000,000 | |
Unsec. Bonds (1 mo. USD LIBOR – 0.12%)(a) | | | 1.36 | % | | | 12/14/2018 | | | | 10,000 | | | | 10,000,000 | |
Unsec. Global Bonds (1 mo. USD LIBOR – 0.12%)(a) | | | 1.39 | % | | | 12/21/2018 | | | | 5,000 | | | | 5,000,000 | |
Unsec. Bonds (1 mo. USD LIBOR – 0.09%)(a) | | | 1.38 | % | | | 01/14/2019 | | | | 9,000 | | | | 9,000,000 | |
Unsec. Bonds (1 mo. USD LIBOR – 0.08%)(a) | | | 1.35 | % | | | 02/11/2019 | | | | 3,000 | | | | 3,000,000 | |
Unsec. Bonds (1 mo. USD LIBOR – 0.08%)(a) | | | 1.35 | % | | | 02/11/2019 | | | | 5,000 | | | | 5,000,000 | |
Unsec. Bonds (1 mo. USD LIBOR – 0.07%)(a) | | | 1.41 | % | | | 02/15/2019 | | | | 10,000 | | | | 10,000,000 | |
Unsec. Bonds (1 mo. USD LIBOR – 0.08%)(a) | | | 1.49 | % | | | 02/28/2019 | | | | 5,000 | | | | 5,000,000 | |
Unsec. Bonds (1 mo. USD LIBOR – 0.08%)(a) | | | 1.31 | % | | | 03/06/2019 | | | | 8,000 | | | | 8,000,000 | |
Unsec. Bonds (1 mo. USD LIBOR – 0.08%)(a) | | | 1.42 | % | | | 03/20/2019 | | | | 2,000 | | | | 2,000,000 | |
Unsec. Bonds (1 mo. USD LIBOR – 0.11%)(a) | | | 1.43 | % | | | 04/22/2019 | | | | 3,000 | | | | 3,000,000 | |
Unsec. Bonds (1 mo. USD LIBOR – 0.09%)(a) | | | 1.40 | % | | | 05/17/2019 | | | | 20,000 | | | | 20,000,000 | |
Unsec. Global Bonds (1 mo. USD LIBOR – 0.09%)(a) | | | 1.39 | % | | | 06/14/2019 | | | | 5,000 | | | | 5,000,000 | |
| | | | | | | | | | | | | | | | 182,194,273 | |
|
| Overseas Private Investment Corp. (OPIC)–3.44% | |
Unsec. Gtd. VRD COP Bonds (3 mo. U.S. Treasury Bill Rate)(c) | | | 1.49 | % | | | 09/15/2020 | | | | 5,000 | | | | 5,000,000 | |
Sr. Unsec. Gtd. VRD COP Bonds (3 mo. U.S. Treasury Bill Rate)(c) | | | 1.49 | % | | | 06/15/2025 | | | | 3,000 | | | | 3,000,000 | |
Sr. Unsec. Gtd. VRD COP Bonds (3 mo. U.S. Treasury Bill Rate)(c) | | | 1.49 | % | | | 02/15/2028 | | | | 10,000 | | | | 10,000,000 | |
Unsec. Gtd. VRD COP Bonds (3 mo. U.S. Treasury Bill Rate)(c) | | | 1.55 | % | | | 07/07/2040 | | | | 7,500 | | | | 7,500,000 | |
| | | | | | | | | | | | | | | | 25,500,000 | |
Total U.S. Government Sponsored Agency Securities (Cost $230,114,203) | | | | | | | | | | | | | | | 230,114,203 | |
See accompanying Notes to Financial Statements which are an integral part of the financial statements.
Invesco V.I. Government Money Market Fund
| | | | | | | | | | | | | | | | |
| | | Interest
Rate | | | Maturity
Date | | | Principal
Amount
(000) | | | Value | |
U.S. Treasury Securities–16.15% | |
| U.S. Treasury Bills–12.78%(b) | |
U.S. Treasury Bills | | | 1.09 | % | | | 01/18/2018 | | | $ | 15,000 | | | $ | 14,988,930 | |
U.S. Treasury Bills | | | 1.13 | % | | | 02/01/2018 | | | | 15,000 | | | | 14,985,875 | |
U.S. Treasury Bills | | | 1.19 | % | | | 02/08/2018 | | | | 15,000 | | | | 14,981,731 | |
U.S. Treasury Bills | | | 1.29 | % | | | 03/08/2018 | | | | 15,000 | | | | 14,965,063 | |
U.S. Treasury Bills | | | 1.32 | % | | | 03/15/2018 | | | | 15,000 | | | | 14,960,400 | |
U.S. Treasury Bills | | | 1.23 | % | | | 04/12/2018 | | | | 15,000 | | | | 14,949,167 | |
U.S. Treasury Bills | | | 1.54 | % | | | 06/28/2018 | | | | 5,000 | | | | 4,962,387 | |
Total U.S. Treasury Bills (Cost $94,793,553) | | | | | | | | | | | | | | | 94,793,553 | |
|
| U.S. Treasury Notes–3.37% | |
U.S. Treasury Floating Rate Notes (3 mo. U.S. Treasury Bill Money Market Yield Rate + 0.07%)(a) | | | 1.52 | % | | | 04/30/2019 | | | | 11,000 | | | | 11,001,588 | |
U.S. Treasury Floating Rate Notes (3 mo. U.S. Treasury Bill Money Market Yield Rate + 0.06%)(a) | | | 1.51 | % | | | 07/31/2019 | | | | 6,000 | | | | 5,999,796 | |
U.S. Treasury Floating Rate Notes (3 mo. U.S. Treasury Bill Money Market Yield Rate + 0.05%)(a) | | | 1.50 | % | | | 10/31/2019 | | | | 8,000 | | | | 8,001,877 | |
Total U.S. Treasury Notes (Cost $25,003,261) | | | | | | | | | | | | | | | 25,003,261 | |
Total U.S. Treasury Securities (Cost $119,796,814) | | | | | | | | | | | | | | | 119,796,814 | |
TOTAL INVESTMENTS IN SECURITIES (excluding Repurchase Agreements)–47.17% (Cost $349,911,017) | | | | | | | | | | | | | | | 349,911,017 | |
| | | | |
| | | | | | | | | Repurchase
Amount | | | | |
Repurchase Agreements–59.51%(d) | | | | | | | | | | | | | | | | |
ABN AMRO Bank N.V., joint agreement dated 12/29/2017, aggregate maturing value of $700,000,000 (collateralized by U.S. Treasury obligations and domestic agency mortgage-backed securities valued at $714,000,014; 0.13%-6.50%; 10/31/2018-04/20/2047) | | | 1.41 | % | | | 01/02/2018 | | | | 35,000,000 | | | | 35,000,000 | |
Bank of Nova Scotia, joint agreement dated 12/29/2017, aggregate maturing value of $200,000,000 (collateralized by domestic agency mortgage-backed securities valued at $204,000,000; 2.50%-6.50%; 04/01/2026-11/01/2047) | | | 1.38 | % | | | 01/02/2018 | | | | 35,000,000 | | | | 35,000,000 | |
BNP Paribas Securities Corp., joint agreement dated 12/29/2017, aggregate maturing value of $400,062,222 (collateralized by U.S. Treasury obligations valued at $407,776,966; 0.13%; 04/15/2019-04/15/2021) | | | 1.40 | % | | | 01/02/2018 | | | | 30,004,667 | | | | 30,000,000 | |
BNP Paribas Securities Corp., joint term agreement dated 12/28/2017, aggregate maturing value of $250,067,083 (collateralized by U.S. Treasury obligations valued at $255,234,376; 0.13%; 07/15/2022)(e) | | | 1.38 | % | | | 01/04/2018 | | | | 25,006,708 | | | | 25,000,000 | |
Canadian Imperial Bank of Commerce, joint term agreement dated 12/14/2017, aggregate maturing value of $775,000,000 (collateralized by domestic agency mortgage-backed securities and U.S. Treasury obligations valued at $790,500,000; 1.50%-4.50%; 09/30/2024-10/01/2047)(e) | | | 1.34 | % | | | 01/12/2018 | | | | 25,000,000 | | | | 25,000,000 | |
Fixed Income Clearing Corp.-Bank of New York Mellon (The), agreement dated 12/29/2017, maturing value of $70,000,000 (collateralized by a U.S. Treasury obligation valued at $71,400,083; 1.13%; 09/30/2021) | | | 1.44 | % | | | 01/02/2018 | | | | 70,000,000 | | | | 70,000,000 | |
ING Financial Markets, LLC, joint term agreement dated 12/14/2017, aggregate maturing value of $375,000,000 (collateralized by U.S. Treasury obligations and domestic agency mortgage-backed securities valued at $382,500,138; 1.88%-7.00%; 04/01/2020-01/01/2048) | | | 1.40 | % | | | 03/22/2018 | | | | 3,000,000 | | | | 3,000,000 | |
Lloyds Bank PLC, joint term agreement dated 12/04/2017, aggregate maturing value of $501,794,722 (collateralized by U.S. Treasury obligations valued at $509,215,248; 1.38%-3.13%; 06/30/2020-08/15/2025) | | | 1.42 | % | | | 03/05/2018 | | | | 15,053,842 | | | | 15,000,000 | |
Lloyds Bank PLC, joint term agreement dated 12/11/2017, aggregate maturing value of $500,695,139 (collateralized by U.S. Treasury obligations valued at $509,630,515; 1.00%-2.63%; 11/30/2019-11/15/2020) | | | 1.43 | % | | | 01/17/2018 | | | | 5,006,951 | | | | 5,000,000 | |
Lloyds Bank PLC, joint term agreement dated 12/11/2017, aggregate maturing value of $500,871,944 (collateralized by U.S. Treasury obligations valued at $509,518,277; 1.00%-7.50%; 10/31/2019-11/15/2024) | | | 1.46 | % | | | 01/25/2018 | | | | 10,017,439 | | | | 10,000,000 | |
See accompanying Notes to Financial Statements which are an integral part of the financial statements.
Invesco V.I. Government Money Market Fund
| | | | | | | | | | | | | | | | |
| | | Interest
Rate | | | Maturity
Date | | | Repurchase
Amount | | | Value | |
Metropolitan Life Insurance Co., joint term agreement dated 12/27/2017, aggregate maturing value of $700,198,098 (collateralized by U.S. Treasury obligations valued at $720,425,977; 0%-4.50%; 01/25/2018-02/15/2043)(e) | | | 1.42 | % | | | 01/03/2018 | | | $ | 15,005,004 | | | $ | 15,000,863 | |
Mitsubishi UFJ Trust and Banking Corp., joint term agreement dated 12/27/2017, aggregate maturing value of $1,397,005,192 (collateralized by U.S. Treasury obligations valued at $1,430,453,729; 0%-2.25%; 09/30/2021-08/15/2045)(e) | | | 1.40 | % | | | 01/03/2018 | | | | 14,441,430 | | | | 14,437,500 | |
RBC Capital Markets LLC, joint term agreement dated 12/14/2017, aggregate maturing value of $1,100,000,000 (collateralized by domestic agency mortgage-backed securities, U.S. Treasury obligations and U.S. government sponsored agency obligations valued at $1,122,000,015; 0%-7.00%; 04/30/2019-11/20/2064)(e) | | | 1.35 | % | | | 02/01/2018 | | | | 10,000,000 | | | | 10,000,000 | |
RBC Capital Markets LLC, joint term agreement dated 12/15/2017, aggregate maturing value of $75,000,000 (collateralized by domestic agency mortgage-backed securities valued at $76,500,001; 2.35%-4.00%; 05/01/2030-01/25/2048)(e) | | | 1.35 | % | | | 02/02/2018 | | | | 5,000,000 | | | | 5,000,000 | |
RBC Capital Markets LLC, joint term agreement dated 12/29/2017, aggregate maturing value of $1,000,000,000 (collateralized by domestic agency mortgage-backed securities valued at $1,020,000,000; 0%-7.00%; 03/01/2018-04/25/2053)(e) | | | 1.42 | % | | | 02/28/2018 | | | | 45,000,000 | | | | 45,000,000 | |
Societe Generale, joint open agreement dated 04/27/2017 (collateralized by domestic agency mortgage-backed securities, U.S. Treasury obligations and U.S. government sponsored agency obligations valued at $1,530,000,091; 0%-9.00%; 12/31/2017-08/15/2047)(f) | | | 0.83 | % | | | — | | | | — | | | | 30,000,000 | |
Sumitomo Mitsui Banking Corp., joint agreement dated 12/29/2017, aggregate maturing value of $3,000,000,000 (collateralized by domestic agency mortgage-backed securities valued at $3,060,000,001; 3.00%-3.50%; 05/20/2045-07/20/2047) | | | 1.43 | % | | | 01/02/2018 | | | | 34,103,272 | | | | 34,103,272 | |
Wells Fargo Securities, LLC, joint agreement dated 12/29/2017, aggregate maturing value of $760,000,000 (collateralized by domestic agency mortgage-backed securities valued at $775,200,000; 4.00%; 12/01/2047-01/01/2048) | | | 1.41 | % | | | 01/02/2018 | | | | 35,000,000 | | | | 35,000,000 | |
Total Repurchase Agreements (Cost $441,541,635) | | | | | | | | | | | | | | | 441,541,635 | |
TOTAL INVESTMENTS IN SECURITIES(g)–106.68% (Cost $791,452,652) | | | | | | | | | | | | | | | 791,452,652 | |
OTHER ASSETS LESS LIABILITIES–(6.68)% | | | | | | | | | | | | | | | (49,543,250 | ) |
NET ASSETS–100.00% | | | | | | | | | | | | | | $ | 741,909,402 | |
Investment Abbreviations:
| | |
| COP | | – Certificates of Participation |
| Disc. | | – Discounted |
| Gtd. | | – Guaranteed |
| LIBOR | | – London Interbank Offered Rate |
| Sr. | | – Senior |
| Unsec. | | – Unsecured |
| USD | | – U.S. Dollar |
| VRD | | – Variable Rate Demand |
Notes to Schedule of Investments:
| (a) | Interest or dividend rate is redetermined periodically. Rate shown is the rate in effect on December 31, 2017. |
| (b) | Security may be traded on a discount basis. The interest rate shown represents the discount rate at the time of purchase by the Fund. |
| (c) | Demand security payable upon demand by the Fund at specified time intervals no greater than thirteen months. Interest rate is redetermined periodically based on current market interest rates. Rate shown is the rate in effect on December 31, 2017. |
| (d) | Principal amount equals value at period end. See Note 1I. |
| (e) | The Fund may demand payment of the term repurchase agreement upon one to seven business days’ notice depending on the timing of the demand. |
| (f) | Either party may terminate the agreement upon demand. Interest rates, principal amount and collateral are redetermined daily. |
| (g) | Also represents cost for federal income tax purposes. |
See accompanying Notes to Financial Statements which are an integral part of the financial statements.
Invesco V.I. Government Money Market Fund
Statement of Assets and Liabilities
December 31, 2017
Statement of Operations
For the year ended December 31, 2017
| | | | |
Assets: | | | | |
Investments, excluding repurchase agreements, at value and cost | | $ | 349,911,017 | |
Repurchase agreements at value and cost | | | 441,541,635 | |
Receivable for: | | | | |
Fund shares sold | | | 25,985 | |
Interest | | | 386,682 | |
Investment for trustee deferred compensation and retirement plans | | | 52,354 | |
Total assets | | | 791,917,673 | |
| |
Liabilities: | | | | |
Payable for: | | | | |
Dividends | | | 11,517 | |
Fund shares reacquired | | | 49,260,958 | |
Amount due custodian | | | 267,479 | |
Accrued fees to affiliates | | | 337,480 | |
Accrued trustees’ and officers’ fees and benefits | | | 1,017 | |
Accrued other operating expenses | | | 68,042 | |
Trustee deferred compensation and retirement plans | | | 61,778 | |
Total liabilities | | | 50,008,271 | |
Net assets applicable to shares outstanding | | $ | 741,909,402 | |
| |
Net assets consist of: | | | | |
Shares of beneficial interest | | $ | 741,924,142 | |
Undistributed net investment income | | | 2,617 | |
Undistributed net realized gain (loss) | | | (17,357 | ) |
| | | $ | 741,909,402 | |
| |
Net Assets: | | | | |
Series I | | $ | 656,368,120 | |
Series II | | $ | 85,541,282 | |
|
Shares outstanding, no par value,
with an unlimited number of shares authorized: | |
Series I | | | 656,369,794 | |
Series II | | | 85,541,486 | |
Series I: | | | | |
Net asset value per share | | $ | 1.00 | |
Series II: | | | | |
Net asset value per share | | $ | 1.00 | |
| | | | |
Investment income: | | | | |
Interest | | $ | 6,895,305 | |
| |
Expenses: | | | | |
Advisory fees | | | 1,071,836 | |
Administrative services fees | | | 1,427,369 | |
Custodian fees | | | 24,380 | |
Distribution fees — Series II | | | 228,828 | |
Transfer agent fees | | | 45,872 | |
Trustees’ and officers’ fees and benefits | | | 30,247 | |
Reports to shareholders | | | 98,088 | |
Professional services fees | | | 132,351 | |
Other | | | 40,154 | |
Total expenses | | | 3,099,125 | |
Less: Expenses reimbursed | | | (2,159 | ) |
Net expenses | | | 3,096,966 | |
Net investment income | | | 3,798,339 | |
Net realized gain (loss) from investment securities | | | (17,357 | ) |
Net increase in net assets resulting from operations | | $ | 3,780,982 | |
See accompanying Notes to Financial Statements which are an integral part of the financial statements.
Invesco V.I. Government Money Market Fund
Statement of Changes in Net Assets
For the years ended December 31, 2017 and 2016
| | | | | | | | |
| | | 2017 | | | 2016 | |
Operations: | | | | | | | | |
Net investment income | | $ | 3,798,339 | | | $ | 667,531 | |
Net realized gain (loss) | | | (17,357 | ) | | | 8,180 | |
Net increase in net assets resulting from operations | | | 3,780,982 | | | | 675,711 | |
| | |
Distributions to shareholders from net investment income: | | | | | | | | |
Series I | | | (3,515,426 | ) | | | (637,907 | ) |
Series ll | | | (282,913 | ) | | | (29,624 | ) |
Total distributions from net investment income | | | (3,798,339 | ) | | | (667,531 | ) |
| | |
Share transactions-net: | | | | | | | | |
Series l | | | 19,851,083 | | | | (101,332,142 | ) |
Series ll | | | (11,818,876 | ) | | | 73,420,621 | |
Net increase (decrease) in net assets resulting from share transactions | | | 8,032,207 | | | | (27,911,521 | ) |
Net increase (decrease) in net assets | | | 8,014,850 | | | | (27,903,341 | ) |
| | |
Net assets: | | | | | | | | |
Beginning of year | | | 733,894,552 | | | | 761,797,893 | |
End of year (includes undistributed net investment income of $2,617 and $(5,563), respectively) | | $ | 741,909,402 | | | $ | 733,894,552 | |
Notes to Financial Statements
December 31, 2017
NOTE 1—Significant Accounting Policies
Invesco V.I. Government Money Market Fund (the “Fund”) is a series portfolio of AIM Variable Insurance Funds (Invesco Variable Insurance Funds) (the “Trust”). The Trust is a Delaware statutory trust registered under the Investment Company Act of 1940, as amended (the “1940 Act”), as an open-end series management investment company consisting of twenty-four separate portfolios, (each constituting a “Fund”). The assets, liabilities and operations of each portfolio are accounted for separately. Information presented in these financial statements pertains only to the Fund. Matters affecting each Fund or class will be voted on exclusively by the shareholders of such Fund or class. Current Securities and Exchange Commission (“SEC”) guidance, however, requires participating insurance companies offering separate accounts to vote shares proportionally in accordance with the instructions of the contract owners whose investments are funded by shares of each Fund or class.
The Fund’s investment objective is to provide current income consistent with preservation of capital and liquidity.
The Fund currently offers two classes of shares, Series I and Series II, both of which are offered to insurance company separate accounts funding variable annuity contracts and variable life insurance policies (“variable products”).
The Fund is an investment company and accordingly follows the investment company accounting and reporting guidance in accordance with Financial Accounting Standards Board Accounting Standards Codification Topic 946, Financial Services – Investment Companies.
The following is a summary of the significant accounting policies followed by the Fund in the preparation of its financial statements.
| A. | Security Valuations — The Fund’s securities are recorded on the basis of amortized cost which approximates value as permitted by Rule 2a-7 under the 1940 Act. This method values a security at its cost on the date of purchase and, thereafter, assumes a constant amortization to maturity of any premiums or accretion of any discounts. |
Because of the inherent uncertainties of valuation, the values reflected in the financial statements may materially differ from the value received upon actual sale of those investments.
The Fund may invest in securities that are subject to interest rate risk, meaning the risk that the prices will generally fall as interest rates rise and, conversely, the prices will generally rise as interest rates fall. Specific securities differ in their sensitivity to changes in interest rates depending on their individual characteristics. Changes in interest rates may result in increased market volatility, which may affect the value and/or liquidity of certain Fund investments.
| B. | Securities Transactions and Investment Income — Securities transactions are accounted for on a trade date basis. Realized gains or losses on sales are computed on the basis of specific identification of the securities sold. Interest income (net of withholding tax, if any) is recorded on the accrual basis from settlement date. Bond premiums and discounts are amortized and/or accreted over the lives of the respective securities. Pay-in-kind interest income and non-cash dividend income received in the form of securities in-lieu of cash are recorded at the fair value of the securities received. Paydown gains and losses on mortgage and asset-backed securities are recorded as adjustments to interest income. |
The Fund may periodically participate in litigation related to Fund investments. As such, the Fund may receive proceeds from litigation settlements. Any proceeds received are included in the Statement of Operations as realized gain (loss) for investments no longer held and as unrealized gain (loss) for investments still held.
Invesco V.I. Government Money Market Fund
Brokerage commissions and mark ups are considered transaction costs and are recorded as an increase to the cost basis of securities purchased and/or a reduction of proceeds on a sale of securities. Such transaction costs are included in the determination of net realized gain (loss) from investment securities reported in the Statement of Operations and the Statement of Changes in Net Assets and the net realized gains (losses) on securities per share in the Financial Highlights. Transaction costs are included in the calculation of the Fund’s net asset value and, accordingly, they reduce the Fund’s total returns. These transaction costs are not considered operating expenses and are not reflected in net investment income reported in the Statement of Operations and the Statement of Changes in Net Assets, or the net investment income per share and the ratios of expenses and net investment income reported in the Financial Highlights, nor are they limited by any expense limitation arrangements between the Fund and the investment adviser.
The Fund allocates realized and unrealized capital gains and losses to a class based on the relative net assets of each class. The Fund allocates income to a class based on the relative value of the settled shares of each class.
| C. | Country Determination — For the purposes of making investment selection decisions and presentation in the Schedule of Investments, the investment adviser may determine the country in which an issuer is located and/or credit risk exposure based on various factors. These factors include the laws of the country under which the issuer is organized, where the issuer maintains a principal office, the country in which the issuer derives 50% or more of its total revenues and the country that has the primary market for the issuer’s securities, as well as other criteria. Among the other criteria that may be evaluated for making this determination are the country in which the issuer maintains 50% or more of its assets, the type of security, financial guarantees and enhancements, the nature of the collateral and the sponsor organization. Country of issuer and/or credit risk exposure has been determined to be the United States of America, unless otherwise noted. |
| D. | Distributions — Distributions from net investment income, if any, are declared daily and paid monthly to separate accounts of participating insurance companies. Distributions from net realized gain, if any, are generally declared and paid annually and recorded on the ex-dividend date. |
| E. | Federal Income Taxes — The Fund intends to comply with the requirements of Subchapter M of the Internal Revenue Code of 1986, as amended (the “Internal Revenue Code”), necessary to qualify as a regulated investment company and to distribute substantially all of the Fund’s taxable earnings to shareholders. As such, the Fund will not be subject to federal income taxes on otherwise taxable income (including net realized capital gain) that is distributed to shareholders. Therefore, no provision for federal income taxes is recorded in the financial statements. |
The Fund recognizes the tax benefits of uncertain tax positions only when the position is more likely than not to be sustained. Management has analyzed the Fund’s uncertain tax positions and concluded that no liability for unrecognized tax benefits should be recorded related to uncertain tax positions. Management is not aware of any tax positions for which it is reasonably possible that the total amounts of unrecognized tax benefits will change materially in the next 12 months.
The Fund files tax returns in the U.S. Federal jurisdiction and certain other jurisdictions. Generally, the Fund is subject to examinations by such taxing authorities for up to three years after the filing of the return for the tax period.
| F. | Expenses — Fees provided for under the Rule 12b-1 plan of a particular class of the Fund and which are directly attributable to that class are charged to the operations of such class. All other expenses are allocated among the classes based on relative net assets. |
| G. | Accounting Estimates — The preparation of financial statements in conformity with accounting principles generally accepted in the United States of America (“GAAP”) requires management to make estimates and assumptions that affect the reported amounts of assets and liabilities at the date of the financial statements and the reported amounts of revenues and expenses during the reporting period including estimates and assumptions related to taxation. Actual results could differ from those estimates by a significant amount. In addition, the Fund monitors for material events or transactions that may occur or become known after the period-end date and before the date the financial statements are released to print. |
| H. | Indemnifications — Under the Trust’s organizational documents, each Trustee, officer, employee or other agent of the Trust is indemnified against certain liabilities that may arise out of the performance of their duties to the Fund. Additionally, in the normal course of business, the Fund enters into contracts, including the Fund’s servicing agreements, that contain a variety of indemnification clauses. The Fund’s maximum exposure under these arrangements is unknown as this would involve future claims that may be made against the Fund that have not yet occurred. The risk of material loss as a result of such indemnification claims is considered remote. |
| I. | Repurchase Agreements — The Fund may enter into repurchase agreements. Collateral on repurchase agreements, including the Fund’s pro-rata interest in joint repurchase agreements, is taken into possession by the Fund upon entering into the repurchase agreement. Collateral consisting of U.S. Government Securities and U.S. Government Sponsored Agency Securities is marked to market daily to ensure its market value is at least 102% of the sales price of the repurchase agreement. The investments in some repurchase agreements, pursuant to procedures approved by the Board of Trustees, are through participation with other mutual funds, private accounts and certain non-registered investment companies managed by the investment advisor or its affiliates (“Joint repurchase agreements”). The principal amount of the repurchase agreement is equal to the value at period-end. If the seller of a repurchase agreement fails to repurchase the security in accordance with the terms of the agreement, the Fund might incur expenses in enforcing its rights, and could experience losses, including a decline in the value of the collateral and loss of income. |
| J. | Other Risks — Investments in obligations issued by agencies and instrumentalities of the U.S. Government may vary in the level of support they receive from the government. The government may choose not to provide financial support to government sponsored agencies or instrumentalities if it is not legally obligated to do so. In this case, if the issuer defaulted, the Fund may not be able to recover its investment in such issuer from the U.S. Government. |
NOTE 2—Advisory Fees and Other Fees Paid to Affiliates
The Trust has entered into a master investment advisory agreement with Invesco Advisers, Inc. (the “Adviser” or “Invesco”). Under the terms of the investment advisory agreement, the Fund pays an advisory fee to the Adviser based on the annual rate of 0.15% of the Fund’s average daily net assets.
Under the terms of a master sub-advisory agreement between the Adviser and each of Invesco Asset Management Deutschland GmbH, Invesco Asset Management Limited, Invesco Asset Management (Japan) Limited, Invesco Hong Kong Limited, Invesco Senior Secured Management, Inc. and Invesco Canada Ltd. and separate sub-advisory agreements with Invesco PowerShares Capital Management LLC and Invesco Asset Management (India) Private Limited (collectively, the “Affiliated Sub-Advisers”) the Adviser, not the Fund, will pay 40% of the fees paid to the Adviser to any such
Invesco V.I. Government Money Market Fund
Affiliated Sub-Adviser(s) that provide(s) discretionary investment management services to the Fund based on the percentage of assets allocated to such Affiliated Sub-Adviser(s).
The Adviser has contractually agreed, through at least June 30, 2018, to waive advisory fees and/or reimburse expenses to the extent necessary to limit total annual operating expenses after fee waivers and/or expense reimbursements (excluding certain items discussed below) of Series I shares to 1.50% and Series II shares to 1.75% of average daily net assets (the “expense limits”). In determining the Adviser’s obligation to waive advisory fees and/or reimburse expenses, the following expenses are not taken into account, and could cause the total annual operating expenses after fee waivers and/or expense reimbursements to exceed the numbers reflected above: (1) interest; (2) taxes; (3) dividend expense on short sales; (4) extraordinary or non-routine items, including litigation expenses; and (5) expenses that the Fund has incurred but did not actually pay because of an expense offset arrangement. Unless Invesco continues the fee waiver agreement, it will terminate on June 30, 2018. During its term, the fee waiver agreement cannot be terminated or amended to increase the expense limits or reduce the advisory fee waiver without approval of the Board of Trustees. The Adviser did not waive fees and/or reimburse expenses during the period under these expense limits.
The Adviser and/or Invesco Distributors, Inc., (“IDI”) voluntarily agreed to waive fees and/or reimburse expenses in order to increase the Fund’s yield. Voluntary fee waivers and/or reimbursements may be modified at any time upon consultation with the Board of Trustees without further notice to investors.
For the year ended December 31, 2017, Invesco voluntarily reimbursed class level expenses of $2,159 for Series II shares in order to increase the Fund’s yield.
The Trust has entered into a master administrative services agreement with Invesco pursuant to which the Fund has agreed to pay Invesco a fee for costs incurred in providing accounting services and fund administrative services to the Fund and to reimburse Invesco for fees paid to insurance companies that have agreed to provide certain administrative services to the Fund. These administrative services provided by the insurance companies may include, among other things: maintenance of master accounts with the Fund; tracking, recording and transmitting net purchase and redemption orders for Fund shares; maintaining and preserving records related to the purchase, redemption and other account activity of variable product owners; distributing copies of Fund documents such as prospectuses, proxy materials and periodic reports, to variable product owners, and responding to inquiries from variable product owners about the Fund. Pursuant to such agreement, for the year ended December 31, 2017, Invesco was paid $383,715 for accounting and fund administrative services and was reimbursed $1,043,654 for fees paid to insurance companies.
The Trust has entered into a transfer agency and service agreement with Invesco Investment Services, Inc. (“IIS”) pursuant to which the Fund has agreed to pay IIS a fee for providing transfer agency and shareholder services to the Fund and reimburse IIS for certain expenses incurred by IIS in the course of providing such services. For the year ended December 31, 2017, expenses incurred under the agreement are shown in the Statement of Operations as Transfer agent fees.
The Trust has entered into a master distribution agreement with IDI to serve as the distributor for the Fund. The Trust has adopted a plan pursuant to Rule 12b-1 under the 1940 Act with respect to the Fund’s Series II shares (the “Plan”). The Fund, pursuant to the Plan, pays IDI compensation at the annual rate of 0.25% of the Fund’s average daily net assets of Series II shares. The fees are accrued daily and paid monthly. Of the Plan payments, up to 0.25% of the average daily net assets of the Series II shares may be paid to insurance companies who furnish continuing personal shareholder services to customers who purchase and own Series II shares of the Fund. For the year ended December 31, 2017, expenses incurred under the Plan are detailed in the Statement of Operations as Distribution fees.
Certain officers and trustees of the Trust are officers and directors of the Adviser, IIS and/or IDI.
NOTE 3—Additional Valuation Information
GAAP defines fair value as the price that would be received to sell an asset or paid to transfer a liability in an orderly transaction between market participants at the measurement date, under current market conditions. GAAP establishes a hierarchy that prioritizes the inputs to valuation methods, giving the highest priority to readily available unadjusted quoted prices in an active market for identical assets (Level 1) and the lowest priority to significant unobservable inputs (Level 3), generally when market prices are not readily available or are unreliable. Based on the valuation inputs, the securities or other investments are tiered into one of three levels. Changes in valuation methods may result in transfers in or out of an investment’s assigned level:
| | Level 1 — | Prices are determined using quoted prices in an active market for identical assets. |
| | Level 2 — | Prices are determined using other significant observable inputs. Observable inputs are inputs that other market participants may use in pricing a security. These may include quoted prices for similar securities, interest rates, prepayment speeds, credit risk, yield curves, loss severities, default rates, discount rates, volatilities and others. |
| | Level 3 — | Prices are determined using significant unobservable inputs. In situations where quoted prices or observable inputs are unavailable (for example, when there is little or no market activity for an investment at the end of the period), unobservable inputs may be used. Unobservable inputs reflect the Fund’s own assumptions about the factors market participants would use in determining fair value of the securities or instruments and would be based on the best available information. |
As of December 31, 2017, all of the securities in this Fund were valued based on Level 2 inputs (see the Schedule of Investments for security categories). The level assigned to the securities valuations may not be an indication of the risk or liquidity associated with investing in those securities. Because of the inherent uncertainties of valuation, the values reflected in the financial statements may materially differ from the value received upon actual sale of those investments.
The Fund’s policy is to recognize transfers in and out of the valuation levels as of the end of the reporting period. During the year ended December 31, 2017, there were no material transfers between valuation levels.
Invesco V.I. Government Money Market Fund
NOTE 4—Trustees’ and Officers’ Fees and Benefits
Trustees’ and Officers’ Fees and Benefits include amounts accrued by the Fund to pay remuneration to certain Trustees and Officers of the Fund. Trustees have the option to defer compensation payable by the Fund, and Trustees’ and Officers’ Fees and Benefits also include amounts accrued by the Fund to fund such deferred compensation amounts. Those Trustees who defer compensation have the option to select various Invesco Funds in which their deferral accounts shall be deemed to be invested. Finally, certain current Trustees were eligible to participate in a retirement plan that provided for benefits to be paid upon retirement to Trustees over a period of time based on the number of years of service. The Fund may have certain former Trustees who also participate in a retirement plan and receive benefits under such plan. Trustees’ and Officers’ Fees and Benefits include amounts accrued by the Fund to fund such retirement benefits. Obligations under the deferred compensation and retirement plans represent unsecured claims against the general assets of the Fund.
NOTE 5—Cash Balances
The Fund is permitted to temporarily carry a negative or overdrawn balance in its account with The Bank of New York Mellon, the custodian bank. Such balances, if any at period-end, are shown in the Statement of Assets and Liabilities under the payable caption Amount due custodian. To compensate the custodian bank for such overdrafts, the overdrawn Fund may either (1) leave funds as a compensating balance in the account so the custodian bank can be compensated by earning the additional interest; or (2) compensate by paying the custodian bank at a rate agreed upon by the custodian bank and Invesco, not to exceed the contractually agreed upon rate.
NOTE 6—Distributions to Shareholders and Tax Components of Net Assets
Tax Character of Distributions to Shareholders Paid During the Fiscal Years Ended December 31, 2017 and 2016:
| | | | | | | | |
| | | 2017 | | | 2016 | |
Ordinary income | | $ | 3,798,339 | | | $ | 667,531 | |
Tax Components of Net Assets at Period-End:
| | | | |
| | | 2017 | |
Undistributed ordinary income | | $ | 55,710 | |
Temporary book/tax differences | | | (53,093 | ) |
Capital loss carryforward | | | (17,357 | ) |
Shares of beneficial interest | | | 741,924,142 | |
Total net assets | | $ | 741,909,402 | |
The temporary book/tax differences are a result of timing differences between book and tax recognition of income and/or expenses. The Fund’s temporary book/tax differences are the result of the trustee deferral of compensation and retirement plan benefits.
Capital loss carryforward is calculated and reported as of a specific date. Results of transactions and other activity after that date may affect the amount of capital loss carryforward actually available for the Fund to utilize. Capital losses generated in years beginning after December 22, 2010 can be carried forward for an unlimited period, whereas previous losses expire in eight tax years. Capital losses with an expiration period may not be used to offset capital gains until all net capital losses without an expiration date have been utilized. Capital loss carryforwards with no expiration date will retain their character as either short-term or long-term capital losses instead of as short-term capital losses as under prior law. The ability to utilize capital loss carryforward in the future may be limited under the Internal Revenue Code and related regulations based on the results of future transactions.
The Fund has a capital loss carryforward as of December 31, 2017, which expires as follows:
| | | | | | | | | | | | |
| Capital Loss Carryforward* | |
| Expiration | | Short-Term | | | Long-Term | | | Total | |
Not subject to expiration | | $ | 17,357 | | | $ | — | | | $ | 17,357 | |
| * | Capital loss carryforward as of the date listed above is reduced for limitations, if any, to the extent required by the Internal Revenue Code and may be further limited depending upon a variety of factors, including the realization of net unrealized gains or losses as of the date of any reorganization. |
NOTE 7—Reclassification of Permanent Differences
Primarily as a result of differing book/tax treatment of distributions, on December 31, 2017, undistributed net investment income was increased by $8,180 and undistributed net realized gain (loss) was decreased by $8,180. This reclassification had no effect on the net assets of the Fund.
Invesco V.I. Government Money Market Fund
NOTE 8—Share Information
| | | | | | | | | | | | | | | | |
| | | Summary of Share Activity | |
| | | Years ended December 31, | |
| | | 2017(a) | | | 2016 | |
| | | Shares | | | Amount | | | Shares | | | Amount | |
Sold: | | | | | | | | | | | | | | | | |
Series I | | | 1,456,355,567 | | | $ | 1,456,355,567 | | | | 1,047,450,351 | | �� | $ | 1,047,450,351 | |
Series II | | | 45,247,987 | | | | 45,247,987 | | | | 145,053,508 | | | | 145,053,508 | |
| | | | |
Issued as reinvestment of dividends: | | | | | | | | | | | | | | | | |
Series I | | | 3,422,005 | | | | 3,422,005 | | | | 622,014 | | | | 622,014 | |
Series II | | | 282,913 | | | | 282,913 | | | | 29,624 | | | | 29,624 | |
| | | | |
Reacquired: | | | | | | | | | | | | | | | | |
Series I | | | (1,439,926,489 | ) | | | (1,439,926,489 | ) | | | (1,149,404,507 | ) | | | (1,149,404,507 | ) |
Series II | | | (57,349,776 | ) | | | (57,349,776 | ) | | | (71,662,511 | ) | | | (71,662,511 | ) |
Net increase (decrease) in share activity | | | 8,032,207 | | | $ | 8,032,207 | | | | (27,911,521 | ) | | $ | (27,911,521 | ) |
| (a) | There are entities that are record owners of more than 5% of the outstanding shares of the Fund and in the aggregate own 92% of the outstanding shares of the Fund. The Fund and the Fund’s principal underwriter or adviser, are parties to participation agreements with these entities whereby these entities sell units of interest in separate accounts funding variable products that are invested in the Fund. The Fund, Invesco and/or Invesco affiliates may make payments to these entities, which are considered to be related to the Fund, for providing services to the Fund, Invesco and/or Invesco affiliates including but not limited to services such as, securities brokerage, third party record keeping and account servicing and administrative services. The Fund has no knowledge as to whether all or any portion of the shares owned of record by these entities are also owned beneficially. |
NOTE 9—Financial Highlights
The following schedule presents financial highlights for a share of the Fund outstanding throughout the periods indicated.
| | | | | | | | | | | | | | | | | | | | | | | | | | | | | | | | | | | | | | | | | | | | |
| | | Net asset
value,
beginning
of period | | | Net
investment
income(a) | | | Net realized
gains
(losses)
on securities | | | Total from
investment
operations | | | Dividends
from net
investment
income | | | Net asset
value, end
of period | | | Total
return(b) | | | Net assets,
end of period
(000’s omitted) | | | Ratio of
expenses
to average
net assets
with fee waivers
and/or expenses
absorbed | | | Ratio of
expenses
to average net
assets without
fee waivers
and/or expenses
absorbed | | | Ratio of net
investment
income
to average
net assets | |
Series I | | | | | | | | | | | | | | | | | | | | | | | | | | | | | | | | | | | | | | | | | | | | |
Year ended 12/31/17 | | $ | 1.00 | | | $ | 0.01 | | | $ | (0.00 | ) | | $ | 0.01 | | | $ | (0.01 | ) | | $ | 1.00 | | | | 0.56 | % | | $ | 656,368 | | | | 0.40 | %(c) | | | 0.40 | %(c) | | | 0.56 | %(c) |
Year ended 12/31/16 | | | 1.00 | | | | 0.00 | | | | 0.00 | | | | 0.00 | | | | (0.00 | ) | | | 1.00 | | | | 0.10 | | | | 636,532 | | | | 0.35 | | | | 0.38 | | | | 0.10 | |
Year ended 12/31/15 | | | 1.00 | | | | 0.00 | | | | 0.00 | | | | 0.00 | | | | (0.00 | ) | | | 1.00 | | | | 0.01 | | | | 737,858 | | | | 0.21 | | | | 0.51 | | | | 0.01 | |
Year ended 12/31/14 | | | 1.00 | | | | 0.00 | | | | 0.00 | | | | 0.00 | | | | (0.00 | ) | | | 1.00 | | | | 0.01 | | | | 606,553 | | | | 0.16 | | | | 0.50 | | | | 0.01 | |
Year ended 12/31/13 | | | 1.00 | | | | 0.00 | | | | (0.00 | ) | | | 0.00 | | | | (0.00 | ) | | | 1.00 | | | | 0.03 | | | | 422,491 | | | | 0.16 | | | | 0.70 | | | | 0.03 | |
Series II | | | | | | | | | | | | | | | | | | | | | | | | | | | | | | | | | | | | | | | | | | | | |
Year ended 12/31/17 | | | 1.00 | | | | 0.00 | | | | (0.00 | ) | | | 0.00 | | | | (0.00 | ) | | | 1.00 | | | | 0.31 | | | | 85,541 | | | | 0.65 | (c) | | | 0.65 | (c) | | | 0.31 | (c) |
Year ended 12/31/16 | | | 1.00 | | | | 0.00 | | | | 0.00 | | | | 0.00 | | | | (0.00 | ) | | | 1.00 | | | | 0.03 | | | | 97,362 | | | | 0.43 | | | | 0.63 | | | | 0.02 | |
Year ended 12/31/15 | | | 1.00 | | | | 0.00 | | | | 0.00 | | | | 0.00 | | | | (0.00 | ) | | | 1.00 | | | | 0.01 | | | | 23,940 | | | | 0.21 | | | | 0.76 | | | | 0.01 | |
Year ended 12/31/14 | | | 1.00 | | | | 0.00 | | | | 0.00 | | | | 0.00 | | | | (0.00 | ) | | | 1.00 | | | | 0.01 | | | | 17,496 | | | | 0.16 | | | | 0.75 | | | | 0.01 | |
Year ended 12/31/13 | | | 1.00 | | | | 0.00 | | | | (0.00 | ) | | | 0.00 | | | | (0.00 | ) | | | 1.00 | | | | 0.03 | | | | 15,883 | | | | 0.16 | | | | 0.95 | | | | 0.03 | |
| (a) | Calculated using average shares outstanding. |
| (b) | Includes adjustments in accordance with accounting principles generally accepted in the United States of America. Total returns are not annualized for periods less than one year, if applicable and do not reflect charges assessed in connection with a variable product, which if included would reduce total returns. |
| (c) | Ratios are based on average daily net assets (000’s omitted) of $623,026 and $91,531 for Series I and Series II shares, respectively. |
Invesco V.I. Government Money Market Fund
Report of Independent Registered Public Accounting Firm
To the Board of Trustees of AIM Variable Insurance Funds (Invesco Variable Insurance Funds)
and Shareholders of Invesco V.I. Government Money Market Fund
Opinion on the Financial Statements
We have audited the accompanying statement of assets and liabilities, including the schedule of investments, of Invesco V.I. Government Money Market Fund (one of the funds constituting AIM Variable Insurance Funds (Invesco Variable Insurance Funds), hereafter referred to as the “Fund”) as of December 31, 2017, the related statement of operations for the year ended December 31, 2017, the statement of changes in net assets for each of the two years in the period ended December 31, 2017, including the related notes, and the financial highlights for each of the five years in the period ended December 31, 2017 (collectively referred to as the “financial statements”). In our opinion, the financial statements present fairly, in all material respects, the financial position of the Fund as of December 31, 2017, the results of its operations for the year then ended, the changes in its net assets for each of the two years in the period ended December 31, 2017 and the financial highlights for each of the five years in the period ended December 31, 2017 in conformity with accounting principles generally accepted in the United States of America.
Basis for Opinion
These financial statements are the responsibility of the Fund’s management. Our responsibility is to express an opinion on the Fund’s financial statements based on our audits. We are a public accounting firm registered with the Public Company Accounting Oversight Board (United States) (“PCAOB”) and are required to be independent with respect to the Fund in accordance with the U.S. federal securities laws and the applicable rules and regulations of the Securities and Exchange Commission and the PCAOB.
We conducted our audits of these financial statements in accordance with the standards of the PCAOB. Those standards require that we plan and perform the audit to obtain reasonable assurance about whether the financial statements are free of material misstatement, whether due to error or fraud.
Our audits included performing procedures to assess the risks of material misstatement of the financial statements, whether due to error or fraud, and performing procedures that respond to those risks. Such procedures included examining, on a test basis, evidence regarding the amounts and disclosures in the financial statements. Our audits also included evaluating the accounting principles used and significant estimates made by management, as well as evaluating the overall presentation of the financial statements. Our procedures included confirmation of securities owned as of December 31, 2017 by correspondence with the custodian, transfer agent and brokers; when replies were not received from brokers, we performed other auditing procedures. We believe that our audits provide a reasonable basis for our opinion.
PricewaterhouseCoopers LLP
Houston, TX
February 14, 2018
We have served as the auditor of one or more of the investment companies in the Invesco/PowerShares group of investment companies since at least 1995. We have not determined the specific year we began serving as auditor.
Invesco V.I. Government Money Market Fund
Calculating your ongoing Fund expenses
Example
As a shareholder of the Fund, you incur ongoing costs, including management fees; distribution and/or service fees (12b-1); and other Fund expenses. This example is intended to help you understand your ongoing costs (in dollars) of investing in the Fund and to compare these costs with ongoing costs of investing in other mutual funds. The example is based on an investment of $1,000 invested at the beginning of the period and held for the entire period July 1, 2017 through December 31, 2017.
The actual and hypothetical expenses in the examples below do not represent the effect of any fees or other expenses assessed in connection with a variable product; if they did, the expenses shown would be higher while the ending account values shown would be lower.
Actual expenses
The table below provides information about actual account values and actual expenses. You may use the information in this table, together with the amount you invested, to estimate the expenses that you paid over the period. Simply divide your account value by $1,000 (for example, an $8,600 account value divided by $1,000 = 8.6), then multiply the result by the number in the table under the heading entitled “Actual Expenses Paid During Period” to estimate the expenses you paid on your account during this period.
Hypothetical example for comparison purposes
The table below also provides information about hypothetical account values and hypothetical expenses based on the Fund’s actual expense ratio and an assumed rate of return of 5% per year before expenses, which is not the Fund’s actual return.
The hypothetical account values and expenses may not be used to estimate the actual ending account balance or expenses you paid for the period. You may use this information to compare the ongoing costs of investing in the Fund and other funds. To do so, compare this 5% hypothetical example with the 5% hypothetical examples that appear in the shareholder reports of the other funds.
Please note that the expenses shown in the table are meant to highlight your ongoing costs. Therefore, the hypothetical information is useful in comparing ongoing costs, and will not help you determine the relative total costs of owning different funds.
| | | | | | | | | | | | | | | | | | | | | | | | |
| Class | | Beginning
Account Value
(07/01/17) | | | ACTUAL | | | HYPOTHETICAL (5% annual return before expenses) | | | Annualized
Expense Ratio | |
| | | Ending Account Value
(12/31/17)1 | | | Expenses
Paid During
Period2 | | | Ending Account Value
(12/31/17) | | | Expenses Paid During
Period2 | | |
| Series I | | $ | 1,000.00 | | | $ | 1,003.50 | | | $ | 2.22 | | | $ | 1,022.99 | | | $ | 2.24 | | | | 0.44 | % |
| Series II | | | 1,000.00 | | | | 1,002.20 | | | | 3.48 | | | | 1,021.73 | | | | 3.52 | | | | 0.69 | |
| 1 | The actual ending account value is based on the actual total return of the Fund for the period July 1, 2017 through December 31, 2017, after actual expenses and will differ from the hypothetical ending account value which is based on the Fund’s expense ratio and a hypothetical annual return of 5% before expenses. |
| 2 | Expenses are equal to the Fund’s annualized expense ratio as indicated above multiplied by the average account value over the period, multiplied by 184/365 to reflect the most recent fiscal half year. |
Invesco V.I. Government Money Market Fund
Tax Information
Form 1099-DIV, Form 1042-S and other year-end tax information provide shareholders with actual calendar year amounts that should be included in their tax returns. Shareholders should consult their tax advisors.
The following distribution information is being provided as required by the Internal Revenue Code or to meet a specific state’s requirement.
The Fund designates the following amounts or, if subsequently determined to be different, the maximum amount allowable for its fiscal year ended December 31, 2017:
| | | | |
Federal and State Income Tax | |
Corporate Dividends Received Deduction* | | | 0.00 | % |
U.S. Treasury Obligations* | | | 15.62 | % |
| | * | The above percentages are based on ordinary income dividends paid to shareholders during the Fund’s fiscal year. |
Invesco V.I. Government Money Market Fund
Trustees and Officers
The address of each trustee and officer is AIM Variable Insurance Funds (Invesco Variable Insurance Funds) (the “Trust”), 11 Greenway Plaza, Suite 1000, Houston, Texas 77046-1173. The trustees serve for the life of the Trust, subject to their earlier death, incapacitation, resignation, retirement or removal as more specifically provided in the Trust’s organizational documents. Each officer serves for a one year term or until their successors are elected and qualified. Column two below includes length of time served with predecessor entities, if any.
| | | | | | | | |
Name, Year of Birth and
Position(s) Held with the Trust | | Trustee and/
or Officer Since | | Principal Occupation(s)
During Past 5 Years | | Number of
Funds in Fund
Complex
Overseen by
Trustee | | Other Directorship(s)
Held by Trustee During
Past 5 Years |
| Interested Persons | | | | | | | | |
| Martin L. Flanagan1 — 1960 Trustee | | 2007 | | Executive Director, Chief Executive Officer and President, Invesco Ltd. (ultimate parent of Invesco and a global investment management firm); Trustee, The Invesco Funds; Vice Chair, Investment Company Institute; and Member of Executive Board, SMU Cox School of Business Formerly: Advisor to the Board, Invesco Advisers, Inc. (formerly known as Invesco Institutional (N.A.), Inc.); Chairman and Chief Executive Officer, Invesco Advisers, Inc. (registered investment adviser); Director, Chairman, Chief Executive Officer and President, Invesco Holding Company (US), Inc. (formerly IVZ Inc.) (holding company), Invesco Group Services, Inc. (service provider) and Invesco North American Holdings, Inc. (holding company); Director, Chief Executive Officer and President, Invesco Holding Company Limited (parent of Invesco and a global investment management firm); Director, Invesco Ltd.; Chairman, Investment Company Institute and President, Co-Chief Executive Officer, Co-President, Chief Operating Officer and Chief Financial Officer, Franklin Resources, Inc. (global investment management organization) | | 158 | | None |
| Philip A. Taylor2 — 1954 Trustee and Senior Vice President | | 2006 | | Head of the Americas and Senior Managing Director, Invesco Ltd.; Director, Invesco Advisers, Inc. (formerly known as Invesco Institutional (N.A.), Inc.) (registered investment adviser); Director, Chairman, Chief Executive Officer and President, Invesco Management Group, Inc. (formerly known as Invesco Aim Management Group, Inc.) (financial services holding company); Director and Chairman, Invesco Investment Services, Inc. (formerly known as Invesco Aim Investment Services, Inc.) (registered transfer agent); Chief Executive Officer, Invesco Corporate Class Inc. (corporate mutual fund company); Director, Chairman and Chief Executive Officer, Invesco Canada Ltd. (formerly known as Invesco Trimark Ltd./Invesco Trimark Ltèe) (registered investment adviser and registered transfer agent); Trustee and Senior Vice President, The Invesco Funds; Director, Invesco Investment Advisers LLC (formerly known as Van Kampen Asset Management). Formerly: Co-Chairman, Co-President and Co-Chief Executive Officer, Invesco Advisers, Inc. (formerly known as Invesco Institutional (N.A.), Inc.) (registered investment adviser); Director, Chief Executive Officer and President, Van Kampen Exchange Corp; President and Principal Executive Officer, The Invesco Funds (other than AIM Treasurer’s Series Trust (Invesco Treasurer’s Series Trust), Short-Term Investments Trust and Invesco Management Trust); Executive Vice President, The Invesco Funds (AIM Treasurer’s Series Trust (Invesco Treasurer’s Series Trust), Short-Term Investments Trust and Invesco Management Trust only); Director and President, INVESCO Funds Group, Inc. (registered investment adviser and registered transfer agent); Director and Chairman, IVZ Distributors, Inc. (formerly known as INVESCO Distributors, Inc.) (registered broker dealer); Director, President and Chairman, Invesco Inc. (holding company), Invesco Canada Holdings Inc. (holding company), Trimark Investments Ltd./Placements Trimark Ltèe and Invesco Financial Services Ltd/Services Financiers Invesco Ltèe; Chief Executive Officer, Invesco Canada Fund Inc. (corporate mutual fund company); Director and Chairman, Van Kampen Investor Services Inc.; Director, Chief Executive Officer and President, 1371 Preferred Inc. (holding company) and Van Kampen Investments Inc.; Director and President, AIM GP Canada Inc. (general partner for limited partnerships) and Van Kampen Advisors, Inc.; Director and Chief Executive Officer, Invesco Trimark Dealer Inc. (registered broker dealer); Director, Invesco Distributors, Inc. (formerly known as Invesco Aim Distributors, Inc.) (registered broker dealer); Manager, Invesco PowerShares Capital Management LLC; Director, Chief Executive Officer and President, Invesco Advisers, Inc.; Director, Chairman, Chief Executive Officer and President, Invesco Aim Capital Management, Inc.; President, Invesco Trimark Dealer Inc. and Invesco Trimark Ltd./Invesco Trimark Ltèe; Director and President, AIM Trimark Corporate Class Inc. and AIM Trimark Canada Fund Inc.; Senior Managing Director, Invesco Holding Company Limited; Director and Chairman, Fund Management Company (former registered broker dealer); President and Principal Executive Officer, The Invesco Funds (AIM Treasurer’s Series Trust (Invesco Treasurer’s Series Trust), and Short-Term Investments Trust only); President, AIM Trimark Global Fund Inc. and AIM Trimark Canada Fund Inc. | | 158 | | None |
| 1 | Mr. Flanagan is considered an interested person (within the meaning of Section 2(a)(19) of the 1940 Act) of the Trust because he is an officer of the Adviser to the Trust, and an officer and a director of Invesco Ltd., ultimate parent of the Adviser. |
| 2 | Mr. Taylor is considered an interested person (within the meaning of Section 2(a)(19) of the 1940 Act) of the Trust because he is an officer and a director of the Adviser. |
Invesco V.I. Government Money Market Fund
Trustees and Officers—(continued)
| | | | | | | | |
Name, Year of Birth and
Position(s) Held with the Trust | | Trustee and/
or Officer Since | | Principal Occupation(s)
During Past 5 Years | | Number of
Funds in Fund
Complex
Overseen by
Trustee | | Other Directorship(s)
Held by Trustee During
Past 5 Years |
| Independent Trustees | | | | | | | | |
Bruce L. Crockett — 1944 Trustee and Chair | | 1993 | | Chairman, Crockett Technologies Associates (technology consulting company) Formerly: Director, Captaris (unified messaging provider); Director, President and Chief Executive Officer, COMSAT Corporation; Chairman, Board of Governors of INTELSAT (international communications company); ACE Limited (insurance company); Independent Directors Council and Investment Company Institute: Member of the Audit Committee, Investment Company Institute; Member of the Executive Committee and Chair of the Governance Committee, Independent Directors Council | | 158 | | Director and Chairman of the Audit Committee, ALPS (Attorneys Liability Protection Society) (insurance company); Director and Member of the Audit Committee and Compensation Committee, Ferroglobe PLC (metallurgical company) |
David C. Arch — 1945 Trustee | | 2010 | | Chairman of Blistex Inc. (consumer health care products manufacturer); Member, World Presidents’ Organization | | 158 | | Board member of the Illinois Manufacturers’ Association |
Jack M. Fields — 1952 Trustee | | 1997 | | Chief Executive Officer, Twenty First Century Group, Inc. (government affairs company); and Chairman, Discovery Learning Alliance (non-profit) Formerly: Owner and Chief Executive Officer, Dos Angeles Ranch L.P. (cattle, hunting, corporate entertainment); Director, Insperity, Inc. (formerly known as Administaff) (human resources provider); Chief Executive Officer, Texana Timber LP (sustainable forestry company); Director of Cross Timbers Quail Research Ranch (non-profit); and member of the U.S. House of Representatives | | 158 | | None |
Cynthia Hostetler — 1962 Trustee | | 2017 | | Non-Executive Director and Trustee of a number of public and private business corporations Formerly: Head of Investment Funds and Private Equity, Overseas Private Investment Corporation; President, First Manhattan Bancorporation, Inc.; Attorney, Simpson Thacher & Bartlett LLP | | 158 | | Vulcan Materials Company (construction materials company); Trilinc Global Impact Fund; Aberdeen Investment Funds (4 portfolios); Artio Global Investment LLC (mutual fund complex); Edgen Group, Inc. (specialized energy and infrastructure products distributor) |
Eli Jones — 1961 Trustee | | 2016 | | Professor and Dean, Mays Business School — Texas A&M University Formerly: Professor and Dean, Walton College of Business, University of Arkansas and E.J. Ourso College of Business, Louisiana State University; Director, Arvest Bank | | 158 | | Insperity, Inc. (formerly known as Administaff) (human resources provider) |
Prema Mathai-Davis — 1950 Trustee | | 1998 | | Retired. | | 158 | | None |
Teresa M. Ressel — 1962 Trustee | | 2017 | | Non-executive director and trustee of a number of public and private business corporations Formerly: Chief Financial Officer, Olayan America, The Olayan Group (international investor/commercial/industrial); Chief Executive Officer, UBS Securities LLC; Group Chief Operating Officer, Americas, UBS AG; Assistant Secretary for Management & Budget and CFO, US Department of the Treasury | | 158 | | Atlantic Power Corporation (power generation company); ON Semiconductor Corp. (semiconductor supplier) |
Ann Barnett Stern — 1957 Trustee | | 2017 | | President and Chief Executive Officer, Houston Endowment Inc. (private philanthropic institution) Formerly: Executive Vice President and General Counsel, Texas Children’s Hospital; Attorney, Beck, Redden and Secrest, LLP; Business Law Instructor, University of St. Thomas; Attorney, Andrews & Kurth LLP | | 158 | | Federal Reserve Bank of Dallas |
Raymond Stickel, Jr. — 1944 Trustee | | 2005 | | Retired. Formerly: Director, Mainstay VP Series Funds, Inc. (25 portfolios); Partner, Deloitte & Touche | | 158 | | None |
Robert C. Troccoli — 1949 Trustee | | 2016 | | Adjunct Professor, University of Denver — Daniels College of Business Formerly: Senior Partner, KPMG LLP | | 158 | | None |
| Christopher L. Wilson — 1957 Trustee | | 2017 | | Non-executive director and trustee of a number of public and private business corporations Formerly: Managing Partner, CT2, LLC (investing and consulting firm); President/Chief Executive Officer, Columbia Funds, Bank of America Corporation; President/Chief Executive Officer, CDC IXIS Asset Management Services, Inc.; Principal & Director of Operations, Scudder Funds, Scudder, Stevens & Clark, Inc.; Assistant Vice President, Fidelity Investments | | 158 | | TD Asset Management USA Inc. (mutual fund complex) (22 portfolios); ISO New England, Inc. (non-profit organization managing regional electricity market) |
Invesco V.I. Government Money Market Fund
Trustees and Officers—(continued)
| | | | | | | | |
Name, Year of Birth and
Position(s) Held with the Trust | | Trustee and/
or Officer Since | | Principal Occupation(s)
During Past 5 Years | | Number of
Funds in Fund
Complex
Overseen by
Trustee | | Other Directorship(s)
Held by Trustee During
Past 5 Years |
| Other Officers | | | | | | | | |
Sheri Morris — 1964 President, Principal Executive Officer and Treasurer | | 1999 | | President, Principal Executive Officer and Treasurer, The Invesco Funds; Vice President, Invesco Advisers, Inc. (formerly known as Invesco Institutional (N.A.), Inc.) (registered investment adviser); and Vice President, PowerShares Exchange-Traded Fund Trust, PowerShares Exchange-Traded Fund Trust II, PowerShares India Exchange-Traded Fund Trust, PowerShares Actively Managed Exchange-Traded Fund Trust, PowerShares Actively Managed Exchange-Traded Commodity Fund Trust and PowerShares Exchange-Traded Self-Indexed Fund Trust Formerly: Vice President and Principal Financial Officer, The Invesco Funds; Vice President, Invesco Aim Advisers, Inc., Invesco Aim Capital Management, Inc. and Invesco Aim Private Asset Management, Inc.; Assistant Vice President and Assistant Treasurer, The Invesco Funds and Assistant Vice President, Invesco Advisers, Inc., Invesco Aim Capital Management, Inc. and Invesco Aim Private Asset Management, Inc.; and Treasurer, PowerShares Exchange-Traded Fund Trust, PowerShares Exchange-Traded Fund Trust II, PowerShares India Exchange-Traded Fund Trust and PowerShares Actively Managed Exchange-Traded Fund Trust | | N/A | | N/A |
Russell C. Burk — 1958 Senior Vice President and Senior Officer | | 2005 | | Senior Vice President and Senior Officer, The Invesco Funds | | N/A | | N/A |
John M. Zerr — 1962 Senior Vice President, Chief Legal Officer and Secretary | | 2006 | | Director, Senior Vice President, Secretary and General Counsel, Invesco Management Group, Inc. (formerly known as Invesco AIM Management Group, Inc.); Senior Vice President, Invesco Advisers, Inc. (formerly known as Invesco Institutional (N.A.), Inc.) (registered investment adviser); Senior Vice President and Secretary, Invesco Distributors, Inc. (formerly known as Invesco AIM Distributors, Inc.); Director, Vice President and Secretary, Invesco Investment Services, Inc. (formerly known as Invesco AIM Investment Services, Inc.) Senior Vice President, Chief Legal Officer and Secretary, The Invesco Funds; Managing Director, Invesco PowerShares Capital Management LLC; Director, Secretary and General Counsel, Invesco Investment Advisers LLC (formerly known as Van Kampen Asset Management); Secretary and General Counsel, Invesco Capital Markets, Inc. (formerly known as Van Kampen Funds Inc.) and Chief Legal Officer, PowerShares Exchange-Traded Fund Trust, PowerShares Exchange-Traded Fund Trust II, PowerShares India Exchange-Traded Fund Trust, PowerShares Actively Managed Exchange-Traded Fund Trust, PowerShares Actively Managed Exchange-Traded Commodity Fund Trust and PowerShares Exchange-Traded Self-Indexed Fund Trust; Manager and Secretary, Invesco Indexing LLC Formerly: Director, Secretary, General Counsel and Senior Vice President, Van Kampen Exchange Corp.; Director, Vice President and Secretary, IVZ Distributors, Inc. (formerly known as INVESCO Distributors, Inc.); Director and Vice President, INVESCO Funds Group, Inc.; Director and Vice President, Van Kampen Advisors Inc.; Director, Vice President, Secretary and General Counsel, Van Kampen Investor Services Inc.; Director, Invesco Distributors, Inc. (formerly known as Invesco AIM Distributors, Inc.); Director, Senior Vice President, General Counsel and Secretary, Invesco AIM Advisers, Inc. and Van Kampen Investments Inc.; Director, Vice President and Secretary, Fund Management Company; Director, Senior Vice President, Secretary, General Counsel and Vice President, Invesco AIM Capital Management, Inc.; Chief Operating Officer and General Counsel, Liberty Ridge Capital, Inc. (an investment adviser); Vice President and Secretary, PBHG Funds (an investment company) and PBHG Insurance Series Fund (an investment company); Chief Operating Officer, General Counsel and Secretary, Old Mutual Investment Partners (a broker-dealer); General Counsel and Secretary, Old Mutual Fund Services (an administrator) and Old Mutual Shareholder Services (a shareholder servicing center); Executive Vice President, General Counsel and Secretary, Old Mutual Capital, Inc. (an investment adviser); and Vice President and Secretary, Old Mutual Advisors Funds (an investment company) | | N/A | | N/A |
Gregory G. McGreevey — 1962 Senior Vice President | | 2012 | | Senior Managing Director, Invesco Ltd.; Director, Chairman, President, and Chief Executive Officer, Invesco Advisers, Inc. (formerly known as Invesco Institutional (N.A.), Inc.) (registered investment adviser); Senior Vice President, Invesco Management Group, Inc.; Director, Invesco Mortgage Capital, Inc. and Invesco Senior Secured Management, Inc.; and Senior Vice President, The Invesco Funds Formerly: Assistant Vice President, The Invesco Funds | | N/A | | N/A |
Kelli Gallegos — 1970 Vice President, Principal Financial Officer and Assistant Treasurer | | 2008 | | Vice President, Principal Financial Officer and Assistant Treasurer, The Invesco Funds; Assistant Treasurer, Invesco PowerShares Capital Management LLC, PowerShares Exchange-Traded Fund Trust, PowerShares Exchange-Traded Fund Trust II, PowerShares India Exchange-Traded Fund Trust, PowerShares Actively Managed Exchange-Traded Fund Trust, PowerShares Actively Managed Exchange-Traded Commodity Fund Trust and PowerShares Exchange-Traded Self-Indexed Fund Trust Formerly: Assistant Vice President, The Invesco Funds | | N/A | | N/A |
Invesco V.I. Government Money Market Fund
Trustees and Officers—(continued)
| | | | | | | | |
Name, Year of Birth and Position(s) Held with the Trust | | Trustee and/ or Officer Since | | Principal Occupation(s) During Past 5 Years | | Number of
Funds in Fund
Complex
Overseen by
Trustee | | Other Directorship(s)
Held by Trustee During
Past 5 Years |
| Other Officers—(continued) | | | | | | | | |
Tracy Sullivan — 1962 Vice President, Chief Tax Officer and Assistant Treasurer | | 2008 | | Vice President, Chief Tax Officer and Assistant Treasurer, The Invesco Funds; Assistant Treasurer, Invesco PowerShares Capital Management LLC, PowerShares Exchange-Traded Fund Trust, PowerShares Exchange-Traded Fund Trust II, PowerShares India Exchange-Traded Fund Trust, PowerShares Actively Managed Exchange-Traded Fund Trust, PowerShares Actively Managed Exchange-Traded Commodity Fund Trust and PowerShares Exchange-Traded Self-Indexed Fund Trust Formerly: Assistant Vice President, The Invesco Funds | | N/A | | N/A |
Crissie M. Wisdom — 1969 Anti-Money Laundering Compliance Officer | | 2013 | | Anti-Money Laundering Compliance Officer, Invesco Advisers, Inc. (formerly known as Invesco Institutional (N.A.), Inc.) (registered investment adviser), Invesco Capital Markets, Inc. (formerly known as Van Kampen Funds Inc.), Invesco Distributors, Inc., Invesco Investment Services, Inc., Invesco Management Group, Inc., The Invesco Funds, and PowerShares Exchange-Traded Fund Trust, PowerShares Exchange-Traded Fund Trust II, PowerShares India Exchange-Traded Fund Trust, PowerShares Actively Managed Exchange-Traded Fund Trust, PowerShares Actively Managed Exchange-Traded Commodity Fund Trust and PowerShares Exchange-Traded Self-Indexed Fund Trust; Anti-Money Laundering Compliance Officer and Bank Secrecy Act Officer, INVESCO National Trust Company and Invesco Trust Company; and Fraud Prevention Manager and Controls and Risk Analysis Manager for Invesco Investment Services, Inc. Formerly: Anti-Money Laundering Compliance Officer, Van Kampen Exchange Corp. | | N/A | | N/A |
Robert R. Leveille — 1969 Chief Compliance Officer | | 2016 | | Chief Compliance Officer, Invesco Advisers, Inc. (registered investment adviser); and Chief Compliance Officer, The Invesco Funds Formerly: Chief Compliance Officer, Putnam Investments and the Putnam Funds | | N/A | | N/A |
The Statement of Additional Information of the Trust includes additional information about the Fund’s Trustees and is available upon request, without charge, by calling 1.800.959.4246. Please refer to the Fund’s Statement of Additional Information for information on the Fund’s sub-advisers.
| | | | | | |
Office of the Fund 11 Greenway Plaza, Suite 1000 Houston, TX 77046-1173 | | Investment Adviser Invesco Advisers, Inc. 1555 Peachtree Street, N.E. Atlanta, GA 30309 | | Distributor Invesco Distributors, Inc. 11 Greenway Plaza, Suite 1000 Houston, TX 77046-1173 | | Auditors PricewaterhouseCoopers LLP 1000 Louisiana Street, Suite 5800 Houston, TX 77002-5678 |
| | | |
| | | | | | |
Counsel to the Fund Stradley Ronon Stevens & Young, LLP 2005 Market Street, Suite 2600 Philadelphia, PA 19103-7018 | | Counsel to the Independent Trustees Goodwin Procter LLP 901 New York Avenue, N.W. Washington, D.C. 20001 | | Transfer Agent Invesco Investment Services, Inc. 11 Greenway Plaza, Suite 1000 Houston, TX 77046-1173 | | Custodian Bank of New York Mellon 2 Hanson Place Brooklyn, NY 11217-1431 |
Invesco V.I. Government Money Market Fund
| | | | |
| | |
 | | Annual Report to Shareholders | | December 31, 2017 |
| | |
| | Invesco V.I. Government Securities Fund |

| | |
| | The Fund provides a complete list of its holdings four times in each fiscal year, at the quarter-ends. For the second and fourth quarters, the lists appear in the Fund’s semiannual and annual reports to shareholders. For the first and third quarters, the Fund files the lists with the Securities and Exchange Commission (SEC) on Form N-Q. The Fund’s Form N-Q filings are available on the SEC website, sec.gov. Copies of the Fund’s Forms N-Q may be reviewed and copied at the SEC Public Reference Room in Washington, D.C. You can obtain information on the operation of the Public Reference Room, including information about duplicating fee charges, by calling 202 551 8090 or 800 732 0330, or by electronic request at the following email address: publicinfo@sec.gov. The SEC file numbers for the Fund are 811-07452 and 033-57340. The Fund’s most recent portfolio holdings, as filed on Form N-Q, have also been made available to insurance companies issuing variable annuity contracts and variable life insurance policies (“variable products”) that invest in the Fund. A description of the policies and procedures that the Fund uses to determine how to vote proxies relating to portfolio securities is available without charge, upon request, from our Client Services department at 800 959 4246 or at invesco.com/proxyguidelines. The information is also available on the SEC website, sec.gov. Information regarding how the Fund voted proxies related to its portfolio securities during the most recent 12-month period ended June 30 is available at invesco.com/ proxysearch. The information is also available on the SEC website, sec.gov. Invesco Advisers, Inc. is an investment adviser; it provides investment advisory services to individual and institutional clients and does not sell securities. Invesco Distributors, Inc. is the US distributor for Invesco Ltd.’s retail mutual funds, exchange-traded funds and institutional money market funds. Both are wholly owned, indirect subsidiaries of Invesco Ltd. This report must be accompanied or preceded by a currently effective Fund prospectus and variable product prospectus, which contain more complete information, including sales charges and expenses. Investors should read each carefully before investing. NOT FDIC INSURED | MAY LOSE VALUE | NO BANK GUARANTEE |
| |
| | Invesco Distributors, Inc. VIGOV-AR-1 02092018 1209 |
Management’s Discussion of Fund Performance
Performance summary
For the year ended December 31, 2017, Series I shares of Invesco V.I. Government Securities Fund (the Fund) underperformed the Fund’s style-specific index, the Bloomberg Barclays U.S. Government Index.
Your Fund’s long-term performance appears later in this report.
Fund vs. Indexes
Total returns, 12/31/16 to 12/31/17, excluding variable product issuer charges.
If variable product issuer charges were included, returns would be lower.
| | | | | |
| Series I Shares | | | | 1.96 | % |
| Series II Shares | | | | 1.72 | |
| Bloomberg Barclays U.S. Aggregate Bond Index▼ (Broad Market Index) | | | | 3.54 | |
| Bloomberg Barclays U.S. Government Index▼ (Style-Specific Index) | | | | 2.30 | |
| Lipper VUF General U.S. Government Funds Index∎ (Peer Group Index) | | | | 1.69 | |
Source(s): ▼FactSet Research Systems Inc.; ∎Lipper Inc. | | | | | |
Market conditions and your Fund
A volatile political environment kept things exciting in 2017. The economic agenda of President Donald Trump largely stalled until Congress passed the Tax Cut and Jobs Act just before the end of the year. The Act cut both corporate and individual tax rates. However, the promise to repeal and replace the Affordable Care Act earlier in 2017 proved to be too big a hurdle for the slim Republican majority in the Senate to overcome. Cuts in regulation, combined with growing business optimism, helped the unemployment rate to decline to 4.1% by the end of the year.1 The housing market remained stable and consumer confidence hit record levels. Despite robust economic growth in the second half of 2017, inflation and wage growth remained muted.
The US Federal Reserve (the Fed) hiked the fed funds rate range by 0.25% at each of three different meetings in 2017, leaving the range at 1.25% to 1.50% at year end.2 The Fed also was able to initiate a gradual reduction in the size of its
balance sheet by imposing a cap on the amount of Treasuries and mortgages it was buying. Beginning in October, the Fed reduced its monthly Treasury purchases by $6 billion and its mortgage purchases by $4 billion.2 The rate hikes and balance sheet reductions were accomplished without disrupting the financial markets.
The yield curve flattened significantly during 2017 as the two-year Treasury yield rose 70 basis points, while the 30-year yield fell 32 basis points.3 (A basis point is 0.01%.) Low inflation and a reasonably aggressive Fed were largely responsible for the change in the shape of the yield curve. The 10-year yield ended the year at 2.41%, almost exactly where it began the year.3
Given this market backdrop, the Fund’s total return for the year was positive, but the Fund underperformed its style specific benchmark, the Bloomberg Barclays U.S. Government Index.
Most of the relative performance of the Fund in 2017 was driven by its exposure to floating rate agency mortgages. This had the largest positive impact on relative
Fund performance as yields on these securities moved higher as short-end rates rose during the year. The small underweight position in securities with durations at the long end of the yield curve was the largest detractor from relative performance as long-end rates fell, but the underweight allocation to short duration securities offset much of that impact. Additionally, the inflation protected securities held by the Fund underperformed nominal Treasuries by a small amount. The Fund’s use of derivatives included interest rate futures to manage yield curve exposure and swaptions to hedge interest rate volatility.
The Fund utilizes duration and yield curve positioning for risk management and for generating returns. Duration measures a portfolio’s price sensitivity to interest rate changes, with a shorter duration tending to be less sensitive to these changes. Yield curve positioning refers to actively emphasizing points (maturities) along the yield curve with favorable risk/ return expectations. During the reporting period, duration was managed with cash, bonds and futures positions. Buying and selling interest rate futures contracts was an important tool we used to manage interest rate risk. The Fund also used swapations to hedge interest rate volatility during the reporting period.
Please note that our strategy is implemented using derivative instruments, including futures, swaps and options. Therefore, a portion of the performance of the Fund, both positive and negative, can be attributed to these instruments. Derivatives can be a cost-effective way to gain or hedge exposure to certain risks and asset classes. However, derivatives may amplify traditional investment risks through the creation of leverage and may be less liquid than traditional securities.
| | |
| Portfolio Composition |
By security type | % of total net assets |
| | | | | |
| |
| U.S. Government Sponsored Agency Mortgage-Backed Securities | | | | 44.2% | |
| U.S. Treasury Securities | | | | 38.5 | |
| Non-U.S. Government Sponsored Agency Securities | | | | 13.8 | |
| U.S. Government Sponsored Agency Securities | | | | 2.1 | |
| Put Options Purchased | | | | 0.1 | |
| Money Market Funds Plus Other Assets Less Liabilities | | | | 1.3 | |
| | |
| Top Five Debt Issuers* |
% of total net assets |
| |
1. U.S. Treasury | | 38.5% |
2. Federal National Mortgage Association | | 10.8 |
3. Fannie Mae REMICs | | 9.9 |
4. Federal Home Loan Mortgage Corp. | | 8.2 |
5. Freddie Mac REMICs | | 7.7 |
| | |
| Total Net Assets | | $525.4 million |
| |
| Total Number of Holdings* | | 641 |
The Fund’s holdings are subject to change, and there is no assurance that the Fund will continue to hold any particular security.
*Excluding money market fund holdings.
Data presented here are as of December 31, 2017.
Invesco V.I. Government Securities Fund
We wish to remind you that the Fund is subject to interest rate risk, meaning when interest rates rise, the value of fixed income securities tend to fall. This risk may be greater in the current market environment because interest rates are at or near historic lows. The degree to which the value of fixed income securities may decline due to rising interest rates may vary depending on the speed and magnitude of the increase in interest rates, as well as individual security characteristics such as price, maturity, duration and coupon, and market forces such as supply and demand for similar securities. We are monitoring interest rates, and the market, economic and geopolitical factors that may impact the direction, speed and magnitude of changes to interest rates across the maturity spectrum, including the potential impact of monetary policy changes by the Fed and certain foreign central banks. If interest rates rise, markets may experience increased volatility, which may affect the value and/ or liquidity of certain of the Fund’s investments.
We welcome new investors who joined the Fund during the year and thank you for your investment in Invesco V.I. Government Securities Fund.
| 1 | Source: Bureau of Labor Statistics |
| 2 | Source: US Federal Reserve |
The views and opinions expressed in management’s discussion of Fund performance are those of Invesco Advisers, Inc. These views and opinions are subject to change at any time based on factors such as market and economic conditions. These views and opinions may not be relied upon as investment advice or recommendations, or as an offer for a particular security. The information is not a complete analysis of every aspect of any market, country, industry, security or the Fund. Statements of fact are from sources considered reliable, but Invesco Advisers, Inc. makes no representation or warranty as to their completeness or accuracy. Although historical performance is no guarantee of future results, these insights may help you understand our investment management philosophy.
See important Fund and, if applicable, index disclosures later in this report.
| | |
 | | Clint Dudley Chartered Financial Analyst, Portfolio Manager, is manager of Invesco V.I. Government Securities Fund. |
| He joined Invesco in 1998. Mr. Dudley earned a BBA and an MBA from Baylor University. |
| | |
 | | Brian Schneider Chartered Financial Analyst, Portfolio Manager, is manager of Invesco V.I. Government Securities Fund. |
| He joined Invesco in 1987. Mr. Schneider earned a BA in economics and an MBA from Bellarmine University (formerly Bellarmine College). |
| | |
 | | Robert Waldner Chartered Financial Analyst, Portfolio Manager, is manager of Invesco V.I. Government Securities Fund. |
| He joined Invesco in 2013. Mr. Waldner earned a BSE degree in civil engineering from Princeton University. |
Invesco V.I. Government Securities Fund
Your Fund’s Long-Term Performance
Results of a $10,000 Investment – Oldest Share Class(es)
Fund and index data from 12/31/07
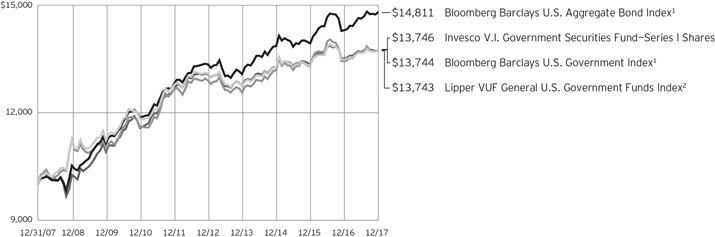
| 1 | Source: FactSet Research Systems Inc. |
Past performance cannot guarantee
comparable future results.
| | | | | |
| Average Annual Total Returns |
As of 12/31/17 | | | | | |
| |
| Series I Shares | | | | | |
| Inception (5/5/93) | | | | 4.23 | % |
| 10 Years | | | | 3.23 | |
| 5 Years | | | | 0.98 | |
| 1 Year | | | | 1.96 | |
| |
| Series II Shares | | | | | |
| Inception (9/19/01) | | | | 3.25 | % |
| 10 Years | | | | 2.97 | |
| 5 Years | | | | 0.74 | |
| 1 Year | | | | 1.72 | |
The performance of the Fund’s Series I and Series II share classes will differ primarily due to different class expenses.
The performance data quoted represent past performance and cannot guarantee comparable future results; current performance may be lower or higher. Please contact your variable product issuer or financial adviser for the most recent month-end variable product performance. Performance
figures reflect Fund expenses, reinvested distributions and changes in net asset value. Investment return and principal value will fluctuate so that you may have a gain or loss when you sell shares.
The total annual Fund operating expense ratio set forth in the most recent Fund prospectus as of the date of this report for Series I and Series II shares was 0.68% and 0.93%, respectively. The expense ratios presented above may vary from the expense ratios presented in other sections of this report that are based on expenses incurred during the period covered by this report.
Invesco V.I. Government Securities Fund, a series portfolio of AIM Variable Insurance Funds (Invesco Variable Insurance Funds), is currently offered through insurance companies issuing variable products. You cannot purchase shares of the Fund directly.
Performance figures given represent the Fund and are not intended to reflect actual variable product values. They do not reflect sales charges, expenses and fees assessed in connection with a variable product. Sales charges, expenses and fees, which are determined by the variable product issuers, will vary and will lower the total return.
The most recent month-end performance at the Fund level, excluding variable product charges, is available at 800 451 4246. As mentioned above, for the most recent month-end performance including variable product charges, please contact your variable product issuer or financial adviser.
Fund performance reflects any applicable fee waivers and/or expense reimbursements. Had the adviser not waived fees and/or reimbursed expenses currently or in the past, returns would have been lower. See current prospectus for more information.
Invesco V.I. Government Securities Fund
Invesco V.I. Government Securities Fund’s investment objective is total return, comprised of current income and capital appreciation.
| ∎ | | Unless otherwise stated, information presented in this report is as of December 31, 2017, and is based on total net assets. |
| ∎ | | Unless otherwise noted, all data provided by Invesco. |
Principal risks of investing in the Fund
Changing fixed income market conditions risk. The current low interest rate environment was created in part by the Federal Reserve Board (FRB) and certain foreign central banks keeping the federal funds and equivalent foreign rates near, at or below zero. Increases in the federal funds and equivalent foreign rates may expose fixed income markets to heightened volatility and reduced liquidity for certain fixed income investments, particularly those with longer maturities. In addition, decreases in fixed income dealer market-making capacity may also potentially lead to heightened volatility and reduced liquidity in the fixed income markets. As a result, the value of the Fund’s investments and share price may decline. Changes in central bank policies could also result in higher than normal shareholder redemptions, which could potentially increase portfolio turnover and the Fund’s transaction costs.
Collateralized loan obligations risk. CLOs are subject to the risks of substantial losses due to actual defaults by underlying borrowers, which will be greater during periods of economic or financial stress. CLOs may also lose value due to collateral defaults and disappearance of subordinate tranches, market anticipation of defaults, and investor aversion to CLO securities as a class. The risks of CLOs will be greater if the Fund invests in CLOs that hold loans of uncreditworthy borrowers or if the Fund holds subordinate tranches of the CLO that absorbs losses from the defaults before senior tranches. In addition, CLOs are subject to interest rate risk and credit risk.
Debt securities risk. The prices of debt securities held by the Fund will be affected by changes in interest rates, the creditworthiness of the issuer and other factors. An increase in prevailing interest rates typically causes the value of existing debt securities to fall and often has a greater impact on longer-duration debt securities and higher quality debt securities. Falling interest rates will cause the Fund to reinvest the proceeds of debt securities that have been repaid by the issuer at lower interest rates. Falling interest rates may also reduce the Fund’s distributable income because interest payments on floating rate debt instruments held by
the Fund will decline. The Fund could lose money on investments in debt securities if the issuer or borrower fails to meet its obligations to make interest payments and/or to repay principal in a timely manner. Changes in an issuer’s financial strength, the market’s perception of such strength or in the credit rating of the issuer or the security may affect the value of debt securities. The Adviser’s credit analysis may fail to anticipate such changes, which could result in buying a debt security at an inopportune time or failing to sell a debt security in advance of a price decline or other credit event.
Derivatives risk. The value of a derivative instrument depends largely on (and is derived from) the value of an underlying security, currency, commodity, interest rate, index or other asset (each referred to as an underlying asset). In addition to risks relating to the underlying assets, the use of derivatives may include other, possibly greater, risks, including counterparty, leverage and liquidity risks. Counterparty risk is the risk that the counterparty to the derivative contract will default on its obligation to pay the Fund the amount owed or otherwise perform under the derivative contract. Derivatives create leverage risk because they do not require payment up front equal to the economic exposure created by owning the derivative. As a result, an adverse change in the value of the underlying asset could result in the Fund sustaining a loss that is substantially greater than the amount invested in the derivative, which may make the Fund’s returns more volatile and increase the risk of loss. Derivative instruments may also be less liquid than more traditional investments and the Fund may be unable to sell or close out its derivative positions at a desirable time or price. This risk may be more acute under adverse market conditions, during which the Fund may be most in need of liquidating its derivative positions. Derivatives may also be harder to value, less tax efficient and subject to changing government regulation that could impact the Fund’s ability to use certain derivatives or their cost. Also, derivatives used for hedging or to gain or limit exposure to a particular market segment may not provide the expected benefits, particularly during adverse market conditions.
Management risk. The Fund is actively managed and depends heavily on the Adviser’s judgment about markets, interest rates or the attractiveness, relative values, liquidity, or potential appreciation of particular investments made for the Fund’s portfolio. The Fund could experience losses if these judgments prove to be incorrect. Additionally, legislative, regulatory, or tax developments may adversely affect management of the Fund and, therefore, the ability of the Fund to achieve its investment objective.
Market risk. The market values of the Fund’s investments, and therefore the value of the Fund’s shares, will go up and down, sometimes rapidly or unpredictably. Market risk may affect a single issuer, industry or section of the economy, or it may affect the market as a whole. Individual stock prices tend to go up and down more dramatically than those of certain other types of investments, such as bonds. During a general downturn in the financial markets, multiple asset classes may decline in value. When markets perform well, there can be no assurance that specific investments held by the Fund will rise in value.
Mortgage- and asset-backed securities risk. Mortgage- and asset-backed securities, including collateralized debt obligations and collateralized mortgage obligations, are subject to prepayment or call risk, which is the risk that a borrower’s payments may be received earlier or later than expected due to changes in prepayment rates on underlying loans. This could result in the Fund reinvesting these early payments at lower interest rates, thereby reducing the Fund’s income. Mortgage- and asset-backed securities also are subject to extension risk, which is the risk that an unexpected rise in interest rates could reduce the rate of prepayments, causing the price of the mortgage- and asset-backed securities and the Fund’s share price to fall. An unexpectedly high rate of defaults on the mortgages held by a mortgage pool may adversely affect the value of mortgage-backed securities and could result in losses to the Fund. The Fund may invest in mortgage pools that include subprime mortgages, which are loans made to borrowers with weakened credit histories or with lower capacity to make timely payments on their mortgages. Privately
Invesco V.I. Government Securities Fund
issued mortgage-related securities are not subject to the same underwriting requirements as those with government or government-sponsored entity guarantees and, therefore, mortgage loans underlying privately issued mortgage-related securities may have less favorable collateral, credit risk or other underwriting characteristics, and wider variances in interest rate, term, size, purpose and borrower characteristics.
TBA transactions risk. TBA transactions involve the risk of loss if the securities received are less favorable than what was anticipated by the Fund when entering into the TBA transaction, or if the counterparty fails to deliver the securities. When the Fund enters into a short sale of a TBA mortgage it does not own, the Fund may have to purchase deliverable mortgages to settle the short sale at a higher price than anticipated, thereby causing a loss. As there is no limit on how much the price of mortgage securities can increase, the Fund’s exposure is unlimited. The Fund may not always be able to purchase mortgage securities to close out the short position at a particular time or at an acceptable price. In addition, taking short positions results in a form of leverage, which could increase the volatility of the Fund’s share price.
US government obligations risk. Obligations of US government agencies and authorities receive varying levels of support and may not be backed by the full faith and credit of the US government, which could affect the Fund’s ability to recover should they default. No assurance can be given that the US government will provide financial support to its agencies and authorities if it is not obligated by law to do so.
When-issued, delayed delivery and forward commitment risks. When-issued and delayed delivery transactions subject the Fund to market risk because the value or yield of a security at delivery may be more or less than the purchase price or yield generally available when delivery occurs, and counterparty risk because the Fund relies on the buyer or seller, as the case may be, to consummate the transaction. These transactions also have a leveraging effect on the Fund because the Fund commits to purchase securities that it does not have to pay for until a later date, which increases the Fund’s overall investment exposure and, as a result, its volatility.
Zero coupon or pay-in-kind securities risk. The value, interest rates, and liquidity of non-cash paying instruments, such as zero coupon and pay-in-kind securities, are subject to greater fluctuation than other types of securities. The higher yields and interest rates on pay-in-kind securities reflect the payment deferral and increased credit risk associated with such instruments and that such investments may represent a higher credit risk than loans that periodically pay interest.
About indexes used in this report
The Bloomberg Barclays U.S. Aggregate Bond Index is an unmanaged index considered representative of the US investment grade, fixed-rate bond market.
The Bloomberg Barclays U.S. Government Index is an unmanaged index considered representative of fixed income obligations issued by the US Treasury, government agencies and quasi-federal corporations.
The Lipper VUF General U.S. Government Funds Index is an unmanaged index considered representative of general US government variable insurance underlying funds tracked by Lipper.
The Fund is not managed to track the performance of any particular index, including the index(es) described here, and consequently, the performance of the Fund may deviate significantly from the performance of the index(es).
A direct investment cannot be made in an index. Unless otherwise indicated, index results include reinvested dividends, and they do not reflect sales charges. Performance of the peer group, if applicable, reflects fund expenses; performance of a market index does not.
Other information
The returns shown in management’s discussion of Fund performance are based on net asset values calculated for shareholder transactions. Generally accepted accounting principles require adjustments to be made to the net assets of the Fund at period end for financial reporting purposes, and as such, the net asset values for shareholder transactions and the returns based on those net asset values may differ from the net asset values and returns reported in the Financial Highlights. Additionally, the returns and
net asset values shown throughout this report are at the Fund level only and do not include variable product issuer charges. If such charges were included, the total returns would be lower.
Invesco V.I. Government Securities Fund
Schedule of Investments
December 31, 2017
| | | | | | | | |
| | | Principal
Amount | | | Value | |
U.S. Government Sponsored Agency Mortgage-Backed Securities–44.24% | |
| Collateralized Mortgage Obligations–22.02% | |
Fannie Mae ACES,
1.83% (1 mo. USD LIBOR + 0.59%), 09/25/2023(a) | | $ | 3,629,200 | | | $ | 3,646,311 | |
Fannie Mae REMICs,
4.00%, 07/25/2018 to 07/25/2040 | | | 2,528,501 | | | | 2,612,986 | |
5.00%, 08/25/2019 | | | 117,678 | | | | 119,057 | |
3.00%, 10/25/2025 | | | 442,324 | | | | 444,392 | |
2.50%, 03/25/2026 | | | 484,950 | | | | 484,176 | |
7.00%, 09/18/2027 | | | 276,119 | | | | 303,051 | |
1.50%, 01/25/2028 | | | 4,811,644 | | | | 4,658,449 | |
6.50%, 03/25/2032 | | | 788,178 | | | | 886,074 | |
5.75%, 10/25/2035 | | | 352,756 | | | | 384,235 | |
1.85% (1 mo. USD LIBOR + 0.30%), 05/25/2036(a) | | | 2,670,110 | | | | 2,664,110 | |
4.25%, 02/25/2037 | | | 755,578 | | | | 776,195 | |
2.00% (1 mo. USD LIBOR + 0.45%), 03/25/2037(a) | | | 1,220,760 | | | | 1,225,983 | |
2.05% (1 mo. USD LIBOR + 0.50%), 03/25/2037 to 05/25/2041(a) | | | 4,136,368 | | | | 4,147,879 | |
1.95% (1 mo. USD LIBOR + 0.40%), 06/25/2038 to 09/25/2046(a) | | | 7,131,100 | | | | 7,159,412 | |
6.58%, 06/25/2039(b) | | | 3,296,494 | | | | 3,803,888 | |
2.10% (1 mo. USD LIBOR + 0.55%), 02/25/2041(a) | | | 2,607,932 | | | | 2,623,712 | |
2.07% (1 mo. USD LIBOR + 0.52%), 11/25/2041(a) | | | 1,280,229 | | | | 1,290,290 | |
1.56% (1 mo. USD LIBOR + 0.32%), 08/25/2044(a) | | | 2,974,297 | | | | 2,971,870 | |
1.64% (1 mo. USD LIBOR + 0.40%), 11/25/2046(a) | | | 4,448,182 | | | | 4,454,556 | |
1.72% (1 mo. USD LIBOR + 0.48%), 02/25/2056(a) | | | 5,575,542 | | | | 5,584,276 | |
1.66% (1 mo. USD LIBOR + 0.42%), 12/25/2056(a) | | | 5,566,224 | | | | 5,571,165 | |
Federal Home Loan Bank,
5.77%, 03/23/2018 | | | 574,436 | | | | 579,502 | |
Freddie Mac REMICs,
5.00%, 02/15/2018 to 01/15/2019 | | | 36,441 | | | | 36,521 | |
4.50%, 07/15/2018 | | | 28,469 | | | | 28,626 | |
3.00%, 10/15/2018 to 04/15/2026 | | | 795,031 | | | | 800,251 | |
1.98% (1 mo. USD LIBOR + 0.50%), 12/15/2035 to 03/15/2040(a) | | | 4,743,939 | | | | 4,765,103 | |
1.78% (1 mo. USD LIBOR + 0.30%), 03/15/2036 to 09/15/2044(a) | | | 11,851,671 | | | | 11,852,927 | |
1.59% (1 mo. USD LIBOR + 0.35%), 11/15/2036(a) | | | 4,357,080 | | | | 4,360,740 | |
1.85% (1 mo. USD LIBOR + 0.37%), 03/15/2037(a) | | | 1,345,164 | | | | 1,347,533 | |
1.88% (1 mo. USD LIBOR + 0.40%), 05/15/2037 to 06/15/2037(a) | | | 3,046,179 | | | | 3,055,931 | |
2.34% (1 mo. USD LIBOR + 0.86%), 11/15/2039(a) | | | 724,282 | | | | 739,645 | |
1.93% (1 mo. USD LIBOR + 0.45%), 03/15/2040 to 02/15/2042(a) | | | 13,160,963 | | | | 13,228,548 | |
| | | | | | | | |
| | | Principal
Amount | | | Value | |
| Collateralized Mortgage Obligations–(continued) | |
Freddie Mac STRIPS,
1.59% (1 mo. USD LIBOR + 0.35%), 10/15/2037(a) | | $ | 3,279,557 | | | $ | 3,276,752 | |
Freddie Mac Whole Loan Securities Trust, 3.50%, 05/25/2047 | | | 2,264,390 | | | | 2,291,475 | |
Ginnie Mae REMICs, | | | | | | | | |
6.00%, 01/16/2025 | | | 338,321 | | | | 360,232 | |
5.72%, 08/20/2034(b) | | | 1,175,929 | | | | 1,295,978 | |
5.89%, 01/20/2039(b) | | | 4,070,321 | | | | 4,492,383 | |
2.29% (1 mo. USD LIBOR + 0.80%), 09/16/2039(a) | | | 1,336,566 | | | | 1,357,562 | |
4.49%, 07/20/2041(b) | | | 838,559 | | | | 878,765 | |
2.47%, 09/20/2041(b) | | | 3,517,366 | | | | 3,647,095 | |
1.75% (1 mo. USD LIBOR + 0.25%), 01/20/2042(a) | | | 662,182 | | | | 662,339 | |
Ginnie Mae REMICs, IO,
1.59%,
09/20/2064(b) | | | 8,977,067 | | | | 812,842 | |
| | | | | | | | 115,682,817 | |
|
| Federal Home Loan Mortgage Corp. (FHLMC)–8.19% | |
Pass Through Ctfs., | | | | | | | | |
5.00%, 07/01/2018 to 01/01/2040 | | | 1,261,393 | | | | 1,375,717 | |
6.00%, 09/01/2018 to 07/01/2038 | | | 361,027 | | | | 390,759 | |
6.50%, 05/01/2019 to 12/01/2035 | | | 2,487,351 | | | | 2,772,926 | |
4.50%, 09/01/2020 to 08/01/2041 | | | 8,148,210 | | | | 8,748,273 | |
10.00%, 03/01/2021 | | | 3,558 | | | | 3,587 | |
9.00%, 06/01/2021 to 06/01/2022 | | | 44,356 | | | | 45,821 | |
7.00%, 12/01/2021 to 11/01/2035 | | | 2,984,884 | | | | 3,304,991 | |
8.00%, 12/01/2021 to 09/01/2036 | | | 1,109,536 | | | | 1,185,475 | |
7.50%, 09/01/2022 to 06/01/2035 | | | 965,981 | | | | 1,066,196 | |
8.50%, 11/17/2022 to 08/01/2031 | | | 481,703 | | | | 531,389 | |
5.50%, 12/01/2022 | | | 160,920 | | | | 164,571 | |
3.50%, 08/01/2026 | | | 707,376 | | | | 733,729 | |
3.00%, 05/01/2027 to 02/01/2032 | | | 6,529,133 | | | | 6,666,589 | |
7.05%, 05/20/2027 | | | 108,296 | | | | 117,196 | |
6.03%, 10/20/2030 | | | 737,399 | | | | 821,065 | |
Pass Through Ctfs., ARM, | | | | | | | | |
3.61% (1 yr. USD LIBOR + 1.88%), 09/01/2035(a) | | | 4,066,560 | | | | 4,306,039 | |
3.32% (1 yr. USD LIBOR + 1.57%), 10/01/2036(a) | | | 1,940,660 | | | | 2,023,757 | |
3.66% (1 yr. USD LIBOR + 1.91%), 10/01/2036(a) | | | 149,467 | | | | 157,839 | |
3.75% (1 yr. USD LIBOR + 2.00%), 11/01/2037(a) | | | 1,877,936 | | | | 1,987,066 | |
3.68% (1 yr. USD LIBOR + 2.06%), 01/01/2038(a) | | | 118,559 | | | | 126,181 | |
3.63% (1 yr. USD LIBOR + 1.84%), 07/01/2038(a) | | | 856,934 | | | | 903,543 | |
3.36% (1 yr. USD LIBOR + 1.78%), 06/01/2043(a) | | | 1,876,677 | | | | 1,954,514 | |
3.64% (1 yr. USD LIBOR + 1.78%), 07/01/2036(a) | | | 3,452,623 | | | | 3,658,859 | |
| | | | | | | | 43,046,082 | |
See accompanying Notes to Financial Statements which are an integral part of the financial statements.
Invesco V.I. Government Securities Fund
| | | | | | | | |
| | | Principal
Amount | | | Value | |
| Federal National Mortgage Association (FNMA)–10.84% | |
Pass Through Ctfs., | | | | | | | | |
6.50%, 02/01/2018 to 11/01/2037 | | $ | 2,455,514 | | | $ | 2,691,143 | |
7.00%, 05/01/2018 to 06/01/2036 | | | 3,485,895 | | | | 3,731,345 | |
5.00%, 06/01/2018 to 12/01/2033 | | | 289,110 | | | | 300,695 | |
4.50%, 04/01/2019 to 08/01/2041 | | | 6,290,016 | | | | 6,762,645 | |
8.00%, 02/01/2021 to 10/01/2037 | | | 3,228,769 | | | | 3,749,613 | |
8.50%, 02/01/2021 to 08/01/2037 | | | 1,051,709 | | | | 1,184,398 | |
5.50%, 03/01/2021 to 05/01/2035 | | | 1,547,796 | | | | 1,718,265 | |
6.00%, 08/01/2021 to 10/01/2038 | | | 1,692,677 | | | | 1,899,600 | |
7.50%, 11/01/2022 to 08/01/2037 | | | 4,526,299 | | | | 5,117,468 | |
6.75%, 07/01/2024 | | | 306,398 | | | | 339,782 | |
6.95%, 10/01/2025 | | | 17,442 | | | | 17,592 | |
3.50%, 03/01/2027 to 08/01/2027 | | | 8,620,758 | | | | 8,914,809 | |
3.00%, 05/01/2027 to 07/01/2032 | | | 12,404,530 | | | | 12,670,109 | |
Pass Through Ctfs., ARM, | | | | | | | | |
3.62% (1 yr. U.S. Treasury Yield Curve Rate + 2.36%), 10/01/2034(a) | | | 2,105,894 | | | | 2,231,375 | |
3.24% (1 yr. U.S. Treasury Yield Curve Rate + 2.20%), 05/01/2035(a) | | | 319,103 | | | | 336,830 | |
3.48% (1 yr. USD LIBOR + 1.73%), 03/01/2038(a) | | | 80,672 | | | | 84,649 | |
2.73% (1 yr. USD LIBOR + 1.75%), 02/01/2042(a) | | | 1,095,333 | | | | 1,142,588 | |
2.16% (1 yr. USD LIBOR + 1.52%), 08/01/2043(a) | | | 2,206,150 | | | | 2,226,164 | |
2.28% (1 yr. U.S. Treasury Yield Curve Rate + 1.88%), 05/01/2044 (a) | | | 1,796,235 | | | | 1,815,602 | |
| | | | | | | | 56,934,672 | |
|
Government National Mortgage Association
(GNMA)–3.19% | |
Pass Through Ctfs., | | | | | | | | |
6.50%, 10/15/2018 to 01/15/2035 | | | 3,379,268 | | | | 3,711,892 | |
10.00%, 06/15/2019 | | | 558 | | | | 559 | |
7.00%, 07/15/2019 to 12/15/2036 | | | 802,556 | | | | 867,367 | |
6.00%, 09/15/2020 to 08/15/2033 | | | 535,628 | | | | 589,694 | |
7.50%, 09/15/2022 to 10/15/2035 | | | 2,150,612 | | | | 2,419,096 | |
8.00%, 01/15/2023 to 01/15/2037 | | | 1,145,871 | | | | 1,317,409 | |
5.00%, 02/15/2025 | | | 168,749 | | | | 181,609 | |
8.50%, 02/15/2025 to 01/15/2037 | | | 140,525 | | | | 146,761 | |
6.95%, 08/20/2025 to 08/20/2027 | | | 247,051 | | | | 250,586 | |
6.38%, 10/20/2027 to 02/20/2028 | | | 229,694 | | | | 246,744 | |
6.10%, 12/20/2033 | | | 3,848,512 | | | | 4,445,790 | |
3.50%, 10/20/2042 | | | 2,521,860 | | | | 2,583,320 | |
| | | | | | | | 16,760,827 | |
Total U.S. Government Sponsored Agency Mortgage-Backed Securities (Cost $230,047,231) | | | | 232,424,398 | |
|
U.S. Treasury Securities–38.56% | |
| U.S. Treasury Bills–0.28%(c)(d) | |
1.03%, 02/01/2018 | | | 135,000 | | | | 134,858 | |
1.04%, 02/01/2018 | | | 145,000 | | | | 144,848 | |
1.06%, 02/01/2018 | | | 50,000 | | | | 49,947 | |
1.07%, 02/01/2018 | | | 5,000 | | | | 4,995 | |
1.09%, 02/01/2018 | | | 40,000 | | | | 39,958 | |
| | | | | | | | |
| | | Principal
Amount | | | Value | |
| U.S. Treasury Bills–(continued) | |
1.10%, 02/01/2018 | | $ | 1,080,000 | | | $ | 1,078,865 | |
1.11%, 02/01/2018 | | | 10,000 | | | | 9,990 | |
| | | | | | | | 1,463,461 | |
|
| U.S. Treasury Notes–24.85% | |
0.75%, 08/31/2018 | | | 4,250,000 | | | | 4,224,236 | |
1.00%, 11/30/2018 | | | 5,000,000 | | | | 4,964,766 | |
1.25%, 12/31/2018 | | | 5,000,000 | | | | 4,972,581 | |
1.50%, 12/31/2018 | | | 2,500,000 | | | | 2,492,248 | |
1.00%, 03/15/2019 | | | 3,000,000 | | | | 2,970,087 | |
1.50%, 05/31/2019 | | | 7,000,000 | | | | 6,965,498 | |
0.75%, 07/15/2019 | | | 8,100,000 | | | | 7,964,104 | |
1.63%, 07/31/2019 | | | 2,700,000 | | | | 2,690,231 | |
1.75%, 09/30/2019 | | | 2,500,000 | | | | 2,494,475 | |
3.38%, 11/15/2019 | | | 625,000 | | | | 642,224 | |
1.75%, 11/30/2019 | | | 3,000,000 | | | | 2,992,433 | |
1.50%, 04/15/2020 | | | 2,000,000 | | | | 1,981,400 | |
2.00%, 09/30/2020 | | | 2,500,000 | | | | 2,503,571 | |
1.75%, 12/31/2020 | | | 2,500,000 | | | | 2,482,775 | |
1.38%, 01/31/2021 | | | 3,000,000 | | | | 2,943,063 | |
3.13%, 05/15/2021 | | | 2,100,000 | | | | 2,173,143 | |
2.13%, 08/15/2021 | | | 2,700,000 | | | | 2,704,142 | |
2.00%, 10/31/2021 | | | 2,500,000 | | | | 2,489,491 | |
2.00%, 11/15/2021 | | | 3,300,000 | | | | 3,290,384 | |
2.00%, 12/31/2021 | | | 3,000,000 | | | | 2,984,995 | |
1.88%, 03/31/2022 | | | 6,000,000 | | | | 5,932,616 | |
1.75%, 05/15/2022 | | | 4,000,000 | | | | 3,935,664 | |
2.13%, 06/30/2022 | | | 3,000,000 | | | | 2,994,664 | |
2.00%, 07/31/2022 | | | 2,000,000 | | | | 1,984,866 | |
1.63%, 08/31/2022 | | | 5,000,000 | | | | 4,876,392 | |
1.63%, 11/15/2022 | | | 2,000,000 | | | | 1,948,995 | |
2.00%, 11/30/2022 | | | 2,700,000 | | | | 2,675,362 | |
2.13%, 12/31/2022 | | | 7,000,000 | | | | 6,970,600 | |
1.63%, 04/30/2023 | | | 4,000,000 | | | | 3,877,940 | |
1.63%, 05/31/2023 | | | 1,400,000 | | | | 1,356,123 | |
1.63%, 10/31/2023 | | | 625,000 | | | | 603,368 | |
2.13%, 11/30/2023 | | | 5,500,000 | | | | 5,454,822 | |
2.13%, 03/31/2024 | | | 4,000,000 | | | | 3,958,886 | |
2.13%, 07/31/2024 | | | 3,000,000 | | | | 2,964,153 | |
2.25%, 11/15/2024 | | | 5,000,000 | | | | 4,973,896 | |
1.50%, 08/15/2026 | | | 8,750,000 | | | | 8,138,864 | |
2.38%, 05/15/2027 | | | 1,000,000 | | | | 996,999 | |
| | | | | | | | 130,570,057 | |
|
| U.S. Treasury Bonds–10.76% | |
8.75%, 05/15/2020 | | | 1,200,000 | | | | 1,391,634 | |
7.88%, 02/15/2021 | | | 1,100,000 | | | | 1,295,848 | |
5.38%, 02/15/2031 | | | 3,800,000 | | | | 5,048,289 | |
3.38%, 05/15/2044 | | | 6,000,000 | | | | 6,727,230 | |
3.00%, 05/15/2045 | | | 7,000,000 | | | | 7,345,019 | |
2.88%, 08/15/2045 | | | 750,000 | | | | 768,521 | |
3.00%, 11/15/2045 | | | 3,000,000 | | | | 3,147,850 | |
See accompanying Notes to Financial Statements which are an integral part of the financial statements.
Invesco V.I. Government Securities Fund
| | | | | | | | |
| | | Principal
Amount | | | Value | |
| U.S. Treasury Bonds–(continued) | |
2.50%, 05/15/2046 | | $ | 6,000,000 | | | $ | 5,701,258 | |
2.25%, 08/15/2046 | | | 6,550,000 | | | | 5,901,961 | |
3.00%, 05/15/2047 | | | 7,300,000 | | | | 7,668,089 | |
2.75%, 08/15/2047 | | | 10,000,000 | | | | 10,003,406 | |
2.75%, 11/15/2047 | | | 1,500,000 | | | | 1,501,007 | |
| | | | | | | | 56,500,112 | |
|
| U.S. Treasury Inflation — Indexed Notes–2.67%(e) | |
0.13%, 04/15/2021 | | | 8,534,642 | | | | 8,504,578 | |
0.13%, 04/15/2022 | | | 5,578,760 | | | | 5,542,407 | |
| | | | | | | | 14,046,985 | |
Total U.S. Treasury Securities
(Cost $202,763,567) | | | | 202,580,615 | |
|
Non-U.S. Government Sponsored Agency
Securities–13.76% | |
| Collateralized Mortgage Obligations–11.66% | |
Banc of America Commercial Mortgage Trust, Series 2015-UBS7, Class XA, IO Variable Rate Pass Through Ctfs., 0.90%, 09/15/2048(b) | | | 16,604,543 | | | | 869,220 | |
Barclays Bank Commercial Mortgage Securities Trust, Series 2015-RRI, Class D, Floating Rate Pass Through Ctfs., 4.25% (1 mo. USD LIBOR + 3.00%), 05/15/2032(a)(f) | | | 2,460,000 | | | | 2,470,470 | |
Bear Stearns Adjustable Rate Mortgage Trust, Series 2004-10, Class 12A1, Variable Rate Pass Through Ctfs., 3.56%, 01/25/2035(b) | | | 680,928 | | | | 695,661 | |
Chase Mortgage Trust,
Series 2016-1, Class M3, Variable Rate Pass Through Ctfs.,
3.75%, 04/25/2045(b)(f) | | | 2,567,521 | | | | 2,572,041 | |
Series 2016-2, Class M3, Variable Rate Pass Through Ctfs.,
3.75%, 12/25/2045(b)(f) | | | 2,972,781 | | | | 2,969,997 | |
Commercial Mortgage Trust,
Series 2015-CR23, Class CMB, Variable Rate Pass Through Ctfs., 3.68%, 05/10/2048(b)(f) | | | 4,740,000 | | | | 4,767,739 | |
Series 2015-CR24, Class B, Variable Rate Pass Through Ctfs.,
4.38%, 08/10/2048(b) | | | 6,200,000 | | | | 6,514,980 | |
Credit Suisse Mortgage Capital Trust, Series 2015-TOWN, Class B, Floating Rate Pass Through Ctfs., 3.38% (1 mo. USD LIBOR + 1.90%), 03/15/2028(a)(f) | | | 7,100,000 | | | | 7,106,295 | |
La Hipotecaria El Salvadorian Mortgage Trust (El Salvador), Series 2013-1A, Class A, Pass Through Ctfs., 3.50%, 10/25/2041 (Acquired 04/22/2013; Cost $8,101,812)(f) | | | 7,827,838 | | | | 8,083,465 | |
La Hipotecaria Panamanian Mortgage Trust (El Salvador), Series 2010-1GA, Class A, Floating Rate Pass Through Ctfs., 2.25% (PNMR—3.00%), 09/08/2039 (Acquired 11/05/2010;
Cost $12,617,469)(a)(f) | | | 12,212,917 | | | | 12,560,221 | |
| | | | | | | | |
| | | Principal
Amount | | | Value | |
| Collateralized Mortgage Obligations–(continued) | |
LSTAR Commercial Mortgage Trust, Series 2014-2, Class A2, Pass Through Ctfs., 2.77%,
01/20/2041(f) | | $ | 718,057 | | | $ | 716,438 | |
Morgan Stanley Capital I Trust, Series 2015-XLF2, Class AFSD, Floating Rate Pass Through Ctfs., 5.13% (1 mo. USD LIBOR + 3.66%), 08/15/2026(a)(f) | | | 3,000,000 | | | | 3,043,704 | |
Towd Point Mortgage Trust, Series 2015-1, Class AES, Variable Rate Pass Through Ctfs., 3.00%, 10/25/2053(b)(f) | | | 2,927,316 | | | | 2,949,296 | |
Wells Fargo Commercial Mortgage Trust, Series 2015-C28, Class B, Variable Rate Pass Through Ctfs.,
4.13%, 05/15/2048(b) | | | 5,900,000 | | | | 5,935,311 | |
| | | | | | | | 61,254,838 | |
|
| Bonds & Notes–2.10% | |
Israel Government Agency for International Development (AID) Bond, Unsec. Gtd. Global Bonds,
5.13%, 11/01/2024 | | | 3,800,000 | | | | 4,425,277 | |
Private Export Funding Corp., | | | | | | | | |
Series BB, Sec. Gtd. Notes,
4.30%, 12/15/2021 | | | 1,540,000 | | | | 1,658,656 | |
Series HH, Sr. Sec. Gtd. Notes,
1.45%, 08/15/2019 | | | 5,000,000 | | | | 4,956,160 | |
| | | | | | | | 11,040,093 | |
Total Non-U.S. Government Sponsored Agency
Securities (Cost $71,265,112) | | | | 72,294,931 | |
|
U.S. Government Sponsored Agency
Securities–2.14% | |
| Federal Home Loan Bank (FHLB)–1.22% | |
Unsec. Bonds, 3.38%, 06/12/2020 | | | 6,220,000 | | | | 6,416,720 | |
|
| Financing Corp (FICO)–0.54% | |
| Sec. Bonds, 9.80%, 04/06/2018 | | | 700,000 | | | | 714,807 | |
Series E, Sec. Bonds,
9.65%, 11/02/2018 | | | 1,985,000 | | | | 2,113,725 | |
| | | | | | | | 2,828,532 | |
|
| Tennessee Valley Authority (TVA)–0.38% | |
Sr. Unsec. Global Notes,
1.88%, 08/15/2022 | | | 2,000,000 | | | | 1,969,638 | |
Total U.S. Government Sponsored Agency
Securities (Cost $11,164,381) | | | | 11,214,890 | |
| | |
| | | Shares | | | | |
Money Market Funds–0.88% | |
Invesco Government & Agency Portfolio–Institutional Class, 1.18%
(Cost $4,639,480)(g) | | | 4,639,480 | | | | 4,639,480 | |
| | |
| Options Purchased–0.04% | | | | | | | | |
(Cost $175,312)(h) | | | | 214,353 | |
TOTAL INVESTMENTS IN SECURITIES–99.62%
(Cost $520,055,083) | | | | 523,368,667 | |
OTHER ASSETS LESS LIABILITIES–0.38% | | | | 2,015,507 | |
NET ASSETS–100.00% | | | $ | 525,384,174 | |
See accompanying Notes to Financial Statements which are an integral part of the financial statements.
Invesco V.I. Government Securities Fund
Investment Abbreviations:
| | |
| ACES | | – Automatically Convertible Extendable Security |
| ARM | | – Adjustable Rate Mortgage |
| Ctfs. | | – Certificates |
| Gtd. | | – Guaranteed |
| IO | | – Interest Only |
| LIBOR | | – London Interbank Offered Rate |
| PNMR | | – Panamanian Mortgage Reference Rate |
| | |
| REMICs | | – Real Estate Mortgage Investment Conduits |
| Sec. | | – Secured |
| Sr. | | – Senior |
| STRIPS | | – Separately Traded Registered Interest and Principal Security |
| Unsec. | | – Unsecured |
| USD | | – U.S. Dollar |
Notes to Schedule of Investments:
| (a) | Interest or dividend rate is redetermined periodically. Rate shown is the rate in effect on December 31, 2017. |
| (b) | Interest rate is redetermined periodically based on the cash flows generated by the pool of assets backing the security, less any applicable fees. The rate shown is the rate in effect December 31, 2017. |
| (c) | Security traded on a discount basis. The interest rate shown represents the discount rate at the time of purchase by the Fund. |
| (d) | All or a portion of the value was pledged and/or designated as collateral to cover margin requirements for open futures contracts and swap agreements. See Note 1J and Note 4. |
| (e) | Principal amount of security and interest payments are adjusted for inflation. See Note 1I. |
| (f) | Security purchased or received in a transaction exempt from registration under the Securities Act of 1933, as amended (the “1933 Act”). The security may be resold pursuant to an exemption from registration under the 1933 Act, typically to qualified institutional buyers. The aggregate value of these securities at December 31, 2017 was $47,239,666, which represented 8.99% of the Fund’s Net Assets. |
| (g) | The money market fund and the Fund are affiliated by having the same investment adviser. The rate shown is the 7-day SEC standardized yield as of December 31, 2017. |
| (h) | The table below details options purchased: See Note 1M: |
| | | | | | | | | | | | | | | | | | | | | | | | | | | | | | | | | | |
| Open Over-The-Counter Interest Rate Swaptions Purchased | |
| Description | | Type of
Contract | | | Counterparty | | Exercise
Rate | | | Pay/Receive
Exercise
Rate | | | Floating Rate Index | | | Payment
Frequency | | | Expiration
Date | | | Notional
Value | | | Value | |
10 Year Interest Rate Swap | | | Put | | | Citibank, N.A. | | | 2.25 | % | | | Pay | | | | 3 Month USD LIBOR | | | | Quarterly | | | | 03/26/2018 | | | $ | 5,500,000 | | | $ | 107,177 | |
10 Year Interest Rate Swap | | | Put | | | Morgan Stanley
Capital Services LLC | | | 2.25 | | | | Pay | | | | 3 Month USD LIBOR | | | | Quarterly | | | | 03/26/2018 | | | | 5,500,000 | | | | 107,177 | |
Total Options Purchased — Interest Rate Risk (Cost $175,313) | | | | | | | | | | | $ | 214,354 | |
| | | | | | | | | | | | | | | | | | | | |
| Open Futures Contracts | |
| Long Futures Contracts | | Number of
Contracts | | | Expiration
Month | | | Notional Value | | | Value | | | Unrealized
Appreciation
(Depreciation) | |
U.S. Treasury 5 Year Notes | | | 35 | | | | March–2018 | | | $ | 4,065,742 | | | $ | (14,576 | ) | | $ | (14,576 | ) |
U.S. Treasury 10 Year Notes | | | 50 | | | | March–2018 | | | | 6,202,344 | | | | (12,197 | ) | | | (12,197 | ) |
U.S. Treasury Long Bonds | | | 36 | | | | March–2018 | | | | 5,508,000 | | | | (13,023 | ) | | | (13,023 | ) |
U.S. Treasury Ultra Bonds | | | 83 | | | | March–2018 | | | | 13,915,469 | | | | 101,834 | | | | 101,834 | |
Subtotal — Long Futures Contracts | | | | | | | | | | | | | | | 62,038 | | | | 62,038 | |
| | | | | |
| | | | | | | | | | | | | | | | | | | | |
Short Futures Contracts | | | | | | | | | | | | | | | | | | | | |
U.S. Treasury 2 Year Notes | | | 88 | | | | March–2018 | | | | (18,841,625 | ) | | | 20,546 | | | | 20,546 | |
U.S. Treasury 10 Year Ultra Bonds | | | 77 | | | | March–2018 | | | | (10,284,313 | ) | | | 41,418 | | | | 41,418 | |
Subtotal — Short Futures Contracts | | | | | | | | | | | | | | | 61,964 | | | | 61,964 | |
Total Futures Contracts — Interest Rate Risk | | | | | | | | | | | | | | $ | 124,002 | | | $ | 124,002 | |
| | | | | | | | | | | | | | | | | | | | | | | | | | | | | | | | | | | | | | |
| Open Centrally Cleared Interest Rate Swap Agreements | |
Pay/Receive
Floating Rate | | Floating Rate
Index | | Payment
Frequency | | | (Pay)/
Receive
Fixed
Rate | | | Payment
Frequency | | | Maturity Date | | | Notional
Value | | | Upfront
Payments
Paid (Received) | | | Value | | | Unrealized
Appreciation
(Depreciation) | |
Pay | | 3 Month USD LIBOR | | | Quarterly | | | | 2.25 | % | | | Semi-Annually | | | | 03/28/2028 | | | | USD | | | | 2,750,000 | | | $ | — | | | $ | (39,880 | ) | | $ | (39,880 | ) |
Pay | | 3 Month USD LIBOR | | | Quarterly | | | | 2.25 | | | | Semi-Annually | | | | 03/28/2028 | | | | USD | | | | 2,750,000 | | | | — | | | | (39,880 | ) | | | (39,880 | ) |
Pay | | 3 Month USD LIBOR | | | Quarterly | | | | 2.37 | | | | Semi-Annually | | | | 03/28/2028 | | | | USD | | | | 1,095,000 | | | | — | | | | (4,856 | ) | | | (4,856 | ) |
Pay | | 3 Month USD LIBOR | | | Quarterly | | | | 2.49 | | | | Semi-Annually | | | | 03/28/2028 | | | | USD | | | | 1,042,000 | | | | — | | | | 6,289 | | | | 6,289 | |
Receive | | 3 Month USD LIBOR | | | Quarterly | | | | (2.34 | ) | | | Semi-Annually | | | | 03/28/2028 | | | | USD | | | | 1,105,000 | | | | — | | | | 7,675 | | | | 7,675 | |
Total Centrally Cleared Interest Rate Swap Agreements — Interest Rate Risk | | | | | | | | | | | $ | — | | | $ | (70,652 | ) | | $ | (70,652 | ) |
Abbreviations:
| | |
| LIBOR | | – London Interbank Offer Rate |
| USD | | – U.S. Dollar |
See accompanying Notes to Financial Statements which are an integral part of the financial statements.
Invesco V.I. Government Securities Fund
Statement of Assets and Liabilities
December 31, 2017
Statement of Operations
For the year ended December 31, 2017
| | | | |
Assets: | | | | |
Investments in securities, at value (Cost $515,415,603) | | $ | 518,729,187 | |
Investments in affiliated money market funds, at value and cost | | | 4,639,480 | |
Other investments: | |
Variation margin receivable — futures contracts | | | 32,719 | |
Variation margin receivable — centrally cleared swap agreements | | | 4,836 | |
Receivable for: | |
Fund shares sold | | | 318,493 | |
Dividends and interest | | | 1,979,585 | |
Principal paydowns | | | 346,823 | |
Investment for trustee deferred compensation and retirement plans | | | 247,083 | |
Other assets | | | 1,194 | |
Total assets | | | 526,299,400 | |
| |
Liabilities: | | | | |
Payable for: | |
Fund shares reacquired | | | 233,689 | |
Accrued fees to affiliates | | | 342,242 | |
Accrued trustees’ and officers’ fees and benefits | | | 960 | |
Accrued other operating expenses | | | 67,789 | |
Trustee deferred compensation and retirement plans | | | 270,546 | |
Total liabilities | | | 915,226 | |
Net assets applicable to shares outstanding | | $ | 525,384,174 | |
| |
Net assets consist of: | | | | |
Shares of beneficial interest | | $ | 527,623,183 | |
Undistributed net investment income | | | 10,040,738 | |
Undistributed net realized gain (loss) | | | (15,646,681 | ) |
Net unrealized appreciation | | | 3,366,934 | |
| | | $ | 525,384,174 | |
| |
Net Assets: | | | | |
Series I | | $ | 318,297,929 | |
Series II | | $ | 207,086,245 | |
|
Shares outstanding, no par value,
with an unlimited number of shares authorized: | |
Series I | | | 27,894,147 | |
Series II | | | 18,316,242 | |
Series I: | |
Net asset value per share | | $ | 11.41 | |
Series II: | |
Net asset value per share | | $ | 11.31 | |
| | | | |
Investment income: | |
Interest | | $ | 14,696,001 | |
Dividends from affiliated money market funds | | | 56,092 | |
Total investment income | | | 14,752,093 | |
|
Expenses: | |
Advisory fees | | | 2,607,686 | |
Administrative services fees | | | 957,859 | |
Custodian fees | | | 37,270 | |
Distribution fees — Series II | | | 520,428 | |
Transfer agent fees | | | 40,685 | |
Trustees’ and officers’ fees and benefits | | | 28,147 | |
Reports to shareholders | | | 75,961 | |
Professional services fees | | | 60,297 | |
Other | | | 75,579 | |
Total expenses | | | 4,403,912 | |
Less: Fees waived | | | (7,917 | ) |
Net expenses | | | 4,395,995 | |
Net investment income | | | 10,356,098 | |
|
Realized and unrealized gain (loss) from: | |
Net realized gain (loss) from: | |
Investment securities | | | (2,676,859 | ) |
Futures contracts | | | 2,590,336 | |
Swap agreements | | | (236 | ) |
| | | | (86,759 | ) |
Change in net unrealized appreciation (depreciation) of: | |
Investment securities | | | (463,400 | ) |
Futures contracts | | | 146,504 | |
Swap agreements | | | (70,652 | ) |
| | | | (387,548 | ) |
Net realized and unrealized gain (loss) | | | (474,307 | ) |
Net increase in net assets resulting from operations | | $ | 9,881,791 | |
See accompanying Notes to Financial Statements which are an integral part of the financial statements.
Invesco V.I. Government Securities Fund
Statement of Changes in Net Assets
For the years ended December 31, 2017 and 2016
| | | | | | | | |
| | | 2017 | | | 2016 | |
Operations: | |
Net investment income | | $ | 10,356,098 | | | $ | 11,085,017 | |
Net realized gain (loss) | | | (86,759 | ) | | | 1,829,666 | |
Change in net unrealized appreciation (depreciation) | | | (387,548 | ) | | | (5,192,977 | ) |
Net increase in net assets resulting from operations | | | 9,881,791 | | | | 7,721,706 | |
|
Distributions to shareholders from net investment income: | |
Series I | | | (7,221,984 | ) | | | (7,819,357 | ) |
Series ll | | | (3,882,382 | ) | | | (3,787,853 | ) |
Total distributions from net investment income | | | (11,104,366 | ) | | | (11,607,210 | ) |
|
Share transactions–net: | |
Series l | | | (34,554,472 | ) | | | (37,454,400 | ) |
Series ll | | | 2,536,879 | | | | 11,482,998 | |
Net increase (decrease) in net assets resulting from share transactions | | | (32,017,593 | ) | | | (25,971,402 | ) |
Net increase (decrease) in net assets | | | (33,240,168 | ) | | | (29,856,906 | ) |
|
Net assets: | |
Beginning of year | | | 558,624,342 | | | | 588,481,248 | |
End of year (includes undistributed net investment income of $10,040,738 and $10,784,856, respectively) | | $ | 525,384,174 | | | $ | 558,624,342 | |
Notes to Financial Statements
December 31, 2017
NOTE 1—Significant Accounting Policies
Invesco V.I. Government Securities Fund (the “Fund”) is a series portfolio of AIM Variable Insurance Funds (Invesco Variable Insurance Funds) (the “Trust”). The Trust is a Delaware statutory trust registered under the Investment Company Act of 1940, as amended (the “1940 Act”), as an open-end series management investment company consisting of twenty-four separate portfolios, (each constituting a “Fund”). The assets, liabilities and operations of each portfolio are accounted for separately. Information presented in these financial statements pertains only to the Fund. Matters affecting each Fund or class will be voted on exclusively by the shareholders of such Fund or class. Current Securities and Exchange Commission (“SEC”) guidance, however, requires participating insurance companies offering separate accounts to vote shares proportionally in accordance with the instructions of the contract owners whose investments are funded by shares of each Fund or class.
The Fund’s investment objective is total return, comprised of current income and capital appreciation.
The Fund currently offers two classes of shares, Series I and Series II, both of which are offered to insurance company separate accounts funding variable annuity contracts and variable life insurance policies (“variable products”).
The Fund is an investment company and accordingly follows the investment company accounting and reporting guidance in accordance with Financial Accounting Standards Board Accounting Standards Codification Topic 946, Financial Services — Investment Companies.
The following is a summary of the significant accounting policies followed by the Fund in the preparation of its financial statements.
| A. | Security Valuations — Securities, including restricted securities, are valued according to the following policy. |
Debt obligations (including convertible securities) and unlisted equities are fair valued using an evaluated quote provided by an independent pricing service. Evaluated quotes provided by the pricing service may be determined without exclusive reliance on quoted prices, and may reflect appropriate factors such as institution-size trading in similar groups of securities, developments related to specific securities, dividend rate (for unlisted equities), yield (for debt obligations), quality, type of issue, coupon rate (for debt obligations), maturity (for debt obligations), individual trading characteristics and other market data. Pricing services generally value debt obligations assuming orderly transactions of institutional round lot size, but a fund may hold or transact in the same securities in smaller, odd lot sizes. Odd lots often trade at lower prices than institutional round lots. Debt obligations are subject to interest rate and credit risks. In addition, all debt obligations involve some risk of default with respect to interest and/or principal payments.
A security listed or traded on an exchange (except convertible securities) is valued at its last sales price or official closing price as of the close of the customary trading session on the exchange where the security is principally traded, or lacking any sales or official closing price on a particular day, the security may be valued at the closing bid price on that day. Securities traded in the over-the-counter market are valued based on prices furnished by independent pricing services or market makers. When such securities are valued by an independent pricing service they may be considered fair valued. Futures contracts are valued at the final settlement price set by an exchange on which they are principally traded. Listed options are valued at the mean between the last bid and asked prices from the exchange on which they are principally traded. Options not listed on an exchange are valued by an independent source at the mean between the last bid and asked prices. For purposes of determining net asset value (“NAV”) per share, futures and option contracts generally are valued 15 minutes after the close of the customary trading session of the New York Stock Exchange (“NYSE”).
Invesco V.I. Government Securities Fund
Investments in open-end and closed-end registered investment companies that do not trade on an exchange are valued at the end-of-day net asset value per share. Investments in open-end and closed-end registered investment companies that trade on an exchange are valued at the last sales price or official closing price as of the close of the customary trading session on the exchange where the security is principally traded.
Foreign securities’ (including foreign exchange contracts) prices are converted into U.S. dollar amounts using the applicable exchange rates as of the close of the NYSE. If market quotations are available and reliable for foreign exchange-traded equity securities, the securities will be valued at the market quotations. Because trading hours for certain foreign securities end before the close of the NYSE, closing market quotations may become unreliable. If between the time trading ends on a particular security and the close of the customary trading session on the NYSE, events occur that the investment adviser determines are significant and make the closing price unreliable, the Fund may fair value the security. If the event is likely to have affected the closing price of the security, the security will be valued at fair value in good faith using procedures approved by the Board of Trustees. Adjustments to closing prices to reflect fair value may also be based on a screening process of an independent pricing service to indicate the degree of certainty, based on historical data, that the closing price in the principal market where a foreign security trades is not the current value as of the close of the NYSE. Foreign securities’ prices meeting the approved degree of certainty that the price is not reflective of current value will be priced at the indication of fair value from the independent pricing service. Multiple factors may be considered by the independent pricing service in determining adjustments to reflect fair value and may include information relating to sector indices, American Depositary Receipts and domestic and foreign index futures. Foreign securities may have additional risks including exchange rate changes, potential for sharply devalued currencies and high inflation, political and economic upheaval, the relative lack of issuer information, relatively low market liquidity and the potential lack of strict financial and accounting controls and standards.
Securities for which market prices are not provided by any of the above methods may be valued based upon quotes furnished by independent sources. The last bid price may be used to value equity securities. The mean between the last bid and asked prices is used to value debt obligations, including corporate loans.
Securities for which market quotations are not readily available or became unreliable are valued at fair value as determined in good faith by or under the supervision of the Trust’s officers following procedures approved by the Board of Trustees. Issuer specific events, market trends, bid/asked quotes of brokers and information providers and other market data may be reviewed in the course of making a good faith determination of a security’s fair value.
The Fund may invest in securities that are subject to interest rate risk, meaning the risk that the prices will generally fall as interest rates rise and, conversely, the prices will generally rise as interest rates fall. Specific securities differ in their sensitivity to changes in interest rates depending on their individual characteristics. Changes in interest rates may result in increased market volatility, which may affect the value and/or liquidity of certain Fund investments.
Valuations change in response to many factors including the historical and prospective earnings of the issuer, the value of the issuer’s assets, general economic conditions, interest rates, investor perceptions and market liquidity. Because of the inherent uncertainties of valuation, the values reflected in the financial statements may materially differ from the value received upon actual sale of those investments.
| B. | Securities Transactions and Investment Income — Securities transactions are accounted for on a trade date basis. Realized gains or losses on sales are computed on the basis of specific identification of the securities sold. Interest income (net of withholding tax, if any) is recorded on the accrual basis from settlement date. Bond premiums and discounts are amortized and/or accreted over the lives of the respective securities. Pay-in-kind interest income and non-cash dividend income received in the form of securities in-lieu of cash are recorded at the fair value of the securities received. Paydown gains and losses on mortgage and asset-backed securities are recorded as adjustments to interest income. Dividend income (net of withholding tax, if any) is recorded on the ex-dividend date. |
The Fund may periodically participate in litigation related to Fund investments. As such, the Fund may receive proceeds from litigation settlements. Any proceeds received are included in the Statement of Operations as realized gain (loss) for investments no longer held and as unrealized gain (loss) for investments still held.
Brokerage commissions and mark ups are considered transaction costs and are recorded as an increase to the cost basis of securities purchased and/or a reduction of proceeds on a sale of securities. Such transaction costs are included in the determination of net realized and unrealized gain (loss) from investment securities reported in the Statement of Operations and the Statement of Changes in Net Assets and the net realized and unrealized gains (losses) on securities per share in the Financial Highlights. Transaction costs are included in the calculation of the Fund’s net asset value and, accordingly, they reduce the Fund’s total returns. These transaction costs are not considered operating expenses and are not reflected in net investment income reported in the Statement of Operations and the Statement of Changes in Net Assets, or the net investment income per share and the ratios of expenses and net investment income reported in the Financial Highlights, nor are they limited by any expense limitation arrangements between the Fund and the investment adviser.
The Fund allocates income and realized and unrealized capital gains and losses to a class based on the relative net assets of each class.
| C. | Country Determination — For the purposes of making investment selection decisions and presentation in the Schedule of Investments, the investment adviser may determine the country in which an issuer is located and/or credit risk exposure based on various factors. These factors include the laws of the country under which the issuer is organized, where the issuer maintains a principal office, the country in which the issuer derives 50% or more of its total revenues and the country that has the primary market for the issuer’s securities, as well as other criteria. Among the other criteria that may be evaluated for making this determination are the country in which the issuer maintains 50% or more of its assets, the type of security, financial guarantees and enhancements, the nature of the collateral and the sponsor organization. Country of issuer and/or credit risk exposure has been determined to be the United States of America, unless otherwise noted. |
| D. | Distributions — Distributions from net investment income and net realized capital gain, if any, are generally declared and paid to separate accounts of participating insurance companies annually and recorded on the ex-dividend date. |
| E. | Federal Income Taxes — The Fund intends to comply with the requirements of Subchapter M of the Internal Revenue Code of 1986, as amended (the “Internal Revenue Code”), necessary to qualify as a regulated investment company and to distribute substantially all of the Fund’s taxable earnings to shareholders. As such, the Fund will not be subject to federal income taxes on otherwise taxable income (including net realized capital gain) that is distributed to shareholders. Therefore, no provision for federal income taxes is recorded in the financial statements. |
The Fund recognizes the tax benefits of uncertain tax positions only when the position is more likely than not to be sustained. Management has analyzed the Fund’s uncertain tax positions and concluded that no liability for unrecognized tax benefits should be recorded related to uncertain
Invesco V.I. Government Securities Fund
tax positions. Management is not aware of any tax positions for which it is reasonably possible that the total amounts of unrecognized tax benefits will change materially in the next 12 months.
The Fund files tax returns in the U.S. Federal jurisdiction and certain other jurisdictions. Generally, the Fund is subject to examinations by such taxing authorities for up to three years after the filing of the return for the tax period.
| F. | Expenses — Fees provided for under the Rule 12b-1 plan of a particular class of the Fund and which are directly attributable to that class are charged to the operations of such class. All other expenses are allocated among the classes based on relative net assets. |
| G. | Accounting Estimates — The preparation of financial statements in conformity with accounting principles generally accepted in the United States of America (“GAAP”) requires management to make estimates and assumptions that affect the reported amounts of assets and liabilities at the date of the financial statements and the reported amounts of revenues and expenses during the reporting period including estimates and assumptions related to taxation. Actual results could differ from those estimates by a significant amount. In addition, the Fund monitors for material events or transactions that may occur or become known after the period-end date and before the date the financial statements are released to print. |
| H. | Indemnifications — Under the Trust’s organizational documents, each Trustee, officer, employee or other agent of the Trust is indemnified against certain liabilities that may arise out of the performance of their duties to the Fund. Additionally, in the normal course of business, the Fund enters into contracts, including the Fund’s servicing agreements, that contain a variety of indemnification clauses. The Fund’s maximum exposure under these arrangements is unknown as this would involve future claims that may be made against the Fund that have not yet occurred. The risk of material loss as a result of such indemnification claims is considered remote. |
| I. | Treasury Inflation-Protected Securities — The Fund may invest in Treasury Inflation-Protected Securities (“TIPS”). TIPS are fixed income securities whose principal value is periodically adjusted to the rate of inflation. The principal value of TIPS will be adjusted upward or downward, and any increase or decrease in the principal amount of TIPS will be included as interest income in the Statement of Operations, even though investors do not receive their principal until maturity. |
| J. | Futures Contracts — The Fund may enter into futures contracts to manage exposure to interest rate, equity and market price movements and/or currency risks. A futures contract is an agreement between two parties (“Counterparties”) to purchase or sell a specified underlying security, currency or commodity (or delivery of a cash settlement price, in the case of an index future) for a fixed price at a future date. The Fund currently invests only in exchange-traded futures and they are standardized as to maturity date and underlying financial instrument. Initial margin deposits required upon entering into futures contracts are satisfied by the segregation of specific securities or cash as collateral at the futures commission merchant (broker). During the period the futures contracts are open, changes in the value of the contracts are recognized as unrealized gains or losses by recalculating the value of the contracts on a daily basis. Subsequent or variation margin payments are received or made depending upon whether unrealized gains or losses are incurred. These amounts are reflected as receivables or payables on the Statement of Assets and Liabilities. When the contracts are closed or expire, the Fund recognizes a realized gain or loss equal to the difference between the proceeds from, or cost of, the closing transaction and the Fund’s basis in the contract. The net realized gain (loss) and the change in unrealized gain (loss) on futures contracts held during the period is included on the Statement of Operations. The primary risks associated with futures contracts are market risk and the absence of a liquid secondary market. If the Fund were unable to liquidate a futures contract and/or enter into an offsetting closing transaction, the Fund would continue to be subject to market risk with respect to the value of the contracts and continue to be required to maintain the margin deposits on the futures contracts. Futures contracts have minimal Counterparty risk since the exchange’s clearinghouse, as Counterparty to all exchange-traded futures, guarantees the futures against default. Risks may exceed amounts recognized in the Statement of Assets and Liabilities. |
| K. | Dollar Rolls and Forward Commitment Transactions — The Fund may enter into dollar roll transactions to enhance the Fund’s performance. The Fund executes its dollar roll transactions in the to be announced (“TBA”) market whereby the Fund makes a forward commitment to purchase a security and, instead of accepting delivery, the position is offset by the sale of the security with a simultaneous agreement to repurchase at a future date. |
The Fund accounts for dollar roll transactions as purchases and sales and realizes gains and losses on these transactions. These transactions increase the Fund’s portfolio turnover rate. The Fund will segregate liquid assets in an amount equal to its dollar roll commitments. Dollar roll transactions may be considered borrowings under the 1940 Act.
Dollar roll transactions involve the risk that a Counterparty to the transaction may fail to complete the transaction. If this occurs, the Fund may lose the opportunity to purchase or sell the security at the agreed upon price. Dollar roll transactions also involve the risk that the value of the securities retained by the Fund may decline below the price of the securities that the Fund has sold but is obligated to purchase under the agreement.
| L. | Call Options Purchased and Written — The Fund may write covered call options and/or buy call options. A covered call option gives the purchaser of such option the right to buy, and the writer the obligation to sell, the underlying security or foreign currency at the stated exercise price during the option period. Options written by the Fund normally will have expiration dates between three and nine months from the date written. The exercise price of a call option may be below, equal to, or above the current market value of the underlying security at the time the option is written. |
Additionally, the Fund may enter into an option on a swap agreement, also called a “swaption”. A swaption is an option that gives the buyer the right, but not the obligation, to enter into a swap on a future date in exchange for paying a market-based premium. A receiver swaption gives the owner the right to receive the total return of a specified asset, reference rate or index. Swaptions also include options that allow an existing swap to be terminated or extended by one of the Counterparties.
When the Fund writes a covered call option, an amount equal to the premium received by the Fund is recorded as an asset and an equivalent liability in the Statement of Assets and Liabilities. The amount of the liability is subsequently “marked-to-market” to reflect the current market value of the option written. If a written covered call option expires on the stipulated expiration date, or if the Fund enters into a closing purchase transaction, the Fund realizes a gain (or a loss if the closing purchase transaction exceeds the premium received when the option was written) without regard to any unrealized gain or loss on the underlying security, and the liability related to such option is extinguished. If a written covered call option is exercised, the Fund realizes a gain or a loss from the sale of the underlying security and the proceeds of the sale are increased by the premium originally received. Realized and unrealized gains and losses on call options written are included in the Statement of
Invesco V.I. Government Securities Fund
Operations as Net realized gain (loss) from and Change in net unrealized appreciation (depreciation) of Option contracts written. A risk in writing a covered call option is that the Fund gives up the opportunity for profit if the market price of the security increases and the option is exercised.
When the Fund buys a call option, an amount equal to the premium paid by the Fund is recorded as an investment on the Statement of Assets and Liabilities. The amount of the investment is subsequently “marked-to-market” to reflect the current value of the option purchased. Realized and unrealized gains and losses on call options purchased are included in the Statement of Operations as Net realized gain (loss) from and Change in net unrealized appreciation (depreciation) of Investment securities. A risk in buying an option is that the Fund pays a premium whether or not the option is exercised. In addition, there can be no assurance that a liquid secondary market will exist for any option purchased.
| M. | Put Options Purchased and Written — The Fund may purchase and write put options including options on securities indexes, or foreign currency and/or futures contracts. By purchasing a put option, the Fund obtains the right (but not the obligation) to sell the option’s underlying instrument at a fixed strike price. In return for this right, the Fund pays an option premium. The option’s underlying instrument may be a security, securities index, or a futures contract. Put options may be used by the Fund to hedge securities it owns by locking in a minimum price at which the Fund can sell. If security prices fall, the put option could be exercised to offset all or a portion of the Fund’s resulting losses. At the same time, because the maximum the Fund has at risk is the cost of the option, purchasing put options does not eliminate the potential for the Fund to profit from an increase in the value of the underlying portfolio securities. The Fund may write put options to earn additional income in the form of option premiums if it expects the price of the underlying instrument to remain stable or rise during the option period so that the option will not be exercised. The risk in this strategy is that the price of the underlying securities may decline by an amount greater than the premium received. Put options written are reported as a liability in the Statement of Assets and Liabilities. Realized and unrealized gains and losses on put options purchased and put options written are included in the Statement of Operations as Net realized gain (loss) from and Change in net unrealized appreciation (depreciation) of Investment securities and Option contracts written, respectively. A risk in buying an option is that the Fund pays a premium whether or not the option is exercised. In addition, there can be no assurance that a liquid secondary market will exist for any option purchased. |
| N. | Swap Agreements — The Fund may enter into various swap transactions, including interest rate, total return, index, currency and credit default swap contracts (“CDS”) for investment purposes or to manage interest rate, currency or credit risk. Such transactions are agreements between Counterparties. A swap agreement may be negotiated bilaterally and traded over-the-counter (“OTC”) between two parties (“uncleared/OTC”) or, in some instances, must be transacted through a future commission merchant (“FCM”) and cleared through a clearinghouse that serves as a central Counterparty (“centrally cleared swap”). These agreements may contain among other conditions, events of default and termination events, and various covenants and representations such as provisions that require the Fund to maintain a pre-determined level of net assets, and/or provide limits regarding the decline of the Fund’s NAV over specific periods of time. If the Fund were to trigger such provisions and have open derivative positions at that time, the Counterparty may be able to terminate such agreement and request immediate payment in an amount equal to the net liability positions, if any. |
Interest rate, total return, index, and currency swap agreements are two-party contracts entered into primarily to exchange the returns (or differentials in rates of returns) earned or realized on particular predetermined investments or instruments. The gross returns to be exchanged or “swapped” between the parties are calculated with respect to a notional amount, i.e., the return on or increase in value of a particular dollar amount invested at a particular interest rate or return of an underlying asset, in a particular foreign currency, or in a “basket” of securities representing a particular index.
In a centrally cleared swap, the Fund’s ultimate Counterparty is a central clearinghouse. The Fund initially will enter into centrally cleared swaps through an executing broker. When a fund enters into a centrally cleared swap, it must deliver to the central Counterparty (via the FCM) an amount referred to as “initial margin.” Initial margin requirements are determined by the central Counterparty, but an FCM may require additional initial margin above the amount required by the central Counterparty. Initial margin deposits required upon entering into centrally cleared swaps are satisfied by cash or securities as collateral at the FCM. Securities deposited as initial margin are designated on the Schedule of Investments and cash deposited is recorded on the Statement of Assets and Liabilities. During the term of a cleared swap agreement, a “variation margin” amount may be required to be paid by the Fund or may be received by the Fund, based on the daily change in price of the underlying reference instrument subject to the swap agreement and is recorded as a receivable or payable for variation margin in the Statement of Assets and Liabilities until the centrally cleared swap is terminated at which time a realized gain or loss is recorded.
An interest rate swap is an agreement between Counterparties pursuant to which the parties exchange a floating rate payment for a fixed rate payment based on a specified notional amount.
Changes in the value of centrally cleared and OTC swap agreements are recognized as unrealized gains (losses) in the Statement of Operations by “marking to market” on a daily basis to reflect the value of the swap agreement at the end of each trading day. Payments received or paid at the beginning of the agreement are reflected as such on the Statement of Assets and Liabilities and may be referred to as upfront payments. The Fund accrues for the fixed payment stream and amortizes upfront payments, if any, on swap agreements on a daily basis with the net amount, recorded as a component of realized gain (loss) on the Statement of Operations. A liquidation payment received or made at the termination of a swap agreement is recorded as realized gain (loss) on the Statement of Operations. The Fund segregates cash or liquid securities having a value at least equal to the amount of the potential obligation of a Fund under any swap transaction. Cash held as collateral is recorded as deposits with brokers on the Statement of Assets and Liabilities. Entering into these agreements involves, to varying degrees, lack of liquidity and elements of credit, market, and Counterparty risk in excess of amounts recognized on the Statement of Assets and Liabilities. Such risks involve the possibility that a swap is difficult to sell or liquidate; the Counterparty does not honor its obligations under the agreement and unfavorable interest rates and market fluctuations. It is possible that developments in the swaps market, including potential government regulation, could adversely affect the Fund’s ability to terminate existing swap agreements or to realize amounts to be received under such agreements. A short position in a security poses more risk than holding the same security long. As there is no limit on how much the price of the security can increase, the Fund’s exposure is unlimited.
| O. | Other Risks — The Fund may invest in obligations issued by agencies and instrumentalities of the U.S. Government that may vary in the level of support they receive from the government. The government may choose not to provide financial support to government sponsored agencies or instrumentalities if it is not legally obligated to do so. In this case, if the issuer defaulted, the Fund may not be able to recover its investment in such issuer from the U.S. Government. Many securities purchased by the Fund are not guaranteed by the U.S. Government. |
Invesco V.I. Government Securities Fund
| P. | Leverage Risk — Leverage exists when the Fund can lose more than it originally invests because it purchases or sells an instrument or enters into a transaction without investing an amount equal to the full economic exposure of the instrument or transaction. |
| Q. | Collateral — To the extent the Fund has designated or segregated a security as collateral and that security is subsequently sold, it is the Fund’s practice to replace such collateral no later than the next business day. |
NOTE 2—Advisory Fees and Other Fees Paid to Affiliates
The Trust has entered into a master investment advisory agreement with Invesco Advisers, Inc. (the “Adviser” or “Invesco”). Under the terms of the investment advisory agreement, the Fund accrues daily and pays monthly an advisory fee to the Adviser based on the annual rate of the Fund’s average daily net assets as follows:
| | | | |
| Average Daily Net Assets | | Rate | |
First $250 million | | | 0.50% | |
Over $250 million | | | 0.45% | |
For the year ended December 31, 2017, the effective advisory fees incurred by the Fund was 0.47%.
Under the terms of a master sub-advisory agreement between the Adviser and each of Invesco Asset Management Deutschland GmbH, Invesco Asset Management Limited, Invesco Asset Management (Japan) Limited, Invesco Hong Kong Limited, Invesco Senior Secured Management, Inc. and Invesco Canada Ltd. and separate sub-advisory agreements with Invesco PowerShares Capital Management LLC and Invesco Asset Management (India) Private Limited (collectively, the “Affiliated Sub-Advisers”) the Adviser, not the Fund, will pay 40% of the fees paid to the Adviser to any such Affiliated Sub-Adviser(s) that provide(s) discretionary investment management services to the Fund based on the percentage of assets allocated to such Affiliated Sub-Adviser(s).
The Adviser has contractually agreed, through at least June 30, 2018, to waive advisory fees and/or reimburse expenses of all shares to the extent necessary to limit total annual fund operating expenses after fee waivers and/or expense reimbursements (excluding certain items discussed below) of Series I shares to 1.50% and Series II shares to 1.75% of average daily net assets (the “expense limits”). In determining the Adviser’s obligation to waive advisory fees and/or reimburse expenses, the following expenses are not taken into account, and could cause the total annual fund operating expenses after fee waivers and/or expense reimbursements to exceed the numbers reflected above: (1) interest; (2) taxes; (3) dividend expense on short sales; (4) extraordinary or non-routine items, including litigation expenses; and (5) expenses that the Fund has incurred but did not actually pay because of an expense offset arrangement. Unless Invesco continues the fee waiver agreement, it will terminate on June 30, 2018. During its term, the fee waiver agreement cannot be terminated or amended to increase the expense limits or reduce the advisory fee waiver without approval of the Board of Trustees. The Adviser did not waive fees and/or reimburse expenses during the period under these expense limits.
Further, the Adviser has contractually agreed, through at least June 30, 2019, to waive the advisory fee payable by the Fund in an amount equal to 100% of the net advisory fees the Adviser receives from the affiliated money market funds on investments by the Fund of uninvested cash in such affiliated money market funds.
For the year ended December 31, 2017, the Adviser waived advisory fees of $7,917.
The Trust has entered into a master administrative services agreement with Invesco pursuant to which the Fund has agreed to pay Invesco a fee for costs incurred in providing accounting services and fund administrative services to the Fund and to reimburse Invesco for fees paid to insurance companies that have agreed to provide certain administrative services to the Fund. These administrative services provided by the insurance companies may include, among other things: maintenance of master accounts with the Fund; tracking, recording and transmitting net purchase and redemption orders for Fund shares; maintaining and preserving records related to the purchase, redemption and other account activity of variable product owners; distributing copies of Fund documents such as prospectuses, proxy materials and periodic reports, to variable product owners, and responding to inquiries from variable product owners about the Fund. Pursuant to such agreement, for the year ended December 31, 2017, Invesco was paid $131,893 for accounting and fund administrative services and was reimbursed $825,966 for fees paid to insurance companies.
The Trust has entered into a transfer agency and service agreement with Invesco Investment Services, Inc. (“IIS”) pursuant to which the Fund has agreed to pay IIS a fee for providing transfer agency and shareholder services to the Fund and reimburse IIS for certain expenses incurred by IIS in the course of providing such services. For the year ended December 31, 2017, expenses incurred under the agreement are shown in the Statement of Operations as Transfer agent fees.
The Trust has entered into a master distribution agreement with Invesco Distributors, Inc. (“IDI”) to serve as the distributor for the Fund. The Trust has adopted a plan pursuant to Rule 12b-1 under the 1940 Act with respect to the Fund’s Series II shares (the “Plan”). The Fund, pursuant to the Plan, pays IDI compensation at the annual rate of 0.25% of the Fund’s average daily net assets of Series II shares. The fees are accrued daily and paid monthly. Of the Plan payments, up to 0.25% of the average daily net assets of the Series II shares may be paid to insurance companies who furnish continuing personal shareholder services to customers who purchase and own Series II shares of the Fund. For the year ended December 31, 2017, expenses incurred under the Plan are detailed in the Statement of Operations as Distribution fees.
Certain officers and trustees of the Trust are officers and directors of the Adviser, IIS and/or IDI.
NOTE 3—Additional Valuation Information
GAAP defines fair value as the price that would be received to sell an asset or paid to transfer a liability in an orderly transaction between market participants at the measurement date, under current market conditions. GAAP establishes a hierarchy that prioritizes the inputs to valuation methods, giving the highest priority to readily available unadjusted quoted prices in an active market for identical assets (Level 1) and the lowest priority to significant unobservable inputs (Level 3), generally when market prices are not readily available or are unreliable. Based on the valuation inputs, the securities or other investments are tiered into one of three levels. Changes in valuation methods may result in transfers in or out of an investment’s assigned level:
| | Level 1 — | Prices are determined using quoted prices in an active market for identical assets. |
| | Level 2 — | Prices are determined using other significant observable inputs. Observable inputs are inputs that other market participants may use in pricing a security. These may include quoted prices for similar securities, interest rates, prepayment speeds, credit risk, yield curves, loss severities, default rates, discount rates, volatilities and others. |
Invesco V.I. Government Securities Fund
| | Level 3 — | Prices are determined using significant unobservable inputs. In situations where quoted prices or observable inputs are unavailable (for example, when there is little or no market activity for an investment at the end of the period), unobservable inputs may be used. Unobservable inputs reflect the Fund’s own assumptions about the factors market participants would use in determining fair value of the securities or instruments and would be based on the best available information. |
The following is a summary of the tiered valuation input levels, as of December 31, 2017. The level assigned to the securities valuations may not be an indication of the risk or liquidity associated with investing in those securities. Because of the inherent uncertainties of valuation, the values reflected in the financial statements may materially differ from the value received upon actual sale of those investments.
The Fund’s policy is to recognize transfers in and out of the valuation levels as of the end of the reporting period. During the year ended December 31, 2017, there were no material transfers between valuation levels.
| | | | | | | | | | | | | | | | |
| | | Level 1 | | | Level 2 | | | Level 3 | | | Total | |
Investments in Securities | | | | | | | | | | | | | | | | |
U.S. Government Sponsored Agency Mortgaged-Backed Securities | | $ | — | | | $ | 232,424,397 | | | $ | — | | | $ | 232,424,397 | |
U.S. Treasury Securities | | | — | | | | 202,580,615 | | | | — | | | | 202,580,615 | |
Non-U.S. Government Sponsored Agency Securities | | | — | | | | 72,294,931 | | | | — | | | | 72,294,931 | |
U.S. Government Sponsored Agency Securities | | | — | | | | 11,214,890 | | | | — | | | | 11,214,890 | |
Money Market Funds | | | 4,639,480 | | | | — | | | | — | | | | 4,639,480 | |
Options Purchased | | | — | | | | 214,354 | | | | — | | | | 214,354 | |
Total Investments in Securities | | | 4,639,480 | | | | 518,729,187 | | | | — | | | | 523,368,667 | |
Other Investments — Assets* | | | | | | | | | | | | | | | | |
Futures Contracts | | | 163,798 | | | | — | | | | — | | | | 163,798 | |
Swap Agreements | | | — | | | | 13,964 | | | | — | | | | 13,964 | |
| | | | 163,798 | | | | 13,964 | | | | — | | | | 177,762 | |
Other Investments — Liabilities* | | | | | | | | | | | | | | | | |
Futures Contracts | | | (39,796 | ) | | | — | | | | — | | | | (39,796 | ) |
Swap Agreements | | | — | | | | (84,616 | ) | | | — | | | | (84,616 | ) |
| | | | (39,796 | ) | | | (84,616 | ) | | | — | | | | (124,412 | ) |
Total Other Investments | | | 124,002 | | | | (70,652 | ) | | | — | | | | 53,350 | |
Total Investments | | $ | 4,763,482 | | | $ | 518,658,535 | | | $ | — | | | $ | 523,422,017 | |
| * | Unrealized appreciation (depreciation). |
NOTE 4—Derivative Investments
The Fund may enter into an International Swaps and Derivatives Association Master Agreement (“ISDA Master Agreement”) under which a fund may trade OTC derivatives. An OTC transaction entered into under an ISDA Master Agreement typically involves a collateral posting arrangement, payment netting provisions and close-out netting provisions. These netting provisions allow for reduction of credit risk through netting of contractual obligations. The enforceability of the netting provisions of the ISDA Master Agreement depends on the governing law of the ISDA Master Agreement, among other factors.
For financial reporting purposes, the Fund does not offset OTC derivative assets or liabilities that are subject to ISDA Master Agreements in the Statement of Assets and Liabilities.
Value of Derivative Investments at Period-End
The table below summarizes the value of the Fund’s derivative investments, detailed by primary risk exposure, held as of December 31, 2017:
| | | | |
| | | Value | |
| Derivative Assets | | Interest Rate
Risk | |
Unrealized appreciation on futures contracts — Exchange-Traded(a) | | $ | 163,798 | |
Unrealized appreciation on swap agreements — Centrally Cleared(a) | | | 13,964 | |
Options purchased, at value — OTC(b) | | | 214,354 | |
Total Derivative Assets | | | 392,116 | |
Derivatives not subject to master netting agreements | | | (177,762 | ) |
Total Derivative Assets subject to master netting agreements | | $ | 214,354 | |
| | | | |
| | | Value | |
| Derivative Liabilities | | Interest Rate
Risk | |
Unrealized depreciation on futures contracts — Exchange-Traded(a) | | $ | (39,796 | ) |
Unrealized depreciation on swap agreements — Centrally Cleared(a) | | | (84,616 | ) |
Total Derivative Liabilities | | | (124,412 | ) |
Derivatives not subject to master netting agreements | | | 124,412 | |
Total Derivative Liabilities subject to master netting agreements | | $ | — | |
| (a) | The daily variation margin receivable (payable) at period-end is recorded in the Statement of Assets and Liabilities. |
| (b) | Options purchased, at value as reported in the Schedule of Investments. |
Invesco V.I. Government Securities Fund
Offsetting Assets and Liabilities
The table below reflects the Fund’s exposure to Counterparties subject to either an ISDA Master Agreement or other agreement for OTC derivative transactions as of December 31, 2017.
| | | | | | | | | | | | | | | | | | | | |
| | | Financial
Derivative
Assets | | | Net Value of
Derivatives | | | Collateral
(Received)/Pledged | | | Net
Amount | |
| Counterparty | | Options
Purchased | | | | Non-Cash | | | Cash | | |
Citibank, N.A. | | $ | 107,177 | | | $ | 107,177 | | | $ | — | | | $ | — | | | $ | 107,177 | |
Morgan Stanley Capital Services LLC | | | 107,177 | | | | 107,177 | | | | — | | | | — | | | | 107,177 | |
Total | | $ | 214,354 | | | $ | 214,354 | | | $ | — | | | $ | — | | | $ | 214,354 | |
Effect of Derivative Investments for the year ended December 31, 2017
The table below summarizes the gains (losses) on derivative investments, detailed by primary risk exposure, recognized in earnings during the period:
| | | | |
| | | Location of Gain (Loss) on
Statement of Operations | |
| | | Interest Rate
Risk | |
Realized Gain (Loss): | | | | |
Futures contracts | | $ | 2,590,336 | |
Options purchased(a) | | | (295,000 | ) |
Swap agreements | | | (236 | ) |
Change in Net Unrealized Appreciation (Depreciation): | | | | |
Futures contracts | | | 146,504 | |
Options purchased(a) | | | 137,898 | |
Swap agreements | | | (70,652 | ) |
Total | | $ | 2,508,850 | |
| (a) | Options purchased are included in the net realized gain (loss) from investment securities and the change in net unrealized appreciation (depreciation) of investment securities. |
The table below summarizes the twelve-month average notional value of futures contracts, eight-month average notional value of options purchased and four-month average notional value of swap agreements outstanding during the period.
| | | | | | | | | | | | |
| | | Futures
Contracts | | | Options
Purchased | | | Swap
Agreements | |
Average notional value | | $ | 135,602,595 | | | $ | 9,812,500 | | | $ | 7,655,250 | |
NOTE 5—Trustees’ and Officers’ Fees and Benefits
Trustees’ and Officers’ Fees and Benefits include amounts accrued by the Fund to pay remuneration to certain Trustees and Officers of the Fund. Trustees have the option to defer compensation payable by the Fund, and Trustees’ and Officers’ Fees and Benefits also include amounts accrued by the Fund to fund such deferred compensation amounts. Those Trustees who defer compensation have the option to select various Invesco Funds in which their deferral accounts shall be deemed to be invested. Finally, certain current Trustees were eligible to participate in a retirement plan that provided for benefits to be paid upon retirement to Trustees over a period of time based on the number of years of service. The Fund may have certain former Trustees who also participate in a retirement plan and receive benefits under such plan. Trustees’ and Officers’ Fees and Benefits include amounts accrued by the Fund to fund such retirement benefits. Obligations under the deferred compensation and retirement plans represent unsecured claims against the general assets of the Fund.
NOTE 6—Cash Balances
The Fund may borrow for leveraging in an amount up to 5% of the Fund’s total assets (excluding the amount borrowed) at the time the borrowing is made. In doing so, the Fund is permitted to temporarily carry a negative or overdrawn balance in its account with State Street Bank and Trust Company, the custodian bank. Such balances, if any at period end, are shown in the Statement of Assets and Liabilities under the payable caption Amount due custodian. To compensate the custodian bank for such overdrafts, the overdrawn Fund may either (1) leave funds as a compensating balance in the account so the custodian bank can be compensated by earning the additional interest; or (2) compensate by paying the custodian bank at a rate agreed upon by the custodian bank and Invesco, not to exceed the contractually agreed upon rate. The Fund may not purchase additional securities when any borrowings from banks exceed 5% of the Fund’s total assets.
Invesco V.I. Government Securities Fund
NOTE 7—Distributions to Shareholders and Tax Components of Net Assets
Tax Character of Distributions to Shareholders Paid During the Fiscal Years Ended December 31, 2017 and 2016:
| | | | | | | | |
| | | 2017 | | | 2016 | |
Ordinary income | | $ | 11,104,366 | | | $ | 11,607,210 | |
Tax Components of Net Assets at Period-End:
| | | | |
| | | 2017 | |
Undistributed ordinary income | | $ | 10,276,681 | |
Net unrealized appreciation — investments | | | 2,991,120 | |
Temporary book/tax differences | | | (235,943 | ) |
Capital loss carryforward | | | (15,270,867 | ) |
Shares of beneficial interest | | | 527,623,183 | |
Total net assets | | $ | 525,384,174 | |
The difference between book-basis and tax-basis unrealized appreciation (depreciation) is due to differences in the timing of recognition of gains and losses on investments for tax and book purposes. The Fund’s net unrealized appreciation difference is attributable primarily to futures contracts and wash sales.
The temporary book/tax differences are a result of timing differences between book and tax recognition of income and/or expenses. The Fund’s temporary book/tax differences are the result of the trustee deferral of compensation and retirement plan benefits.
Capital loss carryforward is calculated and reported as of a specific date. Results of transactions and other activity after that date may affect the amount of capital loss carryforward actually available for the Fund to utilize. Capital losses generated in years beginning after December 22, 2010 can be carried forward for an unlimited period, whereas previous losses expire in eight tax years. Capital losses with an expiration period may not be used to offset capital gains until all net capital losses without an expiration date have been utilized. Capital loss carryforwards with no expiration date will retain their character as either short-term or long-term capital losses instead of as short-term capital losses as under prior law. The ability to utilize capital loss carryforwards in the future may be limited under the Internal Revenue Code and related regulations based on the results of future transactions.
The Fund has a capital loss carryforward as of December 31, 2017, which expires as follows:
| | | | | | | | | | | | |
| Capital Loss Carryforward* | |
| Expiration | | Short-Term | | | Long-Term | | | Total | |
Not subject to expiration | | $ | 8,472,407 | | | $ | 6,798,460 | | | $ | 15,270,867 | |
| * | Capital loss carryforward as of the date listed above is reduced for limitations, if any, to the extent required by the Internal Revenue Code and may be further limited depending upon a variety of factors, including the realization of net unrealized gains or losses as of the date of any reorganization. |
NOTE 8—Investment Transactions
The aggregate amount of investment securities (other than short-term securities, U.S. Treasury obligations and money market funds, if any) purchased and sold by the Fund during the year ended December 31, 2017 was $55,621,786 and $90,177,509, respectively. During the same period, purchases and sales of U.S. Treasury obligations were $129,827,009 and $96,886,807, respectively. Cost of investments, including any derivatives, on a tax basis includes the adjustments for financial reporting purposes as of the most recently completed federal income tax reporting period-end.
| | | | |
| Unrealized Appreciation (Depreciation) of Investments on a Tax Basis | | | |
Aggregate unrealized appreciation of investments | | $ | 6,506,766 | |
Aggregate unrealized (depreciation) of investments | | | (3,515,646 | ) |
Net unrealized appreciation of investments | | $ | 2,991,120 | |
Cost of investments for tax purposes is $520,430,897.
NOTE 9—Reclassification of Permanent Differences
Primarily as a result of differing book/tax treatment of expiration of capital loss carryforward, on December 31, 2017, undistributed net investment income was increased by $4,150, undistributed net realized gain (loss) was increased by $3,841,689 and shares of beneficial interest was decreased by $3,845,839. This reclassification had no effect on the net assets of the Fund.
Invesco V.I. Government Securities Fund
NOTE 10—Share Information
| | | | | | | | | | | | | | | | |
| | | Summary of Share Activity | |
| | | Years ended December 31, | |
| | | 2017(a) | | | 2016 | |
| | | Shares | | | Amount | | | Shares | | | Amount | |
Sold: | | | | | | | | | | | | | | | | |
Series I | | | 4,245,551 | | | $ | 49,001,619 | | | | 5,588,689 | | | $ | 65,831,931 | |
Series II | | | 1,931,968 | | | | 22,005,900 | | | | 3,992,862 | | | | 46,492,943 | |
| | | | |
Issued as reinvestment of dividends: | | | | | | | | | | | | | | | | |
Series I | | | 632,952 | | | | 7,221,984 | | | | 666,044 | | | | 7,819,357 | |
Series II | | | 343,270 | | | | 3,882,382 | | | | 325,417 | | | | 3,787,853 | |
| | | | |
Reacquired: | | | | | | | | | | | | | | | | |
Series I | | | (7,906,368 | ) | | | (90,778,075 | ) | | | (9,454,799 | ) | | | (111,105,688 | ) |
Series II | | | (2,048,051 | ) | | | (23,351,403 | ) | | | (3,337,612 | ) | | | (38,797,798 | ) |
Net increase (decrease) in share activity | | | (2,800,678 | ) | | $ | (32,017,593 | ) | | | (2,219,399 | ) | | $ | (25,971,402 | ) |
| (a) | There are entities that are record owners of more than 5% of the outstanding shares of the Fund and in the aggregate own 79% of the outstanding shares of the Fund. The Fund and the Fund’s principal underwriter or adviser, are parties to participation agreements with these entities whereby these entities sell units of interest in separate accounts funding variable products that are invested in the Fund. The Fund, Invesco and/or Invesco affiliates may make payments to these entities, which are considered to be related to the Fund, for providing services to the Fund, Invesco and/or Invesco affiliates including but not limited to services such as, securities brokerage, third party record keeping and account servicing and administrative services. The Fund has no knowledge as to whether all or any portion of the shares owned of record by these entities are also owned beneficially. |
NOTE 11—Financial Highlights
The following schedule presents financial highlights for a share of the Fund outstanding throughout the periods indicated.
| | | | | | | | | | | | | | | | | | | | | | | | | | | | | | | | | | | | | | | | | | | | | | | | |
| | | Net asset
value,
beginning
of period | | | Net
investment
income(a) | | | Net gains
(losses)
on securities
(both
realized and
unrealized) | | | Total from
investment
operations | | | Dividends
from net
investment
income | | | Net asset
value, end
of period | | | Total
return(b) | | | Net assets,
end of period
(000’s omitted) | | | Ratio of
expenses
to average
net assets
with fee waivers
and/or expenses
absorbed | | | Ratio of
expenses
to average net
assets without
fee waivers
and/or expenses
absorbed | | | Ratio of net
investment
income
to average
net assets | | | Portfolio
turnover(c) | |
Series I | |
Year ended 12/31/17 | | $ | 11.44 | | | $ | 0.22 | | | $ | (0.01 | ) | | $ | 0.21 | | | $ | (0.24 | ) | | $ | 11.41 | | | | 1.87 | % | | $ | 318,298 | | | | 0.70 | %(d) | | | 0.70 | %(d) | | | 1.97 | %(d) | | | 35 | % |
Year ended 12/31/16 | | | 11.52 | | | | 0.23 | | | | (0.07 | ) | | | 0.16 | | | | (0.24 | ) | | | 11.44 | | | | 1.32 | | | | 353,614 | | | | 0.73 | | | | 0.73 | | | | 1.93 | | | | 31 | |
Year ended 12/31/15 | | | 11.74 | | | | 0.17 | | | | (0.13 | ) | | | 0.04 | | | | (0.26 | ) | | | 11.52 | | | | 0.34 | | | | 393,090 | | | | 0.77 | | | | 0.77 | | | | 1.44 | | | | 59 | |
Year ended 12/31/14 | | | 11.64 | | | | 0.16 | | | | 0.32 | | | | 0.48 | | | | (0.38 | ) | | | 11.74 | | | | 4.14 | | | | 474,556 | | | | 0.78 | | | | 0.78 | | | | 1.36 | | | | 55 | |
Year ended 12/31/13 | | | 12.40 | | | | 0.13 | | | | (0.45 | ) | | | (0.32 | ) | | | (0.44 | ) | | | 11.64 | | | | (2.62 | ) | | | 565,690 | | | | 0.74 | | | | 0.76 | | | | 1.10 | | | | 139 | |
Series II | | | | | | | | | | | | | | | | | | | | | | | | | | | | | | | | | | | | | | | | | | | | | | | | |
Year ended 12/31/17 | | | 11.33 | | | | 0.19 | | | | (0.00 | ) | | | 0.19 | | | | (0.21 | ) | | | 11.31 | | | | 1.72 | | | | 207,086 | | | | 0.95 | (d) | | | 0.95 | (d) | | | 1.72 | (d) | | | 35 | |
Year ended 12/31/16 | | | 11.42 | | | | 0.20 | | | | (0.08 | ) | | | 0.12 | | | | (0.21 | ) | | | 11.33 | | | | 1.00 | | | | 205,010 | | | | 0.98 | | | | 0.98 | | | | 1.68 | | | | 31 | |
Year ended 12/31/15 | | | 11.64 | | | | 0.14 | | | | (0.13 | ) | | | 0.01 | | | | (0.23 | ) | | | 11.42 | | | | 0.06 | | | | 195,392 | | | | 1.02 | | | | 1.02 | | | | 1.19 | | | | 59 | |
Year ended 12/31/14 | | | 11.54 | | | | 0.13 | | | | 0.31 | | | | 0.44 | | | | (0.34 | ) | | | 11.64 | | | | 3.88 | | | | 212,788 | | | | 1.03 | | | | 1.03 | | | | 1.11 | | | | 55 | |
Year ended 12/31/13 | | | 12.29 | | | | 0.10 | | | | (0.45 | ) | | | (0.35 | ) | | | (0.40 | ) | | | 11.54 | | | | (2.85 | ) | | | 227,237 | | | | 0.99 | | | | 1.01 | | | | 0.85 | | | | 139 | |
| (a) | Calculated using average shares outstanding. |
| (b) | Includes adjustments in accordance with accounting principles generally accepted in the United States of America and as such, the net asset value for financial reporting purposes and the returns based upon those net asset values may differ from the net asset value and returns for shareholder transactions. Total returns are not annualized for periods less than one year, if applicable, and do not reflect charges assessed in connection with a variable product, which if included would reduce total returns. |
| (c) | Portfolio turnover is calculated at the fund level and is not annualized for periods less than one year, if applicable. |
| (d) | Ratios are based on average daily net assets (000’s omitted) of $343,537 and $208,171 for Series I and Series II shares, respectively. |
Invesco V.I. Government Securities Fund
Report of Independent Registered Public Accounting Firm
To the Board of Trustees of AIM Variable Insurance Funds (Invesco Variable Insurance Funds)
and Shareholders of Invesco V.I. Government Securities Fund
Opinion on the Financial Statements
We have audited the accompanying statement of assets and liabilities, including the schedule of investments, of Invesco V.I. Government Securities Fund (one of the funds constituting AIM Variable Insurance Funds (Invesco Variable Insurance Funds), hereafter referred to as the “Fund”) as of December 31, 2017, the related statement of operations for the year ended December 31, 2017, the statement of changes in net assets for each of the two years in the period ended December 31, 2017, including the related notes, and the financial highlights for each of the five years in the period ended December 31, 2017 (collectively referred to as the “financial statements”). In our opinion, the financial statements present fairly, in all material respects, the financial position of the Fund as of December 31, 2017, the results of its operations for the year then ended, the changes in its net assets for each of the two years in the period ended December 31, 2017 and the financial highlights for each of the five years in the period ended December 31, 2017 in conformity with accounting principles generally accepted in the United States of America.
Basis for Opinion
These financial statements are the responsibility of the Fund’s management. Our responsibility is to express an opinion on the Fund’s financial statements based on our audits. We are a public accounting firm registered with the Public Company Accounting Oversight Board (United States) (“PCAOB”) and are required to be independent with respect to the Fund in accordance with the U.S. federal securities laws and the applicable rules and regulations of the Securities and Exchange Commission and the PCAOB.
We conducted our audits of these financial statements in accordance with the standards of the PCAOB. Those standards require that we plan and perform the audit to obtain reasonable assurance about whether the financial statements are free of material misstatement, whether due to error or fraud.
Our audits included performing procedures to assess the risks of material misstatement of the financial statements, whether due to error or fraud, and performing procedures that respond to those risks. Such procedures included examining, on a test basis, evidence regarding the amounts and disclosures in the financial statements. Our audits also included evaluating the accounting principles used and significant estimates made by management, as well as evaluating the overall presentation of the financial statements. Our procedures included confirmation of securities owned as of December 31, 2017 by correspondence with the custodian, transfer agent and brokers; when replies were not received from brokers, we performed other auditing procedures. We believe that our audits provide a reasonable basis for our opinion.
PricewaterhouseCoopers LLP
Houston, TX
February 14, 2018
We have served as the auditor of one or more of the investment companies in the Invesco/PowerShares group of investment companies since at least 1995. We have not determined the specific year we began serving as auditor.
Invesco V.I. Government Securities Fund
Calculating your ongoing Fund expenses
Example
As a shareholder of the Fund, you incur ongoing costs, including management fees; distribution and/or service fees (12b-1); and other Fund expenses. This example is intended to help you understand your ongoing costs (in dollars) of investing in the Fund and to compare these costs with ongoing costs of investing in other mutual funds. The example is based on an investment of $1,000 invested at the beginning of the period and held for the entire period July 1, 2017 through December 31, 2017.
The actual and hypothetical expenses in the examples below do not represent the effect of any fees or other expenses assessed in connection with a variable product; if they did, the expenses shown would be higher while the ending account values shown would be lower.
Actual expenses
The table below provides information about actual account values and actual expenses. You may use the information in this table, together with the amount you invested, to estimate the expenses that you paid over the period. Simply divide your account value by $1,000 (for example, an $8,600 account value divided by $1,000 = 8.6), then multiply the result by the number in the table under the heading entitled “Actual Expenses Paid During Period” to estimate the expenses you paid on your account during this period.
Hypothetical example for comparison purposes
The table below also provides information about hypothetical account values and hypothetical expenses based on the Fund’s actual expense ratio and an assumed rate of return of 5% per year before expenses, which is not the Fund’s actual return.
The hypothetical account values and expenses may not be used to estimate the actual ending account balance or expenses you paid for the period. You may use this information to compare the ongoing costs of investing in the Fund and other funds. To do so, compare this 5% hypothetical example with the 5% hypothetical examples that appear in the shareholder reports of the other funds.
Please note that the expenses shown in the table are meant to highlight your ongoing costs. Therefore, the hypothetical information is useful in comparing ongoing costs, and will not help you determine the relative total costs of owning different funds.
| | | | | | | | | | | | | | | | | | | | | | | | |
| Class | | Beginning
Account Value
(07/01/17) | | | ACTUAL | | | HYPOTHETICAL
(5% annual return before expenses) | | | Annualized
Expense
Ratio | |
| | | Ending
Account Value
(12/31/17)1 | | | Expenses
Paid During
Period2 | | | Ending
Account Value
(12/31/17) | | | Expenses
Paid During
Period2 | | |
Series I | | $ | 1,000.00 | | | $ | 1,005.50 | | | $ | 3.49 | | | $ | 1,021.73 | | | $ | 3.52 | | | | 0.69 | % |
Series II | | | 1,000.00 | | | | 1,004.80 | | | | 4.75 | | | | 1,020.47 | | | | 4.79 | | | | 0.94 | |
| 1 | The actual ending account value is based on the actual total return of the Fund for the period July 1, 2017 through December 31, 2017, after actual expenses and will differ from the hypothetical ending account value which is based on the Fund’s expense ratio and a hypothetical annual return of 5% before expenses. |
| 2 | Expenses are equal to the Fund’s annualized expense ratio as indicated above multiplied by the average account value over the period, multiplied by 184/365 to reflect the most recent fiscal half year. |
Invesco V.I. Government Securities Fund
Tax Information
Form 1099-DIV, Form 1042-S and other year–end tax information provide shareholders with actual calendar year amounts that should be included in their tax returns. Shareholders should consult their tax advisors.
The following distribution information is being provided as required by the Internal Revenue Code or to meet a specific state’s requirement.
The Fund designates the following amounts or, if subsequently determined to be different, the maximum amount allowable for its fiscal year ended December 31, 2017:
| | | | |
Federal and State Income Tax | |
Corporate Dividends Received Deduction* | | | 0.00 | % |
U.S. Treasury Obligations* | | | 24.79 | % |
| | * | The above percentages are based on ordinary income dividends paid to shareholders during the Fund’s fiscal year. |
Invesco V.I. Government Securities Fund
Trustees and Officers
The address of each trustee and officer is AIM Variable Insurance Funds (Invesco Variable Insurance Funds) (the “Trust”), 11 Greenway Plaza, Suite 1000, Houston, Texas 77046-1173. The trustees serve for the life of the Trust, subject to their earlier death, incapacitation, resignation, retirement or removal as more specifically provided in the Trust’s organizational documents. Each officer serves for a one year term or until their successors are elected and qualified. Column two below includes length of time served with predecessor entities, if any.
| | | | | | | | |
Name, Year of Birth and
Position(s) Held with the Trust | | Trustee and/
or Officer Since | | Principal Occupation(s)
During Past 5 Years | | Number of
Funds in Fund
Complex
Overseen by
Trustee | | Other Directorship(s)
Held by Trustee During
Past 5 Years |
| Interested Persons | | | | | | | | |
Martin L. Flanagan1 — 1960 Trustee | | 2007 | | Executive Director, Chief Executive Officer and President, Invesco Ltd. (ultimate parent of Invesco and a global investment management firm); Trustee, The Invesco Funds; Vice Chair, Investment Company Institute; and Member of Executive Board, SMU Cox School of Business Formerly: Advisor to the Board, Invesco Advisers, Inc. (formerly known as Invesco Institutional (N.A.), Inc.); Chairman and Chief Executive Officer, Invesco Advisers, Inc. (registered investment adviser); Director, Chairman, Chief Executive Officer and President, Invesco Holding Company (US), Inc. (formerly IVZ Inc.) (holding company), Invesco Group Services, Inc. (service provider) and Invesco North American Holdings, Inc. (holding company); Director, Chief Executive Officer and President, Invesco Holding Company Limited (parent of Invesco and a global investment management firm); Director, Invesco Ltd.; Chairman, Investment Company Institute and President, Co-Chief Executive Officer, Co-President, Chief Operating Officer and Chief Financial Officer, Franklin Resources, Inc. (global investment management organization) | | 158 | | None |
Philip A. Taylor2 — 1954 Trustee and Senior Vice President | | 2006 | | Head of the Americas and Senior Managing Director, Invesco Ltd.; Director, Invesco Advisers, Inc. (formerly known as Invesco Institutional (N.A.), Inc.) (registered investment adviser); Director, Chairman, Chief Executive Officer and President, Invesco Management Group, Inc. (formerly known as Invesco Aim Management Group, Inc.) (financial services holding company); Director and Chairman, Invesco Investment Services, Inc. (formerly known as Invesco Aim Investment Services, Inc.) (registered transfer agent); Chief Executive Officer, Invesco Corporate Class Inc. (corporate mutual fund company); Director, Chairman and Chief Executive Officer, Invesco Canada Ltd. (formerly known as Invesco Trimark Ltd./Invesco Trimark Ltèe) (registered investment adviser and registered transfer agent); Trustee and Senior Vice President, The Invesco Funds; Director, Invesco Investment Advisers LLC (formerly known as Van Kampen Asset Management). Formerly: Co-Chairman, Co-President and Co-Chief Executive Officer, Invesco Advisers, Inc. (formerly known as Invesco Institutional (N.A.), Inc.) (registered investment adviser); Director, Chief Executive Officer and President, Van Kampen Exchange Corp; President and Principal Executive Officer, The Invesco Funds (other than AIM Treasurer’s Series Trust (Invesco Treasurer’s Series Trust), Short-Term Investments Trust and Invesco Management Trust); Executive Vice President, The Invesco Funds (AIM Treasurer’s Series Trust (Invesco Treasurer’s Series Trust), Short-Term Investments Trust and Invesco Management Trust only); Director and President, INVESCO Funds Group, Inc. (registered investment adviser and registered transfer agent); Director and Chairman, IVZ Distributors, Inc. (formerly known as INVESCO Distributors, Inc.) (registered broker dealer); Director, President and Chairman, Invesco Inc. (holding company), Invesco Canada Holdings Inc. (holding company), Trimark Investments Ltd./Placements Trimark Ltèe and Invesco Financial Services Ltd/Services Financiers Invesco Ltèe; Chief Executive Officer, Invesco Canada Fund Inc. (corporate mutual fund company); Director and Chairman, Van Kampen Investor Services Inc.; Director, Chief Executive Officer and President, 1371 Preferred Inc. (holding company) and Van Kampen Investments Inc.; Director and President, AIM GP Canada Inc. (general partner for limited partnerships) and Van Kampen Advisors, Inc.; Director and Chief Executive Officer, Invesco Trimark Dealer Inc. (registered broker dealer); Director, Invesco Distributors, Inc. (formerly known as Invesco Aim Distributors, Inc.) (registered broker dealer); Manager, Invesco PowerShares Capital Management LLC; Director, Chief Executive Officer and President, Invesco Advisers, Inc.; Director, Chairman, Chief Executive Officer and President, Invesco Aim Capital Management, Inc.; President, Invesco Trimark Dealer Inc. and Invesco Trimark Ltd./Invesco Trimark Ltèe; Director and President, AIM Trimark Corporate Class Inc. and AIM Trimark Canada Fund Inc.; Senior Managing Director, Invesco Holding Company Limited; Director and Chairman, Fund Management Company (former registered broker dealer); President and Principal Executive Officer, The Invesco Funds (AIM Treasurer’s Series Trust (Invesco Treasurer’s Series Trust), and Short-Term Investments Trust only); President, AIM Trimark Global Fund Inc. and AIM Trimark Canada Fund Inc. | | 158 | | None |
| 1 | Mr. Flanagan is considered an interested person (within the meaning of Section 2(a)(19) of the 1940 Act) of the Trust because he is an officer of the Adviser to the Trust, and an officer and a director of Invesco Ltd., ultimate parent of the Adviser. |
| 2 | Mr. Taylor is considered an interested person (within the meaning of Section 2(a)(19) of the 1940 Act) of the Trust because he is an officer and a director of the Adviser. |
Invesco V.I. Government Securities Fund
Trustees and Officers—(continued)
| | | | | | | | |
Name, Year of Birth and
Position(s) Held with the Trust | | Trustee and/
or Officer Since | | Principal Occupation(s)
During Past 5 Years | | Number of
Funds in Fund
Complex
Overseen by
Trustee | | Other Directorship(s)
Held by Trustee During
Past 5 Years |
| Independent Trustees | | | | | | | | |
Bruce L. Crockett — 1944 Trustee and Chair | | 1993 | | Chairman, Crockett Technologies Associates (technology consulting company) Formerly: Director, Captaris (unified messaging provider); Director, President and Chief Executive Officer, COMSAT Corporation; Chairman, Board of Governors of INTELSAT (international communications company); ACE Limited (insurance company); Independent Directors Council and Investment Company Institute: Member of the Audit Committee, Investment Company Institute; Member of the Executive Committee and Chair of the Governance Committee, Independent Directors Council | | 158 | | Director and Chairman of the Audit Committee, ALPS (Attorneys Liability Protection Society) (insurance company); Director and Member of the Audit Committee and Compensation Committee, Ferroglobe PLC (metallurgical company) |
David C. Arch — 1945 Trustee | | 2010 | | Chairman of Blistex Inc. (consumer health care products manufacturer); Member, World Presidents’ Organization | | 158 | | Board member of the Illinois Manufacturers’ Association |
Jack M. Fields — 1952 Trustee | | 1997 | | Chief Executive Officer, Twenty First Century Group, Inc. (government affairs company); and Chairman, Discovery Learning Alliance (non-profit) Formerly: Owner and Chief Executive Officer, Dos Angeles Ranch L.P. (cattle, hunting, corporate entertainment); Director, Insperity, Inc. (formerly known as Administaff) (human resources provider); Chief Executive Officer, Texana Timber LP (sustainable forestry company); Director of Cross Timbers Quail Research Ranch (non-profit); and member of the U.S. House of Representatives | | 158 | | None |
Cynthia Hostetler — 1962 Trustee | | 2017 | | Non-Executive Director and Trustee of a number of public and private business corporations Formerly: Head of Investment Funds and Private Equity, Overseas Private Investment Corporation; President, First Manhattan Bancorporation, Inc.; Attorney, Simpson Thacher & Bartlett LLP | | 158 | | Vulcan Materials Company (construction materials company); Trilinc Global Impact Fund; Aberdeen Investment Funds (4 portfolios); Artio Global Investment LLC (mutual fund complex); Edgen Group, Inc. (specialized energy and infrastructure products distributor) |
Eli Jones — 1961 Trustee | | 2016 | | Professor and Dean, Mays Business School — Texas A&M University Formerly: Professor and Dean, Walton College of Business, University of Arkansas and E.J. Ourso College of Business, Louisiana State University; Director, Arvest Bank | | 158 | | Insperity, Inc. (formerly known as Administaff) (human resources provider) |
Prema Mathai-Davis — 1950 Trustee | | 1998 | | Retired. | | 158 | | None |
Teresa M. Ressel — 1962 Trustee | | 2017 | | Non-executive director and trustee of a number of public and private business corporations Formerly: Chief Financial Officer, Olayan America, The Olayan Group (international investor/commercial/industrial); Chief Executive Officer, UBS Securities LLC; Group Chief Operating Officer, Americas, UBS AG; Assistant Secretary for Management & Budget and CFO, US Department of the Treasury | | 158 | | Atlantic Power Corporation (power generation company); ON Semiconductor Corp. (semiconductor supplier) |
Ann Barnett Stern — 1957 Trustee | | 2017 | | President and Chief Executive Officer, Houston Endowment Inc. (private philanthropic institution) Formerly: Executive Vice President and General Counsel, Texas Children’s Hospital; Attorney, Beck, Redden and Secrest, LLP; Business Law Instructor, University of St. Thomas; Attorney, Andrews & Kurth LLP | | 158 | | Federal Reserve Bank of Dallas |
Raymond Stickel, Jr. — 1944 Trustee | | 2005 | | Retired. Formerly: Director, Mainstay VP Series Funds, Inc. (25 portfolios); Partner, Deloitte & Touche | | 158 | | None |
Robert C. Troccoli — 1949 Trustee | | 2016 | | Adjunct Professor, University of Denver — Daniels College of Business Formerly: Senior Partner, KPMG LLP | | 158 | | None |
Christopher L. Wilson — 1957 Trustee | | 2017 | | Non-executive director and trustee of a number of public and private business corporations Formerly: Managing Partner, CT2, LLC (investing and consulting firm); President/Chief Executive Officer, Columbia Funds, Bank of America Corporation; President/Chief Executive Officer, CDC IXIS Asset Management Services, Inc.; Principal & Director of Operations, Scudder Funds, Scudder, Stevens & Clark, Inc.; Assistant Vice President, Fidelity Investments | | 158 | | TD Asset Management USA Inc. (mutual fund complex) (22 portfolios); ISO New England, Inc. (non-profit organization managing regional electricity market) |
Invesco V.I. Government Securities Fund
Trustees and Officers—(continued)
| | | | | | | | |
Name, Year of Birth and
Position(s) Held with the Trust | | Trustee and/
or Officer Since | | Principal Occupation(s)
During Past 5 Years | | Number of
Funds in Fund
Complex
Overseen by
Trustee | | Other Directorship(s)
Held by Trustee During
Past 5 Years |
| Other Officers | | | | | | | | |
Sheri Morris — 1964 President, Principal Executive Officer and Treasurer | | 1999 | | President, Principal Executive Officer and Treasurer, The Invesco Funds; Vice President, Invesco Advisers, Inc. (formerly known as Invesco Institutional (N.A.), Inc.) (registered investment adviser); and Vice President, PowerShares Exchange-Traded Fund Trust, PowerShares Exchange-Traded Fund Trust II, PowerShares India Exchange-Traded Fund Trust, PowerShares Actively Managed Exchange-Traded Fund Trust, PowerShares Actively Managed Exchange-Traded Commodity Fund Trust and PowerShares Exchange-Traded Self-Indexed Fund Trust Formerly: Vice President and Principal Financial Officer, The Invesco Funds; Vice President, Invesco Aim Advisers, Inc., Invesco Aim Capital Management, Inc. and Invesco Aim Private Asset Management, Inc.; Assistant Vice President and Assistant Treasurer, The Invesco Funds and Assistant Vice President, Invesco Advisers, Inc., Invesco Aim Capital Management, Inc. and Invesco Aim Private Asset Management, Inc.; and Treasurer, PowerShares Exchange-Traded Fund Trust, PowerShares Exchange-Traded Fund Trust II, PowerShares India Exchange-Traded Fund Trust and PowerShares Actively Managed Exchange-Traded Fund Trust | | N/A | | N/A |
Russell C. Burk — 1958 Senior Vice President and Senior Officer | | 2005 | | Senior Vice President and Senior Officer, The Invesco Funds | | N/A | | N/A |
John M. Zerr — 1962 Senior Vice President, Chief Legal Officer and Secretary | | 2006 | | Director, Senior Vice President, Secretary and General Counsel, Invesco Management Group, Inc. (formerly known as Invesco AIM Management Group, Inc.); Senior Vice President, Invesco Advisers, Inc. (formerly known as Invesco Institutional (N.A.), Inc.) (registered investment adviser); Senior Vice President and Secretary, Invesco Distributors, Inc. (formerly known as Invesco AIM Distributors, Inc.); Director, Vice President and Secretary, Invesco Investment Services, Inc. (formerly known as Invesco AIM Investment Services, Inc.) Senior Vice President, Chief Legal Officer and Secretary, The Invesco Funds; Managing Director, Invesco PowerShares Capital Management LLC; Director, Secretary and General Counsel, Invesco Investment Advisers LLC (formerly known as Van Kampen Asset Management); Secretary and General Counsel, Invesco Capital Markets, Inc. (formerly known as Van Kampen Funds Inc.) and Chief Legal Officer, PowerShares Exchange-Traded Fund Trust, PowerShares Exchange-Traded Fund Trust II, PowerShares India Exchange-Traded Fund Trust, PowerShares Actively Managed Exchange-Traded Fund Trust, PowerShares Actively Managed Exchange-Traded Commodity Fund Trust and PowerShares Exchange-Traded Self-Indexed Fund Trust; Manager and Secretary, Invesco Indexing LLC Formerly: Director, Secretary, General Counsel and Senior Vice President, Van Kampen Exchange Corp.; Director, Vice President and Secretary, IVZ Distributors, Inc. (formerly known as INVESCO Distributors, Inc.); Director and Vice President, INVESCO Funds Group, Inc.; Director and Vice President, Van Kampen Advisors Inc.; Director, Vice President, Secretary and General Counsel, Van Kampen Investor Services Inc.; Director, Invesco Distributors, Inc. (formerly known as Invesco AIM Distributors, Inc.); Director, Senior Vice President, General Counsel and Secretary, Invesco AIM Advisers, Inc. and Van Kampen Investments Inc.; Director, Vice President and Secretary, Fund Management Company; Director, Senior Vice President, Secretary, General Counsel and Vice President, Invesco AIM Capital Management, Inc.; Chief Operating Officer and General Counsel, Liberty Ridge Capital, Inc. (an investment adviser); Vice President and Secretary, PBHG Funds (an investment company) and PBHG Insurance Series Fund (an investment company); Chief Operating Officer, General Counsel and Secretary, Old Mutual Investment Partners (a broker-dealer); General Counsel and Secretary, Old Mutual Fund Services (an administrator) and Old Mutual Shareholder Services (a shareholder servicing center); Executive Vice President, General Counsel and Secretary, Old Mutual Capital, Inc. (an investment adviser); and Vice President and Secretary, Old Mutual Advisors Funds (an investment company) | | N/A | | N/A |
Gregory G. McGreevey — 1962 Senior Vice President | | 2012 | | Senior Managing Director, Invesco Ltd.; Director, Chairman, President, and Chief Executive Officer, Invesco Advisers, Inc. (formerly known as Invesco Institutional (N.A.), Inc.) (registered investment adviser); Senior Vice President, Invesco Management Group, Inc.; Director, Invesco Mortgage Capital, Inc. and Invesco Senior Secured Management, Inc.; and Senior Vice President, The Invesco Funds Formerly: Assistant Vice President, The Invesco Funds | | N/A | | N/A |
Kelli Gallegos — 1970 Vice President, Principal Financial Officer and Assistant Treasurer | | 2008 | | Vice President, Principal Financial Officer and Assistant Treasurer, The Invesco Funds; Assistant Treasurer, Invesco PowerShares Capital Management LLC, PowerShares Exchange-Traded Fund Trust, PowerShares Exchange-Traded Fund Trust II, PowerShares India Exchange-Traded Fund Trust, PowerShares Actively Managed Exchange-Traded Fund Trust, PowerShares Actively Managed Exchange-Traded Commodity Fund Trust and PowerShares Exchange-Traded Self-Indexed Fund Trust Formerly: Assistant Vice President, The Invesco Funds | | N/A | | N/A |
Invesco V.I. Government Securities Fund
Trustees and Officers—(continued)
| | | | | | | | |
Name, Year of Birth and
Position(s) Held with the Trust | | Trustee and/
or Officer Since | | Principal Occupation(s)
During Past 5 Years | | Number of
Funds in Fund
Complex
Overseen by
Trustee | | Other Directorship(s)
Held by Trustee During
Past 5 Years |
| Other Officers—(continued) | | | | | | | | |
Tracy Sullivan — 1962 Vice President, Chief Tax Officer and Assistant Treasurer | | 2008 | | Vice President, Chief Tax Officer and Assistant Treasurer, The Invesco Funds; Assistant Treasurer, Invesco PowerShares Capital Management LLC, PowerShares Exchange-Traded Fund Trust, PowerShares Exchange-Traded Fund Trust II, PowerShares India Exchange-Traded Fund Trust, PowerShares Actively Managed Exchange-Traded Fund Trust, PowerShares Actively Managed Exchange-Traded Commodity Fund Trust and PowerShares Exchange-Traded Self-Indexed Fund Trust Formerly: Assistant Vice President, The Invesco Funds | | N/A | | N/A |
Crissie M. Wisdom — 1969 Anti-Money Laundering Compliance Officer | | 2013 | | Anti-Money Laundering Compliance Officer, Invesco Advisers, Inc. (formerly known as Invesco Institutional (N.A.), Inc.) (registered investment adviser), Invesco Capital Markets, Inc. (formerly known as Van Kampen Funds Inc.), Invesco Distributors, Inc., Invesco Investment Services, Inc., Invesco Management Group, Inc., The Invesco Funds, and PowerShares Exchange-Traded Fund Trust, PowerShares Exchange-Traded Fund Trust II, PowerShares India Exchange-Traded Fund Trust, PowerShares Actively Managed Exchange-Traded Fund Trust, PowerShares Actively Managed Exchange-Traded Commodity Fund Trust and PowerShares Exchange-Traded Self-Indexed Fund Trust; Anti-Money Laundering Compliance Officer and Bank Secrecy Act Officer, INVESCO National Trust Company and Invesco Trust Company; and Fraud Prevention Manager and Controls and Risk Analysis Manager for Invesco Investment Services, Inc. Formerly: Anti-Money Laundering Compliance Officer, Van Kampen Exchange Corp. | | N/A | | N/A |
Robert R. Leveille — 1969 Chief Compliance Officer | | 2016 | | Chief Compliance Officer, Invesco Advisers, Inc. (registered investment adviser); and Chief Compliance Officer, The Invesco Funds Formerly: Chief Compliance Officer, Putnam Investments and the Putnam Funds | | N/A | | N/A |
The Statement of Additional Information of the Trust includes additional information about the Fund’s Trustees and is available upon request, without charge, by calling 1.800.959.4246. Please refer to the Fund’s Statement of Additional Information for information on the Fund’s sub-advisers.
| | | | | | |
Office of the Fund 11 Greenway Plaza, Suite 1000 Houston, TX 77046-1173 | | Investment Adviser Invesco Advisers, Inc. 1555 Peachtree Street, N.E. Atlanta, GA 30309 | | Distributor Invesco Distributors, Inc. 11 Greenway Plaza, Suite 1000 Houston, TX 77046-1173 | | Auditors PricewaterhouseCoopers LLP 1000 Louisiana Street, Suite 5800 Houston, TX 77002-5678 |
| | | |
| | | | | | |
Counsel to the Fund Stradley Ronon Stevens & Young, LLP 2005 Market Street, Suite 2600 Philadelphia, PA 19103-7018 | | Counsel to the Independent Trustees Goodwin Procter LLP 901 New York Avenue, N.W. Washington, D.C. 20001 | | Transfer Agent Invesco Investment Services, Inc. 11 Greenway Plaza, Suite 1000 Houston, TX 77046-1173 | | Custodian State Street Bank and Trust Company 225 Franklin Street Boston, MA 02110-2801 |
Invesco V.I. Government Securities Fund
| | | | |
| | |
 | | Annual Report to Shareholders | | December 31, 2017 |
| | |
| | Invesco V.I. Growth and Income Fund |

| | |
| | The Fund provides a complete list of its holdings four times in each fiscal year, at the quarter-ends. For the second and fourth quarters, the lists appear in the Fund’s semiannual and annual reports to shareholders. For the first and third quarters, the Fund files the lists with the Securities and Exchange Commission (SEC) on Form N-Q. The Fund’s Form N-Q filings are available on the SEC website, sec.gov. Copies of the Fund’s Forms N-Q may be reviewed and copied at the SEC Public Reference Room in Washington, D.C. You can obtain information on the operation of the Public Reference Room, including information about duplicating fee charges, by calling 202 551 8090 or 800 732 0330, or by electronic request at the following email address: publicinfo@sec.gov. The SEC file numbers for the Fund are 811-07452 and 033-57340. The Fund’s most recent portfolio holdings, as filed on Form N-Q, have also been made available to insurance companies issuing variable annuity contracts and variable life insurance policies (“variable products”) that invest in the Fund. A description of the policies and procedures that the Fund uses to determine how to vote proxies relating to portfolio securities is available without charge, upon request, from our Client Services department at 800 959 4246 or at invesco.com/proxyguidelines. The information is also available on the SEC website, sec.gov. Information regarding how the Fund voted proxies related to its portfolio securities during the most recent 12-month period ended June 30 is available at invesco.com/ proxysearch. The information is also available on the SEC website, sec.gov. Invesco Advisers, Inc. is an investment adviser; it provides investment advisory services to individual and institutional clients and does not sell securities. Invesco Distributors, Inc. is the US distributor for Invesco Ltd.’s retail mutual funds, exchange-traded funds and institutional money market funds. Both are wholly owned, indirect subsidiaries of Invesco Ltd. This report must be accompanied or preceded by a currently effective Fund prospectus and variable product prospectus, which contain more complete information, including sales charges and expenses. Investors should read each carefully before investing. NOT FDIC INSURED | MAY LOSE VALUE | NO BANK GUARANTEE |
| |
| | Invesco Distributors, Inc. VK-VIGRI-AR-1 02132018 1136 |
Management’s Discussion of Fund Performance
Performance summary
For the year ended December 31, 2017, Series I shares of Invesco V.I. Growth and Income Fund (the Fund) outperformed the Russell 1000 Value Index, the Fund’s style-specific benchmark.
Your Fund’s long-term performance appears later in this report.
Fund vs. Indexes
Total returns, 12/31/16 to 12/31/17, excluding variable product issuer charges.
If variable product issuer charges were included, returns would be lower.
| | | | | |
| Series I Shares | | | | 14.32 | % |
| Series II Shares | | | | 14.04 | |
| S&P 500 Index▼ (Broad Market Index) | | | | 21.83 | |
| Russell 1000 Value Index▼ (Style-Specific Index) | | | | 13.66 | |
| Lipper VUF Large-Cap Value Funds Index∎ (Peer Group Index) | | | | 14.65 | |
Source(s): ▼FactSet Research Systems Inc.; ∎Lipper Inc. | | | | | |
Market conditions and your Fund
Despite highly destructive hurricanes that threatened to derail a years-long economic recovery, the US economy continued to expand throughout the year ended December 31, 2017. Gross domestic product – the value of all goods and services produced in the US – expanded in the first three quarters of 2017. Inflation remained subdued even as unemployment continued its multiyear decline.
Given signs of an improving economy, the US Federal Reserve (the Fed) raised interest rates three times during the reporting period, most recently in December 2017; each rate hike was 25 basis points. (A basis point is 0.01%.) The Fed pledged that “realized and expected economic conditions relative to its objectives of maximum employment and 2 percent inflation” will guide its future actions. At the close of the reporting period, Fed policy remained accommodative, and the fed funds target rate stood at a range of 1.25% to 1.50%.1
Higher inventories and a worsening outlook caused oil prices and many
energy stocks to decline during the first half of 2017. However, oil prices rose significantly in the second half of the reporting period as expectations for lower supplies increased, partly due to continued OPEC production cuts, and demand began normalizing.
Major US stock market indexes repeatedly hit all-time highs throughout the reporting period. The stock market rally that began after the 2016 presidential election continued throughout the reporting period, fueled by generally positive economic data, strong corporate earnings and improved consumer confidence. Finally, after much debate in Congress, a tax reform bill was signed into law in December 2017. While its enactment further strengthened stocks, its effect on the US economy remained uncertain.
For the reporting period as a whole, financials, consumer discretionary and telecommunication services were the strongest-performing sectors for the Fund, while consumer staples and materials were the weakest-performing sectors for the Fund, relative to the Russell 1000 Value Index.
The financials sector was the largest contributor to the Fund’s performance versus its style-specific benchmark due to strong stock selection in and overweight exposure to the sector. Specifically, Citigroup, Bank of America and Morgan Stanley were the Fund’s top contributors. These companies benefited from investor optimism about future interest rates, an improving economy and lower corporate tax rates. Financials also benefited when the Fed’s Comprehensive Capital Analysis and Review was better than expected, providing a favorable view of the financial strength of US banks and their ability to return capital to their shareholders.
Stock selection in the consumer discretionary sector also benefited the Fund’s performance relative to the Fund’s style-specific benchmark. Carnival was a key contributor in this sector. The stock performed well and posted returns of over 30% for the reporting period, leading the cruise operator to raise its outlook after reporting better pricing and strong forward-booking volumes for 2017. Michael Kors also contributed to the Fund’s relative results. Mid-year, the company reported better-than-expected results and a better revenue outlook due to fewer promotions and increased sales within its high-end product lines.
Stock selection in the telecommunication services sector, as well as underweight exposure relative to the style-specific benchmark, contributed to relative Fund performance. The Fund’s lack of exposure to some of the weaker names in the sector, namely AT&T, helped on a relative basis, as the sector posted negative returns for the reporting period. Similarly, the Fund’s lack of exposure to the real estate sector contributed to relative returns. The Fund remained materially
| | | | | |
| Portfolio Composition |
By sector | % of total net assets |
| | |
| |
| Financials | | 34.7% |
| Energy | | 15.5 |
| Health Care | | 11.2 |
| Information Technology | | 11.2 |
| Consumer Discretionary | | 8.1 |
| Consumer Staples | | 6.2 |
| Industrials | | 5.5 |
| Materials | | 2.4 |
| Telecommunications Services | | 1.7 |
| Utilities | | 0.4 |
Money Market Funds Plus Other Assets Less Liabilities | | 3.1 |
| | |
| Top 10 Equity Holdings* |
% of total net assets |
| |
| 1. Citigroup Inc. | | 5.7% |
2. Bank of America Corp. | | 4.6 |
3. JPMorgan Chase & Co. | | 3.8 |
4. Morgan Stanley | | 3.0 |
5. Citizens Financial Group, Inc. | | 2.6 |
6. Royal Dutch Shell PLC-Class A | | 2.4 |
7. Occidental Petroleum Corp. | | 2.3 |
8. Oracle Corp. | | 2.2 |
9. Devon Energy Corp. | | 2.0 |
10. General Motors Co. | | 1.9 |
| | |
| Total Net Assets | | $2.0 billion |
| |
| Total Number of Holdings* | | 67 |
The Fund’s holdings are subject to change, and there is no assurance that the Fund will continue to hold any particular security.
*Excluding money market fund holdings.
Data presented here are as of December 31, 2017.
Invesco V.I. Growth and Income Fund
underweight in these sectors because we believe they were overvalued, as investors have driven up stock prices in a quest for yield in a low-interest rate environment.
Stock selection within the industrials sector contributed to the Fund’s performance relative to its style-specific benchmark. CSX, a rail-based transportation services firm, was one of the top contributors as the stock posted a return of over 50% for the year. Early in 2017, the company announced the arrival of Hunter Harrison, a highly respected chief executive officer (CEO) within the industry, and the stock rallied on investors’ expectations of improved profitability. Mr. Harrison passed away in December; however, the company quickly appointed a new experienced CEO with a history of working with Mr. Harrison for many years. Material underweight exposure to General Electric was also a driver of relative Fund performance as the stock posted negative returns for the year. We sold our position in the company during the reporting period.
Stock selection within the consumer staples sector was a large detractor from relative Fund performance for the reporting period. Specifically, Walgreens Boots Alliance posted negative returns for the year after rumors emerged that Amazon (not a Fund holding) may be entering the pharmacy space, driving investor concerns.
Stock selection in the materials sector also detracted from the Fund’s performance versus the style-specific benchmark. Within the sector, the largest detractor was The Mosaic Company, a phosphate and potash supplier. During the first half of 2017, the stock price fell after the company reported that sales and profits were down sharply year over year. Operating earnings were down due to lower phosphate and potash prices caused by excessive supply.
The Fund’s underweight allocation to the utilities sector also detracted from performance relative to the style-specific benchmark. The Fund remained materially underweight in this sector because we believed it to be overvalued.
We used currency forward contracts for the purpose of hedging currency exposure of non-US-based companies held in the portfolio. Currency forward contracts were used solely for the purpose of hedging and not for speculative purposes or leverage. The use of currency forward contracts had a negative impact on the Fund’s performance, largely due to the weakness of the US dollar compared to the foreign currencies in which the Fund’s non-US holdings were denominated.
At the end of the reporting period, the Fund’s largest overweight exposures relative to the style-specific benchmark were in the financials and energy sectors, while the largest underweight exposures were in the real estate and utilities sectors.
Thank you for your investment in Invesco V.I. Growth and Income Fund and for sharing our long-term investment horizon.
| 1 | Source: US Federal Reserve |
The views and opinions expressed in management’s discussion of Fund performance are those of Invesco Advisers, Inc. These views and opinions are subject to change at any time based on factors such as market and economic conditions. These views and opinions may not be relied upon as investment advice or recommendations, or as an offer for a particular security. The information is not a complete analysis of every aspect of any market, country, industry, security or the Fund. Statements of fact are from sources considered reliable, but Invesco Advisers, Inc. makes no representation or warranty as to their completeness or accuracy. Although historical performance is no guarantee of future results, these insights may help you understand our investment management philosophy.
See important Fund and, if applicable, index disclosures later in this report.
| | |
 | | Thomas Bastian Chartered Financial Analyst, Portfolio Manager, is lead manager of Invesco V.I. Growth and Income |
| Fund. He joined Invesco in 2010. Mr. Bastian earned a BA in accounting from St. John’s University and an MBA in finance from the University of Michigan. |
| | |
 | | Brian Jurkash Portfolio Manager, is manager of Invesco V.I. Growth and Income Fund. He joined Invesco in 2000. Mr. Jurkash |
| earned a BBA degree in finance from Stephen F. Austin State University and an MBA in finance from the University of Houston. |
| | |
 | | Sergio Marcheli Portfolio Manager, is manager of Invesco V.I. Growth and Income Fund. He joined Invesco in 2010. Mr. Marcheli |
| earned a BBA from the University of Houston and an MBA from the University of St. Thomas. |
| | |
 | | Matthew Titus Chartered Financial Analyst, Portfolio Manager, is manager of Invesco V.I. Growth and Income Fund. He joined |
| Invesco in 2016. Mr. Titus earned a bachelor’s degree in accounting and economics from Luther College in Decorah, Iowa, and an MBA from Ohio State University. |
Invesco V.I. Growth and Income Fund
Your Fund’s Long-Term Performance
Results of a $10,000 Investment – Oldest Share Class(es)
Fund and index data from 12/31/07
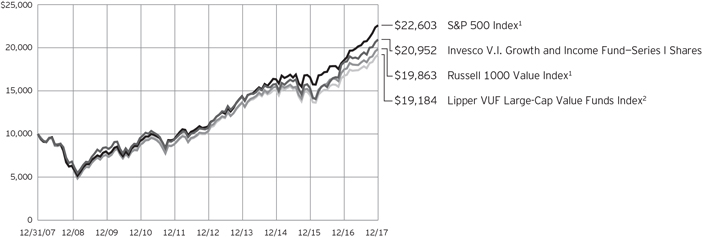
| 1 | Source: FactSet Research Systems Inc. |
Past performance cannot guarantee
comparable future results.
| | | | | |
| Average Annual Total Returns |
As of 12/31/17 | | | | | |
| |
| Series I Shares | | | | | |
| Inception (12/23/96) | | | | 9.29 | % |
| 10 Years | | | | 7.68 | |
| 5 Years | | | | 14.42 | |
| 1 Year | | | | 14.32 | |
| |
| Series II Shares | | | | | |
| Inception (9/18/00) | | | | 7.09 | % |
| 10 Years | | | | 7.41 | |
| 5 Years | | | | 14.14 | |
| 1 Year | | | | 14.04 | |
Effective June 1, 2010, Class I and Class II shares of the predecessor fund, Van Kampen Life Investment Trust Growth and Income Portfolio, advised by Van Kampen Asset Management were reorganized into Series I and Series II shares, respectively, of Invesco Van Kampen V.I. Growth and Income Fund (renamed Invesco V.I. Growth and Income Fund on April 29, 2013). Returns shown above, prior to June 1, 2010, for Series I and Series II shares are blended returns of the predecessor fund and Invesco V.I. Growth and Income Fund. Share class returns will differ from the predecessor fund because of different expenses.
The performance data quoted represent past performance and cannot guarantee comparable future
results; current performance may be lower or higher. Please contact your variable product issuer or financial adviser for the most recent month-end variable product performance. Performance figures reflect Fund expenses, reinvested distributions and changes in net asset value. Investment return and principal value will fluctuate so that you may have a gain or loss when you sell shares.
The net annual Fund operating expense ratio set forth in the most recent Fund prospectus as of the date of this report for Series I and Series II shares was 0.78% and 1.03%, respectively.1,2 The total annual Fund operating expense ratio set forth in the most recent Fund prospectus as of the date of this report for Series I and Series II shares was 0.80% and 1.05%, respectively. The expense ratios presented above may vary from the expense ratios presented in other sections of this report that are based on expenses incurred during the period covered by this report.
Invesco V.I. Growth and Income Fund, a series portfolio of AIM Variable Insurance Funds (Invesco Variable Insurance Funds), is currently offered through insurance companies issuing variable products. You cannot purchase shares of the Fund directly.
Performance figures given represent the Fund and are not intended to reflect actual variable product values. They do not reflect sales charges, expenses and fees assessed in connection with a variable product. Sales charges, expenses and fees, which are determined by the variable product issuers, will vary and will lower the total return.
The most recent month-end performance at the Fund level, excluding variable product charges, is available at 800 451 4246. As mentioned above, for the most recent month-end performance including variable product charges, please contact your variable product issuer or financial adviser.
Fund performance reflects any applicable fee waivers and/or expense reimbursements. Had the adviser not waived fees and/or reimbursed expenses currently or in the past, returns would have been lower. See current prospectus for more information.
| 1 | Total annual Fund operating expenses after any contractual fee waivers and/or expense reimbursements by the adviser in effect through at least April 30, 2019. See current prospectus for more information. |
| 2 | Total annual Fund operating expenses after any contractual fee waivers and/or expense reimbursements by the adviser in effect through at least June 30, 2019. See current prospectus for more information. |
Invesco V.I. Growth and Income Fund
Invesco V.I. Growth and Income Fund’s investment objective is to seek long-term growth of capital and income.
| ∎ | | Unless otherwise stated, information presented in this report is as of December 31, 2017, and is based on total net assets. |
| ∎ | | Unless otherwise noted, all data provided by Invesco. |
Principal risks of investing in the Fund
Convertible securities risk. The market values of convertible securities are affected by market interest rates, the risk of actual issuer default on interest or principal payments and the value of the underlying common stock into which the convertible security may be converted. Additionally, a convertible security is subject to the same types of market and issuer risks as apply to the underlying common stock. In addition, certain convertible securities are subject to involuntary conversions and may undergo principal write-downs upon the occurrence of certain triggering events, and, as a result, are subject to an increased risk of loss. Convertible securities may be rated below investment grade.
Depositary receipts risk. Investing in depositary receipts involves the same risks as direct investments in foreign securities. In addition, the underlying issuers of certain depositary receipts are under no obligation to distribute shareholder communications or pass through any voting rights with respect to the deposited securities to the holders of such receipts. The Fund may therefore receive less timely information or have less control than if it invested directly in the foreign issuer.
Derivatives risk. The value of a derivative instrument depends largely on (and is derived from) the value of an underlying security, currency, commodity, interest rate, index or other asset (each referred to as an underlying asset). In addition to risks relating to the underlying assets, the use of derivatives may include other, possibly greater, risks, including counterparty, leverage and liquidity risks. Counterparty risk is the risk that the counterparty to the derivative contract will default on its obligation to pay the Fund the amount owed or otherwise perform under the derivative contract. Derivatives create leverage risk because they do not require payment up front equal to the economic exposure created by owning the derivative. As a result, an adverse change in the value of the underlying asset could result in the Fund sustaining a loss that is substantially greater than the amount invested in the derivative, which may make the Fund’s returns more volatile and increase the
risk of loss. Derivative instruments may also be less liquid than more traditional investments and the Fund may be unable to sell or close out its derivative positions at a desirable time or price. This risk may be more acute under adverse market conditions, during which the Fund may be most in need of liquidating its derivative positions. Derivatives may also be harder to value, less tax efficient and subject to changing government regulation that could impact the Fund’s ability to use certain derivatives or their cost. Also, derivatives used for hedging or to gain or limit exposure to a particular market segment may not provide the expected benefits, particularly during adverse market conditions.
Foreign securities risk. The Fund’s foreign investments may be adversely affected by political and social instability, changes in economic or taxation policies, difficulty in enforcing obligations, decreased liquidity or increased volatility. Foreign investments also involve the risk of the possible seizure, nationalization or expropriation of the issuer or foreign deposits (in which the Fund could lose its entire investments in a certain market) and the possible adoption of foreign governmental restrictions such as exchange controls. Unless the Fund has hedged its foreign securities risk, foreign securities risk also involves the risk of negative foreign currency rate fluctuations, which may cause the value of securities denominated in such foreign currency (or other instruments through which the Fund has exposure to foreign currencies) to decline in value. Currency exchange rates may fluctuate significantly over short periods of time. Currency hedging strategies, if used, are not always successful.
Management risk. The Fund is actively managed and depends heavily on the Adviser’s judgment about markets, interest rates or the attractiveness, relative values, liquidity, or potential appreciation of particular investments made for the Fund’s portfolio. The Fund could experience losses if these judgments prove to be incorrect. Additionally, legislative, regulatory, or tax developments may adversely affect management of the Fund and, therefore, the ability of the Fund to achieve its investment objective.
Market risk. The market values of the Fund’s investments, and therefore the value of the Fund’s shares, will go up and down, sometimes rapidly or unpredictably. Market risk may affect a single issuer, industry or section of the economy, or it may affect the market as a whole. Individual stock prices tend to go up and down more dramatically than those of certain other types of investments, such as bonds. During a general downturn in the financial markets, multiple asset classes may decline in value. When markets perform well, there can be no assurance that specific investments held by the Fund will rise in value.
Real estate investment trust risk/real estate risk. Investments in real estate related instruments may be affected by economic, legal, cultural, environmental or technological factors that affect property values, rents or occupancies of real estate related to the Fund’s holdings. Shares of real estate related companies, which tend to be small- and mid-cap companies, may be more volatile and less liquid.
Sector focus risk. The Fund may from time to time invest a significant amount of its assets (i.e. over 25%) in one market sector or group of related industries. In this event, the Fund’s performance will depend to a greater extent on the overall condition of the sector or group of industries and there is increased risk that the Fund will lose significant value if conditions adversely affect that sector or group of industries.
Small- and mid-capitalization companies risks. Small- and mid-capitalization companies tend to be more vulnerable to changing market conditions, may have little or no operating history or track record of success, and may have more limited product lines and markets, less experienced management and fewer financial resources than larger companies. These companies’ securities may be more volatile and less liquid than those of more established companies, and their returns may vary, sometimes significantly, from the overall securities market.
Value investing style risk. A value investing style subjects the Fund to the risk that the valuations never improve or that the returns on value equity securities are less than returns on other styles of investing or the overall stock market.
Invesco V.I. Growth and Income Fund
About indexes used in this report
The S&P 500® Index is an unmanaged index considered representative of the US stock market.
The Russell 1000® Value Index is an unmanaged index considered representative of large-cap value stocks. The Russell 1000 Value Index is a trademark/service mark of the Frank Russell Co. Russell® is a trademark of the Frank Russell Co.
The Lipper VUF Large-Cap Value Funds Index is an unmanaged index considered representative of large-cap value variable insurance underlying funds tracked by Lipper.
The Fund is not managed to track the performance of any particular index, including the index(es) described here, and consequently, the performance of the Fund may deviate significantly from the performance of the index(es).
A direct investment cannot be made in an index. Unless otherwise indicated, index results include reinvested dividends, and they do not reflect sales charges. Performance of the peer group, if applicable, reflects fund expenses; performance of a market index does not.
Other information
The returns shown in management’s discussion of Fund performance are based on net asset values calculated for shareholder transactions. Generally accepted accounting principles require adjustments to be made to the net assets of the Fund at period end for financial reporting purposes, and as such, the net asset values for shareholder transactions and the returns based on those net asset values may differ from the net asset values and returns reported in the Financial Highlights. Additionally, the returns and net asset values shown throughout this report are at the Fund level only and do not include variable product issuer charges. If such charges were included, the total returns would be lower.
Industry classifications used in this report are generally according to the Global Industry Classification Standard, which was developed by and is the exclusive property and a service mark of MSCI Inc. and Standard & Poor’s.
Invesco V.I. Growth and Income Fund
Schedule of Investments(a)
December 31, 2017
| | | | | | | | |
| | | Shares | | | Value | |
Common Stocks & Other Equity Interests–96.87% | |
| Aerospace & Defense–1.57% | |
General Dynamics Corp. | | | 155,191 | | | $ | 31,573,609 | |
|
| Apparel, Accessories & Luxury Goods–0.74% | |
Michael Kors Holdings Ltd.(b) | | | 235,421 | | | | 14,819,752 | |
|
| Asset Management & Custody Banks–2.59% | |
Northern Trust Corp. | | | 223,357 | | | | 22,311,131 | |
State Street Corp. | | | 305,003 | | | | 29,771,343 | |
| | | | | | | | 52,082,474 | |
|
| Automobile Manufacturers–1.92% | |
General Motors Co. | | | 941,222 | | | | 38,580,690 | |
|
| Biotechnology–0.71% | |
Amgen Inc. | | | 81,735 | | | | 14,213,716 | |
|
| Broadcasting–0.27% | |
CBS Corp.–Class B | | | 90,652 | | | | 5,348,468 | |
|
| Building Products–1.06% | |
Johnson Controls International PLC | | | 557,700 | | | | 21,253,947 | |
|
| Cable & Satellite–2.15% | |
Charter Communications, Inc.–Class A(b) | | | 51,101 | | | | 17,167,892 | |
Comcast Corp.–Class A | | | 652,082 | | | | 26,115,884 | |
| | | | | | | | 43,283,776 | |
|
| Communications Equipment–2.89% | |
Cisco Systems, Inc. | | | 962,866 | | | | 36,877,768 | |
Juniper Networks, Inc. | | | 744,700 | | | | 21,223,950 | |
| | | | | | | | 58,101,718 | |
|
| Data Processing & Outsourced Services–0.67% | |
PayPal Holdings, Inc.(b) | | | 183,904 | | | | 13,539,012 | |
|
| Diversified Banks–14.05% | |
Bank of America Corp. | | | 3,124,918 | | | | 92,247,579 | |
Citigroup Inc. | | | 1,525,663 | | | | 113,524,584 | |
JPMorgan Chase & Co. | | | 717,012 | | | | 76,677,263 | |
| | | | | | | | 282,449,426 | |
|
| Diversified Metals & Mining–0.81% | |
BHP Billiton Ltd. (Australia) | | | 704,401 | | | | 16,213,045 | |
|
| Drug Retail–3.37% | |
CVS Health Corp. | | | 479,079 | | | | 34,733,228 | |
Walgreens Boots Alliance, Inc. | | | 454,210 | | | | 32,984,730 | |
| | | | | | | | 67,717,958 | |
|
| Electric Utilities–0.40% | |
FirstEnergy Corp. | | | 264,075 | | | | 8,085,976 | |
|
| Fertilizers & Agricultural Chemicals–1.59% | |
Agrium Inc. (Canada) | | | 135,866 | | | | 15,624,590 | |
Mosaic Co. (The) | | | 634,426 | | | | 16,279,371 | |
| | | | | | | | 31,903,961 | |
| | | | | | | | |
| | | Shares | | | Value | |
| Health Care Distributors–1.25% | |
McKesson Corp. | | | 160,946 | | | $ | 25,099,529 | |
|
| Health Care Equipment–2.22% | |
Baxter International Inc. | | | 291,309 | | | | 18,830,214 | |
Medtronic PLC | | | 319,059 | | | | 25,764,014 | |
| | | | | | | | 44,594,228 | |
|
| Home Improvement Retail–1.17% | |
Kingfisher PLC (United Kingdom) | | | 5,179,601 | | | | 23,615,291 | |
|
| Hotels, Resorts & Cruise Lines–1.83% | |
Carnival Corp. | | | 554,569 | | | | 36,806,745 | |
|
| Industrial Machinery–1.23% | |
Ingersoll-Rand PLC | | | 276,860 | | | | 24,693,143 | |
|
| Insurance Brokers–2.74% | |
Aon PLC | | | 178,066 | | | | 23,860,844 | |
Marsh & McLennan Cos., Inc. | | | 163,444 | | | | 13,302,707 | |
Willis Towers Watson PLC | | | 118,908 | | | | 17,918,247 | |
| | | | | | | | 55,081,798 | |
|
| Integrated Oil & Gas–5.79% | |
Occidental Petroleum Corp. | | | 615,859 | | | | 45,364,174 | |
Royal Dutch Shell PLC–Class A (United Kingdom) | | | 1,429,321 | | | | 47,857,212 | |
TOTAL S.A. (France) | | | 420,941 | | | | 23,224,589 | |
| | | | | | | | 116,445,975 | |
|
| Integrated Telecommunication Services–0.96% | |
Orange S.A. (France) | | | 264,144 | | | | 4,583,467 | |
Verizon Communications Inc. | | | 277,464 | | | | 14,686,169 | |
| | | | | | | | 19,269,636 | |
|
| Internet Software & Services–1.38% | |
eBay Inc.(b) | | | 734,668 | | | | 27,726,370 | |
|
| Investment Banking & Brokerage–5.36% | |
Charles Schwab Corp. (The) | | | 400,936 | | | | 20,596,082 | |
Goldman Sachs Group, Inc. (The) | | | 102,810 | | | | 26,191,876 | |
Morgan Stanley | | | 1,162,017 | | | | 60,971,032 | |
| | | | | | | | 107,758,990 | |
|
| IT Consulting & Other Services–1.36% | |
Cognizant Technology Solutions
Corp.–Class A | | | 385,009 | | | | 27,343,339 | |
|
| Managed Health Care–1.01% | |
Anthem, Inc. | | | 90,431 | | | | 20,347,879 | |
|
| Multi-Line Insurance–1.50% | |
American International Group, Inc. | | | 504,944 | | | | 30,084,564 | |
|
| Oil & Gas Equipment & Services–2.55% | |
Baker Hughes, a GE Co. | | | 527,644 | | | | 16,694,656 | |
TechnipFMC PLC (United Kingdom) | | | 1,105,894 | | | | 34,625,541 | |
| | | | | | | | 51,320,197 | |
See accompanying Notes to Financial Statements which are an integral part of the financial statements.
Invesco V.I. Growth and Income Fund
| | | | | | | | |
| | | Shares | | | Value | |
| Oil & Gas Exploration & Production–7.14% | |
Anadarko Petroleum Corp. | | | 527,549 | | | $ | 28,297,728 | |
Apache Corp. | | | 909,495 | | | | 38,398,879 | |
Canadian Natural Resources Ltd. (Canada) | | | 1,056,381 | | | | 37,753,707 | |
Devon Energy Corp. | | | 946,746 | | | | 39,195,285 | |
| | | | | | | | 143,645,599 | |
|
| Other Diversified Financial Services–0.82% | |
Voya Financial, Inc. | | | 333,108 | | | | 16,478,853 | |
|
| Packaged Foods & Meats–1.20% | |
Mondelez International, Inc.–Class A | | | 562,215 | | | | 24,062,802 | |
|
| Pharmaceuticals–6.01% | |
Bristol-Myers Squibb Co. | | | 258,528 | | | | 15,842,596 | |
Merck & Co., Inc. | | | 454,032 | | | | 25,548,381 | |
Novartis AG (Switzerland) | | | 306,846 | | | | 25,951,053 | |
Pfizer Inc. | | | 984,152 | | | | 35,645,985 | |
Sanofi (France) | | | 208,494 | | | | 17,951,339 | |
| | | | | | | | 120,939,354 | |
|
| Railroads–1.60% | |
CSX Corp. | | | 585,581 | | | | 32,212,811 | |
|
| Regional Banks–7.60% | |
Citizens Financial Group, Inc. | | | 1,251,755 | | | | 52,548,675 | |
Comerica Inc. | | | 174,271 | | | | 15,128,466 | |
Fifth Third Bancorp | | | 1,090,670 | | | | 33,090,928 | |
First Horizon National Corp. | | | 818,762 | | | | 16,367,052 | |
PNC Financial Services Group, Inc. (The) | | | 246,580 | | | | 35,579,028 | |
| | | | | | | | 152,714,149 | |
| | | | | | | | |
| | | Shares | | | Value | |
| Semiconductors–2.72% | |
Intel Corp. | | | 566,719 | | | $ | 26,159,749 | |
QUALCOMM Inc. | | | 445,212 | | | | 28,502,472 | |
| | | | | | | | 54,662,221 | |
|
| Systems Software–2.21% | |
Oracle Corp. | | | 940,971 | | | | 44,489,109 | |
|
| Tobacco–1.69% | |
Philip Morris International Inc. | | | 320,931 | | | | 33,906,360 | |
|
| Wireless Telecommunication Services–0.74% | |
Vodafone Group PLC–ADR (United Kingdom) | | | 468,632 | | | | 14,949,361 | |
Total Common Stocks & Other Equity Interests
(Cost $1,525,369,684) | | | | 1,947,415,831 | |
|
Money Market Funds–3.34% | |
Invesco Government & Agency Portfolio–Institutional Class,
1.18%(c) | | | 23,536,346 | | | | 23,536,346 | |
Invesco Liquid Assets Portfolio–Institutional Class, 1.40% (c) | | | 16,808,622 | | | | 16,810,303 | |
Invesco Treasury Portfolio–Institutional Class, 1.17%(c) | | | 26,898,682 | | | | 26,898,682 | |
Total Money Market Funds
(Cost $67,246,634) | | | | 67,245,331 | |
TOTAL INVESTMENTS IN SECURITIES–100.21% (Cost $1,592,616,318) | | | | | | | 2,014,661,162 | |
OTHER ASSETS LESS LIABILITIES–(0.21)% | | | | (4,322,084 | ) |
NET ASSETS–100.00% | | | | | | $ | 2,010,339,078 | |
Investment Abbreviations:
| | |
| ADR | | – American Depositary Receipt |
Notes to Schedule of Investments:
| (a) | Industry and/or sector classifications used in this report are generally according to the Global Industry Classification Standard, which was developed by and is the exclusive property and a service mark of MSCI Inc. and Standard & Poor’s. |
| (b) | Non-income producing security. |
| (c) | The money market fund and the Fund are affiliated by having the same investment adviser. The rate shown is the 7-day SEC standardized yield as of December 31, 2017. |
See accompanying Notes to Financial Statements which are an integral part of the financial statements.
Invesco V.I. Growth and Income Fund
| | | | | | | | | | | | | | | | | | | | | | |
| Open Forward Foreign Currency Contracts | |
Settlement
Date | | Counterparty | | Contract to | | | Unrealized
Appreciation
(Depreciation) | |
| | | Deliver | | | Receive | | |
01/19/2018 | | State Street Bank and Trust Co. | | | USD | | | | 88,990 | | | | AUD | | | | 116,034 | | | $ | 1,545 | |
01/19/2018 | | State Street Bank and Trust Co. | | | USD | | | | 208,599 | | | | CAD | | | | 268,209 | | | | 4,860 | |
01/19/2018 | | State Street Bank and Trust Co. | | | USD | | | | 153,075 | | | | CHF | | | | 150,254 | | | | 1,384 | |
01/19/2018 | | State Street Bank and Trust Co. | | | USD | | | | 269,191 | | | | EUR | | | | 226,929 | | | | 3,442 | |
01/19/2018 | | State Street Bank and Trust Co. | | | USD | | | | 270,111 | | | | GBP | | | | 201,255 | | | | 1,807 | |
Subtotal | | | | | | | | | | | | | | | | 13,038 | |
01/19/2018 | | Bank of New York Mellon (The) | | | AUD | | | | 7,360,405 | | | | USD | | | | 5,560,786 | | | | (182,137 | ) |
01/19/2018 | | Bank of New York Mellon (The) | | | CAD | | | | 17,768,593 | | | | USD | | | | 13,806,211 | | | | (335,275 | ) |
01/19/2018 | | Bank of New York Mellon (The) | | | CHF | | | | 9,624,714 | | | | USD | | | | 9,726,845 | | | | (167,252 | ) |
01/19/2018 | | Bank of New York Mellon (The) | | | EUR | | | | 14,749,896 | | | | USD | | | | 17,365,052 | | | | (355,434 | ) |
01/19/2018 | | Bank of New York Mellon (The) | | | GBP | | | | 23,513,987 | | | | USD | | | | 31,413,158 | | | | (356,695 | ) |
01/19/2018 | | State Street Bank and Trust Co. | | | AUD | | | | 7,360,463 | | | | USD | | | | 5,562,905 | | | | (180,062 | ) |
01/19/2018 | | State Street Bank and Trust Co. | | | CAD | | | | 17,769,716 | | | | USD | | | | 13,810,517 | | | | (331,863 | ) |
01/19/2018 | | State Street Bank and Trust Co. | | | CHF | | | | 9,624,667 | | | | USD | | | | 9,726,740 | | | | (167,310 | ) |
01/19/2018 | | State Street Bank and Trust Co. | | | EUR | | | | 14,749,886 | | | | USD | | | | 17,374,113 | | | | (346,363 | ) |
01/19/2018 | | State Street Bank and Trust Co. | | | GBP | | | | 23,514,137 | | | | USD | | | | 31,415,405 | | | | (354,652 | ) |
Subtotal | | | | | | | | | | | | | | | | | | | (2,777,043 | ) |
Total Forward Foreign Currency Contracts — Currency Risk | | | | | | | $ | (2,764,005 | ) |
Currency Abbreviations:
| | |
| AUD | | – Australian Dollar |
| CAD | | – Canadian Dollar |
| CHF | | – Swiss Franc |
| EUR | | – Euro |
| GBP | | – British Pound Sterling |
| USD | | – U.S. Dollar |
See accompanying Notes to Financial Statements which are an integral part of the financial statements.
Invesco V.I. Growth and Income Fund
Statement of Assets and Liabilities
December 31, 2017
Statement of Operations
For the year ended December 31, 2017
| | | | |
Assets: | | | | |
Investments in securities, at value
(Cost $1,525,369,684) | | $ | 1,947,415,831 | |
Investments in affiliated money market funds, at value (Cost $67,246,634) | | | 67,245,331 | |
Other investments: | | | | |
Unrealized appreciation on forward foreign currency contracts outstanding | | | 13,038 | |
Cash | | | 125,988 | |
Foreign currencies, at value (Cost $1,227) | | | 1,243 | |
Receivable for: | | | | |
Fund shares sold | | | 121,801 | |
Dividends | | | 3,262,126 | |
Investment for trustee deferred compensation and retirement plans | | | 213,048 | |
Total assets | | | 2,018,398,406 | |
| |
Liabilities: | | | | |
Other investments: | | | | |
Unrealized depreciation on forward foreign currency contracts outstanding | | | 2,777,043 | |
Payable for: | | | | |
Fund shares reacquired | | | 3,058,794 | |
Accrued fees to affiliates | | | 1,899,881 | |
Accrued trustees’ and officers’ fees and benefits | | | 1,277 | |
Accrued other operating expenses | | | 81,362 | |
Trustee deferred compensation and retirement plans | | | 240,971 | |
Total liabilities | | | 8,059,328 | |
Net assets applicable to shares outstanding | | $ | 2,010,339,078 | |
| |
Net assets consist of: | | | | |
Shares of beneficial interest | | $ | 1,392,362,860 | |
Undistributed net investment income | | | 32,933,079 | |
Undistributed net realized gain | | | 165,745,273 | |
Net unrealized appreciation | | | 419,297,866 | |
| | | $ | 2,010,339,078 | |
| |
Net Assets: | | | | |
Series I | | $ | 187,254,276 | |
Series II | | $ | 1,823,084,802 | |
|
Shares outstanding, no par value,
with an unlimited number of shares authorized: | |
Series I | | | 8,249,971 | |
Series II | | | 80,466,656 | |
Series I: | | | | |
Net asset value per share | | $ | 22.70 | |
Series II: | | | | |
Net asset value per share | | $ | 22.66 | |
| | | | |
Investment income: | | | | |
Dividends (net of foreign withholding taxes of $1,159,055) | | $ | 52,237,041 | |
Dividends from affiliated money market funds | | | 378,611 | |
Total investment income | | | 52,615,652 | |
| |
Expenses: | | | | |
Advisory fees | | | 11,147,816 | |
Administrative services fees | | | 3,379,462 | |
Custodian fees | | | 99,557 | |
Distribution fees —Series II | | | 4,515,907 | |
Transfer agent fees | | | 35,649 | |
Trustees’ and officers’ fees and benefits | | | 47,058 | |
Reports to shareholders | | | 208,026 | |
Professional services fees | | | 65,298 | |
Other | | | 30,636 | |
Total expenses | | | 19,529,409 | |
Less: Fees waived | | | (53,761 | ) |
Net expenses | | | 19,475,648 | |
Net investment income | | | 33,140,004 | |
| |
Realized and unrealized gain (loss) from: | | | | |
Net realized gain (loss) from: | | | | |
Investment securities | | | 175,530,781 | |
Foreign currencies | | | 6,774 | |
Forward foreign currency contracts | | | (5,342,727 | ) |
| | | | 170,194,828 | |
Change in net unrealized appreciation (depreciation) of: | | | | |
Investment securities | | | 63,287,868 | |
Foreign currencies | | | 20,611 | |
Forward foreign currency contracts | | | (5,957,990 | ) |
| | | | 57,350,489 | |
Net realized and unrealized gain | | | 227,545,317 | |
Net increase in net assets resulting from operations | | $ | 260,685,321 | |
See accompanying Notes to Financial Statements which are an integral part of the financial statements.
Invesco V.I. Growth and Income Fund
Statement of Changes in Net Assets
For the years ended December 31, 2017 and 2016
| | | | | | | | |
| | | 2017 | | | 2016 | |
Operations: | | | | | | | | |
Net investment income | | $ | 33,140,004 | | | $ | 25,590,251 | |
Net realized gain | | | 170,194,828 | | | | 80,727,734 | |
Change in net unrealized appreciation | | | 57,350,489 | | | | 222,115,422 | |
Net increase in net assets resulting from operations | | | 260,685,321 | | | | 328,433,407 | |
| | |
Distributions to shareholders from net investment income: | | | | | | | | |
Series I | | | (2,699,090 | ) | | | (1,752,815 | ) |
Series ll | | | (23,299,802 | ) | | | (15,406,306 | ) |
Total distributions from net investment income | | | (25,998,892 | ) | | | (17,159,121 | ) |
| | |
Distributions to shareholders from net realized gains: | | | | | | | | |
Series l | | | (7,416,214 | ) | | | (14,485,559 | ) |
Series ll | | | (74,973,902 | ) | | | (163,022,756 | ) |
Total distributions from net realized gains | | | (82,390,116 | ) | | | (177,508,315 | ) |
| | |
Share transactions–net: | | | | | | | | |
Series l | | | 5,625,071 | | | | 7,123,071 | |
Series ll | | | (153,738,313 | ) | | | 281,089,879 | |
Net increase (decrease) in net assets resulting from share transactions | | | (148,113,242 | ) | | | 288,212,950 | |
Net increase in net assets | | | 4,183,071 | | | | 421,978,921 | |
| | |
Net assets: | | | | | | | | |
Beginning of year | | | 2,006,156,007 | | | | 1,584,177,086 | |
End of year (includes undistributed net investment income of $32,933,079 and $25,770,737, respectively) | | $ | 2,010,339,078 | | | $ | 2,006,156,007 | |
Notes to Financial Statements
December 31, 2017
NOTE 1—Significant Accounting Policies
Invesco V.I. Growth and Income Fund (the “Fund”) is a series portfolio of AIM Variable Insurance Funds (Invesco Variable Insurance Funds) (the “Trust”). The Trust is a Delaware statutory trust registered under the Investment Company Act of 1940, as amended (the “1940 Act”), as an open-end series management investment company consisting of twenty-four separate portfolios, (each constituting a “Fund”). The assets, liabilities and operations of each portfolio are accounted for separately. Information presented in these financial statements pertains only to the Fund. Matters affecting each Fund or class will be voted on exclusively by the shareholders of such Fund or class. Current Securities and Exchange Commission (“SEC”) guidance, however, requires participating insurance companies offering separate accounts to vote shares proportionally in accordance with the instructions of the contract owners whose investments are funded by shares of each Fund or class.
The Fund’s investment objective is to seek long-term growth of capital and income.
The Fund currently offers two classes of shares, Series I and Series II, both of which are offered to insurance company separate accounts funding variable annuity contracts and variable life insurance policies (“variable products”).
The Fund is an investment company and accordingly follows the investment company accounting and reporting guidance in accordance with Financial Accounting Standards Board Accounting Standards Codification Topic 946, Financial Services — Investment Companies.
The following is a summary of the significant accounting policies followed by the Fund in the preparation of its financial statements.
| A. | Security Valuations — Securities, including restricted securities, are valued according to the following policy. |
A security listed or traded on an exchange (except convertible securities) is valued at its last sales price or official closing price as of the close of the customary trading session on the exchange where the security is principally traded, or lacking any sales or official closing price on a particular day, the security may be valued at the closing bid price on that day. Securities traded in the over-the-counter market are valued based on prices furnished by independent pricing services or market makers. When such securities are valued by an independent pricing service they may be considered fair valued. Futures contracts are valued at the final settlement price set by an exchange on which they are principally traded. Listed options are valued at the mean between the last bid and asked prices from the exchange on which they are principally traded. Options not listed on an exchange are valued by an independent source at the mean between the last bid and asked prices. For purposes of determining net asset value (“NAV”) per share, futures and option contracts generally are valued 15 minutes after the close of the customary trading session of the New York Stock Exchange (“NYSE”).
Investments in open-end and closed-end registered investment companies that do not trade on an exchange are valued at the end-of-day net asset value per share. Investments in open-end and closed-end registered investment companies that trade on an exchange are valued at the last sales price or official closing price as of the close of the customary trading session on the exchange where the security is principally traded.
Invesco V.I. Growth and Income Fund
Debt obligations (including convertible securities) and unlisted equities are fair valued using an evaluated quote provided by an independent pricing service. Evaluated quotes provided by the pricing service may be determined without exclusive reliance on quoted prices, and may reflect appropriate factors such as institution-size trading in similar groups of securities, developments related to specific securities, dividend rate (for unlisted equities), yield (for debt obligations), quality, type of issue, coupon rate (for debt obligations), maturity (for debt obligations), individual trading characteristics and other market data. Pricing services generally value debt obligations assuming orderly transactions of institutional round lot size, but a fund may hold or transact in the same securities in smaller, odd lot sizes. Odd lots often trade at lower prices than institutional round lots. Debt obligations are subject to interest rate and credit risks. In addition, all debt obligations involve some risk of default with respect to interest and/or principal payments.
Foreign securities’ (including foreign exchange contracts) prices are converted into U.S. dollar amounts using the applicable exchange rates as of the close of the NYSE. If market quotations are available and reliable for foreign exchange-traded equity securities, the securities will be valued at the market quotations. Because trading hours for certain foreign securities end before the close of the NYSE, closing market quotations may become unreliable. If between the time trading ends on a particular security and the close of the customary trading session on the NYSE, events occur that the investment adviser determines are significant and make the closing price unreliable, the Fund may fair value the security. If the event is likely to have affected the closing price of the security, the security will be valued at fair value in good faith using procedures approved by the Board of Trustees. Adjustments to closing prices to reflect fair value may also be based on a screening process of an independent pricing service to indicate the degree of certainty, based on historical data, that the closing price in the principal market where a foreign security trades is not the current value as of the close of the NYSE. Foreign securities’ prices meeting the approved degree of certainty that the price is not reflective of current value will be priced at the indication of fair value from the independent pricing service. Multiple factors may be considered by the independent pricing service in determining adjustments to reflect fair value and may include information relating to sector indices, American Depositary Receipts and domestic and foreign index futures. Foreign securities may have additional risks including exchange rate changes, potential for sharply devalued currencies and high inflation, political and economic upheaval, the relative lack of issuer information, relatively low market liquidity and the potential lack of strict financial and accounting controls and standards.
Securities for which market prices are not provided by any of the above methods may be valued based upon quotes furnished by independent sources. The last bid price may be used to value equity securities. The mean between the last bid and asked prices is used to value debt obligations, including corporate loans.
Securities for which market quotations are not readily available or became unreliable are valued at fair value as determined in good faith by or under the supervision of the Trust’s officers following procedures approved by the Board of Trustees. Issuer specific events, market trends, bid/asked quotes of brokers and information providers and other market data may be reviewed in the course of making a good faith determination of a security’s fair value.
The Fund may invest in securities that are subject to interest rate risk, meaning the risk that the prices will generally fall as interest rates rise and, conversely, the prices will generally rise as interest rates fall. Specific securities differ in their sensitivity to changes in interest rates depending on their individual characteristics. Changes in interest rates may result in increased market volatility, which may affect the value and/or liquidity of certain Fund investments.
Valuations change in response to many factors including the historical and prospective earnings of the issuer, the value of the issuer’s assets, general economic conditions, interest rates, investor perceptions and market liquidity. Because of the inherent uncertainties of valuation, the values reflected in the financial statements may materially differ from the value received upon actual sale of those investments.
| B. | Securities Transactions and Investment Income — Securities transactions are accounted for on a trade date basis. Realized gains or losses on sales are computed on the basis of specific identification of the securities sold. Interest income (net of withholding tax, if any) is recorded on the accrual basis from settlement date. Dividend income (net of withholding tax, if any) is recorded on the ex-dividend date. |
The Fund may periodically participate in litigation related to Fund investments. As such, the Fund may receive proceeds from litigation settlements. Any proceeds received are included in the Statement of Operations as realized gain (loss) for investments no longer held and as unrealized gain (loss) for investments still held.
Brokerage commissions and mark ups are considered transaction costs and are recorded as an increase to the cost basis of securities purchased and/or a reduction of proceeds on a sale of securities. Such transaction costs are included in the determination of net realized and unrealized gain (loss) from investment securities reported in the Statement of Operations and the Statement of Changes in Net Assets and the net realized and unrealized gains (losses) on securities per share in the Financial Highlights. Transaction costs are included in the calculation of the Fund’s net asset value and, accordingly, they reduce the Fund’s total returns. These transaction costs are not considered operating expenses and are not reflected in net investment income reported in the Statement of Operations and the Statement of Changes in Net Assets, or the net investment income per share and the ratios of expenses and net investment income reported in the Financial Highlights, nor are they limited by any expense limitation arrangements between the Fund and the investment adviser.
The Fund allocates income and realized and unrealized capital gains and losses to a class based on the relative net assets of each class.
| C. | Country Determination — For the purposes of making investment selection decisions and presentation in the Schedule of Investments, the investment adviser may determine the country in which an issuer is located and/or credit risk exposure based on various factors. These factors include the laws of the country under which the issuer is organized, where the issuer maintains a principal office, the country in which the issuer derives 50% or more of its total revenues and the country that has the primary market for the issuer’s securities, as well as other criteria. Among the other criteria that may be evaluated for making this determination are the country in which the issuer maintains 50% or more of its assets, the type of security, financial guarantees and enhancements, the nature of the collateral and the sponsor organization. Country of issuer and/or credit risk exposure has been determined to be the United States of America, unless otherwise noted. |
| D. | Distributions — Distributions from net investment income and net realized capital gain, if any, are generally declared and paid to separate accounts of participating insurance companies annually and recorded on the ex-dividend date. |
| E. | Federal Income Taxes — The Fund intends to comply with the requirements of Subchapter M of the Internal Revenue Code of 1986, as amended (the “Internal Revenue Code”), necessary to qualify as a regulated investment company and to distribute substantially all of the Fund’s taxable earnings to shareholders. As such, the Fund will not be subject to federal income taxes on otherwise taxable income (including net realized capital gain) that is distributed to shareholders. Therefore, no provision for federal income taxes is recorded in the financial statements. |
Invesco V.I. Growth and Income Fund
The Fund recognizes the tax benefits of uncertain tax positions only when the position is more likely than not to be sustained. Management has analyzed the Fund’s uncertain tax positions and concluded that no liability for unrecognized tax benefits should be recorded related to uncertain tax positions. Management is not aware of any tax positions for which it is reasonably possible that the total amounts of unrecognized tax benefits will change materially in the next 12 months.
The Fund files tax returns in the U.S. Federal jurisdiction and certain other jurisdictions. Generally, the Fund is subject to examinations by such taxing authorities for up to three years after the filing of the return for the tax period.
| F. | Expenses — Fees provided for under the Rule 12b-1 plan of a particular class of the Fund and which are directly attributable to that class are charged to the operations of such class. All other expenses are allocated among the classes based on relative net assets. |
| G. | Accounting Estimates — The preparation of financial statements in conformity with accounting principles generally accepted in the United States of America (“GAAP”) requires management to make estimates and assumptions that affect the reported amounts of assets and liabilities at the date of the financial statements and the reported amounts of revenues and expenses during the reporting period including estimates and assumptions related to taxation. Actual results could differ from those estimates by a significant amount. In addition, the Fund monitors for material events or transactions that may occur or become known after the period-end date and before the date the financial statements are released to print. |
| H. | Indemnifications — Under the Trust’s organizational documents, each Trustee, officer, employee or other agent of the Trust is indemnified against certain liabilities that may arise out of the performance of their duties to the Fund. Additionally, in the normal course of business, the Fund enters into contracts, including the Fund’s servicing agreements, that contain a variety of indemnification clauses. The Fund’s maximum exposure under these arrangements is unknown as this would involve future claims that may be made against the Fund that have not yet occurred. The risk of material loss as a result of such indemnification claims is considered remote. |
| I. | Foreign Currency Translations — Foreign currency is valued at the close of the NYSE based on quotations posted by banks and major currency dealers. Portfolio securities and other assets and liabilities denominated in foreign currencies are translated into U.S. dollar amounts at date of valuation. Purchases and sales of portfolio securities (net of foreign taxes withheld on disposition) and income items denominated in foreign currencies are translated into U.S. dollar amounts on the respective dates of such transactions. The Fund does not separately account for the portion of the results of operations resulting from changes in foreign exchange rates on investments and the fluctuations arising from changes in market prices of securities held. The combined results of changes in foreign exchange rates and the fluctuation of market prices on investments (net of estimated foreign tax withholding) are included with the net realized and unrealized gain or loss from investments in the Statement of Operations. Reported net realized foreign currency gains or losses arise from (1) sales of foreign currencies, (2) currency gains or losses realized between the trade and settlement dates on securities transactions, and (3) the difference between the amounts of dividends, interest, and foreign withholding taxes recorded on the Fund’s books and the U.S. dollar equivalent of the amounts actually received or paid. Net unrealized foreign currency gains and losses arise from changes in the fair values of assets and liabilities, other than investments in securities at fiscal period end, resulting from changes in exchange rates. |
The Fund may invest in foreign securities, which may be subject to foreign taxes on income, gains on investments or currency repatriation, a portion of which may be recoverable. Foreign taxes, if any, are recorded based on the tax regulations and rates that exist in the foreign markets in which the Fund invests and are shown in the Statement of Operations.
| J. | Forward Foreign Currency Contracts — The Fund may engage in foreign currency transactions either on a spot (i.e. for prompt delivery and settlement) basis, or through forward foreign currency contracts, to manage or minimize currency or exchange rate risk. |
The Fund may also enter into forward foreign currency contracts for the purchase or sale of a security denominated in a foreign currency in order to “lock in” the U.S. dollar price of that security, or the Fund may also enter into forward foreign currency contracts that do not provide for physical settlement of the two currencies, but instead are settled by a single cash payment calculated as the difference between the agreed upon exchange rate and the spot rate at settlement based upon an agreed upon notional amount (non-deliverable forwards). The Fund will set aside liquid assets in an amount equal to the daily mark-to-market obligation for forward foreign currency contracts.
A forward foreign currency contract is an obligation between two parties (“Counterparties”) to purchase or sell a specific currency for an agreed-upon price at a future date. The use of forward foreign currency contracts does not eliminate fluctuations in the price of the underlying securities the Fund owns or intends to acquire but establishes a rate of exchange in advance. Fluctuations in the value of these contracts are measured by the difference in the contract date and reporting date exchange rates and are recorded as unrealized appreciation (depreciation) until the contracts are closed. When the contracts are closed, realized gains (losses) are recorded. Realized and unrealized gains (losses) on the contracts are included in the Statement of Operations. The primary risks associated with forward foreign currency contracts include failure of the Counterparty to meet the terms of the contract and the value of the foreign currency changing unfavorably. These risks may be in excess of the amounts reflected in the Statement of Assets and Liabilities.
NOTE 2—Advisory Fees and Other Fees Paid to Affiliates
The Trust has entered into a master investment advisory agreement with Invesco Advisers, Inc. (the “Adviser” or “Invesco”). Under the terms of the investment advisory agreement, the Fund accrues daily and pays monthly an advisory fee to the Adviser based on the annual rate of the Fund’s average daily net assets as follows:
| | | | |
| Average Daily Net Assets | | Rate | |
First $500 million | | | 0.60% | |
Over $500 million | | | 0.55% | |
For the year ended December 31, 2017, the effective advisory fees incurred by the Fund was 0.56%.
Under the terms of a master sub-advisory agreement between the Adviser and each of Invesco Asset Management Deutschland GmbH, Invesco Asset Management Limited, Invesco Asset Management (Japan) Limited, Invesco Hong Kong Limited, Invesco Senior Secured Management, Inc. and Invesco Canada Ltd. and separate sub-advisory agreements with Invesco PowerShares Capital Management LLC and Invesco Asset Management (India) Private Limited (collectively, the “Affiliated Sub-Advisers”) the Adviser, not the Fund, will pay 40% of the fees paid to the Adviser to any such
Invesco V.I. Growth and Income Fund
Affiliated Sub-Adviser(s) that provide(s) discretionary investment management services to the Fund based on the percentage of assets allocated to such Affiliated Sub-Adviser(s).
The Adviser has contractually agreed, through at least April 30, 2019, to waive advisory fees and/or reimburse expenses of all shares to the extent necessary to limit total annual fund operating expenses after fee waiver and/or expense reimbursement (excluding certain items discussed below) of Series I shares to 0.78% and Series II shares to 1.03% of average daily net assets (the “expense limits”). In determining the Adviser’s obligation to waive advisory fees and/or reimburse expenses, the following expenses are not taken into account, and could cause the total annual fund operating expenses after fee waiver and/or expense reimbursement to exceed the numbers reflected above: (1) interest; (2) taxes; (3) dividend expense on short sales; (4) extraordinary or non-routine items, including litigation expenses; and (5) expenses that the Fund has incurred but did not actually pay because of an expense offset arrangement. Unless Invesco continues the fee waiver agreement, it will terminate on April 30, 2019. During its term, the fee waiver agreement cannot be terminated or amended to increase the expense limits or reduce the advisory fee waiver without approval of the Board of Trustees. The Adviser did not waive fees and/or reimburse expenses during the period under these expense limits.
Further, the Adviser has contractually agreed, through at least June 30, 2019, to waive the advisory fee payable by the Fund in an amount equal to 100% of the net advisory fees the Adviser receives from the affiliated money market funds on investments by the Fund of uninvested cash in such affiliated money market funds.
For the year ended December 31, 2017, the Adviser waived advisory fees of $53,761.
The Trust has entered into a master administrative services agreement with Invesco pursuant to which the Fund has agreed to pay Invesco a fee for costs incurred in providing accounting services and fund administrative services to the Fund and to reimburse Invesco for fees paid to insurance companies that have agreed to provide certain administrative services to the Fund. These administrative services provided by the insurance companies may include, among other things: maintenance of master accounts with the Fund; tracking, recording and transmitting net purchase and redemption orders for Fund shares; maintaining and preserving records related to the purchase, redemption and other account activity of variable product owners; distributing copies of Fund documents such as prospectuses, proxy materials and periodic reports, to variable product owners, and responding to inquiries from variable product owners about the Fund. Pursuant to such agreement, for the year ended December 31, 2017, Invesco was paid $412,584 for accounting and fund administrative services and was reimbursed $2,966,878 for fees paid to insurance companies.
The Trust has entered into a transfer agency and service agreement with Invesco Investment Services, Inc. (“IIS”) pursuant to which the Fund has agreed to pay IIS a fee for providing transfer agency and shareholder services to the Fund and reimburse IIS for certain expenses incurred by IIS in the course of providing such services. For the year ended December 31, 2017, expenses incurred under the agreement are shown in the Statement of Operations as Transfer agent fees.
The Trust has entered into a master distribution agreement with Invesco Distributors, Inc. (“IDI”) to serve as the distributor for the Fund. The Trust has adopted a plan pursuant to Rule 12b-1 under the 1940 Act with respect to the Fund’s Series II shares (the “Plan”). The Fund, pursuant to the Plan, pays IDI compensation at the annual rate of 0.25% of the Fund’s average daily net assets of Series II shares. The fees are accrued daily and paid monthly. Of the Plan payments, up to 0.25% of the average daily net assets of the Series II shares may be paid to insurance companies who furnish continuing personal shareholder services to customers who purchase and own Series II shares of the Fund. For the year ended December 31, 2017, expenses incurred under the Plan are detailed in the Statement of Operations as Distribution fees.
For the year ended December 31, 2017, the Fund incurred $10,905 in brokerage commissions with Invesco Capital Markets, Inc., an affiliate of the Adviser and IDI, for portfolio transactions executed on behalf of the Fund.
Certain officers and trustees of the Trust are officers and directors of the Adviser, IIS and/or IDI.
NOTE 3—Additional Valuation Information
GAAP defines fair value as the price that would be received to sell an asset or paid to transfer a liability in an orderly transaction between market participants at the measurement date, under current market conditions. GAAP establishes a hierarchy that prioritizes the inputs to valuation methods, giving the highest priority to readily available unadjusted quoted prices in an active market for identical assets (Level 1) and the lowest priority to significant unobservable inputs (Level 3), generally when market prices are not readily available or are unreliable. Based on the valuation inputs, the securities or other investments are tiered into one of three levels. Changes in valuation methods may result in transfers in or out of an investment’s assigned level:
| | Level 1 — | Prices are determined using quoted prices in an active market for identical assets. |
| | Level 2 — | Prices are determined using other significant observable inputs. Observable inputs are inputs that other market participants may use in pricing a security. These may include quoted prices for similar securities, interest rates, prepayment speeds, credit risk, yield curves, loss severities, default rates, discount rates, volatilities and others. |
| | Level 3 — | Prices are determined using significant unobservable inputs. In situations where quoted prices or observable inputs are unavailable (for example, when there is little or no market activity for an investment at the end of the period), unobservable inputs may be used. Unobservable inputs reflect the Fund’s own assumptions about the factors market participants would use in determining fair value of the securities or instruments and would be based on the best available information. |
The following is a summary of the tiered valuation input levels, as of December 31, 2017. The level assigned to the securities valuations may not be an indication of the risk or liquidity associated with investing in those securities. Because of the inherent uncertainties of valuation, the values reflected in the financial statements may materially differ from the value received upon actual sale of those investments.
Invesco V.I. Growth and Income Fund
The Fund’s policy is to recognize transfers in and out of the valuation levels as of the end of the reporting period. During the year ended December 31, 2017, there were transfers from Level 1 to Level 2 of $17,951,339 and from Level 2 to Level 1 of $71,472,503, due to foreign fair value adjustments.
| | | | | | | | | | | | | | | | |
| | | Level 1 | | | Level 2 | | | Level 3 | | | Total | |
Investments in Securities | | | | | | | | | | | | | | | | |
Common Stocks & Other Equity Interests | | $ | 1,885,443,391 | | | $ | 61,972,440 | | | $ | — | | | $ | 1,947,415,831 | |
Money Market Funds | | | 67,245,331 | | | | — | | | | — | | | | 67,245,331 | |
Total Investments in Securities | | | 1,952,688,722 | | | | 61,972,440 | | | | — | | | | 2,014,661,162 | |
Other Investments — Assets* | | | | | | | | | | | | | | | | |
Forward Foreign Currency Contracts | | | — | | | | 13,038 | | | | — | | | | 13,038 | |
Other Investments — Liabilities* | | | | | | | | | | | | | | | | |
Forward Foreign Currency Contracts | | | — | | | | (2,777,043 | ) | | | — | | | | (2,777,043 | ) |
Total Other Investments | | | — | | | | (2,764,005 | ) | | | — | | | | (2,764,005 | ) |
Total Investments | | $ | 1,952,688,722 | | | $ | 59,208,435 | | | $ | — | | | $ | 2,011,897,157 | |
| * | Unrealized appreciation (depreciation). |
NOTE 4—Derivative Investments
The Fund may enter into an International Swaps and Derivatives Association Master Agreement (“ISDA Master Agreement”) under which a fund may trade OTC derivatives. An OTC transaction entered into under an ISDA Master Agreement typically involves a collateral posting arrangement, payment netting provisions and close-out netting provisions. These netting provisions allow for reduction of credit risk through netting of contractual obligations. The enforceability of the netting provisions of the ISDA Master Agreement depends on the governing law of the ISDA Master Agreement, among other factors.
For financial reporting purposes, the Fund does not offset OTC derivative assets or liabilities that are subject to ISDA Master Agreements in the Statement of Assets and Liabilities.
Value of Derivative Investments at Period-End
The table below summarizes the value of the Fund’s derivative investments, detailed by primary risk exposure, held as of December 31, 2017:
| | | | |
| | | Value | |
| Derivative Assets | | Currency Risk | |
Unrealized appreciation on forward foreign currency contracts outstanding | | $ | 13,038 | |
Derivatives not subject to master netting agreements | | | — | |
Total Derivative Assets subject to master netting agreements | | $ | 13,038 | |
| | | | |
| |
| | | Value | |
| Derivative Liabilities | | Currency Risk | |
Unrealized depreciation on forward foreign currency contracts outstanding | | $ | (2,777,043 | ) |
Derivatives not subject to master netting agreements | | | — | |
Total Derivative Liabilities subject to master netting agreements | | $ | (2,777,043 | ) |
Offsetting Assets and Liabilities
The table below reflects the Fund’s exposure to Counterparties subject to either an ISDA Master Agreement or other agreement for OTC derivative transactions as of December 31, 2017.
| | | | | | | | | | | | | | | | | | | | | | | | |
| | | Financial
Derivative
Assets | | | Financial
Derivative
Liabilities | | | | | | Collateral (Received)/Pledged | | | | |
| Counterparty | | Forward Foreign
Currency Contracts | | | Forward Foreign
Currency Contracts | | | Net Value of
Derivatives | | | Non-Cash | | | Cash | | | Net
Amount | |
Bank of New York Mellon (The) | | $ | — | | | $ | (1,396,793 | ) | | $ | (1,396,793 | ) | | $ | — | | | $ | — | | | $ | (1,396,793 | ) |
State Street Bank and Trust Co. | | | 13,038 | | | | (1,380,250 | ) | | | (1,367,212 | ) | | | — | | | | — | | | | (1,367,212 | ) |
Total | | $ | 13,038 | | | $ | (2,777,043 | ) | | $ | (2,764,005 | ) | | $ | — | | | $ | — | | | $ | (2,764,005 | ) |
Invesco V.I. Growth and Income Fund
Effect of Derivative Investments for the year ended December 31, 2017
The table below summarizes the gains (losses) on derivative investments, detailed by primary risk exposure, recognized in earnings during the period:
| | | | |
| | | Location of Gain (Loss) on
Statement of Operations | |
| | | Currency Risk | |
Realized Gain (Loss): | | | | |
Forward foreign currency contracts | | $ | (5,342,727 | ) |
Change in Net Unrealized Appreciation (Depreciation): | | | | |
Forward foreign currency contracts | | | (5,957,990 | ) |
Total | | $ | (11,300,717 | ) |
The table below summarizes the average notional value of forward foreign currency contracts outstanding during the period.
| | | | |
| | | Forward Foreign Currency Contracts | |
Average notional value | | $ | 172,548,287 | |
NOTE 5—Security Transactions with Affiliated Funds
The Fund is permitted to purchase or sell securities from or to certain other Invesco Funds under specified conditions outlined in procedures adopted by the Board of Trustees of the Trust. The procedures have been designed to ensure that any purchase or sale of securities by the Fund from or to another fund or portfolio that is or could be considered an affiliate by virtue of having a common investment adviser (or affiliated investment advisers), common Trustees and/or common officers complies with Rule 17a-7 of the 1940 Act. Further, as defined under the procedures, each transaction is effected at the current market price. Pursuant to these procedures, for the year ended December 31, 2017, the Fund engaged in securities purchases of $6,029,687.
NOTE 6—Trustees’ and Officers’ Fees and Benefits
Trustees’ and Officers’ Fees and Benefits include amounts accrued by the Fund to pay remuneration to certain Trustees and Officers of the Fund. Trustees have the option to defer compensation payable by the Fund, and Trustees’ and Officers’ Fees and Benefits also include amounts accrued by the Fund to fund such deferred compensation amounts. Those Trustees who defer compensation have the option to select various Invesco Funds in which their deferral accounts shall be deemed to be invested. Finally, certain current Trustees were eligible to participate in a retirement plan that provided for benefits to be paid upon retirement to Trustees over a period of time based on the number of years of service. The Fund may have certain former Trustees who also participate in a retirement plan and receive benefits under such plan. Trustees’ and Officers’ Fees and Benefits include amounts accrued by the Fund to fund such retirement benefits. Obligations under the deferred compensation and retirement plans represent unsecured claims against the general assets of the Fund.
NOTE 7—Cash Balances
The Fund is permitted to temporarily carry a negative or overdrawn balance in its account with State Street Bank and Trust Company, the custodian bank. Such balances, if any at period-end, are shown in the Statement of Assets and Liabilities under the payable caption Amount due custodian. To compensate the custodian bank for such overdrafts, the overdrawn Fund may either (1) leave funds as a compensating balance in the account so the custodian bank can be compensated by earning the additional interest; or (2) compensate by paying the custodian bank at a rate agreed upon by the custodian bank and Invesco, not to exceed the contractually agreed upon rate.
NOTE 8—Distributions to Shareholders and Tax Components of Net Assets
Tax Character of Distributions to Shareholders Paid During the Fiscal Years Ended December 31, 2017 and 2016:
| | | | | | | | |
| | | 2017 | | | 2016 | |
Ordinary income | | $ | 33,469,069 | | | $ | 17,159,121 | |
Long-term capital gain | | | 74,919,939 | | | | 177,508,315 | |
Total distributions | | $ | 108,389,008 | | | $ | 194,667,436 | |
Invesco V.I. Growth and Income Fund
Tax Components of Net Assets at Period-End:
| | | | |
| | | 2017 | |
Undistributed ordinary income | | $ | 38,073,012 | |
Undistributed long-term gain | | | 158,580,070 | |
Net unrealized appreciation — investments | | | 421,519,055 | |
Net unrealized appreciation — foreign currencies | | | 17,027 | |
Temporary book/tax differences | | | (212,946 | ) |
Shares of beneficial interest | | | 1,392,362,860 | |
Total net assets | | $ | 2,010,339,078 | |
The difference between book-basis and tax-basis unrealized appreciation (depreciation) is due to differences in the timing of recognition of gains and losses on investments for tax and book purposes. The Fund’s net unrealized appreciation difference is attributable primarily to forward foreign currency contracts and wash sales.
The temporary book/tax differences are a result of timing differences between book and tax recognition of income and/or expenses. The Fund’s temporary book/tax differences are the result of the trustee deferral of compensation and retirement plan benefits.
Capital loss carryforward is calculated and reported as of a specific date. Results of transactions and other activity after that date may affect the amount of capital loss carryforward actually available for the Fund to utilize. Capital losses generated in years beginning after December 22, 2010 can be carried forward for an unlimited period, whereas previous losses expire in eight tax years. Capital losses with an expiration period may not be used to offset capital gains until all net capital losses without an expiration date have been utilized. Capital loss carryforwards with no expiration date will retain their character as either short-term or long-term capital losses instead of as short-term capital losses as under prior law. The ability to utilize capital loss carryforwards in the future may be limited under the Internal Revenue Code and related regulations based on the results of future transactions.
The Fund does not have a capital loss carryforward as of December 31, 2017.
NOTE 9—Investment Transactions
The aggregate amount of investment securities (other than short-term securities, U.S. Treasury obligations and money market funds, if any) purchased and sold by the Fund during the year ended December 31, 2017 was $328,355,100 and $587,391,089, respectively. Cost of investments, including any derivatives, on a tax basis includes the adjustments for financial reporting purposes as of the most recently completed federal income tax reporting period-end.
| | | | |
| Unrealized Appreciation (Depreciation) of Investments on a Tax Basis | |
Aggregate unrealized appreciation of investments | | $ | 489,494,633 | |
Aggregate unrealized (depreciation) of investments | | | (67,975,578 | ) |
Net unrealized appreciation of investments | | $ | 421,519,055 | |
Cost of investments for tax purposes is $1,590,378,102.
NOTE 10—Reclassification of Permanent Differences
Primarily as a result of differing book/tax treatment of fair fund tax adjustments and foreign currency transactions, on December 31, 2017, undistributed net investment income was increased by $21,230 and undistributed net realized gain was decreased by $21,230. This reclassification had no effect on the net assets of the Fund.
Invesco V.I. Growth and Income Fund
NOTE 11—Share Information
| | | | | | | | | | | | | | | | |
| | | Summary of Share Activity | |
| | | Years ended December 31, | |
| | | 2017(a) | | | 2016 | |
| | | Shares | | | Amount | | | Shares | | | Amount | |
Sold: | | | | | | | | | | | | | | | | |
Series I | | | 1,248,121 | | | $ | 26,984,341 | | | | 1,098,200 | | | $ | 21,457,639 | |
Series II | | | 1,126,956 | | | | 24,398,016 | | | | 26,177,046 | | | | 523,596,316 | |
| | | | |
Issued as reinvestment of dividends: | | | | | | | | | | | | | | | | |
Series I | | | 472,016 | | | | 10,115,304 | | | | 855,102 | | | | 16,238,374 | |
Series II | | | 4,592,229 | | | | 98,273,704 | | | | 9,405,855 | | | | 178,429,062 | |
Reacquired: | | | | | | | | | | | | | | | | |
Series I | | | (1,454,161 | ) | | | (31,474,574 | ) | | | (1,574,684 | ) | | | (30,572,942 | ) |
Series II | | | (12,689,269 | ) | | | (276,410,033 | ) | | | (21,459,558 | ) | | | (420,935,499 | ) |
Net increase (decrease) in share activity | | | (6,704,108 | ) | | $ | (148,113,242 | ) | | | 14,501,961 | | | $ | 288,212,950 | |
| (a) | There are entities that are record owners of more than 5% of the outstanding shares of the Fund and in the aggregate own 79% of the outstanding shares of the Fund. The Fund and the Fund’s principal underwriter or adviser, are parties to participation agreements with these entities whereby these entities sell units of interest in separate accounts funding variable products that are invested in the Fund. The Fund, Invesco and/or Invesco affiliates may make payments to these entities, which are considered to be related to the Fund, for providing services to the Fund, Invesco and/or Invesco affiliates including but not limited to services such as, securities brokerage, third party record keeping and account servicing and administrative services. The Fund has no knowledge as to whether all or any portion of the shares owned of record by these entities are also owned beneficially. |
NOTE 12—Financial Highlights
The following schedule presents financial highlights for a share of the Fund outstanding throughout the periods indicated.
| | | | | | | | | | | | | | | | | | | | | | | | | | | | | | | | | | | | | | | | | | | | | | | | | | | | | | | | |
| | | Net asset
value,
beginning
of period | | | Net
investment
income(a) | | | Net gains
(losses)
on securities
(both
realized and
unrealized) | | | Total from
investment
operations | | | Dividends
from net
investment
income | | | Distributions
from net
realized
gains | | | Total
distributions | | | Net asset
value, end
of period | | | Total
return(b) | | | Net assets,
end of period
(000’s omitted) | | | Ratio of
expenses
to average
net assets
with fee waivers
and/or expenses
absorbed | | | Ratio of
expenses
to average net
assets without
fee waivers
and/or expenses
absorbed | | | Ratio of net
investment
income
to average
net assets | | | Portfolio
turnover(c) | |
Series I | | | | | | | | | | | | | | | | | | | | | | | | | | | | | | | | | | | | | | | | | | | | | | | | | | | | | | | | |
Year ended 12/31/17 | | $ | 21.05 | | | $ | 0.41 | (d) | | $ | 2.52 | | | $ | 2.93 | | | $ | (0.34 | ) | | $ | (0.94 | ) | | $ | (1.28 | ) | | $ | 22.70 | | | | 14.32 | % | | $ | 187,254 | | | | 0.76 | %(e) | | | 0.76 | %(e) | | | 1.90 | %(d)(e) | | | 17 | % |
Year ended 12/31/16 | | | 19.60 | | | | 0.33 | | | | 3.29 | | | | 3.62 | | | | (0.23 | ) | | | (1.94 | ) | | | (2.17 | ) | | | 21.05 | | | | 19.69 | | | | 168,082 | | | | 0.77 | | | | 0.79 | | | | 1.69 | | | | 28 | |
Year ended 12/31/15 | | | 25.15 | | | | 0.33 | | | | (1.30 | ) | | | (0.97 | ) | | | (0.74 | ) | | | (3.84 | ) | | | (4.58 | ) | | | 19.60 | | | | (3.06 | ) | | | 149,066 | | | | 0.78 | | | | 0.84 | | | | 1.41 | | | | 22 | |
Year ended 12/31/14 | | | 26.29 | | | | 0.59 | (f) | | | 2.02 | | | | 2.61 | | | | (0.50 | ) | | | (3.25 | ) | | | (3.75 | ) | | | 25.15 | | | | 10.28 | | | | 161,866 | | | | 0.78 | | | | 0.83 | | | | 2.22 | (f) | | | 31 | |
Year ended 12/31/13 | | | 20.07 | | | | 0.32 | | | | 6.47 | | | | 6.79 | | | | (0.36 | ) | | | (0.21 | ) | | | (0.57 | ) | | | 26.29 | | | | 34.08 | | | | 170,637 | | | | 0.75 | | | | 0.83 | | | | 1.37 | | | | 29 | |
Series II | | | | | | | | | | | | | | | | | | | | | | | | | | | | | | | | | | | | | | | | | | | | | | | | | | | | | | | | |
Year ended 12/31/17 | | | 21.02 | | | | 0.36 | (d) | | | 2.51 | | | | 2.87 | | | | (0.29 | ) | | | (0.94 | ) | | | (1.23 | ) | | | 22.66 | | | | 14.04 | | | | 1,823,085 | | | | 1.01 | (e) | | | 1.01 | (e) | | | 1.65 | (d)(e) | | | 17 | |
Year ended 12/31/16 | | | 19.58 | | | | 0.28 | | | | 3.28 | | | | 3.56 | | | | (0.18 | ) | | | (1.94 | ) | | | (2.12 | ) | | | 21.02 | | | | 19.37 | | | | 1,838,074 | | | | 1.02 | | | | 1.04 | | | | 1.44 | | | | 28 | |
Year ended 12/31/15 | | | 25.09 | | | | 0.27 | | | | (1.29 | ) | | | (1.02 | ) | | | (0.65 | ) | | | (3.84 | ) | | | (4.49 | ) | | | 19.58 | | | | (3.26 | ) | | | 1,435,111 | | | | 1.03 | | | | 1.09 | | | | 1.16 | | | | 22 | |
Year ended 12/31/14 | | | 26.23 | | | | 0.52 | (f) | | | 2.01 | | | | 2.53 | | | | (0.42 | ) | | | (3.25 | ) | | | (3.67 | ) | | | 25.09 | | | | 9.96 | | | | 1,828,854 | | | | 1.03 | | | | 1.08 | | | | 1.97 | (f) | | | 31 | |
Year ended 12/31/13 | | | 20.03 | | | | 0.26 | | | | 6.46 | | | | 6.72 | | | | (0.31 | ) | | | (0.21 | ) | | | (0.52 | ) | | | 26.23 | | | | 33.77 | | | | 2,335,747 | | | | 1.00 | | | | 1.08 | | | | 1.12 | | | | 29 | |
| (a) | Calculated using average shares outstanding. |
| (b) | Includes adjustments in accordance with accounting principles generally accepted in the United States of America and as such, the net asset value for financial reporting purposes and the returns based upon those net asset values may differ from the net asset value and returns for shareholder transactions. Total returns are not annualized for periods less than one year, if applicable, and do not reflect charges assessed in connection with a variable product, which if included would reduce total returns. |
| (c) | Portfolio turnover is calculated at the fund level and is not annualized for periods less than one year, if applicable. |
| (d) | Net investment income per share and the ratio of net investment income to average net assets include significant dividends received during the period. Net investment income per share and the ratio of net investment income to average net assets excluding the significant dividends are $0.30 and 1.42%, and $0.25 and 1.17%, for Series I and Series II, respectively. |
| (e) | Ratios are based on average daily net assets (000’s omitted) of $175,058 and $1,806,363 for Series I and Series II shares, respectively. |
| (f) | Net investment income per share and the ratio of net investment income to average net assets include significant dividends received during the period. Net investment income per share and the ratio of net investment income to average net assets excluding the significant dividends are $0.35 and 1.29%, and $0.28 and 1.04%, for Series I and Series II, respectively. |
Invesco V.I. Growth and Income Fund
Report of Independent Registered Public Accounting Firm
To the Board of Trustees of AIM Variable Insurance Funds (Invesco Variable Insurance Funds)
and Shareholders of Invesco V.I. Growth & Income Fund
Opinion on the Financial Statements
We have audited the accompanying statement of assets and liabilities, including the schedule of investments, of Invesco V.I. Growth & Income Fund (one of the funds constituting AIM Variable Insurance Funds (Invesco Variable Insurance Funds), hereafter referred to as the “Fund”) as of December 31, 2017, the related statement of operations for the year ended December 31, 2017, the statement of changes in net assets for each of the two years in the period ended December 31, 2017, including the related notes, and the financial highlights for each of the five years in the period ended December 31, 2017 (collectively referred to as the “financial statements”). In our opinion, the financial statements present fairly, in all material respects, the financial position of the Fund as of December 31, 2017, the results of its operations for the year then ended, the changes in its net assets for each of the two years in the period ended December 31, 2017 and the financial highlights for each of the five years in the period ended December 31, 2017 in conformity with accounting principles generally accepted in the United States of America.
Basis for Opinion
These financial statements are the responsibility of the Fund’s management. Our responsibility is to express an opinion on the Fund’s financial statements based on our audits. We are a public accounting firm registered with the Public Company Accounting Oversight Board (United States) (“PCAOB”) and are required to be independent with respect to the Fund in accordance with the U.S. federal securities laws and the applicable rules and regulations of the Securities and Exchange Commission and the PCAOB.
We conducted our audits of these financial statements in accordance with the standards of the PCAOB. Those standards require that we plan and perform the audit to obtain reasonable assurance about whether the financial statements are free of material misstatement, whether due to error or fraud.
Our audits included performing procedures to assess the risks of material misstatement of the financial statements, whether due to error or fraud, and performing procedures that respond to those risks. Such procedures included examining, on a test basis, evidence regarding the amounts and disclosures in the financial statements. Our audits also included evaluating the accounting principles used and significant estimates made by management, as well as evaluating the overall presentation of the financial statements. Our procedures included confirmation of securities owned as of December 31, 2017 by correspondence with the custodian, transfer agent and brokers; when replies were not received from brokers, we performed other auditing procedures. We believe that our audits provide a reasonable basis for our opinion.
PricewaterhouseCoopers LLP
Houston, TX
February 14, 2018
We have served as the auditor of one or more of the investment companies in the Invesco/PowerShares group of investment companies since at least 1995. We have not determined the specific year we began serving as auditor.
Invesco V.I. Growth and Income Fund
Calculating your ongoing Fund expenses
Example
As a shareholder of the Fund, you incur ongoing costs, including management fees; distribution and/or service fees (12b-1); and other Fund expenses. This example is intended to help you understand your ongoing costs (in dollars) of investing in the Fund and to compare these costs with ongoing costs of investing in other mutual funds. The example is based on an investment of $1,000 invested at the beginning of the period and held for the entire period July 1, 2017 through December 31, 2017.
The actual and hypothetical expenses in the examples below do not represent the effect of any fees or other expenses assessed in connection with a variable product; if they did, the expenses shown would be higher while the ending account values shown would be lower.
Actual expenses
The table below provides information about actual account values and actual expenses. You may use the information in this table, together with the amount you invested, to estimate the expenses that you paid over the period. Simply divide your account value by $1,000 (for example, an $8,600 account value divided by $1,000 = 8.6), then multiply the result by the number in the table under the heading entitled “Actual Expenses Paid During Period” to estimate the expenses you paid on your account during this period.
Hypothetical example for comparison purposes
The table below also provides information about hypothetical account values and hypothetical expenses based on the Fund’s actual expense ratio and an assumed rate of return of 5% per year before expenses, which is not the Fund’s actual return.
The hypothetical account values and expenses may not be used to estimate the actual ending account balance or expenses you paid for the period. You may use this information to compare the ongoing costs of investing in the Fund and other funds. To do so, compare this 5% hypothetical example with the 5% hypothetical examples that appear in the shareholder reports of the other funds.
Please note that the expenses shown in the table are meant to highlight your ongoing costs. Therefore, the hypothetical information is useful in comparing ongoing costs, and will not help you determine the relative total costs of owning different funds.
| | | | | | | | | | | | | | | | | | | | | | | | |
Class | | Beginning
Account Value
(07/01/17) | | | ACTUAL | | | HYPOTHETICAL
(5% annual return before
expenses) | | | Annualized
Expense Ratio | |
| | | Ending
Account Value
(12/31/17)1 | | | Expenses
Paid During
Period2 | | | Ending
Account Value
(12/31/17) | | | Expenses
Paid During
Period2 | | |
| Series I | | $ | 1,000.00 | | | $ | 1,092.80 | | | $ | 4.01 | | | $ | 1,021.37 | | | $ | 3.87 | | | | 0.76 | % |
| Series II | | | 1,000.00 | | | | 1,091.50 | | | | 5.32 | | | | 1,020.11 | | | | 5.14 | | | | 1.01 | |
| 1 | The actual ending account value is based on the actual total return of the Fund for the period July 1, 2017 through December 31, 2017, after actual expenses and will differ from the hypothetical ending account value which is based on the Fund’s expense ratio and a hypothetical annual return of 5% before expenses. |
| 2 | Expenses are equal to the Fund’s annualized expense ratio as indicated above multiplied by the average account value over the period, multiplied by 184/365 to reflect the most recent fiscal half year. |
Invesco V.I. Growth and Income Fund
Tax Information
Form 1099-DIV, Form 1042-S and other year-end tax information provide shareholders with actual calendar year amounts that should be included in their tax returns. Shareholders should consult their tax advisors.
The following distribution information is being provided as required by the Internal Revenue Code or to meet a specific state’s requirement.
The Fund designates the following amounts or, if subsequently determined to be different, the maximum amount allowable for its fiscal year ended December 31, 2017:
| | | | |
Federal and State Income Tax | |
Long-Term Capital Gain Distributions | | $ | 74,919,939 | |
Corporate Dividends Received Deduction* | | | 98.86 | % |
U.S. Treasury Obligations* | | | 0.00 | % |
| | * | The above percentages are based on ordinary income dividends paid to shareholders during the Fund’s fiscal year. |
Invesco V.I. Growth and Income Fund
Trustees and Officers
The address of each trustee and officer is AIM Variable Insurance Funds (Invesco Variable Insurance Funds) (the “Trust”), 11 Greenway Plaza, Suite 1000, Houston, Texas 77046-1173. The trustees serve for the life of the Trust, subject to their earlier death, incapacitation, resignation, retirement or removal as more specifically provided in the Trust’s organizational documents. Each officer serves for a one year term or until their successors are elected and qualified. Column two below includes length of time served with predecessor entities, if any.
| | | | | | | | |
Name, Year of Birth and
Position(s) Held with the Trust | | Trustee and/
or Officer Since | | Principal Occupation(s)
During Past 5 Years | | Number of
Funds in Fund
Complex
Overseen by
Trustee | | Other Directorship(s)
Held by Trustee During
Past 5 Years |
| Interested Persons | | | | | | | | |
Martin L. Flanagan1 — 1960 Trustee | | 2007 | | Executive Director, Chief Executive Officer and President, Invesco Ltd. (ultimate parent of Invesco and a global investment management firm); Trustee, The Invesco Funds; Vice Chair, Investment Company Institute; and Member of Executive Board, SMU Cox School of Business Formerly: Advisor to the Board, Invesco Advisers, Inc. (formerly known as Invesco Institutional (N.A.), Inc.); Chairman and Chief Executive Officer, Invesco Advisers, Inc. (registered investment adviser); Director, Chairman, Chief Executive Officer and President, Invesco Holding Company (US), Inc. (formerly IVZ Inc.) (holding company), Invesco Group Services, Inc. (service provider) and Invesco North American Holdings, Inc. (holding company); Director, Chief Executive Officer and President, Invesco Holding Company Limited (parent of Invesco and a global investment management firm); Director, Invesco Ltd.; Chairman, Investment Company Institute and President, Co-Chief Executive Officer, Co-President, Chief Operating Officer and Chief Financial Officer, Franklin Resources, Inc. (global investment management organization) | | 158 | | None |
Philip A. Taylor2 — 1954 Trustee and Senior Vice President | | 2006 | | Head of the Americas and Senior Managing Director, Invesco Ltd.; Director, Invesco Advisers, Inc. (formerly known as Invesco Institutional (N.A.), Inc.) (registered investment adviser); Director, Chairman, Chief Executive Officer and President, Invesco Management Group, Inc. (formerly known as Invesco Aim Management Group, Inc.) (financial services holding company); Director and Chairman, Invesco Investment Services, Inc. (formerly known as Invesco Aim Investment Services, Inc.) (registered transfer agent); Chief Executive Officer, Invesco Corporate Class Inc. (corporate mutual fund company); Director, Chairman and Chief Executive Officer, Invesco Canada Ltd. (formerly known as Invesco Trimark Ltd./Invesco Trimark Ltèe) (registered investment adviser and registered transfer agent); Trustee and Senior Vice President, The Invesco Funds; Director, Invesco Investment Advisers LLC (formerly known as Van Kampen Asset Management). Formerly: Co-Chairman, Co-President and Co-Chief Executive Officer, Invesco Advisers, Inc. (formerly known as Invesco Institutional (N.A.), Inc.) (registered investment adviser); Director, Chief Executive Officer and President, Van Kampen Exchange Corp; President and Principal Executive Officer, The Invesco Funds (other than AIM Treasurer’s Series Trust (Invesco Treasurer’s Series Trust), Short-Term Investments Trust and Invesco Management Trust); Executive Vice President, The Invesco Funds (AIM Treasurer’s Series Trust (Invesco Treasurer’s Series Trust), Short-Term Investments Trust and Invesco Management Trust only); Director and President, INVESCO Funds Group, Inc. (registered investment adviser and registered transfer agent); Director and Chairman, IVZ Distributors, Inc. (formerly known as INVESCO Distributors, Inc.) (registered broker dealer); Director, President and Chairman, Invesco Inc. (holding company), Invesco Canada Holdings Inc. (holding company), Trimark Investments Ltd./Placements Trimark Ltèe and Invesco Financial Services Ltd/Services Financiers Invesco Ltèe; Chief Executive Officer, Invesco Canada Fund Inc. (corporate mutual fund company); Director and Chairman, Van Kampen Investor Services Inc.; Director, Chief Executive Officer and President, 1371 Preferred Inc. (holding company) and Van Kampen Investments Inc.; Director and President, AIM GP Canada Inc. (general partner for limited partnerships) and Van Kampen Advisors, Inc.; Director and Chief Executive Officer, Invesco Trimark Dealer Inc. (registered broker dealer); Director, Invesco Distributors, Inc. (formerly known as Invesco Aim Distributors, Inc.) (registered broker dealer); Manager, Invesco PowerShares Capital Management LLC; Director, Chief Executive Officer and President, Invesco Advisers, Inc.; Director, Chairman, Chief Executive Officer and President, Invesco Aim Capital Management, Inc.; President, Invesco Trimark Dealer Inc. and Invesco Trimark Ltd./Invesco Trimark Ltèe; Director and President, AIM Trimark Corporate Class Inc. and AIM Trimark Canada Fund Inc.; Senior Managing Director, Invesco Holding Company Limited; Director and Chairman, Fund Management Company (former registered broker dealer); President and Principal Executive Officer, The Invesco Funds (AIM Treasurer’s Series Trust (Invesco Treasurer’s Series Trust), and Short-Term Investments Trust only); President, AIM Trimark Global Fund Inc. and AIM Trimark Canada Fund Inc. | | 158 | | None |
| 1 | Mr. Flanagan is considered an interested person (within the meaning of Section 2(a)(19) of the 1940 Act) of the Trust because he is an officer of the Adviser to the Trust, and an officer and a director of Invesco Ltd., ultimate parent of the Adviser. |
| 2 | Mr. Taylor is considered an interested person (within the meaning of Section 2(a)(19) of the 1940 Act) of the Trust because he is an officer and a director of the Adviser. |
Invesco V.I. Growth and Income Fund
Trustees and Officers—(continued)
| | | | | | | | |
Name, Year of Birth and
Position(s) Held with the Trust | | Trustee and/
or Officer Since | | Principal Occupation(s)
During Past 5 Years | | Number of
Funds in Fund
Complex
Overseen by
Trustee | | Other Directorship(s)
Held by Trustee During
Past 5 Years |
| Independent Trustees | | | | | | | | |
Bruce L. Crockett — 1944 Trustee and Chair | | 1993 | | Chairman, Crockett Technologies Associates (technology consulting company) Formerly: Director, Captaris (unified messaging provider); Director, President and Chief Executive Officer, COMSAT Corporation; Chairman, Board of Governors of INTELSAT (international communications company); ACE Limited (insurance company); Independent Directors Council and Investment Company Institute: Member of the Audit Committee, Investment Company Institute; Member of the Executive Committee and Chair of the Governance Committee, Independent Directors Council | | 158 | | Director and Chairman of the Audit Committee, ALPS (Attorneys Liability Protection Society) (insurance company); Director and Member of the Audit Committee and Compensation Committee, Ferroglobe PLC (metallurgical company) |
David C. Arch — 1945 Trustee | | 2010 | | Chairman of Blistex Inc. (consumer health care products manufacturer); Member, World Presidents’ Organization | | 158 | | Board member of the Illinois Manufacturers’ Association |
Jack M. Fields — 1952 Trustee | | 1997 | | Chief Executive Officer, Twenty First Century Group, Inc. (government affairs company); and Chairman, Discovery Learning Alliance (non-profit) Formerly: Owner and Chief Executive Officer, Dos Angeles Ranch L.P. (cattle, hunting, corporate entertainment); Director, Insperity, Inc. (formerly known as Administaff) (human resources provider); Chief Executive Officer, Texana Timber LP (sustainable forestry company); Director of Cross Timbers Quail Research Ranch (non-profit); and member of the U.S. House of Representatives | | 158 | | None |
Cynthia Hostetler — 1962 Trustee | | 2017 | | Non-Executive Director and Trustee of a number of public and private business corporations Formerly: Head of Investment Funds and Private Equity, Overseas Private Investment Corporation; President, First Manhattan Bancorporation, Inc.; Attorney, Simpson Thacher & Bartlett LLP | | 158 | | Vulcan Materials Company (construction materials company); Trilinc Global Impact Fund; Aberdeen Investment Funds (4 portfolios); Artio Global Investment LLC (mutual fund complex); Edgen Group, Inc. (specialized energy and infrastructure products distributor) |
Eli Jones — 1961 Trustee | | 2016 | | Professor and Dean, Mays Business School — Texas A&M University Formerly: Professor and Dean, Walton College of Business, University of Arkansas and E.J. Ourso College of Business, Louisiana State University; Director, Arvest Bank | | 158 | | Insperity, Inc. (formerly known as Administaff) (human resources provider) |
Prema Mathai-Davis — 1950 Trustee | | 1998 | | Retired. | | 158 | | None |
Teresa M. Ressel — 1962 Trustee | | 2017 | | Non-executive director and trustee of a number of public and private business corporations Formerly: Chief Financial Officer, Olayan America, The Olayan Group (international investor/commercial/industrial); Chief Executive Officer, UBS Securities LLC; Group Chief Operating Officer, Americas, UBS AG; Assistant Secretary for Management & Budget and CFO, US Department of the Treasury | | 158 | | Atlantic Power Corporation (power generation company); ON Semiconductor Corp. (semiconductor supplier) |
Ann Barnett Stern — 1957 Trustee | | 2017 | | President and Chief Executive Officer, Houston Endowment Inc. (private philanthropic institution) Formerly: Executive Vice President and General Counsel, Texas Children’s Hospital; Attorney, Beck, Redden and Secrest, LLP; Business Law Instructor, University of St. Thomas; Attorney, Andrews & Kurth LLP | | 158 | | Federal Reserve Bank of Dallas |
Raymond Stickel, Jr. — 1944 Trustee | | 2005 | | Retired. Formerly: Director, Mainstay VP Series Funds, Inc. (25 portfolios); Partner, Deloitte & Touche | | 158 | | None |
Robert C. Troccoli — 1949 Trustee | | 2016 | | Adjunct Professor, University of Denver — Daniels College of Business Formerly: Senior Partner, KPMG LLP | | 158 | | None |
Christopher L. Wilson — 1957 Trustee | | 2017 | | Non-executive director and trustee of a number of public and private business corporations Formerly: Managing Partner, CT2, LLC (investing and consulting firm); President/Chief Executive Officer, Columbia Funds, Bank of America Corporation; President/Chief Executive Officer, CDC IXIS Asset Management Services, Inc.; Principal & Director of Operations, Scudder Funds, Scudder, Stevens & Clark, Inc.; Assistant Vice President, Fidelity Investments | | 158 | | TD Asset Management USA Inc. (mutual fund complex) (22 portfolios); ISO New England, Inc. (non-profit organization managing regional electricity market) |
Invesco V.I. Growth and Income Fund
Trustees and Officers—(continued)
| | | | | | | | |
Name, Year of Birth and
Position(s) Held with the Trust | | Trustee and/
or Officer Since | | Principal Occupation(s)
During Past 5 Years | | Number of
Funds in Fund
Complex
Overseen by
Trustee | | Other Directorship(s)
Held by Trustee During
Past 5 Years |
| Other Officers | | | | | | | | |
Sheri Morris — 1964 President, Principal Executive Officer and Treasurer | | 1999 | | President, Principal Executive Officer and Treasurer, The Invesco Funds; Vice President, Invesco Advisers, Inc. (formerly known as Invesco Institutional (N.A.), Inc.) (registered investment adviser); and Vice President, PowerShares Exchange-Traded Fund Trust, PowerShares Exchange-Traded Fund Trust II, PowerShares India Exchange-Traded Fund Trust, PowerShares Actively Managed Exchange-Traded Fund Trust, PowerShares Actively Managed Exchange-Traded Commodity Fund Trust and PowerShares Exchange-Traded Self-Indexed Fund Trust Formerly: Vice President and Principal Financial Officer, The Invesco Funds; Vice President, Invesco Aim Advisers, Inc., Invesco Aim Capital Management, Inc. and Invesco Aim Private Asset Management, Inc.; Assistant Vice President and Assistant Treasurer, The Invesco Funds and Assistant Vice President, Invesco Advisers, Inc., Invesco Aim Capital Management, Inc. and Invesco Aim Private Asset Management, Inc.; and Treasurer, PowerShares Exchange-Traded Fund Trust, PowerShares Exchange-Traded Fund Trust II, PowerShares India Exchange-Traded Fund Trust and PowerShares Actively Managed Exchange-Traded Fund Trust | | N/A | | N/A |
Russell C. Burk — 1958 Senior Vice President and Senior Officer | | 2005 | | Senior Vice President and Senior Officer, The Invesco Funds | | N/A | | N/A |
John M. Zerr — 1962 Senior Vice President, Chief Legal Officer and Secretary | | 2006 | | Director, Senior Vice President, Secretary and General Counsel, Invesco Management Group, Inc. (formerly known as Invesco AIM Management Group, Inc.); Senior Vice President, Invesco Advisers, Inc. (formerly known as Invesco Institutional (N.A.), Inc.) (registered investment adviser); Senior Vice President and Secretary, Invesco Distributors, Inc. (formerly known as Invesco AIM Distributors, Inc.); Director, Vice President and Secretary, Invesco Investment Services, Inc. (formerly known as Invesco AIM Investment Services, Inc.) Senior Vice President, Chief Legal Officer and Secretary, The Invesco Funds; Managing Director, Invesco PowerShares Capital Management LLC; Director, Secretary and General Counsel, Invesco Investment Advisers LLC (formerly known as Van Kampen Asset Management); Secretary and General Counsel, Invesco Capital Markets, Inc. (formerly known as Van Kampen Funds Inc.) and Chief Legal Officer, PowerShares Exchange-Traded Fund Trust, PowerShares Exchange-Traded Fund Trust II, PowerShares India Exchange-Traded Fund Trust, PowerShares Actively Managed Exchange-Traded Fund Trust, PowerShares Actively Managed Exchange-Traded Commodity Fund Trust and PowerShares Exchange-Traded Self-Indexed Fund Trust; Manager and Secretary, Invesco Indexing LLC Formerly: Director, Secretary, General Counsel and Senior Vice President, Van Kampen Exchange Corp.; Director, Vice President and Secretary, IVZ Distributors, Inc. (formerly known as INVESCO Distributors, Inc.); Director and Vice President, INVESCO Funds Group, Inc.; Director and Vice President, Van Kampen Advisors Inc.; Director, Vice President, Secretary and General Counsel, Van Kampen Investor Services Inc.; Director, Invesco Distributors, Inc. (formerly known as Invesco AIM Distributors, Inc.); Director, Senior Vice President, General Counsel and Secretary, Invesco AIM Advisers, Inc. and Van Kampen Investments Inc.; Director, Vice President and Secretary, Fund Management Company; Director, Senior Vice President, Secretary, General Counsel and Vice President, Invesco AIM Capital Management, Inc.; Chief Operating Officer and General Counsel, Liberty Ridge Capital, Inc. (an investment adviser); Vice President and Secretary, PBHG Funds (an investment company) and PBHG Insurance Series Fund (an investment company); Chief Operating Officer, General Counsel and Secretary, Old Mutual Investment Partners (a broker-dealer); General Counsel and Secretary, Old Mutual Fund Services (an administrator) and Old Mutual Shareholder Services (a shareholder servicing center); Executive Vice President, General Counsel and Secretary, Old Mutual Capital, Inc. (an investment adviser); and Vice President and Secretary, Old Mutual Advisors Funds (an investment company) | | N/A | | N/A |
Gregory G. McGreevey — 1962 Senior Vice President | | 2012 | | Senior Managing Director, Invesco Ltd.; Director, Chairman, President, and Chief Executive Officer, Invesco Advisers, Inc. (formerly known as Invesco Institutional (N.A.), Inc.) (registered investment adviser); Senior Vice President, Invesco Management Group, Inc.; Director, Invesco Mortgage Capital, Inc. and Invesco Senior Secured Management, Inc.; and Senior Vice President, The Invesco Funds Formerly: Assistant Vice President, The Invesco Funds | | N/A | | N/A |
Kelli Gallegos — 1970 Vice President, Principal Financial Officer and Assistant Treasurer | | 2008 | | Vice President, Principal Financial Officer and Assistant Treasurer, The Invesco Funds; Assistant Treasurer, Invesco PowerShares Capital Management LLC, PowerShares Exchange-Traded Fund Trust, PowerShares Exchange-Traded Fund Trust II, PowerShares India Exchange-Traded Fund Trust, PowerShares Actively Managed Exchange-Traded Fund Trust, PowerShares Actively Managed Exchange-Traded Commodity Fund Trust and PowerShares Exchange-Traded Self-Indexed Fund Trust Formerly: Assistant Vice President, The Invesco Funds | | N/A | | N/A |
Invesco V.I. Growth and Income Fund
Trustees and Officers—(continued)
| | | | | | | | |
Name, Year of Birth and
Position(s) Held with the Trust | | Trustee and/
or Officer Since | | Principal Occupation(s)
During Past 5 Years | | Number of
Funds in Fund
Complex
Overseen by
Trustee | | Other Directorship(s)
Held by Trustee During
Past 5 Years |
| Other Officers—(continued) | | | | | | | | |
Tracy Sullivan — 1962 Vice President, Chief Tax Officer and Assistant Treasurer | | 2008 | | Vice President, Chief Tax Officer and Assistant Treasurer, The Invesco Funds; Assistant Treasurer, Invesco PowerShares Capital Management LLC, PowerShares Exchange-Traded Fund Trust, PowerShares Exchange-Traded Fund Trust II, PowerShares India Exchange-Traded Fund Trust, PowerShares Actively Managed Exchange-Traded Fund Trust, PowerShares Actively Managed Exchange-Traded Commodity Fund Trust and PowerShares Exchange-Traded Self-Indexed Fund Trust Formerly: Assistant Vice President, The Invesco Funds | | N/A | | N/A |
Crissie M. Wisdom — 1969 Anti-Money Laundering Compliance Officer | | 2013 | | Anti-Money Laundering Compliance Officer, Invesco Advisers, Inc. (formerly known as Invesco Institutional (N.A.), Inc.) (registered investment adviser), Invesco Capital Markets, Inc. (formerly known as Van Kampen Funds Inc.), Invesco Distributors, Inc., Invesco Investment Services, Inc., Invesco Management Group, Inc., The Invesco Funds, and PowerShares Exchange-Traded Fund Trust, PowerShares Exchange-Traded Fund Trust II, PowerShares India Exchange-Traded Fund Trust, PowerShares Actively Managed Exchange-Traded Fund Trust, PowerShares Actively Managed Exchange-Traded Commodity Fund Trust and PowerShares Exchange-Traded Self-Indexed Fund Trust; Anti-Money Laundering Compliance Officer and Bank Secrecy Act Officer, INVESCO National Trust Company and Invesco Trust Company; and Fraud Prevention Manager and Controls and Risk Analysis Manager for Invesco Investment Services, Inc. Formerly: Anti-Money Laundering Compliance Officer, Van Kampen Exchange Corp. | | N/A | | N/A |
Robert R. Leveille — 1969 Chief Compliance Officer | | 2016 | | Chief Compliance Officer, Invesco Advisers, Inc. (registered investment adviser); and Chief Compliance Officer, The Invesco Funds Formerly: Chief Compliance Officer, Putnam Investments and the Putnam Funds | | N/A | | N/A |
The Statement of Additional Information of the Trust includes additional information about the Fund’s Trustees and is available upon request, without charge, by calling 1.800.959.4246. Please refer to the Fund’s Statement of Additional Information for information on the Fund’s sub-advisers.
| | | | | | |
Office of the Fund 11 Greenway Plaza, Suite 1000 Houston, TX 77046-1173 | | Investment Adviser Invesco Advisers, Inc. 1555 Peachtree Street, N.E. Atlanta, GA 30309 | | Distributor Invesco Distributors, Inc. 11 Greenway Plaza, Suite 1000 Houston, TX 77046-1173 | | Auditors PricewaterhouseCoopers LLP 1000 Louisiana Street, Suite 5800 Houston, TX 77002-5678 |
| | | |
| | | | | | |
Counsel to the Fund Stradley Ronon Stevens & Young, LLP 2005 Market Street, Suite 2600 Philadelphia, PA 19103-7018 | | Counsel to the Independent Trustees Goodwin Procter LLP 901 New York Avenue, N.W. Washington, D.C. 20001 | | Transfer Agent Invesco Investment Services, Inc. 11 Greenway Plaza, Suite 1000 Houston, TX 77046-1173 | | Custodian State Street Bank and Trust Company 225 Franklin Street Boston, MA 02110-2801 |
Invesco V.I. Growth and Income Fund
| | | | |
| | |
 | | Annual Report to Shareholders | | December 31, 2017 |
| | |
| | Invesco V.I. High Yield Fund |

| | |
| | The Fund provides a complete list of its holdings four times in each fiscal year, at the quarter-ends. For the second and fourth quarters, the lists appear in the Fund’s semiannual and annual reports to shareholders. For the first and third quarters, the Fund files the lists with the Securities and Exchange Commission (SEC) on Form N-Q. The Fund’s Form N-Q filings are available on the SEC website, sec.gov. Copies of the Fund’s Forms N-Q may be reviewed and copied at the SEC Public Reference Room in Washington, D.C. You can obtain information on the operation of the Public Reference Room, including information about duplicating fee charges, by calling 202 551 8090 or 800 732 0330, or by electronic request at the following email address: publicinfo@sec.gov. The SEC file numbers for the Fund are 811-07452 and 033-57340. The Fund’s most recent portfolio holdings, as filed on Form N-Q, have also been made available to insurance companies issuing variable annuity contracts and variable life insurance policies (“variable products”) that invest in the Fund. A description of the policies and procedures that the Fund uses to determine how to vote proxies relating to portfolio securities is available without charge, upon request, from our Client Services department at 800 959 4246 or at invesco.com/proxyguidelines. The information is also available on the SEC website, sec.gov. Information regarding how the Fund voted proxies related to its portfolio securities during the most recent 12-month period ended June 30 is available at invesco.com/ proxysearch. The information is also available on the SEC website, sec.gov. Invesco Advisers, Inc. is an investment adviser; it provides investment advisory services to individual and institutional clients and does not sell securities. Invesco Distributors, Inc. is the US distributor for Invesco Ltd.’s retail mutual funds, exchange-traded funds and institutional money market funds. Both are wholly owned, indirect subsidiaries of Invesco Ltd. This report must be accompanied or preceded by a currently effective Fund prospectus and variable product prospectus, which contain more complete information, including sales charges and expenses. Investors should read each carefully before investing. NOT FDIC INSURED | MAY LOSE VALUE | NO BANK GUARANTEE |
| |
| | Invesco Distributors, Inc. VIHYI-AR-1 02142018 0916 |
Management’s Discussion of Fund Performance
Performance summary
For the year ended December 31, 2017, Series I shares of Invesco V.I. High Yield Fund (the Fund) underperformed the Bloomberg Barclays U.S. Corporate High Yield 2% Issuer Cap Index, the Fund’s style-specific index.
Your Fund’s long-term performance appears later in this report.
Fund vs. Indexes
Total returns, 12/31/16 to 12/31/17, excluding variable product issuer charges.
If variable product issuer charges were included, returns would be lower.
| | | | | |
| Series I Shares | | | | 6.30 | % |
| Series II Shares | | | | 6.12 | |
| Bloomberg Barclays U.S. Aggregate Bond Index▼ (Broad Market Index) | | | | 3.54 | |
| Bloomberg Barclays U.S. Corporate High Yield 2% Issuer Cap Index▼ (Style-Specific Index) | | | | 7.50 | |
| Lipper VUF High Yield Bond Funds Classification Average∎ (Peer Group) | | | | 6.49 | |
Source(s): ▼FactSet Research Systems Inc.; ∎Lipper Inc. | | | | | |
Market conditions and your Fund
The high yield market produced strong returns for the year ended December 31, 2017, as solid earnings, a sharp rise in equity markets and an increase in oil prices all provided a tailwind for the market. The US economy continued its modest economic growth, although the health of individual sectors varied.
The US Federal Reserve (the Fed) raised interest rates three times during the year to a range of 1.25% to 1.50% and has now done so five times since the global financial crisis ended.1 At its December 2017 meeting, the Fed noted signs of a stronger labor market, economic activity that has been advancing at a solid rate and an inflation level below two percent.1
The high yield market produced positive monthly returns nine of the 12
months during the year. From a ratings perspective, much like in 2016, the lowest-rated segment of the market delivered the strongest performance with a double-digit return. By sector, chemicals had the strongest return, while retail had a negative return for the year as several issuers continued to struggle with outdated business models and a high amount of leverage.
The par-weighted high yield default rate decreased considerably in 2017 and ended the year at 1.27% compared to 3.57% at the end of 2016, according to JP Morgan.2 The decline in the default rate was due to the rise in oil prices beginning in 2016, which led to a significant drop in defaults in the energy sector. New issuance rose during 2017, compared to 2016, and ended the year at $328 billion.2 The increase in issuance occurred
| | |
| Portfolio Composition† |
By credit quality | % of total investments |
| | |
| |
| AA | | 0.2% |
| BBB | | 2.0 |
| BB | | 46.3 |
| B | | 39.7 |
| CCC | | 5.0 |
| D | | 0.1 |
| Non-Rated | | 6.7 |
| † | Source: Standard & Poor’s. A credit rating is an assessment provided by a nationally recognized statistical rating organization (NRSRO) of the creditworthiness of an issuer with respect to debt obligations, including specific securities, money market instruments or other debts. Ratings are measured on a scale that generally ranges from AAA (highest) to D (lowest); ratings are subject to change without notice. “Non-Rated” indicates the debtor was not rated, and should not be interpreted as indicating low quality. For more information on Standard & Poor’s rating methodology, please visit standardandpoors.com and select “Understanding Ratings” under Rating Resources on the homepage. |
| | |
| Top Five Debt Issuers* |
% of total net assets |
| |
| 1. Sprint Corp. | | 2.1% |
2. HCA, Inc. | | 2.0 |
3. Valeant Pharmaceuticals | | |
International, Inc. | | 1.5 |
4. CSC Holdings LLC | | 1.4 |
5. DISH DBS Corp. | | 1.4 |
| | |
| Total Net Assets | | $172.2 million |
| |
| Total Number of Holdings* | | 326 |
The Fund’s holdings are subject to change, and there is no assurance that the Fund will continue to hold any particular security.
| * | Excluding US Treasury bills and money market fund holdings. |
Data presented here are as of December 31, 2017.
in an environment of outflows as retail mutual fund investors pulled about $20 billion from the sector during the year.2 However, most new issuance was for refinancing of existing debt, a sign of a healthy market.
The Bloomberg Barclays U.S. Corporate High Yield 2% Issuer Cap Index, which measures the performance of the US high yield bond market and is the Fund’s style-specific index, generated a 7.50% return for the year ended December 31, 2017. Likewise, the Fund generated a positive return for the year.
The Fund’s performance relative to the style-specific benchmark was hindered in 2017 due to its defensive posture, which was based on our belief that we were in the latter stages of the credit and business cycle, which warranted such a position. With an underweight allocation to bonds rated CCC† and below, the Fund underperformed its style-specific benchmark. Moreover, the Fund held a small cash position, which the style-specific benchmark did not have, and it detracted from relative returns when the market rallied.
Despite our underweight allocation to the riskiest parts of the market relative to the style-specific benchmark, our security selection contributed to relative Fund performance during the year. In particular, security selection in the retail sector added to relative outperformance as many issuers in the sector continued to struggle despite solid economic growth. Moreover, our selection within the metals and mining sector also contributed to relative Fund performance as the sector had a strong return for the year. Additionally, our allocation to credit default swaps helped the Fund outperform the broader high yield cash bond market. These positions were used primarily to modulate overall portfolio risk.
Invesco V.I. High Yield Fund
During the year, we used currency forward contracts for the purpose of hedging currency exposure of non-US-dollar-denominated bonds held in the portfolio. We also used credit default swaps to efficiently manage the portfolio and to take advantage of relative value opportunities. Treasury futures were used to manage the Fund’s duration.
At the close of the year, we had a positive view of the high yield market and expected default activity to remain muted. We had a strong preference for companies with low leverage, high quality assets and strong management during the year. In particular, we favored sectors that benefited from US gross domestic product growth such as cable and satellite, paper, chemicals and building materials. At the close of the year, we believed the retail sector would continue to face considerable change and careful credit selection could prove to be critical to success.
We wish to remind you that the Fund is subject to interest rate risk, meaning when interest rates rise, the value of fixed income securities tends to fall. This risk may be greater in the current market environment because interest rates are at or near historic lows. The degree to which the value of fixed income securities may decline due to rising interest rates may vary depending on the speed and magnitude of the increase in interest rates, as well as individual security characteristics such as price, maturity, duration and coupon and market forces such as supply and demand for similar securities. We are monitoring interest rates, and the market, economic and geopolitical factors that may impact the direction, speed and magnitude of changes to interest rates across the maturity spectrum, including the potential impact of monetary policy changes by the Fed and certain foreign central banks. If interest rates rise, markets may experience increased volatility, which may affect the value and/or liquidity of certain of the Fund’s investments.
Thank you for investing in Invesco V.I. High Yield Fund and for sharing our long-term investment horizon.
| 1 | Source: US Federal Reserve |
| 2 | Source: JP Morgan High Yield Market Monitor |
The views and opinions expressed in management’s discussion of Fund performance are those of Invesco Advisers, Inc. These views and opinions are subject to change at any time based on factors such as market and economic conditions. These views and opinions may not be relied upon as investment advice or recommendations, or as an offer for a particular security. The information is not a complete analysis of every aspect of any market, country, industry, security or the Fund. Statements of fact are from sources considered reliable, but Invesco Advisers, Inc. makes no representation or warranty as to their completeness or accuracy. Although historical performance is no guarantee of future results, these insights may help you understand our investment management philosophy.
See important Fund and, if applicable, index disclosures later in this report.
| | |
 | | Andrew Geryol Chartered Financial Analyst, Portfolio Manager, is manager of Invesco V.I. High Yield |
| Fund. He joined Invesco in 2011. Mr. Geryol earned a BS in business administration from Miami University. |
| | |
 | | Jennifer Hartviksen Chartered Financial Analyst, Portfolio Manager, is manager of Invesco V.I. High Yield |
| Fund. She is the Head of Canada Fixed Income. Ms. Hartviksen joined Invesco in 2013. She earned a BA in economics from the University of Toronto. |
| | |
 | | Joseph Portera Portfolio Manager, is manager of Invesco V.I. High Yield Fund. He joined Invesco in 2012. |
| Mr. Portera earned BA and MA degrees in Soviet studies and an MA in international political economy and development from Fordham University. |
| | |
 | | Scott Roberts Chartered Financial Analyst, Portfolio Manager, is manager of Invesco V.I. High Yield |
| Fund. He joined Invesco in 2000. Mr. Roberts earned a BBA in finance from the University of Houston. |
Invesco V.I. High Yield Fund
Your Fund’s Long-Term Performance
Results of a $10,000 Investment – Oldest Share Class(es)
Fund and index data from 12/31/07
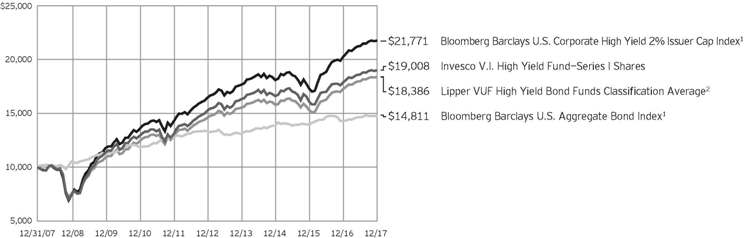
| 1 | Source: FactSet Research Systems Inc. |
Past performance cannot guarantee
comparable future results.
| | | | | |
| Average Annual Total Returns |
As of 12/31/17 | | | | | |
| |
| Series I Shares | | | | | |
| Inception (5/1/98) | | | | 4.34 | % |
| 10 Years | | | | 6.63 | |
| 5 Years | | | | 4.50 | |
| 1 Year | | | | 6.30 | |
| |
| Series II Shares | | | | | |
| Inception (3/26/02) | | | | 6.88 | % |
| 10 Years | | | | 6.39 | |
| 5 Years | | | | 4.27 | |
| 1 Year | | | | 6.12 | |
The performance of the Fund’s Series I and Series II share classes will differ primarily due to different class expenses.
The performance data quoted represent past performance and cannot guarantee comparable future results; current performance may be lower or higher. Please contact your variable product issuer or financial adviser for the most recent month-end variable product performance. Performance
figures reflect Fund expenses, reinvested distributions and changes in net asset value. Investment return and principal value will fluctuate so that you may have a gain or loss when you sell shares.
The total annual Fund operating expense ratio set forth in the most recent Fund prospectus as of the date of this report for Series I and Series II shares was 0.98% and 1.23%, respectively. The expense ratios presented above may vary from the expense ratios presented in other sections of this report that are based on expenses incurred during the period covered by this report.
Invesco V.I. High Yield Fund, a series portfolio of AIM Variable Insurance Funds (Invesco Variable Insurance Funds), is currently offered through insurance companies issuing variable products. You cannot purchase shares of the Fund directly. Performance
figures given represent the Fund and are not intended to reflect actual variable product values. They do not reflect sales charges, expenses and fees assessed in connection with a variable product. Sales charges, expenses and fees, which are determined by the variable product issuers, will vary and will lower the total return.
The most recent month-end performance data at the Fund level, excluding variable product charges, is available at 800 451 4246. As mentioned above, for the most recent month-end performance including variable product charges, please contact your variable product issuer or financial adviser.
Fund performance reflects any applicable fee waivers and/or expense reimbursements. Had the adviser not waived fees and/or reimbursed expenses currently or in the past, returns would have been lower. See current prospectus for more information.
Invesco V.I. High Yield Fund
Invesco V.I. High Yield Fund’s investment objective is total return, comprised of current income and capital appreciation.
| ∎ | | Unless otherwise stated, information presented in this report is as of December 31, 2017, and is based on total net assets. |
| ∎ | | Unless otherwise noted, all data provided by Invesco. |
Principal risks of investing in the Fund
Changing fixed income market conditions risk. The current low interest rate environment was created in part by the Federal Reserve Board (FRB) and certain foreign central banks keeping the federal funds and equivalent foreign rates near, at or below zero. Increases in the federal funds and equivalent foreign rates may expose fixed income markets to heightened volatility and reduced liquidity for certain fixed income investments, particularly those with longer maturities. In addition, decreases in fixed income dealer market-making capacity may also potentially lead to heightened volatility and reduced liquidity in the fixed income markets. As a result, the value of the Fund’s investments and share price may decline. Changes in central bank policies could also result in higher than normal shareholder redemptions, which could potentially increase portfolio turnover and the Fund’s transaction costs.
Collateralized loan obligations risk. CLOs are subject to the risks of substantial losses due to actual defaults by underlying borrowers, which will be greater during periods of economic or financial stress. CLOs may also lose value due to collateral defaults and disappearance of subordinate tranches, market anticipation of defaults, and investor aversion to CLO securities as a class. The risks of CLOs will be greater if the Fund invests in CLOs that hold loans of uncreditworthy borrowers or if the Fund holds subordinate tranches of the CLO that absorbs losses from the defaults before senior tranches. In addition, CLOs are subject to interest rate risk and credit risk.
Convertible securities risk. The market values of convertible securities are affected by market interest rates, the risk of actual issuer default on interest or principal payments and the value of the underlying common stock into which the convertible security may be converted. Additionally, a convertible security is subject to the same types of market and issuer risks as apply to the underlying common stock. In addition, certain convertible securities are subject to involuntary conversions and may undergo principal write-downs upon the occurrence of certain triggering events, and, as a result, are subject to an
increased risk of loss. Convertible securities may be rated below investment grade.
Debt securities risk. The prices of debt securities held by the Fund will be affected by changes in interest rates, the creditworthiness of the issuer and other factors. An increase in prevailing interest rates typically causes the value of existing debt securities to fall and often has a greater impact on longer-duration debt securities and higher quality debt securities. Falling interest rates will cause the Fund to reinvest the proceeds of debt securities that have been repaid by the issuer at lower interest rates. Falling interest rates may also reduce the Fund’s distributable income because interest payments on floating rate debt instruments held by the Fund will decline. The Fund could lose money on investments in debt securities if the issuer or borrower fails to meet its obligations to make interest payments and/or to repay principal in a timely manner. Changes in an issuer’s financial strength, the market’s perception of such strength or in the credit rating of the issuer or the security may affect the value of debt securities. The Adviser’s credit analysis may fail to anticipate such changes, which could result in buying a debt security at an inopportune time or failing to sell a debt security in advance of a price decline or other credit event.
Derivatives risk. The value of a derivative instrument depends largely on (and is derived from) the value of an underlying security, currency, commodity, interest rate, index or other asset (each referred to as an underlying asset). In addition to risks relating to the underlying assets, the use of derivatives may include other, possibly greater, risks, including counterparty, leverage and liquidity risks. Counterparty risk is the risk that the counterparty to the derivative contract will default on its obligation to pay the Fund the amount owed or otherwise perform under the derivative contract. Derivatives create leverage risk because they do not require payment up front equal to the economic exposure created by owning the derivative. As a result, an adverse change in the value of the underlying asset could result in the Fund sustaining a loss that is substantially greater than the amount invested in the derivative, which may make the Fund’s returns more volatile and increase the risk of loss. Derivative
instruments may also be less liquid than more traditional investments and the Fund may be unable to sell or close out its derivative positions at a desirable time or price. This risk may be more acute under adverse market conditions, during which the Fund may be most in need of liquidating its derivative positions. Derivatives may also be harder to value, less tax efficient and subject to changing government regulation that could impact the Fund’s ability to use certain derivatives or their cost. Also, derivatives used for hedging or to gain or limit exposure to a particular market segment may not provide the expected benefits, particularly during adverse market conditions.
Emerging markets securities risk. Emerging markets (also referred to as developing markets) are generally subject to greater market volatility, political, social and economic instability, uncertain trading markets and more governmental limitations on foreign investment than more developed markets. In addition, companies operating in emerging markets may be subject to lower trading volume and greater price fluctuations than companies in more developed markets. Securities law and the enforcement of systems of taxation in many emerging market countries may change quickly and unpredictably. In addition, investments in emerging markets securities may also be subject to additional transaction costs, delays in settlement procedures, and lack of timely information.
Foreign credit exposure risk. US dollar-denominated securities carrying foreign credit exposure may be affected by unfavorable political, economic or governmental developments that could affect payments of principal and interest.
Foreign securities risk. The Fund’s foreign investments may be adversely affected by political and social instability, changes in economic or taxation policies, difficulty in enforcing obligations, decreased liquidity or increased volatility. Foreign investments also involve the risk of the possible seizure, nationalization or expropriation of the issuer or foreign deposits (in which the Fund could lose its entire investments in a certain market) and the possible adoption of foreign governmental restrictions such as exchange controls. Unless the Fund has hedged its foreign securities risk, foreign securities
Invesco V.I. High Yield Fund
risk also involves the risk of negative foreign currency rate fluctuations, which may cause the value of securities denominated in such foreign currency (or other instruments through which the Fund has exposure to foreign currencies) to decline in value. Currency exchange rates may fluctuate significantly over short periods of time. Currency hedging strategies, if used, are not always successful.
High yield debt securities (junk bond) risk. Investments in high yield debt securities (“junk bonds”) and other lower-rated securities will subject the Fund to substantial risk of loss. These securities are considered to be speculative with respect to the issuer’s ability to pay interest and principal when due, are more susceptible to default or decline in market value and are less liquid than investment grade debt securities. Prices of high yield debt securities tend to be very volatile.
Liquidity risk. The Fund may be unable to sell illiquid investments at the time or price it desires and, as a result, could lose its entire investment in such investments. Liquid securities can become illiquid during periods of market stress. If a significant amount of the Fund’s securities become illiquid, the Fund may not be able to timely pay redemption proceeds and may need to sell securities at significantly reduced prices.
Management risk. The Fund is actively managed and depends heavily on the Adviser’s judgment about markets, interest rates or the attractiveness, relative values, liquidity, or potential appreciation of particular investments made for the Fund’s portfolio. The Fund could experience losses if these judgments prove to be incorrect. Additionally, legislative, regulatory, or tax developments may adversely affect management of the Fund and, therefore, the ability of the Fund to achieve its investment objective.
Market risk. The market values of the Fund’s investments, and therefore the value of the Fund’s shares, will go up and down, sometimes rapidly or unpredictably. Market risk may affect a single issuer, industry or section of the economy, or it may affect the market as a whole. Individual stock prices tend to go up and down more dramatically than those of certain other types of investments, such as bonds. During a general downturn in the financial markets, multiple asset classes may decline in value. When markets perform well, there can be no assurance that specific investments held by the Fund will rise in value.
Mortgage- and asset-backed securities risk. Mortgage- and asset-backed securities, including collateralized debt obligations
and collateralized mortgage obligations, are subject to prepayment or call risk, which is the risk that a borrower’s payments may be received earlier or later than expected due to changes in prepayment rates on underlying loans. This could result in the Fund reinvesting these early payments at lower interest rates, thereby reducing the Fund’s income. Mortgage- and asset-backed securities also are subject to extension risk, which is the risk that an unexpected rise in interest rates could reduce the rate of prepayments, causing the price of the mortgage- and asset-backed securities and the Fund’s share price to fall. An unexpectedly high rate of defaults on the mortgages held by a mortgage pool may adversely affect the value of mortgage- backed securities and could result in losses to the Fund. The Fund may invest in mortgage pools that include subprime mortgages, which are loans made to borrowers with weakened credit histories or with lower capacity to make timely payments on their mortgages. Privately issued mortgage-related securities are not subject to the same underwriting requirements as those with government or government-sponsored entity guarantees and, therefore, mortgage loans underlying privately issued mortgage-related securities may have less favorable collateral, credit risk or other underwriting characteristics, and wider variances in interest rate, term, size, purpose and borrower characteristics.
Municipal securities risk. The risk of a municipal obligation generally depends on the financial and credit status of the issuer. Constitutional amendments, legislative enactments, executive orders, administrative regulations, voter initiatives, and the issuer’s regional economic conditions may affect the municipal security’s value, interest payments, repayment of principal and the Fund’s ability to sell the security. Failure of a municipal security issuer to comply with applicable tax requirements may make income paid thereon taxable, resulting in a decline in the security’s value. In addition, there could be changes in applicable tax laws or tax treatments that reduce or eliminate the current federal income tax exemption on municipal securities or otherwise adversely affect the current federal or state tax status of municipal securities.
Preferred securities risk. Preferred securities are subject to issuer-specific and market risks applicable generally to equity securities. Preferred securities also may be subordinated to bonds or other debt instruments, subjecting them to a greater risk of non-payment, may be less
liquid than many other securities, such as common stocks, and generally offer no voting rights with respect to the issuer.
Zero coupon or pay-in-kind securities risk. The value, interest rates, and liquidity of non-cash paying instruments, such as zero coupon and pay-in-kind securities, are subject to greater fluctuation than other types of securities. The higher yields and interest rates on pay-in-kind securities reflect the payment deferral and increased credit risk associated with such instruments and that such investments may represent a higher credit risk than loans that periodically pay interest.
About indexes used in this report
The Bloomberg Barclays U.S. Aggregate Bond Index is an unmanaged index considered representative of the US investment-grade, fixed-rate bond market.
The Bloomberg Barclays U.S. Corporate High Yield 2% Issuer Cap Index is an unmanaged index considered representative of the US high-yield, fixed-rate corporate bond market. Index weights for each issuer are capped at 2%.
The Lipper VUF High Yield Bond Funds Classification Average represents an average of all variable insurance underlying funds in the Lipper High Yield Bond Funds classification.
The Fund is not managed to track the performance of any particular index, including the index(es) described here, and consequently, the performance of the Fund may deviate significantly from the performance of the index(es).
A direct investment cannot be made in an index. Unless otherwise indicated, index results include reinvested dividends, and they do not reflect sales charges. Performance of the peer group, if applicable, reflects fund expenses; performance of a market index does not.
Other information
The returns shown in management’s discussion of Fund performance are based on net asset values calculated for shareholder transactions. Generally accepted accounting principles require adjustments to be made to the net assets of the Fund at period end for financial reporting purposes, and as such, the net asset values for shareholder transactions and the returns based on those net asset values may differ from the net asset values and returns reported in the Financial Highlights. Additionally, the returns and net asset values shown throughout this report are at the Fund level only and do not include variable product issuer charges. If such charges were included, the total returns would be lower.
Invesco V.I. High Yield Fund
Schedule of Investments(a)
December 31, 2017
| | | | | | | | |
| | | Principal
Amount | | | Value | |
U.S. Dollar Denominated Bonds & Notes–92.71% | |
| Advertising–0.51% | |
Lamar Media Corp., Sr. Unsec. Gtd. Global Notes, 5.75%, 02/01/2026 | | $ | 815,000 | | | $ | 870,087 | |
|
| Aerospace & Defense–1.77% | |
Bombardier Inc. (Canada), Sr. Unsec. Notes, | | | | | | | | |
6.13%, 01/15/2023(b) | | | 428,000 | | | | 421,580 | |
7.50%, 03/15/2025(b) | | | 325,000 | | | | 329,062 | |
KLX Inc., Sr. Unsec. Gtd. Notes, 5.88%, 12/01/2022(b) | | | 640,000 | | | | 672,608 | |
TransDigm Inc., Sr. Unsec. Gtd. Sub. Global Notes, | | | | | | | | |
6.50%, 07/15/2024 | | | 157,000 | | | | 161,318 | |
6.50%, 05/15/2025 | | | 1,420,000 | | | | 1,455,500 | |
| | | | | | | | 3,040,068 | |
|
| Agricultural & Farm Machinery–0.59% | |
Titan International, Inc., Sr. Sec. Gtd. First Lien Notes, 6.50%, 11/30/2023(b) | | | 989,000 | | | | 1,008,780 | |
|
| Air Freight & Logistics–0.15% | |
XPO Logistics, Inc., Sr. Unsec. Gtd. Notes, 6.50%, 06/15/2022(b) | | | 249,000 | | | | 260,828 | |
|
| Airlines–0.27% | |
Air Canada (Canada), Sr. Unsec. Gtd. Notes, 7.75%, 04/15/2021(b) | | | 400,000 | | | | 458,000 | |
|
| Alternative Carriers–0.74% | |
Level 3 Financing, Inc., Sr. Unsec. Gtd. Global Notes, | | | | | | | | |
5.25%, 03/15/2026 | | | 753,000 | | | | 740,990 | |
5.38%, 05/01/2025 | | | 540,000 | | | | 540,675 | |
| | | | | | | | 1,281,665 | |
|
| Aluminum–0.78% | |
Alcoa Nederland Holding B.V., Sr. Unsec. Gtd. Notes, 6.75%, 09/30/2024(b) | | | 467,000 | | | | 511,365 | |
Novelis Corp., Sr. Unsec. Gtd. Notes, 6.25%, 08/15/2024(b) | | | 796,000 | | | | 835,800 | |
| | | | | | | | 1,347,165 | |
|
| Apparel Retail–1.56% | |
Gap, Inc. (The), Sr. Unsec. Global Bonds, 5.95%, 04/12/2021 | | | 413,000 | | | | 445,624 | |
Hot Topic, Inc., Sr. Sec. Gtd. First Lien Notes, 9.25%, 06/15/2021(b) | | | 882,000 | | | | 842,310 | |
L Brands, Inc., Sr. Unsec. Gtd. Global Notes, | | | | | | | | |
5.63%, 02/15/2022 | | | 823,000 | | | | 881,639 | |
6.75%, 07/01/2036 | | | 101,000 | | | | 101,505 | |
6.88%, 11/01/2035 | | | 404,000 | | | | 410,060 | |
| | | | | | | | 2,681,138 | |
| | | | | | | | |
| | | Principal
Amount | | | Value | |
| Auto Parts & Equipment–0.72% | |
Dana Financing Luxembourg S.a.r.l., Sr. Unsec. Gtd. Notes, 5.75%, 04/15/2025(b) | | $ | 270,000 | | | $ | 285,188 | |
Dana Inc., Sr. Unsec. Notes, 5.50%, 12/15/2024 | | | 498,000 | | | | 528,502 | |
Delphi Technologies PLC, Sr. Unsec. Gtd. Notes, 5.00%, 10/01/2025(b) | | | 427,000 | | | | 433,405 | |
| | | | | | | | 1,247,095 | |
|
| Automobile Manufacturers–0.00% | |
Motors Liquidation Co., Sr. Unsec. Deb., 0.00%, 07/15/2033(c) (d) | | | 1,060,000 | | | | 0 | |
|
| Automotive Retail–0.78% | |
Lithia Motors, Inc., Sr. Unsec. Gtd. Notes, 5.25%, 08/01/2025(b) | | | 248,000 | | | | 259,160 | |
Murphy Oil USA, Inc., Sr. Unsec. Gtd. Global Notes, 5.63%, 05/01/2027 | | | 472,000 | | | | 497,464 | |
Penske Automotive Group Inc., Sr. Unsec. Sub. Gtd. Notes, 5.50%, 05/15/2026 | | | 579,000 | | | | 588,959 | |
| | | | | | | | 1,345,583 | |
|
| Broadcasting–2.55% | |
Clear Channel Worldwide Holdings Inc., Series B, Sr. Unsec. Gtd. Global Notes, | | | | | | | | |
6.50%, 11/15/2022 | | | 694,000 | | | | 708,747 | |
Sr. Unsec. Gtd. Sub. Global Notes, | | | | | | | | |
7.63%, 03/15/2020 | | | 747,000 | | | | 734,861 | |
Netflix, Inc., Sr. Unsec. Global Notes, 5.75%, 03/01/2024 | | | 505,000 | | | | 538,456 | |
Nexstar Broadcasting, Inc., Sr. Unsec. Gtd. Notes, 5.63%, 08/01/2024(b) | | | 540,000 | | | | 558,900 | |
Sirius XM Radio Inc., Sr. Unsec. Gtd. Notes, | | | | | | | | |
5.38%, 04/15/2025(b) | | | 4,000 | | | | 4,175 | |
5.38%, 07/15/2026(b) | | | 620,000 | | | | 644,025 | |
6.00%, 07/15/2024(b) | | | 568,000 | | | | 602,080 | |
Tribune Media Co., Sr. Unsec. Gtd. Global Notes, 5.88%, 07/15/2022 | | | 581,000 | | | | 599,883 | |
| | | | | | | | 4,391,127 | |
|
| Building Products–0.42% | |
James Hardie International Finance DAC (Ireland), Sr. Unsec. Notes, 4.75%, 01/15/2025(b) | | | 200,000 | | | | 202,500 | |
Standard Industries Inc., Sr. Unsec. Notes, 5.00%, 02/15/2027(b) | | | 515,000 | | | | 527,875 | |
| | | | | | | | 730,375 | |
|
| Cable & Satellite–9.01% | |
AMC Networks Inc., | |
Sr. Unsec. Gtd. Global Notes, | | | | | | | | |
4.75%, 08/01/2025 | | | 127,000 | | | | 126,206 | |
5.00%, 04/01/2024 | | | 500,000 | | | | 507,500 | |
See accompanying Notes to Financial Statements which are an integral part of the financial statements.
Invesco V.I. High Yield Fund
| | | | | | | | |
| | | Principal
Amount | | | Value | |
| Cable & Satellite–(continued) | | | | | | | | |
CCO Holdings LLC/CCO Holdings Capital Corp.,
Sr. Unsec. Global Notes, | | | | | | | | |
5.75%, 09/01/2023 | | $ | 620,000 | | | $ | 637,050 | |
5.75%, 01/15/2024 | | | 40,000 | | | | 41,300 | |
Sr. Unsec. Notes, | | | | | | | | |
5.75%, 02/15/2026(b) | | | 1,395,000 | | | | 1,452,544 | |
CSC Holdings LLC,
Sr. Unsec. Gtd. Notes, | | | | | | | | |
6.63%, 10/15/2025(b) | | | 200,000 | | | | 216,996 | |
Sr. Unsec. Notes, | | | | | | | | |
10.13%, 01/15/2023(b) | | | 1,555,000 | | | | 1,755,206 | |
10.88%, 10/15/2025(b) | | | 445,000 | | | | 529,550 | |
DISH DBS Corp., Sr. Unsec. Gtd. Global Notes, | | | | | | | | |
5.88%, 11/15/2024 | | | 1,314,000 | | | | 1,282,792 | |
7.88%, 09/01/2019 | | | 1,111,000 | | | | 1,191,547 | |
Hughes Satellite Systems Corp., Sr. Unsec. Gtd. Global Notes, 7.63%, 06/15/2021 | | | 1,092,000 | | | | 1,210,755 | |
Intelsat Jackson Holdings S.A. (Luxembourg), | | | | | | | | |
Sr. Unsec. Gtd. Global Bonds, | | | | | | | | |
5.50%, 08/01/2023 | | | 554,000 | | | | 454,280 | |
Sr. Unsec. Gtd. Global Notes, | | | | | | | | |
7.25%, 10/15/2020 | | | 599,000 | | | | 566,055 | |
7.50%, 04/01/2021 | | | 476,000 | | | | 435,540 | |
SFR Group S.A. (France),
Sr. Sec. Gtd. First Lien Bonds, | | | | | | | | |
6.00%, 05/15/2022(b) | | | 905,000 | | | | 917,444 | |
Sr. Sec. Gtd. First Lien Notes, | | | | | | | | |
7.38%, 05/01/2026(b) | | | 764,000 | | | | 789,785 | |
Unitymedia Hessen GmbH & Co. KG/Unitymedia NRW GmbH (Germany), Sr. Sec. Gtd. First Lien Bonds, 5.00%, 01/15/2025(b) | | | 885,000 | | | | 909,337 | |
UPC Holding B.V. (Netherlands), Sr. Sec. First Lien Notes, 5.50%, 01/15/2028(b) | | | 200,000 | | | | 195,000 | |
UPCB Finance IV Ltd. (Netherlands), Sr. Sec. First Lien Notes, 5.38%, 01/15/2025(b) | | | 450,000 | | | | 455,355 | |
Virgin Media Finance PLC (United Kingdom), Sr. Unsec. Gtd. Notes, 6.00%, 10/15/2024(b) | | | 450,000 | | | | 463,500 | |
Virgin Media Secured Finance PLC (United Kingdom), Sr. Sec. Gtd. First Lien Notes, 5.50%, 08/15/2026(b) | | | 299,000 | | | | 307,223 | |
VTR Finance B.V. (Chile), Sr. Sec. First Lien Notes, 6.88%, 01/15/2024(b) | | | 490,000 | | | | 518,175 | |
Ziggo Bond Finance B.V. (Netherlands), Sr. Unsec. Notes, 5.88%, 01/15/2025(b) | | | 400,000 | | | | 396,000 | |
Ziggo Secured Finance B.V. (Netherlands), Sr. Sec. Gtd. First Lien Notes, 5.50%, 01/15/2027(b) | | | 150,000 | | | | 150,188 | |
| | | | | | | | 15,509,328 | |
| | | | | | | | |
| | | Principal
Amount | | | Value | |
| Casinos & Gaming–2.42% | |
Boyd Gaming Corp., Sr. Unsec. Gtd. Global Notes, 6.88%, 05/15/2023 | | $ | 690,000 | | | $ | 733,987 | |
Codere Finance 2 (Luxembourg) S.A. (Spain), Sr. Sec. Gtd. First Lien Notes, 7.63%, 11/01/2021(b) | | | 448,000 | | | | 456,971 | |
MGM Resorts International, Sr. Unsec. Gtd. Notes, | | | | | | | | |
6.00%, 03/15/2023 | | | 280,000 | | | | 303,100 | |
7.75%, 03/15/2022 | | | 519,000 | | | | 592,958 | |
Pinnacle Entertainment, Inc., Sr. Unsec. Global Notes, 5.63%, 05/01/2024 | | | 353,000 | | | | 379,475 | |
Scientific Games International Inc., Sr. Unsec. Gtd. Global Notes, 10.00%, 12/01/2022 | | | 1,045,000 | | | | 1,150,806 | |
Wynn Las Vegas LLC/Wynn Las Vegas Capital Corp., Sr. Unsec. Gtd. Notes, | | | | | | | | |
5.25%, 05/15/2027(b) | | | 144,000 | | | | 146,160 | |
5.50%, 03/01/2025(b) | | | 385,000 | | | | 397,513 | |
| | | | | | | | 4,160,970 | |
|
| Coal & Consumable Fuels–0.29% | |
SunCoke Energy Partners, L.P./ SunCoke Energy Partners Finance Corp., Sr. Unsec. Gtd. Notes, 7.50%, 06/15/2025(b) | | | 469,000 | | | | 492,450 | |
|
| Commodity Chemicals–0.28% | |
Koppers Inc., Sr. Unsec. Gtd. Notes, 6.00%, 02/15/2025(b) | | | 460,000 | | | | 488,750 | |
|
| Construction Machinery & Heavy Trucks–0.75% | |
Meritor Inc., Sr. Unsec. Gtd. Notes, 6.25%, 02/15/2024 | | | 592,000 | | | | 626,040 | |
Oshkosh Corp., Sr. Unsec. Gtd. Global Notes, 5.38%, 03/01/2025 | | | 179,000 | | | | 190,859 | |
Terex Corp., Sr. Unsec. Gtd. Notes, 5.63%, 02/01/2025(b) | | | 456,000 | | | | 477,090 | |
| | | | | | | | 1,293,989 | |
|
| Consumer Finance–2.05% | |
Ally Financial Inc.,
Sr. Unsec. Global Notes, | | | | | | | | |
4.63%, 03/30/2025 | | | 454,000 | | | | 478,403 | |
5.13%, 09/30/2024 | | | 991,000 | | | | 1,073,996 | |
Sr. Unsec. Gtd. Global Notes, | | | | | | | | |
8.00%, 03/15/2020 | | | 325,000 | | | | 359,125 | |
Discover Financial Services, Inc., Series C, Jr. Unsec. Sub. Global Notes, 5.50%(e) | | | 385,000 | | | | 397,031 | |
Navient Corp., Sr. Unsec. Medium-Term Notes, | |
7.25%, 01/25/2022 | | | 345,000 | | | | 370,875 | |
8.00%, 03/25/2020 | | | 785,000 | | | | 850,744 | |
| | | | | | | | 3,530,174 | |
|
| Copper–0.53% | |
First Quantum Minerals Ltd. (Zambia), Sr. Unsec. Gtd. Notes, 7.00%, 02/15/2021(b) | | | 880,000 | | | | 915,200 | |
See accompanying Notes to Financial Statements which are an integral part of the financial statements.
Invesco V.I. High Yield Fund
| | | | | | | | |
| | | Principal
Amount | | | Value | |
| Data Processing & Outsourced Services–0.73% | |
First Data Corp., Sr. Unsec. Gtd. Notes, 7.00%, 12/01/2023(b) | | $ | 1,180,000 | | | $ | 1,250,800 | |
|
| Diversified Banks–1.41% | |
Bank of America Corp., Series K, Jr. Unsec. Sub. Global Notes, 8.00%(e) | | | 197,000 | | | | 197,916 | |
Dresdner Funding Trust I (Germany), REGS, Jr. Unsec. Sub. Euro Notes, 8.15%, 06/30/2031(b) | | | 365,000 | | | | 485,223 | |
JPMorgan Chase & Co., Series I, Jr. Unsec. Sub. Global Notes, 7.90%(e) | | | 445,000 | | | | 451,119 | |
Royal Bank of Scotland Group PLC (The) (United Kingdom), Unsec. Sub. Global Bonds, 5.13%, 05/28/2024 | | | 1,219,000 | | | | 1,294,462 | |
| | | | | | | | 2,428,720 | |
|
| Diversified Chemicals–1.02% | |
Chemours Co. (The), Sr. Unsec. Gtd. Global Notes, | | | | | | | | |
6.63%, 05/15/2023 | | | 1,154,000 | | | | 1,226,125 | |
7.00%, 05/15/2025 | | | 220,000 | | | | 239,800 | |
Trinseo Materials Operating S.C.A./Trinseo Materials Finance, Inc., Sr. Unsec. Gtd. Notes, 5.38%, 09/01/2025(b) | | | 285,000 | | | | 295,687 | |
| | | | | | | | 1,761,612 | |
|
| Diversified Metals & Mining–1.36% | |
Freeport-McMoRan Inc., Sr. Unsec. Gtd. Global Notes, 5.40%, 11/14/2034 | | | 700,000 | | | | 715,750 | |
HudBay Minerals, Inc. (Canada), Sr. Unsec. Gtd. Notes, 7.63%, 01/15/2025(b) | | | 596,000 | | | | 655,600 | |
Teck Resources Ltd. (Canada),
Sr. Unsec. Gtd. Global Notes, | | | | | | | | |
4.75%, 01/15/2022 | | | 513,000 | | | | 538,034 | |
Sr. Unsec. Notes, 6.13%, 10/01/2035 | | | 378,000 | | | | 425,250 | |
| | | | | | | | 2,334,634 | |
|
| Diversified Support Services–0.15% | |
Jaguar Holding Co. II/Pharmaceutical Product Development, LLC, Sr. Unsec. Gtd. Notes, 6.38%, 08/01/2023(b) | | | 250,000 | | | | 253,125 | |
|
| Electric Utilities–0.18% | |
Southern Co. (The), Series B, Jr. Unsec. Sub. Global Notes, 5.50%, 03/15/2057 | | | 286,000 | | | | 303,517 | |
|
| Electrical Components & Equipment–0.67% | |
EnerSys, Sr. Unsec. Gtd. Notes, 5.00%, 04/30/2023(b) | | | 848,000 | | | | 889,340 | |
Sensata Technologies B.V., Sr. Unsec. Gtd. Notes, 5.00%, 10/01/2025(b) | | | 252,000 | | | | 267,750 | |
| | | | | | | | 1,157,090 | |
|
| Electronic Equipment & Instruments–0.20% | |
Itron, Inc., Sr. Unsec. Gtd. Notes, 5.00%, 01/15/2026(b) | | | 336,000 | | | | 338,100 | |
| | | | | | | | |
| | | Principal
Amount | | | Value | |
| Environmental & Facilities Services–0.66% | |
Advanced Disposal Services, Inc., Sr. Unsec. Gtd. Notes, 5.63%, 11/15/2024(b) | | $ | 408,000 | | | $ | 418,200 | |
Core & Main LP, Sr. Unsec. Notes, 6.13%, 08/15/2025(b) | | | 641,000 | | | | 652,218 | |
Wrangler Buyer Corp., Sr. Unsec. Notes, 6.00%, 10/01/2025(b) | | | 68,000 | | | | 70,380 | |
| | | | | | | | 1,140,798 | |
|
| Food Distributors–0.40% | |
US Foods, Inc., Sr. Unsec. Gtd. Notes, 5.88%, 06/15/2024(b) | | | 653,000 | | | | 688,915 | |
|
| Food Retail–1.66% | |
1011778 BC ULC/ New Red Finance, Inc. (Canada), Sec. Gtd. Second Lien Notes, 5.00%, 10/15/2025(b) | | | 1,150,000 | | | | 1,164,375 | |
Albertsons Cos. LLC/ Safeway Inc./New Albertson’s, Inc./Albertson’s LLC, Sr. Unsec. Gtd. Global Notes, 6.63%, 06/15/2024 | | | 783,000 | | | | 751,680 | |
Ingles Markets, Inc., Sr. Unsec. Global Notes, 5.75%, 06/15/2023 | | | 927,000 | | | | 943,222 | |
| | | | | | | | 2,859,277 | |
|
| Gas Utilities–1.45% | |
AmeriGas Partners, L.P./AmeriGas Finance Corp., Sr. Unsec. Global Notes, | | | | | | | | |
5.63%, 05/20/2024 | | | 390,000 | | | | 407,550 | |
5.88%, 08/20/2026 | | | 692,000 | | | | 716,220 | |
Ferrellgas L.P./Ferrellgas Finance Corp., Sr. Unsec. Global Notes, 6.50%, 05/01/2021 | | | 297,000 | | | | 279,551 | |
Suburban Propane Partners, L.P./Suburban Energy Finance Corp., Sr. Unsec. Global Notes, 5.50%, 06/01/2024 | | | 1,105,000 | | | | 1,099,475 | |
| | | | | | | | 2,502,796 | |
|
| General Merchandise Stores–0.17% | |
Dollar Tree, Inc., Sr. Unsec. Gtd. Global Notes, 5.75%, 03/01/2023 | | | 287,000 | | | | 301,171 | |
|
| Health Care Equipment–0.79% | |
Eagle Holding Co. II, LLC, Sr. Unsec. PIK Notes, 8.38% PIK Rate, 7.63% Cash Rate, 05/15/2022(b)(f) | | | 526,000 | | | | 536,520 | |
Hill-Rom Holdings, Inc., Sr. Unsec. Gtd. Notes, 5.00%, 02/15/2025(b) | | | 645,000 | | | | 660,931 | |
Teleflex Inc., Sr. Unsec. Gtd. Global Notes, | | | | | | | | |
4.88%, 06/01/2026 | | | 111,000 | | | | 115,163 | |
5.25%, 06/15/2024 | | | 43,000 | | | | 45,043 | |
| | | | | | | | 1,357,657 | |
|
| Health Care Facilities–3.86% | |
Acadia Healthcare Co., Inc., Sr. Unsec. Gtd. Global Notes, 6.50%, 03/01/2024 | | | 500,000 | | | | 522,500 | |
See accompanying Notes to Financial Statements which are an integral part of the financial statements.
Invesco V.I. High Yield Fund
| | | | | | | | |
| | | Principal
Amount | | | Value | |
| Health Care Facilities–(continued) | |
Community Health Systems, Inc.,
Sr. Sec. Gtd. First Lien Global Notes, | | | | | | | | |
5.13%, 08/01/2021 | | $ | 425,000 | | | $ | 384,625 | |
Sr. Sec. Gtd. First Lien Notes, | | | | | | | | |
6.25%, 03/31/2023 | | | 502,000 | | | | 454,310 | |
Sr. Unsec. Gtd. Global Notes, | | | | | | | | |
6.88%, 02/01/2022 | | | 159,202 | | | | 92,337 | |
8.00%, 11/15/2019 | | | 450,000 | | | | 383,625 | |
HCA Healthcare, Inc., Sr. Unsec. Notes, 6.25%, 02/15/2021 | | | 94,000 | | | | 99,875 | |
HCA, Inc., | | | | | | | | |
Sr. Sec. Gtd. First Lien Global Notes, | | | | | | | | |
5.88%, 03/15/2022 | | | 170,000 | | | | 182,325 | |
Sr. Sec. Gtd. First Lien Notes, | | | | | | | | |
5.25%, 04/15/2025 | | | 918,000 | | | | 973,080 | |
Sr. Unsec. Gtd. Global Notes, | | | | | | | | |
7.50%, 02/15/2022 | | | 334,000 | | | | 376,585 | |
Sr. Unsec. Gtd. Notes, | | | | | | | | |
5.38%, 02/01/2025 | | | 640,000 | | | | 664,000 | |
5.88%, 02/15/2026 | | | 1,110,000 | | | | 1,176,600 | |
HealthSouth Corp., Sr. Unsec. Gtd. Global Notes, 5.75%, 09/15/2025 | | | 640,000 | | | | 668,800 | |
LifePoint Health, Inc., | |
Sr. Unsec. Gtd. Global Notes, | | | | | | | | |
5.38%, 05/01/2024 | | | 555,000 | | | | 552,919 | |
Sr. Unsec. Gtd. Notes, | | | | | | | | |
5.88%, 12/01/2023 | | | 110,000 | | | | 111,512 | |
| | | | | | | | 6,643,093 | |
|
| Health Care Services–3.09% | |
DaVita Inc., Sr. Unsec. Gtd. Global Notes, 5.00%, 05/01/2025 | | | 500,000 | | | | 501,100 | |
Envision Healthcare Corp., Sr. Unsec. Gtd. Notes, 6.25%, 12/01/2024(b) | | | 222,000 | | | | 229,770 | |
MEDNAX, Inc., Sr. Unsec. Gtd. Notes, 5.25%, 12/01/2023(b) | | | 765,000 | | | | 780,300 | |
MPH Acquisition Holdings LLC, Sr. Unsec. Gtd. Notes, 7.13%, 06/01/2024(b) | | | 1,169,000 | | | | 1,247,907 | |
Surgery Center Holdings, Inc., Sr. Unsec. Gtd. Notes, | | | | | | | | |
6.75%, 07/01/2025(b) | | | 233,000 | | | | 221,350 | |
8.88%, 04/15/2021(b) | | | 103,000 | | | | 107,120 | |
Team Health Holdings, Inc., Sr. Unsec. Gtd. Notes, 6.38%, 02/01/2025(b) | | | 460,000 | | | | 412,850 | |
Tenet Healthcare Corp.,
Sec. Gtd. Second Lien Notes, | | | | | | | | |
7.50%, 01/01/2022(b) | | | 103,000 | | | | 108,536 | |
Sr. Unsec. Global Notes, | | | | | | | | |
6.75%, 06/15/2023 | | | 1,114,000 | | | | 1,084,758 | |
8.13%, 04/01/2022 | | | 615,000 | | | | 628,069 | |
| | | | | | | | 5,321,760 | |
|
| Home Improvement Retail–0.57% | |
Hillman Group Inc. (The), Sr. Unsec. Gtd. Notes, 6.38%, 07/15/2022(b) | | | 980,000 | | | | 982,450 | |
| | | | | | | | |
| | | Principal
Amount | | | Value | |
| Homebuilding–2.55% | |
Ashton Woods USA LLC/Ashton Woods Finance Co., Sr. Unsec. Notes, | | | | | | | | |
6.75%, 08/01/2025(b) | | $ | 365,000 | | | $ | 366,369 | |
6.88%, 02/15/2021(b) | | | 446,000 | | | | 456,593 | |
Beazer Homes USA, Inc., Sr. Unsec. Gtd. Global Notes, | | | | | | | | |
6.75%, 03/15/2025 | | | 402,000 | | | | 425,618 | |
8.75%, 03/15/2022 | | | 415,000 | | | | 458,533 | |
CalAtlantic Group, Inc., | | | | | | | | |
Sr. Unsec. Gtd. Global Notes, | | | | | | | | |
8.38%, 01/15/2021 | | | 112,000 | | | | 129,500 | |
Sr. Unsec. Gtd. Notes, | | | | | | | | |
5.25%, 06/01/2026 | | | 183,000 | | | | 194,209 | |
5.38%, 10/01/2022 | | | 554,000 | | | | 596,242 | |
KB Home, Sr. Unsec. Gtd. Notes, | |
7.50%, 09/15/2022 | | | 236,000 | | | | 269,630 | |
8.00%, 03/15/2020 | | | 119,000 | | | | 130,900 | |
Meritage Homes Corp., Sr. Unsec. Gtd. Global Notes, | | | | | | | | |
6.00%, 06/01/2025 | | | 505,000 | | | | 542,875 | |
7.15%, 04/15/2020 | | | 270,000 | | | | 294,975 | |
Taylor Morrison Communities Inc./ Taylor Morrison Holdings II, Inc., Sr. Unsec. Gtd. Notes, 5.88%, 04/15/2023(b) | | | 498,000 | | | | 528,502 | |
| | | | | | | | 4,393,946 | |
|
| Household Products–1.54% | |
Reynolds Group Issuer Inc./LLC, | | | | | | | | |
Sr. Sec. Gtd. First Lien Global Notes, | | | | | | | | |
5.75%, 10/15/2020 | | | 345,971 | | | | 351,593 | |
Sr. Sec. Gtd. First Lien Notes, | | | | | | | | |
5.13%, 07/15/2023(b) | | | 450,000 | | | | 466,313 | |
Sr. Unsec. Gtd. Notes, | | | | | | | | |
7.00%, 07/15/2024(b) | | | 561,000 | | | | 601,883 | |
Spectrum Brands, Inc., Sr. Unsec. Gtd. Global Notes, 5.75%, 07/15/2025 | | | 705,000 | | | | 745,537 | |
Springs Industries, Inc., Sr. Sec. Global Notes, 6.25%, 06/01/2021 | | | 469,000 | | | | 479,553 | |
| | | | | | | | 2,644,879 | |
|
| Independent Power Producers & Energy Traders–1.23% | |
AES Corp. (The), | | | | | | | | |
Sr. Unsec. Global Notes, | | | | | | | | |
8.00%, 06/01/2020 | | | 105,000 | | | | 118,125 | |
Sr. Unsec. Notes, | | | | | | | | |
5.50%, 04/15/2025 | | | 635,000 | | | | 669,925 | |
Calpine Corp., Sr. Unsec. Global Notes, 5.50%, 02/01/2024 | | | 334,000 | | | | 320,640 | |
Dynegy Inc., Sr. Unsec. Gtd. Global Notes, 7.38%, 11/01/2022 | | | 285,000 | | | | 301,387 | |
NRG Energy, Inc., Sr. Unsec. Gtd. Global Notes, | | | | | | | | |
6.25%, 05/01/2024 | | | 495,000 | | | | 520,987 | |
6.63%, 01/15/2027 | | | 175,000 | | | | 185,938 | |
| | | | | | | | 2,117,002 | |
See accompanying Notes to Financial Statements which are an integral part of the financial statements.
Invesco V.I. High Yield Fund
| | | | | | | | |
| | | Principal
Amount | | | Value | |
| Industrial Machinery–0.53% | |
Cleaver-Brooks, Inc., Sr. Sec. Notes, 7.88%, 03/01/2023(b) | | $ | 222,000 | | | $ | 228,105 | |
Mueller Industries, Inc., Unsec. Sub. Deb., 6.00%, 03/01/2027 | | | 429,000 | | | | 440,798 | |
TriMas Corp., Sr. Unsec. Gtd. Notes, 4.88%, 10/15/2025(b) | | | 242,000 | | | | 243,361 | |
| | | | | | | | 912,264 | |
|
| Integrated Oil & Gas–0.23% | |
California Resources Corp., Sec. Gtd. Second Lien Notes, 8.00%, 12/15/2022(b) | | | 469,000 | | | | 388,684 | |
|
| Integrated Telecommunication Services–2.33% | |
CenturyLink, Inc., | | | | | | | | |
Series S, Sr. Unsec. Notes, | | | | | | | | |
6.45%, 06/15/2021 | | | 635,000 | | | | 644,525 | |
Series Y, Sr. Unsec. Global Notes, | | | | | | | | |
7.50%, 04/01/2024 | | | 696,000 | | | | 696,000 | |
Cincinnati Bell Inc., Sr. Unsec. Gtd. Notes, 7.00%, 07/15/2024(b) | | | 629,000 | | | | 625,855 | |
Frontier Communications Corp., Sr. Unsec. Global Notes, | | | | | | | | |
8.50%, 04/15/2020 | | | 673,000 | | | | 560,272 | |
10.50%, 09/15/2022 | | | 680,000 | | | | 515,950 | |
11.00%, 09/15/2025 | | | 415,000 | | | | 307,100 | |
Telecom Italia Capital S.A. (Italy), Sr. Unsec. Gtd. Global Notes, | | | | | | | | |
6.38%, 11/15/2033 | | | 232,000 | | | | 270,860 | |
7.20%, 07/18/2036 | | | 312,000 | | | | 389,220 | |
| | | | | | | | 4,009,782 | |
|
| Internet Software & Services–1.20% | |
CyrusOne L.P./CyrusOne Finance Corp., Sr. Unsec. Gtd. Notes, | | | | | | | | |
5.00%, 03/15/2024(b) | | | 176,000 | | | | 183,040 | |
5.00%, 03/15/2024(b) | | | 166,000 | | | | 172,640 | |
5.38%, 03/15/2027(b) | | | 366,000 | | | | 385,215 | |
Equinix, Inc., Sr. Unsec. Notes, | | | | | | | | |
5.75%, 01/01/2025 | | | 122,000 | | | | 130,083 | |
5.88%, 01/15/2026 | | | 1,106,000 | | | | 1,190,332 | |
| | | | | | | | 2,061,310 | |
|
| Leisure Facilities–0.55% | |
Cedar Fair L.P./Canada’s Wonderland Co./Magnum Management Corp., | | | | | | | | |
Sr. Unsec. Gtd. Global Notes, | | | | | | | | |
5.38%, 06/01/2024 | | | 225,000 | | | | 236,250 | |
Sr. Unsec. Gtd. Notes, | | | | | | | | |
5.38%, 04/15/2027(b) | | | 200,000 | | | | 210,500 | |
Six Flags Entertainment Corp., Sr. Unsec. Gtd. Notes, 4.88%, 07/31/2024(b) | | | 500,000 | | | | 508,750 | |
| | | | | | | | 955,500 | |
| | | | | | | | |
| | | Principal
Amount | | | Value | |
| Leisure Products–0.54% | |
Mattel, Inc., | | | | | | | | |
Sr. Unsec. Global Notes, | | | | | | | | |
5.45%, 11/01/2041 | | $ | 202,000 | | | $ | 168,165 | |
Sr. Unsec. Gtd. Notes, | | | | | | | | |
6.75%, 12/31/2025(b) | | | 647,000 | | | | 657,320 | |
Sr. Unsec. Notes, | | | | | | | | |
6.20%, 10/01/2040 | | | 112,000 | | | | 101,220 | |
| | | | | | | | 926,705 | |
|
| Managed Health Care–0.72% | |
Centene Corp., Sr. Unsec. Notes, 4.75%, 01/15/2025 | | | 315,000 | | | | 321,300 | |
Molina Healthcare, Inc., Sr. Unsec. Gtd. Notes, 4.88%, 06/15/2025(b) | | | 340,000 | | | | 340,850 | |
WellCare Health Plans Inc., Sr. Unsec. Notes, 5.25%, 04/01/2025 | | | 549,000 | | | | 580,568 | |
| | | | | | | | 1,242,718 | |
|
| Metal & Glass Containers–0.76% | |
Ardagh Packaging Finance PLC/Ardagh Holdings USA Inc. (Ireland), Sr. Unsec. Gtd. Notes, | | | | | | | | |
6.00%, 02/15/2025(b) | | | 500,000 | | | | 527,500 | |
7.25%, 05/15/2024(b) | | | 310,000 | | | | 338,675 | |
Berry Global, Inc., | | | | | | | | |
Sec. Gtd. Second Lien Global Notes, | | | | | | | | |
6.00%, 10/15/2022 | | | 90,000 | | | | 94,613 | |
Sec. Gtd. Second Lien Notes, | | | | | | | | |
5.50%, 05/15/2022 | | | 205,000 | | | | 211,406 | |
OI European Group B.V., Sr. Unsec. Gtd. Notes, 4.00%, 03/15/2023(b) | | | 130,000 | | | | 130,500 | |
| | | | | | | | 1,302,694 | |
|
| Movies & Entertainment–0.78% | |
AMC Entertainment Holdings, Inc., Sr. Unsec. Gtd. Sub. Global Notes, 5.75%, 06/15/2025 | | | 860,000 | | | | 854,625 | |
Lions Gate Entertainment Corp., Sr. Unsec. Gtd. Notes, 5.88%, 11/01/2024(b) | | | 466,000 | | | | 494,543 | |
| | | | | | | | 1,349,168 | |
|
| Oil & Gas Drilling–1.19% | |
Ensco PLC, Sr. Unsec. Global Notes, 4.50%, 10/01/2024 | | | 548,000 | | | | 463,060 | |
Noble Holding International Ltd. (United Kingdom), Sr. Unsec. Gtd. Global Notes, 7.75%, 01/15/2024 | | | 472,000 | | | | 408,280 | |
Precision Drilling Corp. (Canada), Sr. Unsec. Gtd. Global Notes, | | | | | | | | |
5.25%, 11/15/2024 | | | 514,000 | | | | 487,015 | |
6.50%, 12/15/2021 | | | 158,000 | | | | 161,752 | |
7.75%, 12/15/2023 | | | 94,000 | | | | 99,170 | |
Transocean Inc., Sr. Unsec. Gtd. Global Notes, 7.50%, 04/15/2031 | | | 483,000 | | | | 432,285 | |
| | | | | | | | 2,051,562 | |
See accompanying Notes to Financial Statements which are an integral part of the financial statements.
Invesco V.I. High Yield Fund
| | | | | | | | |
| | | Principal
Amount | | | Value | |
| Oil & Gas Equipment & Services–0.81% | |
Archrock Partners, L.P./Archrock Partners Finance Corp., Sr. Unsec. Gtd. Global Notes, 6.00%, 10/01/2022 | | $ | 240,000 | | | $ | 241,200 | |
SESI, L.L.C., Sr. Unsec. Gtd. Global Notes, 7.13%, 12/15/2021 | | | 521,000 | | | | 534,676 | |
Weatherford International Ltd., Sr. Unsec. Gtd. Notes, | | | | | | | | |
6.50%, 08/01/2036 | | | 524,000 | | | | 433,610 | |
8.25%, 06/15/2023 | | | 178,000 | | | | 180,225 | |
| | | | | | | | 1,389,711 | |
|
| Oil & Gas Exploration & Production–6.36% | |
Callon Petroleum Co., Sr. Unsec. Gtd. Global Notes, 6.13%, 10/01/2024 | | | 682,000 | | | | 705,870 | |
Continental Resources Inc., Sr. Unsec. Gtd. Global Notes, 3.80%, 06/01/2024 | | | 725,000 | | | | 719,563 | |
Denbury Resources Inc., Sr. Unsec. Gtd. Sub. Notes, 5.50%, 05/01/2022 | | | 323,000 | | | | 222,466 | |
EP Energy LLC/Everest Acquisition Finance Inc., Sr. Sec. Gtd. First Lien Notes, 8.00%, 11/29/2024(b) | | | 420,000 | | | | 435,750 | |
Gulfport Energy Corp., Sr. Unsec. Gtd. Global Notes, 6.00%, 10/15/2024 | | | 697,000 | | | | 700,485 | |
Newfield Exploration Co., Sr. Unsec. Global Notes, 5.63%, 07/01/2024 | | | 341,000 | | | | 368,280 | |
Oasis Petroleum Inc., Sr. Unsec. Gtd. Global Notes, 6.88%, 01/15/2023 | | | 619,000 | | | | 635,249 | |
Parsley Energy LLC/Parsley Finance Corp., Sr. Unsec. Gtd. Notes, 6.25%, 06/01/2024(b) | | | 919,000 | | | | 971,842 | |
QEP Resources, Inc., | | | | | | | | |
Sr. Unsec. Global Notes, | | | | | | | | |
5.25%, 05/01/2023 | | | 225,000 | | | | 228,794 | |
Sr. Unsec. Notes, | | | | | | | | |
6.88%, 03/01/2021 | | | 610,000 | | | | 661,850 | |
Range Resources Corp., Sr. Unsec. Gtd. Global Notes, | | | | | | | | |
4.88%, 05/15/2025 | | | 716,000 | | | | 694,520 | |
5.88%, 07/01/2022 | | | 446,000 | | | | 457,150 | |
RSP Permian, Inc., Sr. Unsec. Gtd. Global Notes, 5.25%, 01/15/2025 | | | 529,000 | | | | 544,870 | |
SM Energy Co., Sr. Unsec. Global Notes, | | | | | | | | |
6.13%, 11/15/2022 | | | 553,000 | | | | 566,134 | |
6.75%, 09/15/2026 | | | 185,000 | | | | 191,475 | |
Southwestern Energy Co., Sr. Unsec. Global Notes, 4.10%, 03/15/2022 | | | 352,000 | | | | 347,600 | |
Whiting Petroleum Corp., Sr. Unsec. Gtd. Global Notes, 6.25%, 04/01/2023 | | | 1,053,000 | | | | 1,081,957 | |
WildHorse Resource Development Corp., Sr. Unsec. Gtd. Global Notes, 6.88%, 02/01/2025 | | | 673,000 | | | | 689,825 | |
WPX Energy Inc., Sr. Unsec. Notes, 5.25%, 09/15/2024 | | | 730,000 | | | | 731,131 | |
| | | | | | | | 10,954,811 | |
| | | | | | | | |
| | | Principal
Amount | | | Value | |
| Oil & Gas Storage & Transportation–3.06% | |
Antero Midstream Partners LP/Antero Midstream Finance Corp., Sr. Unsec. Gtd. Global Notes, 5.38%, 09/15/2024 | | $ | 407,000 | | | $ | 421,245 | |
Antero Resources Corp., Sr. Unsec. Gtd. Global Notes, 5.63%, 06/01/2023 | | | 485,000 | | | | 506,825 | |
Energy Transfer Equity, L.P., Sr. Sec. First Lien Notes, 5.88%, 01/15/2024 | | | 563,000 | | | | 593,965 | |
Energy Transfer Partners, L.P., Series A, Jr. Unsec. Sub. Global Notes, 6.25%(e) | | | 385,000 | | | | 374,653 | |
Holly Energy Partners L.P./Holly Energy Finance Corp., Sr. Unsec. Gtd. Notes, 6.00%, 08/01/2024(b) | | | 457,000 | | | | 478,708 | |
NGPL PipeCo. LLC, Sr. Unsec. Bonds, 4.88%, 08/15/2027(b) | | | 105,000 | | | | 109,331 | |
Plains All American Pipeline, L.P., Series B, Jr. Unsec. Sub. Notes, 6.13%(e) | | | 456,000 | | | | 456,456 | |
SemGroup Corp., Sr. Unsec. Gtd. Notes, 6.38%, 03/15/2025(b) | | | 535,000 | | | | 529,650 | |
Targa Resources Partners L.P./Targa Resources Partners Finance Corp., Sr. Unsec. Gtd. Global Bonds, | | | | | | | | |
5.13%, 02/01/2025 | | | 484,000 | | | | 497,310 | |
5.25%, 05/01/2023 | | | 448,000 | | | | 459,200 | |
Williams Cos., Inc. (The), | | | | | | | | |
Sr. Unsec. Global Notes, | | | | | | | | |
4.55%, 06/24/2024 | | | 460,000 | | | | 479,550 | |
Sr. Unsec. Notes, | | | | | | | | |
7.88%, 09/01/2021 | | | 311,000 | | | | 360,760 | |
| | | | | | | | 5,267,653 | |
|
| Other Diversified Financial Services–0.71% | |
Lincoln Finance Ltd. (Netherlands), Sr. Sec. Gtd. First Lien Notes, 7.38%, 04/15/2021(b) | | | 492,000 | | | | 514,755 | |
LPL Holdings Inc., Sr. Unsec. Gtd. Notes, 5.75%, 09/15/2025(b) | | | 509,000 | | | | 519,180 | |
VFH Parent LLC/Orchestra Co-Issuer Inc., Sec. Gtd. Second Lien Notes, 6.75%, 06/15/2022(b) | | | 171,000 | | | | 180,405 | |
| | | | | | | | 1,214,340 | |
|
| Packaged Foods & Meats–1.38% | |
B&G Foods, Inc., Sr. Unsec. Gtd. Notes, 5.25%, 04/01/2025 | | | 389,000 | | | | 396,644 | |
JBS Investments GmbH (Brazil), Gtd. Notes, 7.25%, 04/03/2024(b) | | | 525,000 | | | | 517,781 | |
JBS USA Lux S.A./JBS USA Finance Inc. (Brazil), Sr. Unsec. Gtd. Notes, 5.75%, 06/15/2025(b) | | | 180,000 | | | | 174,150 | |
Lamb Weston Holdings, Inc., Sr. Unsec. Gtd. Notes, 4.63%, 11/01/2024(b) | | | 420,000 | | | | 434,700 | |
TreeHouse Foods, Inc., Sr. Unsec. Gtd. Notes, 6.00%, 02/15/2024(b) | | | 814,000 | | | | 850,630 | |
| | | | | | | | 2,373,905 | |
See accompanying Notes to Financial Statements which are an integral part of the financial statements.
Invesco V.I. High Yield Fund
| | | | | | | | |
| | | Principal
Amount | | | Value | |
| Paper Packaging–0.58% | |
Graphic Packaging International Inc., Sr. Unsec. Gtd. Notes, | | | | | | | | |
4.13%, 08/15/2024 | | $ | 30,000 | | | $ | 31,200 | |
4.88%, 11/15/2022 | | | 350,000 | | | | 372,750 | |
Plastipak Holdings Inc., Sr. Unsec. Notes, 6.25%, 10/15/2025(b) | | | 580,000 | | | | 598,850 | |
| | | | | | | | 1,002,800 | |
|
| Paper Products–1.37% | |
Clearwater Paper Corp., Sr. Unsec. Gtd. Global Notes, 4.50%, 02/01/2023 | | | 644,000 | | | | 639,975 | |
Mercer International Inc. (Canada), | | | | | | | | |
Sr. Unsec. Global Notes, | | | | | | | | |
6.50%, 02/01/2024 | | | 259,000 | | | | 275,835 | |
7.75%, 12/01/2022 | | | 230,000 | | | | 243,800 | |
Sr. Unsec. Notes, | | | | | | | | |
5.50%, 01/15/2026(b) | | | 162,000 | | | | 164,835 | |
P.H. Glatfelter Co., Sr. Unsec. Gtd. Global Notes, 5.38%, 10/15/2020 | | | 326,000 | | | | 330,482 | |
Rayonier A.M. Products Inc., Sr. Unsec. Gtd. Notes, 5.50%, 06/01/2024(b) | | | 700,000 | | | | 700,875 | |
| | | | | | | | 2,355,802 | |
|
| Pharmaceuticals–1.72% | |
Catalent Pharma Solutions, Inc., Sr. Unsec. Gtd. Notes, 4.88%, 01/15/2026(b) | | | 122,000 | | | | 122,763 | |
Endo DAC/Endo Finance LLC/Endo Finco Inc., Sr. Unsec. Gtd. Notes, 6.00%, 07/15/2023(b) | | | 240,000 | | | | 189,600 | |
Valeant Pharmaceuticals International, Inc., | | | | | | | | |
Sr. Sec. Gtd. First Lien Notes, | | | | | | | | |
5.50%, 11/01/2025(b) | | | 348,000 | | | | 355,830 | |
Sr. Unsec. Gtd. Notes, | | | | | | | | |
5.63%, 12/01/2021(b) | | | 16,000 | | | | 15,700 | |
5.88%, 05/15/2023(b) | | | 200,000 | | | | 185,750 | |
6.13%, 04/15/2025(b) | | | 410,000 | | | | 376,687 | |
7.25%, 07/15/2022(b) | | | 485,000 | | | | 492,275 | |
7.50%, 07/15/2021(b) | | | 1,200,000 | | | | 1,225,500 | |
| | | | | | | | 2,964,105 | |
|
| Restaurants–0.67% | |
Aramark Services, Inc., Sr. Unsec. Gtd. Notes, 5.00%, 04/01/2025(b) | | | 195,000 | | | | 206,466 | |
Carrols Restaurant Group, Inc., Sec. Gtd. Second Lien Global Notes, 8.00%, 05/01/2022 | | | 660,000 | | | | 697,950 | |
KFC Holding Co./Pizza Hut Holdings LLC/Taco Bell of America LLC, Sr. Unsec. Gtd. Notes, 4.75%, 06/01/2027(b) | | | 241,000 | | | | 247,025 | |
| | | | | | | | 1,151,441 | |
|
| Security & Alarm Services–0.82% | |
ADT Corp. (The), Sr. Sec. Gtd. First Lien Global Notes, 6.25%, 10/15/2021 | | | 250,000 | | | | 275,000 | |
Prime Security Services Borrower, LLC/Prime Finance, Inc., Sec. Gtd. Second Lien Notes, 9.25%, 05/15/2023(b) | | | 1,030,000 | | | | 1,145,875 | |
| | | | | | | | 1,420,875 | |
| | | | | | | | |
| | | Principal
Amount | | | Value | |
| Semiconductor Equipment–0.16% | |
Entegris Inc., Sr. Unsec. Gtd. Notes, 4.63%, 02/10/2026(b) | | $ | 274,000 | | | $ | 279,480 | |
|
| Semiconductors–0.38% | |
Micron Technology, Inc., Sr. Unsec. Global Notes, 5.50%, 02/01/2025 | | | 618,000 | | | | 649,673 | |
|
| Specialized Consumer Services–0.85% | |
ServiceMaster Co., LLC (The), | | | | | | | | |
Sr. Unsec. Gtd. Notes, | | | | | | | | |
5.13%, 11/15/2024(b) | | | 272,000 | | | | 276,080 | |
Sr. Unsec. Notes, | | | | | | | | |
7.45%, 08/15/2027 | | | 1,086,000 | | | | 1,181,025 | |
| | | | | | | | 1,457,105 | |
|
| Specialized Finance–1.85% | |
AerCap Global Aviation Trust (Ireland), Jr. Unsec. Gtd. Sub. Notes, 6.50%, 06/15/2045(b) | | | 434,000 | | | | 476,315 | |
Aircastle Ltd., | | | | | | | | |
Sr. Unsec. Global Notes, | | | | | | | | |
7.63%, 04/15/2020 | | | 160,000 | | | | 175,400 | |
Sr. Unsec. Notes, | | | | | | | | |
5.00%, 04/01/2023 | | | 396,000 | | | | 418,275 | |
5.50%, 02/15/2022 | | | 512,000 | | | | 551,040 | |
CIT Group Inc., Sr. Unsec. Global Notes, | | | | | | | | |
5.00%, 08/15/2022 | | | 165,000 | | | | 175,313 | |
5.00%, 08/01/2023 | | | 756,000 | | | | 807,030 | |
MSCI Inc., Sr. Unsec. Gtd. Notes, | |
5.25%, 11/15/2024(b) | | | 415,000 | | | | 439,381 | |
5.75%, 08/15/2025(b) | | | 140,000 | | | | 151,025 | |
| | | | | | | | 3,193,779 | |
|
| Specialized REIT’s–0.40% | |
Iron Mountain Inc., Sr. Unsec. Gtd. Notes, 6.00%, 08/15/2023 | | | 416,000 | | | | 436,800 | |
Iron Mountain US Holdings, Inc., Sr. Unsec. Gtd. Notes, 5.38%, 06/01/2026(b) | | | 248,000 | | | | 256,060 | |
| | | | | | | | 692,860 | |
|
| Specialty Chemicals–1.80% | |
Axalta Coating Systems, LLC, Sr. Unsec. Gtd. Notes, 4.88%, 08/15/2024(b) | | | 472,000 | | | | 496,780 | |
GCP Applied Technologies Inc., Sr. Unsec. Gtd. Notes, 9.50%, 02/01/2023(b) | | | 516,000 | | | | 574,050 | |
Kraton Polymers LLC/Kraton Polymers Capital Corp., Sr. Unsec. Gtd. Notes, 10.50%, 04/15/2023(b) | | | 596,000 | | | | 676,460 | |
Platform Specialty Products Corp., Sr. Unsec. Gtd. Notes, 5.88%, 12/01/2025(b) | | | 627,000 | | | | 623,081 | |
PQ Corp., Sr. Unsec. Gtd. Notes, 5.75%, 12/15/2025(b) | | | 83,000 | | | | 84,660 | |
Valvoline Inc., Sr. Unsec. Gtd. Global Notes, 5.50%, 07/15/2024 | | | 388,000 | | | | 413,220 | |
See accompanying Notes to Financial Statements which are an integral part of the financial statements.
Invesco V.I. High Yield Fund
| | | | | | | | |
| | | Principal
Amount | | | Value | |
| Specialty Chemicals–(continued) | |
Venator Finance S.a.r.l./Venator Materials Corp., Sr. Unsec. Gtd. Notes, 5.75%, 07/15/2025(b) | | $ | 215,000 | | | $ | 227,900 | |
| | | | | | | | 3,096,151 | |
|
| Steel–1.10% | |
ArcelorMittal (Luxembourg), Sr. Unsec. Global Notes, 7.50%, 10/15/2039 | | | 421,000 | | | | 540,985 | |
Steel Dynamics, Inc., Sr. Unsec. Gtd. Global Notes, 5.00%, 12/15/2026 | | | 308,000 | | | | 326,480 | |
United States Steel Corp., Sr. Unsec. Global Notes, 6.88%, 08/15/2025 | | | 981,000 | | | | 1,028,873 | |
| | | | | | | | 1,896,338 | |
|
| Technology Distributors–0.32% | |
CDW LLC/CDW Finance Corp., Sr. Unsec. Gtd. Notes, 5.00%, 09/01/2025 | | | 538,000 | | | | 559,520 | |
|
| Technology Hardware, Storage & Peripherals–2.09% | |
CommScope Technologies LLC, Sr. Unsec. Gtd. Notes, 6.00%, 06/15/2025(b) | | | 502,000 | | | | 535,885 | |
Dell International LLC/EMC Corp., Sr. Unsec. Gtd. Notes, 7.13%, 06/15/2024(b) | | | 1,047,000 | | | | 1,146,718 | |
Diebold Nixdorf, Inc., Sr. Unsec. Gtd. Global Notes, 8.50%, 04/15/2024 | | | 569,000 | | | | 606,696 | |
Western Digital Corp., Sr. Unsec. Gtd. Global Notes, 10.50%, 04/01/2024 | | | 1,134,000 | | | | 1,316,858 | |
| | | | | | | | 3,606,157 | |
|
| Trading Companies & Distributors–1.39% | |
BMC East, LLC, Sr. Sec. Gtd. First Lien Notes, 5.50%, 10/01/2024(b) | | | 649,000 | | | | 673,338 | |
H&E Equipment Services, Inc., Sr. Unsec. Gtd. Notes, 5.63%, 09/01/2025(b) | | | 791,000 | | | | 828,572 | |
Herc Rentals Inc., Sec. Gtd. Second Lien Notes, 7.75%, 06/01/2024(b) | | | 647,000 | | | | 713,317 | |
United Rentals North America, Inc., | | | | | | | | |
Sr. Unsec. Gtd. Global Notes, | | | | | | | | |
5.50%, 07/15/2025 | | | 41,000 | | | | 43,614 | |
Sr. Unsec. Gtd. Notes, | | | | | | | | |
5.88%, 09/15/2026 | | | 120,000 | | | | 128,850 | |
| | | | | | | | 2,387,691 | |
|
| Trucking–1.03% | |
Avis Budget Car Rental LLC/Avis Budget Finance Inc., Sr. Unsec. Gtd. Notes, | | | | | | | | |
5.25%, 03/15/2025(b) | | | 305,000 | | | | 303,094 | |
6.38%, 04/01/2024(b) | | | 150,000 | | | | 156,795 | |
Hertz Corp. (The), Sec. Gtd. Second Lien Notes, 7.63%, 06/01/2022(b) | | | 193,000 | | | | 202,650 | |
Kenan Advantage Group Inc. (The), Sr. Unsec. Notes, 7.88%, 07/31/2023(b) | | | 1,068,000 | | | | 1,110,720 | |
| | | | | | | | 1,773,259 | |
| | | | | | | | |
| | | Principal Amount | | | Value | |
| Wireless Telecommunication Services–5.17% | |
Altice Financing S.A. (Luxembourg), | | | | | | | | |
Sr. Sec. Gtd. First Lien Bonds, | | | | | | | | |
7.50%, 05/15/2026(b) | | $ | 430,000 | | | $ | 459,025 | |
Sr. Sec. Gtd. First Lien Notes, | | | | | | | | |
6.63%, 02/15/2023(b) | | | 800,000 | | | | 839,680 | |
Altice Luxembourg S.A. (Luxembourg), | | | | | | | | |
Sr. Unsec. Gtd. Notes, | | | | | | | | |
7.63%, 02/15/2025(b) | | | 207,000 | | | | 198,979 | |
7.75%, 05/15/2022(b) | | | 700,000 | | | | 686,875 | |
Altice US Finance I Corp., Sr. Sec. Notes, 5.50%, 05/15/2026(b) | | | 440,000 | | | | 449,350 | |
CB Escrow Corp., Sr. Unsec. Notes, 8.00%, 10/15/2025(b) | | | 94,000 | | | | 95,880 | |
SBA Communications Corp., Sr. Unsec. Global Notes, | | | | | | | | |
4.88%, 07/15/2022 | | | 178,000 | | | | 183,340 | |
4.88%, 09/01/2024 | | | 325,000 | | | | 334,750 | |
Sprint Corp., Sr. Unsec. Gtd. Global Notes, | | | | | | | | |
7.25%, 09/15/2021 | | | 1,566,000 | | | | 1,661,917 | |
7.63%, 02/15/2025 | | | 535,000 | | | | 561,750 | |
7.88%, 09/15/2023 | | | 1,314,000 | | | | 1,402,695 | |
T-Mobile USA, Inc., | | | | | | | | |
Sr. Unsec. Gtd. Global Bonds, | | | | | | | | |
6.50%, 01/15/2026 | | | 868,000 | | | | 949,375 | |
Sr. Unsec. Gtd. Global Notes, | | | | | | | | |
6.38%, 03/01/2025 | | | 647,000 | | | | 693,908 | |
Wind Tre S.p.A. (Italy), Sr. Sec. Gtd. First Lien Notes, 5.00%, 01/20/2026(b) | | | 400,000 | | | | 382,400 | |
| | | | | | | | 8,899,924 | |
Total U.S. Dollar Denominated Bonds & Notes
(Cost $162,996,827) | | | | 159,621,881 | |
| | |
| | | Shares | | | | |
|
| Exchange-Traded Fund–2.16% | |
SPDR® Bloomberg Barclays Short Term High Yield Bond ETF (Cost $3,780,600) | | | 135,000 | | | | 3,720,600 | |
| | |
| | | Principal Amount | | | | |
|
Variable Rate Senior Loan Interests–1.28%(g) | |
| Electronic Equipment & Instruments–0.47% | |
Itron, Inc., Bridge Loan,
—%, 06/30/2018(c) (h) | | $ | 812,000 | | | | 812,000 | |
|
| Food & Drug Retailers–0.81% | |
Albertson’s LLC, Term Loan B-4, 4.10% (1 mo. USD LIBOR + 2.75%), 08/25/2021 | | | 1,420,863 | | | | 1,394,783 | |
Total Variable Rate Senior Loan Interests
(Cost $2,185,906) | | | | 2,206,783 | |
|
Non-U.S. Dollar Denominated Bonds & Notes–0.56%(i) | |
| Food Retail–0.26% | |
Iceland Bondco PLC (United Kingdom), REGS, Sr. Sec. Gtd. Euro Notes, 4.63%, 03/15/2025(b) GBP | | GBP | 350,000 | | | | 447,703 | |
See accompanying Notes to Financial Statements which are an integral part of the financial statements.
Invesco V.I. High Yield Fund
| | | | | | | | |
| | | Principal Amount | | | Value | |
| Health Care Services–0.30% | |
Synlab Unsecured Bondco PLC (United Kingdom), REGS, Sr. Unsec. Gtd. Euro Bonds, 8.25%, 07/01/2023(b) | | EUR | 400,000 | | | $ | 522,859 | |
Total Non-U.S. Dollar Denominated Bonds & Notes
(Cost $910,828) | | | | 970,562 | |
|
U.S. Treasury Bills–0.22%(j)(k) | |
1.05%, 02/01/2018 | | $ | 5,000 | | | | 4,995 | |
1.09%, 02/01/2018 | | | 365,000 | | | | 364,616 | |
Total U.S. Treasury Securities
(Cost $369,629) | | | | 369,611 | |
| | |
| | | Shares | | | | |
|
Preferred Stock–0.07% | |
| Specialized Finance–0.07% | |
CIT Group Inc., Series A, 5.80% Pfd. (Cost $120,000) | | | 120,000 | | | | 123,900 | |
|
Common Stocks & Other Equity Interests–0.00% | |
| Automobile Manufacturers–0.00% | |
Motors Liquidation Co.
GUC Trust(l) | | | 1 | | | | 9 | |
|
| Broadcasting–0.00% | |
Adelphia Recovery Trust–Series ACC-1(m) | | | 318,570 | | | | 32 | |
Adelphia Recovery
Trust–Series Arahova(m) | | | 109,170 | | | | 11 | |
| | | | | | | | 43 | |
| | | | | | | | |
| | | Shares | | | Value | |
| Diversified Support Services–0.00% | |
ACC Claims Holdings, LLC(l) | | | 269,616 | | | $ | 944 | |
Total Common Stocks & Other Equity Interests
(Cost $143,574) | | | | 996 | |
|
Money Market Funds–2.05% | |
Invesco Government & Agency Portfolio–Institutional Class, 1.18%(n) | | | 1,232,999 | | | | 1,232,999 | |
Invesco Liquid Assets Portfolio–Institutional Class, 1.40%(n) | | | 880,540 | | | | 880,628 | |
Invesco Treasury Portfolio–Institutional Class, 1.17%(n) | | | 1,409,142 | | | | 1,409,142 | |
Total Money Market Funds
(Cost $3,522,812) | | | | 3,522,769 | |
TOTAL INVESTMENTS IN SECURITIES–99.05% (Cost $174,030,176) | | | | | | | 170,537,102 | |
OTHER ASSETS LESS LIABILITIES–0.95% | | | | | | | 1,636,423 | |
NET ASSETS–100.00% | | | | | | $ | 172,173,525 | |
Investment Abbreviations:
| | |
| Deb. | | – Debentures |
| ETF | | – Exchange-Traded Fund |
| EUR | | – Euro |
| GBP | | – British Pound |
| Gtd. | | – Guaranteed |
| GUC | | – General Unsecured Creditors |
| Jr. | | – Junior |
| LIBOR | | – London Interbank Offered Rate |
| Pfd. | | – Preferred |
| PIK | | – Pay-in-Kind |
| REGS | | – Regulation S |
| REIT | | – Real Estate Investment Trust |
| Sec. | | – Secured |
| SPDR | | – Standard & Poor’s Depositary Receipt |
| Sr. | | – Senior |
| Sub. | | – Subordinated |
| Unsec. | | – Unsecured |
| USD | | – United States Dollar |
See accompanying Notes to Financial Statements which are an integral part of the financial statements.
Invesco V.I. High Yield Fund
Notes to Schedule of Investments:
| (a) | Industry and/or sector classifications used in this report are generally according to the Global Industry Classification Standard, which was developed by and is the exclusive property and a service mark of MSCI Inc. and Standard & Poor’s. |
| (b) | Security purchased or received in a transaction exempt from registration under the Securities Act of 1933, as amended (the “1933 Act”). The security may be resold pursuant to an exemption from registration under the 1933 Act, typically to qualified institutional buyers. The aggregate value of these securities at December 31, 2017 was $67,920,748, which represented 39.45% of the Fund’s Net Assets. |
| (c) | Security valued using significant unobservable inputs (Level 3). See Note 3. |
| (d) | Defaulted security. Currently, the issuer is partially or fully in default with respect to interest payments. The value of this security at December 31, 2017 represented less than 1% of the Fund’s Net Assets. |
| (e) | Perpetual bond with no specified maturity date. |
| (f) | All or a portion of this security is Pay-in-Kind. Pay-in-Kind securities pay interest income in the form of securities. |
| (g) | Variable rate senior loan interests are, at present, not readily marketable, not registered under the 1933 Act and may be subject to contractual and legal restrictions on sale. Variable rate senior loan interests in the Fund’s portfolio generally have variable rates which adjust to a base, such as the London Interbank Offered Rate ("LIBOR"), on set dates, typically every 30 days but not greater than one year; and/or have interest rates that float at a margin above a widely recognized base lending rate such as the Prime Rate of a designated U.S. bank. |
| (h) | This variable rate interest will settle after December 31, 2017, at which time the interest rate will be determined. |
| (i) | Foreign denominated security. Principal amount is denominated in the currency indicated. |
| (j) | Security traded on a discount basis. The interest rate shown represents the discount rate at the time of purchase by the Fund. |
| (k) | All or a portion of the value was designated as collateral to cover margin requirements for swap agreements. See Note 1N. |
| (l) | Non-income producing security. |
| (m) | Acquired as part of the Adelphia Communications bankruptcy reorganization. |
| (n) | The money market fund and the Fund are affiliated by having the same investment adviser. The rate shown is the 7-day SEC standardized yield as of December 31, 2017. |
| | | | | | | | | | | | | | | | | | | | | | |
| Open Forward Foreign Currency Contracts | |
Settlement
Date | | Counterparty | | Contract to | | | Unrealized
Appreciation
(Depreciation) | |
| | | Deliver | | | Receive | | |
02/28/2018 | | Barclays Bank PLC | | | EUR | | | | 290,478 | | | | USD | | | | 343,113 | | | $ | (6,659 | ) |
02/28/2018 | | Barclays Bank PLC | | | GBP | | | | 353,033 | | | | USD | | | | 469,056 | | | | (8,505 | ) |
Total Forward Foreign Currency Contracts — Currency Risk | | | | | | | | | | | | | | | | | | $ | (15,164 | ) |
| | | | | | | | | | | | | | | | | | | | | | | | | | | | | | | | | | | | | | | | |
| Open Centrally Cleared Credit Default Swap Agreements — Credit Risk | |
| Reference Entity | | Buy/Sell Protection | | | (Pay)/Receive Fixed Rate | | | Payment
Frequency | | | Maturity Date | | | Implied Credit
Spread(a) | | | Notional Value | | | Upfront
Payments
Paid
(Received) | | | Value | | | Unrealized Appreciation(b) | |
Markit CDX North America | |
High Yield Index, Series 28, Version 1 | | | Sell | | | | 5.00 | % | | | Quarterly | | | | 06/20/2022 | | | | 2.79 | % | | | USD | | | | 6,930,000 | | | $ | 441,591 | | | $ | 607,840 | | | $ | 166,249 | |
Currency Abbreviations:
| | |
| EUR | | – Euro |
| GBP | | – British Pound Sterling |
| USD | | – U.S. Dollar |
| (a) | Implied credit spreads represent the current level, as of December 31, 2017, at which protection could be bought or sold given the terms of the existing credit default swap agreement and serve as an indicator of the current status of the payment/performance risk of the credit default swap agreement. An implied credit spread that has widened or increased since entry into the initial agreement may indicate a deteriorating credit profile and increased risk of default for the reference entity. A declining or narrowing spread may indicate an improving credit profile or decreased risk of default for the reference entity. Alternatively, credit spreads may increase or decrease reflecting the general tolerance for risk in the credit markets generally. |
| (b) | The daily variation margin receivable at period end is recorded in the Statement of Assets and Liabilities. |
See accompanying Notes to Financial Statements which are an integral part of the financial statements.
Invesco V.I. High Yield Fund
Statement of Assets and Liabilities
December 31, 2017
Statement of Operations
For the year ended December 31, 2017
| | | | |
Assets: | | | | |
Investments in securities, at value (Cost $170,507,364) | | $ | 167,014,333 | |
Investments in affiliated money market funds, at value (Cost $3,522,812) | | | 3,522,769 | |
Other investments: | | | | |
Variation margin receivable — centrally cleared swap agreements | | | 9,464 | |
Foreign currencies, at value (Cost $501,973) | | | 511,767 | |
Receivable for: | | | | |
Investments sold | | | 2,568 | |
Fund shares sold | | | 53,739 | |
Dividends and interest | | | 2,664,808 | |
Investment for trustee deferred compensation and retirement plans | | | 83,008 | |
Total assets | | | 173,862,456 | |
| |
Liabilities: | | | | |
Other investments: | | | | |
Unrealized depreciation on forward foreign currency contracts outstanding | | | 15,164 | |
Payable for: | | | | |
Investments purchased | | | 1,203,516 | |
Fund shares reacquired | | | 111,663 | |
Accrued fees to affiliates | | | 128,596 | |
Accrued trustees’ and officers’ fees and benefits | | | 670 | |
Accrued other operating expenses | | | 141,525 | |
Trustee deferred compensation and retirement plans | | | 87,797 | |
Total liabilities | | | 1,688,931 | |
Net assets applicable to shares outstanding | | $ | 172,173,525 | |
| |
Net assets consist of: | | | | |
Shares of beneficial interest | | $ | 177,501,503 | |
Undistributed net investment income | | | 8,624,103 | |
Undistributed net realized gain (loss) | | | (10,620,398 | ) |
Net unrealized appreciation (depreciation) | | | (3,331,683 | ) |
| | | $ | 172,173,525 | |
| |
Net Assets: | | | | |
Series I | | $ | 80,371,910 | |
Series II | | $ | 91,801,615 | |
|
Shares outstanding, no par value,
with an unlimited number of shares authorized: | |
Series I | | | 14,594,093 | |
Series II | | | 16,802,382 | |
Series I: | | | | |
Net asset value per share | | $ | 5.51 | |
Series II: | | | | |
Net asset value per share | | $ | 5.46 | |
| | | | |
Investment income: | | | | |
Interest (net of foreign withholding taxes of $464) | | $ | 10,407,213 | |
Dividends | | | 209,727 | |
Dividends from affiliates | | | 83,649 | |
Total investment income | | | 10,700,589 | |
| |
Expenses: | | | | |
Advisory fees | | | 1,168,242 | |
Administrative services fees | | | 329,719 | |
Custodian fees | | | 12,639 | |
Distribution fees — Series II | | | 220,445 | |
Transfer agent fees | | | 27,565 | |
Trustees’ and officers’ fees and benefits | | | 23,561 | |
Reports to shareholders | | | 29,214 | |
Professional services fees | | | 272,710 | |
Other | | | 7,856 | |
Total expenses | | | 2,091,951 | |
Less: Fees waived | | | (16,777 | ) |
Net expenses | | | 2,075,174 | |
Net investment income | | | 8,625,415 | |
| |
Realized and unrealized gain (loss) from: | | | | |
Net realized gain (loss) from: | | | | |
Investment securities | | | 1,796,369 | |
Foreign currencies | | | 67,772 | |
Forward foreign currency contracts | | | (110,931 | ) |
Futures contracts | | | (413,456 | ) |
Swap agreements | | | 125,387 | |
| | | | 1,465,141 | |
Change in net unrealized appreciation (depreciation) of: | | | | |
Investment securities | | | 588,888 | |
Foreign currencies | | | 11,367 | |
Forward foreign currency contracts | | | (23,828 | ) |
Futures contracts | | | 24,152 | |
Swap agreements | | | 166,249 | |
| | | | 766,828 | |
Net realized and unrealized gain | | | 2,231,969 | |
Net increase in net assets resulting from operations | | $ | 10,857,384 | |
See accompanying Notes to Financial Statements which are an integral part of the financial statements.
Invesco V.I. High Yield Fund
Statement of Changes in Net Assets
For the years ended December 31, 2017 and 2016
| | | | | | | | |
| | | 2017 | | | 2016 | |
Operations: | | | | | | | | |
Net investment income | | $ | 8,625,415 | | | $ | 8,396,076 | |
Net realized gain (loss) | | | 1,465,141 | | | | (5,542,632 | ) |
Change in net unrealized appreciation | | | 766,828 | | | | 13,733,616 | |
Net increase in net assets resulting from operations | | | 10,857,384 | | | | 16,587,060 | |
| | |
Distributions to shareholders from net investment income: | | | | | | | | |
Series I | | | (4,535,246 | ) | | | (4,133,290 | ) |
Series ll | | | (3,468,057 | ) | | | (3,068,973 | ) |
Total distributions from net investment income | | | (8,003,303 | ) | | | (7,202,263 | ) |
| | |
Share transactions–net: | | | | | | | | |
Series l | | | (15,580,462 | ) | | | 16,319,925 | |
Series ll | | | 7,275,758 | | | | 7,485,826 | |
Net increase (decrease) in net assets resulting from share transactions | | | (8,304,704 | ) | | | 23,805,751 | |
Net increase (decrease) in net assets | | | (5,450,623 | ) | | | 33,190,548 | |
| | |
Net assets: | | | | | | | | |
Beginning of year | | | 177,624,148 | | | | 144,433,600 | |
End of year (includes undistributed net investment income of $8,624,103 and $7,849,198, respectively) | | $ | 172,173,525 | | | $ | 177,624,148 | |
Notes to Financial Statements
December 31, 2017
NOTE 1—Significant Accounting Policies
Invesco V.I. High Yield Fund (the “Fund”) is a series portfolio of AIM Variable Insurance Funds (Invesco Variable Insurance Funds) (the “Trust”). The Trust is a Delaware statutory trust registered under the Investment Company Act of 1940, as amended (the “1940 Act”), as an open-end series management investment company consisting of twenty-four separate portfolios, (each constituting a “Fund”). The assets, liabilities and operations of each portfolio are accounted for separately. Information presented in these financial statements pertains only to the Fund. Matters affecting each Fund or class will be voted on exclusively by the shareholders of such Fund or class. Current Securities and Exchange Commission (“SEC”) guidance, however, requires participating insurance companies offering separate accounts to vote shares proportionally in accordance with the instructions of the contract owners whose investments are funded by shares of each Fund or class.
The Fund’s investment objective is total return, comprised of current income and capital appreciation.
The Fund currently offers two classes of shares, Series I and Series II, both of which are offered to insurance company separate accounts funding variable annuity contracts and variable life insurance policies (“variable products”).
The Fund is an investment company and accordingly follows the investment company accounting and reporting guidance in accordance with Financial Accounting Standards Board Accounting Standards Codification Topic 946, Financial Services – Investment Companies.
The following is a summary of the significant accounting policies followed by the Fund in the preparation of its financial statements.
| A. | Security Valuations — Securities, including restricted securities, are valued according to the following policy. |
Debt obligations (including convertible securities) and unlisted equities are fair valued using an evaluated quote provided by an independent pricing service. Evaluated quotes provided by the pricing service may be determined without exclusive reliance on quoted prices, and may reflect appropriate factors such as institution-size trading in similar groups of securities, developments related to specific securities, dividend rate (for unlisted equities), yield (for debt obligations), quality, type of issue, coupon rate (for debt obligations), maturity (for debt obligations), individual trading characteristics and other market data. Pricing services generally value debt obligations assuming orderly transactions of institutional round lot size, but a fund may hold or transact in the same securities in smaller, odd lot sizes. Odd lots often trade at lower prices than institutional round lots. Debt obligations are subject to interest rate and credit risks. In addition, all debt obligations involve some risk of default with respect to interest and/or principal payments.
Variable rate senior loan interests are fair valued using quotes provided by an independent pricing service. Quotes provided by the pricing service may reflect appropriate factors such as ratings, tranche type, industry, company performance, spread, individual trading characteristics, institution-size trading in similar groups of securities and other market data.
A security listed or traded on an exchange (except convertible securities) is valued at its last sales price or official closing price as of the close of the customary trading session on the exchange where the security is principally traded, or lacking any sales or official closing price on a particular day, the security may be valued at the closing bid price on that day. Securities traded in the over-the-counter market are valued based on prices furnished by independent pricing services or market makers. When such securities are valued by an independent pricing service they may be considered fair valued. Futures contracts are valued at the final settlement price set by an exchange on which they are principally traded. Listed options are valued at the mean between the last bid and asked prices from the exchange on which they are principally traded. Options not
Invesco V.I. High Yield Fund
listed on an exchange are valued by an independent source at the mean between the last bid and asked prices. For purposes of determining net asset value (“NAV”) per share, futures and option contracts generally are valued 15 minutes after the close of the customary trading session of the New York Stock Exchange (“NYSE”).
Investments in open-end and closed-end registered investment companies that do not trade on an exchange are valued at the end-of-day net asset value per share. Investments in open-end and closed-end registered investment companies that trade on an exchange are valued at the last sales price or official closing price as of the close of the customary trading session on the exchange where the security is principally traded.
Swap agreements are fair valued using an evaluated quote, if available, provided by an independent pricing service. Evaluated quotes provided by the pricing service are valued based on a model which may include end-of-day net present values, spreads, ratings, industry, company performance and returns of referenced assets. Centrally cleared swap agreements are valued at the daily settlement price determined by the relevant exchange or clearinghouse.
Foreign securities’ (including foreign exchange contracts) prices are converted into U.S. dollar amounts using the applicable exchange rates as of the close of the NYSE. If market quotations are available and reliable for foreign exchange-traded equity securities, the securities will be valued at the market quotations. Because trading hours for certain foreign securities end before the close of the NYSE, closing market quotations may become unreliable. If between the time trading ends on a particular security and the close of the customary trading session on the NYSE, events occur that the investment adviser determines are significant and make the closing price unreliable, the Fund may fair value the security. If the event is likely to have affected the closing price of the security, the security will be valued at fair value in good faith using procedures approved by the Board of Trustees. Adjustments to closing prices to reflect fair value may also be based on a screening process of an independent pricing service to indicate the degree of certainty, based on historical data, that the closing price in the principal market where a foreign security trades is not the current value as of the close of the NYSE. Foreign securities’ prices meeting the approved degree of certainty that the price is not reflective of current value will be priced at the indication of fair value from the independent pricing service. Multiple factors may be considered by the independent pricing service in determining adjustments to reflect fair value and may include information relating to sector indices, American Depositary Receipts and domestic and foreign index futures. Foreign securities may have additional risks including exchange rate changes, potential for sharply devalued currencies and high inflation, political and economic upheaval, the relative lack of issuer information, relatively low market liquidity and the potential lack of strict financial and accounting controls and standards.
Securities for which market prices are not provided by any of the above methods may be valued based upon quotes furnished by independent sources. The last bid price may be used to value equity securities. The mean between the last bid and asked prices is used to value debt obligations, including corporate loans.
Securities for which market quotations are not readily available or became unreliable are valued at fair value as determined in good faith by or under the supervision of the Trust’s officers following procedures approved by the Board of Trustees. Issuer specific events, market trends, bid/asked quotes of brokers and information providers and other market data may be reviewed in the course of making a good faith determination of a security’s fair value.
The Fund may invest in securities that are subject to interest rate risk, meaning the risk that the prices will generally fall as interest rates rise and, conversely, the prices will generally rise as interest rates fall. Specific securities differ in their sensitivity to changes in interest rates depending on their individual characteristics. Changes in interest rates may result in increased market volatility, which may affect the value and/or liquidity of certain Fund investments.
Valuations change in response to many factors including the historical and prospective earnings of the issuer, the value of the issuer’s assets, general economic conditions, interest rates, investor perceptions and market liquidity. Because of the inherent uncertainties of valuation, the values reflected in the financial statements may materially differ from the value received upon actual sale of those investments.
| B. | Securities Transactions and Investment Income — Securities transactions are accounted for on a trade date basis. Realized gains or losses on sales are computed on the basis of specific identification of the securities sold. Interest income (net of withholding tax, if any) is recorded on the accrual basis from settlement date. Bond premiums and discounts are amortized and/or accreted over the lives of the respective securities. Pay-in-kind interest income and non-cash dividend income received in the form of securities in-lieu of cash are recorded at the fair value of the securities received. Dividend income (net of withholding tax, if any) is recorded on the ex-dividend date. |
The Fund may periodically participate in litigation related to Fund investments. As such, the Fund may receive proceeds from litigation settlements. Any proceeds received are included in the Statement of Operations as realized gain (loss) for investments no longer held and as unrealized gain (loss) for investments still held.
Brokerage commissions and mark ups are considered transaction costs and are recorded as an increase to the cost basis of securities purchased and/or a reduction of proceeds on a sale of securities. Such transaction costs are included in the determination of net realized and unrealized gain (loss) from investment securities reported in the Statement of Operations and the Statement of Changes in Net Assets and the net realized and unrealized gains (losses) on securities per share in the Financial Highlights. Transaction costs are included in the calculation of the Fund’s net asset value and, accordingly, they reduce the Fund’s total returns. These transaction costs are not considered operating expenses and are not reflected in net investment income reported in the Statement of Operations and the Statement of Changes in Net Assets, or the net investment income per share and the ratios of expenses and net investment income reported in the Financial Highlights, nor are they limited by any expense limitation arrangements between the Fund and the investment adviser.
The Fund allocates income and realized and unrealized capital gains and losses to a class based on the relative net assets of each class.
| C. | Country Determination — For the purposes of making investment selection decisions and presentation in the Schedule of Investments, the investment adviser may determine the country in which an issuer is located and/or credit risk exposure based on various factors. These factors include the laws of the country under which the issuer is organized, where the issuer maintains a principal office, the country in which the issuer derives 50% or more of its total revenues and the country that has the primary market for the issuer’s securities, as well as other criteria. Among the other criteria that may be evaluated for making this determination are the country in which the issuer maintains 50% or more of its assets, the type of security, financial guarantees and enhancements, the nature of the collateral and the sponsor organization. Country of issuer and/or credit risk exposure has been determined to be the United States of America, unless otherwise noted. |
| D. | Distributions — Distributions from net investment income and net realized capital gain, if any, are generally declared and paid to separate accounts of participating insurance companies annually and recorded on the ex-dividend date. |
Invesco V.I. High Yield Fund
| E. | Federal Income Taxes — The Fund intends to comply with the requirements of Subchapter M of the Internal Revenue Code of 1986, as amended (the “Internal Revenue Code”), necessary to qualify as a regulated investment company and to distribute substantially all of the Fund’s taxable earnings to shareholders. As such, the Fund will not be subject to federal income taxes on otherwise taxable income (including net realized capital gain) that is distributed to shareholders. Therefore, no provision for federal income taxes is recorded in the financial statements. |
The Fund recognizes the tax benefits of uncertain tax positions only when the position is more likely than not to be sustained. Management has analyzed the Fund’s uncertain tax positions and concluded that no liability for unrecognized tax benefits should be recorded related to uncertain tax positions. Management is not aware of any tax positions for which it is reasonably possible that the total amounts of unrecognized tax benefits will change materially in the next 12 months.
The Fund files tax returns in the U.S. Federal jurisdiction and certain other jurisdictions. Generally, the Fund is subject to examinations by such taxing authorities for up to three years after the filing of the return for the tax period.
| F. | Expenses — Fees provided for under the Rule 12b-1 plan of a particular class of the Fund and which are directly attributable to that class are charged to the operations of such class. All other expenses are allocated among the classes based on relative net assets. |
| G. | Accounting Estimates — The preparation of financial statements in conformity with accounting principles generally accepted in the United States of America (“GAAP”) requires management to make estimates and assumptions that affect the reported amounts of assets and liabilities at the date of the financial statements and the reported amounts of revenues and expenses during the reporting period including estimates and assumptions related to taxation. Actual results could differ from those estimates by a significant amount. In addition, the Fund monitors for material events or transactions that may occur or become known after the period-end date and before the date the financial statements are released to print. |
| H. | Indemnifications — Under the Trust’s organizational documents, each Trustee, officer, employee or other agent of the Trust is indemnified against certain liabilities that may arise out of the performance of their duties to the Fund. Additionally, in the normal course of business, the Fund enters into contracts, including the Fund’s servicing agreements, that contain a variety of indemnification clauses. The Fund’s maximum exposure under these arrangements is unknown as this would involve future claims that may be made against the Fund that have not yet occurred. The risk of material loss as a result of such indemnification claims is considered remote. |
| I. | Lower-Rated Securities — The Fund normally invests at least 80% of its net assets in lower-quality debt securities, i.e., “junk bonds”. Investments in lower-rated securities or unrated securities of comparable quality tend to be more sensitive to economic conditions than higher rated securities. Junk bonds involve a greater risk of default by the issuer because such securities are generally unsecured and are often subordinated to other creditors’ claims. |
| J. | Securities Purchased on a When-Issued and Delayed Delivery Basis — The Fund may purchase and sell interests in corporate loans and corporate debt securities and other portfolio securities on a when-issued and delayed delivery basis, with payment and delivery scheduled for a future date. No income accrues to the Fund on such interests or securities in connection with such transactions prior to the date the Fund actually takes delivery of such interests or securities. These transactions are subject to market fluctuations and are subject to the risk that the value at delivery may be more or less than the trade date purchase price. Although the Fund will generally purchase these securities with the intention of acquiring such securities, they may sell such securities prior to the settlement date. |
| K. | Foreign Currency Translations — Foreign currency is valued at the close of the NYSE based on quotations posted by banks and major currency dealers. Portfolio securities and other assets and liabilities denominated in foreign currencies are translated into U.S. dollar amounts at date of valuation. Purchases and sales of portfolio securities (net of foreign taxes withheld on disposition) and income items denominated in foreign currencies are translated into U.S. dollar amounts on the respective dates of such transactions. The Fund does not separately account for the portion of the results of operations resulting from changes in foreign exchange rates on investments and the fluctuations arising from changes in market prices of securities held. The combined results of changes in foreign exchange rates and the fluctuation of market prices on investments (net of estimated foreign tax withholding) are included with the net realized and unrealized gain or loss from investments in the Statement of Operations. Reported net realized foreign currency gains or losses arise from (1) sales of foreign currencies, (2) currency gains or losses realized between the trade and settlement dates on securities transactions, and (3) the difference between the amounts of dividends, interest, and foreign withholding taxes recorded on the Fund’s books and the U.S. dollar equivalent of the amounts actually received or paid. Net unrealized foreign currency gains and losses arise from changes in the fair values of assets and liabilities, other than investments in securities at fiscal period end, resulting from changes in exchange rates. |
The Fund may invest in foreign securities, which may be subject to foreign taxes on income, gains on investments or currency repatriation, a portion of which may be recoverable. Foreign taxes, if any, are recorded based on the tax regulations and rates that exist in the foreign markets in which the Fund invests and are shown in the Statement of Operations.
| L. | Forward Foreign Currency Contracts — The Fund may engage in foreign currency transactions either on a spot (i.e. for prompt delivery and settlement) basis, or through forward foreign currency contracts, to manage or minimize currency or exchange rate risk. |
The Fund may also enter into forward foreign currency contracts for the purchase or sale of a security denominated in a foreign currency in order to “lock in” the U.S. dollar price of that security, or the Fund may also enter into forward foreign currency contracts that do not provide for physical settlement of the two currencies, but instead are settled by a single cash payment calculated as the difference between the agreed upon exchange rate and the spot rate at settlement based upon an agreed upon notional amount (non-deliverable forwards). The Fund will set aside liquid assets in an amount equal to the daily mark-to-market obligation for forward foreign currency contracts.
A forward foreign currency contract is an obligation between two parties (“Counterparties”) to purchase or sell a specific currency for an agreed-upon price at a future date. The use of forward foreign currency contracts does not eliminate fluctuations in the price of the underlying securities the Fund owns or intends to acquire but establishes a rate of exchange in advance. Fluctuations in the value of these contracts are measured by the difference in the contract date and reporting date exchange rates and are recorded as unrealized appreciation (depreciation) until the contracts are closed. When the contracts are closed, realized gains (losses) are recorded. Realized and unrealized gains (losses) on the contracts are included in the Statement of Operations. The primary risks associated with forward foreign currency contracts include failure of the Counterparty to meet the terms of the contract and the value of the foreign currency changing unfavorably. These risks may be in excess of the amounts reflected in the Statement of Assets and Liabilities.
Invesco V.I. High Yield Fund
| M. | Futures Contracts — The Fund may enter into futures contracts to manage exposure to interest rate, equity and market price movements and/or currency risks. A futures contract is an agreement between Counterparties to purchase or sell a specified underlying security, currency or commodity (or delivery of a cash settlement price, in the case of an index future) for a fixed price at a future date. The Fund currently invests only in exchange-traded futures and they are standardized as to maturity date and underlying financial instrument. Initial margin deposits required upon entering into futures contracts are satisfied by the segregation of specific securities or cash as collateral at the futures commission merchant (broker). During the period the futures contracts are open, changes in the value of the contracts are recognized as unrealized gains or losses by recalculating the value of the contracts on a daily basis. Subsequent or variation margin payments are received or made depending upon whether unrealized gains or losses are incurred. These amounts are reflected as receivables or payables on the Statement of Assets and Liabilities. When the contracts are closed or expire, the Fund recognizes a realized gain or loss equal to the difference between the proceeds from, or cost of, the closing transaction and the Fund’s basis in the contract. The net realized gain (loss) and the change in unrealized gain (loss) on futures contracts held during the period is included on the Statement of Operations. The primary risks associated with futures contracts are market risk and the absence of a liquid secondary market. If the Fund were unable to liquidate a futures contract and/or enter into an offsetting closing transaction, the Fund would continue to be subject to market risk with respect to the value of the contracts and continue to be required to maintain the margin deposits on the futures contracts. Futures contracts have minimal Counterparty risk since the exchange’s clearinghouse, as Counterparty to all exchange-traded futures, guarantees the futures against default. Risks may exceed amounts recognized in the Statement of Assets and Liabilities. |
| N. | Swap Agreements — The Fund may enter into various swap transactions, including interest rate, total return, index, currency and credit default swap contracts (“CDS”) for investment purposes or to manage interest rate, currency or credit risk. Such transactions are agreements between Counterparties. A swap agreement may be negotiated bilaterally and traded over-the-counter (“OTC”) between two parties (“uncleared/OTC”) or, in some instances, must be transacted through a future commission merchant (“FCM”) and cleared through a clearinghouse that serves as a central Counterparty (“centrally cleared swap”). These agreements may contain among other conditions, events of default and termination events, and various covenants and representations such as provisions that require the Fund to maintain a pre-determined level of net assets, and/or provide limits regarding the decline of the Fund’s NAV over specific periods of time. If the Fund were to trigger such provisions and have open derivative positions at that time, the Counterparty may be able to terminate such agreement and request immediate payment in an amount equal to the net liability positions, if any. |
Interest rate, total return, index, and currency swap agreements are two-party contracts entered into primarily to exchange the returns (or differentials in rates of returns) earned or realized on particular predetermined investments or instruments. The gross returns to be exchanged or “swapped” between the parties are calculated with respect to a notional amount, i.e., the return on or increase in value of a particular dollar amount invested at a particular interest rate or return of an underlying asset, in a particular foreign currency, or in a “basket” of securities representing a particular index.
In a centrally cleared swap, the Fund’s ultimate Counterparty is a central clearinghouse. The Fund initially will enter into centrally cleared swaps through an executing broker. When a fund enters into a centrally cleared swap, it must deliver to the central Counterparty (via the FCM) an amount referred to as “initial margin.” Initial margin requirements are determined by the central Counterparty, but an FCM may require additional initial margin above the amount required by the central Counterparty. Initial margin deposits required upon entering into centrally cleared swaps are satisfied by cash or securities as collateral at the FCM. Securities deposited as initial margin are designated on the Schedule of Investments and cash deposited is recorded on the Statement of Assets and Liabilities. During the term of a cleared swap agreement, a “variation margin” amount may be required to be paid by the Fund or may be received by the Fund, based on the daily change in price of the underlying reference instrument subject to the swap agreement and is recorded as a receivable or payable for variation margin in the Statement of Assets and Liabilities until the centrally cleared swap is terminated at which time a realized gain or loss is recorded.
A CDS is an agreement between Counterparties to exchange the credit risk of an issuer. A buyer of a CDS is said to buy protection by paying a fixed payment over the life of the agreement and in some situations an upfront payment to the seller of the CDS. If a defined credit event occurs (such as payment default or bankruptcy), the Fund as a protection buyer would cease paying its fixed payment, the Fund would deliver eligible bonds issued by the reference entity to the seller, and the seller would pay the full notional value, or the “par value”, of the referenced obligation to the Fund. A seller of a CDS is said to sell protection and thus would receive a fixed payment over the life of the agreement and an upfront payment, if applicable. If a credit event occurs, the Fund as a protection seller would cease to receive the fixed payment stream, the Fund would pay the buyer “par value” or the full notional value of the referenced obligation, and the Fund would receive the eligible bonds issued by the reference entity. In turn, these bonds may be sold in order to realize a recovery value. Alternatively, the seller of the CDS and its Counterparty may agree to net the notional amount and the market value of the bonds and make a cash payment equal to the difference to the buyer of protection. If no credit event occurs, the Fund receives the fixed payment over the life of the agreement. As the seller, the Fund would effectively add leverage to its portfolio because, in addition to its total net assets, the Fund would be subject to investment exposure on the notional amount of the CDS. In connection with these agreements, cash and securities may be identified as collateral in accordance with the terms of the respective swap agreements to provide assets of value and recourse in the event of default under the swap agreement or bankruptcy/insolvency of a party to the swap agreement. If a Counterparty becomes bankrupt or otherwise fails to perform its obligations due to financial difficulties, the Fund may experience significant delays in obtaining any recovery in a bankruptcy or other reorganization proceeding. The Fund may obtain only limited recovery or may obtain no recovery in such circumstances. The Fund’s maximum risk of loss from Counterparty risk, either as the protection seller or as the protection buyer, is the value of the contract. The risk may be mitigated by having a master netting arrangement between the Fund and the Counterparty and by the designation of collateral by the Counterparty to cover the Fund’s exposure to the Counterparty.
Implied credit spreads represent the current level at which protection could be bought or sold given the terms of the existing CDS contract and serve as an indicator of the current status of the payment/performance risk of the CDS. An implied spread that has widened or increased since entry into the initial contract may indicate a deteriorating credit profile and increased risk of default for the reference entity. A declining or narrowing spread may indicate an improving credit profile or decreased risk of default for the reference entity. Alternatively, credit spreads may increase or decrease reflecting the general tolerance for risk in the credit markets.
Invesco V.I. High Yield Fund
An interest rate swap is an agreement between Counterparties pursuant to which the parties exchange a floating rate payment for a fixed rate payment based on a specified notional amount.
Changes in the value of centrally cleared and OTC swap agreements are recognized as unrealized gains (losses) in the Statement of Operations by “marking to market” on a daily basis to reflect the value of the swap agreement at the end of each trading day. Payments received or paid at the beginning of the agreement are reflected as such on the Statement of Assets and Liabilities and may be referred to as upfront payments. The Fund accrues for the fixed payment stream and amortizes upfront payments, if any, on swap agreements on a daily basis with the net amount, recorded as a component of realized gain (loss) on the Statement of Operations. A liquidation payment received or made at the termination of a swap agreement is recorded as realized gain (loss) on the Statement of Operations. The Fund segregates cash or liquid securities having a value at least equal to the amount of the potential obligation of a Fund under any swap transaction. Cash held as collateral is recorded as deposits with brokers on the Statement of Assets and Liabilities. Entering into these agreements involves, to varying degrees, lack of liquidity and elements of credit, market, and Counterparty risk in excess of amounts recognized on the Statement of Assets and Liabilities. Such risks involve the possibility that a swap is difficult to sell or liquidate; the Counterparty does not honor its obligations under the agreement and unfavorable interest rates and market fluctuations. It is possible that developments in the swaps market, including potential government regulation, could adversely affect the Fund’s ability to terminate existing swap agreements or to realize amounts to be received under such agreements. A short position in a security poses more risk than holding the same security long. As there is no limit on how much the price of the security can increase, the Fund’s exposure is unlimited.
Notional amounts of each individual credit default swap agreement outstanding as of December 31, 2017 for which the Fund is the seller of protection are disclosed in the open swap agreements table. These potential amounts would be partially offset by any recovery values of the respective referenced obligations, upfront payments received upon entering into the agreement, or net amounts received from the settlement of buy protection credit default swap agreements entered into by the Fund for the same referenced entity or entities.
| O. | Bank Loan Risk — Although the resale, or secondary market for floating rate loans has grown substantially over the past decade, both in overall size and number of market participants, there is no organized exchange or board of trade on which floating rate loans are traded. Instead, the secondary market for floating rate loans is a private, unregulated interdealer or interbank resale market. Such a market may therefore be subject to irregular trading activity, wide bid/ask spreads, and extended trade settlement periods, which may impair the Fund’s ability to sell bank loans within its desired time frame or at an acceptable price and its ability to accurately value existing and prospective investments. Extended trade settlement periods may result in cash not being immediately available to the Fund. As a result, the Fund may have to sell other investments or engage in borrowing transactions to raise cash to meet its obligations. Similar to other asset classes, bank loan funds may be exposed to counterparty credit risk, or the risk than an entity with which the Fund has unsettled or open transactions may fail to or be unable to perform on its commitments. The Fund seeks to manage counterparty credit risk by entering into transactions only with counterparties that it believes have the financial resources to honor their obligations and by monitoring the financial stability of those counterparties. |
| P. | Leverage Risk — Leverage exists when the Fund can lose more than it originally invests because it purchases or sells an instrument or enters into a transaction without investing an amount equal to the full economic exposure of the instrument or transaction. |
| Q. | Other Risks — The Fund invests in corporate loans from U.S. or non-U.S. companies (the “Borrowers”). The investment of the Fund in a corporate loan may take the form of participation interests or assignments. If the Fund purchases a participation interest from a syndicate of lenders (“Lenders”) or one of the participants in the syndicate (“Participant”), one or more of which administers the loan on behalf of all the Lenders (the “Agent Bank”), the Fund would be required to rely on the Lender that sold the participation interest not only for the enforcement of the Fund’s rights against the Borrower but also for the receipt and processing of payments due to the Fund under the corporate loans. As such, the Fund is subject to the credit risk of the Borrower and the Participant. Lenders and Participants interposed between the Fund and a Borrower, together with Agent Banks, are referred to as “Intermediate Participants”. |
| R. | Collateral — To the extent the Fund has designated or segregated a security as collateral and that security is subsequently sold, it is the Fund’s practice to replace such collateral no later than the next business day. |
NOTE 2—Advisory Fees and Other Fees Paid to Affiliates
The Trust has entered into a master investment advisory agreement with Invesco Advisers, Inc. (the “Adviser” or “Invesco”). Under the terms of the investment advisory agreement, the Fund accrues daily and pays monthly an advisory fee to the Adviser based on the annual rate of the Fund’s average daily net assets as follows:
| | | | | | | | |
| Average Daily Net Assets | | Rate | |
First $200 million | | | 0 | .625% | | | | |
Next $300 million | | | 0 | .55% | | | | |
Next $500 million | | | 0 | .50% | | | | |
Over $1 billion | | | 0 | .45% | | | | |
For the year ended December 31, 2017, the effective advisory fees incurred by the Fund was 0.625%.
Under the terms of a master sub-advisory agreement between the Adviser and each of Invesco Asset Management Deutschland GmbH, Invesco Asset Management Limited, Invesco Asset Management (Japan) Limited, Invesco Hong Kong Limited, Invesco Senior Secured Management, Inc. and Invesco Canada Ltd. and separate sub-advisory agreements with Invesco PowerShares Capital Management LLC and Invesco Asset Management (India) Private Limited (collectively, the “Affiliated Sub-Advisers”) the Adviser, not the Fund, will pay 40% of the fees paid to the Adviser to any such Affiliated Sub-Adviser(s) that provide(s) discretionary investment management services to the Fund based on the percentage of assets allocated to such Affiliated Sub-Adviser(s).
The Adviser has contractually agreed, through at least June 30, 2018, to waive advisory fees and/or reimburse expenses of all shares to the extent necessary to limit total annual fund operating expenses after fee waiver and/or expense reimbursement (excluding certain items discussed below) of Series I shares to 1.50% and Series II shares to 1.75% of average daily net assets (the “expense limits”). In determining the Adviser’s obligation to waive advisory fees and/or reimburse expenses, the following expenses are not taken into account, and could cause the total annual
Invesco V.I. High Yield Fund
fund operating expenses after fee waiver and/or expense reimbursement to exceed the numbers reflected above: (1) interest; (2) taxes; (3) dividend expense on short sales; (4) extraordinary or non-routine items, including litigation expenses; and (5) expenses that the Fund has incurred but did not actually pay because of an expense offset arrangement. Unless Invesco continues the fee waiver agreement, it will terminate on June 30, 2018. During its term, the fee waiver agreement cannot be terminated or amended to increase expense limits or reduce the advisory fee waiver without approval of the Board of Trustees. The Adviser did not waive fees and/or reimburse expenses during the period under these expense limits.
Further, the Adviser has contractually agreed, through at least June 30, 2019, to waive the advisory fee payable by the Fund in an amount equal to 100% of the net advisory fees the Adviser receives from the affiliated money market funds on investments by the Fund of uninvested cash in such affiliated money market funds.
For the year ended December 31, 2017, the Adviser waived advisory fees of $16,777.
The Trust has entered into a master administrative services agreement with Invesco pursuant to which the Fund has agreed to pay Invesco a fee for costs incurred in providing accounting services and fund administrative services to the Fund and to reimburse Invesco for fees paid to insurance companies that have agreed to provide certain administrative services to the Fund. These administrative services provided by the insurance companies may include, among other things: maintenance of master accounts with the Fund; tracking, recording and transmitting net purchase and redemption orders for Fund shares; maintaining and preserving records related to the purchase, redemption and other account activity of variable product owners; distributing copies of Fund documents such as prospectuses, proxy materials and periodic reports, to variable product owners, and responding to inquiries from variable product owners about the Fund. Pursuant to such agreement, for the year ended December 31, 2017, Invesco was paid $50,000 for accounting and fund administrative services and was reimbursed $279,719 for fees paid to insurance companies.
The Trust has entered into a transfer agency and service agreement with Invesco Investment Services, Inc. (“IIS”) pursuant to which the Fund has agreed to pay IIS a fee for providing transfer agency and shareholder services to the Fund and reimburse IIS for certain expenses incurred by IIS in the course of providing such services. For the year ended December 31, 2017, expenses incurred under the agreement are shown in the Statement of Operations as Transfer agent fees.
The Trust has entered into a master distribution agreement with Invesco Distributors, Inc. (“IDI”) to serve as the distributor for the Fund. The Trust has adopted a plan pursuant to Rule 12b-1 under the 1940 Act with respect to the Fund’s Series II shares (the “Plan”). The Fund, pursuant to the Plan, pays IDI compensation at the annual rate of 0.25% of the Fund’s average daily net assets of Series II shares. The fees are accrued daily and paid monthly. Of the Plan payments, up to 0.25% of the average daily net assets of the Series II shares may be paid to insurance companies who furnish continuing personal shareholder services to customers who purchase and own Series II shares of the Fund. For the year ended December 31, 2017, expenses incurred under the Plan are detailed in the Statement of Operations as Distribution fees.
Certain officers and trustees of the Trust are officers and directors of the Adviser, IIS and/or IDI.
NOTE 3—Additional Valuation Information
GAAP defines fair value as the price that would be received to sell an asset or paid to transfer a liability in an orderly transaction between market participants at the measurement date, under current market conditions. GAAP establishes a hierarchy that prioritizes the inputs to valuation methods, giving the highest priority to readily available unadjusted quoted prices in an active market for identical assets (Level 1) and the lowest priority to significant unobservable inputs (Level 3), generally when market prices are not readily available or are unreliable. Based on the valuation inputs, the securities or other investments are tiered into one of three levels. Changes in valuation methods may result in transfers in or out of an investment’s assigned level:
| | Level 1 — | Prices are determined using quoted prices in an active market for identical assets. |
| | Level 2 — | Prices are determined using other significant observable inputs. Observable inputs are inputs that other market participants may use in pricing a security. These may include quoted prices for similar securities, interest rates, prepayment speeds, credit risk, yield curves, loss severities, default rates, discount rates, volatilities and others. |
| | Level 3 — | Prices are determined using significant unobservable inputs. In situations where quoted prices or observable inputs are unavailable (for example, when there is little or no market activity for an investment at the end of the period), unobservable inputs may be used. Unobservable inputs reflect the Fund’s own assumptions about the factors market participants would use in determining fair value of the securities or instruments and would be based on the best available information. |
The following is a summary of the tiered valuation input levels, as of December 31, 2017. The level assigned to the securities valuations may not be an indication of the risk or liquidity associated with investing in those securities. Because of the inherent uncertainties of valuation, the values reflected in the financial statements may materially differ from the value received upon actual sale of those investments.
Invesco V.I. High Yield Fund
The Fund’s policy is to recognize transfers in and out of the valuation levels as of the end of the reporting period. During the year ended December 31, 2017, there were no material transfers between valuation levels.
| | | | | | | | | | | | | | | | |
| | | Level 1 | | | Level 2 | | | Level 3 | | | Total | |
| Investments in Securities | | | | | | | | | | | | |
U.S. Dollar Denominated Bonds & Notes | | $ | — | | | $ | 159,621,881 | | | $ | 0 | | | $ | 159,621,881 | |
Exchange-Traded Fund | | | 3,720,600 | | | | — | | | | — | | | | 3,720,600 | |
Variable Rate Senior Loan Interests | | | — | | | | 1,394,783 | | | | 812,000 | | | | 2,206,783 | |
Non-U.S. Dollar Denominated Bonds & Notes | | | — | | | | 970,562 | | | | — | | | | 970,562 | |
U.S. Treasury Securities | | | — | | | | 369,611 | | | | — | | | | 369,611 | |
Preferred Stock | | | — | | | | 123,900 | | | | — | | | | 123,900 | |
Common Stocks & Other Equity Interests | | | 9 | | | | 987 | | | | — | | | | 996 | |
Money Market Funds | | | 3,522,769 | | | | — | | | | — | | | | 3,522,769 | |
Total Investments in Securities | | | 7,243,378 | | | | 162,481,724 | | | | 812,000 | | | | 170,537,102 | |
| Other Investments - Assets* | | | | | | | | | | | | |
Swap Agreements | | | — | | | | 166,249 | | | | — | | | | 166,249 | |
| Other Investments - Liabilities* | | | | | | | | | | | | |
Forward Foreign Currency Contracts | | | — | | | | (15,164 | ) | | | — | | | | (15,164 | ) |
Total Other Investments | | | — | | | | 151,085 | | | | — | | | | 151,085 | |
Total Investments | | $ | 7,243,378 | | | $ | 162,632,809 | | | $ | 812,000 | | | $ | 170,688,187 | |
| * | Unrealized appreciation (depreciation). |
NOTE 4—Derivative Investments
The Fund may enter into an International Swaps and Derivatives Association Master Agreement (“ISDA Master Agreement”) under which a fund may trade OTC derivatives. An OTC transaction entered into under an ISDA Master Agreement typically involves a collateral posting arrangement, payment netting provisions and close-out netting provisions. These netting provisions allow for reduction of credit risk through netting of contractual obligations. The enforceability of the netting provisions of the ISDA Master Agreement depends on the governing law of the ISDA Master Agreement, among other factors.
For financial reporting purposes, the Fund does not offset OTC derivative assets or liabilities that are subject to ISDA Master Agreements in the Statement of Assets and Liabilities.
Value of Derivative Investments at Period-End
The table below summarizes the value of the Fund’s derivative investments, detailed by primary risk exposure, held as of December 31, 2017:
| | | | | | | | | | | | |
| | | Value | |
| Derivative Assets | | Credit
Risk | | | Currency
Risk | | | Total | |
Unrealized appreciation on swap agreements — Centrally Cleared(a) | | $ | 166,249 | | | $ | — | | | $ | 166,249 | |
Derivatives not subject to master netting agreements | | | (166,249 | ) | | | — | | | | (166,249 | ) |
Total Derivative Assets subject to master netting agreements | | $ | — | | | $ | — | | | $ | — | |
| | | |
| | | | | | | | | | | | |
| | | Value | |
| Derivative Liabilities | | Credit
Risk | | | Currency
Risk | | | Total | |
Unrealized depreciation on forward foreign currency contracts outstanding | | $ | — | | | $ | (15,164 | ) | | $ | (15,164 | ) |
Derivatives not subject to master netting agreements | | | — | | | | — | | | | — | |
Total Derivative Liabilities subject to master netting agreements | | $ | — | | | $ | (15,164 | ) | | $ | (15,164 | ) |
| (a) | The daily variation margin receivable at period-end is recorded in the Statement of Assets and Liabilities. |
Invesco V.I. High Yield Fund
Offsetting Assets and Liabilities
The table below reflects the Fund’s exposure to Counterparties subject to either an ISDA Master Agreement or other agreement for OTC derivative transactions as of December 31, 2017.
| | | | | | | | | | | | | | | | | | | | | | | | |
| | | Financial
Derivative
Assets | | | Financial
Derivative Liabilities | | | | | | Collateral
(Received)/Pledged | | | | |
| Counterparty | | Forward Foreign Currency
Contracts | | | Forward Foreign Currency
Contracts | | | Net value of
Derivatives | | | Non-Cash | | | Cash | | | Net
Amount | |
Barclays Bank PLC | | $ | — | | | $ | (15,164 | ) | | $ | (15,164 | ) | | $ | — | | | $ | — | | | $ | (15,164 | ) |
Effect of Derivative Investments for the year ended December 31, 2017
The table below summarizes the gains (losses) on derivative investments, detailed by primary risk exposure, recognized in earnings during the period:
| | | | | | | | | | | | | | | | |
| | | Location of Gain (Loss) on
Statement of Operations | |
| | | Credit
Risk | | | Currency
Risk | | | Interest Rate
Risk | | | Total | |
Realized Gain (Loss): | | | | | | | | | | | | | | | | |
Forward foreign currency contracts | | $ | — | | | $ | (110,931 | ) | | $ | — | | | $ | (110,931 | ) |
Futures contracts | | | — | | | | — | | | | (413,456 | ) | | | (413,456 | ) |
Swap agreements | | | 125,387 | | | | — | | | | — | | | | 125,387 | |
Change in Net Unrealized Appreciation (Depreciation): | | | | | | | | | | | | | | | | |
Forward foreign currency contracts | | | — | | | | (23,828 | ) | | | — | | | | (23,828 | ) |
Futures contracts | | | — | | | | — | | | | 24,152 | | | | 24,152 | |
Swap agreements | | | 166,249 | | | | — | | | | — | | | | 166,249 | |
Total | | $ | 291,636 | | | $ | (134,759 | ) | | $ | (389,304 | ) | | $ | (232,427 | ) |
The table below summarizes the twelve month average notional value of forward foreign currency contracts, the four month average notional value of futures contracts and the nine month average notional value of swap agreements outstanding during the period.
| | | | | | | | | | | | |
| | | Forward Foreign Currency Contracts | | | Futures
Contracts | | | Swap
Agreements | |
Average notional value | | $ | 1,557,263 | | | $ | 11,305,758 | | | $ | 6,662,556 | |
NOTE 5—Investments in Affiliates
The Fund’s Adviser and the adviser for PowerShares Senior Loan Portfolio are subsidiaries of Invesco Ltd. and therefore, PowerShares Senior Loan Portfolio is considered to be affiliated with the Fund. The following is a summary of the transactions in, and earnings from, investments in PowerShares Senior Loan Portfolio for the year ended December 31, 2017.
| | | | | | | | | | | | | | | | | | | | | | | | | | | | |
| | | Value
12/31/16 | | | Purchases
at Cost | | | Proceeds
from Sales | | | Change in
Unrealized
Appreciation
(Depreciation) | | | Realized
Gain (Loss) | | | Value
12/31/17 | | | Dividend
Income | |
PowerShares Senior Loan Portfolio | | $ | 1,868,800 | | | $ | 1,167,000 | | | $ | (3,018,690 | ) | | $ | (13,832 | ) | | $ | (3,278 | ) | | $ | — | | | $ | 42,615 | |
NOTE 6—Trustees’ and Officers’ Fees and Benefits
Trustees’ and Officers’ Fees and Benefits include amounts accrued by the Fund to pay remuneration to certain Trustees and Officers of the Fund. Trustees have the option to defer compensation payable by the Fund, and Trustees’ and Officers’ Fees and Benefits also include amounts accrued by the Fund to fund such deferred compensation amounts. Those Trustees who defer compensation have the option to select various Invesco Funds in which their deferral accounts shall be deemed to be invested. Finally, certain current Trustees were eligible to participate in a retirement plan that provided for benefits to be paid upon retirement to Trustees over a period of time based on the number of years of service. The Fund may have certain former Trustees who also participate in a retirement plan and receive benefits under such plan. Trustees’ and Officers’ Fees and Benefits include amounts accrued by the Fund to fund such retirement benefits. Obligations under the deferred compensation and retirement plans represent unsecured claims against the general assets of the Fund.
NOTE 7—Cash Balances
The Fund may borrow for leveraging in an amount up to 5% of the Fund’s total assets (excluding the amount borrowed) at the time the borrowing is made. In doing so, the Fund is permitted to temporarily carry a negative or overdrawn balance in its account with State Street Bank and Trust Company, the custodian bank. Such balances, if any at period end, are shown in the Statement of Assets and Liabilities under the payable caption Amount due custodian. To compensate the custodian bank for such overdrafts, the overdrawn Fund may either (1) leave funds as a compensating balance in the account so the custodian bank can be compensated by earning the additional interest; or (2) compensate by paying the custodian bank
Invesco V.I. High Yield Fund
at a rate agreed upon by the custodian bank and Invesco, not to exceed the contractually agreed upon rate. The Fund may not purchase additional securities when any borrowings from banks exceed 5% of the Fund’s total assets.
NOTE 8—Distributions to Shareholders and Tax Components of Net Assets
Tax Character of Distributions to Shareholders Paid During the Fiscal Years Ended December 31, 2017 and 2016:
| | | | | | | | |
| | | 2017 | | | 2016 | |
Ordinary income | | $ | 8,003,303 | | | $ | 7,202,263 | |
Tax Components of Net Assets at Period-End:
| | | | |
| | | 2017 | |
Undistributed ordinary income | | $ | 8,681,610 | |
Net unrealized appreciation (depreciation) — investments | | | (3,442,953 | ) |
Net unrealized appreciation — foreign currencies | | | 10,306 | |
Temporary book/tax differences | | | (71,694 | ) |
Capital loss carryforward | | | (10,505,247 | ) |
Shares of beneficial interest | | | 177,501,503 | |
Total net assets | | $ | 172,173,525 | |
The difference between book-basis and tax-basis unrealized appreciation (depreciation) is due to differences in the timing of recognition of gains and losses on investments for tax and book purposes. The Fund’s net unrealized appreciation (depreciation) difference is attributable primarily to wash sales and forward foreign currency contracts.
The temporary book/tax differences are a result of timing differences between book and tax recognition of income and/or expenses. The Fund’s temporary book/tax differences are the result of the trustee deferral of compensation and retirement plan benefits.
Capital loss carryforward is calculated and reported as of a specific date. Results of transactions and other activity after that date may affect the amount of capital loss carryforward actually available for the Fund to utilize. Capital losses generated in years beginning after December 22, 2010 can be carried forward for an unlimited period, whereas previous losses expire in eight tax years. Capital losses with an expiration period may not be used to offset capital gains until all net capital losses without an expiration date have been utilized. Capital loss carryforwards with no expiration date will retain their character as either short-term or long-term capital losses instead of as short-term capital losses as under prior law. The ability to utilize capital loss carryforwards in the future may be limited under the Internal Revenue Code and related regulations based on the results of future transactions.
The Fund has a capital loss carryforward as of December 31, 2017, which expires as follows:
| | | | | | | | | | | | |
| Capital Loss Carryforward* | |
| Expiration | | Short-Term | | | Long-Term | | | Total | |
Not subject to expiration | | $ | 4,402,615 | | | $ | 6,102,632 | | | $ | 10,505,247 | |
| * | Capital loss carryforward as of the date listed above is reduced for limitations, if any, to the extent required by the Internal Revenue Code and may be further limited depending upon a variety of factors, including the realization of net unrealized gains or losses as of the date of any reorganization. |
NOTE 9—Investment Transactions
The aggregate amount of investment securities (other than short-term securities, U.S. Treasury obligations and money market funds, if any) purchased and sold by the Fund during the year ended December 31, 2017 was $130,050,537 and $133,350,219, respectively. Cost of investments, including any derivatives, on a tax basis includes the adjustments for financial reporting purposes as of the most recently completed federal income tax reporting period-end.
| | | | |
| Unrealized Appreciation (Depreciation) of Investments on a Tax Basis | |
Aggregate unrealized appreciation of investments | | $ | 5,458,351 | |
Aggregate unrealized (depreciation) of investments | | | (8,901,304 | ) |
Net unrealized appreciation (depreciation) of investments | | $ | (3,442,953 | ) |
Cost of investments for tax purposes is $174,572,731.
Invesco V.I. High Yield Fund
Note 10—Reclassification of Permanent Differences
Primarily as a result of differing book/tax treatment of expired capital loss carryforward and swap agreements income on December 31, 2017, undistributed net investment income was increased by $152,793, undistributed net realized gain (loss) was increased by $3,099,154 and shares of beneficial interest was decreased by $3,251,947. This reclassification had no effect on the net assets of the Fund.
NOTE 11—Share Information
| | | | | | | | | | | | | | | | |
| | | Summary of Share Activity | |
| | | Years ended December 31, | |
| | | 2017(a) | | | 2016 | |
| | | Shares | | | Amount | | | Shares | | | Amount | |
Sold: | | | | | | | | | | | | | | | | |
Series I | | | 11,501,884 | | | $ | 63,906,862 | | | | 17,324,848 | | | $ | 92,655,603 | |
Series II | | | 2,531,262 | | | | 13,924,938 | | | | 4,567,922 | | | | 24,054,376 | |
| | | | |
Issued as reinvestment of dividends: | | | | | | | | | | | | | | | | |
Series I | | | 829,113 | | | | 4,535,246 | | | | 774,024 | | | | 4,133,290 | |
Series II | | | 637,511 | | | | 3,468,057 | | | | 577,961 | | | | 3,068,973 | |
| | | | |
Reacquired: | | | | | | | | | | | | | | | | |
Series I | | | (15,263,276 | ) | | | (84,022,570 | ) | | | (15,111,083 | ) | | | (80,468,968 | ) |
Series II | | | (1,841,220 | ) | | | (10,117,237 | ) | | | (3,757,906 | ) | | | (19,637,523 | ) |
Net increase (decrease) in share activity | | | (1,604,726 | ) | | $ | (8,304,704 | ) | | | 4,375,766 | | | $ | 23,805,751 | |
| (a) | There are entities that are record owners of more than 5% of the outstanding shares of the Fund and in the aggregate own 68% of the outstanding shares of the Fund. The Fund and the Fund’s principal underwriter or adviser, are parties to participation agreements with these entities whereby these entities sell units of interest in separate accounts funding variable products that are invested in the Fund. The Fund, Invesco and/or Invesco affiliates may make payments to these entities, which are considered to be related to the Fund, for providing services to the Fund, Invesco and/or Invesco affiliates including but not limited to services such as, securities brokerage, third party record keeping and account servicing and administrative services. The Fund has no knowledge as to whether all or any portion of the shares owned of record by these entities are also owned beneficially. |
NOTE 12—Financial Highlights
The following schedule presents financial highlights for a share of the Fund outstanding throughout the periods indicated.
| | | | | | | | | | | | | | | | | | | | | | | | | | | | | | | | | | | | | | | | | | | | | | | | |
| | | Net asset
value,
beginning
of period | | | Net
investment
income(a) | | | Net gains
(losses)
on securities
(both
realized and
unrealized) | | | Total from
investment
operations | | | Dividends
from net
investment
income | | | Net asset
value, end
of period | | | Total
return(b) | | | Net assets,
end of period
(000’s omitted) | | | Ratio of
expenses
to average
net assets
with fee waivers
and/or expenses
absorbed | | | Ratio of
expenses
to average net
assets without
fee waivers
and/or expenses
absorbed | | | Ratio of net
investment
income
to average
net assets | | | Portfolio
turnover(c) | |
Series I | | | | | | | | | | | | | | | | | | | | | | | | | | | | | | | | | | | | | | | | | | | | | | | | |
Year ended 12/31/17 | | $ | 5.40 | | | $ | 0.26 | | | $ | 0.08 | | | $ | 0.34 | | | $ | (0.23 | ) | | $ | 5.51 | | | | 6.30 | % | | $ | 80,372 | | | | 0.99 | %(d) | | | 1.00 | %(d) | | | 4.73 | %(d) | | | 73 | % |
Year ended 12/31/16 | | | 5.06 | | | | 0.28 | | | | 0.28 | | | | 0.56 | | | | (0.22 | ) | | | 5.40 | | | | 11.21 | | | | 94,653 | | | | 0.96 | | | | 0.96 | | | | 5.25 | | | | 99 | |
Year ended 12/31/15 | | | 5.53 | | | | 0.29 | | | | (0.46 | ) | | | (0.17 | ) | | | (0.30 | ) | | | 5.06 | | | | (3.17 | ) | | | 73,594 | | | | 1.03 | | | | 1.03 | | | | 5.23 | | | | 99 | |
Year ended 12/31/14 | | | 5.70 | | | | 0.29 | | | | (0.19 | ) | | | 0.10 | | | | (0.27 | ) | | | 5.53 | | | | 1.73 | | | | 94,345 | | | | 0.92 | | | | 0.98 | | | | 5.11 | | | | 103 | |
Year ended 12/31/13 | | | 5.61 | | | | 0.33 | | | | 0.05 | | | | 0.38 | | | | (0.29 | ) | | | 5.70 | | | | 7.01 | | | | 98,455 | | | | 0.81 | | | | 1.03 | | | | 5.79 | | | | 74 | |
Series II | | | | | | | | | | | | | | | | | | | | | | | | | | | | | | | | | | | | | | | | | | | | | | | | |
Year ended 12/31/17 | | | 5.36 | | | | 0.25 | | | | 0.07 | | | | 0.32 | | | | (0.22 | ) | | | 5.46 | | | | 5.93 | | | | 91,802 | | | | 1.24 | (d) | | | 1.25 | (d) | | | 4.48 | (d) | | | 73 | |
Year ended 12/31/16 | | | 5.03 | | | | 0.26 | | | | 0.28 | | | | 0.54 | | | | (0.21 | ) | | | 5.36 | | | | 10.83 | | | | 82,971 | | | | 1.21 | | | | 1.21 | | | | 5.00 | | | | 99 | |
Year ended 12/31/15 | | | 5.50 | | | | 0.27 | | | | (0.45 | ) | | | (0.18 | ) | | | (0.29 | ) | | | 5.03 | | | | (3.37 | ) | | | 70,840 | | | | 1.28 | | | | 1.28 | | | | 4.98 | | | | 99 | |
Year ended 12/31/14 | | | 5.67 | | | | 0.28 | | | | (0.19 | ) | | | 0.09 | | | | (0.26 | ) | | | 5.50 | | | | 1.59 | | | | 59,683 | | | | 1.17 | | | | 1.23 | | | | 4.86 | | | | 103 | |
Year ended 12/31/13 | | | 5.59 | | | | 0.32 | | | | 0.05 | | | | 0.37 | | | | (0.29 | ) | | | 5.67 | | | | 6.76 | | | | 44,416 | | | | 1.06 | | | | 1.28 | | | | 5.54 | | | | 74 | |
| (a) | Calculated using average shares outstanding. |
| (b) | Includes adjustments in accordance with accounting principles generally accepted in the United States of America and as such, the net asset value for financial reporting purposes and the returns based upon those net asset values may differ from the net asset value and returns for shareholder transactions. Total returns are not annualized for periods less than one year, if applicable, and do not reflect charges assessed in connection with a variable product, which if included would reduce total returns. |
| (c) | Portfolio turnover is calculated at the fund level and is not annualized for periods less than one year, if applicable. For the period ended December 31, 2013, the portfolio turnover calculation excludes the value of securities purchased of $32,385,318 and sold of $10,521,731 in the effort to realign the Fund’s portfolio holdings after the reorganization of Invesco V.I. High Yield Securities Fund into the Fund. |
| (d) | Ratios are based on average daily net assets (000’s omitted) of $98,741 and $88,178 for Series I and Series II shares, respectively. |
Invesco V.I. High Yield Fund
Report of Independent Registered Public Accounting Firm
To the Board of Trustees of AIM Variable Insurance Funds (Invesco Variable Insurance Funds) and Shareholders of Invesco V.I. High Yield Fund
Opinion on the Financial Statements
We have audited the accompanying statement of assets and liabilities, including the schedule of investments, of Invesco V.I. High Yield Fund (one of the funds constituting AIM Variable Insurance Funds (Invesco Variable Insurance Funds), hereafter referred to as the “Fund”) as of December 31, 2017, the related statement of operations for the year ended December 31, 2017, the statement of changes in net assets for each of the two years in the period ended December 31, 2017, including the related notes, and the financial highlights for each of the five years in the period ended December 31, 2017 (collectively referred to as the “financial statements”). In our opinion, the financial statements present fairly, in all material respects, the financial position of the Fund as of December 31, 2017, the results of its operations for the year then ended, the changes in its net assets for each of the two years in the period ended December 31, 2017 and the financial highlights for each of the five years in the period ended December 31, 2017 in conformity with accounting principles generally accepted in the United States of America.
Basis for Opinion
These financial statements are the responsibility of the Fund’s management. Our responsibility is to express an opinion on the Fund’s financial statements based on our audits. We are a public accounting firm registered with the Public Company Accounting Oversight Board (United States) (“PCAOB”) and are required to be independent with respect to the Fund in accordance with the U.S. federal securities laws and the applicable rules and regulations of the Securities and Exchange Commission and the PCAOB.
We conducted our audits of these financial statements in accordance with the standards of the PCAOB. Those standards require that we plan and perform the audit to obtain reasonable assurance about whether the financial statements are free of material misstatement, whether due to error or fraud.
Our audits included performing procedures to assess the risks of material misstatement of the financial statements, whether due to error or fraud, and performing procedures that respond to those risks. Such procedures included examining, on a test basis, evidence regarding the amounts and disclosures in the financial statements. Our audits also included evaluating the accounting principles used and significant estimates made by management, as well as evaluating the overall presentation of the financial statements. Our procedures included confirmation of securities owned as of December 31, 2017 by correspondence with the custodian, transfer agent and brokers; when replies were not received from brokers, we performed other auditing procedures. We believe that our audits provide a reasonable basis for our opinion.
PricewaterhouseCoopers LLP
Houston, TX
February 14, 2018
We have served as the auditor of one or more of the investment companies in the Invesco/PowerShares group of investment companies since at least 1995. We have not determined the specific year we began serving as such auditor.
Invesco V.I. High Yield Fund
Calculating your ongoing Fund expenses
Example
As a shareholder of the Fund, you incur ongoing costs, including management fees; distribution and/or service fees (12b-1); and other Fund expenses. This example is intended to help you understand your ongoing costs (in dollars) of investing in the Fund and to compare these costs with ongoing costs of investing in other mutual funds. The example is based on an investment of $1,000 invested at the beginning of the period and held for the entire period July 1, 2017 through December 31, 2017.
The actual and hypothetical expenses in the examples below do not represent the effect of any fees or other expenses assessed in connection with a variable product; if they did, the expenses shown would be higher while the ending account values shown would be lower.
Actual expenses
The table below provides information about actual account values and actual expenses. You may use the information in this table, together with the amount you invested, to estimate the expenses that you paid over the period. Simply divide your account value by $1,000 (for example, an $8,600 account value divided by $1,000 = 8.6), then multiply the result by the number in the table under the heading entitled “Actual Expenses Paid During Period” to estimate the expenses you paid on your account during this period.
Hypothetical example for comparison purposes
The table below also provides information about hypothetical account values and hypothetical expenses based on the Fund’s actual expense ratio and an assumed rate of return of 5% per year before expenses, which is not the Fund’s actual return.
The hypothetical account values and expenses may not be used to estimate the actual ending account balance or expenses you paid for the period. You may use this information to compare the ongoing costs of investing in the Fund and other funds. To do so, compare this 5% hypothetical example with the 5% hypothetical examples that appear in the shareholder reports of the other funds.
Please note that the expenses shown in the table are meant to highlight your ongoing costs. Therefore, the hypothetical information is useful in comparing ongoing costs, and will not help you determine the relative total costs of owning different funds.
| | | | | | | | | | | | | | | | | | | | | | | | |
| Class | | Beginning
Account Value
(07/01/17) | | | ACTUAL | | | HYPOTHETICAL
(5% annual return before
expenses) | | | Annualized
Expense
Ratio | |
| | | Ending
Account Value
(12/31/17)1 | | | Expenses
Paid During
Period2 | | | Ending
Account Value
(12/31/17) | | | Expenses
Paid During
Period2 | | |
| Series I | | $ | 1,000.00 | | | $ | 1,021.40 | | | $ | 5.81 | | | $ | 1,019.46 | | | $ | 5.80 | | | | 1.14 | % |
| Series II | | | 1,000.00 | | | | 1,021.20 | | | | 7.08 | | | | 1,018.20 | | | | 7.07 | | | | 1.39 | |
| 1 | The actual ending account value is based on the actual total return of the Fund for the period July 1, 2017 through December 31, 2017, after actual expenses and will differ from the hypothetical ending account value which is based on the Fund’s expense ratio and a hypothetical annual return of 5% before expenses. |
| 2 | Expenses are equal to the Fund’s annualized expense ratio as indicated above multiplied by the average account value over the period, multiplied by 184/365 to reflect the most recent fiscal half year. |
Invesco V.I. High Yield Fund
Tax Information
Form 1099-DIV, Form 1042-S and other year-end tax information provide shareholders with actual calendar year amounts that should be included in their tax returns. Shareholders should consult their tax advisors.
The following distribution information is being provided as required by the Internal Revenue Code or to meet a specific state’s requirement.
The Fund designates the following amounts or, if subsequently determined to be different, the maximum amount allowable for its fiscal year ended December 31, 2017:
| | | | |
Federal and State Income Tax | |
Corporate Dividends Received Deduction* | | | 0.34 | % |
U.S. Treasury Obligations* | | | 0.03 | % |
| | * | The above percentages are based on ordinary income dividends paid to shareholders during the Fund’s fiscal year. |
Invesco V.I. High Yield Fund
Trustees and Officers
The address of each trustee and officer is AIM Variable Insurance Funds (Invesco Variable Insurance Funds) (the “Trust”), 11 Greenway Plaza, Suite 1000, Houston, Texas 77046-1173. The trustees serve for the life of the Trust, subject to their earlier death, incapacitation, resignation, retirement or removal as more specifically provided in the Trust’s organizational documents. Each officer serves for a one year term or until their successors are elected and qualified. Column two below includes length of time served with predecessor entities, if any.
| | | | | | | | |
Name, Year of Birth and
Position(s) Held with the Trust | | Trustee and/
or Officer Since | | Principal Occupation(s)
During Past 5 Years | | Number of
Funds in Fund
Complex
Overseen by
Trustee | | Other Directorship(s)
Held by Trustee During
Past 5 Years |
| Interested Persons | | | | | | | | |
Martin L. Flanagan1 — 1960 Trustee | | 2007 | | Executive Director, Chief Executive Officer and President, Invesco Ltd. (ultimate parent of Invesco and a global investment management firm); Trustee, The Invesco Funds; Vice Chair, Investment Company Institute; and Member of Executive Board, SMU Cox School of Business Formerly: Advisor to the Board, Invesco Advisers, Inc. (formerly known as Invesco Institutional (N.A.), Inc.); Chairman and Chief Executive Officer, Invesco Advisers, Inc. (registered investment adviser); Director, Chairman, Chief Executive Officer and President, Invesco Holding Company (US), Inc. (formerly IVZ Inc.) (holding company), Invesco Group Services, Inc. (service provider) and Invesco North American Holdings, Inc. (holding company); Director, Chief Executive Officer and President, Invesco Holding Company Limited (parent of Invesco and a global investment management firm); Director, Invesco Ltd.; Chairman, Investment Company Institute and President, Co-Chief Executive Officer, Co-President, Chief Operating Officer and Chief Financial Officer, Franklin Resources, Inc. (global investment management organization) | | 158 | | None |
Philip A. Taylor2 — 1954 Trustee and Senior Vice President | | 2006 | | Head of the Americas and Senior Managing Director, Invesco Ltd.; Director, Invesco Advisers, Inc. (formerly known as Invesco Institutional (N.A.), Inc.) (registered investment adviser); Director, Chairman, Chief Executive Officer and President, Invesco Management Group, Inc. (formerly known as Invesco Aim Management Group, Inc.) (financial services holding company); Director and Chairman, Invesco Investment Services, Inc. (formerly known as Invesco Aim Investment Services, Inc.) (registered transfer agent); Chief Executive Officer, Invesco Corporate Class Inc. (corporate mutual fund company); Director, Chairman and Chief Executive Officer, Invesco Canada Ltd. (formerly known as Invesco Trimark Ltd./Invesco Trimark Ltèe) (registered investment adviser and registered transfer agent); Trustee and Senior Vice President, The Invesco Funds; Director, Invesco Investment Advisers LLC (formerly known as Van Kampen Asset Management). Formerly: Co-Chairman, Co-President and Co-Chief Executive Officer, Invesco Advisers, Inc. (formerly known as Invesco Institutional (N.A.), Inc.) (registered investment adviser); Director, Chief Executive Officer and President, Van Kampen Exchange Corp; President and Principal Executive Officer, The Invesco Funds (other than AIM Treasurer’s Series Trust (Invesco Treasurer’s Series Trust), Short-Term Investments Trust and Invesco Management Trust); Executive Vice President, The Invesco Funds (AIM Treasurer’s Series Trust (Invesco Treasurer’s Series Trust), Short-Term Investments Trust and Invesco Management Trust only); Director and President, INVESCO Funds Group, Inc. (registered investment adviser and registered transfer agent); Director and Chairman, IVZ Distributors, Inc. (formerly known as INVESCO Distributors, Inc.) (registered broker dealer); Director, President and Chairman, Invesco Inc. (holding company), Invesco Canada Holdings Inc. (holding company), Trimark Investments Ltd./Placements Trimark Ltèe and Invesco Financial Services Ltd/Services Financiers Invesco Ltèe; Chief Executive Officer, Invesco Canada Fund Inc. (corporate mutual fund company); Director and Chairman, Van Kampen Investor Services Inc.; Director, Chief Executive Officer and President, 1371 Preferred Inc. (holding company) and Van Kampen Investments Inc.; Director and President, AIM GP Canada Inc. (general partner for limited partnerships) and Van Kampen Advisors, Inc.; Director and Chief Executive Officer, Invesco Trimark Dealer Inc. (registered broker dealer); Director, Invesco Distributors, Inc. (formerly known as Invesco Aim Distributors, Inc.) (registered broker dealer); Manager, Invesco PowerShares Capital Management LLC; Director, Chief Executive Officer and President, Invesco Advisers, Inc.; Director, Chairman, Chief Executive Officer and President, Invesco Aim Capital Management, Inc.; President, Invesco Trimark Dealer Inc. and Invesco Trimark Ltd./Invesco Trimark Ltèe; Director and President, AIM Trimark Corporate Class Inc. and AIM Trimark Canada Fund Inc.; Senior Managing Director, Invesco Holding Company Limited; Director and Chairman, Fund Management Company (former registered broker dealer); President and Principal Executive Officer, The Invesco Funds (AIM Treasurer’s Series Trust (Invesco Treasurer’s Series Trust), and Short-Term Investments Trust only); President, AIM Trimark Global Fund Inc. and AIM Trimark Canada Fund Inc. | | 158 | | None |
| 1 | Mr. Flanagan is considered an interested person (within the meaning of Section 2(a)(19) of the 1940 Act) of the Trust because he is an officer of the Adviser to the Trust, and an officer and a director of Invesco Ltd., ultimate parent of the Adviser. |
| 2 | Mr. Taylor is considered an interested person (within the meaning of Section 2(a)(19) of the 1940 Act) of the Trust because he is an officer and a director of the Adviser. |
Invesco V.I. High Yield Fund
Trustees and Officers—(continued)
| | | | | | | | |
Name, Year of Birth and
Position(s) Held with the Trust | | Trustee and/
or Officer Since | | Principal Occupation(s)
During Past 5 Years | | Number of
Funds in Fund
Complex
Overseen by
Trustee | | Other Directorship(s)
Held by Trustee During
Past 5 Years |
| Independent Trustees | | | | | | | | |
Bruce L. Crockett — 1944 Trustee and Chair | | 1993 | | Chairman, Crockett Technologies Associates (technology consulting company) Formerly: Director, Captaris (unified messaging provider); Director, President and Chief Executive Officer, COMSAT Corporation; Chairman, Board of Governors of INTELSAT (international communications company); ACE Limited (insurance company); Independent Directors Council and Investment Company Institute: Member of the Audit Committee, Investment Company Institute; Member of the Executive Committee and Chair of the Governance Committee, Independent Directors Council | | 158 | | Director and Chairman of the Audit Committee, ALPS (Attorneys Liability Protection Society) (insurance company); Director and Member of the Audit Committee and Compensation Committee, Ferroglobe PLC (metallurgical company) |
David C. Arch — 1945 Trustee | | 2010 | | Chairman of Blistex Inc. (consumer health care products manufacturer); Member, World Presidents’ Organization | | 158 | | Board member of the Illinois Manufacturers’ Association |
Jack M. Fields — 1952 Trustee | | 1997 | | Chief Executive Officer, Twenty First Century Group, Inc. (government affairs company); and Chairman, Discovery Learning Alliance (non-profit) Formerly: Owner and Chief Executive Officer, Dos Angeles Ranch L.P. (cattle, hunting, corporate entertainment); Director, Insperity, Inc. (formerly known as Administaff) (human resources provider); Chief Executive Officer, Texana Timber LP (sustainable forestry company); Director of Cross Timbers Quail Research Ranch (non-profit); and member of the U.S. House of Representatives | | 158 | | None |
Cynthia Hostetler — 1962 Trustee | | 2017 | | Non-Executive Director and Trustee of a number of public and private business corporations Formerly: Head of Investment Funds and Private Equity, Overseas Private Investment Corporation; President, First Manhattan Bancorporation, Inc.; Attorney, Simpson Thacher & Bartlett LLP | | 158 | | Vulcan Materials Company (construction materials company); Trilinc Global Impact Fund; Aberdeen Investment Funds (4 portfolios); Artio Global Investment LLC (mutual fund complex); Edgen Group, Inc. (specialized energy and infrastructure products distributor) |
Eli Jones — 1961 Trustee | | 2016 | | Professor and Dean, Mays Business School — Texas A&M University Formerly: Professor and Dean, Walton College of Business, University of Arkansas and E.J. Ourso College of Business, Louisiana State University; Director, Arvest Bank | | 158 | | Insperity, Inc. (formerly known as Administaff) (human resources provider) |
Prema Mathai-Davis — 1950 Trustee | | 1998 | | Retired. | | 158 | | None |
Teresa M. Ressel — 1962 Trustee | | 2017 | | Non-executive director and trustee of a number of public and private business corporations Formerly: Chief Financial Officer, Olayan America, The Olayan Group (international investor/commercial/industrial); Chief Executive Officer, UBS Securities LLC; Group Chief Operating Officer, Americas, UBS AG; Assistant Secretary for Management & Budget and CFO, US Department of the Treasury | | 158 | | Atlantic Power Corporation (power generation company); ON Semiconductor Corp. (semiconductor supplier) |
Ann Barnett Stern — 1957 Trustee | | 2017 | | President and Chief Executive Officer, Houston Endowment Inc. (private philanthropic institution) Formerly: Executive Vice President and General Counsel, Texas Children’s Hospital; Attorney, Beck, Redden and Secrest, LLP; Business Law Instructor, University of St. Thomas; Attorney, Andrews & Kurth LLP | | 158 | | Federal Reserve Bank of Dallas |
Raymond Stickel, Jr. — 1944 Trustee | | 2005 | | Retired. Formerly: Director, Mainstay VP Series Funds, Inc. (25 portfolios); Partner, Deloitte & Touche | | 158 | | None |
Robert C. Troccoli — 1949 Trustee | | 2016 | | Adjunct Professor, University of Denver — Daniels College of Business Formerly: Senior Partner, KPMG LLP | | 158 | | None |
Christopher L. Wilson — 1957 Trustee | | 2017 | | Non-executive director and trustee of a number of public and private business corporations Formerly: Managing Partner, CT2, LLC (investing and consulting firm); President/Chief Executive Officer, Columbia Funds, Bank of America Corporation; President/Chief Executive Officer, CDC IXIS Asset Management Services, Inc.; Principal & Director of Operations, Scudder Funds, Scudder, Stevens & Clark, Inc.; Assistant Vice President, Fidelity Investments | | 158 | | TD Asset Management USA Inc. (mutual fund complex) (22 portfolios); ISO New England, Inc. (non-profit organization managing regional electricity market) |
Invesco V.I. High Yield Fund
Trustees and Officers—(continued)
| | | | | | | | |
Name, Year of Birth and
Position(s) Held with the Trust | | Trustee and/
or Officer Since | | Principal Occupation(s)
During Past 5 Years | | Number of
Funds in Fund
Complex
Overseen by
Trustee | | Other Directorship(s)
Held by Trustee During
Past 5 Years |
| Other Officers | | | | | | | | |
Sheri Morris — 1964 President, Principal Executive Officer and Treasurer | | 1999 | | President, Principal Executive Officer and Treasurer, The Invesco Funds; Vice President, Invesco Advisers, Inc. (formerly known as Invesco Institutional (N.A.), Inc.) (registered investment adviser); and Vice President, PowerShares Exchange-Traded Fund Trust, PowerShares Exchange-Traded Fund Trust II, PowerShares India Exchange-Traded Fund Trust, PowerShares Actively Managed Exchange-Traded Fund Trust, PowerShares Actively Managed Exchange-Traded Commodity Fund Trust and PowerShares Exchange-Traded Self-Indexed Fund Trust Formerly: Vice President and Principal Financial Officer, The Invesco Funds; Vice President, Invesco Aim Advisers, Inc., Invesco Aim Capital Management, Inc. and Invesco Aim Private Asset Management, Inc.; Assistant Vice President and Assistant Treasurer, The Invesco Funds and Assistant Vice President, Invesco Advisers, Inc., Invesco Aim Capital Management, Inc. and Invesco Aim Private Asset Management, Inc.; and Treasurer, PowerShares Exchange-Traded Fund Trust, PowerShares Exchange-Traded Fund Trust II, PowerShares India Exchange-Traded Fund Trust and PowerShares Actively Managed Exchange-Traded Fund Trust | | N/A | | N/A |
Russell C. Burk — 1958 Senior Vice President and Senior Officer | | 2005 | | Senior Vice President and Senior Officer, The Invesco Funds | | N/A | | N/A |
John M. Zerr — 1962 Senior Vice President, Chief Legal Officer and Secretary | | 2006 | | Director, Senior Vice President, Secretary and General Counsel, Invesco Management Group, Inc. (formerly known as Invesco AIM Management Group, Inc.); Senior Vice President, Invesco Advisers, Inc. (formerly known as Invesco Institutional (N.A.), Inc.) (registered investment adviser); Senior Vice President and Secretary, Invesco Distributors, Inc. (formerly known as Invesco AIM Distributors, Inc.); Director, Vice President and Secretary, Invesco Investment Services, Inc. (formerly known as Invesco AIM Investment Services, Inc.) Senior Vice President, Chief Legal Officer and Secretary, The Invesco Funds; Managing Director, Invesco PowerShares Capital Management LLC; Director, Secretary and General Counsel, Invesco Investment Advisers LLC (formerly known as Van Kampen Asset Management); Secretary and General Counsel, Invesco Capital Markets, Inc. (formerly known as Van Kampen Funds Inc.) and Chief Legal Officer, PowerShares Exchange-Traded Fund Trust, PowerShares Exchange-Traded Fund Trust II, PowerShares India Exchange-Traded Fund Trust, PowerShares Actively Managed Exchange-Traded Fund Trust, PowerShares Actively Managed Exchange-Traded Commodity Fund Trust and PowerShares Exchange-Traded Self-Indexed Fund Trust; Manager and Secretary, Invesco Indexing LLC Formerly: Director, Secretary, General Counsel and Senior Vice President, Van Kampen Exchange Corp.; Director, Vice President and Secretary, IVZ Distributors, Inc. (formerly known as INVESCO Distributors, Inc.); Director and Vice President, INVESCO Funds Group, Inc.; Director and Vice President, Van Kampen Advisors Inc.; Director, Vice President, Secretary and General Counsel, Van Kampen Investor Services Inc.; Director, Invesco Distributors, Inc. (formerly known as Invesco AIM Distributors, Inc.); Director, Senior Vice President, General Counsel and Secretary, Invesco AIM Advisers, Inc. and Van Kampen Investments Inc.; Director, Vice President and Secretary, Fund Management Company; Director, Senior Vice President, Secretary, General Counsel and Vice President, Invesco AIM Capital Management, Inc.; Chief Operating Officer and General Counsel, Liberty Ridge Capital, Inc. (an investment adviser); Vice President and Secretary, PBHG Funds (an investment company) and PBHG Insurance Series Fund (an investment company); Chief Operating Officer, General Counsel and Secretary, Old Mutual Investment Partners (a broker-dealer); General Counsel and Secretary, Old Mutual Fund Services (an administrator) and Old Mutual Shareholder Services (a shareholder servicing center); Executive Vice President, General Counsel and Secretary, Old Mutual Capital, Inc. (an investment adviser); and Vice President and Secretary, Old Mutual Advisors Funds (an investment company) | | N/A | | N/A |
Gregory G. McGreevey — 1962 Senior Vice President | | 2012 | | Senior Managing Director, Invesco Ltd.; Director, Chairman, President, and Chief Executive Officer, Invesco Advisers, Inc. (formerly known as Invesco Institutional (N.A.), Inc.) (registered investment adviser); Senior Vice President, Invesco Management Group, Inc.; Director, Invesco Mortgage Capital, Inc. and Invesco Senior Secured Management, Inc.; and Senior Vice President, The Invesco Funds Formerly: Assistant Vice President, The Invesco Funds | | N/A | | N/A |
Kelli Gallegos — 1970 Vice President, Principal Financial Officer and Assistant Treasurer | | 2008 | | Vice President, Principal Financial Officer and Assistant Treasurer, The Invesco Funds; Assistant Treasurer, Invesco PowerShares Capital Management LLC, PowerShares Exchange-Traded Fund Trust, PowerShares Exchange-Traded Fund Trust II, PowerShares India Exchange-Traded Fund Trust, PowerShares Actively Managed Exchange-Traded Fund Trust, PowerShares Actively Managed Exchange-Traded Commodity Fund Trust and PowerShares Exchange-Traded Self-Indexed Fund Trust Formerly: Assistant Vice President, The Invesco Funds | | N/A | | N/A |
Invesco V.I. High Yield Fund
Trustees and Officers—(continued)
| | | | | | | | |
Name, Year of Birth and
Position(s) Held with the Trust | | Trustee and/
or Officer Since | | Principal Occupation(s)
During Past 5 Years | | Number of
Funds in Fund
Complex
Overseen by
Trustee | | Other Directorship(s)
Held by Trustee During
Past 5 Years |
| Other Officers—(continued) | | | | | | | | |
Tracy Sullivan — 1962 Vice President, Chief Tax Officer and Assistant Treasurer | | 2008 | | Vice President, Chief Tax Officer and Assistant Treasurer, The Invesco Funds; Assistant Treasurer, Invesco PowerShares Capital Management LLC, PowerShares Exchange-Traded Fund Trust, PowerShares Exchange-Traded Fund Trust II, PowerShares India Exchange-Traded Fund Trust, PowerShares Actively Managed Exchange-Traded Fund Trust, PowerShares Actively Managed Exchange-Traded Commodity Fund Trust and PowerShares Exchange-Traded Self-Indexed Fund Trust Formerly: Assistant Vice President, The Invesco Funds | | N/A | | N/A |
Crissie M. Wisdom — 1969 Anti-Money Laundering Compliance Officer | | 2013 | | Anti-Money Laundering Compliance Officer, Invesco Advisers, Inc. (formerly known as Invesco Institutional (N.A.), Inc.) (registered investment adviser), Invesco Capital Markets, Inc. (formerly known as Van Kampen Funds Inc.), Invesco Distributors, Inc., Invesco Investment Services, Inc., Invesco Management Group, Inc., The Invesco Funds, and PowerShares Exchange-Traded Fund Trust, PowerShares Exchange-Traded Fund Trust II, PowerShares India Exchange-Traded Fund Trust, PowerShares Actively Managed Exchange-Traded Fund Trust, PowerShares Actively Managed Exchange-Traded Commodity Fund Trust and PowerShares Exchange-Traded Self-Indexed Fund Trust; Anti-Money Laundering Compliance Officer and Bank Secrecy Act Officer, INVESCO National Trust Company and Invesco Trust Company; and Fraud Prevention Manager and Controls and Risk Analysis Manager for Invesco Investment Services, Inc. Formerly: Anti-Money Laundering Compliance Officer, Van Kampen Exchange Corp. | | N/A | | N/A |
Robert R. Leveille — 1969 Chief Compliance Officer | | 2016 | | Chief Compliance Officer, Invesco Advisers, Inc. (registered investment adviser); and Chief Compliance Officer, The Invesco Funds Formerly: Chief Compliance Officer, Putnam Investments and the Putnam Funds | | N/A | | N/A |
The Statement of Additional Information of the Trust includes additional information about the Fund’s Trustees and is available upon request, without charge, by calling 1.800.959.4246. Please refer to the Fund’s Statement of Additional Information for information on the Fund’s sub-advisers.
| | | | | | |
Office of the Fund 11 Greenway Plaza, Suite 1000 Houston, TX 77046-1173 | | Investment Adviser Invesco Advisers, Inc. 1555 Peachtree Street, N.E. Atlanta, GA 30309 | | Distributor Invesco Distributors, Inc. 11 Greenway Plaza, Suite 1000 Houston, TX 77046-1173 | | Auditors PricewaterhouseCoopers LLP 1000 Louisiana Street, Suite 5800 Houston, TX 77002-5678 |
| | | |
| | | | | | |
Counsel to the Fund Stradley Ronon Stevens & Young, LLP 2005 Market Street, Suite 2600 Philadelphia, PA 19103-7018 | | Counsel to the Independent Trustees Goodwin Procter LLP 901 New York Avenue, N.W. Washington, D.C. 20001 | | Transfer Agent Invesco Investment Services, Inc. 11 Greenway Plaza, Suite 1000 Houston, TX 77046-1173 | | Custodian State Street Bank and Trust Company 225 Franklin Street Boston, MA 02110-2801 |
Invesco V.I. High Yield Fund
| | | | |
| | |
 | | Annual Report to Shareholders | | December 31, 2017 |
| | |
| | Invesco V.I. International Growth Fund |

| | |
| | The Fund provides a complete list of its holdings four times in each fiscal year, at the quarter-ends. For the second and fourth quarters, the lists appear in the Fund’s semiannual and annual reports to shareholders. For the first and third quarters, the Fund files the lists with the Securities and Exchange Commission (SEC) on Form N-Q. The Fund’s Form N-Q filings are available on the SEC website, sec.gov. Copies of the Fund’s Forms N-Q may be reviewed and copied at the SEC Public Reference Room in Washington, D.C. You can obtain information on the operation of the Public Reference Room, including information about duplicating fee charges, by calling 202 551 8090 or 800 732 0330, or by electronic request at the following email address: publicinfo@sec.gov. The SEC file numbers for the Fund are 811-07452 and 033-57340. The Fund’s most recent portfolio holdings, as filed on Form N-Q, have also been made available to insurance companies issuing variable annuity contracts and variable life insurance policies (“variable products”) that invest in the Fund. A description of the policies and procedures that the Fund uses to determine how to vote proxies relating to portfolio securities is available without charge, upon request, from our Client Services department at 800 959 4246 or at invesco.com/proxyguidelines. The information is also available on the SEC website, sec.gov. Information regarding how the Fund voted proxies related to its portfolio securities during the most recent 12-month period ended June 30 is available at invesco.com/ proxysearch. The information is also available on the SEC website, sec.gov. Invesco Advisers, Inc. is an investment adviser; it provides investment advisory services to individual and institutional clients and does not sell securities. Invesco Distributors, Inc. is the US distributor for Invesco Ltd.’s retail mutual funds, exchange-traded funds and institutional money market funds. Both are wholly owned, indirect subsidiaries of Invesco Ltd. This report must be accompanied or preceded by a currently effective Fund prospectus and variable product prospectus, which contain more complete information, including sales charges and expenses. Investors should read each carefully before investing. NOT FDIC INSURED | MAY LOSE VALUE | NO BANK GUARANTEE |
| |
| | Invesco Distributors, Inc. VIIGR-AR-1 02082018 1223 |
Management’s Discussion of Fund Performance
Performance summary
For the year ended December 31, 2017, Series I shares of Invesco V.I. International Growth Fund (the Fund) underperformed the Custom Invesco International Growth Index, the Fund’s style-specific benchmark.
Your Fund’s long-term performance appears later in this report.
Fund vs. Indexes
Total returns, 12/31/16 to 12/31/17, excluding variable product issuer charges.
If variable product issuer charges were included, returns would be lower.
| | | | | |
Series I Shares | | | | 23.00 | % |
Series II Shares | | | | 22.73 | |
MSCI All Country World ex-U.S. Index▼ (Broad Market Index) | | | | 27.19 | |
Custom Invesco International Growth Index∎ (Style-Specific Index) | | | | 32.01 | |
Lipper VUF International Large-Cap Growth Funds Index◆ (Peer Group Index) | | | | 24.53 | |
Source(s): ▼FactSet Research Systems Inc.; ∎Invesco, FactSet Research Systems Inc.; ◆Lipper Inc. | |
Market conditions and your Fund
Global equity markets delivered positive, and in many cases double-digit, returns over the year ended December 31, 2017. These gains were broadly driven by firming global economic growth, as well as stronger corporate fundamentals. After trailing international markets for the first three quarters of the year, the US equity market outperformed international markets in the fourth quarter. US equity markets received a boost from the prospect of sweeping individual and corporate tax cuts, with a final tax bill approved by Congress in December.
In developed markets, the US Federal Reserve (the Fed) met in December and increased the benchmark fed funds target rate by 0.25% to a target range of
1.25% to 1.50%.1 Combined with two other interest rate increases earlier in 2017, the Fed’s decision reflects a more constructive outlook for the US economy. In contrast, the European Central Bank held rates steady at 0% throughout 2017 and maintained its generous bond buying program through at least September 2018, or beyond, until it sees a sustained adjustment in the path of inflation.
Most emerging markets continued to perform well during 2017. In addition to the improving global economic outlook, other positive tailwinds included reduced expectations for a major shift in US trade policy as well as stronger oil prices. Oil moved higher on production restraint by OPEC and Russia, benefiting commodity-driven emerging markets.
At the close of 2017, equity market valuations in developed and emerging markets appeared relatively full in absolute terms, but non-US equity markets were trading at a material discount to the US. In sum, while valuations were not cheap, recent earnings growth and upward earnings revisions improved in many non-US developed markets. Interestingly, while 2017 marked the eighth year of the global bull market, we saw a shift in leadership as international stocks outperformed US stocks for the year. Prior to 2017, international stocks had trailed US stocks for four consecutive years and in six of the last seven years.
Regardless of the macroeconomic environment, we remain focused on our bottom-up investment approach of identifying attractive companies that we believe
have sustainable earnings growth, efficient capital allocation and attractive prices.
During the reporting period, Fund holdings in the consumer staples sector outperformed those of the style-specific benchmark and were among the most significant contributors to the Fund’s relative performance. Within this sector, the Fund’s food and beverage holdings showed particular strength.
From an individual securities perspective, Kweichow Moutai, a Chinese spirits company, was the top contributor to Fund performance for the reporting period. Moutai’s strong performance was driven by a growing demand from young Chinese consumers for the company’s iconic grain liquor products. The company’s investment in marketing campaigns has been successful in attracting a new set of affluent consumers who buy Moutai for social events, leading to record revenues for the company. Toward the end of the reporting period, we took profits and trimmed our position in Moutai as we believed valuations started to appear a little stretched.
The Fund’s holdings in the information technology sector, however, under-performed those of the style-specific benchmark and were the most significant detractors from the Fund’s relative performance over the reporting period. Not owning two of the style-specific benchmark’s best-performing stocks over the reporting period – China-based Tencent Holdings and Alibaba Group – was a meaningful drag on relative returns. The market showed little concern for valuation over the year, with investors accepting very high valuations for these types of momentum growth stocks. The Fund did not hold these names because we believed elevated valuations did not offer attractive risk-reward profiles.
| | |
| Portfolio Composition |
By sector | % of total net assets |
| | |
| |
Financials | | 24.6% |
Information Technology | | 19.4 |
Industrials | | 16.6 |
Consumer Staples | | 14.3 |
Consumer Discretionary | | 7.9 |
Health Care | | 4.1 |
Energy | | 4.0 |
Materials | | 2.2 |
Money Market Funds Plus Other Assets Less Liabilities | | 6.9 |
| | |
| Top 10 Equity Holdings* |
% of total net assets |
| |
| 1. Deutsche Boerse AG | | 3.0% |
2. SAP S.E. | | 2.9 |
3. RELX PLC | | 2.7 |
4. CGI Group Inc.-Class A | | 2.7 |
5. Broadcom Ltd. | | 2.5 |
6. British American Tobacco PLC | | 2.4 |
7. Schneider Electric S.E. | | 2.3 |
8. NAVER Corp. | | 2.2 |
9. Amcor Ltd. | | 2.2 |
10. CK Hutchison Holdings Ltd. | | 2.2 |
| | |
| Total Net Assets | | $2.1 billion |
| |
| Total Number of Holdings* | | 64 |
The Fund’s holdings are subject to change, and there is no assurance that the Fund will continue to hold any particular security.
*Excluding money market fund holdings.
Data presented here are as of December 31, 2017.
Invesco V.I. International Growth Fund
Fund holdings in the consumer discretionary and health care sectors under-performed those of the style-specific benchmark and detracted from relative performance, as well. Israel-based pharmaceutical maker Teva Pharmaceutical Industries was the largest individual detractor for the reporting period. Teva reported disappointing results over the year, largely due to a tough pricing environment for generic drugs. Management reduced revenue and cash flow guidance for Teva’s fiscal year, citing the Food and Drug Administration’s delayed approval on new generic drugs. We sold most of our position in Teva in the third quarter of 2017 and exited the remaining position in October, as we became convinced that it no longer aligned with our earnings, quality and valuation (EQV) approach.
The Fund’s cash position in a strong upmarket environment dragged on relative results, as well. As the market moved higher, we trimmed and/or sold a number of stocks because of increased valuations. Although we did initiate several new positions in the Fund, we found it challenging to redeploy all the proceeds because valuation is such an integral part of our EQV approach and many high-quality stocks remained very expensive.
During the year, we continued to look for opportunities to improve the growth potential and quality of the Fund’s portfolio by adding companies based on our EQV outlook for each company. There were several new additions to the portfolio, including Brazilian banking and financial services company Banco Bradesco, Italian bank Intesa Sanpaolo, South Korean internet content service operator NAVER and Brazilian educational company Kroton Educacional.
Over the reporting period, we reduced our weighting in the consumer discretionary sector, particularly in media companies, under the growing concern that advertising agencies and television operations in Europe were facing stronger structural headwinds than some believe. We exited our positions in advertising agencies WPP and Publicis Groupe after consistently trimming these positions since 2016. We also exited our position in SKY as the likelihood that the company would be acquired by 21st Century Fox decreased, while at the same time, paid subscription television fundamentals worsened. In contrast, we increased the Fund’s exposure to the financials sector with the addition of Dutch multinational financial services company ING Groep, Banco Bradesco and Intesa Sanpaolo.
As always, regardless of the macroeconomic environment, we remain focused on a bottom-up investment approach of identifying attractive companies that fit our EQV-focused investment process. We continue to look for companies that exhibit the following characteristics: strong organic growth; high returns on capital; pricing power; strong balance sheets; cash generation; and reasonable valuations. In addition, we continue to favor companies that are able to consistently generate cash during weak economic environments. We believe that this balanced EQV-focused approach may help deliver attractive returns over the long term.
We thank you for your continued investment in Invesco V.I. International Growth Fund.
1 Source: US Federal Reserve
The views and opinions expressed in management’s discussion of Fund performance are those of Invesco Advisers, Inc. These views and opinions are subject to change at any time based on factors such as market and economic conditions. These views and opinions may not be relied upon as investment advice or recommendations, or as an offer for a particular security. The information is not a complete analysis of every aspect of any market, country, industry, security or the Fund. Statements of fact are from sources considered reliable, but Invesco Advisers, Inc. makes no representation or warranty as to their completeness or accuracy. Although historical performance is no guarantee of future results, these insights may help you understand our investment management philosophy.
See important Fund and, if applicable, index disclosures later in this report.
| | |

| | Clas Olsson Portfolio Manager and Chief Investment Officer of Invesco’s International and Global |
| Growth Team, is manager of Invesco V.I. International Growth Fund. He joined Invesco in 1994. Mr. Olsson became a commissioned officer at the Royal Swedish Naval Academy in 1988. He also earned a BBA from The University of Texas at Austin. |
| | |

| | Brent Bates Chartered Financial Analyst, Portfolio Manager, is manager of Invesco V.I. International Growth |
| Fund. He joined Invesco in 1996. Mr. Bates earned a BBA from Texas A&M University and is a Certified Public Accountant. |
| | |
 | | Matthew Dennis Chartered Financial Analyst, Portfolio Manager, is manager of Invesco V.I. International Growth |
| Fund. He joined Invesco in 2000. Mr. Dennis earned a BA in economics from The University of Texas at Austin and an MS in finance from Texas A&M University. |
| | |
 | | Mark Jason Chartered Financial Analyst, Portfolio Manager, is manager of Invesco V.I. International Growth |
| Fund. He joined Invesco in 2001. Mr. Jason earned a BS in finance and a BS in real estate from California State University, Northridge. |
| | |
 | | Richard Nield Chartered Financial Analyst, Portfolio Manager, is manager of Invesco V.I. International Growth |
| Fund. He joined Invesco in 2000. Mr. Nield earned a Bachelor of Commerce degree in finance and international business from McGill University in Montreal. |
Invesco V.I. International Growth Fund
Your Fund’s Long-Term Performance
Results of a $10,000 Investment – Oldest Share Class(es)
Fund and index data from 12/31/07
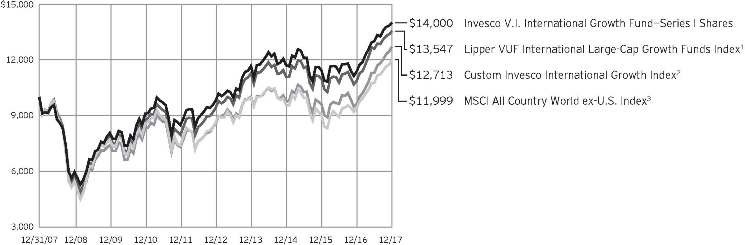
| 2 | Source(s): Invesco, FactSet Research Systems Inc. |
| 3 | Source: FactSet Research Systems Inc. |
Past performance cannot guarantee
comparable future results.
| | | | | |
Average Annual Total Returns |
As of 12/31/17 | | | | | |
| |
Series I Shares | | | | | |
Inception (5/5/93) | | | | 7.40 | % |
10 Years | | | | 3.42 | |
5 Years | | | | 7.38 | |
1 Year | | | | 23.00 | |
| |
Series II Shares | | | | | |
Inception (9/19/01) | | | | 7.72 | % |
10 Years | | | | 3.16 | |
5 Years | | | | 7.12 | |
1 Year | | | | 22.73 | |
The performance of the Fund’s Series I and Series II share classes will differ primarily due to different class expenses.
The performance data quoted represent past performance and cannot guarantee comparable future results; current performance may be lower or higher. Please contact your variable product issuer or financial adviser for the most recent month-end variable product performance. Performance figures reflect Fund expenses, reinvested distributions and changes in net asset value. Investment return and
principal value will fluctuate so that you may have a gain or loss when you sell shares.
The net annual Fund operating expense ratio set forth in the most recent Fund prospectus as of the date of this report for Series I and Series II shares was 0.92% and 1.17%, respectively.1 The total annual Fund operating expense ratio set forth in the most recent Fund prospectus as of the date of this report for Series I and Series II shares was 0.93% and 1.18%, respectively. The expense ratios presented above may vary from the expense ratios presented in other sections of this report that are based on expenses incurred during the period covered by this report.
Invesco V.I. International Growth Fund, a series portfolio of AIM Variable Insurance Funds (Invesco Variable Insurance Funds), is currently offered through insurance companies issuing variable products. You cannot purchase shares of the Fund directly. Performance figures given represent the Fund and are not intended to reflect
actual variable product values. They do not reflect sales charges, expenses and fees assessed in connection with a variable product. Sales charges, expenses and fees, which are determined by the variable product issuers, will vary and will lower the total return.
The most recent month-end performance at the Fund level, excluding variable product charges, is available at 800 451 4246. As mentioned above, for the most recent month-end performance including variable product charges, please contact your variable product issuer or financial adviser.
Fund performance reflects any applicable fee waivers and/or expense reimbursements. Had the adviser not waived fees and/or reimbursed expenses currently or in the past, returns would have been lower. See current prospectus for more information.
| 1 | Total annual Fund operating expenses after any contractual fee waivers and/or expense reimbursements by the adviser in effect through at least June 30, 2019. See current prospectus for more information. |
Invesco V.I. International Growth Fund
Invesco V.I. International Growth Fund’s investment objective is long-term growth of capital.
| ∎ | | Unless otherwise stated, information presented in this report is as of December 31, 2017, and is based on total net assets. |
| ∎ | | Unless otherwise noted, all data provided by Invesco. |
Principal risks of investing in the Fund
Depositary receipts risk. Investing in depositary receipts involves the same risks as direct investments in foreign securities. In addition, the underlying issuers of certain depositary receipts are under no obligation to distribute shareholder communications or pass through any voting rights with respect to the deposited securities to the holders of such receipts. The Fund may therefore receive less timely information or have less control than if it invested directly in the foreign issuer.
Derivatives risk. The value of a derivative instrument depends largely on (and is derived from) the value of an underlying security, currency, commodity, interest rate, index or other asset (each referred to as an underlying asset). In addition to risks relating to the underlying assets, the use of derivatives may include other, possibly greater, risks, including counterparty, leverage and liquidity risks. Counterparty risk is the risk that the counterparty to the derivative contract will default on its obligation to pay the Fund the amount owed or otherwise perform under the derivative contract. Derivatives create leverage risk because they do not require payment up front equal to the economic exposure created by owning the derivative. As a result, an adverse change in the value of the underlying asset could result in the Fund sustaining a loss that is substantially greater than the amount invested in the derivative, which may make the Fund’s returns more volatile and increase the risk of loss. Derivative instruments may also be less liquid than more traditional investments and the Fund may be unable to sell or close out its derivative positions at a desirable time or price. This risk may be more acute under adverse market conditions, during which the Fund may be most in need of liquidating its derivative positions. Derivatives may also be harder to value, less tax efficient and subject to changing government regulation that could impact the Fund’s ability to use certain derivatives or their cost. Also, derivatives used for hedging or to gain or limit exposure to a particular market segment may not provide the expected benefits, particularly during adverse market conditions.
Emerging markets securities risk.
Emerging markets (also referred to as developing markets) are generally subject to greater market volatility, political, social and economic instability, uncertain trading markets and more governmental limitations on foreign investment than more developed markets. In addition, companies operating in emerging markets may be subject to lower trading volume and greater price fluctuations than companies in more developed markets. Securities law and the enforcement of systems of taxation in many emerging market countries may change quickly and unpredictably. In addition, investments in emerging markets securities may also be subject to additional transaction costs, delays in settlement procedures, and lack of timely information.
Foreign securities risk. The Fund’s foreign investments may be adversely affected by political and social instability, changes in economic or taxation policies, difficulty in enforcing obligations, decreased liquidity or increased volatility. Foreign investments also involve the risk of the possible seizure, nationalization or expropriation of the issuer or foreign deposits (in which the Fund could lose its entire investments in a certain market) and the possible adoption of foreign governmental restrictions such as exchange controls. Unless the Fund has hedged its foreign securities risk, foreign securities risk also involves the risk of negative foreign currency rate fluctuations, which may cause the value of securities denominated in such foreign currency (or other instruments through which the Fund has exposure to foreign currencies) to decline in value. Currency exchange rates may fluctuate significantly over short periods of time. Currency hedging strategies, if used, are not always successful.
Geographic focus risk. The Fund may from time to time invest a substantial amount of its assets in securities of issuers located in a single country or a limited number of countries. Adverse economic, political or social conditions in those countries may therefore have a significant negative impact on the Fund’s investment performance.
Growth investing risk. Growth stocks tend to be more expensive relative to the issuing company’s earnings or assets compared with other types of stock. As a
result, they tend to be more sensitive to changes in, or investors’ expectations of, the issuing company’s earnings and can be more volatile.
Investing in the European Union risk. Investments in certain countries in the European Union are susceptible to high economic risks associated with high levels of debt, such as investments in sovereign debt of Greece, Italy and Spain. Efforts of the member states to further unify their economic and monetary policies may increase the potential for the downward movement of one member state’s market to cause a similar effect on other member states’ markets. Separately, the European Union faces issues involving its membership, structure, procedures and policies. The exit of one or more member states from the European Union, such as the United Kingdom (UK) which has announced its intention to exit, would place its currency and banking system in jeopardy. The exit by the UK or other member states will likely result in increased volatility, illiquidity and potentially lower economic growth in the affected markets, which will adversely affect the Fund’s investments.
Management risk. The Fund is actively managed and depends heavily on the Adviser’s judgment about markets, interest rates or the attractiveness, relative values, liquidity, or potential appreciation of particular investments made for the Fund’s portfolio. The Fund could experience losses if these judgments prove to be incorrect. Additionally, legislative, regulatory, or tax developments may adversely affect management of the Fund and, therefore, the ability of the Fund to achieve its investment objective.
Market risk. The market values of the Fund’s investments, and therefore the value of the Fund’s shares, will go up and down, sometimes rapidly or unpredictably. Market risk may affect a single issuer, industry or section of the economy, or it may affect the market as a whole. Individual stock prices tend to go up and down more dramatically than those of certain other types of investments, such as bonds. During a general downturn in the financial markets, multiple asset classes may decline in value. When markets perform well, there can be no assurance that specific investments held by the Fund will rise in value.
Invesco V.I. International Growth Fund
Mid-capitalization companies risk. Mid-capitalization companies tend to be more vulnerable to changing market conditions and may have more limited product lines and markets, less experienced management and fewer financial resources than larger companies. These companies’ securities may be more volatile and less liquid than those of more established companies, and their returns may vary, sometimes significantly, from the overall securities market.
Preferred securities risk. Preferred securities are subject to issuer-specific and market risks applicable generally to equity securities. Preferred securities also may be subordinated to bonds or other debt instruments, subjecting them to a greater risk of non-payment, may be less liquid than many other securities, such as common stocks, and generally offer no voting rights with respect to the issuer.
About indexes used in this report
The MSCI All Country World ex-U.S. Index is an index considered representative of developed and emerging market stock markets, excluding the US. The index is computed using the net return, which withholds applicable taxes for nonresident investors.
The Custom Invesco International Growth Index is composed of the MSCI EAFE Growth Index through February 28, 2013, and the MSCI All Country World ex-U.S. Growth Index thereafter.
The Lipper VUF International Large-Cap Growth Funds Index is an unmanaged index considered representative of international large-cap growth variable insurance underlying funds tracked by Lipper.
The MSCI EAFE® Growth Index is an unmanaged index considered representative of the growth stocks of Europe, Australasia and the Far East. The index is computed using the net return, which withholds applicable taxes for non-resident investors.
The MSCI All Country World ex-U.S. Growth Index is a market capitalization weighted index that includes growth companies in developed and emerging markets throughout the world, excluding the US. The index is computed using the net return, which withholds applicable taxes for non-resident investors.
The Fund is not managed to track the performance of any particular index, including the index(es) described here, and consequently, the performance of the Fund may deviate significantly from the performance of the index(es).
A direct investment cannot be made in an index. Unless otherwise indicated, index results include reinvested dividends, and they do not reflect sales charges. Performance of the peer group, if applicable, reflects fund expenses; performance of a market index does not.
Other information
CPA® and Certified Public Accountant® are trademarks owned by the American Institute of Certified Public Accountants.
The returns shown in management’s discussion of Fund performance are based on net asset values calculated for shareholder transactions. Generally accepted accounting principles require adjustments to be made to the net assets of the Fund at period end for financial reporting purposes, and as such, the net asset values for shareholder transactions and the returns based on those net asset values may differ from the net asset values and returns reported in the Financial Highlights. Additionally, the returns and net asset values shown throughout this report are at the Fund level only and do not include variable product issuer charges. If such charges were included, the total returns would be lower.
Industry classifications used in this report are generally according to the Global Industry Classification Standard, which was developed by and is the exclusive property and a service mark of MSCI Inc. and Standard & Poor’s.
Invesco V.I. International Growth Fund
Schedule of Investments
December 31, 2017
| | | | | | | | |
| | | Shares | | | Value | |
Common Stocks & Other Equity Interests–93.12% | |
| Australia–4.73% | |
Amcor Ltd. | | | 3,858,093 | | | $ | 46,354,137 | |
Brambles Ltd. | | | 4,496,007 | | | | 35,243,419 | |
CSL Ltd. | | | 151,428 | | | | 16,665,319 | |
| | | | | | | | 98,262,875 | |
|
| Brazil–6.15% | |
B3 S.A.–Brasil, Bolsa, Balcão | | | 5,188,534 | | | | 35,681,450 | |
Banco Bradesco S.A.–ADR | | | 3,309,450 | | | | 33,888,768 | |
Cielo S.A. | | | 4,645,489 | | | | 32,848,135 | |
Kroton Educacional S.A. | | | 4,557,713 | | | | 25,316,806 | |
| | | | | | | | 127,735,159 | |
|
| Canada–8.61% | |
Canadian National Railway Co. | | | 278,269 | | | | 22,947,396 | |
Cenovus Energy Inc. | | | 1,584,586 | | | | 14,472,947 | |
CGI Group Inc.–Class A(a) | | | 1,033,899 | | | | 56,182,116 | |
Fairfax Financial Holdings Ltd. | | | 32,485 | | | | 17,299,316 | |
Great-West Lifeco Inc. | | | 618,170 | | | | 17,262,922 | |
PrairieSky Royalty Ltd. | | | 935,571 | | | | 23,863,797 | |
Suncor Energy, Inc. | | | 731,587 | | | | 26,861,914 | |
| | | | | | | | 178,890,408 | |
|
| China–2.27% | |
Baidu, Inc.–ADR(a) | | | 75,579 | | | | 17,701,357 | |
Kweichow Moutai Co., Ltd.–Class A | | | 274,683 | | | | 29,444,373 | |
| | | | | | | | 47,145,730 | |
|
| Denmark–1.95% | |
Carlsberg A/S–Class B | | | 338,151 | | | | 40,506,405 | |
|
| France–6.20% | |
Essilor International S.A. | | | 170,138 | | | | 23,464,924 | |
Pernod Ricard S.A. | | | 213,873 | | | | 33,859,007 | |
Schneider Electric S.E. | | | 560,724 | | | | 47,553,692 | |
Vinci S.A. | | | 160,845 | | | | 16,409,858 | |
Vivendi S.A. | | | 275,505 | | | | 7,410,951 | |
| | | | | | | | 128,698,432 | |
|
| Germany–10.48% | |
Allianz S.E. | | | 193,619 | | | | 44,339,559 | |
Deutsche Boerse AG | | | 537,701 | | | | 62,324,665 | |
Deutsche Post AG | | | 686,478 | | | | 32,609,731 | |
GEA Group AG | | | 380,535 | | | | 18,245,555 | |
SAP S.E. | | | 536,632 | | | | 60,167,883 | |
| | | | | | | | 217,687,393 | |
|
| Hong Kong–3.60% | |
CK Hutchison Holdings Ltd. | | | 3,564,268 | | | | 44,753,509 | |
Galaxy Entertainment Group Ltd. | | | 3,747,000 | | | | 29,962,461 | |
| | | | | | | | 74,715,970 | |
| | | | | | | | |
| | | Shares | | | Value | |
| Italy–1.80% | |
Intesa Sanpaolo S.p.A. | | | 6,606,459 | | | $ | 21,909,663 | |
Mediobanca S.p.A. | | | 1,363,085 | | | | 15,437,079 | |
| | | | | | | | 37,346,742 | |
|
| Japan–4.53% | |
FANUC Corp. | | | 79,200 | | | | 19,021,496 | |
Japan Tobacco Inc. | | | 623,800 | | | | 20,103,113 | |
Kao Corp. | | | 304,300 | | | | 20,577,454 | |
Keyence Corp. | | | 23,500 | | | | 13,122,175 | |
Yahoo! Japan Corp. | | | 4,637,600 | | | | 21,280,192 | |
| | | | | | | | 94,104,430 | |
|
| Mexico–1.99% | |
Fomento Economico Mexicano, S.A.B. de C.V.–ADR | | | 441,094 | | | | 41,418,727 | |
|
| Netherlands–2.62% | |
ING Groep N.V. | | | 887,394 | | | | 16,328,089 | |
Wolters Kluwer N.V. | | | 729,545 | | | | 37,988,559 | |
| | | | | | | | 54,316,648 | |
|
| Singapore–1.75% | |
United Overseas Bank Ltd. | | | 1,846,500 | | | | 36,425,163 | |
|
| South Korea–3.32% | |
NAVER Corp. | | | 57,038 | | | | 46,489,657 | |
Samsung Electronics Co., Ltd. | | | 9,410 | | | | 22,422,486 | |
| | | | | | | | 68,912,143 | |
|
| Spain–1.73% | |
Amadeus IT Group S.A. | | | 499,786 | | | | 35,971,457 | |
|
| Sweden–2.02% | |
Investor AB–Class B | | | 920,276 | | | | 41,857,224 | |
|
| Switzerland–5.35% | |
Cie Financiere Richemont S.A. | | | 235,739 | | | | 21,347,781 | |
Julius Baer Group Ltd. | | | 634,104 | | | | 38,789,488 | |
Kuehne + Nagel International AG | | | 68,367 | | | | 12,083,934 | |
Novartis AG | | | 237,850 | | | | 20,115,816 | |
UBS Group AG | | | 1,021,009 | | | | 18,763,121 | |
| | | | | | | | 111,100,140 | |
|
| Taiwan–2.13% | |
Taiwan Semiconductor Manufacturing Co.
Ltd.–ADR | | | 1,114,584 | | | | 44,193,256 | |
|
| Thailand–2.01% | |
Kasikornbank PCL–NVDR | | | 5,855,900 | | | | 41,645,462 | |
|
| Turkey–0.95% | |
Akbank T.A.S. | | | 7,630,201 | | | | 19,828,377 | |
|
| United Kingdom–16.40% | |
British American Tobacco PLC | | | 737,749 | | | | 49,789,155 | |
See accompanying Notes to Financial Statements which are an integral part of the financial statements.
Invesco V.I. International Growth Fund
| | | | | | | | |
| | | Shares | | | Value | |
| United Kingdom–(continued) | |
Compass Group PLC | | | 1,796,968 | | | $ | 38,854,299 | |
Informa PLC | | | 2,826,649 | | | | 27,495,940 | |
Lloyds Banking Group PLC | | | 34,320,058 | | | | 31,425,573 | |
Next PLC | | | 235,786 | | | | 14,436,320 | |
Reckitt Benckiser Group PLC | | | 289,410 | | | | 27,034,778 | |
RELX PLC | | | 2,424,256 | | | | 56,792,670 | |
Royal Dutch Shell PLC–Class B | | | 545,709 | | | | 18,404,396 | |
Smith & Nephew PLC | | | 1,427,813 | | | | 24,705,079 | |
Standard Life Aberdeen PLC | | | 2,915,795 | | | | 17,187,260 | |
Unilever N.V. | | | 611,967 | | | | 34,381,543 | |
| | | | | | | | 340,507,013 | |
|
| United States–2.53% | |
Broadcom Ltd. | | | 204,498 | | | | 52,535,536 | |
Total Common Stocks & Other Equity Interests
(Cost $1,314,955,646) | | | | 1,933,804,690 | |
| | | | | | | | |
| | | Shares | | | Value | |
Money Market Funds–6.87% | |
Invesco Government & Agency Portfolio–Institutional Class,
1.18%(b) | | | 49,903,490 | | | $ | 49,903,490 | |
Invesco Liquid Assets
Portfolio–Institutional Class, 1.40%(b) | | | 35,648,361 | | | | 35,651,926 | |
Invesco Treasury Portfolio–
Institutional Class, 1.17%(b) | | | 57,032,560 | | | | 57,032,560 | |
Total Money Market Funds
(Cost $142,587,976) | | | | 142,587,976 | |
TOTAL INVESTMENTS IN SECURITIES–99.99% (Cost $1,457,543,622) | | | | 2,076,392,666 | |
OTHER ASSETS LESS LIABILITIES–0.01% | | | | 225,022 | |
NET ASSETS–100.00% | | | $ | 2,076,617,688 | |
Investment Abbreviations:
| | |
| ADR | | – American Depositary Receipt |
| NVDR | | – Non-Voting Depositary Receipt |
Notes to Schedule of Investments:
| (a) | Non-income producing security. |
| (b) | The money market fund and the Fund are affiliated by having the same investment adviser. The rate shown is the 7-day SEC standardized yield as of December 31, 2017. |
See accompanying Notes to Financial Statements which are an integral part of the financial statements.
Invesco V.I. International Growth Fund
Statement of Assets and Liabilities
December 31, 2017
Statement of Operations
For the year ended December��31, 2017
| | | | |
Assets: | | | | |
Investments in securities, at value
(Cost $1,314,955,646) | | $ | 1,933,804,690 | |
Investments in affiliated money market funds, at value and cost | | | 142,587,976 | |
Foreign currencies, at value (Cost $810,195) | | | 817,068 | |
Receivable for: | | | | |
Fund shares sold | | | 1,804,766 | |
Dividends | | | 4,478,568 | |
Investment for trustee deferred compensation and retirement plans | | | 263,618 | |
Other assets | | | 190 | |
Total assets | | | 2,083,756,876 | |
| |
Liabilities: | | | | |
Payable for: | | | | |
Investments purchased | | | 2,040,147 | |
Fund shares reacquired | | | 1,561,112 | |
Accrued foreign taxes | | | 1,442,601 | |
Accrued fees to affiliates | | | 1,672,764 | |
Accrued trustees’ and officers’ fees and benefits | | | 1,266 | |
Accrued other operating expenses | | | 127,674 | |
Trustee deferred compensation and retirement plans | | | 293,624 | |
Total liabilities | | | 7,139,188 | |
Net assets applicable to shares outstanding | | $ | 2,076,617,688 | |
| |
Net assets consist of: | | | | |
Shares of beneficial interest | | $ | 1,451,145,091 | |
Undistributed net investment income | | | 9,782,789 | |
Undistributed net realized gain (loss) | | | (3,245,251 | ) |
Net unrealized appreciation | | | 618,935,059 | |
| | | $ | 2,076,617,688 | |
| |
Net Assets: | | | | |
Series I | | $ | 627,894,360 | |
Series II | | $ | 1,448,723,328 | |
|
Shares outstanding, no par value,
with an unlimited number of shares authorized: | |
Series I | | | 15,740,358 | |
Series II | | | 36,836,045 | |
Series I: | | | | |
Net asset value per share | | $ | 39.89 | |
Series II: | | | | |
Net asset value per share | | $ | 39.33 | |
| | | | |
Investment income: | | | | |
Dividends (net of foreign withholding taxes of $3,590,358) | | $ | 42,756,626 | |
Dividends from affiliated money market funds | | | 1,251,925 | |
Total investment income | | | 44,008,551 | |
| |
Expenses: | | | | |
Advisory fees | | | 13,768,252 | |
Administrative services fees | | | 3,320,635 | |
Custodian fees | | | 589,714 | |
Distribution fees — Series II | | | 3,388,988 | |
Transfer agent fees | | | 86,915 | |
Trustees’ and officers’ fees and benefits | | | 46,391 | |
Reports to shareholders | | | 192,189 | |
Professional services fees | | | 77,636 | |
Other | | | 27,869 | |
Total expenses | | | 21,498,589 | |
Less: Fees waived | | | (167,752 | ) |
Net expenses | | | 21,330,837 | |
Net investment income | | | 22,677,714 | |
| |
Realized and unrealized gain from: | | | | |
Net realized gain from: | | | | |
Investment securities | | | 63,271,402 | |
Foreign currencies | | | 285,294 | |
| | | | 63,556,696 | |
Change in net unrealized appreciation of: | | | | |
Investment securities (net of foreign taxes of $1,102,800) | | | 306,777,428 | |
Foreign currencies | | | 267,871 | |
| | | | 307,045,299 | |
Net realized and unrealized gain | | | 370,601,995 | |
Net increase in net assets resulting from operations | | $ | 393,279,709 | |
See accompanying Notes to Financial Statements which are an integral part of the financial statements.
Invesco V.I. International Growth Fund
Statement of Changes in Net Assets
For the years ended December 31, 2017 and 2016
| | | | | | | | |
| | | 2017 | | | 2016 | |
Operations: | | | | | | | | |
Net investment income | | $ | 22,677,714 | | | $ | 23,189,171 | |
Net realized gain (loss) | | | 63,556,696 | | | | (1,173,971 | ) |
Change in net unrealized appreciation (depreciation) | | | 307,045,299 | | | | (36,501,234 | ) |
Net increase (decrease) in net assets resulting from operations | | | 393,279,709 | | | | (14,486,034 | ) |
| | |
Distributions to shareholders from net investment income: | | | | | | | | |
Series I | | �� | (8,599,101 | ) | | | (7,627,878 | ) |
Series ll | | | (17,155,517 | ) | | | (14,078,193 | ) |
Total distributions from net investment income | | | (25,754,618 | ) | | | (21,706,071 | ) |
| | |
Share transactions–net: | | | | | | | | |
Series l | | | (25,091,564 | ) | | | (51,402,690 | ) |
Series ll | | | 25,903,929 | | | | 24,291,791 | |
Net increase (decrease) in net assets resulting from share transactions | | | 812,365 | | | | (27,110,899 | ) |
Net increase (decrease) in net assets | | | 368,337,456 | | | | (63,303,004 | ) |
| | |
Net assets: | | | | | | | | |
Beginning of year | | | 1,708,280,232 | | | | 1,771,583,236 | |
End of year (includes undistributed net investment income of $9,782,789 and $12,559,820, respectively) | | $ | 2,076,617,688 | | | $ | 1,708,280,232 | |
Notes to Financial Statements
December 31, 2017
NOTE 1—Significant Accounting Policies
Invesco V.I. International Growth Fund (the “Fund”) is a series portfolio of AIM Variable Insurance Funds (Invesco Variable Insurance Funds) (the “Trust”). The Trust is a Delaware statutory trust registered under the Investment Company Act of 1940, as amended (the “1940 Act”), as an open-end series management investment company consisting of twenty-four separate portfolios, (each constituting a “Fund”). The assets, liabilities and operations of each portfolio are accounted for separately. Information presented in these financial statements pertains only to the Fund. Matters affecting each Fund or class will be voted on exclusively by the shareholders of such Fund or class. Current Securities and Exchange Commission (“SEC”) guidance, however, requires participating insurance companies offering separate accounts to vote shares proportionally in accordance with the instructions of the contract owners whose investments are funded by shares of each Fund or class.
The Fund’s investment objective is long-term growth of capital.
The Fund currently offers two classes of shares, Series I and Series II, both of which are offered to insurance company separate accounts funding variable annuity contracts and variable life insurance policies (“variable products”).
The Fund is an investment company and accordingly follows the investment company accounting and reporting guidance in accordance with Financial Accounting Standards Board Accounting Standards Codification Topic 946, Financial Services — Investment Companies.
The following is a summary of the significant accounting policies followed by the Fund in the preparation of its financial statements.
| A. | Security Valuations — Securities, including restricted securities, are valued according to the following policy. |
A security listed or traded on an exchange (except convertible securities) is valued at its last sales price or official closing price as of the close of the customary trading session on the exchange where the security is principally traded, or lacking any sales or official closing price on a particular day, the security may be valued at the closing bid price on that day. Securities traded in the over-the-counter market are valued based on prices furnished by independent pricing services or market makers. When such securities are valued by an independent pricing service they may be considered fair valued. Futures contracts are valued at the final settlement price set by an exchange on which they are principally traded. Listed options are valued at the mean between the last bid and asked prices from the exchange on which they are principally traded. Options not listed on an exchange are valued by an independent source at the mean between the last bid and asked prices. For purposes of determining net asset value (“NAV”) per share, futures and option contracts generally are valued 15 minutes after the close of the customary trading session of the New York Stock Exchange (“NYSE”).
Investments in open-end and closed-end registered investment companies that do not trade on an exchange are valued at the end-of-day net asset value per share. Investments in open-end and closed-end registered investment companies that trade on an exchange are valued at the last sales price or official closing price as of the close of the customary trading session on the exchange where the security is principally traded.
Debt obligations (including convertible securities) and unlisted equities are fair valued using an evaluated quote provided by an independent pricing service. Evaluated quotes provided by the pricing service may be determined without exclusive reliance on quoted prices, and may reflect appropriate factors such as institution-size trading in similar groups of securities, developments related to specific securities, dividend rate (for unlisted equities), yield (for debt obligations), quality, type of issue, coupon rate (for debt obligations), maturity (for debt obligations), individual trading characteristics and other market data. Pricing services generally value debt obligations assuming orderly transactions of institutional
Invesco V.I. International Growth Fund
round lot size, but a fund may hold or transact in the same securities in smaller, odd lot sizes. Odd lots often trade at lower prices than institutional round lots. Debt obligations are subject to interest rate and credit risks. In addition, all debt obligations involve some risk of default with respect to interest and/or principal payments.
Foreign securities’ (including foreign exchange contracts) prices are converted into U.S. dollar amounts using the applicable exchange rates as of the close of the NYSE. If market quotations are available and reliable for foreign exchange-traded equity securities, the securities will be valued at the market quotations. Because trading hours for certain foreign securities end before the close of the NYSE, closing market quotations may become unreliable. If between the time trading ends on a particular security and the close of the customary trading session on the NYSE, events occur that the investment adviser determines are significant and make the closing price unreliable, the Fund may fair value the security. If the event is likely to have affected the closing price of the security, the security will be valued at fair value in good faith using procedures approved by the Board of Trustees. Adjustments to closing prices to reflect fair value may also be based on a screening process of an independent pricing service to indicate the degree of certainty, based on historical data, that the closing price in the principal market where a foreign security trades is not the current value as of the close of the NYSE. Foreign securities’ prices meeting the approved degree of certainty that the price is not reflective of current value will be priced at the indication of fair value from the independent pricing service. Multiple factors may be considered by the independent pricing service in determining adjustments to reflect fair value and may include information relating to sector indices, American Depositary Receipts and domestic and foreign index futures. Foreign securities may have additional risks including exchange rate changes, potential for sharply devalued currencies and high inflation, political and economic upheaval, the relative lack of issuer information, relatively low market liquidity and the potential lack of strict financial and accounting controls and standards.
Securities for which market prices are not provided by any of the above methods may be valued based upon quotes furnished by independent sources. The last bid price may be used to value equity securities. The mean between the last bid and asked prices is used to value debt obligations, including corporate loans.
Securities for which market quotations are not readily available or became unreliable are valued at fair value as determined in good faith by or under the supervision of the Trust’s officers following procedures approved by the Board of Trustees. Issuer specific events, market trends, bid/asked quotes of brokers and information providers and other market data may be reviewed in the course of making a good faith determination of a security’s fair value.
The Fund may invest in securities that are subject to interest rate risk, meaning the risk that the prices will generally fall as interest rates rise and, conversely, the prices will generally rise as interest rates fall. Specific securities differ in their sensitivity to changes in interest rates depending on their individual characteristics. Changes in interest rates may result in increased market volatility, which may affect the value and/or liquidity of certain Fund investments.
Valuations change in response to many factors including the historical and prospective earnings of the issuer, the value of the issuer’s assets, general economic conditions, interest rates, investor perceptions and market liquidity. Because of the inherent uncertainties of valuation, the values reflected in the financial statements may materially differ from the value received upon actual sale of those investments.
| B. | Securities Transactions and Investment Income — Securities transactions are accounted for on a trade date basis. Realized gains or losses on sales are computed on the basis of specific identification of the securities sold. Interest income (net of withholding tax, if any) is recorded on the accrual basis from settlement date. Dividend income (net of withholding tax, if any) is recorded on the ex-dividend date. |
The Fund may periodically participate in litigation related to Fund investments. As such, the Fund may receive proceeds from litigation settlements. Any proceeds received are included in the Statement of Operations as realized gain (loss) for investments no longer held and as unrealized gain (loss) for investments still held.
Brokerage commissions and mark ups are considered transaction costs and are recorded as an increase to the cost basis of securities purchased and/or a reduction of proceeds on a sale of securities. Such transaction costs are included in the determination of net realized and unrealized gain (loss) from investment securities reported in the Statement of Operations and the Statement of Changes in Net Assets and the net realized and unrealized gains (losses) on securities per share in the Financial Highlights. Transaction costs are included in the calculation of the Fund’s net asset value and, accordingly, they reduce the Fund’s total returns. These transaction costs are not considered operating expenses and are not reflected in net investment income reported in the Statement of Operations and the Statement of Changes in Net Assets, or the net investment income per share and the ratios of expenses and net investment income reported in the Financial Highlights, nor are they limited by any expense limitation arrangements between the Fund and the investment adviser.
The Fund allocates income and realized and unrealized capital gains and losses to a class based on the relative net assets of each class.
| C. | Country Determination — For the purposes of making investment selection decisions and presentation in the Schedule of Investments, the investment adviser may determine the country in which an issuer is located and/or credit risk exposure based on various factors. These factors include the laws of the country under which the issuer is organized, where the issuer maintains a principal office, the country in which the issuer derives 50% or more of its total revenues and the country that has the primary market for the issuer’s securities, as well as other criteria. Among the other criteria that may be evaluated for making this determination are the country in which the issuer maintains 50% or more of its assets, the type of security, financial guarantees and enhancements, the nature of the collateral and the sponsor organization. Country of issuer and/or credit risk exposure has been determined to be the United States of America, unless otherwise noted. |
| D. | Distributions — Distributions from net investment income and net realized capital gain, if any, are generally declared and paid to separate accounts of participating insurance companies annually and recorded on the ex-dividend date. |
| E. | Federal Income Taxes — The Fund intends to comply with the requirements of Subchapter M of the Internal Revenue Code of 1986, as amended (the “Internal Revenue Code”), necessary to qualify as a regulated investment company and to distribute substantially all of the Fund’s taxable earnings to shareholders. As such, the Fund will not be subject to federal income taxes on otherwise taxable income (including net realized capital gain) that is distributed to shareholders. Therefore, no provision for federal income taxes is recorded in the financial statements. |
The Fund recognizes the tax benefits of uncertain tax positions only when the position is more likely than not to be sustained. Management has analyzed the Fund’s uncertain tax positions and concluded that no liability for unrecognized tax benefits should be recorded related to uncertain tax positions. Management is not aware of any tax positions for which it is reasonably possible that the total amounts of unrecognized tax benefits will change materially in the next 12 months.
Invesco V.I. International Growth Fund
The Fund files tax returns in the U.S. Federal jurisdiction and certain other jurisdictions. Generally, the Fund is subject to examinations by such taxing authorities for up to three years after the filing of the return for the tax period.
| F. | Expenses — Fees provided for under the Rule 12b-1 plan of a particular class of the Fund and which are directly attributable to that class are charged to the operations of such class. All other expenses are allocated among the classes based on relative net assets. |
| G. | Accounting Estimates — The preparation of financial statements in conformity with accounting principles generally accepted in the United States of America (“GAAP”) requires management to make estimates and assumptions that affect the reported amounts of assets and liabilities at the date of the financial statements and the reported amounts of revenues and expenses during the reporting period including estimates and assumptions related to taxation. Actual results could differ from those estimates by a significant amount. In addition, the Fund monitors for material events or transactions that may occur or become known after the period-end date and before the date the financial statements are released to print. |
| H. | Indemnifications — Under the Trust’s organizational documents, each Trustee, officer, employee or other agent of the Trust is indemnified against certain liabilities that may arise out of the performance of their duties to the Fund. Additionally, in the normal course of business, the Fund enters into contracts, including the Fund’s servicing agreements, that contain a variety of indemnification clauses. The Fund’s maximum exposure under these arrangements is unknown as this would involve future claims that may be made against the Fund that have not yet occurred. The risk of material loss as a result of such indemnification claims is considered remote. |
| I. | Foreign Currency Translations — Foreign currency is valued at the close of the NYSE based on quotations posted by banks and major currency dealers. Portfolio securities and other assets and liabilities denominated in foreign currencies are translated into U.S. dollar amounts at date of valuation. Purchases and sales of portfolio securities (net of foreign taxes withheld on disposition) and income items denominated in foreign currencies are translated into U.S. dollar amounts on the respective dates of such transactions. The Fund does not separately account for the portion of the results of operations resulting from changes in foreign exchange rates on investments and the fluctuations arising from changes in market prices of securities held. The combined results of changes in foreign exchange rates and the fluctuation of market prices on investments (net of estimated foreign tax withholding) are included with the net realized and unrealized gain or loss from investments in the Statement of Operations. Reported net realized foreign currency gains or losses arise from (1) sales of foreign currencies, (2) currency gains or losses realized between the trade and settlement dates on securities transactions, and (3) the difference between the amounts of dividends, interest, and foreign withholding taxes recorded on the Fund’s books and the U.S. dollar equivalent of the amounts actually received or paid. Net unrealized foreign currency gains and losses arise from changes in the fair values of assets and liabilities, other than investments in securities at fiscal period end, resulting from changes in exchange rates. |
The Fund may invest in foreign securities, which may be subject to foreign taxes on income, gains on investments or currency repatriation, a portion of which may be recoverable. Foreign taxes, if any, are recorded based on the tax regulations and rates that exist in the foreign markets in which the Fund invests and are shown in the Statement of Operations.
| J. | Forward Foreign Currency Contracts — The Fund may engage in foreign currency transactions either on a spot (i.e. for prompt delivery and settlement) basis, or through forward foreign currency contracts, to manage or minimize currency or exchange rate risk. |
The Fund may also enter into forward foreign currency contracts for the purchase or sale of a security denominated in a foreign currency in order to “lock in” the U.S. dollar price of that security, or the Fund may also enter into forward foreign currency contracts that do not provide for physical settlement of the two currencies, but instead are settled by a single cash payment calculated as the difference between the agreed upon exchange rate and the spot rate at settlement based upon an agreed upon notional amount (non-deliverable forwards). The Fund will set aside liquid assets in an amount equal to the daily mark-to-market obligation for forward foreign currency contracts.
A forward foreign currency contract is an obligation between two parties (“Counterparties”) to purchase or sell a specific currency for an agreed-upon price at a future date. The use of forward foreign currency contracts does not eliminate fluctuations in the price of the underlying securities the Fund owns or intends to acquire but establishes a rate of exchange in advance. Fluctuations in the value of these contracts are measured by the difference in the contract date and reporting date exchange rates and are recorded as unrealized appreciation (depreciation) until the contracts are closed. When the contracts are closed, realized gains (losses) are recorded. Realized and unrealized gains (losses) on the contracts are included in the Statement of Operations. The primary risks associated with forward foreign currency contracts include failure of the Counterparty to meet the terms of the contract and the value of the foreign currency changing unfavorably. These risks may be in excess of the amounts reflected in the Statement of Assets and Liabilities.
NOTE 2—Advisory Fees and Other Fees Paid to Affiliates
The Trust has entered into a master investment advisory agreement with Invesco Advisers, Inc. (the “Adviser” or “Invesco”). Under the terms of the investment advisory agreement, the Fund accrues daily and pays monthly an advisory fee to the Adviser based on the annual rate of the Fund’s average daily net assets as follows:
| | | | |
| Average Daily Net Assets | | Rate | |
First $250 million | | | 0.75% | |
Over $250 million | | | 0.70% | |
For the year ended December 31, 2017, the effective advisory fees incurred by the Fund was 0.71%.
Under the terms of a master sub-advisory agreement between the Adviser and each of Invesco Asset Management Deutschland GmbH, Invesco Asset Management Limited, Invesco Asset Management (Japan) Limited, Invesco Hong Kong Limited, Invesco Senior Secured Management, Inc. and Invesco Canada Ltd. and separate sub-advisory agreements with Invesco PowerShares Capital Management LLC and Invesco Asset Management (India) Private Limited (collectively, the “Affiliated Sub-Advisers”) the Adviser, not the Fund, will pay 40% of the fees paid to the Adviser to any such Affiliated Sub-Adviser(s) that provide(s) discretionary investment management services to the Fund based on the percentage of assets allocated to such Affiliated Sub-Adviser(s).
The Adviser has contractually agreed, through at least June 30, 2018, to waive advisory fees and/or reimburse expenses of all shares to the extent necessary to limit total annual fund operating expenses after fee waiver and/or expense reimbursement (excluding certain items discussed
Invesco V.I. International Growth Fund
below) of Series I shares to 2.25% and Series II shares to 2.50% of average daily net assets (the “expense limits”). In determining the Adviser’s obligation to waive advisory fees and/or reimburse expenses, the following expenses are not taken into account, and could cause the total annual fund operating expenses after fee waiver and/or expense reimbursement to exceed the numbers reflected above: (1) interest; (2) taxes; (3) dividend expense on short sales; (4) extraordinary or non-routine items, including litigation expenses; and (5) expenses that the Fund has incurred but did not actually pay because of an expense offset arrangement. Unless Invesco continues the fee waiver agreement, it will terminate on June 30, 2018. During its term, the fee waiver agreement cannot be terminated or amended to increase expense limits or reduce the advisory fee waiver without approval of the Board of Trustees. The Adviser did not waive fees and/or reimburse expenses during the period under these expense limits.
Further, the Adviser has contractually agreed, through at least June 30, 2019, to waive the advisory fee payable by the Fund in an amount equal to 100% of the net advisory fees the Adviser receives from the affiliated money market funds on investments by the Fund of uninvested cash in such affiliated money market funds.
For the year ended December 31, 2017, the Adviser waived advisory fees of $167,752.
The Trust has entered into a master administrative services agreement with Invesco pursuant to which the Fund has agreed to pay Invesco a fee for costs incurred in providing accounting services and fund administrative services to the Fund and to reimburse Invesco for fees paid to insurance companies that have agreed to provide certain administrative services to the Fund. These administrative services provided by the insurance companies may include, among other things: maintenance of master accounts with the Fund; tracking, recording and transmitting net purchase and redemption orders for Fund shares; maintaining and preserving records related to the purchase, redemption and other account activity of variable product owners; distributing copies of Fund documents such as prospectuses, proxy materials and periodic reports, to variable product owners, and responding to inquiries from variable product owners about the Fund. Pursuant to such agreement, for the year ended December 31, 2017, Invesco was paid $408,375 for accounting and fund administrative services and was reimbursed $2,912,260 for fees paid to insurance companies.
The Trust has entered into a transfer agency and service agreement with Invesco Investment Services, Inc. (“IIS”) pursuant to which the Fund has agreed to pay IIS a fee for providing transfer agency and shareholder services to the Fund and reimburse IIS for certain expenses incurred by IIS in the course of providing such services. For the year ended December 31, 2017, expenses incurred under the agreement are shown in the Statement of Operations as Transfer agent fees.
The Trust has entered into a master distribution agreement with Invesco Distributors, Inc. (“IDI”) to serve as the distributor for the Fund. The Trust has adopted a plan pursuant to Rule 12b-1 under the 1940 Act with respect to the Fund’s Series II shares (the “Plan”). The Fund, pursuant to the Plan, pays IDI compensation at the annual rate of 0.25% of the Fund’s average daily net assets of Series II shares. The fees are accrued daily and paid monthly. Of the Plan payments, up to 0.25% of the average daily net assets of the Series II shares may be paid to insurance companies who furnish continuing personal shareholder services to customers who purchase and own Series II shares of the Fund. For the year ended December 31, 2017, expenses incurred under the Plan are detailed in the Statement of Operations as Distribution fees.
Certain officers and trustees of the Trust are officers and directors of the Adviser, IIS and/or IDI.
NOTE 3—Additional Valuation Information
GAAP defines fair value as the price that would be received to sell an asset or paid to transfer a liability in an orderly transaction between market participants at the measurement date, under current market conditions. GAAP establishes a hierarchy that prioritizes the inputs to valuation methods, giving the highest priority to readily available unadjusted quoted prices in an active market for identical assets (Level 1) and the lowest priority to significant unobservable inputs (Level 3), generally when market prices are not readily available or are unreliable. Based on the valuation inputs, the securities or other investments are tiered into one of three levels. Changes in valuation methods may result in transfers in or out of an investment’s assigned level:
| | Level 1 — | Prices are determined using quoted prices in an active market for identical assets. |
| | Level 2 — | Prices are determined using other significant observable inputs. Observable inputs are inputs that other market participants may use in pricing a security. These may include quoted prices for similar securities, interest rates, prepayment speeds, credit risk, yield curves, loss severities, default rates, discount rates, volatilities and others. |
| | Level 3 — | Prices are determined using significant unobservable inputs. In situations where quoted prices or observable inputs are unavailable (for example, when there is little or no market activity for an investment at the end of the period), unobservable inputs may be used. Unobservable inputs reflect the Fund’s own assumptions about the factors market participants would use in determining fair value of the securities or instruments and would be based on the best available information. |
The following is a summary of the tiered valuation input levels, as of December 31, 2017. The level assigned to the securities valuations may not be an indication of the risk or liquidity associated with investing in those securities. Because of the inherent uncertainties of valuation, the values reflected in the financial statements may materially differ from the value received upon actual sale of those investments.
The Fund’s policy is to recognize transfers in and out of the valuation levels as of the end of the reporting period.
Invesco V.I. International Growth Fund
During the year ended December 31, 2017, there were transfers from Level 1 to Level 2 of $230,281,487 and from Level 2 to Level 1 of $209,646,165, due to foreign fair value adjustments.
| | | | | | | | | | | | | | | | |
| | | Level 1 | | | Level 2 | | | Level 3 | | | Total | |
| Investments in Securities | | | | | | | | | | | | |
Australia | | $ | — | | | $ | 98,262,875 | | | $ | — | | | $ | 98,262,875 | |
Brazil | | | 94,887,024 | | | | 32,848,135 | | | | — | | | | 127,735,159 | |
Canada | | | 178,890,408 | | | | — | | | | — | | | | 178,890,408 | |
China | | | 47,145,730 | | | | — | | | | — | | | | 47,145,730 | |
Denmark | | | — | | | | 40,506,405 | | | | — | | | | 40,506,405 | |
France | | | 64,734,882 | | | | 63,963,550 | | | | — | | | | 128,698,432 | |
Germany | | | 60,167,883 | | | | 157,519,510 | | | | — | | | | 217,687,393 | |
Hong Kong | | | 44,753,509 | | | | 29,962,461 | | | | — | | | | 74,715,970 | |
Italy | | | — | | | | 37,346,742 | | | | — | | | | 37,346,742 | |
Japan | | | 80,982,255 | | | | 13,122,175 | | | | — | | | | 94,104,430 | |
Mexico | | | 41,418,727 | | | | — | | | | — | | | | 41,418,727 | |
Netherlands | | | — | | | | 54,316,648 | | | | — | | | | 54,316,648 | |
Singapore | | | — | | | | 36,425,163 | | | | — | | | | 36,425,163 | |
South Korea | | | 46,489,657 | | | | 22,422,486 | | | | — | | | | 68,912,143 | |
Spain | | | — | | | | 35,971,457 | | | | — | | | | 35,971,457 | |
Sweden | | | — | | | | 41,857,224 | | | | — | | | | 41,857,224 | |
Switzerland | | | 58,905,304 | | | | 52,194,836 | | | | — | | | | 111,100,140 | |
Taiwan | | | 44,193,256 | | | | — | | | | — | | | | 44,193,256 | |
Thailand | | | — | | | | 41,645,462 | | | | — | | | | 41,645,462 | |
Turkey | | | 19,828,377 | | | | — | | | | — | | | | 19,828,377 | |
United Kingdom | | | 44,222,038 | | | | 296,284,975 | | | | — | | | | 340,507,013 | |
United States | | | 52,535,536 | | | | — | | | | — | | | | 52,535,536 | |
Money Market Funds | | | 142,587,976 | | | | — | | | | — | | | | 142,587,976 | |
Total Investments | | $ | 1,021,742,562 | | | $ | 1,054,650,104 | | | $ | — | | | $ | 2,076,392,666 | |
NOTE 4—Trustees’ and Officers’ Fees and Benefits
Trustees’ and Officers’ Fees and Benefits include amounts accrued by the Fund to pay remuneration to certain Trustees and Officers of the Fund. Trustees have the option to defer compensation payable by the Fund, and Trustees’ and Officers’ Fees and Benefits also include amounts accrued by the Fund to fund such deferred compensation amounts. Those Trustees who defer compensation have the option to select various Invesco Funds in which their deferral accounts shall be deemed to be invested. Finally, certain current Trustees were eligible to participate in a retirement plan that provided for benefits to be paid upon retirement to Trustees over a period of time based on the number of years of service. The Fund may have certain former Trustees who also participate in a retirement plan and receive benefits under such plan. Trustees’ and Officers’ Fees and Benefits include amounts accrued by the Fund to fund such retirement benefits. Obligations under the deferred compensation and retirement plans represent unsecured claims against the general assets of the Fund.
NOTE 5—Cash Balances
The Fund is permitted to temporarily carry a negative or overdrawn balance in its account with State Street Bank and Trust Company, the custodian bank. Such balances, if any at period-end, are shown in the Statement of Assets and Liabilities under the payable caption Amount due custodian. To compensate the custodian bank for such overdrafts, the overdrawn Fund may either (1) leave funds as a compensating balance in the account so the custodian bank can be compensated by earning the additional interest; or (2) compensate by paying the custodian bank at a rate agreed upon by the custodian bank and Invesco, not to exceed the contractually agreed upon rate.
Invesco V.I. International Growth Fund
NOTE 6—Distributions to Shareholders and Tax Components of Net Assets
Tax Character of Distributions to Shareholders Paid During the Fiscal Years Ended December 31, 2017 and 2016:
| | | | | | | | |
| | | 2017 | | | 2016 | |
Ordinary income | | $ | 25,754,618 | | | $ | 21,706,071 | |
Tax Components of Net Assets at Period-End:
| | | | |
| | | 2017 | |
Undistributed ordinary income | | $ | 31,709,530 | |
Undistributed long-term gain | | | 11,420,956 | |
Net unrealized appreciation — investments | | | 582,512,532 | |
Net unrealized appreciation — foreign currencies | | | 86,015 | |
Temporary book/tax differences | | | (256,436 | ) |
Shares of beneficial interest | | | 1,451,145,091 | |
Total net assets | | $ | 2,076,617,688 | |
The difference between book-basis and tax-basis unrealized appreciation (depreciation) is due to differences in the timing of recognition of gains and losses on investments for tax and book purposes. The Fund’s net unrealized appreciation difference is attributable primarily to wash sales and passive foreign investment companies.
The temporary book/tax differences are a result of timing differences between book and tax recognition of income and/or expenses. The Fund’s temporary book/tax differences are the result of the trustee deferral of compensation and retirement plan benefits.
Capital loss carryforward is calculated and reported as of a specific date. Results of transactions and other activity after that date may affect the amount of capital loss carryforward actually available for the Fund to utilize. Capital losses generated in years beginning after December 22, 2010 can be carried forward for an unlimited period, whereas previous losses expire in eight tax years. Capital losses with an expiration period may not be used to offset capital gains until all net capital losses without an expiration date have been utilized. Capital loss carryforwards with no expiration date will retain their character as either short-term or long-term capital losses instead of as short-term capital losses as under prior law. The ability to utilize capital loss carryforwards in the future may be limited under the Internal Revenue Code and related regulations based on the results of future transactions.
The Fund does not have a capital loss carryforward as of December 31, 2017.
NOTE 7—Investment Transactions
The aggregate amount of investment securities (other than short-term securities, U.S. Treasury obligations and money market funds, if any) purchased and sold by the Fund during the year ended December 31, 2017 was $612,010,589 and $646,287,366, respectively. Cost of investments, including any derivatives, on a tax basis includes the adjustments for financial reporting purposes as of the most recently completed federal income tax reporting period-end.
| | | | |
| Unrealized Appreciation (Depreciation) of Investments on a Tax Basis | |
Aggregate unrealized appreciation of investments | | $ | 597,001,652 | |
Aggregate unrealized (depreciation) of investments | | | (14,489,120 | ) |
Net unrealized appreciation of investments | | $ | 582,512,532 | |
Cost of investments for tax purposes is $1,493,880,134.
NOTE 8—Reclassification of Permanent Differences
Primarily as a result of differing book/tax treatment of foreign currency transactions, on December 31, 2017, undistributed net investment income was increased by $299,873 and undistributed net realized gain (loss) was decreased by $299,873. This reclassification had no effect on the net assets of the Fund.
Invesco V.I. International Growth Fund
NOTE 9—Share Information
| | | | | | | | | | | | | | | | |
| | | Summary of Share Activity | |
| | | Years ended December 31, | |
| | | 2017(a) | | | 2016 | |
| | | Shares | | | Amount | | | Shares | | | Amount | |
Sold: | | | | | | | | | | | | | | | | |
Series I | | | 2,055,141 | | | $ | 75,392,382 | | | | 2,604,909 | | | $ | 86,162,855 | |
Series II | | | 5,918,465 | | | | 210,230,623 | | | | 8,332,304 | | | | 275,601,981 | |
| | | | |
Issued as reinvestment of dividends: | | | | | | | | | | | | | | | | |
Series I | | | 220,254 | | | | 8,521,626 | | | | 219,998 | | | | 7,587,737 | |
Series II | | | 449,451 | | | | 17,155,517 | | | | 413,456 | | | | 14,078,193 | |
| | | | |
Reacquired: | | | | | | | | | | | | | | | | |
Series I | | | (2,968,744 | ) | | | (109,005,572 | ) | | | (4,361,304 | ) | | | (145,153,282 | ) |
Series II | | | (5,526,752 | ) | | | (201,482,211 | ) | | | (8,151,842 | ) | | | (265,388,383 | ) |
Net increase (decrease) in share activity | | | 147,815 | | | $ | 812,365 | | | | (942,479 | ) | | $ | (27,110,899 | ) |
| (a) | There are entities that are record owners of more than 5% of the outstanding shares of the Fund and in the aggregate own 30% of the outstanding shares of the Fund. The Fund and the Fund’s principal underwriter or adviser, are parties to participation agreements with these entities whereby these entities sell units of interest in separate accounts funding variable products that are invested in the Fund. The Fund, Invesco and/or Invesco affiliates may make payments to these entities, which are considered to be related to the Fund, for providing services to the Fund, Invesco and/or Invesco affiliates including but not limited to services such as, securities brokerage, third party record keeping and account servicing and administrative services. The Fund has no knowledge as to whether all or any portion of the shares owned of record by these entities are also owned beneficially. |
NOTE 10—Financial Highlights
The following schedule presents financial highlights for a share of the Fund outstanding throughout the periods indicated.
| | | | | | | | | | | | | | | | | | | | | | | | | | | | | | | | | | | | | | | | | | | | | | | | |
| | | Net asset
value,
beginning
of period | | | Net
investment
income(a) | | | Net gains
(losses)
on securities
(both
realized and
unrealized) | | | Total from
investment
operations | | | Dividends
from net
investment
income | | | Net asset
value, end
of period | | | Total
return(b) | | | Net assets,
end of period
(000’s omitted) | | | Ratio of
expenses
to average net assets
with fee waivers
and/or expenses
absorbed | | | Ratio of
expenses
to average net
assets without
fee waivers
and/or expenses
absorbed | | | Ratio of net
investment
income to average
net assets | | | Portfolio
turnover(c) | |
Series I | | | | | | | | | | | | | | | | | | | | | | | | | | | | | | | | | | | | | | | | | | | | | | | | |
Year ended 12/31/17 | | $ | 32.89 | | | $ | 0.49 | | | $ | 7.06 | | | $ | 7.55 | | | $ | (0.55 | ) | | $ | 39.89 | | | | 23.00 | % | | $ | 627,894 | | | | 0.92 | %(d) | | | 0.93 | %(d) | | | 1.34 | %(d) | | | 34 | % |
Year ended 12/31/16 | | | 33.49 | | | | 0.50 | | | | (0.63 | ) | | | (0.13 | ) | | | (0.47 | ) | | | 32.89 | | | | (0.45 | ) | | | 540,460 | | | | 0.95 | | | | 0.96 | | | | 1.51 | | | | 18 | |
Year ended 12/31/15 | | | 34.87 | | | | 0.48 | | | | (1.33 | ) | | | (0.85 | ) | | | (0.53 | ) | | | 33.49 | | | | (2.34 | ) | | | 601,760 | | | | 1.00 | | | | 1.01 | | | | 1.35 | | | | 22 | |
Year ended 12/31/14 | | | 35.32 | | | | 0.56 | | | | (0.44 | ) | | | 0.12 | | | | (0.57 | ) | | | 34.87 | | | | 0.33 | | | | 647,530 | | | | 1.01 | | | | 1.02 | | | | 1.58 | | | | 26 | |
Year ended 12/31/13 | | | 30.03 | | | | 0.44 | | | | 5.25 | | | | 5.69 | | | | (0.40 | ) | | | 35.32 | | | | 19.01 | | | | 686,305 | | | | 1.01 | | | | 1.02 | | | | 1.37 | | | | 24 | |
Series II | | | | | | | | | | | | | | | | | | | | | | | | | | | | | | | | | | | | | | | | | | | | | | | | |
Year ended 12/31/17 | | | 32.44 | | | | 0.40 | | | | 6.96 | | | | 7.36 | | | | (0.47 | ) | | | 39.33 | | | | 22.73 | | | | 1,448,723 | | | | 1.17 | (d) | | | 1.18 | (d) | | | 1.09 | (d) | | | 34 | |
Year ended 12/31/16 | | | 33.04 | | | | 0.41 | | | | (0.62 | ) | | | (0.21 | ) | | | (0.39 | ) | | | 32.44 | | | | (0.70 | ) | | | 1,167,820 | | | | 1.20 | | | | 1.21 | | | | 1.26 | | | | 18 | |
Year ended 12/31/15 | | | 34.42 | | | | 0.38 | | | | (1.31 | ) | | | (0.93 | ) | | | (0.45 | ) | | | 33.04 | | | | (2.61 | ) | | | 1,169,823 | | | | 1.25 | | | | 1.26 | | | | 1.10 | | | | 22 | |
Year ended 12/31/14 | | | 34.88 | | | | 0.47 | | | | (0.43 | ) | | | 0.04 | | | | (0.50 | ) | | | 34.42 | | | | 0.09 | | | | 1,079,488 | | | | 1.26 | | | | 1.27 | | | | 1.33 | | | | 26 | |
Year ended 12/31/13 | | | 29.68 | | | | 0.36 | | | | 5.18 | | | | 5.54 | | | | (0.34 | ) | | | 34.88 | | | | 18.72 | | | | 1,062,929 | | | | 1.26 | | | | 1.27 | | | | 1.12 | | | | 24 | |
| (a) | Calculated using average shares outstanding. |
| (b) | Includes adjustments in accordance with accounting principles generally accepted in the United States of America and as such, the net asset value for financial reporting purposes and the returns based upon those net asset values may differ from the net asset value and returns for shareholder transactions. Total returns are not annualized for periods less than one year, if applicable, and do not reflect charges assessed in connection with a variable product, which if included would reduce total returns. |
| (c) | Portfolio turnover is calculated at the fund level and is not annualized for periods less than one year, if applicable. |
| (d) | Ratios are based on average daily net assets (000’s omitted) of $593,441 and $1,355,595 for Series I and Series II shares, respectively. |
Invesco V.I. International Growth Fund
Report of Independent Registered Public Accounting Firm
To the Board of Trustees of AIM Variable Insurance Funds
(Invesco Variable Insurance Funds) and Shareholders of Invesco V.I. International Growth Fund
Opinion on the Financial Statements
We have audited the accompanying statement of assets and liabilities, including the schedule of investments, of Invesco V.I. International Growth Fund (one of the funds constituting AIM Variable Insurance Funds (Invesco Variable Insurance Funds), hereafter referred to as the “Fund”) as of December 31, 2017, the related statement of operations for the year ended December 31, 2017, the statement of changes in net assets for each of the two years in the period ended December 31, 2017, including the related notes, and the financial highlights for each of the five years in the period ended December 31, 2017 (collectively referred to as the “financial statements”). In our opinion, the financial statements present fairly, in all material respects, the financial position of the Fund as of December 31, 2017, the results of its operations for the year then ended, the changes in its net assets for each of the two years in the period ended December 31, 2017 and the financial highlights for each of the five years in the period ended December 31, 2017 in conformity with accounting principles generally accepted in the United States of America.
Basis for Opinion
These financial statements are the responsibility of the Fund’s management. Our responsibility is to express an opinion on the Fund’s financial statements based on our audits. We are a public accounting firm registered with the Public Company Accounting Oversight Board (United States) (“PCAOB”) and are required to be independent with respect to the Fund in accordance with the U.S. federal securities laws and the applicable rules and regulations of the Securities and Exchange Commission and the PCAOB.
We conducted our audits of these financial statements in accordance with the standards of the PCAOB. Those standards require that we plan and perform the audit to obtain reasonable assurance about whether the financial statements are free of material misstatement, whether due to error or fraud.
Our audits included performing procedures to assess the risks of material misstatement of the financial statements, whether due to error or fraud, and performing procedures that respond to those risks. Such procedures included examining, on a test basis, evidence regarding the amounts and disclosures in the financial statements. Our audits also included evaluating the accounting principles used and significant estimates made by management, as well as evaluating the overall presentation of the financial statements. Our procedures included confirmation of securities owned as of December 31, 2017 by correspondence with the custodian, transfer agent and brokers; when replies were not received from brokers, we performed other auditing procedures. We believe that our audits provide a reasonable basis for our opinion.
PricewaterhouseCoopers LLP
Houston, TX
February 14, 2018
We have served as the auditor of one or more of the investment companies in the Invesco/PowerShares group of investment companies since at least 1995. We have not determined the specific year we began serving as such auditor.
Invesco V.I. International Growth Fund
Calculating your ongoing Fund expenses
Example
As a shareholder of the Fund, you incur ongoing costs, including management fees; distribution and/or service fees (12b-1); and other Fund expenses. This example is intended to help you understand your ongoing costs (in dollars) of investing in the Fund and to compare these costs with ongoing costs of investing in other mutual funds. The example is based on an investment of $1,000 invested at the beginning of the period and held for the entire period July 1, 2017 through December 31, 2017.
The actual and hypothetical expenses in the examples below do not represent the effect of any fees or other expenses assessed in connection with a variable product; if they did, the expenses shown would be higher while the ending account values shown would be lower.
Actual expenses
The table below provides information about actual account values and actual expenses. You may use the information in this table, together with the amount you invested, to estimate the expenses that you paid over the period. Simply divide your account value by $1,000 (for example, an $8,600 account value divided by $1,000 = 8.6), then multiply the result by the number in the table under the heading entitled “Actual Expenses Paid During Period” to estimate the expenses you paid on your account during this period.
Hypothetical example for comparison purposes
The table below also provides information about hypothetical account values and hypothetical expenses based on the Fund’s actual expense ratio and an assumed rate of return of 5% per year before expenses, which is not the Fund’s actual return.
The hypothetical account values and expenses may not be used to estimate the actual ending account balance or expenses you paid for the period. You may use this information to compare the ongoing costs of investing in the Fund and other funds. To do so, compare this 5% hypothetical example with the 5% hypothetical examples that appear in the shareholder reports of the other funds.
Please note that the expenses shown in the table are meant to highlight your ongoing costs. Therefore, the hypothetical information is useful in comparing ongoing costs, and will not help you determine the relative total costs of owning different funds.
| | | | | | | | | | | | | | | | | | | | | | | | |
Class | | Beginning
Account Value
(07/01/17) | | | ACTUAL | | | HYPOTHETICAL
(5% annual return before
expenses) | | | Annualized
Expense Ratio | |
| | | Ending
Account Value
(12/31/17)1 | | | Expenses
Paid During
Period2 | | | Ending
Account Value
(12/31/17) | | | Expenses
Paid During
Period2 | | |
| Series I | | $ | 1,000.00 | | | $ | 1,076.80 | | | $ | 4.76 | | | $ | 1,020.62 | | | $ | 4.63 | | | | 0.91 | % |
| Series II | | | 1,000.00 | | | | 1,075.70 | | | | 6.07 | | | | 1,019.36 | | | | 5.90 | | | | 1.16 | |
| 1 | The actual ending account value is based on the actual total return of the Fund for the period July 1, 2017 through December 31, 2017, after actual expenses and will differ from the hypothetical ending account value which is based on the Fund’s expense ratio and a hypothetical annual return of 5% before expenses. |
| 2 | Expenses are equal to the Fund’s annualized expense ratio as indicated above multiplied by the average account value over the period, multiplied by 184/365 to reflect the most recent fiscal half year. |
Invesco V.I. International Growth Fund
Tax Information
Form 1099-DIV, Form 1042-S and other year-end tax information provide shareholders with actual calendar year amounts that should be included in their tax returns. Shareholders should consult their tax advisors.
The following distribution information is being provided as required by the Internal Revenue Code or to meet a specific state’s requirement.
The Fund designates the following amounts or, if subsequently determined to be different, the maximum amount allowable for its fiscal year ended December 31, 2017:
| | | | |
Federal and State Income Tax | |
Corporate Dividends Received Deduction* | | | 0 | % |
U.S. Treasury Obligations* | | | 0 | % |
Foreign Taxes per share | | $ | 0.0683 | |
Foreign Source Income per share | | $ | 0.8850 | |
| | * | The above percentages are based on ordinary income dividends paid to shareholders during the Fund’s fiscal year. |
Invesco V.I. International Growth Fund
Trustees and Officers
The address of each trustee and officer is AIM Variable Insurance Funds (Invesco Variable Insurance Funds) (the “Trust”), 11 Greenway Plaza, Suite 1000, Houston, Texas 77046-1173. The trustees serve for the life of the Trust, subject to their earlier death, incapacitation, resignation, retirement or removal as more specifically provided in the Trust’s organizational documents. Each officer serves for a one year term or until their successors are elected and qualified. Column two below includes length of time served with predecessor entities, if any.
| | | | | | | | |
Name, Year of Birth and
Position(s) Held with the Trust | | Trustee and/
or Officer Since | | Principal Occupation(s)
During Past 5 Years | | Number of
Funds in Fund
Complex
Overseen by
Trustee | | Other Directorship(s)
Held by Trustee During
Past 5 Years |
| Interested Persons | | | | | | | | |
Martin L. Flanagan1 — 1960 Trustee | | 2007 | | Executive Director, Chief Executive Officer and President, Invesco Ltd. (ultimate parent of Invesco and a global investment management firm); Trustee, The Invesco Funds; Vice Chair, Investment Company Institute; and Member of Executive Board, SMU Cox School of Business Formerly: Advisor to the Board, Invesco Advisers, Inc. (formerly known as Invesco Institutional (N.A.), Inc.); Chairman and Chief Executive Officer, Invesco Advisers, Inc. (registered investment adviser); Director, Chairman, Chief Executive Officer and President, Invesco Holding Company (US), Inc. (formerly IVZ Inc.) (holding company), Invesco Group Services, Inc. (service provider) and Invesco North American Holdings, Inc. (holding company); Director, Chief Executive Officer and President, Invesco Holding Company Limited (parent of Invesco and a global investment management firm); Director, Invesco Ltd.; Chairman, Investment Company Institute and President, Co-Chief Executive Officer, Co-President, Chief Operating Officer and Chief Financial Officer, Franklin Resources, Inc. (global investment management organization) | | 158 | | None |
Philip A. Taylor2 — 1954 Trustee and Senior Vice President | | 2006 | | Head of the Americas and Senior Managing Director, Invesco Ltd.; Director, Invesco Advisers, Inc. (formerly known as Invesco Institutional (N.A.), Inc.) (registered investment adviser); Director, Chairman, Chief Executive Officer and President, Invesco Management Group, Inc. (formerly known as Invesco Aim Management Group, Inc.) (financial services holding company); Director and Chairman, Invesco Investment Services, Inc. (formerly known as Invesco Aim Investment Services, Inc.) (registered transfer agent); Chief Executive Officer, Invesco Corporate Class Inc. (corporate mutual fund company); Director, Chairman and Chief Executive Officer, Invesco Canada Ltd. (formerly known as Invesco Trimark Ltd./Invesco Trimark Ltèe) (registered investment adviser and registered transfer agent); Trustee and Senior Vice President, The Invesco Funds; Director, Invesco Investment Advisers LLC (formerly known as Van Kampen Asset Management). Formerly: Co-Chairman, Co-President and Co-Chief Executive Officer, Invesco Advisers, Inc. (formerly known as Invesco Institutional (N.A.), Inc.) (registered investment adviser); Director, Chief Executive Officer and President, Van Kampen Exchange Corp; President and Principal Executive Officer, The Invesco Funds (other than AIM Treasurer’s Series Trust (Invesco Treasurer’s Series Trust), Short-Term Investments Trust and Invesco Management Trust); Executive Vice President, The Invesco Funds (AIM Treasurer’s Series Trust (Invesco Treasurer’s Series Trust), Short-Term Investments Trust and Invesco Management Trust only); Director and President, INVESCO Funds Group, Inc. (registered investment adviser and registered transfer agent); Director and Chairman, IVZ Distributors, Inc. (formerly known as INVESCO Distributors, Inc.) (registered broker dealer); Director, President and Chairman, Invesco Inc. (holding company), Invesco Canada Holdings Inc. (holding company), Trimark Investments Ltd./Placements Trimark Ltèe and Invesco Financial Services Ltd/Services Financiers Invesco Ltèe; Chief Executive Officer, Invesco Canada Fund Inc. (corporate mutual fund company); Director and Chairman, Van Kampen Investor Services Inc.; Director, Chief Executive Officer and President, 1371 Preferred Inc. (holding company) and Van Kampen Investments Inc.; Director and President, AIM GP Canada Inc. (general partner for limited partnerships) and Van Kampen Advisors, Inc.; Director and Chief Executive Officer, Invesco Trimark Dealer Inc. (registered broker dealer); Director, Invesco Distributors, Inc. (formerly known as Invesco Aim Distributors, Inc.) (registered broker dealer); Manager, Invesco PowerShares Capital Management LLC; Director, Chief Executive Officer and President, Invesco Advisers, Inc.; Director, Chairman, Chief Executive Officer and President, Invesco Aim Capital Management, Inc.; President, Invesco Trimark Dealer Inc. and Invesco Trimark Ltd./Invesco Trimark Ltèe; Director and President, AIM Trimark Corporate Class Inc. and AIM Trimark Canada Fund Inc.; Senior Managing Director, Invesco Holding Company Limited; Director and Chairman, Fund Management Company (former registered broker dealer); President and Principal Executive Officer, The Invesco Funds (AIM Treasurer’s Series Trust (Invesco Treasurer’s Series Trust), and Short-Term Investments Trust only); President, AIM Trimark Global Fund Inc. and AIM Trimark Canada Fund Inc. | | 158 | | None |
| 1 | Mr. Flanagan is considered an interested person (within the meaning of Section 2(a)(19) of the 1940 Act) of the Trust because he is an officer of the Adviser to the Trust, and an officer and a director of Invesco Ltd., ultimate parent of the Adviser. |
| 2 | Mr. Taylor is considered an interested person (within the meaning of Section 2(a)(19) of the 1940 Act) of the Trust because he is an officer and a director of the Adviser. |
Invesco V.I. International Growth Fund
Trustees and Officers—(continued)
| | | | | | | | |
Name, Year of Birth and
Position(s) Held with the Trust | | Trustee and/
or Officer Since | | Principal Occupation(s)
During Past 5 Years | | Number of
Funds in Fund
Complex
Overseen by
Trustee | | Other Directorship(s)
Held by Trustee During
Past 5 Years |
| Independent Trustees | | | | | | | | |
Bruce L. Crockett — 1944 Trustee and Chair | | 1993 | | Chairman, Crockett Technologies Associates (technology consulting company) Formerly: Director, Captaris (unified messaging provider); Director, President and Chief Executive Officer, COMSAT Corporation; Chairman, Board of Governors of INTELSAT (international communications company); ACE Limited (insurance company); Independent Directors Council and Investment Company Institute: Member of the Audit Committee, Investment Company Institute; Member of the Executive Committee and Chair of the Governance Committee, Independent Directors Council | | 158 | | Director and Chairman of the Audit Committee, ALPS (Attorneys Liability Protection Society) (insurance company); Director and Member of the Audit Committee and Compensation Committee, Ferroglobe PLC (metallurgical company) |
David C. Arch — 1945 Trustee | | 2010 | | Chairman of Blistex Inc. (consumer health care products manufacturer); Member, World Presidents’ Organization | | 158 | | Board member of the Illinois Manufacturers’ Association |
Jack M. Fields — 1952 Trustee | | 1997 | | Chief Executive Officer, Twenty First Century Group, Inc. (government affairs company); and Chairman, Discovery Learning Alliance (non-profit) Formerly: Owner and Chief Executive Officer, Dos Angeles Ranch L.P. (cattle, hunting, corporate entertainment); Director, Insperity, Inc. (formerly known as Administaff) (human resources provider); Chief Executive Officer, Texana Timber LP (sustainable forestry company); Director of Cross Timbers Quail Research Ranch (non-profit); and member of the U.S. House of Representatives | | 158 | | None |
Cynthia Hostetler — 1962 Trustee | | 2017 | | Non-Executive Director and Trustee of a number of public and private business corporations Formerly: Head of Investment Funds and Private Equity, Overseas Private Investment Corporation; President, First Manhattan Bancorporation, Inc.; Attorney, Simpson Thacher & Bartlett LLP | | 158 | | Vulcan Materials Company (construction materials company); Trilinc Global Impact Fund; Aberdeen Investment Funds (4 portfolios); Artio Global Investment LLC (mutual fund complex); Edgen Group, Inc. (specialized energy and infrastructure products distributor) |
Eli Jones — 1961 Trustee | | 2016 | | Professor and Dean, Mays Business School — Texas A&M University Formerly: Professor and Dean, Walton College of Business, University of Arkansas and E.J. Ourso College of Business, Louisiana State University; Director, Arvest Bank | | 158 | | Insperity, Inc. (formerly known as Administaff) (human resources provider) |
Prema Mathai-Davis — 1950 Trustee | | 1998 | | Retired. | | 158 | | None |
Teresa M. Ressel — 1962 Trustee | | 2017 | | Non-executive director and trustee of a number of public and private business corporations Formerly: Chief Financial Officer, Olayan America, The Olayan Group (international investor/commercial/industrial); Chief Executive Officer, UBS Securities LLC; Group Chief Operating Officer, Americas, UBS AG; Assistant Secretary for Management & Budget and CFO, US Department of the Treasury | | 158 | | Atlantic Power Corporation (power generation company); ON Semiconductor Corp. (semiconductor supplier) |
Ann Barnett Stern — 1957 Trustee | | 2017 | | President and Chief Executive Officer, Houston Endowment Inc. (private philanthropic institution) Formerly: Executive Vice President and General Counsel, Texas Children’s Hospital; Attorney, Beck, Redden and Secrest, LLP; Business Law Instructor, University of St. Thomas; Attorney, Andrews & Kurth LLP | | 158 | | Federal Reserve Bank of Dallas |
Raymond Stickel, Jr. — 1944 Trustee | | 2005 | | Retired. Formerly: Director, Mainstay VP Series Funds, Inc. (25 portfolios); Partner, Deloitte & Touche | | 158 | | None |
Robert C. Troccoli — 1949 Trustee | | 2016 | | Adjunct Professor, University of Denver — Daniels College of Business Formerly: Senior Partner, KPMG LLP | | 158 | | None |
Christopher L. Wilson — 1957 Trustee | | 2017 | | Non-executive director and trustee of a number of public and private business corporations Formerly: Managing Partner, CT2, LLC (investing and consulting firm); President/Chief Executive Officer, Columbia Funds, Bank of America Corporation; President/Chief Executive Officer, CDC IXIS Asset Management Services, Inc.; Principal & Director of Operations, Scudder Funds, Scudder, Stevens & Clark, Inc.; Assistant Vice President, Fidelity Investments | | 158 | | TD Asset Management USA Inc. (mutual fund complex) (22 portfolios); ISO New England, Inc. (non-profit organization managing regional electricity market) |
Invesco V.I. International Growth Fund
Trustees and Officers—(continued)
| | | | | | | | |
Name, Year of Birth and
Position(s) Held with the Trust | | Trustee and/
or Officer Since | | Principal Occupation(s)
During Past 5 Years | | Number of
Funds in Fund
Complex
Overseen by
Trustee | | Other Directorship(s)
Held by Trustee During
Past 5 Years |
| Other Officers | | | | | | | | |
Sheri Morris — 1964 President, Principal Executive Officer and Treasurer | | 1999 | | President, Principal Executive Officer and Treasurer, The Invesco Funds; Vice President, Invesco Advisers, Inc. (formerly known as Invesco Institutional (N.A.), Inc.) (registered investment adviser); and Vice President, PowerShares Exchange-Traded Fund Trust, PowerShares Exchange-Traded Fund Trust II, PowerShares India Exchange-Traded Fund Trust, PowerShares Actively Managed Exchange-Traded Fund Trust, PowerShares Actively Managed Exchange-Traded Commodity Fund Trust and PowerShares Exchange-Traded Self-Indexed Fund Trust Formerly: Vice President and Principal Financial Officer, The Invesco Funds; Vice President, Invesco Aim Advisers, Inc., Invesco Aim Capital Management, Inc. and Invesco Aim Private Asset Management, Inc.; Assistant Vice President and Assistant Treasurer, The Invesco Funds and Assistant Vice President, Invesco Advisers, Inc., Invesco Aim Capital Management, Inc. and Invesco Aim Private Asset Management, Inc.; and Treasurer, PowerShares Exchange-Traded Fund Trust, PowerShares Exchange-Traded Fund Trust II, PowerShares India Exchange-Traded Fund Trust and PowerShares Actively Managed Exchange-Traded Fund Trust | | N/A | | N/A |
Russell C. Burk — 1958 Senior Vice President and Senior Officer | | 2005 | | Senior Vice President and Senior Officer, The Invesco Funds | | N/A | | N/A |
John M. Zerr — 1962 Senior Vice President, Chief Legal Officer and Secretary | | 2006 | | Director, Senior Vice President, Secretary and General Counsel, Invesco Management Group, Inc. (formerly known as Invesco AIM Management Group, Inc.); Senior Vice President, Invesco Advisers, Inc. (formerly known as Invesco Institutional (N.A.), Inc.) (registered investment adviser); Senior Vice President and Secretary, Invesco Distributors, Inc. (formerly known as Invesco AIM Distributors, Inc.); Director, Vice President and Secretary, Invesco Investment Services, Inc. (formerly known as Invesco AIM Investment Services, Inc.) Senior Vice President, Chief Legal Officer and Secretary, The Invesco Funds; Managing Director, Invesco PowerShares Capital Management LLC; Director, Secretary and General Counsel, Invesco Investment Advisers LLC (formerly known as Van Kampen Asset Management); Secretary and General Counsel, Invesco Capital Markets, Inc. (formerly known as Van Kampen Funds Inc.) and Chief Legal Officer, PowerShares Exchange-Traded Fund Trust, PowerShares Exchange-Traded Fund Trust II, PowerShares India Exchange-Traded Fund Trust, PowerShares Actively Managed Exchange-Traded Fund Trust, PowerShares Actively Managed Exchange-Traded Commodity Fund Trust and PowerShares Exchange-Traded Self-Indexed Fund Trust; Manager and Secretary, Invesco Indexing LLC Formerly: Director, Secretary, General Counsel and Senior Vice President, Van Kampen Exchange Corp.; Director, Vice President and Secretary, IVZ Distributors, Inc. (formerly known as INVESCO Distributors, Inc.); Director and Vice President, INVESCO Funds Group, Inc.; Director and Vice President, Van Kampen Advisors Inc.; Director, Vice President, Secretary and General Counsel, Van Kampen Investor Services Inc.; Director, Invesco Distributors, Inc. (formerly known as Invesco AIM Distributors, Inc.); Director, Senior Vice President, General Counsel and Secretary, Invesco AIM Advisers, Inc. and Van Kampen Investments Inc.; Director, Vice President and Secretary, Fund Management Company; Director, Senior Vice President, Secretary, General Counsel and Vice President, Invesco AIM Capital Management, Inc.; Chief Operating Officer and General Counsel, Liberty Ridge Capital, Inc. (an investment adviser); Vice President and Secretary, PBHG Funds (an investment company) and PBHG Insurance Series Fund (an investment company); Chief Operating Officer, General Counsel and Secretary, Old Mutual Investment Partners (a broker-dealer); General Counsel and Secretary, Old Mutual Fund Services (an administrator) and Old Mutual Shareholder Services (a shareholder servicing center); Executive Vice President, General Counsel and Secretary, Old Mutual Capital, Inc. (an investment adviser); and Vice President and Secretary, Old Mutual Advisors Funds (an investment company) | | N/A | | N/A |
Gregory G. McGreevey — 1962 Senior Vice President | | 2012 | | Senior Managing Director, Invesco Ltd.; Director, Chairman, President, and Chief Executive Officer, Invesco Advisers, Inc. (formerly known as Invesco Institutional (N.A.), Inc.) (registered investment adviser); Senior Vice President, Invesco Management Group, Inc.; Director, Invesco Mortgage Capital, Inc. and Invesco Senior Secured Management, Inc.; and Senior Vice President, The Invesco Funds Formerly: Assistant Vice President, The Invesco Funds | | N/A | | N/A |
Kelli Gallegos — 1970 Vice President, Principal Financial Officer and Assistant Treasurer | | 2008 | | Vice President, Principal Financial Officer and Assistant Treasurer, The Invesco Funds; Assistant Treasurer, Invesco PowerShares Capital Management LLC, PowerShares Exchange-Traded Fund Trust, PowerShares Exchange-Traded Fund Trust II, PowerShares India Exchange-Traded Fund Trust, PowerShares Actively Managed Exchange-Traded Fund Trust, PowerShares Actively Managed Exchange-Traded Commodity Fund Trust and PowerShares Exchange-Traded Self-Indexed Fund Trust Formerly: Assistant Vice President, The Invesco Funds | | N/A | | N/A |
Invesco V.I. International Growth Fund
Trustees and Officers—(continued)
| | | | | | | | |
Name, Year of Birth and
Position(s) Held with the Trust | | Trustee and/
or Officer Since | | Principal Occupation(s)
During Past 5 Years | | Number of
Funds in Fund
Complex
Overseen by
Trustee | | Other Directorship(s)
Held by Trustee During
Past 5 Years |
| Other Officers—(continued) | | | | | | | | |
Tracy Sullivan — 1962 Vice President, Chief Tax Officer and Assistant Treasurer | | 2008 | | Vice President, Chief Tax Officer and Assistant Treasurer, The Invesco Funds; Assistant Treasurer, Invesco PowerShares Capital Management LLC, PowerShares Exchange-Traded Fund Trust, PowerShares Exchange-Traded Fund Trust II, PowerShares India Exchange-Traded Fund Trust, PowerShares Actively Managed Exchange-Traded Fund Trust, PowerShares Actively Managed Exchange-Traded Commodity Fund Trust and PowerShares Exchange-Traded Self-Indexed Fund Trust Formerly: Assistant Vice President, The Invesco Funds | | N/A | | N/A |
Crissie M. Wisdom — 1969 Anti-Money Laundering Compliance Officer | | 2013 | | Anti-Money Laundering Compliance Officer, Invesco Advisers, Inc. (formerly known as Invesco Institutional (N.A.), Inc.) (registered investment adviser), Invesco Capital Markets, Inc. (formerly known as Van Kampen Funds Inc.), Invesco Distributors, Inc., Invesco Investment Services, Inc., Invesco Management Group, Inc., The Invesco Funds, and PowerShares Exchange-Traded Fund Trust, PowerShares Exchange-Traded Fund Trust II, PowerShares India Exchange-Traded Fund Trust, PowerShares Actively Managed Exchange-Traded Fund Trust, PowerShares Actively Managed Exchange-Traded Commodity Fund Trust and PowerShares Exchange-Traded Self-Indexed Fund Trust; Anti-Money Laundering Compliance Officer and Bank Secrecy Act Officer, INVESCO National Trust Company and Invesco Trust Company; and Fraud Prevention Manager and Controls and Risk Analysis Manager for Invesco Investment Services, Inc. Formerly: Anti-Money Laundering Compliance Officer, Van Kampen Exchange Corp. | | N/A | | N/A |
Robert R. Leveille — 1969 Chief Compliance Officer | | 2016 | | Chief Compliance Officer, Invesco Advisers, Inc. (registered investment adviser); and Chief Compliance Officer, The Invesco Funds Formerly: Chief Compliance Officer, Putnam Investments and the Putnam Funds | | N/A | | N/A |
The Statement of Additional Information of the Trust includes additional information about the Fund’s Trustees and is available upon request, without charge, by calling 1.800.959.4246. Please refer to the Fund’s Statement of Additional Information for information on the Fund’s sub-advisers.
| | | | | | |
Office of the Fund 11 Greenway Plaza, Suite 1000 Houston, TX 77046-1173 | | Investment Adviser Invesco Advisers, Inc. 1555 Peachtree Street, N.E. Atlanta, GA 30309 | | Distributor Invesco Distributors, Inc. 11 Greenway Plaza, Suite 1000 Houston, TX 77046-1173 | | Auditors PricewaterhouseCoopers LLP 1000 Louisiana Street, Suite 5800 Houston, TX 77002-5678 |
| | | |
| | | | | | |
Counsel to the Fund Stradley Ronon Stevens & Young, LLP 2005 Market Street, Suite 2600 Philadelphia, PA 19103-7018 | | Counsel to the Independent Trustees Goodwin Procter LLP 901 New York Avenue, N.W. Washington, D.C. 20001 | | Transfer Agent Invesco Investment Services, Inc. 11 Greenway Plaza, Suite 1000 Houston, TX 77046-1173 | | Custodian State Street Bank and Trust Company 225 Franklin Street Boston, MA 02110-2801 |
Invesco V.I. International Growth Fund
| | | | |
| | |

| | Annual Report to Shareholders | | December 31, 2017 |
| | |
| | Invesco V.I. Managed Volatility Fund |

| | |
| | The Fund provides a complete list of its holdings four times in each fiscal year, at the quarter-ends. For the second and fourth quarters, the lists appear in the Fund’s semiannual and annual reports to shareholders. For the first and third quarters, the Fund files the lists with the Securities and Exchange Commission (SEC) on Form N-Q. The Fund’s Form N-Q filings are available on the SEC website, sec.gov. Copies of the Fund’s Forms N-Q may be reviewed and copied at the SEC Public Reference Room in Washington, D.C. You can obtain information on the operation of the Public Reference Room, including information about duplicating fee charges, by calling 202 551 8090 or 800 732 0330, or by electronic request at the following email address: publicinfo@sec.gov. The SEC file numbers for the Fund are 811-07452 and 033-57340. The Fund’s most recent portfolio holdings, as filed on Form N-Q, have also been made available to insurance companies issuing variable annuity contracts and variable life insurance policies (“variable products”) that invest in the Fund. A description of the policies and procedures that the Fund uses to determine how to vote proxies relating to portfolio securities is available without charge, upon request, from our Client Services department at 800 959 4246 or at invesco.com/proxyguidelines. The information is also available on the SEC website, sec.gov. Information regarding how the Fund voted proxies related to its portfolio securities during the most recent 12-month period ended June 30 is available at invesco.com/ proxysearch. The information is also available on the SEC website, sec.gov. Invesco Advisers, Inc. is an investment adviser; it provides investment advisory services to individual and institutional clients and does not sell securities. Invesco Distributors, Inc. is the US distributor for Invesco Ltd.’s retail mutual funds, exchange-traded funds and institutional money market funds. Both are wholly owned, indirect subsidiaries of Invesco Ltd. This report must be accompanied or preceded by a currently effective Fund prospectus and variable product prospectus, which contain more complete information, including sales charges and expenses. Investors should read each carefully before investing. NOT FDIC INSURED | MAY LOSE VALUE | NO BANK GUARANTEE |
| |
| | Invesco Distributors, Inc. I-VIMGV-AR-1 02082018 1421 |
Management’s Discussion of Fund Performance
Performance summary
For the year ended December 31, 2017, Series I shares of Invesco V.I. Managed Volatility Fund (the Fund) underperformed the Russell 1000 Value Index.
Your Fund’s long-term performance appears later in this report.
Fund vs. Indexes
Total returns, 12/31/16 to 12/31/17, excluding variable product issuer charges.
If variable product issuer charges were included, returns would be lower.
| | | | | |
| Series I Shares | | | | 10.56 | % |
| Series II Shares | | | | 10.33 | |
| Russell 1000 Value Index▼ (Broad Market Index) | | | | 13.66 | |
| Bloomberg Barclays U.S. Government/Credit Index▼ (Style-Specific Index) | | | | 4.00 | |
| Lipper VUF Mixed-Asset Target Allocation Growth Funds Index∎ (Peer Group Index) | | | | 16.46 | |
Source(s): ▼FactSet Research Systems Inc.; ∎Lipper Inc.
Market conditions and your Fund
Despite highly destructive hurricanes that threatened to derail a years-long economic recovery, the US economy continued to expand throughout the year ended December 31, 2017. Gross domestic product – the value of all goods and services produced in the US – expanded in the first three quarters of 2017. Inflation remained subdued even as unemployment continued its multiyear decline.
Given signs of an improving economy, the US Federal Reserve (the Fed) raised interest rates three times during the reporting period, most recently in December 2017; each rate hike was 25 basis points. (A basis point is 0.01%.) The Fed pledged that “realized and expected economic conditions relative to its objectives of maximum employment and 2 percent inflation” will guide its future actions. At the close of the reporting period, Fed policy remained accommodative, and the fed funds target rate stood at a range of 1.25% to 1.50%.1
Higher inventories and a worsening outlook caused oil prices and many energy
stocks to decline during the first half of 2017. However, oil prices rose significantly in the second half of the reporting period as expectations for lower supplies increased, partly due to continued OPEC production cuts, and demand began normalizing.
Major US stock market indexes repeatedly hit all-time highs throughout the reporting period. The stock market rally that began after the 2016 presidential election continued throughout the reporting period, fueled by generally positive economic data, strong corporate earnings and improved consumer confidence. Finally, after much debate in Congress, a tax reform bill was signed into law in December 2017. While its enactment further strengthened stocks, its effect on the US economy remained uncertain.
For the reporting period as a whole, financials, consumer discretionary and telecommunication services were the strongest-performing sectors for the Fund, while consumer staples and materials were the weakest-performing sectors for the Fund, relative to the Russell 1000 Value Index.
During the year, the financials sector was the largest contributor to the Fund’s performance versus the Russell 1000 Value Index due to strong stock selection in and overweight exposure to the sector. Specifically, Citigroup, Bank of America and Morgan Stanley were the Fund’s top contributors. These companies benefited from investor optimism about future interest rates, an improving economy and lower corporate tax rates. Financials also benefited when the Fed’s Comprehensive Capital Analysis and Review was better than expected, providing a favorable view of the financial strength of US banks and their ability to return capital to their shareholders.
Stock selection in the consumer discretionary sector also benefited the Fund’s performance relative to the Russell 1000 Value Index during the year. Carnival was a key contributor in this sector. The stock performed well and posted a return of over 30% for the reporting period, leading the cruise operator to raise its outlook after reporting better pricing and strong forward-booking volumes for 2017. Michael Kors also contributed to the Fund’s relative results. Mid-year, the company reported better-than-expected results and a better revenue outlook due to fewer promotions and increased sales within its high end product lines.
Stock selection in the telecommunication services sector, as well as underweight exposure relative to the Russell 1000 Value Index, contributed to Fund performance during the year. The Fund’s lack of exposure to some of the weaker-performing names in the sector, namely AT&T, helped on a relative basis, as the sector posted negative returns for the reporting period. Similarly, the Fund’s lack of exposure to the real estate sector also contributed to relative returns. The Fund
| | | | | |
| Portfolio Composition |
| By sector | | | | % of total net assets | |
| |
| Financials | | | | 28.0 | % |
| Energy | | | | 11.9 | |
Information Technology | | | | 11.1 | |
| Health Care | | | | 10.8 | |
Consumer
Discretionary | | | | 8.5 | |
| Unknown | | | | 7.4 | |
| Consumer Staples | | | | 5.0 | |
| Industrials | | | | 4.3 | |
| Telecommunication Services | | | | 2.6 | |
| Materials | | | | 1.7 | |
| Real Estate | | | | 1.4 | |
| Utilities | | | | 0.8 | |
| Money Market Funds | | | | | |
| Plus Other Assets Less Liabilities | | | | 6.5 | |
| | | | | |
| Top 10 Equity Holdings* | | % of total net assets |
| | | | | | | |
| | |
| 1. | | Citigroup Inc. | | | | 3.6 | % |
| 2. | | Bank of America Corp. | | | | 3.0 | |
| 3. | | JPMorgan Chase & Co. | | | | 2.5 | |
| 4. | | Morgan Stanley | | | | 2.0 | |
| 5. | | Citizens Financial Group, Inc. | | | | 1.7 | |
| 6. | | Royal Dutch Shell PLC-Class A | | | | 1.5 | |
| 7. | | Oracle Corp. | | | | 1.5 | |
| 8. | | Occidental Petroleum Corp. | | | | 1.4 | |
| 9. | | Devon Energy Corp. | | | | 1.3 | |
| 10. | | General Motors Co. | | | | 1.3 | |
| | | | | |
| Total Net Assets | | | $ | 45.6 million | |
| |
| Total Number of Holdings* | | | | 256 | |
The Fund’s holdings are subject to change, and there is no assurance that the Fund will continue to hold any particular security.
*Excluding money market fund holdings.
Data presented here are as of December 31, 2017.
Invesco V.I. Managed Volatility Fund
remained materially underweight in these sectors because we believed they were overvalued because investors had driven stock prices up in a quest for yield in a low-interest rate environment.
Stock selection within the industrials sector contributed to the Fund’s performance relative to the Russell 1000 Value Index during the reporting period. CSX, a rail-based transportation services firm, was one of the top contributors as the stock posted a return of over 50% for the fiscal year. Early in 2017, the company announced the arrival of Hunter Harrison, a highly respected chief executive officer (CEO) within the industry, and the stock rallied on investors’ expectations of improved profitability. Mr. Harrison passed away in December; however, the company quickly appointed a new experienced CEO with a history of working with Mr. Harrison for many years. Material underweight exposure to General Electric was also a driver of relative Fund performance as the stock posted a negative return for the year. We sold our position in the company during the reporting period.
Stock selection within the consumer staples sector was a large detractor from relative Fund performance for the reporting period. Walgreens Boots Alliance posted a negative return for the year after rumors emerged that Amazon (not a Fund holding) may be entering the pharmacy space, driving investor concerns.
Stock selection in the materials sector also detracted from the Fund’s performance versus the Russell 1000 Value Index during the reporting period. Within the sector, the largest detractor was The Mosaic Company, a phosphate and potash supplier. During the first half of 2017, the stock price fell after the company reported sales and profits had decreased sharply year over year. Operating earnings were down due to lower phosphate and potash prices caused by excessive supply.
The Fund’s underweight allocation to the utilities sector also detracted from performance relative to the Russell 1000 Value Index during the reporting period. The Fund remained materially underweight in this sector because we believed it was overvalued.
The Fund uses high grade bonds as a source of income and to dampen return volatility. Although the bond portion of the Fund posted positive returns for the reporting period, bonds generally underperformed equities and detracted from Fund performance relative to the Russell 1000 Value Index. Similarly, the
Fund’s allocation to convertible securities posted positive returns on an absolute basis, but detracted from relative performance as convertibles underperformed the Russell 1000 Value Index. The Fund’s cash position was a detractor in a strong equity market.
We used forward foreign currency contracts for the purpose of hedging currency exposure of non-US-based companies held in the portfolio. Forward foreign currency contracts were used solely for the purpose of hedging and not for speculative purposes or leverage. The use of forward foreign currency contracts had a negative impact on the Fund’s performance, largely due to the weakness of the US dollar compared to the foreign currencies in which the Fund’s non-US holdings were denominated.
As part of our mandate, and to potentially reduce portfolio volatility during a market downturn, we sold short S&P 500 futures contracts during the reporting period for the purpose of reducing equity exposure in the Fund. Derivatives were used solely for the purpose of reducing volatility and not for speculative purposes. The use of S&P 500 futures contracts had a slight negative impact on the Fund’s absolute performance, but also reduced volatility relative to the Russell 1000 Value Index for the reporting period.
At the end of the reporting period, the Fund’s largest overweight exposures relative to the Russell 1000 Value Index were in the financials and energy sectors, while the largest underweight exposures were in the real estate and utilities sectors.
Thank you for your investment in Invesco V.I. Managed Volatility Fund and for sharing our long-term investment horizon.
1 Source: US Federal Reserve
The views and opinions expressed in management’s discussion of Fund performance are those of Invesco Advisers, Inc. These views and opinions are subject to change at any time based on factors such as market and economic conditions. These views and opinions may not be relied upon as investment advice or recommendations, or as an offer for a particular security. The information is not a complete analysis of every aspect of any market, country, industry, security or the Fund. Statements of fact are from sources considered reliable, but Invesco Advisers, Inc. makes no representation or warranty as to their completeness or accuracy. Although historical performance is no guarantee of future results, these insights may help you understand our investment management philosophy.
See important Fund and, if applicable, index disclosures later in this report.
| | |
 | | Thomas Bastian Chartered Financial Analyst, Portfolio Manager, is lead manager of Invesco V.I. Managed Volatility |
| Fund. He joined Invesco in 2010. Mr. Bastian earned a BA in accounting from St. John’s University and an MBA in finance from the University of Michigan. |
| |
 | | Chuck Burge Portfolio Manager, is manager of Invesco V.I. Managed Volatility Fund. He joined Invesco in 2002. Mr. Burge |
| earned a BS in economics from Texas A&M University and an MBA in finance and accounting from Rice University. |
| |
 | | Brian Jurkash Portfolio Manager, is manager of Invesco V.I. Managed Volatility Fund. He joined Invesco in 2000. Mr. Jurkash |
| earned a BBA degree in finance from Stephen F. Austin State University and an MBA in finance from the University of Houston. |
| |
 | | Sergio Marcheli Portfolio Manager, is manager of Invesco V.I. Managed Volatility Fund. He joined Invesco in 2010. Mr. |
| Marcheli earned a BBA from the University of Houston and an MBA from the University of St. Thomas. |
| |
 | | Duy Nguyen Chartered Financial Analyst, Portfolio Manager and Chief Investment Officer of Invesco’s Global |
| Solutions Development and Implementation Team, is manager of Invesco V.I. Managed Volatility Fund. He joined Invesco in 2000. Mr. Nguyen earned a BBA from The University of Texas at Austin and an MS from the University of Houston. |
| |
 | | Matthew Titus Chartered Financial Analyst, Portfolio Manager, is manager of Invesco V.I. Managed Volatility Fund. |
| He joined Invesco in 2016. Mr. Titus earned a bachelor’s degree in accounting and economics from Luther College in Decorah, Iowa, and an MBA from Ohio State University. |
Invesco V.I. Managed Volatility Fund
Your Fund’s Long-Term Performance
Results of a $10,000 Investment – Oldest Share Class(es)
Fund and index data from 12/31/07
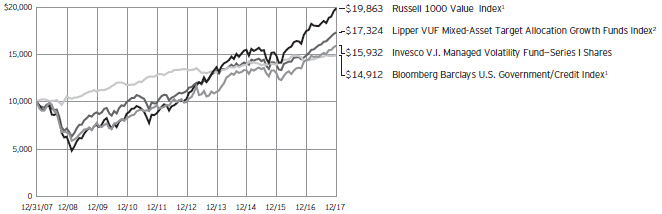
| 1 | Source: FactSet Research Systems Inc. |
Past performance cannot guarantee
comparable future results.
| | | | | |
| Average Annual Total Returns |
As of 12/31/17 | | | | | |
| |
| Series I Shares | | | | | |
| Inception (12/30/94) | | | | 7.48 | % |
| 10 Years | | | | 4.77 | |
| 5 Years | | | | 9.83 | |
| 1 Year | | | | 10.56 | |
| |
| Series II Shares | | | | | |
| Inception (4/30/04) | | | | 9.28 | % |
| 10 Years | | | | 4.51 | |
| 5 Years | | | | 9.56 | |
| 1 Year | | | | 10.33 | |
The performance of the Fund’s Series I and Series II share classes will differ primarily due to different class expenses.
The performance data quoted represent past performance and cannot guarantee comparable future results; current performance may be lower or higher. Please contact your variable product issuer or financial adviser for the most recent month-end variable product performance. Performance figures reflect Fund expenses, reinvested distributions and changes in net asset value. Investment return and
principal value will fluctuate so that you may have a gain or loss when you sell shares.
The net annual Fund operating expense ratio set forth in the most recent Fund prospectus as of the date of this report for Series I and Series II shares was 1.16% and 1.41%, respectively.1 The total annual Fund operating expense ratio set forth in the most recent Fund prospectus as of the date of this report for Series I and Series II shares was 1.17% and 1.42%, respectively. The expense ratios presented above may vary from the expense ratios presented in other sections of this report that are based on expenses incurred during the period covered by this report.
Invesco V.I. Managed Volatility Fund, a series portfolio of AIM Variable Insurance Funds (Invesco Variable Insurance Funds), is currently offered through insurance companies issuing variable products. You cannot purchase shares of the Fund directly. Performance figures given represent the Fund and are not intended to reflect
actual variable product values. They do not reflect sales charges, expenses and fees assessed in connection with a variable product. Sales charges, expenses and fees, which are determined by the variable product issuers, will vary and will lower the total return.
The most recent month-end performance at the Fund level, excluding variable product charges, is available at 800 451 4246. As mentioned above, for the most recent month-end performance including variable product charges, please contact your variable product issuer or financial adviser.
Fund performance reflects any applicable fee waivers and/or expense reimbursements. Had the adviser not waived fees and/or reimbursed expenses currently or in the past, returns would have been lower. See current prospectus for more information.
| 1 | Total annual Fund operating expenses after any contractual fee waivers and/or expense reimbursements by the adviser in effect through at least June 30, 2019. See current prospectus for more information. |
Invesco V.I. Managed Volatility Fund
Invesco V.I. Managed Volatility Fund’s investment objective is both capital appreciation and current income while managing portfolio volatility.
| ∎ | | Unless otherwise stated, information presented in this report is as of December 31, 2017, and is based on total net assets. |
| ∎ | | Unless otherwise noted, all data provided by Invesco. |
Principal risks of investing in the Fund
Changing fixed income market conditions risk. The current low interest rate environment was created in part by the Federal Reserve Board (FRB) and certain foreign central banks keeping the federal funds and equivalent foreign rates near, at or below zero. Increases in the federal funds and equivalent foreign rates may expose fixed income markets to heightened volatility and reduced liquidity for certain fixed income investments, particularly those with longer maturities. In addition, decreases in fixed income dealer market-making capacity may also potentially lead to heightened volatility and reduced liquidity in the fixed income markets. As a result, the value of the Fund’s investments and share price may decline. Changes in central bank policies could also result in higher than normal shareholder redemptions, which could potentially increase portfolio turnover and the Fund’s transaction costs.
Convertible securities risk. The market values of convertible securities are affected by market interest rates, the risk of actual issuer default on interest or principal payments and the value of the underlying common stock into which the convertible security may be converted. Additionally, a convertible security is subject to the same types of market and issuer risks as apply to the underlying common stock. In addition, certain convertible securities are subject to involuntary conversions and may undergo principal write-downs upon the occurrence of certain triggering events, and, as a result, are subject to an increased risk of loss. Convertible securities may be rated below investment grade.
Debt securities risk. The prices of debt securities held by the Fund will be affected by changes in interest rates, the creditworthiness of the issuer and other factors. An increase in prevailing interest rates typically causes the value of existing debt securities to fall and often has a greater impact on longer-duration debt securities and higher quality debt securities. Falling interest rates will cause the Fund to reinvest the proceeds of debt securities that have been repaid by the issuer at lower interest rates. Falling interest rates may also reduce the Fund’s distributable income because interest payments on floating rate debt instruments held by the Fund will decline. The Fund could lose money on investments in debt securities if the issuer or borrower fails to meet its obligations to make interest payments
and/or to repay principal in a timely manner. Changes in an issuer’s financial strength, the market’s perception of such strength or in the credit rating of the issuer or the security may affect the value of debt securities. The Adviser’s credit analysis may fail to anticipate such changes, which could result in buying a debt security at an inopportune time or failing to sell a debt security in advance of a price decline or other credit event.
Depositary receipts risk. Investing in depositary receipts involves the same risks as direct investments in foreign securities. In addition, the underlying issuers of certain depositary receipts are under no obligation to distribute shareholder communications or pass through any voting rights with respect to the deposited securities to the holders of such receipts. The Fund may therefore receive less timely information or have less control than if it invested directly in the foreign issuer.
Derivatives risk. The value of a derivative instrument depends largely on (and is derived from) the value of an underlying security, currency, commodity, interest rate, index or other asset (each referred to as an underlying asset). In addition to risks relating to the underlying assets, the use of derivatives may include other, possibly greater, risks, including counterparty, leverage and liquidity risks. Counterparty risk is the risk that the counterparty to the derivative contract will default on its obligation to pay the Fund the amount owed or otherwise perform under the derivative contract. Derivatives create leverage risk because they do not require payment up front equal to the economic exposure created by owning the derivative. As a result, an adverse change in the value of the underlying asset could result in the Fund sustaining a loss that is substantially greater than the amount invested in the derivative, which may make the Fund’s returns more volatile and increase the risk of loss. Derivative instruments may also be less liquid than more traditional investments and the Fund may be unable to sell or close out its derivative positions at a desirable time or price. This risk may be more acute under adverse market conditions, during which the Fund may be most in need of liquidating its derivative positions. Derivatives may also be harder to value, less tax efficient and subject to changing government regulation that could impact the Fund’s ability to use certain derivatives or their cost. Also, derivatives used for hedging or to gain or limit exposure to a particular
market segment may not provide the expected benefits, particularly during adverse market conditions.
Foreign securities risk. The Fund’s foreign investments may be adversely affected by political and social instability, changes in economic or taxation policies, difficulty in enforcing obligations, decreased liquidity or increased volatility. Foreign investments also involve the risk of the possible seizure, nationalization or expropriation of the issuer or foreign deposits (in which the Fund could lose its entire investments in a certain market) and the possible adoption of foreign governmental restrictions such as exchange controls. Unless the Fund has hedged its foreign securities risk, foreign securities risk also involves the risk of negative foreign currency rate fluctuations, which may cause the value of securities denominated in such foreign currency (or other instruments through which the Fund has exposure to foreign currencies) to decline in value. Currency exchange rates may fluctuate significantly over short periods of time. Currency hedging strategies, if used, are not always successful.
Management risk. The Fund is actively managed and depends heavily on the Adviser’s judgment about markets, interest rates or the attractiveness, relative values, liquidity, or potential appreciation of particular investments made for the Fund’s portfolio. The Fund could experience losses if these judgments prove to be incorrect. There is no guarantee that the portfolio manager’s stock selection process will produce lower volatility than the broader markets in which the Fund invests. In addition, the Fund’s investment strategy to seek lower volatility may cause the Fund to underperform the broader markets in which the Fund invests during market rallies. Such underperformance could be significant during sudden or significant market rallies. Additionally, legislative, regulatory, or tax developments may adversely affect management of the Fund and, therefore, the ability of the Fund to achieve its investment objective.
Market risk. The market values of the Fund’s investments, and therefore the value of the Fund’s shares, will go up and down, sometimes rapidly or unpredictably. Market risk may affect a single issuer, industry or section of the economy, or it may affect the market as a whole. Individual stock prices tend to go up and down more dramatically than those of certain other types of investments, such
Invesco V.I. Managed Volatility Fund
as bonds. During a general downturn in the financial markets, multiple asset classes may decline in value. When markets perform well, there can be no assurance that specific investments held by the Fund will rise in value.
Preferred securities risk. Preferred securities are subject to issuer-specific and market risks applicable generally to equity securities. Preferred securities also may be subordinated to bonds or other debt instruments, subjecting them to a greater risk of non-payment, may be less liquid than many other securities, such as common stocks, and generally offer no voting rights with respect to the issuer.
Real estate investment trust risk/real estate risk. Investments in real estate related instruments may be affected by economic, legal, cultural, environmental or technological factors that affect property values, rents or occupancies of real estate related to the Fund’s holdings. Shares of real estate related companies, which tend to be small- and mid-cap companies, may be more volatile and less liquid.
Sector focus risk. The Fund may from time to time invest a significant amount of its assets (i.e. over 25%) in one market sector or group of related industries. In this event, the Fund’s performance will depend to a greater extent on the overall condition of the sector or group of industries and there is increased risk that the Fund will lose significant value if conditions adversely affect that sector or group of industries.
Short position risk. Because the Fund’s potential loss on a short position arises from increases in the value of the asset sold short, the Fund will incur a loss on a short position, which is theoretically unlimited, if the price of the asset sold short increases from the short sale price. The counterparty to a short position or other market factors may prevent the Fund from closing out a short position at a desirable time or price and may reduce or eliminate any gain or result in a loss. In a rising market, the Fund’s short positions will cause the Fund to underperform the overall market and its peers that do not engage in shorting. If the Fund holds both long and short positions, and both positions decline simultaneously, the short positions will not provide any buffer (hedge) from declines in value of the Fund’s long positions. Certain types of short positions involve leverage, which may exaggerate any losses, potentially more than the actual cost of the investment, and will increase the volatility of the Fund’s returns.
Small- and mid-capitalization companies risks. Small- and mid-capitalization companies tend to be more vulnerable to changing market conditions, may have little or no operating history or track
record of success, and may have more limited product lines and markets, less experienced management and fewer financial resources than larger companies. These companies’ securities may be more volatile and less liquid than those of more established companies, and their returns may vary, sometimes significantly, from the overall securities market.
Value investing style risk. A value investing style subjects the Fund to the risk that the valuations never improve or that the returns on value equity securities are less than returns on other styles of investing or the overall stock market.
Volatility management risk. The Adviser’s strategy for managing portfolio volatility may not produce the desired result and there can be no guarantee that the Fund will maintain its target volatility level. Additionally, maintenance of the target volatility level will not ensure that the Fund will deliver competitive returns. The use of derivatives in connection with the Fund’s managed volatility strategy may expose the Fund to losses (some of which may be sudden) that it would not have otherwise been exposed to if it had only invested directly in equity and/or fixed income securities. Efforts to manage the Fund’s volatility could limit the Fund’s gains in rising markets and may expose the Fund to costs to which it would otherwise not have been exposed. The Adviser uses a combination of proprietary and third-party systems and risk models to help it estimate the Fund’s expected volatility, which may perform differently than expected and may negatively affect performance and the ability of the Fund to maintain its volatility at or below its target maximum annual volatility level.
Warrants risk. Warrants may be significantly less valuable or worthless on their expiration date and may also be postponed or terminated early, resulting in a partial or total loss. Warrants may also be illiquid.
Zero coupon or pay-in-kind securities risk. The value, interest rates, and liquidity of non-cash paying instruments, such as zero coupon and pay-in-kind securities, are subject to greater fluctuation than other types of securities. The higher yields and interest rates on pay-in-kind securities reflect the payment deferral and increased credit risk associated with such instruments and that such investments may represent a higher credit risk than loans that periodically pay interest.
About indexes used in this report
The Russell 1000® Value Index is an unmanaged index considered representative of large-cap value stocks. The Russell 1000 Value Index is a trademark/service mark of the Frank Russell Co. Russell® is a trademark of the Frank Russell Co.
The Bloomberg Barclays U.S. Government/Credit Index is a broad-based benchmark that includes investment-grade, US dollar-denominated, fixed-rate Treasuries, government-related and corporate securities.
The Lipper VUF Mixed-Asset Target Allocation Growth Funds Index is an unmanaged index considered representative of mixed-asset target allocation growth variable insurance underlying funds tracked by Lipper.
The Fund is not managed to track the performance of any particular index, including the index(es) described here, and consequently, the performance of the Fund may deviate significantly from the performance of the index(es).
A direct investment cannot be made in an index. Unless otherwise indicated, index results include reinvested dividends, and they do not reflect sales charges. Performance of the peer group, if applicable, reflects fund expenses; performance of a market index does not.
Other information
The returns shown in management’s discussion of Fund performance are based on net asset values calculated for shareholder transactions. Generally accepted accounting principles require adjustments to be made to the net assets of the Fund at period end for financial reporting purposes, and as such, the net asset values for shareholder transactions and the returns based on those net asset values may differ from the net asset values and returns reported in the Financial Highlights. Additionally, the returns and net asset values shown throughout this report are at the Fund level only and do not include variable product issuer charges. If such charges were included, the total returns would be lower.
Industry classifications used in this report are generally according to the Global Industry Classification Standard, which was developed by and is the exclusive property and a service mark of MSCI Inc. and Standard & Poor’s.
Invesco V.I. Managed Volatility Fund
Schedule of Investments(a)
December 31, 2017
| | | | | | | | |
| | | Shares | | | Value | |
Common Stocks & Other Equity Interests–62.64% | |
| Aerospace & Defense–0.97% | |
General Dynamics Corp. | | | 2,177 | | | $ | 442,911 | |
|
| Apparel, Accessories & Luxury Goods–0.48% | |
Michael Kors Holdings Ltd.(b) | | | 3,447 | | | | 216,989 | |
|
| Asset Management & Custody Banks–1.70% | |
Northern Trust Corp. | | | 3,284 | | | | 328,039 | |
State Street Corp. | | | 4,593 | | | | 448,322 | |
| | | | | | | | 776,361 | |
|
| Automobile Manufacturers–1.29% | |
General Motors Co. | | | 14,306 | | | | 586,403 | |
|
| Biotechnology–0.44% | |
Amgen Inc. | | | 1,141 | | | | 198,420 | |
|
| Broadcasting–0.16% | |
CBS Corp.–Class B | | | 1,212 | | | | 71,508 | |
|
| Building Products–0.65% | |
Johnson Controls International PLC | | | 7,736 | | | | 294,819 | |
|
| Cable & Satellite–1.36% | |
Charter Communications, Inc.–Class A(b) | | | 739 | | | | 248,274 | |
Comcast Corp.–Class A | | | 9,294 | | | | 372,225 | |
| | | | | | | | 620,499 | |
|
| Communications Equipment–1.76% | |
Cisco Systems, Inc. | | | 13,343 | | | | 511,037 | |
Juniper Networks, Inc. | | | 10,174 | | | | 289,959 | |
| | | | | | | | 800,996 | |
|
| Data Processing & Outsourced Services–0.44% | |
PayPal Holdings, Inc.(b) | | | 2,753 | | | | 202,676 | |
|
| Diversified Banks–9.12% | |
Bank of America Corp. | | | 46,193 | | | | 1,363,617 | |
Citigroup Inc. | | | 22,077 | | | | 1,642,750 | |
JPMorgan Chase & Co. | | | 10,713 | | | | 1,145,648 | |
| | | | | | | | 4,152,015 | |
|
| Diversified Metals & Mining–0.52% | |
BHP Billiton Ltd. (Australia) | | | 10,248 | | | | 235,876 | |
| |
| Drug Retail–2.34% | | | | | |
CVS Health Corp. | | | 7,601 | | | | 551,073 | |
Walgreens Boots Alliance, Inc. | | | 7,062 | | | | 512,842 | |
| | | | | | | | 1,063,915 | |
|
| Electric Utilities–0.28% | |
FirstEnergy Corp. | | | 4,143 | | | | 126,859 | |
|
| Fertilizers & Agricultural Chemicals–1.05% | |
Agrium Inc. (Canada) | | | 2,019 | | | | 232,185 | |
Mosaic Co. (The) | | | 9,568 | | | | 245,515 | |
| | | | | | | | 477,700 | |
| | | | | | | | |
| | | Shares | | | Value | |
| Health Care Distributors–0.89% | | | | | |
McKesson Corp. | | | 2,597 | | | $ | 405,002 | |
|
| Health Care Equipment–1.44% | |
Baxter International Inc. | | | 4,203 | | | | 271,682 | |
Medtronic PLC | | | 4,788 | | | | 386,631 | |
| | | | | | | | 658,313 | |
|
| Home Improvement Retail–0.84% | |
Kingfisher PLC (United Kingdom) | | | 84,164 | | | | 383,728 | |
|
| Hotels, Resorts & Cruise Lines–1.11% | |
Carnival Corp. | | | 7,621 | | | | 505,806 | |
|
| Industrial Machinery–0.77% | |
Ingersoll-Rand PLC | | | 3,940 | | | | 351,409 | |
|
| Insurance Brokers–1.77% | |
Aon PLC | | | 2,576 | | | | 345,184 | |
Marsh & McLennan Cos., Inc. | | | 2,394 | | | | 194,848 | |
Willis Towers Watson PLC | | | 1,763 | | | | 265,666 | |
| | | | | | | | 805,698 | |
|
| Integrated Oil & Gas–3.54% | |
Occidental Petroleum Corp. | | | 8,343 | | | | 614,545 | |
Royal Dutch Shell PLC–Class A (United Kingdom) | | | 20,159 | | | | 674,973 | |
TOTAL S.A. (France) | | | 5,892 | | | | 325,080 | |
| | | | | | | | 1,614,598 | |
|
| Integrated Telecommunication Services–0.62% | |
Orange S.A. (France) | | | 4,166 | | | | 72,289 | |
Verizon Communications Inc. | | | 3,950 | | | | 209,074 | |
| | | | | | | | 281,363 | |
|
| Internet Software & Services–0.86% | |
eBay Inc.(b) | | | 10,443 | | | | 394,119 | |
|
| Investment Banking & Brokerage–3.50% | |
Charles Schwab Corp. (The) | | | 6,112 | | | | 313,973 | |
Goldman Sachs Group, Inc. (The) | | | 1,489 | | | | 379,338 | |
Morgan Stanley | | | 17,178 | | | | 901,330 | |
| | | | | | | | 1,594,641 | |
|
| IT Consulting & Other Services–0.88% | |
Cognizant Technology Solutions Corp.–Class A | | | 5,627 | | | | 399,629 | |
|
| Managed Health Care–0.64% | |
Anthem, Inc. | | | 1,304 | | | | 293,413 | |
|
| Multi-Line Insurance–1.03% | |
American International Group, Inc. | | | 7,857 | | | | 468,120 | |
|
| Oil & Gas Equipment & Services–1.66% | |
Baker Hughes, a GE Co. | | | 7,394 | | | | 233,946 | |
TechnipFMC PLC (United Kingdom) | | | 16,649 | | | | 521,280 | |
| | | | | | | | 755,226 | |
See accompanying Notes to Financial Statements which are an integral part of the financial statements.
Invesco V.I. Managed Volatility Fund
| | | | | | | | |
| | |
Shares | | | Value | |
| Oil & Gas Exploration & Production–4.60% | |
Anadarko Petroleum Corp. | | | 8,347 | | | $ | 447,733 | |
Apache Corp. | | | 13,171 | | | | 556,080 | |
Canadian Natural Resources Ltd. (Canada) | | | 13,614 | | | | 486,547 | |
Devon Energy Corp. | | | 14,651 | | | | 606,551 | |
| | | | | | | | 2,096,911 | |
|
| Other Diversified Financial Services–0.54% | |
Voya Financial, Inc. | | | 4,937 | | | | 244,233 | |
|
| Packaged Foods & Meats–0.80% | |
Mondelez International, Inc.–Class A | | | 8,535 | | | | 365,298 | |
|
| Pharmaceuticals–3.82% | |
Bristol-Myers Squibb Co. | | | 4,297 | | | | 263,320 | |
Merck & Co., Inc. | | | 6,288 | | | | 353,826 | |
Novartis AG (Switzerland) | | | 4,162 | | | | 351,995 | |
Pfizer Inc. | | | 13,880 | | | | 502,734 | |
Sanofi (France) | | | 3,113 | | | | 268,029 | |
| | | | | | | | 1,739,904 | |
|
| Railroads–1.05% | |
CSX Corp. | | | 8,715 | | | | 479,412 | |
|
| Regional Banks–4.95% | |
Citizens Financial Group, Inc. | | | 18,085 | | | | 759,208 | |
Comerica Inc. | | | 2,625 | | | | 227,876 | |
Fifth Third Bancorp | | | 16,555 | | | | 502,279 | |
First Horizon National Corp. | | | 12,043 | | | | 240,740 | |
PNC Financial Services Group, Inc. (The) | | | 3,646 | | | | 526,081 | |
| | | | | | | | 2,256,184 | |
|
| Semiconductors–1.71% | |
Intel Corp. | | | 8,041 | | | | 371,173 | |
QUALCOMM Inc. | | | 6,373 | | | | 407,999 | |
| | | | | | | | 779,172 | |
|
| Systems Software–1.45% | |
Oracle Corp. | | | 13,953 | | | | 659,698 | |
|
| Tobacco–1.10% | |
Philip Morris International Inc. | | | 4,736 | | | | 500,358 | |
|
| Wireless Telecommunication Services–0.51% | |
Vodafone Group PLC–ADR (United Kingdom) | | | 7,285 | | | | 232,391 | |
Total Common Stocks & Other Equity Interests
(Cost $22,054,392) | | | | 28,532,573 | |
| | |
| | | Principal
Amount | | | | |
Bonds & Notes–23.23% | |
| Aerospace & Defense–0.23% | |
Northrop Grumman Corp., Sr. Unsec. Global Notes, 1.75%, 06/01/2018 | | $ | 80,000 | | | | 79,953 | |
Precision Castparts Corp., Sr. Unsec. Global Notes, 1.25%, 01/15/2018 | | | 25,000 | | | | 24,993 | |
| | | | | | | | 104,946 | |
| | | | | | | | |
| | | Principal
Amount | | | Value | |
| Air Freight & Logistics–0.01% | |
United Parcel Service, Inc., Sr. Unsec. Notes, 3.40%, 11/15/2046 | | $ | 4,000 | | | $ | 3,875 | |
|
| Airlines–0.13% | |
American Airlines Pass Through Trust, Series 2014-1, Class A, Sr. Sec. First Lien Pass Through Ctfs., 3.70%, 04/01/2028 | | | 20,768 | | | | 21,287 | |
United Airlines Pass Through Trust, Series 2014-2, Class A, Sr. Sec. First Lien Pass Through Ctfs., 3.75%, 09/03/2026 | | | 26,559 | | | | 27,552 | |
Virgin Australia Pass Through Trust (Australia), Series 2013-1, Class A, Sec. Gtd. Pass Through Ctfs., 5.00%, 04/23/2025(c) | | | 8,744 | | | | 9,116 | |
| | | | | | | | 57,955 | |
|
| Application Software–0.83% | |
Citrix Systems, Inc., Sr. Unsec. Conv. Bonds, 0.50%, 04/15/2019 | | | 117,000 | | | | 151,588 | |
Nuance Communications, Inc., Sr. Unsec. Conv. Bonds, 1.00%, 12/15/2022(d) | | | 127,000 | | | | 121,841 | |
RealPage, Inc., Sr. Unsec. Conv. Notes, 1.50%, 11/15/2022(c) | | | 24,000 | | | | 29,820 | |
Workday, Inc., Sr. Unsec. Conv. Notes, 0.25%, 10/01/2022(c) | | | 75,000 | | | | 74,344 | |
| | | | | | | | 377,593 | |
|
| Asset Management & Custody Banks–0.77% | |
Apollo Management Holdings L.P., Sr. Unsec. Gtd. Notes, 4.00%, 05/30/2024(c) | | | 40,000 | | | | 40,977 | |
Blackstone Holdings Finance Co. LLC, Sr. Unsec. Gtd. Notes, 5.00%, 06/15/2044(c) | | | 150,000 | | | | 173,714 | |
Brookfield Asset Management Inc. (Canada), Sr. Unsec. Notes, 4.00%, 01/15/2025 | | | 25,000 | | | | 25,689 | |
Carlyle Holdings Finance LLC, Sr. Unsec. Gtd. Notes, 3.88%, 02/01/2023(c) | | | 15,000 | | | | 15,368 | |
KKR Group Finance Co. III LLC, Sr. Unsec. Gtd. Bonds, 5.13%, 06/01/2044(c) | | | 85,000 | | | | 94,355 | |
| | | | | | | | 350,103 | |
|
| Automobile Manufacturers–0.55% | |
Ford Motor Credit Co. LLC, Sr. Unsec. Global Notes, 4.13%, 08/04/2025 | | | 200,000 | | | | 207,130 | |
General Motors Co., Sr. Unsec. Global Notes, 6.60%, 04/01/2036 | | | 16,000 | | | | 19,537 | |
General Motors Financial Co., Inc., Sr. Unsec. Gtd. Global Notes, 5.25%, 03/01/2026 | | | 21,000 | | | | 23,124 | |
| | | | | | | | 249,791 | |
|
| Biotechnology–0.86% | |
AbbVie Inc., Sr. Unsec. Global Notes, 4.50%, 05/14/2035 | | | 38,000 | | | | 41,835 | |
BioMarin Pharmaceutical Inc., Sr. Unsec. Sub. Conv. Notes, 1.50%, 10/15/2020 | | | 117,000 | | | | 139,157 | |
Celgene Corp., Sr. Unsec. Global Notes, 4.63%, 05/15/2044 | | | 100,000 | | | | 107,012 | |
See accompanying Notes to Financial Statements which are an integral part of the financial statements.
Invesco V.I. Managed Volatility Fund
| | | | | | | | |
| | | Principal
Amount | | | Value | |
| Biotechnology–(continued) | |
Gilead Sciences, Inc., Sr. Unsec. Global Notes, 4.40%, 12/01/2021 | | $ | 25,000 | | | $ | 26,674 | |
Neurocrine Biosciences, Inc., Sr. Unsec. Conv. Notes, 2.25%, 05/15/2024(c) | | | 62,000 | | | | 79,321 | |
| | | | | | | | 393,999 | |
|
| Brewers–0.50% | |
Anheuser-Busch InBev Finance, Inc. (Belgium), Sr. Unsec. Gtd. Global Notes, | | | | | | | | |
2.65%, 02/01/2021 | | | 30,000 | | | | 30,170 | |
3.30%, 02/01/2023 | | | 25,000 | | | | 25,608 | |
4.70%, 02/01/2036 | | | 45,000 | | | | 50,620 | |
4.90%, 02/01/2046 | | | 47,000 | | | | 54,642 | |
Heineken NV (Netherlands), Sr. Unsec. Notes, 3.50%, 01/29/2028(c) | | | 35,000 | | | | 35,770 | |
Molson Coors Brewing Co., Sr. Unsec. Gtd. Global Notes,
1.45%, 07/15/2019 | | | 13,000 | | | | 12,841 | |
4.20%, 07/15/2046 | | | 16,000 | | | | 16,357 | |
| | | | | | | | 226,008 | |
|
| Broadcasting–1.15% | |
Liberty Interactive LLC, Sr. Unsec. Conv. Deb., 1.75%, 10/05/2023(c)(d) | | | 85,000 | | | | 98,547 | |
Liberty Media Corp.,
Sr. Unsec. Conv. Deb., 2.25%,
10/05/2021(d) | | | 55,000 | | | | 57,544 | |
Sr. Unsec. Conv. Notes, 1.38%, 10/15/2023 | | | 299,000 | | | | 345,554 | |
Liberty Formula One, Sr. Unsec. Conv. Notes, 1.00%, 01/30/2023(c) | | | 20,000 | | | | 22,425 | |
| | | | | | | | 524,070 | |
|
| Cable & Satellite–0.82% | |
Charter Communications Operating, LLC/Charter Communications Operating Capital Corp., Sr. Sec. Gtd. First Lien Global Notes, 4.46%, 07/23/2022 | | | 60,000 | | | | 62,656 | |
Comcast Corp., Sr. Unsec. Gtd. Global Notes, 5.70%, 05/15/2018 | | | 150,000 | | | | 152,133 | |
DISH Network Corp., Sr. Unsec. Conv. Bonds, 3.38%, 08/15/2026 | | | 147,000 | | | | 160,322 | |
| | | | | | | | 375,111 | |
|
| Communications Equipment–0.82% | |
Ciena Corp., Sr. Unsec. Conv. Bonds, 4.00%, 12/15/2020 | | | 75,000 | | | | 98,062 | |
Finisar Corp., Sr. Unsec. Conv. Bonds, 0.50%, 12/15/2021(d) | | | 39,000 | | | | 36,368 | |
Viavi Solutions Inc.,
Sr. Unsec. Conv. Deb., 0.63%,
08/15/2018(d) | | | 167,000 | | | | 172,427 | |
Sr. Unsec. Conv. Notes, 1.00%, 03/01/2024(c) | | | 68,000 | | | | 67,363 | |
| | | | | | | | 374,220 | |
| | | | | | | | |
| | | Principal
Amount | | | Value | |
| Consumer Finance–0.06% | |
American Express Co., Unsec. Sub. Global Notes, 3.63%, 12/05/2024 | | $ | 18,000 | | | $ | 18,545 | |
Synchrony Financial, Sr. Unsec. Global Notes, 3.95%, 12/01/2027 | | | 10,000 | | | | 9,975 | |
| | | | | | | | 28,520 | |
|
| Data Processing & Outsourced Services–0.34% | |
Blackhawk Network Holdings, Inc., Sr. Unsec. Conv. Bonds, 1.50%, 01/15/2022 | | | 119,000 | | | | 121,454 | |
Visa Inc., Sr. Unsec. Global Notes, 4.15%, 12/14/2035 | | | 30,000 | | | | 33,348 | |
| | | | | | | | 154,802 | |
|
| Diversified Banks–1.35% | |
Bank of America Corp.,
Sr. Unsec. Medium-Term Global Notes, 3.50%, 04/19/2026 | | | 25,000 | | | | 25,581 | |
Sr. Unsec. Medium-Term Notes, 3.25%, 10/21/2027 | | | 10,000 | | | | 9,933 | |
Citigroup Inc.,
Sr. Unsec. Global Notes, 3.67%, 07/24/2028 | | | 15,000 | | | | 15,232 | |
Unsec. Sub. Notes,
4.00%, 08/05/2024 | | | 60,000 | | | | 62,650 | |
4.75%, 05/18/2046 | | | 15,000 | | | | 16,587 | |
Commonwealth Bank of Australia (Australia), Sr. Unsec. Notes, 2.25%, 03/10/2020(c) | | | 40,000 | | | | 39,887 | |
JPMorgan Chase & Co.,
Sr. Unsec. Global Notes, 3.20%, 06/15/2026 | | | 15,000 | | | | 15,004 | |
4.26%, 02/22/2048 | | | 10,000 | | | | 10,841 | |
Unsec. Sub. Global Notes, 4.25%, 10/01/2027 | | | 15,000 | | | | 15,970 | |
Series V, Jr. Unsec. Sub. Global Notes, 5.00%(e) | | | 150,000 | | | | 152,795 | |
U.S. Bancorp, Series W, Unsec. Sub. Medium-Term Notes, 3.10%, 04/27/2026 | | | 10,000 | | | | 9,938 | |
Wells Fargo & Co.,
Sr. Unsec. Medium-Term Notes, 3.55%, 09/29/2025 | | | 30,000 | | | | 30,818 | |
Unsec. Sub. Medium-Term Notes, 4.10%, 06/03/2026 | | | 95,000 | | | | 99,699 | |
4.65%, 11/04/2044 | | | 100,000 | | | | 109,212 | |
| | | | | | | | 614,147 | |
|
| Diversified Capital Markets–0.57% | |
Credit Suisse AG (Switzerland), Sr. Unsec. Conv. Medium-Term Notes, 0.50%, 06/24/2024(c) | | | 260,000 | | | | 257,842 | |
|
| Diversified Chemicals–0.10% | |
Eastman Chemical Co., Sr. Unsec. Global Notes, 2.70%, 01/15/2020 | | | 43,000 | | | | 43,296 | |
|
| Drug Retail–0.17% | |
CVS Health Corp., Sr. Unsec. Global Bonds, 3.38%, 08/12/2024 | | | 20,000 | | | | 20,132 | |
See accompanying Notes to Financial Statements which are an integral part of the financial statements.
Invesco V.I. Managed Volatility Fund
| | | | | | | | |
| | | Principal
Amount | | | Value | |
| Drug Retail–(continued) | |
Walgreens Boots Alliance Inc., Sr. Unsec. Global Notes,
3.30%, 11/18/2021 | | $ | 32,000 | | | $ | 32,559 | |
4.50%, 11/18/2034 | | | 24,000 | | | | 25,117 | |
| | | | | | | | 77,808 | |
|
| Electric Utilities–0.11% | |
Duke Energy Corp., Sr. Unsec. Global Notes, 2.10%, 06/15/2018 | | | 40,000 | | | | 40,015 | |
NextEra Energy Capital Holdings Inc., Sr. Unsec. Gtd. Deb., 3.55%, 05/01/2027 | | | 11,000 | | | | 11,223 | |
| | | | | | | | 51,238 | |
|
| Environmental & Facilities Services–0.06% | |
Waste Management, Inc., Sr. Unsec. Gtd. Global Notes, 3.90%, 03/01/2035 | | | 25,000 | | | | 26,272 | |
|
| Fertilizers & Agricultural Chemicals–0.03% | |
Monsanto Co., Sr. Unsec. Global Notes, 2.13%, 07/15/2019 | | | 15,000 | | | | 14,951 | |
|
| Food Retail–0.00% | |
Alimentation Couche-Tard Inc. (Canada), Sr. Unsec. Gtd. Notes, 4.50%, 07/26/2047(c) | | | 2,000 | | | | 2,088 | |
|
| Gas Utilities–0.02% | |
NiSource Finance Corp., Sr. Unsec. Gtd. Global Notes, 4.38%, 05/15/2047 | | | 9,000 | | | | 9,897 | |
|
| General Merchandise Stores–0.04% | |
Dollar General Corp., Sr. Unsec. Global Notes, 3.25%, 04/15/2023 | | | 20,000 | | | | 20,290 | |
|
| Health Care Equipment–1.36% | |
Becton, Dickinson and Co.,
Sr. Unsec. Global Notes, 4.88%, 05/15/2044 | | | 170,000 | | | | 182,211 | |
Sr. Unsec. Notes,
2.68%, 12/15/2019 | | | 15,000 | | | | 15,060 | |
DexCom, Inc., Sr. Unsec. Conv. Notes, 0.75%, 05/15/2022(c) | | | 88,000 | | | | 83,105 | |
Insulet Corp., Sr. Unsec. Conv. Notes, 1.38%, 11/15/2024(c) | | | 13,000 | | | | 13,203 | |
Medtronic, Inc., Sr. Unsec. Gtd. Global Notes,
3.15%, 03/15/2022 | | | 58,000 | | | | 59,434 | |
4.38%, 03/15/2035 | | | 20,000 | | | | 22,573 | |
NuVasive, Inc., Sr. Unsec. Conv. Bonds, 2.25%, 03/15/2021 | | | 80,000 | | | | 94,200 | |
Wright Medical Group N.V., Sr. Unsec. Conv. Bonds, 2.25%, 11/15/2021 | | | 39,000 | | | | 47,677 | |
Wright Medical Group, Inc., Sr. Unsec. Gtd. Conv. Bonds, 2.00%, 02/15/2020 | | | 99,000 | | | | 102,032 | |
| | | | | | | | 619,495 | |
|
| Health Care REIT’s–0.06% | |
HCP, Inc., Sr. Unsec. Global Notes, 3.88%, 08/15/2024 | | | 25,000 | | | | 25,619 | |
| | | | | | | | |
| | | Principal
Amount | | | Value | |
| Health Care Services–0.19% | |
Express Scripts Holding Co., Sr. Unsec. Gtd. Global Notes, 2.25%, 06/15/2019 | | $ | 30,000 | | | $ | 29,959 | |
Laboratory Corp. of America Holdings, Sr. Unsec. Notes,
3.20%, 02/01/2022 | | | 33,000 | | | | 33,673 | |
4.70%, 02/01/2045 | | | 22,000 | | | | 23,871 | |
| | | | | | | | 87,503 | |
|
| Home Improvement Retail–0.06% | |
Home Depot, Inc. (The), Sr. Unsec. Global Notes, 2.00%, 04/01/2021 | | | 27,000 | | | | 26,744 | |
|
| Hotel and Resort REIT’s–0.02% | |
Hospitality Properties Trust, Sr. Unsec. Notes, 4.50%, 06/15/2023 | | | 10,000 | | | | 10,466 | |
|
| Insurance Brokers–0.01% | |
Willis North America, Inc., Sr. Unsec. Gtd. Global Notes, 3.60%, 05/15/2024 | | | 5,000 | | | | 5,089 | |
|
| Integrated Oil & Gas–0.33% | |
Chevron Corp., Sr. Unsec. Global Notes, 1.37%, 03/02/2018 | | | 77,000 | | | | 76,950 | |
Occidental Petroleum Corp., Sr. Unsec. Global Notes, 3.40%, 04/15/2026 | | | 15,000 | | | | 15,374 | |
Shell International Finance B.V. (Netherlands), Sr. Unsec. Gtd. Global Notes, 4.00%, 05/10/2046 | | | 37,000 | | | | 39,471 | |
Suncor Energy Inc. (Canada), Sr. Unsec. Notes, 3.60%, 12/01/2024 | | | 18,000 | | | | 18,419 | |
| | | | | | | | 150,214 | |
|
| Integrated Telecommunication Services–1.44% | |
AT&T Inc., Sr. Unsec. Global Notes, 3.00%, 06/30/2022 | | | 28,000 | | | | 28,075 | |
3.40%, 05/15/2025 | | | 15,000 | | | | 14,768 | |
4.50%, 05/15/2035 | | | 25,000 | | | | 24,909 | |
4.90%, 08/14/2037 | | | 69,000 | | | | 70,181 | |
5.15%, 03/15/2042 | | | 150,000 | | | | 156,058 | |
4.80%, 06/15/2044 | | | 40,000 | | | | 39,678 | |
Telefónica Emisiones, S.A.U. (Spain), Sr. Unsec. Gtd. Global Notes, 7.05%, 06/20/2036 | | | 150,000 | | | | 201,692 | |
Verizon Communications Inc., Sr. Unsec. Global Notes, 4.40%, 11/01/2034 | | | 120,000 | | | | 122,561 | |
| | | | | | | | 657,922 | |
|
| Internet & Direct Marketing Retail–0.50% | |
Amazon.com, Inc., Sr. Unsec. Global Notes, 4.80%, 12/05/2034 | | | 9,000 | | | | 10,588 | |
Ctrip.com International, Ltd. (China), Sr. Unsec. Conv. Bonds, 1.25%, 09/15/2019(d) | | | 113,000 | | | | 115,684 | |
Liberty Expedia Holdings, Inc., Sr. Unsec. Conv. Deb., 1.00%, 07/05/2022(c)(d) | | | 53,000 | | | | 53,132 | |
QVC, Inc., Sr. Sec. Gtd. First Lien Global Notes, 5.45%, 08/15/2034 | | | 50,000 | | | | 50,334 | |
| | | | | | | | 229,738 | |
See accompanying Notes to Financial Statements which are an integral part of the financial statements.
Invesco V.I. Managed Volatility Fund
| | | | | | | | |
| | | Principal
Amount | | | Value | |
| Internet Software & Services–0.14% | |
eBay Inc., Sr. Unsec. Global Notes, 2.50%, 03/09/2018 | | $ | 65,000 | | | $ | 65,064 | |
|
| Investment Banking & Brokerage–1.00% | |
Goldman Sachs Group, Inc. (The),
Sr. Unsec. Global Notes, 4.02%, 10/31/2038 | | | 10,000 | | | | 10,297 | |
Unsec. Sub. Notes,
4.25%, 10/21/2025 | | | 27,000 | | | | 28,240 | |
GS Finance Corp., Series 0001, Sr. Unsec. Conv. Medium-Term Notes, 0.25%, 07/08/2024 | | | 198,000 | | | | 204,603 | |
Morgan Stanley, Sr. Unsec. Medium-Term Global Notes,
2.38%, 07/23/2019 | | | 175,000 | | | | 175,246 | |
4.00%, 07/23/2025 | | | 35,000 | | | | 36,674 | |
| | | | | | | | 455,060 | |
|
| Life & Health Insurance–0.58% | |
Athene Global Funding, Sec. Notes, 2.88%, 10/23/2018(c) | | | 31,000 | | | | 31,167 | |
4.00%, 01/25/2022(c) | | | 45,000 | | | | 46,456 | |
Jackson National Life Global Funding, Sr. Sec. Notes,
2.10%, 10/25/2021(c) | | | 10,000 | | | | 9,816 | |
3.25%, 01/30/2024(c) | | | 15,000 | | | | 15,159 | |
Nationwide Financial Services Inc., Sr. Unsec. Notes, 5.30%, 11/18/2044(c) | | | 50,000 | | | | 59,491 | |
Prudential Financial, Inc., Jr. Unsec. Sub. Global Notes, 8.88%, 06/15/2068 | | | 60,000 | | | | 61,785 | |
Reliance Standard Life Global Funding II, Sr. Sec. First Lien Notes, 3.05%, 01/20/2021(c) | | | 20,000 | | | | 20,279 | |
Teachers Insurance and Annuity Association of America, Unsec. Sub. Notes, 4.27%, 05/15/2047(c) | | | 17,000 | | | | 18,007 | |
| | | | | | | | 262,160 | |
|
| Movies & Entertainment–0.17% | |
Live Nation Entertainment, Inc., Sr. Unsec. Conv. Bonds, 2.50%, 05/15/2019 | | | 61,000 | | | | 79,033 | |
|
| Multi-Line Insurance–0.18% | |
American Financial Group, Inc., Sr. Unsec. Notes, 4.50%, 06/15/2047 | | | 20,000 | | | | 20,863 | |
American International Group, Inc., Sr. Unsec. Global Notes, 2.30%, 07/16/2019 | | | 20,000 | | | | 19,990 | |
4.38%, 01/15/2055 | | | 40,000 | | | | 40,887 | |
| | | | | | | | 81,740 | |
|
| Office REIT’s–0.39% | |
Government Properties Income Trust, Sr. Unsec. Global Notes, 4.00%, 07/15/2022 | | | 25,000 | | | | 25,173 | |
Highwoods Realty L.P., Sr. Unsec. Notes, 3.20%, 06/15/2021 | | | 150,000 | | | | 151,381 | |
| | | | | | | | 176,554 | |
| | | | | | | | |
| | | Principal
Amount | | | Value | |
| Oil & Gas Drilling–0.21% | |
Ensco Jersey Finance Ltd., Sr. Unsec. Gtd. Conv. Bonds, 3.00%, 01/31/2024 | | $ | 73,000 | | | $ | 65,153 | |
Nabors Industries Inc., Sr. Unsec. Gtd. Conv. Notes, 0.75%, 01/15/2024(c) | | | 40,000 | | | | 30,750 | |
| | | | | | | | 95,903 | |
|
| Oil & Gas Equipment & Services–0.36% | |
Helix Energy Solutions Group, Inc., Sr. Unsec. Conv. Notes, 4.25%, 05/01/2022 | | | 40,000 | | | | 39,950 | |
Weatherford International Ltd., Sr. Unsec. Gtd. Conv. Notes, 5.88%, 07/01/2021 | | | 114,000 | | | | 123,832 | |
| | | | | | | | 163,782 | |
|
| Oil & Gas Exploration & Production–0.43% | |
Anadarko Petroleum Corp., Sr. Unsec. Notes, 6.60%, 03/15/2046 | | | 18,000 | | | | 23,218 | |
Chesapeake Energy Corp., Sr. Unsec. Gtd. Conv. Notes, 5.50%, 09/15/2026(c) | | | 37,000 | | | | 33,878 | |
Concho Resources Inc.,
Sr. Unsec. Gtd. Global Notes, 3.75%, 10/01/2027 | | | 17,000 | | | | 17,231 | |
4.88%, 10/01/2047 | | | 19,000 | | | | 20,844 | |
ConocoPhillips Co., Sr. Unsec. Gtd. Global Notes,
2.88%, 11/15/2021 | | | 46,000 | | | | 46,570 | |
4.15%, 11/15/2034 | | | 49,000 | | | | 52,186 | |
| | | | | | | | 193,927 | |
|
| Oil & Gas Storage & Transportation–0.83% | |
Enable Midstream Partners, LP, Sr. Unsec. Global Notes, 2.40%, 05/15/2019 | | | 200,000 | | | | 198,902 | |
Enbridge Inc. (Canada), Sr. Unsec. Global Notes, 5.50%, 12/01/2046 | | | 16,000 | | | | 19,298 | |
Energy Transfer, LP, Sr. Unsec. Notes, 4.90%, 03/15/2035 | | | 19,000 | | | | 18,837 | |
Enterprise Products Operating LLC, Sr. Unsec. Gtd. Notes, 2.55%, 10/15/2019 | | | 20,000 | | | | 20,069 | |
Kinder Morgan Inc., Sr. Unsec. Gtd. Notes, 5.30%, 12/01/2034 | | | 23,000 | | | | 24,588 | |
MPLX LP,
Sr. Unsec. Global Bonds, 4.50%, 07/15/2023 | | | 65,000 | | | | 68,745 | |
Sr. Unsec. Global Notes, 5.50%, 02/15/2023 | | | 25,000 | | | | 25,758 | |
| | | | | | | | 376,197 | |
|
| Other Diversified Financial Services–0.11% | |
ERAC USA Finance LLC, Sr. Unsec. Gtd. Notes, 2.35%, 10/15/2019(c) | | | 50,000 | | | | 49,873 | |
|
| Packaged Foods & Meats–0.11% | |
General Mills, Inc., Sr. Unsec. Global Notes, 2.20%, 10/21/2019 | | | 45,000 | | | | 45,003 | |
Mead Johnson Nutrition Co. (United Kingdom), Sr. Unsec. Gtd. Global Notes, 4.13%, 11/15/2025 | | | 3,000 | | | | 3,184 | |
| | | | | | | | 48,187 | |
See accompanying Notes to Financial Statements which are an integral part of the financial statements.
Invesco V.I. Managed Volatility Fund
| | | | | | | | |
| | | Principal
Amount | | | Value | |
| Pharmaceuticals–1.14% | |
Allergan Funding SCS, Sr. Unsec. Gtd. Global Notes, 4.85%, 06/15/2044 | | $ | 150,000 | | | $ | 161,035 | |
Bayer US Finance LLC (Germany), Sr. Unsec. Gtd. Notes, 3.00%, 10/08/2021(c) | | | 200,000 | | | | 202,139 | |
Jazz Investments I Ltd., Sr. Unsec. Gtd. Conv. Bonds, 1.88%, 08/15/2021 | | | 76,000 | | | | 76,427 | |
Medicines Co. (The), Sr. Unsec. Conv. Bonds, 2.75%, 07/15/2023 | | | 37,000 | | | | 34,017 | |
Mylan N.V., Sr. Unsec. Gtd. Global Notes, 3.15%, 06/15/2021 | | | 17,000 | | | | 17,107 | |
Pacira Pharmaceuticals, Inc., Sr. Unsec. Conv. Notes, 2.38%, 04/01/2022(c) | | | 26,000 | | | | 27,300 | |
| | | | | | | | 518,025 | |
|
| Property & Casualty Insurance–0.48% | |
Allstate Corp. (The), Sr. Unsec. Bonds, 3.28%, 12/15/2026 | | | 10,000 | | | | 10,167 | |
Liberty Mutual Group Inc., Sr. Unsec. Gtd. Bonds, 4.85%, 08/01/2044(c) | | | 115,000 | | | | 128,195 | |
Old Republic International Corp., Sr. Unsec. Conv. Notes, 3.75%, 03/15/2018 | | | 59,000 | | | | 82,084 | |
| | | | | | | | 220,446 | |
|
| Railroads–0.06% | |
Union Pacific Corp., Sr. Unsec. Notes, 4.15%, 01/15/2045 | | | 25,000 | | | | 27,070 | |
|
| Regional Banks–0.03% | |
Citizens Financial Group, Inc., Sr. Unsec. Global Notes, 2.38%, 07/28/2021 | | | 15,000 | | | | 14,815 | |
|
| Renewable Electricity–0.35% | |
Oglethorpe Power Corp., Sr. Sec. First Mortgage Bonds, 4.55%, 06/01/2044 | | | 150,000 | | | | 157,726 | |
|
| Retail REIT’s–0.33% | |
Realty Income Corp., Sr. Unsec. Notes, 2.00%, 01/31/2018 | | | 150,000 | | | | 149,989 | |
|
| Semiconductors–0.89% | |
Broadcom Corp./Broadcom Cayman Finance Ltd., Sr. Unsec. Gtd. Notes, 3.63%, 01/15/2024(c) | | | 50,000 | | | | 49,776 | |
Microchip Technology Inc., Sr. Unsec. Sub. Conv. Notes, 1.63%, 02/15/2027(c) | | | 74,000 | | | | 87,089 | |
Micron Technology, Inc., Series G, Sr. Unsec. Conv. Global Bonds, 3.00%, 11/15/2028(d) | | | 98,000 | | | | 141,794 | |
ON Semiconductor Corp., Sr. Unsec. Gtd. Conv. Bonds, 1.00%, 12/01/2020 | | | 76,000 | | | | 97,375 | |
Silicon Laboratories Inc., Sr. Unsec. Conv. Notes, 1.38%, 03/01/2022(c) | | | 21,000 | | | | 24,268 | |
Texas Instruments Inc., Sr. Unsec. Notes, 2.63%, 05/15/2024 | | | 5,000 | | | | 4,963 | |
| | | | | | | | 405,265 | |
|
| Specialized Finance–0.40% | |
Air Lease Corp., Sr. Unsec. Global Notes, 2.63%, 09/04/2018 | | | 45,000 | | | | 45,140 | |
3.00%, 09/15/2023 | | | 24,000 | | | | 23,841 | |
4.25%, 09/15/2024 | | | 35,000 | | | | 36,772 | |
| | | | | | | | |
| | | Principal
Amount | | | Value | |
| Specialized Finance–(continued) | |
Aviation Capital Group LLC, Sr. Unsec. Notes, 2.88%, 09/17/2018(c) | | $ | 35,000 | | | $ | 35,123 | |
4.88%, 10/01/2025(c) | | | 40,000 | | | | 43,515 | |
| | | | | | | | 184,391 | |
|
| Specialized REIT’s–0.58% | |
Crown Castle Towers LLC, Sr. Sec. Gtd. First Lien Notes, 4.88%, 08/15/2020(c) | | | 178,000 | | | | 186,255 | |
EPR Properties, Sr. Unsec. Gtd. Global Notes, 4.75%, 12/15/2026 | | | 75,000 | | | | 77,101 | |
| | | | | | | | 263,356 | |
|
| Specialty Chemicals–0.01% | |
Sherwin-Williams Co. (The), Sr. Unsec. Global Notes, 4.50%, 06/01/2047 | | | 3,000 | | | | 3,291 | |
|
| Systems Software–0.40% | |
FireEye, Inc.,
Series A, Sr. Unsec. Conv. Bonds, 1.00%, 06/01/2020(d) | | | 51,000 | | | | 47,876 | |
Series B, Sr. Unsec. Conv. Bonds, 1.63%, 06/01/2022(d) | | | 51,000 | | | | 46,856 | |
Microsoft Corp., Sr. Unsec. Global Notes, 3.50%, 02/12/2035 | | | 37,000 | | | | 38,543 | |
Oracle Corp., Sr. Unsec. Global Notes, 1.90%, 09/15/2021 | | | 50,000 | | | | 49,232 | |
| | | | | | | | 182,507 | |
|
| Technology Distributors–0.07% | |
Avnet, Inc., Sr. Unsec. Global Notes, 4.63%, 04/15/2026 | | | 30,000 | | | | 30,985 | |
|
| Technology Hardware, Storage & Peripherals–0.49% | |
Apple Inc., Sr. Unsec. Global Notes, 2.15%, 02/09/2022 | | | 39,000 | | | | 38,511 | |
3.35%, 02/09/2027 | | | 10,000 | | | | 10,252 | |
Dell International LLC/EMC Corp., Sr. Sec. Gtd. First Lien Notes, 5.45%, 06/15/2023(c) | | | 26,000 | | | | 28,125 | |
SanDisk Corp., Sr. Unsec. Gtd. Conv. Bonds, 0.50%, 10/15/2020 | | | 140,000 | | | | 132,156 | |
Seagate HDD Cayman, Sr. Unsec. Gtd. Global Bonds, 5.75%, 12/01/2034 | | | 16,000 | | | | 15,404 | |
| | | | | | | | 224,448 | |
Total Bonds & Notes
(Cost $10,106,707) | | | | 10,581,406 | |
|
U.S. Treasury Securities–7.36% | |
| U.S. Treasury Notes–6.93% | |
1.25%, 01/31/2019 | | | 710,000 | | | | 705,609 | |
1.75%, 11/30/2019 | | | 2,128,000 | | | | 2,122,633 | |
1.88%, 12/15/2020 | | | 235,000 | | | | 234,325 | |
2.00%, 11/30/2022 | | | 39,200 | | | | 38,842 | |
2.13%, 11/30/2024 | | | 55,000 | | | | 54,272 | |
2.25%, 11/15/2027 | | | 100 | | | | 99 | |
| | | | | | | | 3,155,780 | |
See accompanying Notes to Financial Statements which are an integral part of the financial statements.
Invesco V.I. Managed Volatility Fund
| | | | | | | | |
| | | Principal
Amount | | | Value | |
| U.S. Treasury Bonds–0.43% | |
4.50%, 02/15/2036 | | $ | 75,000 | | | $ | 96,511 | |
2.75%, 08/15/2047 | | | 99,600 | | | | 99,634 | |
| | | | | | | | 196,145 | |
Total U.S. Treasury Securities
(Cost $3,353,182) | | | | 3,351,925 | |
| | |
| | | Shares | | | | |
Preferred Stocks–0.24% | |
| Asset Management & Custody Banks–0.24% | |
AMG Capital Trust II, $2.58 Conv. Pfd. (Cost $106,269) | | | 1,700 | | | | 107,844 | |
|
Money Market Funds–6.08% | |
Invesco Government & Agency Portfolio– Institutional Class, 1.18%(f) | | | 969,668 | | | | 969,668 | |
| | | | | | | | |
| | | Shares | | | Value | |
Invesco Liquid Assets Portfolio–Institutional Class, 1.40%(f) | | | 692,532 | | | $ | 692,601 | |
Invesco Treasury Portfolio–Institutional Class, 1.17%(f) | | | 1,108,192 | | | | 1,108,192 | |
Total Money Market Funds
(Cost $2,770,475) | | | | | | | 2,770,461 | |
TOTAL INVESTMENTS IN SECURITIES–99.55% (Cost $38,391,025) | | | | 45,344,209 | |
OTHER ASSETS LESS LIABILITIES–0.45% | | | | 205,949 | |
NET ASSETS–100.00% | | | $ | 45,550,158 | |
Investment Abbreviations:
| | |
| ADR | | – American Depositary Receipt |
| Conv. | | – Convertible |
| Ctfs. | | – Certificates |
| Deb. | | – Debentures |
| | |
| Gtd. | | – Guaranteed |
| Jr. | | – Junior |
| Pfd. | | – Preferred |
| REIT | | – Real Estate Investment Trust |
| | |
| Sec. | | – Secured |
| Sr. | | – Senior |
| Sub. | | – Subordinated |
| Unsec. | | – Unsecured |
Notes to Schedule of Investments:
| (a) | Industry and/or sector classifications used in this report are generally according to the Global Industry Classification Standard, which was developed by and is the exclusive property and a service mark of MSCI Inc. and Standard & Poor’s. |
| (b) | Non-income producing security. |
| (c) | Security purchased or received in a transaction exempt from registration under the Securities Act of 1933, as amended (the “1933 Act”). The security may be resold pursuant to an exemption from registration under the 1933 Act, typically to qualified institutional buyers. The aggregate value of these securities at December 31, 2017 was $2,317,038, which represented 5.09% of the Fund’s Net Assets. |
| (d) | Security has an irrevocable call by the issuer or mandatory put by the holder. Maturity date reflects such call or put. |
| (e) | Perpetual bond with no specified maturity date. |
| (f) | The money market fund and the Fund are affiliated by having the same investment adviser. The rate shown is the 7-day SEC standardized yield as of December 31, 2017. |
| | | | | | | | | | | | | | | | | | | | | | |
| Open Forward Foreign Currency Contracts | |
Settlement
Date | | Counterparty | | Contract to | | | Unrealized
Appreciation
(Depreciation) | |
| | | Deliver | | | Receive | | |
01/19/2018 | | State Street Bank and Trust Co. | | | USD | | | | 3,517 | | | | AUD | | | | 4,586 | | | $ | 61 | |
01/19/2018 | | State Street Bank and Trust Co. | | | USD | | | | 7,278 | | | | CAD | | | | 9,357 | | | | 169 | |
01/19/2018 | | State Street Bank and Trust Co. | | | USD | | | | 5,593 | | | | CHF | | | | 5,490 | | | | 50 | |
01/19/2018 | | State Street Bank and Trust Co. | | | USD | | | | 10,642 | | | | EUR | | | | 8,972 | | | | 137 | |
01/19/2018 | | State Street Bank and Trust Co. | | | USD | | | | 10,324 | | | | GBP | | | | 7,692 | | | | 69 | |
Subtotal — Appreciation | | | | | | | | | | | | | | | | | | | 486 | |
01/19/2018 | | Bank of New York Mellon (The) | | | AUD | | | | 108,499 | | | | USD | | | | 81,971 | | | | (2,685 | ) |
01/19/2018 | | Bank of New York Mellon (The) | | | CAD | | | | 232,001 | | | | USD | | | | 180,265 | | | | (4,378 | ) |
01/19/2018 | | Bank of New York Mellon (The) | | | CHF | | | | 132,251 | | | | USD | | | | 133,654 | | | | (2,298 | ) |
01/19/2018 | | Bank of New York Mellon (The) | | | EUR | | | | 217,300 | | | | USD | | | | 255,828 | | | | (5,236 | ) |
01/19/2018 | | Bank of New York Mellon (The) | | | GBP | | | | 354,761 | | | | USD | | | | 473,937 | | | | (5,381 | ) |
01/19/2018 | | State Street Bank and Trust Co. | | | AUD | | | | 108,499 | | | | USD | | | | 82,002 | | | | (2,654 | ) |
01/19/2018 | | State Street Bank and Trust Co. | | | CAD | | | | 232,016 | | | | USD | | | | 180,321 | | | | (4,333 | ) |
01/19/2018 | | State Street Bank and Trust Co. | | | CHF | | | | 132,250 | | | | USD | | | | 133,653 | | | | (2,299 | ) |
01/19/2018 | | State Street Bank and Trust Co. | | | EUR | | | | 217,300 | | | | USD | | | | 255,961 | | | | (5,103 | ) |
01/19/2018 | | State Street Bank and Trust Co. | | | GBP | | | | 354,763 | | | | USD | | | | 473,971 | | | | (5,351 | ) |
Subtotal — Depreciation | | | | | | | | | | | | | | | | | | | (39,718 | ) |
Total Forward Foreign Currency Contracts — Currency Risk | | | | | | | | | | | | | | | | | | $ | (39,232 | ) |
Abbreviations:
| | |
| AUD | | – Australian Dollar |
| CAD | | – Canadian Dollar |
| | |
| CHF | | – Swiss Franc |
| EUR | | – Euro |
| | |
| GBP | | – British Pound Sterling |
| USD | | – U.S. Dollar |
See accompanying Notes to Financial Statements which are an integral part of the financial statements.
Invesco V.I. Managed Volatility Fund
Statement of Assets and Liabilities
December 31, 2017
Statement of Operations
For the year ended December 31, 2017
| | | | |
Assets: | | | | |
Investments in securities, at value (Cost $35,620,550) | | $ | 42,573,748 | |
Investments in affiliated money market funds, at value (Cost $2,770,475) | | | 2,770,461 | |
Other investments: | | | | |
Unrealized appreciation on forward foreign currency contracts outstanding | | | 486 | |
Foreign currencies, at value (Cost $19,783) | | | 20,100 | |
Receivable for: | | | | |
Investments sold | | | 162,109 | |
Fund shares sold | | | 29,241 | |
Dividends and interest | | | 133,673 | |
Investment for trustee deferred compensation and retirement plans | | | 71,518 | |
Other assets | | | 1,855 | |
Total assets | | | 45,763,191 | |
| |
Liabilities: | | | | |
Other investments: | | | | |
Unrealized depreciation on forward foreign currency contracts outstanding | | | 39,718 | |
Payable for: | | | | |
Fund shares reacquired | | | 37,543 | |
Accrued fees to affiliates | | | 18,690 | |
Accrued trustees’ and officers’ fees and benefits | | | 620 | |
Accrued other operating expenses | | | 40,508 | |
Trustee deferred compensation and retirement plans | | | 75,954 | |
Total liabilities | | | 213,033 | |
Net assets applicable to shares outstanding | | $ | 45,550,158 | |
| |
Net assets consist of: | | | | |
Shares of beneficial interest | | $ | 36,920,465 | |
Undistributed net investment income | | | 579,917 | |
Undistributed net realized gain | | | 1,135,244 | |
Net unrealized appreciation | | | 6,914,532 | |
| | | $ | 45,550,158 | |
| |
Net Assets: | | | | |
Series I | | $ | 44,104,166 | |
Series II | | $ | 1,445,992 | |
|
Shares outstanding, no par value,
with an unlimited number of shares authorized: | |
Series I | | | 3,376,662 | |
Series II | | | 111,941 | |
Series I: | | | | |
Net asset value per share | | $ | 13.06 | |
Series II: | | | | |
Net asset value per share | | $ | 12.92 | |
| | | | |
Investment income: | | | | |
Dividends (net of foreign withholding taxes of $18,715) | | $ | 865,339 | |
Dividends from affiliated money market funds | | | 16,270 | |
Interest | | | 380,221 | |
Total investment income | | | 1,261,830 | |
| |
Expenses: | | | | |
Advisory fees | | | 296,522 | |
Administrative services fees | | | 123,515 | |
Custodian fees | | | 19,834 | |
Distribution fees — Series II | | | 3,685 | |
Transfer agent fees | | | 18,803 | |
Trustees’ and officers’ fees and benefits | | | 21,381 | |
Reports to shareholders | | | 16,237 | |
Professional services fees | | | 53,326 | |
Other | | | 8,214 | |
Total expenses | | | 561,517 | |
Less: Fees waived | | | (2,447 | ) |
Net expenses | | | 559,070 | |
Net investment income | | | 702,760 | |
| |
Realized and unrealized gain (loss) from: | | | | |
Net realized gain (loss) from: | | | | |
Investment securities | | | 2,757,707 | |
Foreign currencies | | | 1,785 | |
Forward foreign currency contracts | | | (94,515 | ) |
Futures contracts | | | (25,150 | ) |
| | | | 2,639,827 | |
Change in net unrealized appreciation (depreciation) of: | | | | |
Investment securities | | | 1,644,945 | |
Foreign currencies | | | 730 | |
Forward foreign currency contracts | | | (92,727 | ) |
| | | | 1,552,948 | |
Net realized and unrealized gain | | | 4,192,775 | |
Net increase in net assets resulting from operations | | $ | 4,895,535 | |
See accompanying Notes to Financial Statements which are an integral part of the financial statements.
Invesco V.I. Managed Volatility Fund
Statement of Changes in Net Assets
For the years ended December 31, 2017 and 2016
| | | | | | | | |
| | | 2017 | | | 2016 | |
Operations: | | | | | | | | |
Net investment income | | $ | 702,760 | | | $ | 625,840 | |
Net realized gain (loss) | | | 2,639,827 | | | | (1,186,418 | ) |
Change in net unrealized appreciation | | | 1,552,948 | | | | 5,466,222 | |
Net increase in net assets resulting from operations | | | 4,895,535 | | | | 4,905,644 | |
| | |
Distributions to shareholders from net investment income: | | | | | | | | |
Series I | | | (610,486 | ) | | | (906,262 | ) |
Series ll | | | (16,351 | ) | | | (22,509 | ) |
Total distributions from net investment income | | | (626,837 | ) | | | (928,771 | ) |
| | |
Distributions to shareholders from net realized gains: | | | | | | | | |
Series l | | | — | | | | (1,460,269 | ) |
Series ll | | | — | | | | (42,846 | ) |
Total distributions from net realized gains | | | — | | | | (1,503,115 | ) |
| | |
Share transactions–net: | | | | | | | | |
Series l | | | (10,218,192 | ) | | | (4,579,259 | ) |
Series ll | | | (145,427 | ) | | | (110,167 | ) |
Net increase (decrease) in net assets resulting from share transactions | | | (10,363,619 | ) | | | (4,689,426 | ) |
Net increase (decrease) in net assets | | | (6,094,921 | ) | | | (2,215,668 | ) |
| | |
Net assets: | | | | | | | | |
Beginning of year | | | 51,645,079 | | | | 53,860,747 | |
End of year (includes undistributed net investment income of $579,917 and $420,045, respectively) | | $ | 45,550,158 | | | $ | 51,645,079 | |
Notes to Financial Statements
December 31, 2017
NOTE 1—Significant Accounting Policies
Invesco V.I. Managed Volatility Fund (the “Fund”) is a series portfolio of AIM Variable Insurance Funds (Invesco Variable Insurance Funds) (the “Trust”). The Trust is a Delaware statutory trust registered under the Investment Company Act of 1940, as amended (the “1940 Act”), as an open-end series management investment company consisting of twenty-four separate portfolios, (each constituting a “Fund”). The assets, liabilities and operations of each portfolio are accounted for separately. Information presented in these financial statements pertains only to the Fund. Matters affecting each Fund or class will be voted on exclusively by the shareholders of such Fund or class. Current Securities and Exchange Commission (“SEC”) guidance, however, requires participating insurance companies offering separate accounts to vote shares proportionally in accordance with the instructions of the contract owners whose investments are funded by shares of each Fund or class.
The Fund’s investment objective is both capital appreciation and current income while managing portfolio volatility.
The Fund currently offers two classes of shares, Series I and Series II, both of which are offered to insurance company separate accounts funding variable annuity contracts and variable life insurance policies (“variable products”).
The Fund is an investment company and accordingly follows the investment company accounting and reporting guidance in accordance with Financial Accounting Standards Board Accounting Standards Codification Topic 946, Financial Services — Investment Companies.
The following is a summary of the significant accounting policies followed by the Fund in the preparation of its financial statements.
| A. | Security Valuations — Securities, including restricted securities, are valued according to the following policy. |
A security listed or traded on an exchange (except convertible securities) is valued at its last sales price or official closing price as of the close of the customary trading session on the exchange where the security is principally traded, or lacking any sales or official closing price on a particular day, the security may be valued at the closing bid price on that day. Securities traded in the over-the-counter market are valued based on prices furnished by independent pricing services or market makers. When such securities are valued by an independent pricing service they may be considered fair valued. Futures contracts are valued at the final settlement price set by an exchange on which they are principally traded. Listed options are valued at the mean between the last bid and asked prices from the exchange on which they are principally traded. Options not listed on an exchange are valued by an independent source at the mean between the last bid and asked prices. For purposes of determining net asset value (“NAV”) per share, futures and option contracts generally are valued 15 minutes after the close of the customary trading session of the New York Stock Exchange (“NYSE”).
Investments in open-end and closed-end registered investment companies that do not trade on an exchange are valued at the end-of-day net asset value per share. Investments in open-end and closed-end registered investment companies that trade on an exchange are valued at the last sales price or official closing price as of the close of the customary trading session on the exchange where the security is principally traded.
Invesco V.I. Managed Volatility Fund
Debt obligations (including convertible securities) and unlisted equities are fair valued using an evaluated quote provided by an independent pricing service. Evaluated quotes provided by the pricing service may be determined without exclusive reliance on quoted prices, and may reflect appropriate factors such as institution-size trading in similar groups of securities, developments related to specific securities, dividend rate (for unlisted equities), yield (for debt obligations), quality, type of issue, coupon rate (for debt obligations), maturity (for debt obligations), individual trading characteristics and other market data. Pricing services generally value debt obligations assuming orderly transactions of institutional round lot size, but a fund may hold or transact in the same securities in smaller, odd lot sizes. Odd lots often trade at lower prices than institutional round lots. Debt obligations are subject to interest rate and credit risks. In addition, all debt obligations involve some risk of default with respect to interest and/or principal payments.
Foreign securities’ (including foreign exchange contracts) prices are converted into U.S. dollar amounts using the applicable exchange rates as of the close of the NYSE. If market quotations are available and reliable for foreign exchange-traded equity securities, the securities will be valued at the market quotations. Because trading hours for certain foreign securities end before the close of the NYSE, closing market quotations may become unreliable. If between the time trading ends on a particular security and the close of the customary trading session on the NYSE, events occur that the investment adviser determines are significant and make the closing price unreliable, the Fund may fair value the security. If the event is likely to have affected the closing price of the security, the security will be valued at fair value in good faith using procedures approved by the Board of Trustees. Adjustments to closing prices to reflect fair value may also be based on a screening process of an independent pricing service to indicate the degree of certainty, based on historical data, that the closing price in the principal market where a foreign security trades is not the current value as of the close of the NYSE. Foreign securities’ prices meeting the approved degree of certainty that the price is not reflective of current value will be priced at the indication of fair value from the independent pricing service. Multiple factors may be considered by the independent pricing service in determining adjustments to reflect fair value and may include information relating to sector indices, American Depositary Receipts and domestic and foreign index futures. Foreign securities may have additional risks including exchange rate changes, potential for sharply devalued currencies and high inflation, political and economic upheaval, the relative lack of issuer information, relatively low market liquidity and the potential lack of strict financial and accounting controls and standards.
Securities for which market prices are not provided by any of the above methods may be valued based upon quotes furnished by independent sources. The last bid price may be used to value equity securities. The mean between the last bid and asked prices is used to value debt obligations, including corporate loans.
Securities for which market quotations are not readily available or became unreliable are valued at fair value as determined in good faith by or under the supervision of the Trust’s officers following procedures approved by the Board of Trustees. Issuer specific events, market trends, bid/asked quotes of brokers and information providers and other market data may be reviewed in the course of making a good faith determination of a security’s fair value.
The Fund may invest in securities that are subject to interest rate risk, meaning the risk that the prices will generally fall as interest rates rise and, conversely, the prices will generally rise as interest rates fall. Specific securities differ in their sensitivity to changes in interest rates depending on their individual characteristics. Changes in interest rates may result in increased market volatility, which may affect the value and/or liquidity of certain Fund investments.
Valuations change in response to many factors including the historical and prospective earnings of the issuer, the value of the issuer’s assets, general economic conditions, interest rates, investor perceptions and market liquidity. Because of the inherent uncertainties of valuation, the values reflected in the financial statements may materially differ from the value received upon actual sale of those investments.
| B. | Securities Transactions and Investment Income — Securities transactions are accounted for on a trade date basis. Realized gains or losses on sales are computed on the basis of specific identification of the securities sold. Interest income (net of withholding tax, if any) is recorded on the accrual basis from settlement date. Bond premiums and discounts are amortized and/or accreted over the lives of the respective securities. Pay-in-kind interest income and non-cash dividend income received in the form of securities in-lieu of cash are recorded at the fair value of the securities received. Dividend income (net of withholding tax, if any) is recorded on the ex-dividend date. |
The Fund may periodically participate in litigation related to Fund investments. As such, the Fund may receive proceeds from litigation settlements. Any proceeds received are included in the Statement of Operations as realized gain (loss) for investments no longer held and as unrealized gain (loss) for investments still held.
Brokerage commissions and mark ups are considered transaction costs and are recorded as an increase to the cost basis of securities purchased and/or a reduction of proceeds on a sale of securities. Such transaction costs are included in the determination of net realized and unrealized gain (loss) from investment securities reported in the Statement of Operations and the Statement of Changes in Net Assets and the net realized and unrealized gains (losses) on securities per share in the Financial Highlights. Transaction costs are included in the calculation of the Fund’s net asset value and, accordingly, they reduce the Fund’s total returns. These transaction costs are not considered operating expenses and are not reflected in net investment income reported in the Statement of Operations and the Statement of Changes in Net Assets, or the net investment income per share and the ratios of expenses and net investment income reported in the Financial Highlights, nor are they limited by any expense limitation arrangements between the Fund and the investment adviser.
The Fund allocates income and realized and unrealized capital gains and losses to a class based on the relative net assets of each class.
| C. | Country Determination — For the purposes of making investment selection decisions and presentation in the Schedule of Investments, the investment adviser may determine the country in which an issuer is located and/or credit risk exposure based on various factors. These factors include the laws of the country under which the issuer is organized, where the issuer maintains a principal office, the country in which the issuer derives 50% or more of its total revenues and the country that has the primary market for the issuer’s securities, as well as other criteria. Among the other criteria that may be evaluated for making this determination are the country in which the issuer maintains 50% or more of its assets, the type of security, financial guarantees and enhancements, the nature of the collateral and the sponsor organization. Country of issuer and/or credit risk exposure has been determined to be the United States of America, unless otherwise noted. |
| D. | Distributions — Distributions from net investment income and net realized capital gain, if any, are generally declared and paid to separate accounts of participating insurance companies annually and recorded on the ex-dividend date. |
| E. | Federal Income Taxes — The Fund intends to comply with the requirements of Subchapter M of the Internal Revenue Code of 1986, as amended (the “Internal Revenue Code”), necessary to qualify as a regulated investment company and to distribute substantially all of the Fund’s |
Invesco V.I. Managed Volatility Fund
| | taxable earnings to shareholders. As such, the Fund will not be subject to federal income taxes on otherwise taxable income (including net realized capital gain) that is distributed to shareholders. Therefore, no provision for federal income taxes is recorded in the financial statements. |
The Fund recognizes the tax benefits of uncertain tax positions only when the position is more likely than not to be sustained. Management has analyzed the Fund’s uncertain tax positions and concluded that no liability for unrecognized tax benefits should be recorded related to uncertain tax positions. Management is not aware of any tax positions for which it is reasonably possible that the total amounts of unrecognized tax benefits will change materially in the next 12 months.
The Fund files tax returns in the U.S. Federal jurisdiction and certain other jurisdictions. Generally, the Fund is subject to examinations by such taxing authorities for up to three years after the filing of the return for the tax period.
| F. | Expenses — Fees provided for under the Rule 12b-1 plan of a particular class of the Fund and which are directly attributable to that class are charged to the operations of such class. All other expenses are allocated among the classes based on relative net assets. |
| G. | Accounting Estimates — The preparation of financial statements in conformity with accounting principles generally accepted in the United States of America (“GAAP”) requires management to make estimates and assumptions that affect the reported amounts of assets and liabilities at the date of the financial statements and the reported amounts of revenues and expenses during the reporting period including estimates and assumptions related to taxation. Actual results could differ from those estimates by a significant amount. In addition, the Fund monitors for material events or transactions that may occur or become known after the period-end date and before the date the financial statements are released to print. |
| H. | Indemnifications — Under the Trust’s organizational documents, each Trustee, officer, employee or other agent of the Trust is indemnified against certain liabilities that may arise out of the performance of their duties to the Fund. Additionally, in the normal course of business, the Fund enters into contracts, including the Fund’s servicing agreements, that contain a variety of indemnification clauses. The Fund’s maximum exposure under these arrangements is unknown as this would involve future claims that may be made against the Fund that have not yet occurred. The risk of material loss as a result of such indemnification claims is considered remote. |
| I. | Foreign Currency Translations — Foreign currency is valued at the close of the NYSE based on quotations posted by banks and major currency dealers. Portfolio securities and other assets and liabilities denominated in foreign currencies are translated into U.S. dollar amounts at date of valuation. Purchases and sales of portfolio securities (net of foreign taxes withheld on disposition) and income items denominated in foreign currencies are translated into U.S. dollar amounts on the respective dates of such transactions. The Fund does not separately account for the portion of the results of operations resulting from changes in foreign exchange rates on investments and the fluctuations arising from changes in market prices of securities held. The combined results of changes in foreign exchange rates and the fluctuation of market prices on investments (net of estimated foreign tax withholding) are included with the net realized and unrealized gain or loss from investments in the Statement of Operations. Reported net realized foreign currency gains or losses arise from (1) sales of foreign currencies, (2) currency gains or losses realized between the trade and settlement dates on securities transactions, and (3) the difference between the amounts of dividends, interest, and foreign withholding taxes recorded on the Fund’s books and the U.S. dollar equivalent of the amounts actually received or paid. Net unrealized foreign currency gains and losses arise from changes in the fair values of assets and liabilities, other than investments in securities at fiscal period end, resulting from changes in exchange rates. |
The Fund may invest in foreign securities, which may be subject to foreign taxes on income, gains on investments or currency repatriation, a portion of which may be recoverable. Foreign taxes, if any, are recorded based on the tax regulations and rates that exist in the foreign markets in which the Fund invests and are shown in the Statement of Operations.
| J. | Forward Foreign Currency Contracts — The Fund may engage in foreign currency transactions either on a spot (i.e. for prompt delivery and settlement) basis, or through forward foreign currency contracts, to manage or minimize currency or exchange rate risk. |
The Fund may also enter into forward foreign currency contracts for the purchase or sale of a security denominated in a foreign currency in order to “lock in” the U.S. dollar price of that security, or the Fund may also enter into forward foreign currency contracts that do not provide for physical settlement of the two currencies, but instead are settled by a single cash payment calculated as the difference between the agreed upon exchange rate and the spot rate at settlement based upon an agreed upon notional amount (non-deliverable forwards). The Fund will set aside liquid assets in an amount equal to the daily mark-to-market obligation for forward foreign currency contracts.
A forward foreign currency contract is an obligation between two parties (“Counterparties”) to purchase or sell a specific currency for an agreed-upon price at a future date. The use of forward foreign currency contracts does not eliminate fluctuations in the price of the underlying securities the Fund owns or intends to acquire but establishes a rate of exchange in advance. Fluctuations in the value of these contracts are measured by the difference in the contract date and reporting date exchange rates and are recorded as unrealized appreciation (depreciation) until the contracts are closed. When the contracts are closed, realized gains (losses) are recorded. Realized and unrealized gains (losses) on the contracts are included in the Statement of Operations. The primary risks associated with forward foreign currency contracts include failure of the Counterparty to meet the terms of the contract and the value of the foreign currency changing unfavorably. These risks may be in excess of the amounts reflected in the Statement of Assets and Liabilities.
| K. | Futures Contracts — The Fund may enter into futures contracts to manage exposure to interest rate, equity and market price movements and/or currency risks. A futures contract is an agreement between Counterparties to purchase or sell a specified underlying security, currency or commodity (or delivery of a cash settlement price, in the case of an index future) for a fixed price at a future date. The Fund currently invests only in exchange-traded futures and they are standardized as to maturity date and underlying financial instrument. Initial margin deposits required upon entering into futures contracts are satisfied by the segregation of specific securities or cash as collateral at the futures commission merchant (broker). During the period the futures contracts are open, changes in the value of the contracts are recognized as unrealized gains or losses by recalculating the value of the contracts on a daily basis. Subsequent or variation margin payments are received or made depending upon whether unrealized gains or losses are incurred. These amounts are reflected as receivables or payables on the Statement of Assets and Liabilities. When the contracts are closed or expire, the Fund recognizes a realized gain or loss equal to the difference between the proceeds |
Invesco V.I. Managed Volatility Fund
| | from, or cost of, the closing transaction and the Fund’s basis in the contract. The net realized gain (loss) and the change in unrealized gain (loss) on futures contracts held during the period is included on the Statement of Operations. The primary risks associated with futures contracts are market risk and the absence of a liquid secondary market. If the Fund were unable to liquidate a futures contract and/or enter into an offsetting closing transaction, the Fund would continue to be subject to market risk with respect to the value of the contracts and continue to be required to maintain the margin deposits on the futures contracts. Futures contracts have minimal Counterparty risk since the exchange’s clearinghouse, as Counterparty to all exchange-traded futures, guarantees the futures against default. Risks may exceed amounts recognized in the Statement of Assets and Liabilities. |
NOTE 2—Advisory Fees and Other Fees Paid to Affiliates
The Trust has entered into a master investment advisory agreement with Invesco Advisers, Inc. (the “Adviser” or “Invesco”). Under the terms of the investment advisory agreement, the Fund accrues daily and pays monthly an advisory fee to the Adviser based on the annual rate of 0.60% of the Fund’s average daily net assets.
Under the terms of a master sub-advisory agreement between the Adviser and each of Invesco Asset Management Deutschland GmbH, Invesco Asset Management Limited, Invesco Asset Management (Japan) Limited, Invesco Hong Kong Limited, Invesco Senior Secured Management, Inc. and Invesco Canada Ltd. and separate sub-advisory agreements with Invesco PowerShares Capital Management LLC and Invesco Asset Management (India) Private Limited (collectively, the “Affiliated Sub-Advisers”) the Adviser, not the Fund, will pay 40% of the fees paid to the Adviser to any such Affiliated Sub-Adviser(s) that provide(s) discretionary investment management services to the Fund based on the percentage of assets allocated to such Affiliated Sub-Adviser(s).
The Adviser has contractually agreed, through at least June 30, 2018, to waive advisory fees and/or reimburse expenses to the extent necessary to limit total annual fund operating expenses after fee waiver and/or expense reimbursement (excluding certain items discussed below) of Series I shares to 2.00% and Series II shares to 2.25% of average daily net assets (the “expense limits”). In determining the Adviser’s obligation to waive advisory fees and/or reimburse expenses, the following expenses are not taken into account, and could cause the total annual fund operating expenses after fee waiver and/or expense reimbursement to exceed the numbers reflected above: (1) interest; (2) taxes; (3) dividend expense on short sales; (4) extraordinary or non-routine items, including litigation expenses; and (5) expenses that the Fund has incurred but did not actually pay because of an expense offset arrangement. Unless Invesco continues the fee waiver agreement, it will terminate on June 30, 2018. During its term, the fee waiver agreement cannot be terminated or amended to increase expense limits or reduce the advisory fee waiver without approval of the Board of Trustees. The Adviser did not waive fees and/or reimburse expenses during the period under these expense limits.
Further, the Adviser has contractually agreed, through at least June 30, 2019, to waive the advisory fee payable by the Fund in an amount equal to 100% of the net advisory fees the Adviser receives from the affiliated money market funds on investments by the Fund of uninvested cash in such affiliated money market funds.
For the year ended December 31, 2017, the Adviser waived advisory fees of $2,447.
The Trust has entered into a master administrative services agreement with Invesco pursuant to which the Fund has agreed to pay Invesco a fee for costs incurred in providing accounting services and fund administrative services to the Fund and to reimburse Invesco for fees paid to insurance companies that have agreed to provide certain administrative services to the Fund. These administrative services provided by the insurance companies may include, among other things: maintenance of master accounts with the Fund; tracking, recording and transmitting net purchase and redemption orders for Fund shares; maintaining and preserving records related to the purchase, redemption and other account activity of variable product owners; distributing copies of Fund documents such as prospectuses, proxy materials and periodic reports, to variable product owners, and responding to inquiries from variable product owners about the Fund. Pursuant to such agreement, for the year ended December 31, 2017, Invesco was paid $50,000 for accounting and fund administrative services and was reimbursed $73,515 for fees paid to insurance companies.
The Trust has entered into a transfer agency and service agreement with Invesco Investment Services, Inc. (“IIS”) pursuant to which the Fund has agreed to pay IIS a fee for providing transfer agency and shareholder services to the Fund and reimburse IIS for certain expenses incurred by IIS in the course of providing such services. For the year ended December 31, 2017, expenses incurred under the agreement are shown in the Statement of Operations as Transfer agent fees.
The Trust has entered into a master distribution agreement with Invesco Distributors, Inc. (“IDI”) to serve as the distributor for the Fund. The Trust has adopted a plan pursuant to Rule 12b-1 under the 1940 Act with respect to the Fund’s Series II shares (the “Plan”). The Fund, pursuant to the Plan, pays IDI compensation at the annual rate of 0.25% of the Fund’s average daily net assets of Series II shares. The fees are accrued daily and paid monthly. Of the Plan payments, up to 0.25% of the average daily net assets of the Series II shares may be paid to insurance companies who furnish continuing personal shareholder services to customers who purchase and own Series II shares of the Fund. For the year ended December 31, 2017, expenses incurred under the Plan are detailed in the Statement of Operations as Distribution fees.
For the year ended December 31, 2017, the Fund incurred $268 in brokerage commissions with Invesco Capital Markets, Inc., an affiliate of the Adviser and IDI, for portfolio transactions executed on behalf of the Fund.
Certain officers and trustees of the Trust are officers and directors of the Adviser, IIS and/or IDI.
Invesco V.I. Managed Volatility Fund
NOTE 3—Additional Valuation Information
GAAP defines fair value as the price that would be received to sell an asset or paid to transfer a liability in an orderly transaction between market participants at the measurement date, under current market conditions. GAAP establishes a hierarchy that prioritizes the inputs to valuation methods, giving the highest priority to readily available unadjusted quoted prices in an active market for identical assets (Level 1) and the lowest priority to significant unobservable inputs (Level 3), generally when market prices are not readily available or are unreliable. Based on the valuation inputs, the securities or other investments are tiered into one of three levels. Changes in valuation methods may result in transfers in or out of an investment’s assigned level:
| | Level 1 — | Prices are determined using quoted prices in an active market for identical assets. |
| | Level 2 — | Prices are determined using other significant observable inputs. Observable inputs are inputs that other market participants may use in pricing a security. These may include quoted prices for similar securities, interest rates, prepayment speeds, credit risk, yield curves, loss severities, default rates, discount rates, volatilities and others. |
| | Level 3 — | Prices are determined using significant unobservable inputs. In situations where quoted prices or observable inputs are unavailable (for example, when there is little or no market activity for an investment at the end of the period), unobservable inputs may be used. Unobservable inputs reflect the Fund’s own assumptions about the factors market participants would use in determining fair value of the securities or instruments and would be based on the best available information. |
The following is a summary of the tiered valuation input levels, as of December 31, 2017. The level assigned to the securities valuations may not be an indication of the risk or liquidity associated with investing in those securities. Because of the inherent uncertainties of valuation, the values reflected in the financial statements may materially differ from the value received upon actual sale of those investments.
The Fund’s policy is to recognize transfers in and out of the valuation levels as of the end of the reporting period. During the year ended December 31, 2017, there were no material transfers between valuation levels.
| | | | | | | | | | | | | | | | |
| | | Level 1 | | | Level 2 | | | Level 3 | | | Total | |
| Investments in Securities | | | | | | | | | | | | |
Common Stocks & Other Equity Interests | | $ | 27,631,299 | | | $ | 901,274 | | | $ | — | | | $ | 28,532,573 | |
Bonds and Notes | | | — | | | | 10,581,406 | | | | — | | | | 10,581,406 | |
U.S. Treasury Securities | | | — | | | | 3,351,925 | | | | — | | | | 3,351,925 | |
Preferred Stocks | | | — | | | | 107,844 | | | | — | | | | 107,844 | |
Money Market Funds | | | 2,770,461 | | | | — | | | | — | | | | 2,770,461 | |
Total Investments in Securities | | | 30,401,760 | | | | 14,942,449 | | | | — | | | | 45,344,209 | |
| Other Investments — Assets* | | | | | | | | | | | | |
Forward Foreign Currency Contracts | | | — | | | | 486 | | | | — | | | | 486 | |
| Other Investments — Liabilities* | | | | | | | | | | | | |
Forward Foreign Currency Contracts | | | — | | | | (39,718 | ) | | | — | | | | (39,718 | ) |
Total Other Investments | | | — | | | | (39,232 | ) | | | — | | | | (39,232 | ) |
Total Investments | | $ | 30,401,760 | | | $ | 14,903,217 | | | $ | — | | | $ | 45,304,977 | |
| * | Unrealized appreciation (depreciation). |
NOTE 4—Derivative Investments
The Fund may enter into an International Swaps and Derivatives Association Master Agreement (“ISDA Master Agreement”) under which a fund may trade OTC derivatives. An OTC transaction entered into under an ISDA Master Agreement typically involves a collateral posting arrangement, payment netting provisions and close-out netting provisions. These netting provisions allow for reduction of credit risk through netting of contractual obligations. The enforceability of the netting provisions of the ISDA Master Agreement depends on the governing law of the ISDA Master Agreement, among other factors.
For financial reporting purposes, the Fund does not offset OTC derivative assets or liabilities that are subject to ISDA Master Agreements in the Statement of Assets and Liabilities.
Value of Derivative Investments at Period-End
The table below summarizes the value of the Fund’s derivative investments, detailed by primary risk exposure, held as of December 31, 2017:
| | | | |
| | | Value | |
| Derivative Assets | | Currency Risk | |
Unrealized appreciation on forward foreign currency contracts outstanding | | $ | 486 | |
Derivatives not subject to master netting agreements | | | — | |
Total Derivative Assets subject to master netting agreements | | $ | 486 | |
| | | | |
| | | Value | |
| Derivative Liabilities | | Currency
Risk | |
Unrealized depreciation on forward foreign currency contracts outstanding | | $ | (39,718 | ) |
Derivatives not subject to master netting agreements | | | — | |
Total Derivative Liabilities subject to master netting agreements | | $ | (39,718 | ) |
Invesco V.I. Managed Volatility Fund
Offsetting Assets and Liabilities
The table below reflects the Fund’s exposure to Counterparties subject to either an ISDA Master Agreement or other agreement for OTC derivative transactions as of December 31, 2017.
| | | | | | | | | | | | | | | | | | | | | | | | |
| | | Financial
Derivative Assets | | | Financial
Derivative Liabilities | | | Net Value of
Derivatives | | | Collateral (Received)/
Pledged | | | Net
Amount | |
| Counterparty | | Forward Foreign Currency Contracts | | | Forward Foreign Currency Contracts | | | | Non-Cash | | | Cash | | |
Bank of New York Mellon (The) | | $ | — | | | $ | (19,978 | ) | | $ | (19,978 | ) | | $ | — | | | $ | — | | | $ | (19,978 | ) |
State Street Bank and Trust Co. | | | 486 | | | | (19,740 | ) | | | (19,254 | ) | | | — | | | | — | | | | (19,254 | ) |
Total | | $ | 486 | | | $ | (39,718 | ) | | $ | (39,232 | ) | | $ | — | | | $ | — | | | $ | (39,232 | ) |
Effect of Derivative Investments for the year ended December 31, 2017
The table below summarizes the gains (losses) on derivative investments, detailed by primary risk exposure, recognized in earnings during the period:
| | | | | | | | | | | | |
| | | Location of Gain (Loss) on
Statement of Operations | |
| | | Currency
Risk | | | Equity
Risk | | | Total | |
Realized Gain (Loss): | | | | | | | | | | | | |
Forward foreign currency contracts | | $ | (94,515 | ) | | $ | — | | | $ | (94,515 | ) |
Futures contracts | | | — | | | | (25,150 | ) | | | (25,150 | ) |
Change in Net Unrealized Appreciation (Depreciation): | | | | | | | | | | | | |
Forward foreign currency contracts | | | (92,727 | ) | | | — | | | | (92,727 | ) |
Total | | $ | (187,242 | ) | | $ | (25,150 | ) | | $ | (212,392 | ) |
The table below summarizes the twelve months average notional value of forward foreign currency contracts and the two days average notional value of futures contracts outstanding during the period.
| | | | | | | | |
| | | Forward Foreign Currency
Contracts | | | Futures
Contracts | |
Average notional value | | $ | 2,832,114 | | | $ | 3,824,288 | |
NOTE 5—Security Transactions with Affiliated Funds
The Fund is permitted to purchase or sell securities from or to certain other Invesco Funds under specified conditions outlined in procedures adopted by the Board of Trustees of the Trust. The procedures have been designed to ensure that any purchase or sale of securities by the Fund from or to another fund or portfolio that is or could be considered an affiliate by virtue of having a common investment adviser (or affiliated investment advisers), common Trustees and/or common officers complies with Rule 17a-7 of the 1940 Act. Further, as defined under the procedures, each transaction is effected at the current market price. Pursuant to these procedures, for the year ended December 31, 2017, the Fund engaged in securities purchases of $99,345.
NOTE 6—Trustees’ and Officers’ Fees and Benefits
Trustees’ and Officers’ Fees and Benefits include amounts accrued by the Fund to pay remuneration to certain Trustees and Officers of the Fund. Trustees have the option to defer compensation payable by the Fund, and Trustees’ and Officers’ Fees and Benefits also include amounts accrued by the Fund to fund such deferred compensation amounts. Those Trustees who defer compensation have the option to select various Invesco Funds in which their deferral accounts shall be deemed to be invested. Finally, certain current Trustees were eligible to participate in a retirement plan that provided for benefits to be paid upon retirement to Trustees over a period of time based on the number of years of service. The Fund may have certain former Trustees who also participate in a retirement plan and receive benefits under such plan. Trustees’ and Officers’ Fees and Benefits include amounts accrued by the Fund to fund such retirement benefits. Obligations under the deferred compensation and retirement plans represent unsecured claims against the general assets of the Fund.
NOTE 7—Cash Balances
The Fund is permitted to temporarily carry a negative or overdrawn balance in its account with State Street Bank and Trust Company, the custodian bank. Such balances, if any at period-end, are shown in the Statement of Assets and Liabilities under the payable caption Amount due custodian. To compensate the custodian bank for such overdrafts, the overdrawn Fund may either (1) leave funds as a compensating balance in the account so the custodian bank can be compensated by earning the additional interest; or (2) compensate by paying the custodian bank at a rate agreed upon by the custodian bank and Invesco, not to exceed the contractually agreed upon rate.
Invesco V.I. Managed Volatility Fund
NOTE 8—Distributions to Shareholders and Tax Components of Net Assets
Tax Character of Distributions to Shareholders Paid During the Fiscal Years Ended December 31, 2017 and 2016:
| | | | | | | | |
| | | 2017 | | | 2016 | |
Ordinary income | | $ | 626,837 | | | $ | 1,039,201 | |
Long-term capital gain | | | — | | | | 1,392,685 | |
Total distributions | | $ | 626,837 | | | $ | 2,431,886 | |
Tax Components of Net Assets at Period-End:
| | | | |
| | | 2017 | |
Undistributed ordinary income | | $ | 670,231 | |
Undistributed long-term gain | | | 1,351,361 | |
Net unrealized appreciation — investments | | | 6,670,010 | |
Net unrealized appreciation — foreign currencies | | | 580 | |
Temporary book/tax differences | | | (62,489 | ) |
Shares of beneficial interest | | | 36,920,465 | |
Total net assets | | $ | 45,550,158 | |
The difference between book-basis and tax-basis unrealized appreciation (depreciation) is due to differences in the timing of recognition of gains and losses on investments for tax and book purposes. The Fund’s net unrealized appreciation difference is attributable primarily to wash sales, tax treatment of futures contracts and adjustments to contingent payment debt instruments.
The temporary book/tax differences are a result of timing differences between book and tax recognition of income and/or expenses. The Fund’s temporary book/tax differences are the result of the trustee deferral of compensation and retirement plan benefits.
Capital loss carryforward is calculated and reported as of a specific date. Results of transactions and other activity after that date may affect the amount of capital loss carryforward actually available for the Fund to utilize. Capital losses generated in years beginning after December 22, 2010 can be carried forward for an unlimited period, whereas previous losses expire in eight tax years. Capital losses with an expiration period may not be used to offset capital gains until all net capital losses without an expiration date have been utilized. Capital loss carryforwards with no expiration date will retain their character as either short-term or long-term capital losses instead of as short-term capital losses as under prior law. The ability to utilize capital loss carryforwards in the future may be limited under the Internal Revenue Code and related regulations based on the results of future transactions.
The Fund does not have a capital loss carryforward as of December 31, 2017.
NOTE 9—Investment Transactions
The aggregate amount of investment securities (other than short-term securities, U.S. Treasury obligations and money market funds, if any) purchased and sold by the Fund during the year ended December 31, 2017 was $7,995,651 and $18,737,343, respectively. During the same period, purchases and sales of U.S. Treasury obligations were $34,669,589 and $34,602,721, respectively. Cost of investments, including any derivatives, on a tax basis includes the adjustments for financial reporting purposes as of the most recently completed federal income tax reporting period-end.
| | | | |
| Unrealized Appreciation (Depreciation) of Investments on a Tax Basis | |
Aggregate unrealized appreciation of investments | | $ | 7,612,472 | |
Aggregate unrealized (depreciation) of investments | | | (942,462 | ) |
Net unrealized appreciation of investments | | $ | 6,670,010 | |
Cost of investments for tax purposes is $38,634,967.
NOTE 10—Reclassification of Permanent Differences
Primarily as a result of differing book/tax treatment of contingent payment debt instruments sold, on December 31, 2017, undistributed net investment income was increased by $83,949 and undistributed net realized gain was decreased by $83,949. This reclassification had no effect on the net assets of the Fund.
Invesco V.I. Managed Volatility Fund
NOTE 11—Share Information
| | | | | | | | | | | | | | | | |
| | | Summary of Share Activity | |
| | | Years ended December 31, | |
| | | 2017(a) | | | 2016 | |
| | | Shares | | | Amount | | | Shares | | | Amount | |
Sold: | | | | | | | | | | | | | | | | |
Series I | | | 283,126 | | | $ | 3,509,281 | | | | 300,423 | | | $ | 3,419,830 | |
Series II | | | 13,842 | | | | 167,061 | | | | 8,242 | | | | 92,158 | |
| | | | |
Issued as reinvestment of dividends: | | | | | | | | | | | | | | | | |
Series I | | | 48,606 | | | | 610,486 | | | | 209,985 | | | | 2,366,531 | |
Series II | | | 1,316 | | | | 16,351 | | | | 5,856 | | | | 65,355 | |
| | | | |
Reacquired: | | | | | | | | | | | | | | | | |
Series I | | | (1,147,686 | ) | | | (14,337,959 | ) | | | (918,562 | ) | | | (10,365,620 | ) |
Series II | | | (26,720 | ) | | | (328,839 | ) | | | (23,850 | ) | | | (267,680 | ) |
Net increase (decrease) in share activity | | | (827,516 | ) | | $ | (10,363,619 | ) | | | (417,906 | ) | | $ | (4,689,426 | ) |
| (a) | There are entities that are record owners of more than 5% of the outstanding shares of the Fund and in the aggregate own 60% of the outstanding shares of the Fund. The Fund and the Fund’s principal underwriter or adviser, are parties to participation agreements with these entities whereby these entities sell units of interest in separate accounts funding variable products that are invested in the Fund. The Fund, Invesco and/or Invesco affiliates may make payments to these entities, which are considered to be related to the Fund, for providing services to the Fund, Invesco and/or Invesco affiliates including but not limited to services such as, securities brokerage, third party record keeping and account servicing and administrative services. The Fund has no knowledge as to whether all or any portion of the shares owned of record by these entities are also owned beneficially. |
NOTE 12—Financial Highlights
The following schedule presents financial highlights for a share of the Fund outstanding throughout the periods indicated.
| | | | | | | | | | | | | | | | | | | | | | | | | | | | | | | | | | | | | | | | | | | | | | | | | | | | | | | | |
| | | Net asset
value,
beginning
of period | | | Net
investment
income(a) | | | Net gains
(losses) on
securities
(both
realized and
unrealized) | | | Total from
investment
operations | | | Dividends
from net
investment
income | | | Distributions
from net
realized
gains | | | Total
distributions | | | Net asset
value, end
of period | | | Total
return(b) | | | Net assets,
end of period
(000’s omitted) | | | Ratio of
expenses
to average
net assets
with fee waivers
and/or expenses
absorbed | | | Ratio of
expenses
to average net
assets without
fee waivers
and/or expenses
absorbed | | | Ratio of net
investment
income
to average
net assets | | | Portfolio
turnover(c) | |
Series I | | | | | | | | | | | | | | | | | | | | | | | | | | | | | | | | | | | | | | | | | | | | | | | | | | | | | | | | |
Year ended 12/31/17 | | $ | 11.97 | | | $ | 0.18 | (d) | | $ | 1.08 | | | $ | 1.26 | | | $ | (0.17 | ) | | $ | — | | | $ | (0.17 | ) | | $ | 13.06 | | | | 10.56 | % | | $ | 44,104 | | | | 1.13 | %(e) | | | 1.13 | %(e) | | | 1.42 | %(d)(e) | | | 91 | % |
Year ended 12/31/16 | | | 11.38 | | | | 0.14 | | | | 1.03 | | | | 1.17 | | | | (0.22 | ) | | | (0.36 | ) | | | (0.58 | ) | | | 11.97 | | | | 10.61 | | | | 50,183 | | | | 1.15 | | | | 1.16 | | | | 1.26 | | | | 92 | |
Year ended 12/31/15 | | | 19.02 | | | | 0.18 | | | | (0.74 | ) | | | (0.56 | ) | | | (0.27 | ) | | | (6.81 | ) | | | (7.08 | ) | | | 11.38 | | | | (2.15 | ) | | | 52,360 | | | | 1.08 | | | | 1.10 | | | | 1.07 | | | | 117 | |
Year ended 12/31/14 | | | 17.03 | | | | 0.24 | | | | 3.23 | | | | 3.47 | | | | (0.56 | ) | | | (0.92 | ) | | | (1.48 | ) | | | 19.02 | | | | 20.57 | | | | 70,717 | | | | 1.03 | | | | 1.10 | | | | 1.26 | | | | 201 | |
Year ended 12/31/13 | | | 16.20 | | | | 0.47 | | | | 1.25 | | | | 1.72 | | | | (0.52 | ) | | | (0.37 | ) | | | (0.89 | ) | | | 17.03 | | | | 10.76 | | | | 61,806 | | | | 1.07 | | | | 1.08 | | | | 2.73 | | | | 15 | |
Series II | | | | | | | | | | | | | | | | | | | | | | | | | | | | | | | | | | | | | | | | | | | | | | | | | | | | | | | | |
Year ended 12/31/17 | | | 11.84 | | | | 0.15 | (d) | | | 1.07 | | | | 1.22 | | | | (0.14 | ) | | | — | | | | (0.14 | ) | | | 12.92 | | | | 10.33 | | | | 1,446 | | | | 1.38 | (e) | | | 1.38 | (e) | | | 1.17 | (d)(e) | | | 91 | |
Year ended 12/31/16 | | | 11.26 | | | | 0.11 | | | | 1.02 | | | | 1.13 | | | | (0.19 | ) | | | (0.36 | ) | | | (0.55 | ) | | | 11.84 | | | | 10.31 | | | | 1,462 | | | | 1.40 | | | | 1.41 | | | | 1.01 | | | | 92 | |
Year ended 12/31/15 | | | 18.88 | | | | 0.13 | | | | (0.72 | ) | | | (0.59 | ) | | | (0.22 | ) | | | (6.81 | ) | | | (7.03 | ) | | | 11.26 | | | | (2.37 | ) | | | 1,500 | | | | 1.33 | | | | 1.35 | | | | 0.82 | | | | 117 | |
Year ended 12/31/14 | | | 16.91 | | | | 0.19 | | | | 3.21 | | | | 3.40 | | | | (0.51 | ) | | | (0.92 | ) | | | (1.43 | ) | | | 18.88 | | | | 20.30 | | | | 1,794 | | | | 1.28 | | | | 1.35 | | | | 1.01 | | | | 201 | |
Year ended 12/31/13 | | | 16.09 | | | | 0.43 | | | | 1.23 | | | | 1.66 | | | | (0.47 | ) | | | (0.37 | ) | | | (0.84 | ) | | | 16.91 | | | | 10.45 | | | | 1,664 | | | | 1.32 | | | | 1.33 | | | | 2.48 | | | | 15 | |
| (a) | Calculated using average shares outstanding. |
| (b) | Includes adjustments in accordance with accounting principles generally accepted in the United States of America and as such, the net asset value for financial reporting purposes and the returns based upon those net asset values may differ from the net asset value and returns for shareholder transactions. Total returns are not annualized for periods less than one year, if applicable, and do not reflect charges assessed in connection with a variable product, which if included would reduce total returns. |
| (c) | Portfolio turnover is calculated at the fund level and is not annualized for periods less than one year, if applicable. |
| (d) | Net investment income per share and the ratio of net investment income to average net assets includes significant dividends received during the year ended December 31, 2017. Net investment income per share and the ratio of net investment income to average net assets excluding the significant dividends are $0.14 and 1.11%, $0.11 and 0.86% for Series I and Series II shares, respectively. |
| (e) | Ratios are based on average daily net assets (000’s omitted) of $47,946 and $1,474 for Series I and Series II shares, respectively. |
Invesco V.I. Managed Volatility Fund
Report of Independent Registered Public Accounting Firm
To the Board of Trustees of AIM Variable Insurance Funds (Invesco Variable Insurance Funds)
and Shareholders of Invesco V.I. Managed Volatility Fund
Opinion on the Financial Statements
We have audited the accompanying statement of assets and liabilities, including the schedule of investments, of Invesco V.I. Managed Volatility Fund (one of the funds constituting AIM Variable Insurance Funds (Invesco Variable Insurance Funds), hereafter referred to as the “Fund”) as of December 31, 2017, the related statement of operations for the year ended December 31, 2017, the statement of changes in net assets for each of the two years in the period ended December 31, 2017, including the related notes, and the financial highlights for each of the five years in the period ended December 31, 2017 (collectively referred to as the “financial statements”). In our opinion, the financial statements present fairly, in all material respects, the financial position of the Fund as of December 31, 2017, the results of its operations for the year then ended, the changes in its net assets for each of the two years in the period ended December 31, 2017 and the financial highlights for each of the five years in the period ended December 31, 2017 in conformity with accounting principles generally accepted in the United States of America.
Basis for Opinion
These financial statements are the responsibility of the Fund’s management. Our responsibility is to express an opinion on the Fund’s financial statements based on our audits. We are a public accounting firm registered with the Public Company Accounting Oversight Board (United States) (“PCAOB”) and are required to be independent with respect to the Fund in accordance with the U.S. federal securities laws and the applicable rules and regulations of the Securities and Exchange Commission and the PCAOB.
We conducted our audits of these financial statements in accordance with the standards of the PCAOB. Those standards require that we plan and perform the audit to obtain reasonable assurance about whether the financial statements are free of material misstatement, whether due to error or fraud.
Our audits included performing procedures to assess the risks of material misstatement of the financial statements, whether due to error or fraud, and performing procedures that respond to those risks. Such procedures included examining, on a test basis, evidence regarding the amounts and disclosures in the financial statements. Our audits also included evaluating the accounting principles used and significant estimates made by management, as well as evaluating the overall presentation of the financial statements. Our procedures included confirmation of securities owned as of December 31, 2017 by correspondence with the custodian, transfer agent and brokers; when replies were not received from brokers, we performed other auditing procedures. We believe that our audits provide a reasonable basis for our opinion.
PricewaterhouseCoopers LLP
Houston, TX
February 14, 2018
We have served as the auditor of one or more of the investment companies in the Invesco/PowerShares group of investment companies since at least 1995. We have not determined the specific year we began serving as auditor.
Invesco V.I. Managed Volatility Fund
Calculating your ongoing Fund expenses
Example
As a shareholder of the Fund, you incur ongoing costs, including management fees; distribution and/or service fees (12b-1); and other Fund expenses. This example is intended to help you understand your ongoing costs (in dollars) of investing in the Fund and to compare these costs with ongoing costs of investing in other mutual funds. The example is based on an investment of $1,000 invested at the beginning of the period and held for the entire period July 1, 2017 through December 31, 2017.
The actual and hypothetical expenses in the examples below do not represent the effect of any fees or other expenses assessed in connection with a variable product; if they did, the expenses shown would be higher while the ending account values shown would be lower.
Actual expenses
The table below provides information about actual account values and actual expenses. You may use the information in this table, together with the amount you invested, to estimate the expenses that you paid over the period. Simply divide your account value by $1,000 (for example, an $8,600 account value divided by $1,000 = 8.6), then multiply the result by the number in the table under the heading entitled “Actual Expenses Paid During Period” to estimate the expenses you paid on your account during this period.
Hypothetical example for comparison purposes
The table below also provides information about hypothetical account values and hypothetical expenses based on the Fund’s actual expense ratio and an assumed rate of return of 5% per year before expenses, which is not the Fund’s actual return.
The hypothetical account values and expenses may not be used to estimate the actual ending account balance or expenses you paid for the period. You may use this information to compare the ongoing costs of investing in the Fund and other funds. To do so, compare this 5% hypothetical example with the 5% hypothetical examples that appear in the shareholder reports of the other funds.
Please note that the expenses shown in the table are meant to highlight your ongoing costs. Therefore, the hypothetical information is useful in comparing ongoing costs, and will not help you determine the relative total costs of owning different funds.
| | | | | | | | | | | | | | | | | | | | | | | | |
| Class | | Beginning
Account Value
(07/01/17) | | | ACTUAL | | | HYPOTHETICAL (5% annual return before
expenses) | | | | |
| | | Ending
Account Value
(12/31/17)1 | | | Expenses
Paid During
Period2 | | | Ending
Account Value
(12/31/17) | | | Expenses
Paid During
Period2 | | | Annualized
Expense Ratio | |
| Series I | | $ | 1,000.00 | | | $ | 1,063.00 | | | $ | 5.88 | | | $ | 1,019.51 | | | $ | 5.75 | | | | 1.13 | % |
| Series II | | | 1,000.00 | | | | 1,062.00 | | | | 7.17 | | | | 1,018.25 | | | | 7.02 | | | | 1.38 | |
| 1 | The actual ending account value is based on the actual total return of the Fund for the period July 1, 2017 through December 31, 2017, after actual expenses and will differ from the hypothetical ending account value which is based on the Fund’s expense ratio and a hypothetical annual return of 5% before expenses. |
| 2 | Expenses are equal to the Fund’s annualized expense ratio as indicated above multiplied by the average account value over the period, multiplied by 184/365 to reflect the most recent fiscal half year. |
Invesco V.I. Managed Volatility Fund
Tax Information
Form 1099-DIV, Form 1042-S and other year-end tax information provide shareholders with actual calendar year amounts that should be included in their tax returns. Shareholders should consult their tax advisors.
The following distribution information is being provided as required by the Internal Revenue Code or to meet a specific state’s requirement.
The Fund designates the following amounts or, if subsequently determined to be different, the maximum amount allowable for its fiscal year ended December 31, 2017:
| | | | |
Federal and State Income Tax | |
Corporate Dividends Received Deduction* | | | 93.71 | % |
U.S. Treasury Obligations* | | | 3.72 | % |
| | * | The above percentages are based on ordinary income dividends paid to shareholders during the Fund’s fiscal year. |
Invesco V.I. Managed Volatility Fund
Trustees and Officers
The address of each trustee and officer is AIM Variable Insurance Funds (Invesco Variable Insurance Funds) (the “Trust”), 11 Greenway Plaza, Suite 1000, Houston, Texas 77046-1173. The trustees serve for the life of the Trust, subject to their earlier death, incapacitation, resignation, retirement or removal as more specifically provided in the Trust’s organizational documents. Each officer serves for a one year term or until their successors are elected and qualified. Column two below includes length of time served with predecessor entities, if any.
| | | | | | | | |
Name, Year of Birth and
Position(s) Held with the Trust | | Trustee and/
or Officer Since | | Principal Occupation(s)
During Past 5 Years | | Number of
Funds in Fund
Complex
Overseen by
Trustee | | Other Directorship(s)
Held by Trustee During
Past 5 Years |
| Interested Persons | | | | | | | | |
Martin L. Flanagan1 — 1960 Trustee | | 2007 | | Executive Director, Chief Executive Officer and President, Invesco Ltd. (ultimate parent of Invesco and a global investment management firm); Trustee, The Invesco Funds; Vice Chair, Investment Company Institute; and Member of Executive Board, SMU Cox School of Business Formerly: Advisor to the Board, Invesco Advisers, Inc. (formerly known as Invesco Institutional (N.A.), Inc.); Chairman and Chief Executive Officer, Invesco Advisers, Inc. (registered investment adviser); Director, Chairman, Chief Executive Officer and President, Invesco Holding Company (US), Inc. (formerly IVZ Inc.) (holding company), Invesco Group Services, Inc. (service provider) and Invesco North American Holdings, Inc. (holding company); Director, Chief Executive Officer and President, Invesco Holding Company Limited (parent of Invesco and a global investment management firm); Director, Invesco Ltd.; Chairman, Investment Company Institute and President, Co-Chief Executive Officer, Co-President, Chief Operating Officer and Chief Financial Officer, Franklin Resources, Inc. (global investment management organization) | | 158 | | None |
Philip A. Taylor2 — 1954 Trustee and Senior Vice President | | 2006 | | Head of the Americas and Senior Managing Director, Invesco Ltd.; Director, Invesco Advisers, Inc. (formerly known as Invesco Institutional (N.A.), Inc.) (registered investment adviser); Director, Chairman, Chief Executive Officer and President, Invesco Management Group, Inc. (formerly known as Invesco Aim Management Group, Inc.) (financial services holding company); Director and Chairman, Invesco Investment Services, Inc. (formerly known as Invesco Aim Investment Services, Inc.) (registered transfer agent); Chief Executive Officer, Invesco Corporate Class Inc. (corporate mutual fund company); Director, Chairman and Chief Executive Officer, Invesco Canada Ltd. (formerly known as Invesco Trimark Ltd./Invesco Trimark Ltèe) (registered investment adviser and registered transfer agent); Trustee and Senior Vice President, The Invesco Funds; Director, Invesco Investment Advisers LLC (formerly known as Van Kampen Asset Management). Formerly: Co-Chairman, Co-President and Co-Chief Executive Officer, Invesco Advisers, Inc. (formerly known as Invesco Institutional (N.A.), Inc.) (registered investment adviser); Director, Chief Executive Officer and President, Van Kampen Exchange Corp; President and Principal Executive Officer, The Invesco Funds (other than AIM Treasurer’s Series Trust (Invesco Treasurer’s Series Trust), Short-Term Investments Trust and Invesco Management Trust); Executive Vice President, The Invesco Funds (AIM Treasurer’s Series Trust (Invesco Treasurer’s Series Trust), Short-Term Investments Trust and Invesco Management Trust only); Director and President, INVESCO Funds Group, Inc. (registered investment adviser and registered transfer agent); Director and Chairman, IVZ Distributors, Inc. (formerly known as INVESCO Distributors, Inc.) (registered broker dealer); Director, President and Chairman, Invesco Inc. (holding company), Invesco Canada Holdings Inc. (holding company), Trimark Investments Ltd./Placements Trimark Ltèe and Invesco Financial Services Ltd/Services Financiers Invesco Ltèe; Chief Executive Officer, Invesco Canada Fund Inc. (corporate mutual fund company); Director and Chairman, Van Kampen Investor Services Inc.; Director, Chief Executive Officer and President, 1371 Preferred Inc. (holding company) and Van Kampen Investments Inc.; Director and President, AIM GP Canada Inc. (general partner for limited partnerships) and Van Kampen Advisors, Inc.; Director and Chief Executive Officer, Invesco Trimark Dealer Inc. (registered broker dealer); Director, Invesco Distributors, Inc. (formerly known as Invesco Aim Distributors, Inc.) (registered broker dealer); Manager, Invesco PowerShares Capital Management LLC; Director, Chief Executive Officer and President, Invesco Advisers, Inc.; Director, Chairman, Chief Executive Officer and President, Invesco Aim Capital Management, Inc.; President, Invesco Trimark Dealer Inc. and Invesco Trimark Ltd./Invesco Trimark Ltèe; Director and President, AIM Trimark Corporate Class Inc. and AIM Trimark Canada Fund Inc.; Senior Managing Director, Invesco Holding Company Limited; Director and Chairman, Fund Management Company (former registered broker dealer); President and Principal Executive Officer, The Invesco Funds (AIM Treasurer’s Series Trust (Invesco Treasurer’s Series Trust), and Short-Term Investments Trust only); President, AIM Trimark Global Fund Inc. and AIM Trimark Canada Fund Inc. | | 158 | | None |
| 1 | Mr. Flanagan is considered an interested person (within the meaning of Section 2(a)(19) of the 1940 Act) of the Trust because he is an officer of the Adviser to the Trust, and an officer and a director of Invesco Ltd., ultimate parent of the Adviser. |
| 2 | Mr. Taylor is considered an interested person (within the meaning of Section 2(a)(19) of the 1940 Act) of the Trust because he is an officer and a director of the Adviser. |
Invesco V.I. Managed Volatility Fund
Trustees and Officers—(continued)
| | | | | | | | |
Name, Year of Birth and
Position(s) Held with the Trust | | Trustee and/
or Officer Since | | Principal Occupation(s)
During Past 5 Years | | Number of
Funds in Fund
Complex
Overseen by
Trustee | | Other Directorship(s)
Held by Trustee During
Past 5 Years |
| Independent Trustees | | | | | | | | |
Bruce L. Crockett — 1944 Trustee and Chair | | 1993 | | Chairman, Crockett Technologies Associates (technology consulting company) Formerly: Director, Captaris (unified messaging provider); Director, President and Chief Executive Officer, COMSAT Corporation; Chairman, Board of Governors of INTELSAT (international communications company); ACE Limited (insurance company); Independent Directors Council and Investment Company Institute: Member of the Audit Committee, Investment Company Institute; Member of the Executive Committee and Chair of the Governance Committee, Independent Directors Council | | 158 | | Director and Chairman of the Audit Committee, ALPS (Attorneys Liability Protection Society) (insurance company); Director and Member of the Audit Committee and Compensation Committee, Ferroglobe PLC (metallurgical company) |
David C. Arch — 1945 Trustee | | 2010 | | Chairman of Blistex Inc. (consumer health care products manufacturer); Member, World Presidents’ Organization | | 158 | | Board member of the Illinois Manufacturers’ Association |
Jack M. Fields — 1952 Trustee | | 1997 | | Chief Executive Officer, Twenty First Century Group, Inc. (government affairs company); and Chairman, Discovery Learning Alliance (non-profit) Formerly: Owner and Chief Executive Officer, Dos Angeles Ranch L.P. (cattle, hunting, corporate entertainment); Director, Insperity, Inc. (formerly known as Administaff) (human resources provider); Chief Executive Officer, Texana Timber LP (sustainable forestry company); Director of Cross Timbers Quail Research Ranch (non-profit); and member of the U.S. House of Representatives | | 158 | | None |
Cynthia Hostetler — 1962 Trustee | | 2017 | | Non-Executive Director and Trustee of a number of public and private business corporations Formerly: Head of Investment Funds and Private Equity, Overseas Private Investment Corporation; President, First Manhattan Bancorporation, Inc.; Attorney, Simpson Thacher & Bartlett LLP | | 158 | | Vulcan Materials Company (construction materials company); Trilinc Global Impact Fund; Aberdeen Investment Funds (4 portfolios); Artio Global Investment LLC (mutual fund complex); Edgen Group, Inc. (specialized energy and infrastructure products distributor) |
Eli Jones — 1961 Trustee | | 2016 | | Professor and Dean, Mays Business School — Texas A&M University Formerly: Professor and Dean, Walton College of Business, University of Arkansas and E.J. Ourso College of Business, Louisiana State University; Director, Arvest Bank | | 158 | | Insperity, Inc. (formerly known as Administaff) (human resources provider) |
Prema Mathai-Davis — 1950 Trustee | | 1998 | | Retired. | | 158 | | None |
Teresa M. Ressel — 1962 Trustee | | 2017 | | Non-executive director and trustee of a number of public and private business corporations Formerly: Chief Financial Officer, Olayan America, The Olayan Group (international investor/commercial/industrial); Chief Executive Officer, UBS Securities LLC; Group Chief Operating Officer, Americas, UBS AG; Assistant Secretary for Management & Budget and CFO, US Department of the Treasury | | 158 | | Atlantic Power Corporation (power generation company); ON Semiconductor Corp. (semiconductor supplier) |
Ann Barnett Stern — 1957 Trustee | | 2017 | | President and Chief Executive Officer, Houston Endowment Inc. (private philanthropic institution) Formerly: Executive Vice President and General Counsel, Texas Children’s Hospital; Attorney, Beck, Redden and Secrest, LLP; Business Law Instructor, University of St. Thomas; Attorney, Andrews & Kurth LLP | | 158 | | Federal Reserve Bank of Dallas |
Raymond Stickel, Jr. — 1944 Trustee | | 2005 | | Retired. Formerly: Director, Mainstay VP Series Funds, Inc. (25 portfolios); Partner, Deloitte & Touche | | 158 | | None |
Robert C. Troccoli — 1949 Trustee | | 2016 | | Adjunct Professor, University of Denver — Daniels College of Business Formerly: Senior Partner, KPMG LLP | | 158 | | None |
Christopher L. Wilson — 1957 Trustee | | 2017 | | Non-executive director and trustee of a number of public and private business corporations Formerly: Managing Partner, CT2, LLC (investing and consulting firm); President/Chief Executive Officer, Columbia Funds, Bank of America Corporation; President/Chief Executive Officer, CDC IXIS Asset Management Services, Inc.; Principal & Director of Operations, Scudder Funds, Scudder, Stevens & Clark, Inc.; Assistant Vice President, Fidelity Investments | | 158 | | TD Asset Management USA Inc. (mutual fund complex) (22 portfolios); ISO New England, Inc. (non-profit organization managing regional electricity market) |
Invesco V.I. Managed Volatility Fund
Trustees and Officers—(continued)
| | | | | | | | |
Name, Year of Birth and
Position(s) Held with the Trust | | Trustee and/
or Officer Since | | Principal Occupation(s)
During Past 5 Years | | Number of
Funds in Fund
Complex
Overseen by
Trustee | | Other Directorship(s)
Held by Trustee During
Past 5 Years |
| Other Officers | | | | | | | | |
Sheri Morris — 1964 President, Principal Executive Officer and Treasurer | | 1999 | | President, Principal Executive Officer and Treasurer, The Invesco Funds; Vice President, Invesco Advisers, Inc. (formerly known as Invesco Institutional (N.A.), Inc.) (registered investment adviser); and Vice President, PowerShares Exchange-Traded Fund Trust, PowerShares Exchange-Traded Fund Trust II, PowerShares India Exchange-Traded Fund Trust, PowerShares Actively Managed Exchange-Traded Fund Trust, PowerShares Actively Managed Exchange-Traded Commodity Fund Trust and PowerShares Exchange-Traded Self-Indexed Fund Trust Formerly: Vice President and Principal Financial Officer, The Invesco Funds; Vice President, Invesco Aim Advisers, Inc., Invesco Aim Capital Management, Inc. and Invesco Aim Private Asset Management, Inc.; Assistant Vice President and Assistant Treasurer, The Invesco Funds and Assistant Vice President, Invesco Advisers, Inc., Invesco Aim Capital Management, Inc. and Invesco Aim Private Asset Management, Inc.; and Treasurer, PowerShares Exchange-Traded Fund Trust, PowerShares Exchange-Traded Fund Trust II, PowerShares India Exchange-Traded Fund Trust and PowerShares Actively Managed Exchange-Traded Fund Trust | | N/A | | N/A |
Russell C. Burk — 1958 Senior Vice President and Senior Officer | | 2005 | | Senior Vice President and Senior Officer, The Invesco Funds | | N/A | | N/A |
John M. Zerr — 1962 Senior Vice President, Chief Legal Officer and Secretary | | 2006 | | Director, Senior Vice President, Secretary and General Counsel, Invesco Management Group, Inc. (formerly known as Invesco AIM Management Group, Inc.); Senior Vice President, Invesco Advisers, Inc. (formerly known as Invesco Institutional (N.A.), Inc.) (registered investment adviser); Senior Vice President and Secretary, Invesco Distributors, Inc. (formerly known as Invesco AIM Distributors, Inc.); Director, Vice President and Secretary, Invesco Investment Services, Inc. (formerly known as Invesco AIM Investment Services, Inc.) Senior Vice President, Chief Legal Officer and Secretary, The Invesco Funds; Managing Director, Invesco PowerShares Capital Management LLC; Director, Secretary and General Counsel, Invesco Investment Advisers LLC (formerly known as Van Kampen Asset Management); Secretary and General Counsel, Invesco Capital Markets, Inc. (formerly known as Van Kampen Funds Inc.) and Chief Legal Officer, PowerShares Exchange-Traded Fund Trust, PowerShares Exchange-Traded Fund Trust II, PowerShares India Exchange-Traded Fund Trust, PowerShares Actively Managed Exchange-Traded Fund Trust, PowerShares Actively Managed Exchange-Traded Commodity Fund Trust and PowerShares Exchange-Traded Self-Indexed Fund Trust; Manager and Secretary, Invesco Indexing LLC Formerly: Director, Secretary, General Counsel and Senior Vice President, Van Kampen Exchange Corp.; Director, Vice President and Secretary, IVZ Distributors, Inc. (formerly known as INVESCO Distributors, Inc.); Director and Vice President, INVESCO Funds Group, Inc.; Director and Vice President, Van Kampen Advisors Inc.; Director, Vice President, Secretary and General Counsel, Van Kampen Investor Services Inc.; Director, Invesco Distributors, Inc. (formerly known as Invesco AIM Distributors, Inc.); Director, Senior Vice President, General Counsel and Secretary, Invesco AIM Advisers, Inc. and Van Kampen Investments Inc.; Director, Vice President and Secretary, Fund Management Company; Director, Senior Vice President, Secretary, General Counsel and Vice President, Invesco AIM Capital Management, Inc.; Chief Operating Officer and General Counsel, Liberty Ridge Capital, Inc. (an investment adviser); Vice President and Secretary, PBHG Funds (an investment company) and PBHG Insurance Series Fund (an investment company); Chief Operating Officer, General Counsel and Secretary, Old Mutual Investment Partners (a broker-dealer); General Counsel and Secretary, Old Mutual Fund Services (an administrator) and Old Mutual Shareholder Services (a shareholder servicing center); Executive Vice President, General Counsel and Secretary, Old Mutual Capital, Inc. (an investment adviser); and Vice President and Secretary, Old Mutual Advisors Funds (an investment company) | | N/A | | N/A |
Gregory G. McGreevey — 1962 Senior Vice President | | 2012 | | Senior Managing Director, Invesco Ltd.; Director, Chairman, President, and Chief Executive Officer, Invesco Advisers, Inc. (formerly known as Invesco Institutional (N.A.), Inc.) (registered investment adviser); Senior Vice President, Invesco Management Group, Inc.; Director, Invesco Mortgage Capital, Inc. and Invesco Senior Secured Management, Inc.; and Senior Vice President, The Invesco Funds Formerly: Assistant Vice President, The Invesco Funds | | N/A | | N/A |
Kelli Gallegos — 1970 Vice President, Principal Financial Officer and Assistant Treasurer | | 2008 | | Vice President, Principal Financial Officer and Assistant Treasurer, The Invesco Funds; Assistant Treasurer, Invesco PowerShares Capital Management LLC, PowerShares Exchange-Traded Fund Trust, PowerShares Exchange-Traded Fund Trust II, PowerShares India Exchange-Traded Fund Trust, PowerShares Actively Managed Exchange-Traded Fund Trust, PowerShares Actively Managed Exchange-Traded Commodity Fund Trust and PowerShares Exchange-Traded Self-Indexed Fund Trust Formerly: Assistant Vice President, The Invesco Funds | | N/A | | N/A |
Invesco V.I. Managed Volatility Fund
Trustees and Officers—(continued)
| | | | | | | | |
Name, Year of Birth and
Position(s) Held with the Trust | | Trustee and/
or Officer Since | | Principal Occupation(s)
During Past 5 Years | | Number of
Funds in Fund
Complex
Overseen by
Trustee | | Other Directorship(s)
Held by Trustee During
Past 5 Years |
| Other Officers—(continued) | | | | | | | | |
Tracy Sullivan — 1962 Vice President, Chief Tax Officer and Assistant Treasurer | | 2008 | | Vice President, Chief Tax Officer and Assistant Treasurer, The Invesco Funds; Assistant Treasurer, Invesco PowerShares Capital Management LLC, PowerShares Exchange-Traded Fund Trust, PowerShares Exchange-Traded Fund Trust II, PowerShares India Exchange-Traded Fund Trust, PowerShares Actively Managed Exchange-Traded Fund Trust, PowerShares Actively Managed Exchange-Traded Commodity Fund Trust and PowerShares Exchange-Traded Self-Indexed Fund Trust Formerly: Assistant Vice President, The Invesco Funds | | N/A | | N/A |
Crissie M. Wisdom — 1969 Anti-Money Laundering Compliance Officer | | 2013 | | Anti-Money Laundering Compliance Officer, Invesco Advisers, Inc. (formerly known as Invesco Institutional (N.A.), Inc.) (registered investment adviser), Invesco Capital Markets, Inc. (formerly known as Van Kampen Funds Inc.), Invesco Distributors, Inc., Invesco Investment Services, Inc., Invesco Management Group, Inc., The Invesco Funds, and PowerShares Exchange-Traded Fund Trust, PowerShares Exchange-Traded Fund Trust II, PowerShares India Exchange-Traded Fund Trust, PowerShares Actively Managed Exchange-Traded Fund Trust, PowerShares Actively Managed Exchange-Traded Commodity Fund Trust and PowerShares Exchange-Traded Self-Indexed Fund Trust; Anti-Money Laundering Compliance Officer and Bank Secrecy Act Officer, INVESCO National Trust Company and Invesco Trust Company; and Fraud Prevention Manager and Controls and Risk Analysis Manager for Invesco Investment Services, Inc. Formerly: Anti-Money Laundering Compliance Officer, Van Kampen Exchange Corp. | | N/A | | N/A |
Robert R. Leveille — 1969 Chief Compliance Officer | | 2016 | | Chief Compliance Officer, Invesco Advisers, Inc. (registered investment adviser); and Chief Compliance Officer, The Invesco Funds Formerly: Chief Compliance Officer, Putnam Investments and the Putnam Funds | | N/A | | N/A |
The Statement of Additional Information of the Trust includes additional information about the Fund’s Trustees and is available upon request, without charge, by calling 1.800.959.4246. Please refer to the Fund’s Statement of Additional Information for information on the Fund’s sub-advisers.
| | | | | | |
Office of the Fund 11 Greenway Plaza, Suite 1000 Houston, TX 77046-1173 | | Investment Adviser Invesco Advisers, Inc. 1555 Peachtree Street, N.E. Atlanta, GA 30309 | | Distributor Invesco Distributors, Inc. 11 Greenway Plaza, Suite 1000 Houston, TX 77046-1173 | | Auditors PricewaterhouseCoopers LLP 1000 Louisiana Street, Suite 5800 Houston, TX 77002-5678 |
| | | |
| | | | | | |
Counsel to the Fund Stradley Ronon Stevens & Young, LLP 2005 Market Street, Suite 2600 Philadelphia, PA 19103-7018 | | Counsel to the Independent Trustees Goodwin Procter LLP 901 New York Avenue, N.W. Washington, D.C. 20001 | | Transfer Agent Invesco Investment Services, Inc. 11 Greenway Plaza, Suite 1000 Houston, TX 77046-1173 | | Custodian State Street Bank and Trust Company 225 Franklin Street Boston, MA 02110-2801 |
Invesco V.I. Managed Volatility Fund
| | | | |
| | |
 | | Annual Report to Shareholders | | December 31, 2017 |
| | |
| | Invesco V.I. Mid Cap Core Equity Fund |

| | |
| | The Fund provides a complete list of its holdings four times in each fiscal year, at the quarter-ends. For the second and fourth quarters, the lists appear in the Fund’s semiannual and annual reports to shareholders. For the first and third quarters, the Fund files the lists with the Securities and Exchange Commission (SEC) on Form N-Q. The Fund’s Form N-Q filings are available on the SEC website, sec.gov. Copies of the Fund’s Forms N-Q may be reviewed and copied at the SEC Public Reference Room in Washington, D.C. You can obtain information on the operation of the Public Reference Room, including information about duplicating fee charges, by calling 202 551 8090 or 800 732 0330, or by electronic request at the following email address: publicinfo@sec.gov. The SEC file numbers for the Fund are 811-07452 and 033-57340. The Fund’s most recent portfolio holdings, as filed on Form N-Q, have also been made available to insurance companies issuing variable annuity contracts and variable life insurance policies (“variable products”) that invest in the Fund. A description of the policies and procedures that the Fund uses to determine how to vote proxies relating to portfolio securities is available without charge, upon request, from our Client Services department at 800 959 4246 or at invesco.com/proxyguidelines. The information is also available on the SEC website, sec.gov. Information regarding how the Fund voted proxies related to its portfolio securities during the most recent 12-month period ended June 30 is available at invesco.com/proxysearch. The information is also available on the SEC website, sec.gov. Invesco Advisers, Inc. is an investment adviser; it provides investment advisory services to individual and institutional clients and does not sell securities. Invesco Distributors, Inc. is the US distributor for Invesco Ltd.’s retail mutual funds, exchange-traded funds and institutional money market funds. Both are wholly owned, indirect subsidiaries of Invesco Ltd. This report must be accompanied or preceded by a currently effective Fund prospectus and variable product prospectus, which contain more complete information, including sales charges and expenses. Investors should read each carefully before investing. NOT FDIC INSURED | MAY LOSE VALUE | NO BANK GUARANTEE |
| | | | |
| | Invesco Distributors, Inc. | | VIMCCE-AR-1 02082018 1418 |
Management’s Discussion of Fund Performance
Performance summary
For the year ended December 31, 2017, Series I shares of Invesco V.I. Mid Cap Core Equity Fund (the Fund) underperformed the Russell Midcap Index, the Fund’s style-specific benchmark.
Your Fund’s long-term performance appears later in this report.
Fund vs. Indexes
Total returns, 12/31/16 to 12/31/17, excluding variable product issuer charges.
If variable product issuer charges were included, returns would be lower.
| | | | | |
| Series I Shares | | | | 14.92 | % |
| Series II Shares | | | | 14.65 | |
| S&P 500 Index▼ (Broad Market Index) | | | | 21.83 | |
| Russell Midcap Index▼ (Style-Specific Index) | | | | 18.52 | |
| Lipper VUF Mid-Cap Core Funds Index∎ (Peer Group Index) | | | | 15.29 | |
Source(s): ▼FactSet Research Systems Inc.; ∎Lipper Inc. | | | | | |
Market conditions and your Fund
Despite highly destructive hurricanes that threatened to derail a years-long economic recovery, the US economy continued to expand throughout the year ended December 31, 2017. Gross domestic product – the value of all goods and services produced in the US – expanded in the first three quarters of 2017. Inflation remained subdued even as unemployment continued its multiyear decline.
Given signs of an improving economy, the US Federal Reserve (the Fed) raised interest rates three times during the reporting period, most recently in December 2017; each rate hike was 25 basis points.1 (A basis point is 0.01%.) The Fed pledged that “realized and expected economic conditions relative to its objectives of maximum employment and 2 percent inflation” will guide its future actions. At the close of the reporting period, Fed policy remained accommodative, and the fed funds target rate stood at a range of 1.25% to 1.50% – 75 basis points higher than at the start of the reporting period.1
Higher inventories and a worsening outlook caused oil prices and many energy stocks to decline during the first half of 2017. However, oil prices rose significantly
in the second half of the reporting period as expectations for lower supplies increased, partly due to continued OPEC production cuts, and demand began normalizing.
Major US stock market indexes repeatedly hit all-time highs throughout the reporting period. The stock market rally that began after the 2016 presidential election continued throughout the reporting period, fueled by generally positive economic data, strong corporate earnings and improved consumer confidence. Finally, after much debate in Congress, a tax reform bill was signed into law in December 2017. While its enactment further strengthened stocks, its effect on the US economy remained uncertain.
During the year, stock selection in the consumer discretionary and materials sectors benefited Fund performance relative to the style-specific benchmark. In addition, underweight exposure to the consumer staples, telecommunication services and utilities sectors contributed to the Fund’s performance. While stock selection in the information technology (IT) sector hindered the Fund’s relative performance, overweight exposure to the sector produced positive overall results. The largest detractors from Fund
performance included stock selection in the health care and energy sectors, as well as underweight exposure to the former and overweight exposure to the latter.
One of the most significant contributors to Fund performance was semiconductor company Teradyne. The company reported strong revenue and earnings growth and benefited from generally strong performance of the IT sector.
The largest home construction company in the US, D.R. Horton, was another top performer for the year. The company’s stock price benefited from positive earnings data and increased activity in homebuilding and remodeling.
IT consulting firm EPAM Systems was also a contributor to Fund performance. The company’s positive performance was attributed to better-than-expected earnings and rising demand for its IT services.
The largest individual detractors from the Fund’s performance versus the style-specific benchmark were natural gas companies Range Resources and Seven Generations Energy. Range Resources underperformed due to disappointing earnings results and a reduction in its forward guidance. Seven Generations Energy received negative market reaction to a slight increase in its 2018 spending plan. Both companies were negatively affected by declining natural gas prices. We sold our position in Range Resources before the close of the reporting period.
Also detracting for the year was media conglomerate Viacom, which declined following disappointing earnings results and worse-than-expected guidance.
Finally, the Fund’s conservative positioning and allocation to cash hampered Fund performance during the year. We have been quite active in deploying cash during periods of market volatility, and we remain focused on putting these assets back to work.
At the close of the reporting period, our largest overweight position relative
| | |
Portfolio Composition |
By sector | | % of total net assets |
| | |
| |
| Information Technology | | 19.9% |
| Industrials | | 15.1 |
| Consumer Discretionary | | 11.7 |
| Financials | | 8.8 |
| Health Care | | 8.3 |
| Materials | | 5.7 |
| Energy | | 4.8 |
| Utilities | | 1.1 |
Money Market Funds Plus Other Assets Less Liabilities | | 24.6 |
| | |
Top 10 Equity Holdings* |
% of total net assets |
| |
1. Teradyne, Inc. | | 2.6% |
2. Dover Corp. | | 2.6 |
3. Stanley Black & Decker Inc. | | 2.4 |
4. Agilent Technologies, Inc. | | 2.3 |
5. EPAM Systems, Inc. | | 2.2 |
6. St. James’s Place PLC | | 2.1 |
7. D.R. Horton, Inc. | | 2.0 |
8. Samsonite International S.A. | | 1.9 |
9. Moody’s Corp. | | 1.9 |
10. Jack Henry & Associates, Inc. | | 1.9 |
| | |
Total Net Assets | | $333.4 million |
| |
| Total Number of Holdings* | | 58 |
The Fund’s holdings are subject to change, and there is no assurance that the Fund will continue to hold any particular security.
* Excluding money market fund holdings.
Data presented here are as of December 31, 2017.
Invesco V.I. Mid Cap Core Equity Fund
to the Russell Midcap Index was in the IT sector. The largest underweight positions were in the consumer staples, health care, real estate and utilities sectors. The Fund also had a slight underweight position in the financials sector.
As always, the Fund focuses on companies that provide an attractive return on invested capital, trade at attractive valuations and have high-quality management teams with a long-term perspective. In short, we seek to take advantage of the market’s volatile behavior and short-term focus. We believe our conservative approach should position the Fund to navigate the evolving economic backdrop.
We thank you for your continued investment in Invesco V.I. Mid Cap Core Equity Fund.
| 1 | Source: US Federal Reserve |
The views and opinions expressed in management’s discussion of Fund performance are those of Invesco Advisers, Inc. These views and opinions are subject to change at any time based on factors such as market and economic conditions. These views and opinions may not be relied upon as investment advice or recommendations, or as an offer for a particular security. The information is not a complete analysis of every aspect of any market, country, industry, security or the Fund. Statements of fact are from sources considered reliable, but Invesco Advisers, Inc. makes no representation or warranty as to their completeness or accuracy. Although historical performance is no guarantee of future results, these insights may help you understand our investment management philosophy.
See important Fund and, if applicable, index disclosures later in this report.
| | |

| | Ronald Sloan Chartered Financial Analyst, Portfolio Manager and Co-Chief Investment Officer of Invesco’s Global Core Equity Team, is lead |
manager of Invesco V.I. Mid Cap Core Equity Fund. He joined Invesco in 1998. Mr. Sloan earned a BS in business administration and an MBA from the University of Missouri. |
| | |

| | Brian Nelson Chartered Financial Analyst, Portfolio Manager, is manager of Invesco V.I. Mid Cap Core Equity Fund. He joined Invesco in 2004. |
Mr. Nelson earned a BA from the University of California, Santa Barbara. |
Assisted by Invesco’s Global Core Equity Team
Invesco V.I. Mid Cap Core Equity Fund
Your Fund’s Long-Term Performance
Results of a $10,000 Investment – Oldest Share Class(es)
Fund and index data from 12/31/07
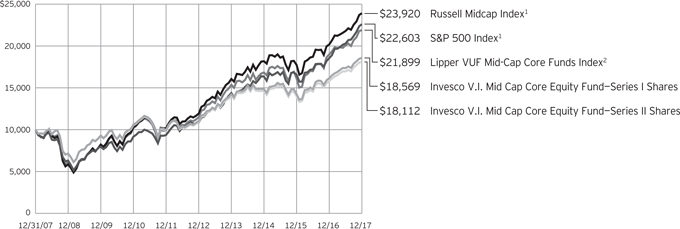
| 1 | Source: FactSet Research Systems Inc. |
Past performance cannot guarantee
comparable future results.
| | | | | |
| |
| Average Annual Total Returns | |
As of 12/31/17 | |
| |
| Series I Shares | | | | | |
| Inception (9/10/01) | | | | 7.73% | |
| 10 Years | | | | 6.38 | |
| 5 Years | | | | 10.97 | |
| 1 Year | | | | 14.92 | |
|
| Series II Shares | |
| Inception (9/10/01) | | | | 7.47% | |
| 10 Years | | | | 6.12 | |
5 Years | | | | 10.69 | |
1 Year | | | | 14.65 | |
The performance of the Fund’s Series I and Series II share classes will differ primarily due to different class expenses.
The performance data quoted represent past performance and cannot guarantee comparable future results; current performance may be lower or higher. Please contact your variable product issuer or financial adviser for the most recent month-end variable product performance. Performance figures reflect Fund expenses, reinvested distributions and changes in net asset value. Investment return and principal value will fluctuate so that you may have a gain or loss when you sell shares.
The net annual Fund operating expense ratio set forth in the most recent Fund prospectus as of the date of this report for Series I and Series II shares was 0.95% and 1.20%, respectively.1 The total annual Fund operating expense ratio set forth in the most recent Fund prospectus as of the date of this report for Series I and Series II shares was 0.97% and 1.22%, respectively. The expense ratios presented above may vary from the expense ratios presented in other sections of this report that are based on expenses incurred during the period covered by this report.
Invesco V.I. Mid Cap Core Equity Fund, a series portfolio of AIM Variable Insurance Funds (Invesco Variable Insurance Funds), is currently offered through insurance companies issuing variable products. You cannot purchase shares of the Fund directly. Performance figures given represent the Fund and are not intended to reflect actual variable product values. They do not reflect sales charges, expenses and fees assessed in connection with a variable product. Sales charges, expenses and fees, which are determined by the variable product issuers, will vary and will lower the total return.
The most recent month-end performance at the Fund level, excluding variable product charges, is available at 800 451 4246. As mentioned above, for the most recent month-end performance including variable product charges, please contact your variable product issuer or financial adviser.
Fund performance reflects any applicable fee waivers and/or expense reimbursements. Had the adviser not waived fees and/or reimbursed expenses currently or in the past, returns would have been lower. See current prospectus for more information.
| 1 | Total annual Fund operating expenses after any contractual fee waivers and/or expense reimbursements by the adviser in effect through at least June 30, 2019. See current prospectus for more information. |
Invesco V.I. Mid Cap Core Equity Fund
Invesco V.I. Mid Cap Core Equity Fund’s investment objective is long-term growth of capital.
| ∎ | | Unless otherwise stated, information presented in this report is as of December 31, 2017, and is based on total net assets. |
| ∎ | | Unless otherwise noted, all data provided by Invesco. |
Principal risks of investing in the Fund
Cash/cash equivalents risk. In rising markets, holding cash or cash equivalents will negatively affect the Fund’s performance relative to its benchmark.
Derivatives risk. The value of a derivative instrument depends largely on (and is derived from) the value of an underlying security, currency, commodity, interest rate, index or other asset (each referred to as an underlying asset). In addition to risks relating to the underlying assets, the use of derivatives may include other, possibly greater, risks, including counter-party, leverage and liquidity risks. Counterparty risk is the risk that the counterparty to the derivative contract will default on its obligation to pay the Fund the amount owed or otherwise perform under the derivative contract. Derivatives create leverage risk because they do not require payment up front equal to the economic exposure created by owning the derivative. As a result, an adverse change in the value of the underlying asset could result in the Fund sustaining a loss that is substantially greater than the amount invested in the derivative, which may make the Fund’s returns more volatile and increase the risk of loss. Derivative instruments may also be less liquid than more traditional investments and the Fund may be unable to sell or close out its derivative positions at a desirable time or price. This risk may be more acute under adverse market conditions, during which the Fund may be most in need of liquidating its derivative positions. Derivatives may also be harder to value, less tax efficient and subject to changing government regulation that could impact the Fund’s ability to use certain derivatives or their cost. Also, derivatives used for hedging or to gain or limit exposure to a particular market segment may not provide the expected benefits, particularly during adverse market conditions.
Emerging markets securities risk. Emerging markets (also referred to as developing markets) are generally subject to greater market volatility, political, social and economic instability, uncertain trading markets and more governmental limitations on foreign investment than more developed markets. In addition, companies operating in emerging markets may be subject to lower trading volume and greater price fluctuations than companies in more developed markets. Securities law and the enforcement of systems of taxation in many emerging market countries may change quickly and
unpredictably. In addition, investments in emerging markets securities may also be subject to additional transaction costs, delays in settlement procedures, and lack of timely information.
Foreign securities risk. The Fund’s foreign investments may be adversely affected by political and social instability, changes in economic or taxation policies, difficulty in enforcing obligations, decreased liquidity or increased volatility. Foreign investments also involve the risk of the possible seizure, nationalization or expropriation of the issuer or foreign deposits (in which the Fund could lose its entire investments in a certain market) and the possible adoption of foreign governmental restrictions such as exchange controls. Unless the Fund has hedged its foreign securities risk, foreign securities risk also involves the risk of negative foreign currency rate fluctuations, which may cause the value of securities denominated in such foreign currency (or other instruments through which the Fund has exposure to foreign currencies) to decline in value. Currency exchange rates may fluctuate significantly over short periods of time. Currency hedging strategies, if used, are not always successful.
Management risk. The Fund is actively managed and depends heavily on the Adviser’s judgment about markets, interest rates or the attractiveness, relative values, liquidity, or potential appreciation of particular investments made for the Fund’s portfolio. The Fund could experience losses if these judgments prove to be incorrect. Additionally, legislative, regulatory, or tax developments may adversely affect management of the Fund and, therefore, the ability of the Fund to achieve its investment objective.
Market risk. The market values of the Fund’s investments, and therefore the value of the Fund’s shares, will go up and down, sometimes rapidly or unpredictably. Market risk may affect a single issuer, industry or section of the economy, or it may affect the market as a whole. Individual stock prices tend to go up and down more dramatically than those of certain other types of investments, such as bonds. During a general downturn in the financial markets, multiple asset classes may decline in value. When markets perform well, there can be no assurance that specific investments held by the Fund will rise in value.
Mid-capitalization companies risk. Mid-capitalization companies tend to be more vulnerable to changing market conditions and may have more limited product lines and markets, less experienced management
and fewer financial resources than larger companies. These companies’ securities may be more volatile and less liquid than those of more established companies, and their returns may vary, sometimes significantly, from the overall securities market.
About indexes used in this report
The S&P 500® Index is an unmanaged index considered representative of the US stock market.
The Russell Midcap® Index is an unmanaged index considered representative of mid-cap stocks. The Russell Midcap Index is a trademark/service mark of the Frank Russell Co. Russell® is a trademark of the Frank Russell Co.
The Lipper VUF Mid-Cap Core Funds Index is an unmanaged index considered representative of mid-cap core variable insurance underlying funds tracked by Lipper.
The Fund is not managed to track the performance of any particular index, including the index(es) described here, and consequently, the performance of the Fund may deviate significantly from the performance of the index(es).
A direct investment cannot be made in an index. Unless otherwise indicated, index results include reinvested dividends, and they do not reflect sales charges. Performance of the peer group, if applicable, reflects fund expenses; performance of a market index does not.
Other information
The returns shown in management’s discussion of Fund performance are based on net asset values calculated for shareholder transactions. Generally accepted accounting principles require adjustments to be made to the net assets of the Fund at period end for financial reporting purposes, and as such, the net asset values for shareholder transactions and the returns based on those net asset values may differ from the net asset values and returns reported in the Financial Highlights. Additionally, the returns and net asset values shown throughout this report are at the Fund level only and do not include variable product issuer charges. If such charges were included, the total returns would be lower.
Industry classifications used in this report are generally according to the Global Industry Classification Standard, which was developed by and is the exclusive property and a service mark of MSCI Inc. and Standard & Poor’s.
Invesco V.I. Mid Cap Core Equity Fund
Schedule of Investments(a)
December 31, 2017
| | | | | | | | |
| | | Shares | | | Value | |
Common Stocks–75.43% | |
| Apparel, Accessories & Luxury Goods–1.93% | |
Samsonite International S.A. | | | 1,399,500 | | | $ | 6,430,653 | |
|
| Application Software–0.94% | |
Synopsys, Inc.(b) | | | 36,942 | | | | 3,148,936 | |
|
| Asset Management & Custody Banks–2.08% | |
St. James’s Place PLC (United Kingdom) | | | 420,210 | | | | 6,945,659 | |
|
| Biotechnology–1.01% | |
BioMarin Pharmaceutical Inc.(b) | | | 37,915 | | | | 3,380,881 | |
|
| Casinos & Gaming–1.79% | |
Wynn Resorts Ltd. | | | 35,439 | | | | 5,974,661 | |
|
| Communications Equipment–1.19% | |
Motorola Solutions, Inc. | | | 43,946 | | | | 3,970,082 | |
|
| Data Processing & Outsourced Services–1.87% | |
Jack Henry & Associates, Inc. | | | 53,358 | | | | 6,240,752 | |
|
| Electronic Components–1.83% | |
Amphenol Corp.–Class A | | | 69,419 | | | | 6,094,988 | |
|
| Electronic Equipment & Instruments–0.49% | |
Keysight Technologies, Inc.(b) | | | 39,194 | | | | 1,630,470 | |
|
| Electronic Manufacturing Services–0.74% | |
IPG Photonics Corp.(b) | | | 11,496 | | | | 2,461,638 | |
|
| Environmental & Facilities Services–1.77% | |
Republic Services, Inc. | | | 58,121 | | | | 3,929,561 | |
Tetra Tech, Inc. | | | 40,875 | | | | 1,968,131 | |
| | | | | | | | 5,897,692 | |
|
| Financial Exchanges & Data–1.87% | |
Moody’s Corp. | | | 42,319 | | | | 6,246,708 | |
|
| General Merchandise Stores–1.77% | |
Dollar General Corp. | | | 63,564 | | | | 5,912,088 | |
|
| Health Care Equipment–3.91% | |
Becton, Dickinson and Co. | | | 3,357 | | | | 718,581 | |
ResMed Inc. | | | 45,827 | | | | 3,881,089 | |
Wright Medical Group N.V.(b) | | | 148,197 | | | | 3,289,973 | |
Zimmer Biomet Holdings, Inc. | | | 42,735 | | | | 5,156,832 | |
| | | | | | | | 13,046,475 | |
|
| Health Care Supplies–1.05% | |
DENTSPLY SIRONA Inc. | | | 53,379 | | | | 3,513,940 | |
|
| Home Furnishings–1.54% | |
Mohawk Industries, Inc.(b) | | | 18,648 | | | | 5,144,983 | |
|
| Homebuilding–2.02% | |
D.R. Horton, Inc. | | | 131,582 | | | | 6,719,893 | |
| | | | | | | | |
| | | Shares | | | Value | |
| Household Appliances–1.11% | |
Whirlpool Corp. | | | 21,861 | | | $ | 3,686,639 | |
|
| Industrial Machinery–12.12% | |
Colfax Corp.(b) | | | 135,893 | | | | 5,384,081 | |
Crane Co. | | | 19,107 | | | | 1,704,726 | |
Dover Corp. | | | 85,485 | | | | 8,633,130 | |
Fortive Corp. | | | 67,510 | | | | 4,884,348 | |
ITT Inc. | | | 81,254 | | | | 4,336,526 | |
Nordson Corp. | | | 27,087 | | | | 3,965,537 | |
Parker-Hannifin Corp. | | | 8,851 | | | | 1,766,483 | |
Stanley Black & Decker Inc. | | | 47,576 | | | | 8,073,171 | |
Timken Co. (The) | | | 33,797 | | | | 1,661,123 | |
| | | | | | | | 40,409,125 | |
|
| Internet Software & Services–1.36% | |
Just Eat PLC (United Kingdom)(b) | | | 430,573 | | | | 4,516,697 | |
|
| IT Consulting & Other Services–2.18% | |
EPAM Systems, Inc.(b) | | | 67,511 | | | | 7,252,707 | |
|
| Life & Health Insurance–1.21% | |
Torchmark Corp. | | | 44,368 | | | | 4,024,621 | |
|
| Life Sciences Tools & Services–2.34% | |
Agilent Technologies, Inc. | | | 116,560 | | | | 7,806,023 | |
|
| Movies & Entertainment–1.54% | |
Viacom Inc.–Class B | | | 166,280 | | | | 5,123,087 | |
|
| Multi-Utilities–1.11% | |
CMS Energy Corp. | | | 78,024 | | | | 3,690,535 | |
|
| Office Services & Supplies–0.71% | |
Société BIC S.A. (France) | | | 21,394 | | | | 2,352,777 | |
|
| Oil & Gas Equipment & Services–1.36% | |
Core Laboratories N.V. | | | 41,386 | | | | 4,533,836 | |
|
| Oil & Gas Exploration & Production–3.42% | |
Concho Resources Inc.(b) | | | 35,273 | | | | 5,298,710 | |
Seven Generations Energy Ltd.–Class A (Canada)(b) | | | 200,520 | | | | 2,836,539 | |
Vermilion Energy, Inc. (Canada) | | | 89,474 | | | | 3,251,788 | |
| | | | | | | | 11,387,037 | |
|
| Paper Packaging–1.33% | |
Packaging Corp. of America | | | 36,822 | | | | 4,438,892 | |
|
| Property & Casualty Insurance–2.77% | |
Arch Capital Group Ltd.(b) | | | 49,909 | | | | 4,530,240 | |
Progressive Corp. (The) | | | 83,617 | | | | 4,709,309 | |
| | | | | | | | 9,239,549 | |
|
| Railroads–0.50% | |
Genesee & Wyoming Inc.–Class A(b) | | | 21,317 | | | | 1,678,287 | |
See accompanying Notes to Financial Statements which are an integral part of the financial statements.
Invesco V.I. Mid Cap Core Equity Fund
| | | | | | | | |
| | | Shares | | | Value | |
| Regional Banks–0.92% | |
First Republic Bank | | | 35,503 | | | $ | 3,075,980 | |
|
| Semiconductor Equipment–4.41% | |
KLA-Tencor Corp. | | | 41,201 | | | | 4,328,989 | |
MKS Instruments, Inc. | | | 17,772 | | | | 1,679,454 | |
Teradyne, Inc. | | | 207,752 | | | | 8,698,576 | |
| | | | | | | | 14,707,019 | |
|
| Semiconductors–4.89% | |
Cypress Semiconductor Corp. | | | 110,839 | | | | 1,689,186 | |
MACOM Technology Solutions Holdings, Inc.(b) | | | 93,485 | | | | 3,042,002 | |
Microchip Technology Inc. | | | 67,665 | | | | 5,946,400 | |
Xilinx, Inc. | | | 83,285 | | | | 5,615,075 | |
| | | | | | | | 16,292,663 | |
|
| Specialty Chemicals–3.83% | |
Albemarle Corp. | | | 31,266 | | | | 3,998,609 | |
International Flavors & Fragrances Inc. | | | 28,377 | | | | 4,330,614 | |
PPG Industries, Inc. | | | 37,965 | | | | 4,435,071 | |
| | | | | | | | 12,764,294 | |
|
| Steel–0.52% | |
Reliance Steel & Aluminum Co. | | | 20,311 | | | | 1,742,481 | |
Total Common Stocks
(Cost $165,791,376) | | | | 251,482,748 | |
| | | | | | | | |
| | | Shares | | | Value | |
Money Market Funds–24.16% | |
Invesco Government & Agency Portfolio–Institutional Class, 1.18%(c) | | | 28,194,364 | | | $ | 28,194,364 | |
Invesco Liquid Assets Portfolio–Institutional Class, 1.40%(c) | | | 20,134,932 | | | | 20,136,946 | |
Invesco Treasury Portfolio–Institutional Class, 1.17%(c) | | | 32,222,130 | | | | 32,222,130 | |
Total Money Market Funds
(Cost $80,555,264) | | | | 80,553,440 | |
TOTAL INVESTMENTS IN SECURITIES–99.59%
(Cost $246,346,640) | | | | 332,036,188 | |
OTHER ASSETS LESS LIABILITIES–0.41% | | | | 1,360,187 | |
NET ASSETS–100.00% | | | | | | $ | 333,396,375 | |
Notes to Schedule of Investments:
| (a) | Industry and/or sector classifications used in this report are generally according to the Global Industry Classification Standard, which was developed by and is the exclusive property and a service mark of MSCI Inc. and Standard & Poor’s. |
| (b) | Non-income producing security. |
| (c) | The money market fund and the Fund are affiliated by having the same investment adviser. The rate shown is the 7-day SEC standardized yield as of December 31, 2017. |
See accompanying Notes to Financial Statements which are an integral part of the financial statements.
Invesco V.I. Mid Cap Core Equity Fund
Statement of Assets and Liabilities
December 31, 2017
Statement of Operations
For the year ended December 31, 2017
| | | | |
Assets: | | | | |
Investments in securities, at value (Cost $165,791,376) | | $ | 251,482,748 | |
Investments in affiliated money market funds, at value (Cost $80,555,264) | | | 80,553,440 | |
Foreign currencies, at value (Cost $2,005) | | | 2,031 | |
Receivable for: | | | | |
Investments sold | | | 2,193,416 | |
Fund shares sold | | | 26,118 | |
Dividends | | | 289,970 | |
Investment for trustee deferred compensation and retirement plans | | | 122,472 | |
Total assets | | | 334,670,195 | |
| |
Liabilities: | | | | |
Payable for: | | | | |
Investments purchased | | | 719,453 | |
Fund shares reacquired | | | 151,768 | |
Accrued fees to affiliates | | | 219,751 | |
Accrued trustees’ and officers’ fees and benefits | | | 716 | |
Accrued other operating expenses | | | 47,158 | |
Trustee deferred compensation and retirement plans | | | 134,974 | |
Total liabilities | | | 1,273,820 | |
Net assets applicable to shares outstanding | | $ | 333,396,375 | |
| |
Net assets consist of: | | | | |
Shares of beneficial interest | | $ | 212,032,409 | |
Undistributed net investment income | | | 860,887 | |
Undistributed net realized gain | | | 34,813,461 | |
Net unrealized appreciation | | | 85,689,618 | |
| | | $ | 333,396,375 | |
| |
Net Assets: | | | | |
Series I | | $ | 192,276,767 | |
Series II | | $ | 141,119,608 | |
|
Shares outstanding, no par value,
with an unlimited number of shares authorized: | |
Series I | | | 13,341,271 | |
Series II | | | 10,000,199 | |
Series I: | | | | |
Net asset value per share | | $ | 14.41 | |
Series II: | | | | |
Net asset value per share | | $ | 14.11 | |
| | | | |
Investment income: | | | | |
Dividends (net of foreign withholding taxes of $77,196) | | $ | 3,801,170 | |
Dividends from affiliated money market funds | | | 530,338 | |
Total investment income | | | 4,331,508 | |
| |
Expenses: | | | | |
Advisory fees | | | 2,400,909 | |
Administrative services fees | | | 577,287 | |
Custodian fees | | | 20,732 | |
Distribution fees — Series II | | | 342,721 | |
Transfer agent fees | | | 43,472 | |
Trustees’ and officers’ fees and benefits | | | 25,145 | |
Reports to shareholders | | | 43,596 | |
Professional services fees | | | 51,987 | |
Other | | | 5,711 | |
Total expenses | | | 3,511,560 | |
Less: Fees waived | | | (71,534 | ) |
Net expenses | | | 3,440,026 | |
Net investment income | | | 891,482 | |
| |
Realized and unrealized gain (loss) from: | | | | |
Net realized gain (loss) from: | | | | |
Investment securities (includes net gains from securities sold to affiliates of $95,107) | | | 34,955,345 | |
Foreign currencies | | | (21,210 | ) |
| | | | 34,934,135 | |
Change in net unrealized appreciation of: | | | | |
Investment securities | | | 9,873,677 | |
Foreign currencies | | | 4,894 | |
| | | | 9,878,571 | |
Net realized and unrealized gain | | | 44,812,706 | |
Net increase in net assets resulting from operations | | $ | 45,704,188 | |
See accompanying Notes to Financial Statements which are an integral part of the financial statements.
Invesco V.I. Mid Cap Core Equity Fund
Statement of Changes in Net Assets
For the years ended December 31, 2017 and 2016
| | | | | | | | |
| | | 2017 | | | 2016 | |
Operations: | | | | | | | | |
Net investment income | | $ | 891,482 | | | $ | 1,492,494 | |
Net realized gain | | | 34,934,135 | | | | 6,883,128 | |
Change in net unrealized appreciation | | | 9,878,571 | | | | 31,767,897 | |
Net increase in net assets resulting from operations | | | 45,704,188 | | | | 40,143,519 | |
| | |
Distributions to shareholders from net investment income: | | | | | | | | |
Series I | | | (1,002,873 | ) | | | (150,245 | ) |
Series ll | | | (437,528 | ) | | | — | |
Total distributions from net investment income | | | (1,440,401 | ) | | | (150,245 | ) |
| | |
Distributions to shareholders from net realized gains: | | | | | | | | |
Series l | | | (3,883,265 | ) | | | (12,808,400 | ) |
Series ll | | | (2,880,476 | ) | | | (8,160,367 | ) |
Total distributions from net realized gains | | | (6,763,741 | ) | | | (20,968,767 | ) |
| | |
Share transactions–net: | | | | | | | | |
Series l | | | (25,346,439 | ) | | | (17,870,780 | ) |
Series ll | | | (4,339,452 | ) | | | 4,467,820 | |
Net increase (decrease) in net assets resulting from share transactions | | | (29,685,891 | ) | | | (13,402,960 | ) |
Net increase in net assets | | | 7,814,155 | | | | 5,621,547 | |
| | |
Net assets: | | | | | | | | |
Beginning of year | | | 325,582,220 | | | | 319,960,673 | |
End of year (includes undistributed net investment income of $860,887 and $1,313,167, respectively) | | $ | 333,396,375 | | | $ | 325,582,220 | |
Notes to Financial Statements
December 31, 2017
NOTE 1—Significant Accounting Policies
Invesco V.I. Mid Cap Core Equity Fund (the “Fund”) is a series portfolio of AIM Variable Insurance Funds (Invesco Variable Insurance Funds) (the “Trust”). The Trust is a Delaware statutory trust registered under the Investment Company Act of 1940, as amended (the “1940 Act”), as an open-end series management investment company consisting of twenty-four separate portfolios, (each constituting a “Fund”). The assets, liabilities and operations of each portfolio are accounted for separately. Information presented in these financial statements pertains only to the Fund. Matters affecting each Fund or class will be voted on exclusively by the shareholders of such Fund or class. Current Securities and Exchange Commission (“SEC”) guidance, however, requires participating insurance companies offering separate accounts to vote shares proportionally in accordance with the instructions of the contract owners whose investments are funded by shares of each Fund or class.
The Fund’s investment objective is long-term growth of capital.
The Fund currently offers two classes of shares, Series I and Series II, both of which are offered to insurance company separate accounts funding variable annuity contracts and variable life insurance policies (“variable products”).
The Fund is an investment company and accordingly follows the investment company accounting and reporting guidance in accordance with Financial Accounting Standards Board Accounting Standards Codification Topic 946, Financial Services — Investment Companies.
The following is a summary of the significant accounting policies followed by the Fund in the preparation of its financial statements.
| A. | Security Valuations — Securities, including restricted securities, are valued according to the following policy. |
A security listed or traded on an exchange (except convertible securities) is valued at its last sales price or official closing price as of the close of the customary trading session on the exchange where the security is principally traded, or lacking any sales or official closing price on a particular day, the security may be valued at the closing bid price on that day. Securities traded in the over-the-counter market are valued based on prices furnished by independent pricing services or market makers. When such securities are valued by an independent pricing service they may be considered fair valued. Futures contracts are valued at the final settlement price set by an exchange on which they are principally traded. Listed options are valued at the mean between the last bid and asked prices from the exchange on which they are principally traded. Options not listed on an exchange are valued by an independent source at the mean between the last bid and asked prices. For purposes of determining net asset value (“NAV”) per share, futures and option contracts generally are valued 15 minutes after the close of the customary trading session of the New York Stock Exchange (“NYSE”).
Investments in open-end and closed-end registered investment companies that do not trade on an exchange are valued at the end-of-day net asset value per share. Investments in open-end and closed-end registered investment companies that trade on an exchange are valued at the last sales price or official closing price as of the close of the customary trading session on the exchange where the security is principally traded.
Invesco V.I. Mid Cap Core Equity Fund
Debt obligations (including convertible securities) and unlisted equities are fair valued using an evaluated quote provided by an independent pricing service. Evaluated quotes provided by the pricing service may be determined without exclusive reliance on quoted prices, and may reflect appropriate factors such as institution-size trading in similar groups of securities, developments related to specific securities, dividend rate (for unlisted equities), yield (for debt obligations), quality, type of issue, coupon rate (for debt obligations), maturity (for debt obligations), individual trading characteristics and other market data. Pricing services generally value debt obligations assuming orderly transactions of institutional round lot size, but a fund may hold or transact in the same securities in smaller, odd lot sizes. Odd lots often trade at lower prices than institutional round lots. Debt obligations are subject to interest rate and credit risks. In addition, all debt obligations involve some risk of default with respect to interest and/or principal payments.
Foreign securities’ (including foreign exchange contracts) prices are converted into U.S. dollar amounts using the applicable exchange rates as of the close of the NYSE. If market quotations are available and reliable for foreign exchange-traded equity securities, the securities will be valued at the market quotations. Because trading hours for certain foreign securities end before the close of the NYSE, closing market quotations may become unreliable. If between the time trading ends on a particular security and the close of the customary trading session on the NYSE, events occur that the investment adviser determines are significant and make the closing price unreliable, the Fund may fair value the security. If the event is likely to have affected the closing price of the security, the security will be valued at fair value in good faith using procedures approved by the Board of Trustees. Adjustments to closing prices to reflect fair value may also be based on a screening process of an independent pricing service to indicate the degree of certainty, based on historical data, that the closing price in the principal market where a foreign security trades is not the current value as of the close of the NYSE. Foreign securities’ prices meeting the approved degree of certainty that the price is not reflective of current value will be priced at the indication of fair value from the independent pricing service. Multiple factors may be considered by the independent pricing service in determining adjustments to reflect fair value and may include information relating to sector indices, American Depositary Receipts and domestic and foreign index futures. Foreign securities may have additional risks including exchange rate changes, potential for sharply devalued currencies and high inflation, political and economic upheaval, the relative lack of issuer information, relatively low market liquidity and the potential lack of strict financial and accounting controls and standards.
Securities for which market prices are not provided by any of the above methods may be valued based upon quotes furnished by independent sources. The last bid price may be used to value equity securities. The mean between the last bid and asked prices is used to value debt obligations, including corporate loans.
Securities for which market quotations are not readily available or became unreliable are valued at fair value as determined in good faith by or under the supervision of the Trust’s officers following procedures approved by the Board of Trustees. Issuer specific events, market trends, bid/asked quotes of brokers and information providers and other market data may be reviewed in the course of making a good faith determination of a security’s fair value.
The Fund may invest in securities that are subject to interest rate risk, meaning the risk that the prices will generally fall as interest rates rise and, conversely, the prices will generally rise as interest rates fall. Specific securities differ in their sensitivity to changes in interest rates depending on their individual characteristics. Changes in interest rates may result in increased market volatility, which may affect the value and/or liquidity of certain Fund investments.
Valuations change in response to many factors including the historical and prospective earnings of the issuer, the value of the issuer’s assets, general economic conditions, interest rates, investor perceptions and market liquidity. Because of the inherent uncertainties of valuation, the values reflected in the financial statements may materially differ from the value received upon actual sale of those investments.
| B. | Securities Transactions and Investment Income — Securities transactions are accounted for on a trade date basis. Realized gains or losses on sales are computed on the basis of specific identification of the securities sold. Interest income (net of withholding tax, if any) is recorded on the accrual basis from settlement date. Dividend income (net of withholding tax, if any) is recorded on the ex-dividend date. |
The Fund may periodically participate in litigation related to Fund investments. As such, the Fund may receive proceeds from litigation settlements. Any proceeds received are included in the Statement of Operations as realized gain (loss) for investments no longer held and as unrealized gain (loss) for investments still held.
Brokerage commissions and mark ups are considered transaction costs and are recorded as an increase to the cost basis of securities purchased and/or a reduction of proceeds on a sale of securities. Such transaction costs are included in the determination of net realized and unrealized gain (loss) from investment securities reported in the Statement of Operations and the Statement of Changes in Net Assets and the net realized and unrealized gains (losses) on securities per share in the Financial Highlights. Transaction costs are included in the calculation of the Fund’s net asset value and, accordingly, they reduce the Fund’s total returns. These transaction costs are not considered operating expenses and are not reflected in net investment income reported in the Statement of Operations and the Statement of Changes in Net Assets, or the net investment income per share and the ratios of expenses and net investment income reported in the Financial Highlights, nor are they limited by any expense limitation arrangements between the Fund and the investment adviser.
The Fund allocates income and realized and unrealized capital gains and losses to a class based on the relative net assets of each class.
| C. | Country Determination — For the purposes of making investment selection decisions and presentation in the Schedule of Investments, the investment adviser may determine the country in which an issuer is located and/or credit risk exposure based on various factors. These factors include the laws of the country under which the issuer is organized, where the issuer maintains a principal office, the country in which the issuer derives 50% or more of its total revenues and the country that has the primary market for the issuer’s securities, as well as other criteria. Among the other criteria that may be evaluated for making this determination are the country in which the issuer maintains 50% or more of its assets, the type of security, financial guarantees and enhancements, the nature of the collateral and the sponsor organization. Country of issuer and/or credit risk exposure has been determined to be the United States of America, unless otherwise noted. |
| D. | Distributions — Distributions from net investment income and net realized capital gain, if any, are generally declared and paid to separate accounts of participating insurance companies annually and recorded on the ex-dividend date. |
| E. | Federal Income Taxes — The Fund intends to comply with the requirements of Subchapter M of the Internal Revenue Code of 1986, as amended (the “Internal Revenue Code”), necessary to qualify as a regulated investment company and to distribute substantially all of the Fund’s taxable earnings to shareholders. As such, the Fund will not be subject to federal income taxes on otherwise taxable income (including net realized capital gain) that is distributed to shareholders. Therefore, no provision for federal income taxes is recorded in the financial statements. |
Invesco V.I. Mid Cap Core Equity Fund
The Fund recognizes the tax benefits of uncertain tax positions only when the position is more likely than not to be sustained. Management has analyzed the Fund’s uncertain tax positions and concluded that no liability for unrecognized tax benefits should be recorded related to uncertain tax positions. Management is not aware of any tax positions for which it is reasonably possible that the total amounts of unrecognized tax benefits will change materially in the next 12 months.
The Fund files tax returns in the U.S. Federal jurisdiction and certain other jurisdictions. Generally, the Fund is subject to examinations by such taxing authorities for up to three years after the filing of the return for the tax period.
| F. | Expenses — Fees provided for under the Rule 12b-1 plan of a particular class of the Fund and which are directly attributable to that class are charged to the operations of such class. All other expenses are allocated among the classes based on relative net assets. |
| G. | Accounting Estimates — The preparation of financial statements in conformity with accounting principles generally accepted in the United States of America (“GAAP”) requires management to make estimates and assumptions that affect the reported amounts of assets and liabilities at the date of the financial statements and the reported amounts of revenues and expenses during the reporting period including estimates and assumptions related to taxation. Actual results could differ from those estimates by a significant amount. In addition, the Fund monitors for material events or transactions that may occur or become known after the period-end date and before the date the financial statements are released to print. |
| H. | Indemnifications — Under the Trust’s organizational documents, each Trustee, officer, employee or other agent of the Trust is indemnified against certain liabilities that may arise out of the performance of their duties to the Fund. Additionally, in the normal course of business, the Fund enters into contracts, including the Fund’s servicing agreements, that contain a variety of indemnification clauses. The Fund’s maximum exposure under these arrangements is unknown as this would involve future claims that may be made against the Fund that have not yet occurred. The risk of material loss as a result of such indemnification claims is considered remote. |
| I. | Foreign Currency Translations — Foreign currency is valued at the close of the NYSE based on quotations posted by banks and major currency dealers. Portfolio securities and other assets and liabilities denominated in foreign currencies are translated into U.S. dollar amounts at date of valuation. Purchases and sales of portfolio securities (net of foreign taxes withheld on disposition) and income items denominated in foreign currencies are translated into U.S. dollar amounts on the respective dates of such transactions. The Fund does not separately account for the portion of the results of operations resulting from changes in foreign exchange rates on investments and the fluctuations arising from changes in market prices of securities held. The combined results of changes in foreign exchange rates and the fluctuation of market prices on investments (net of estimated foreign tax withholding) are included with the net realized and unrealized gain or loss from investments in the Statement of Operations. Reported net realized foreign currency gains or losses arise from (1) sales of foreign currencies, (2) currency gains or losses realized between the trade and settlement dates on securities transactions, and (3) the difference between the amounts of dividends, interest, and foreign withholding taxes recorded on the Fund’s books and the U.S. dollar equivalent of the amounts actually received or paid. Net unrealized foreign currency gains and losses arise from changes in the fair values of assets and liabilities, other than investments in securities at fiscal period end, resulting from changes in exchange rates. |
The Fund may invest in foreign securities, which may be subject to foreign taxes on income, gains on investments or currency repatriation, a portion of which may be recoverable. Foreign taxes, if any, are recorded based on the tax regulations and rates that exist in the foreign markets in which the Fund invests and are shown in the Statement of Operations.
| J. | Forward Foreign Currency Contracts — The Fund may engage in foreign currency transactions either on a spot (i.e. for prompt delivery and settlement) basis, or through forward foreign currency contracts, to manage or minimize currency or exchange rate risk. |
The Fund may also enter into forward foreign currency contracts for the purchase or sale of a security denominated in a foreign currency in order to “lock in” the U.S. dollar price of that security, or the Fund may also enter into forward foreign currency contracts that do not provide for physical settlement of the two currencies, but instead are settled by a single cash payment calculated as the difference between the agreed upon exchange rate and the spot rate at settlement based upon an agreed upon notional amount (non-deliverable forwards). The Fund will set aside liquid assets in an amount equal to the daily mark-to-market obligation for forward foreign currency contracts.
A forward foreign currency contract is an obligation between two parties (“Counterparties”) to purchase or sell a specific currency for an agreed-upon price at a future date. The use of forward foreign currency contracts does not eliminate fluctuations in the price of the underlying securities the Fund owns or intends to acquire but establishes a rate of exchange in advance. Fluctuations in the value of these contracts are measured by the difference in the contract date and reporting date exchange rates and are recorded as unrealized appreciation (depreciation) until the contracts are closed. When the contracts are closed, realized gains (losses) are recorded. Realized and unrealized gains (losses) on the contracts are included in the Statement of Operations. The primary risks associated with forward foreign currency contracts include failure of the Counterparty to meet the terms of the contract and the value of the foreign currency changing unfavorably. These risks may be in excess of the amounts reflected in the Statement of Assets and Liabilities.
NOTE 2—Advisory Fees and Other Fees Paid to Affiliates
The Trust has entered into a master investment advisory agreement with Invesco Advisers, Inc. (the “Adviser” or “Invesco”). Under the terms of the investment advisory agreement, the Fund accrues daily and pays monthly an advisory fee to the Adviser based on the annual rate of the Fund’s average daily net assets as follows:
| | | | | | | | |
| Average Daily Net Assets | | Rate | |
First $500 million | | | 0 | .725% | | | | |
Next $500 million | | | 0 | .70% | | | | |
Next $500 million | | | 0 | .675% | | | | |
Over $1.5 billion | | | 0 | .65% | | | | |
For the year ended December 31, 2017, the effective advisory fees incurred by the Fund was 0.725%.
Under the terms of a master sub-advisory agreement between the Adviser and each of Invesco Asset Management Deutschland GmbH, Invesco Asset Management Limited, Invesco Asset Management (Japan) Limited, Invesco Hong Kong Limited, Invesco Senior Secured Management, Inc. and
Invesco V.I. Mid Cap Core Equity Fund
Invesco Canada Ltd. and separate sub-advisory agreements with Invesco PowerShares Capital Management LLC and Invesco Asset Management (India) Private Limited (collectively, the “Affiliated Sub-Advisers”) the Adviser, not the Fund, will pay 40% of the fees paid to the Adviser to any such Affiliated Sub-Adviser(s) that provide(s) discretionary investment management services to the Fund based on the percentage of assets allocated to such Affiliated Sub-Adviser(s).
The Adviser has contractually agreed, through at least June 30, 2018, to waive advisory fees and/or reimburse expenses to the extent necessary to limit total annual operating expenses after fee waiver and/or expense reimbursement (excluding certain items discussed below) of Series I shares to 2.00% and Series II shares to 2.25% of average daily net assets (the “expense limits”). In determining the Adviser’s obligation to waive advisory fees and/or reimburse expenses, the following expenses are not taken into account, and could cause the total annual fund operating expenses after fee waiver and/or expense reimbursement to exceed the numbers reflected above: (1) interest; (2) taxes; (3) dividend expense on short sales; (4) extraordinary or non-routine items, including litigation expenses; and (5) expenses that the Fund has incurred but did not actually pay because of an expense offset arrangement. Unless Invesco continues the fee waiver agreement, it will terminate on June 30, 2018. During its term, the fee waiver agreement cannot be terminated or amended to increase expense limits or reduce the advisory fee waiver without approval of the Board of Trustees. The Adviser did not waive fees and/or reimburse expenses during the period under these expense limits.
Further, the Adviser has contractually agreed, through at least June 30, 2019, to waive the advisory fee payable by the Fund in an amount equal to 100% of the net advisory fees the Adviser receives from the affiliated money market funds on investments by the Fund of uninvested cash in such affiliated money market funds.
For the year ended December 31, 2017, the Adviser waived advisory fees of $71,534.
The Trust has entered into a master administrative services agreement with Invesco pursuant to which the Fund has agreed to pay Invesco a fee for costs incurred in providing accounting services and fund administrative services to the Fund and to reimburse Invesco for fees paid to insurance companies that have agreed to provide certain administrative services to the Fund. These administrative services provided by the insurance companies may include, among other things: maintenance of master accounts with the Fund; tracking, recording and transmitting net purchase and redemption orders for Fund shares; maintaining and preserving records related to the purchase, redemption and other account activity of variable product owners; distributing copies of Fund documents such as prospectuses, proxy materials and periodic reports, to variable product owners, and responding to inquiries from variable product owners about the Fund. Pursuant to such agreement, for the year ended December 31, 2017, Invesco was paid $81,167 for accounting and fund administrative services and was reimbursed $496,120 for fees paid to insurance companies.
The Trust has entered into a transfer agency and service agreement with Invesco Investment Services, Inc. (“IIS”) pursuant to which the Fund has agreed to pay IIS a fee for providing transfer agency and shareholder services to the Fund and reimburse IIS for certain expenses incurred by IIS in the course of providing such services. For the year ended December 31, 2017, expenses incurred under the agreement are shown in the Statement of Operations as Transfer agent fees.
The Trust has entered into a master distribution agreement with Invesco Distributors, Inc. (“IDI”) to serve as the distributor for the Fund. The Trust has adopted a plan pursuant to Rule 12b-1 under the 1940 Act with respect to the Fund’s Series II shares (the “Plan”). The Fund, pursuant to the Plan, pays IDI compensation at the annual rate of 0.25% of the Fund’s average daily net assets of Series II shares. The fees are accrued daily and paid monthly. Of the Plan payments, up to 0.25% of the average daily net assets of the Series II shares may be paid to insurance companies who furnish continuing personal shareholder services to customers who purchase and own Series II shares of the Fund. For the year ended December 31, 2017, expenses incurred under the Plan are detailed in the Statement of Operations as Distribution fees .
For the year ended December 31, 2017, the Fund incurred $147 in brokerage commissions with Invesco Capital Markets, Inc., an affiliate of the Adviser and IDI, for portfolio transactions executed on behalf of the Fund.
Certain officers and trustees of the Trust are officers and directors of the Adviser, IIS and/or IDI.
NOTE 3—Additional Valuation Information
GAAP defines fair value as the price that would be received to sell an asset or paid to transfer a liability in an orderly transaction between market participants at the measurement date, under current market conditions. GAAP establishes a hierarchy that prioritizes the inputs to valuation methods, giving the highest priority to readily available unadjusted quoted prices in an active market for identical assets (Level 1) and the lowest priority to significant unobservable inputs (Level 3), generally when market prices are not readily available or are unreliable. Based on the valuation inputs, the securities or other investments are tiered into one of three levels. Changes in valuation methods may result in transfers in or out of an investment’s assigned level:
| | Level 1 — | Prices are determined using quoted prices in an active market for identical assets. |
| | Level 2 — | Prices are determined using other significant observable inputs. Observable inputs are inputs that other market participants may use in pricing a security. These may include quoted prices for similar securities, interest rates, prepayment speeds, credit risk, yield curves, loss severities, default rates, discount rates, volatilities and others. |
| | Level 3 — | Prices are determined using significant unobservable inputs. In situations where quoted prices or observable inputs are unavailable (for example, when there is little or no market activity for an investment at the end of the period), unobservable inputs may be used. Unobservable inputs reflect the Fund’s own assumptions about the factors market participants would use in determining fair value of the securities or instruments and would be based on the best available information. |
The following is a summary of the tiered valuation input levels, as of December 31, 2017. The level assigned to the securities valuations may not be an indication of the risk or liquidity associated with investing in those securities. Because of the inherent uncertainties of valuation, the values reflected in the financial statements may materially differ from the value received upon actual sale of those investments.
Invesco V.I. Mid Cap Core Equity Fund
The Fund’s policy is to recognize transfers in and out of the valuation levels as of the end of the reporting period. During the year ended December 31, 2017, there were no material transfers between valuation levels.
| | | | | | | | | | | | | | | | |
| | | Level 1 | | | Level 2 | | | Level 3 | | | Total | |
| Investments in Securities | | | | | | | | | | | | |
Common Stocks | | $ | 240,020,392 | | | $ | 11,462,356 | | | $ | — | | | $ | 251,482,748 | |
Money Market Funds | | | 80,553,440 | | | | — | | | | — | | | | 80,553,440 | |
Total Investments | | $ | 320,573,832 | | | $ | 11,462,356 | | | $ | — | | | $ | 332,036,188 | |
NOTE 4—Security Transactions with Affiliated Funds
The Fund is permitted to purchase or sell securities from or to certain other Invesco Funds under specified conditions outlined in procedures adopted by the Board of Trustees of the Trust. The procedures have been designed to ensure that any purchase or sale of securities by the Fund from or to another fund or portfolio that is or could be considered an affiliate by virtue of having a common investment adviser (or affiliated investment advisers), common Trustees and/or common officers complies with Rule 17a-7 of the 1940 Act. Further, as defined under the procedures, each transaction is effected at the current market price. Pursuant to these procedures, for the year ended December 31, 2017, the Fund engaged in securities sales of $2,933,554, which resulted in net realized gains of $95,107.
NOTE 5—Trustees’ and Officers’ Fees and Benefits
Trustees’ and Officers’ Fees and Benefits include amounts accrued by the Fund to pay remuneration to certain Trustees and Officers of the Fund. Trustees have the option to defer compensation payable by the Fund, and Trustees’ and Officers’ Fees and Benefits also include amounts accrued by the Fund to fund such deferred compensation amounts. Those Trustees who defer compensation have the option to select various Invesco Funds in which their deferral accounts shall be deemed to be invested. Finally, certain current Trustees were eligible to participate in a retirement plan that provided for benefits to be paid upon retirement to Trustees over a period of time based on the number of years of service. The Fund may have certain former Trustees who also participate in a retirement plan and receive benefits under such plan. Trustees’ and Officers’ Fees and Benefits include amounts accrued by the Fund to fund such retirement benefits. Obligations under the deferred compensation and retirement plans represent unsecured claims against the general assets of the Fund.
NOTE 6—Cash Balances
The Fund is permitted to temporarily carry a negative or overdrawn balance in its account with State Street Bank and Trust Company, the custodian bank. Such balances, if any at period-end, are shown in the Statement of Assets and Liabilities under the payable caption Amount due custodian. To compensate the custodian bank for such overdrafts, the overdrawn Fund may either (1) leave funds as a compensating balance in the account so the custodian bank can be compensated by earning the additional interest; or (2) compensate by paying the custodian bank at a rate agreed upon by the custodian bank and Invesco, not to exceed the contractually agreed upon rate.
NOTE 7—Distributions to Shareholders and Tax Components of Net Assets
Tax Character of Distributions to Shareholders Paid During the Fiscal Years Ended December 31, 2017 and 2016:
| | | | | | | | |
| | | 2017 | | | 2016 | |
Ordinary income | | $ | 2,926,214 | | | $ | 4,117,708 | |
Long-term capital gain | | | 5,277,928 | | | | 17,001,304 | |
Total distributions | | $ | 8,204,142 | | | $ | 21,119,012 | |
Tax Components of Net Assets at Period-End:
| | | | |
| | | 2017 | |
Undistributed ordinary income | | $ | 977,777 | |
Undistributed long-term gain | | | 34,814,533 | |
Net unrealized appreciation — investments | | | 85,688,476 | |
Net unrealized appreciation — foreign currencies | | | 70 | |
Temporary book/tax differences | | | (116,890 | ) |
Shares of beneficial interest | | | 212,032,409 | |
Total net assets | | $ | 333,396,375 | |
The difference between book-basis and tax-basis unrealized appreciation (depreciation) is due to differences in the timing of recognition of gains and losses on investments for tax and book purposes. The Fund’s net unrealized appreciation difference is attributable primarily to wash sales.
The temporary book/tax differences are a result of timing differences between book and tax recognition of income and/or expenses. The Fund’s temporary book/tax differences are the result of the trustee deferral of compensation and retirement plan benefits.
Capital loss carryforward is calculated and reported as of a specific date. Results of transactions and other activity after that date may affect the amount of capital loss carryforward actually available for the Fund to utilize. Capital losses generated in years beginning after December 22, 2010 can be carried forward for an unlimited period, whereas previous losses expire in eight tax years. Capital losses with an expiration period may not be used to offset capital gains until all net capital losses without an expiration date have been utilized. Capital loss carryforwards with no expiration date
Invesco V.I. Mid Cap Core Equity Fund
will retain their character as either short-term or long-term capital losses instead of as short-term capital losses as under prior law. The ability to utilize capital loss carryforwards in the future may be limited under the Internal Revenue Code and related regulations based on the results of future transactions.
The Fund does not have a capital loss carryforward as of December 31, 2017.
NOTE 8—Investment Transactions
The aggregate amount of investment securities (other than short-term securities, U.S. Treasury obligations and money market funds, if any) purchased and sold by the Fund during the year ended December 31, 2017 was $120,816,218 and $186,543,086, respectively. Cost of investments, including any derivatives, on a tax basis includes the adjustments for financial reporting purposes as of the most recently completed federal income tax reporting period-end.
| | | | |
| Unrealized Appreciation (Depreciation) of Investments on a Tax Basis | |
Aggregate unrealized appreciation of investments | | $ | 90,655,718 | |
Aggregate unrealized (depreciation) of investments | | | (4,967,242 | ) |
Net unrealized appreciation of investments | | $ | 85,688,476 | |
Cost of investments for tax purposes is $246,347,712.
NOTE 9—Reclassification of Permanent Differences
Primarily as a result of differing book/tax treatment of real estate investment trust distributions, return of capital adjustments and foreign currency transactions, on December 31, 2017, undistributed net investment income was increased by $96,639, undistributed net realized gain was decreased by $47,685 and shares of beneficial interest was decreased by $48,954. This reclassification had no effect on the net assets of the Fund.
NOTE 10—Share Information
| | | | | | | | | | | | | | | | |
| | | Summary of Share Activity | |
| | | Years ended December 31, | |
| | | 2017(a) | | | 2016 | |
| | | Shares | | | Amount | | | Shares | | | Amount | |
Sold: | | | | | | | | | | | | | | | | |
Series I | | | 246,444 | | | $ | 3,379,997 | | | | 690,232 | | | $ | 8,736,328 | |
Series II | | | 1,068,806 | | | | 14,280,075 | | | | 1,380,934 | | | | 16,624,301 | |
| | | | |
Issued as reinvestment of dividends: | | | | | | | | | | | | | | | | |
Series I | | | 355,873 | | | | 4,886,138 | | | | 1,025,209 | | | | 12,958,645 | |
Series II | | | 246,692 | | | | 3,318,004 | | | | 658,626 | | | | 8,160,367 | |
| | | | |
Reacquired: | | | | | | | | | | | | | | | | |
Series I | | | (2,449,096 | ) | | | (33,612,574 | ) | | | (3,166,296 | ) | | | (39,565,753 | ) |
Series II | | | (1,632,724 | ) | | | (21,937,531 | ) | | | (1,649,202 | ) | | | (20,316,848 | ) |
Net increase (decrease) in share activity | | | (2,164,005 | ) | | $ | (29,685,891 | ) | | | (1,060,497 | ) | | $ | (13,402,960 | ) |
| (a) | There are entities that are record owners of more than 5% of the outstanding shares of the Fund and in the aggregate own 56% of the outstanding shares of the Fund. The Fund and the Fund’s principal underwriter or adviser, are parties to participation agreements with these entities whereby these entities sell units of interest in separate accounts funding variable products that are invested in the Fund. The Fund, Invesco and/or Invesco affiliates may make payments to these entities, which are considered to be related to the Fund, for providing services to the Fund, Invesco and/or Invesco affiliates including but not limited to services such as, securities brokerage, third party record keeping and account servicing and administrative services. The Fund has no knowledge as to whether all or any portion of the shares owned of record by these entities are also owned beneficially. |
Invesco V.I. Mid Cap Core Equity Fund
NOTE 11—Financial Highlights
The following schedule presents financial highlights for a share of the Fund outstanding throughout the periods indicated.
| | | | | | | | | | | | | | | | | | | | | | | | | | | | | | | | | | | | | | | | | | | | | | | | | | | | | | | | |
| | | Net asset value, beginning of period | | | Net investment income
(loss)(a) | | | Net gains (losses) on securities (both realized and unrealized) | | | Total from investment
operations | | | Dividends from net investment
income | | | Distributions from net
realized
gains | | | Total distributions | | | Net asset
value, end of period | | | Total return(b) | | | Net assets, end of period (000’s omitted) | | | Ratio of expenses to average net assets with fee waivers and/or expenses absorbed | | | Ratio of expenses
to average net assets without fee waivers
and/or expenses absorbed | | | Ratio of net investment
income
(loss) to average
net assets | | | Portfolio
turnover(c) | |
Series I | | | | | | | | | | | | | | | | | | | | | | | | | | | | | | | | | | | | | | | | | | | | | | | | | | | | | | | | |
Year ended 12/31/17 | | $ | 12.87 | | | $ | 0.05 | | | $ | 1.85 | | | $ | 1.90 | | | $ | (0.07 | ) | | $ | (0.29 | ) | | $ | (0.36 | ) | | $ | 14.41 | | | | 14.92 | % | | $ | 192,277 | | | | 0.94 | %(d) | | | 0.96 | %(d) | | | 0.37 | %(d) | | | 45 | % |
Year ended 12/31/16 | | | 12.12 | | | | 0.07 | | | | 1.54 | | | | 1.61 | | | | (0.01 | ) | | | (0.85 | ) | | | (0.86 | ) | | | 12.87 | | | | 13.43 | | | | 195,464 | | | | 0.98 | | | | 1.00 | | | | 0.57 | | | | 29 | |
Year ended 12/31/15 | | | 14.06 | | | | 0.02 | | | | (0.58 | ) | | | (0.56 | ) | | | (0.05 | ) | | | (1.33 | ) | | | (1.38 | ) | | | 12.12 | | | | (4.03 | ) | | | 201,685 | | | | 1.01 | | | | 1.03 | | | | 0.17 | | | | 44 | |
Year ended 12/31/14 | | | 15.13 | | | | 0.05 | | | | 0.64 | | | | 0.69 | | | | (0.01 | ) | | | (1.75 | ) | | | (1.76 | ) | | | 14.06 | | | | 4.43 | | | | 254,553 | | | | 1.01 | | | | 1.04 | | | | 0.29 | | | | 38 | |
Year ended 12/31/13 | | | 12.71 | | | | 0.01 | | | | 3.59 | | | | 3.60 | | | | (0.11 | ) | | | (1.07 | ) | | | (1.18 | ) | | | 15.13 | | | | 28.81 | | | | 290,550 | | | | 1.01 | | | | 1.04 | | | | 0.09 | | | | 34 | |
Series II | | | | | | | | | | | | | | | | | | | | | | | | | | | | | | | | | | | | | | | | | | | | | | | | | | | | | | | | |
Year ended 12/31/17 | | | 12.61 | | | | 0.02 | | | | 1.81 | | | | 1.83 | | | | (0.04 | ) | | | (0.29 | ) | | | (0.33 | ) | | | 14.11 | | | | 14.65 | | | | 141,120 | | | | 1.19 | (d) | | | 1.21 | (d) | | | 0.12 | (d) | | | 45 | |
Year ended 12/31/16 | | | 11.91 | | | | 0.04 | | | | 1.51 | | | | 1.55 | | | | — | | | | (0.85 | ) | | | (0.85 | ) | | | 12.61 | | | | 13.16 | | | | 130,118 | | | | 1.23 | | | | 1.25 | | | | 0.32 | | | | 29 | |
Year ended 12/31/15 | | | 13.84 | | | | (0.01 | ) | | | (0.57 | ) | | | (0.58 | ) | | | (0.02 | ) | | | (1.33 | ) | | | (1.35 | ) | | | 11.91 | | | | (4.28 | ) | | | 118,276 | | | | 1.26 | | | | 1.28 | | | | (0.08 | ) | | | 44 | |
Year ended 12/31/14 | | | 14.95 | | | | 0.01 | | | | 0.63 | | | | 0.64 | | | | — | | | | (1.75 | ) | | | (1.75 | ) | | | 13.84 | | | | 4.17 | | | | 128,305 | | | | 1.26 | | | | 1.29 | | | | 0.04 | | | | 38 | |
Year ended 12/31/13 | | | 12.58 | | | | (0.02 | ) | | | 3.54 | | | | 3.52 | | | | (0.08 | ) | | | (1.07 | ) | | | (1.15 | ) | | | 14.95 | | | | 28.46 | | | | 117,219 | | | | 1.26 | | | | 1.29 | | | | (0.16 | ) | | | 34 | |
| (a) | Calculated using average shares outstanding. |
| (b) | Includes adjustments in accordance with accounting principles generally accepted in the United States of America and as such, the net asset value for financial reporting purposes and the returns based upon those net asset values may differ from the net asset value and returns for shareholder transactions. Total returns are not annualized for periods less than one year, if applicable and do not reflect charges assessed in connection with a variable product, which if included would reduce total returns. |
| (c) | Portfolio turnover is calculated at the fund level and is not annualized for periods less than one year, if applicable. |
| (d) | Ratios are based on average daily net assets (000’s omitted) of $194,071 and $137,089 for Series I and Series II shares, respectively. |
Invesco V.I. Mid Cap Core Equity Fund
Report of Independent Registered Public Accounting Firm
To the Board of Trustees of AIM Variable Insurance Funds (Invesco Variable Insurance Funds) and Shareholders of Invesco V.I. Mid Cap Core Equity Fund
Opinion on the Financial Statements
We have audited the accompanying statement of assets and liabilities, including the schedule of investments, of Invesco V.I. Mid Cap Core Equity Fund (one of the funds constituting AIM Variable Insurance Funds (Invesco Variable Insurance Funds), hereafter referred to as the “Fund”) as of December 31, 2017, the related statement of operations for the year ended December 31, 2017, the statement of changes in net assets for each of the two years in the period ended December 31, 2017, including the related notes, and the financial highlights for each of the five years in the period ended December 31, 2017 (collectively referred to as the “financial statements”). In our opinion, the financial statements present fairly, in all material respects, the financial position of the Fund as of December 31, 2017, the results of its operations for the year then ended, the changes in its net assets for each of the two years in the period ended December 31, 2017 and the financial highlights for each of the five years in the period ended December 31, 2017 in conformity with accounting principles generally accepted in the United States of America.
Basis for Opinion
These financial statements are the responsibility of the Fund’s management. Our responsibility is to express an opinion on the Fund’s financial statements based on our audits. We are a public accounting firm registered with the Public Company Accounting Oversight Board (United States) (“PCAOB”) and are required to be independent with respect to the Fund in accordance with the U.S. federal securities laws and the applicable rules and regulations of the Securities and Exchange Commission and the PCAOB.
We conducted our audits of these financial statements in accordance with the standards of the PCAOB. Those standards require that we plan and perform the audit to obtain reasonable assurance about whether the financial statements are free of material misstatement, whether due to error or fraud.
Our audits included performing procedures to assess the risks of material misstatement of the financial statements, whether due to error or fraud, and performing procedures that respond to those risks. Such procedures included examining, on a test basis, evidence regarding the amounts and disclosures in the financial statements. Our audits also included evaluating the accounting principles used and significant estimates made by management, as well as evaluating the overall presentation of the financial statements. Our procedures included confirmation of securities owned as of December 31, 2017 by correspondence with the custodian, transfer agent and brokers; when replies were not received from brokers, we performed other auditing procedures. We believe that our audits provide a reasonable basis for our opinion.
PricewaterhouseCoopers LLP
Houston, TX
February 14, 2018
We have served as the auditor of one or more of the investment companies in the Invesco/PowerShares group of investment companies since at least 1995. We have not determined the specific year we began serving as auditor.
Invesco V.I. Mid Cap Core Equity Fund
Calculating your ongoing Fund expenses
Example
As a shareholder of the Fund, you incur ongoing costs, including management fees; distribution and/or service fees (12b-1); and other Fund expenses. This example is intended to help you understand your ongoing costs (in dollars) of investing in the Fund and to compare these costs with ongoing costs of investing in other mutual funds. The example is based on an investment of $1,000 invested at the beginning of the period and held for the entire period July 1, 2017 through December 31, 2017.
The actual and hypothetical expenses in the examples below do not represent the effect of any fees or other expenses assessed in connection with a variable product; if they did, the expenses shown would be higher while the ending account values shown would be lower.
Actual expenses
The table below provides information about actual account values and actual expenses. You may use the information in this table, together with the amount you invested, to estimate the expenses that you paid over the period. Simply divide your account value by $1,000 (for example, an $8,600 account value divided by $1,000 = 8.6), then multiply the result by the number in the table under the heading entitled “Actual Expenses Paid During Period” to estimate the expenses you paid on your account during this period.
Hypothetical example for comparison purposes
The table below also provides information about hypothetical account values and hypothetical expenses based on the Fund’s actual expense ratio and an assumed rate of return of 5% per year before expenses, which is not the Fund’s actual return.
The hypothetical account values and expenses may not be used to estimate the actual ending account balance or expenses you paid for the period. You may use this information to compare the ongoing costs of investing in the Fund and other funds. To do so, compare this 5% hypothetical example with the 5% hypothetical examples that appear in the shareholder reports of the other funds.
Please note that the expenses shown in the table are meant to highlight your ongoing costs. Therefore, the hypothetical information is useful in comparing ongoing costs, and will not help you determine the relative total costs of owning different funds.
| | | | | | | | | | | | | | | | | | | | | | | | |
| Class | | Beginning
Account Value
(07/01/17) | | | ACTUAL | | | HYPOTHETICAL
(5% annual return before
expenses) | | | Annualized Expense
Ratio | |
| | | Ending
Account Value
(12/31/17)1 | | | Expenses
Paid During
Period2 | | | Ending
Account Value
(12/31/17) | | | Expenses
Paid During
Period2 | | |
Series I | | $ | 1,000.00 | | | $ | 1,070.20 | | | $ | 4.90 | | | $ | 1,020.47 | | | $ | 4.79 | | | | 0.94 | % |
Series II | | | 1,000.00 | | | | 1,068.60 | | | | 6.20 | | | | 1,019.21 | | | | 6.06 | | | | 1.19 | |
| 1 | The actual ending account value is based on the actual total return of the Fund for the period July 1, 2017 through December 31, 2017, after actual expenses and will differ from the hypothetical ending account value which is based on the Fund’s expense ratio and a hypothetical annual return of 5% before expenses. |
| 2 | Expenses are equal to the Fund’s annualized expense ratio as indicated above multiplied by the average account value over the period, multiplied by 184/365 to reflect the most recent fiscal half year. |
Invesco V.I. Mid Cap Core Equity Fund
Tax Information
Form 1099-DIV, Form 1042-S and other year-end tax information provide shareholders with actual calendar year amounts that should be included in their tax returns. Shareholders should consult their tax advisors.
The following distribution information is being provided as required by the Internal Revenue Code or to meet a specific state’s requirement.
The Fund designates the following amounts or, if subsequently determined to be different, the maximum amount allowable for its fiscal year ended December 31, 2017:
| | | | |
Federal and State Income Tax | | | |
Long-Term Capital Gain Distributions | | $ | 5,277,928 | |
Corporate Dividends Received Deduction* | | | 100.00 | % |
U.S. Treasury Obligations* | | | 0.00 | % |
| | * | The above percentages are based on ordinary income dividends paid to shareholders during the Fund’s fiscal year. |
Invesco V.I. Mid Cap Core Equity Fund
Trustees and Officers
The address of each trustee and officer is AIM Variable Insurance Funds (Invesco Variable Insurance Funds) (the “Trust”), 11 Greenway Plaza, Suite 1000, Houston, Texas 77046-1173. The trustees serve for the life of the Trust, subject to their earlier death, incapacitation, resignation, retirement or removal as more specifically provided in the Trust’s organizational documents. Each officer serves for a one year term or until their successors are elected and qualified. Column two below includes length of time served with predecessor entities, if any.
| | | | | | | | |
Name, Year of Birth and
Position(s) Held with the Trust | | Trustee and/
or Officer Since | | Principal Occupation(s)
During Past 5 Years | | Number of
Funds in Fund
Complex
Overseen by
Trustee | | Other Directorship(s)
Held by Trustee During
Past 5 Years |
| Interested Persons | | | | | | | | |
Martin L. Flanagan1 — 1960 Trustee | | 2007 | | Executive Director, Chief Executive Officer and President, Invesco Ltd. (ultimate parent of Invesco and a global investment management firm); Trustee, The Invesco Funds; Vice Chair, Investment Company Institute; and Member of Executive Board, SMU Cox School of Business Formerly: Advisor to the Board, Invesco Advisers, Inc. (formerly known as Invesco Institutional (N.A.), Inc.); Chairman and Chief Executive Officer, Invesco Advisers, Inc. (registered investment adviser); Director, Chairman, Chief Executive Officer and President, Invesco Holding Company (US), Inc. (formerly IVZ Inc.) (holding company), Invesco Group Services, Inc. (service provider) and Invesco North American Holdings, Inc. (holding company); Director, Chief Executive Officer and President, Invesco Holding Company Limited (parent of Invesco and a global investment management firm); Director, Invesco Ltd.; Chairman, Investment Company Institute and President, Co-Chief Executive Officer, Co-President, Chief Operating Officer and Chief Financial Officer, Franklin Resources, Inc. (global investment management organization) | | 158 | | None |
Philip A. Taylor2 — 1954 Trustee and Senior Vice President | | 2006 | | Head of the Americas and Senior Managing Director, Invesco Ltd.; Director, Invesco Advisers, Inc. (formerly known as Invesco Institutional (N.A.), Inc.) (registered investment adviser); Director, Chairman, Chief Executive Officer and President, Invesco Management Group, Inc. (formerly known as Invesco Aim Management Group, Inc.) (financial services holding company); Director and Chairman, Invesco Investment Services, Inc. (formerly known as Invesco Aim Investment Services, Inc.) (registered transfer agent); Chief Executive Officer, Invesco Corporate Class Inc. (corporate mutual fund company); Director, Chairman and Chief Executive Officer, Invesco Canada Ltd. (formerly known as Invesco Trimark Ltd./Invesco Trimark Ltèe) (registered investment adviser and registered transfer agent); Trustee and Senior Vice President, The Invesco Funds; Director, Invesco Investment Advisers LLC (formerly known as Van Kampen Asset Management). Formerly: Co-Chairman, Co-President and Co-Chief Executive Officer, Invesco Advisers, Inc. (formerly known as Invesco Institutional (N.A.), Inc.) (registered investment adviser); Director, Chief Executive Officer and President, Van Kampen Exchange Corp; President and Principal Executive Officer, The Invesco Funds (other than AIM Treasurer’s Series Trust (Invesco Treasurer’s Series Trust), Short-Term Investments Trust and Invesco Management Trust); Executive Vice President, The Invesco Funds (AIM Treasurer’s Series Trust (Invesco Treasurer’s Series Trust), Short-Term Investments Trust and Invesco Management Trust only); Director and President, INVESCO Funds Group, Inc. (registered investment adviser and registered transfer agent); Director and Chairman, IVZ Distributors, Inc. (formerly known as INVESCO Distributors, Inc.) (registered broker dealer); Director, President and Chairman, Invesco Inc. (holding company), Invesco Canada Holdings Inc. (holding company), Trimark Investments Ltd./Placements Trimark Ltèe and Invesco Financial Services Ltd/Services Financiers Invesco Ltèe; Chief Executive Officer, Invesco Canada Fund Inc. (corporate mutual fund company); Director and Chairman, Van Kampen Investor Services Inc.; Director, Chief Executive Officer and President, 1371 Preferred Inc. (holding company) and Van Kampen Investments Inc.; Director and President, AIM GP Canada Inc. (general partner for limited partnerships) and Van Kampen Advisors, Inc.; Director and Chief Executive Officer, Invesco Trimark Dealer Inc. (registered broker dealer); Director, Invesco Distributors, Inc. (formerly known as Invesco Aim Distributors, Inc.) (registered broker dealer); Manager, Invesco PowerShares Capital Management LLC; Director, Chief Executive Officer and President, Invesco Advisers, Inc.; Director, Chairman, Chief Executive Officer and President, Invesco Aim Capital Management, Inc.; President, Invesco Trimark Dealer Inc. and Invesco Trimark Ltd./Invesco Trimark Ltèe; Director and President, AIM Trimark Corporate Class Inc. and AIM Trimark Canada Fund Inc.; Senior Managing Director, Invesco Holding Company Limited; Director and Chairman, Fund Management Company (former registered broker dealer); President and Principal Executive Officer, The Invesco Funds (AIM Treasurer’s Series Trust (Invesco Treasurer’s Series Trust), and Short-Term Investments Trust only); President, AIM Trimark Global Fund Inc. and AIM Trimark Canada Fund Inc. | | 158 | | None |
| 1 | Mr. Flanagan is considered an interested person (within the meaning of Section 2(a)(19) of the 1940 Act) of the Trust because he is an officer of the Adviser to the Trust, and an officer and a director of Invesco Ltd., ultimate parent of the Adviser. |
| 2 | Mr. Taylor is considered an interested person (within the meaning of Section 2(a)(19) of the 1940 Act) of the Trust because he is an officer and a director of the Adviser. |
Invesco V.I. Mid Cap Core Equity Fund
Trustees and Officers—(continued)
| | | | | | | | |
Name, Year of Birth and
Position(s) Held with the Trust | | Trustee and/
or Officer Since | | Principal Occupation(s)
During Past 5 Years | | Number of
Funds in Fund
Complex
Overseen by
Trustee | | Other Directorship(s)
Held by Trustee During
Past 5 Years |
| Independent Trustees | | | | | | | | |
Bruce L. Crockett — 1944 Trustee and Chair | | 1993 | | Chairman, Crockett Technologies Associates (technology consulting company) Formerly: Director, Captaris (unified messaging provider); Director, President and Chief Executive Officer, COMSAT Corporation; Chairman, Board of Governors of INTELSAT (international communications company); ACE Limited (insurance company); Independent Directors Council and Investment Company Institute: Member of the Audit Committee, Investment Company Institute; Member of the Executive Committee and Chair of the Governance Committee, Independent Directors Council | | 158 | | Director and Chairman of the Audit Committee, ALPS (Attorneys Liability Protection Society) (insurance company); Director and Member of the Audit Committee and Compensation Committee, Ferroglobe PLC (metallurgical company) |
David C. Arch — 1945 Trustee | | 2010 | | Chairman of Blistex Inc. (consumer health care products manufacturer); Member, World Presidents’ Organization | | 158 | | Board member of the Illinois Manufacturers’ Association |
Jack M. Fields — 1952 Trustee | | 1997 | | Chief Executive Officer, Twenty First Century Group, Inc. (government affairs company); and Chairman, Discovery Learning Alliance (non-profit) Formerly: Owner and Chief Executive Officer, Dos Angeles Ranch L.P. (cattle, hunting, corporate entertainment); Director, Insperity, Inc. (formerly known as Administaff) (human resources provider); Chief Executive Officer, Texana Timber LP (sustainable forestry company); Director of Cross Timbers Quail Research Ranch (non-profit); and member of the U.S. House of Representatives | | 158 | | None |
Cynthia Hostetler — 1962 Trustee | | 2017 | | Non-Executive Director and Trustee of a number of public and private business corporations Formerly: Head of Investment Funds and Private Equity, Overseas Private Investment Corporation; President, First Manhattan Bancorporation, Inc.; Attorney, Simpson Thacher & Bartlett LLP | | 158 | | Vulcan Materials Company (construction materials company); Trilinc Global Impact Fund; Aberdeen Investment Funds (4 portfolios); Artio Global Investment LLC (mutual fund complex); Edgen Group, Inc. (specialized energy and infrastructure products distributor) |
Eli Jones — 1961 Trustee | | 2016 | | Professor and Dean, Mays Business School — Texas A&M University Formerly: Professor and Dean, Walton College of Business, University of Arkansas and E.J. Ourso College of Business, Louisiana State University; Director, Arvest Bank | | 158 | | Insperity, Inc. (formerly known as Administaff) (human resources provider) |
Prema Mathai-Davis — 1950 Trustee | | 1998 | | Retired. | | 158 | | None |
Teresa M. Ressel — 1962 Trustee | | 2017 | | Non-executive director and trustee of a number of public and private business corporations Formerly: Chief Financial Officer, Olayan America, The Olayan Group (international investor/commercial/industrial); Chief Executive Officer, UBS Securities LLC; Group Chief Operating Officer, Americas, UBS AG; Assistant Secretary for Management & Budget and CFO, US Department of the Treasury | | 158 | | Atlantic Power Corporation (power generation company); ON Semiconductor Corp. (semiconductor supplier) |
Ann Barnett Stern — 1957 Trustee | | 2017 | | President and Chief Executive Officer, Houston Endowment Inc. (private philanthropic institution) Formerly: Executive Vice President and General Counsel, Texas Children’s Hospital; Attorney, Beck, Redden and Secrest, LLP; Business Law Instructor, University of St. Thomas; Attorney, Andrews & Kurth LLP | | 158 | | Federal Reserve Bank of Dallas |
Raymond Stickel, Jr. — 1944 Trustee | | 2005 | | Retired. Formerly: Director, Mainstay VP Series Funds, Inc. (25 portfolios); Partner, Deloitte & Touche | | 158 | | None |
Robert C. Troccoli — 1949 Trustee | | 2016 | | Adjunct Professor, University of Denver — Daniels College of Business Formerly: Senior Partner, KPMG LLP | | 158 | | None |
Christopher L. Wilson — 1957 Trustee | | 2017 | | Non-executive director and trustee of a number of public and private business corporations Formerly: Managing Partner, CT2, LLC (investing and consulting firm); President/Chief Executive Officer, Columbia Funds, Bank of America Corporation; President/Chief Executive Officer, CDC IXIS Asset Management Services, Inc.; Principal & Director of Operations, Scudder Funds, Scudder, Stevens & Clark, Inc.; Assistant Vice President, Fidelity Investments | | 158 | | TD Asset Management USA Inc. (mutual fund complex) (22 portfolios); ISO New England, Inc. (non-profit organization managing regional electricity market) |
Invesco V.I. Mid Cap Core Equity Fund
Trustees and Officers—(continued)
| | | | | | | | |
Name, Year of Birth and
Position(s) Held with the Trust | | Trustee and/
or Officer Since | | Principal Occupation(s)
During Past 5 Years | | Number of
Funds in Fund
Complex
Overseen by
Trustee | | Other Directorship(s)
Held by Trustee During
Past 5 Years |
| Other Officers | | | | | | | | |
Sheri Morris — 1964 President, Principal Executive Officer and Treasurer | | 1999 | | President, Principal Executive Officer and Treasurer, The Invesco Funds; Vice President, Invesco Advisers, Inc. (formerly known as Invesco Institutional (N.A.), Inc.) (registered investment adviser); and Vice President, PowerShares Exchange-Traded Fund Trust, PowerShares Exchange-Traded Fund Trust II, PowerShares India Exchange-Traded Fund Trust, PowerShares Actively Managed Exchange-Traded Fund Trust, PowerShares Actively Managed Exchange-Traded Commodity Fund Trust and PowerShares Exchange-Traded Self-Indexed Fund Trust Formerly: Vice President and Principal Financial Officer, The Invesco Funds; Vice President, Invesco Aim Advisers, Inc., Invesco Aim Capital Management, Inc. and Invesco Aim Private Asset Management, Inc.; Assistant Vice President and Assistant Treasurer, The Invesco Funds and Assistant Vice President, Invesco Advisers, Inc., Invesco Aim Capital Management, Inc. and Invesco Aim Private Asset Management, Inc.; and Treasurer, PowerShares Exchange-Traded Fund Trust, PowerShares Exchange-Traded Fund Trust II, PowerShares India Exchange-Traded Fund Trust and PowerShares Actively Managed Exchange-Traded Fund Trust | | N/A | | N/A |
Russell C. Burk — 1958 Senior Vice President and Senior Officer | | 2005 | | Senior Vice President and Senior Officer, The Invesco Funds | | N/A | | N/A |
John M. Zerr — 1962 Senior Vice President, Chief Legal Officer and Secretary | | 2006 | | Director, Senior Vice President, Secretary and General Counsel, Invesco Management Group, Inc. (formerly known as Invesco AIM Management Group, Inc.); Senior Vice President, Invesco Advisers, Inc. (formerly known as Invesco Institutional (N.A.), Inc.) (registered investment adviser); Senior Vice President and Secretary, Invesco Distributors, Inc. (formerly known as Invesco AIM Distributors, Inc.); Director, Vice President and Secretary, Invesco Investment Services, Inc. (formerly known as Invesco AIM Investment Services, Inc.) Senior Vice President, Chief Legal Officer and Secretary, The Invesco Funds; Managing Director, Invesco PowerShares Capital Management LLC; Director, Secretary and General Counsel, Invesco Investment Advisers LLC (formerly known as Van Kampen Asset Management); Secretary and General Counsel, Invesco Capital Markets, Inc. (formerly known as Van Kampen Funds Inc.) and Chief Legal Officer, PowerShares Exchange-Traded Fund Trust, PowerShares Exchange-Traded Fund Trust II, PowerShares India Exchange-Traded Fund Trust, PowerShares Actively Managed Exchange-Traded Fund Trust, PowerShares Actively Managed Exchange-Traded Commodity Fund Trust and PowerShares Exchange-Traded Self-Indexed Fund Trust; Manager and Secretary, Invesco Indexing LLC Formerly: Director, Secretary, General Counsel and Senior Vice President, Van Kampen Exchange Corp.; Director, Vice President and Secretary, IVZ Distributors, Inc. (formerly known as INVESCO Distributors, Inc.); Director and Vice President, INVESCO Funds Group, Inc.; Director and Vice President, Van Kampen Advisors Inc.; Director, Vice President, Secretary and General Counsel, Van Kampen Investor Services Inc.; Director, Invesco Distributors, Inc. (formerly known as Invesco AIM Distributors, Inc.); Director, Senior Vice President, General Counsel and Secretary, Invesco AIM Advisers, Inc. and Van Kampen Investments Inc.; Director, Vice President and Secretary, Fund Management Company; Director, Senior Vice President, Secretary, General Counsel and Vice President, Invesco AIM Capital Management, Inc.; Chief Operating Officer and General Counsel, Liberty Ridge Capital, Inc. (an investment adviser); Vice President and Secretary, PBHG Funds (an investment company) and PBHG Insurance Series Fund (an investment company); Chief Operating Officer, General Counsel and Secretary, Old Mutual Investment Partners (a broker-dealer); General Counsel and Secretary, Old Mutual Fund Services (an administrator) and Old Mutual Shareholder Services (a shareholder servicing center); Executive Vice President, General Counsel and Secretary, Old Mutual Capital, Inc. (an investment adviser); and Vice President and Secretary, Old Mutual Advisors Funds (an investment company) | | N/A | | N/A |
Gregory G. McGreevey — 1962 Senior Vice President | | 2012 | | Senior Managing Director, Invesco Ltd.; Director, Chairman, President, and Chief Executive Officer, Invesco Advisers, Inc. (formerly known as Invesco Institutional (N.A.), Inc.) (registered investment adviser); Senior Vice President, Invesco Management Group, Inc.; Director, Invesco Mortgage Capital, Inc. and Invesco Senior Secured Management, Inc.; and Senior Vice President, The Invesco Funds Formerly: Assistant Vice President, The Invesco Funds | | N/A | | N/A |
Kelli Gallegos — 1970 Vice President, Principal Financial Officer and Assistant Treasurer | | 2008 | | Vice President, Principal Financial Officer and Assistant Treasurer, The Invesco Funds; Assistant Treasurer, Invesco PowerShares Capital Management LLC, PowerShares Exchange-Traded Fund Trust, PowerShares Exchange-Traded Fund Trust II, PowerShares India Exchange-Traded Fund Trust, PowerShares Actively Managed Exchange-Traded Fund Trust, PowerShares Actively Managed Exchange-Traded Commodity Fund Trust and PowerShares Exchange-Traded Self-Indexed Fund Trust Formerly: Assistant Vice President, The Invesco Funds | | N/A | | N/A |
Invesco V.I. Mid Cap Core Equity Fund
Trustees and Officers—(continued)
| | | | | | | | |
Name, Year of Birth and
Position(s) Held with the Trust | | Trustee and/
or Officer Since | | Principal Occupation(s)
During Past 5 Years | | Number of
Funds in Fund
Complex
Overseen by
Trustee | | Other Directorship(s)
Held by Trustee During
Past 5 Years |
| Other Officers—(continued) | | | | | | | | |
Tracy Sullivan — 1962 Vice President, Chief Tax Officer and Assistant Treasurer | | 2008 | | Vice President, Chief Tax Officer and Assistant Treasurer, The Invesco Funds; Assistant Treasurer, Invesco PowerShares Capital Management LLC, PowerShares Exchange-Traded Fund Trust, PowerShares Exchange-Traded Fund Trust II, PowerShares India Exchange-Traded Fund Trust, PowerShares Actively Managed Exchange-Traded Fund Trust, PowerShares Actively Managed Exchange-Traded Commodity Fund Trust and PowerShares Exchange-Traded Self-Indexed Fund Trust Formerly: Assistant Vice President, The Invesco Funds | | N/A | | N/A |
Crissie M. Wisdom — 1969 Anti-Money Laundering Compliance Officer | | 2013 | | Anti-Money Laundering Compliance Officer, Invesco Advisers, Inc. (formerly known as Invesco Institutional (N.A.), Inc.) (registered investment adviser), Invesco Capital Markets, Inc. (formerly known as Van Kampen Funds Inc.), Invesco Distributors, Inc., Invesco Investment Services, Inc., Invesco Management Group, Inc., The Invesco Funds, and PowerShares Exchange-Traded Fund Trust, PowerShares Exchange-Traded Fund Trust II, PowerShares India Exchange-Traded Fund Trust, PowerShares Actively Managed Exchange-Traded Fund Trust, PowerShares Actively Managed Exchange-Traded Commodity Fund Trust and PowerShares Exchange-Traded Self-Indexed Fund Trust; Anti-Money Laundering Compliance Officer and Bank Secrecy Act Officer, INVESCO National Trust Company and Invesco Trust Company; and Fraud Prevention Manager and Controls and Risk Analysis Manager for Invesco Investment Services, Inc. Formerly: Anti-Money Laundering Compliance Officer, Van Kampen Exchange Corp. | | N/A | | N/A |
Robert R. Leveille — 1969 Chief Compliance Officer | | 2016 | | Chief Compliance Officer, Invesco Advisers, Inc. (registered investment adviser); and Chief Compliance Officer, The Invesco Funds Formerly: Chief Compliance Officer, Putnam Investments and the Putnam Funds | | N/A | | N/A |
The Statement of Additional Information of the Trust includes additional information about the Fund’s Trustees and is available upon request, without charge, by calling 1.800.959.4246. Please refer to the Fund’s Statement of Additional Information for information on the Fund’s sub-advisers.
| | | | | | |
Office of the Fund 11 Greenway Plaza, Suite 1000 Houston, TX 77046-1173 | | Investment Adviser Invesco Advisers, Inc. 1555 Peachtree Street, N.E. Atlanta, GA 30309 | | Distributor Invesco Distributors, Inc. 11 Greenway Plaza, Suite 1000 Houston, TX 77046-1173 | | Auditors PricewaterhouseCoopers LLP 1000 Louisiana Street, Suite 5800 Houston, TX 77002-5678 |
| | | |
| | | | | | |
Counsel to the Fund Stradley Ronon Stevens & Young, LLP 2005 Market Street, Suite 2600 Philadelphia, PA 19103-7018 | | Counsel to the Independent Trustees Goodwin Procter LLP 901 New York Avenue, N.W. Washington, D.C. 20001 | | Transfer Agent Invesco Investment Services, Inc. 11 Greenway Plaza, Suite 1000 Houston, TX 77046-1173 | | Custodian State Street Bank and Trust Company 225 Franklin Street Boston, MA 02110-2801 |
Invesco V.I. Mid Cap Core Equity Fund
| | | | |
| | |
 | | Annual Report to Shareholders | | December 31, 2017 |
| | |
| | Invesco V.I. Mid Cap Growth Fund |

| | |
| | The Fund provides a complete list of its holdings four times in each fiscal year, at the quarter-ends. For the second and fourth quarters, the lists appear in the Fund’s semiannual and annual reports to shareholders. For the first and third quarters, the Fund files the lists with the Securities and Exchange Commission (SEC) on Form N-Q. The Fund’s Form N-Q filings are available on the SEC website, sec.gov. Copies of the Fund’s Forms N-Q may be reviewed and copied at the SEC Public Reference Room in Washington, D.C. You can obtain information on the operation of the Public Reference Room, including information about duplicating fee charges, by calling 202 551 8090 or 800 732 0330, or by electronic request at the following email address: publicinfo@sec.gov. The SEC file numbers for the Fund are 811-07452 and 033-57340. The Fund’s most recent portfolio holdings, as filed on Form N-Q, have also been made available to insurance companies issuing variable annuity contracts and variable life insurance policies (“variable products”) that invest in the Fund. A description of the policies and procedures that the Fund uses to determine how to vote proxies relating to portfolio securities is available without charge, upon request, from our Client Services department at 800 959 4246 or at invesco.com/proxyguidelines. The information is also available on the SEC website, sec.gov. Information regarding how the Fund voted proxies related to its portfolio securities during the most recent 12-month period ended June 30 is available at invesco.com/ proxysearch. The information is also available on the SEC website, sec.gov. Invesco Advisers, Inc. is an investment adviser; it provides investment advisory services to individual and institutional clients and does not sell securities. Invesco Distributors, Inc. is the US distributor for Invesco Ltd.’s retail mutual funds, exchange-traded funds and institutional money market funds. Both are wholly owned, indirect subsidiaries of Invesco Ltd. This report must be accompanied or preceded by a currently effective Fund prospectus and variable product prospectus, which contain more complete information, including sales charges and expenses. Investors should read each carefully before investing. NOT FDIC INSURED | MAY LOSE VALUE | NO BANK GUARANTEE |
| | | | |
| | Invesco Distributors, Inc. | | VK-VIMCG-AR-1 02082018 0953 |
Management’s Discussion of Fund Performance
Performance summary
For the year ended December 31, 2017, Series I shares of Invesco V.I. Mid Cap Growth Fund (the Fund) underperformed the Russell Midcap Growth Index, the Fund’s style-specific benchmark.
Your Fund’s long-term performance appears later in this report.
Fund vs. Indexes
Total returns, 12/31/16 to 12/31/17, excluding variable product issuer charges.
If variable product issuer charges were included, returns would be lower.
| | | | | |
| Series I Shares | | | | 22.49 | % |
| Series II Shares | | | | 22.14 | |
| S&P 500 Index▼ (Broad Market Index) | | | | 21.83 | |
| Russell Midcap Growth Index▼ (Style-Specific Index) | | | | 25.27 | |
| Lipper VUF Mid-Cap Growth Funds Index∎ (Peer Group Index) | | | | 25.52 | |
Source(s): ▼FactSet Research Systems Inc.; ∎Lipper Inc. | | | | | |
Market conditions and your Fund
Despite highly destructive hurricanes that threatened to derail a years-long economic recovery, the US economy continued to expand throughout the year ended December 31, 2017. Gross domestic product – the value of all goods and services produced in the US – expanded in the first three quarters of 2017. Inflation remained subdued even as unemployment continued its multiyear decline.
Given signs of an improving economy, the US Federal Reserve (the Fed) raised interest rates three times during the reporting period, most recently in December 2017; each rate hike was 25 basis points.1 (A basis point is 0.01%.) The Fed pledged that “realized and expected economic conditions relative to its objectives of maximum employment and 2 percent inflation” will guide its future actions. At the close of the reporting period, Fed policy remained accommodative, and the fed funds target rate stood at a range of 1.25% to 1.50% – 75 basis points higher than at the start of the reporting period.1
Higher inventories and a worsening outlook caused oil prices and many energy
stocks to decline during the first half of 2017. However, oil prices rose significantly in the second half of the reporting period as expectations for lower supplies increased, partly due to continued OPEC production cuts, and demand began normalizing.
Major US stock market indexes repeatedly hit all-time highs throughout the reporting period. The stock market rally that began after the 2016 presidential election continued throughout the reporting period, fueled by generally positive economic data, strong corporate earnings and improved consumer confidence. Finally, after much debate in Congress, a tax reform bill was signed into law in December 2017. While its enactment further strengthened stocks, its effect on the US economy remained uncertain.
In this environment, the Fund produced a solid return but underperformed its style-specific benchmark. Relative performance was driven by our bottom-up stock selection process. On the positive side, the Fund outperformed its style-specific benchmark by the largest margin in the consumer staples sector. Fund performance in the real estate, materials and
financials sectors also contributed to relative results. Conversely, the Fund underperformed its style-specific benchmark in the health care, information technology (IT), consumer discretionary and energy sectors.
In the consumer staples sector, Fund holdings in the beverage industry and underweight exposure to the food and staples retailing industry led relative performance. At the individual holdings level, alcoholic beverage distributor Constellation Brands was a leading contributor to Fund performance. The company benefited from strong sales growth and higher pricing throughout the year. Branded food manufacturer Pinnacle Foods was also a solid contributor to Fund performance. The company’s stock price rose during the year driven by continued momentum from its Birds Eye and Hungry-Man businesses.
The Fund also outperformed its style-specific benchmark in the real estate sector. Within the sector, SBA Communications, a wireless communications infrastructure owner and operator, was a solid contributor to Fund performance. The company was helped by accelerated demand from wireless carriers throughout the year.
Stock selection in the financials sector also contributed to relative performance. In particular, Fund holdings in the capital markets industry were the leading contributor to relative performance within the sector. At the individual holdings level, financial services company E*TRADE Financial was one of the leading contributors to Fund performance. E*TRADE reported better-than-expected results and raised its forward guidance for 2019 driven by new account growth and strong engagement from retail traders.
Conversely, the Fund underperformed its style-specific benchmark in the health
| | |
| Portfolio Composition |
By sector | % of total net assets |
| | |
| |
| Information Technology | | 31.0% |
| Health Care | | 15.4 |
| Industrials | | 15.3 |
| Consumer Discretionary | | 12.0 |
| Financials | | 9.4 |
| Materials | | 4.8 |
| Real Estate | | 3.8 |
| Energy | | 3.7 |
| Consumer Staples | | 3.4 |
| Telecommunication Services | | 1.2 |
Money Market Funds Plus Other Assets Less Liabilities | | 0.0 |
| | |
| Top 10 Equity Holdings* |
% of total net assets |
| |
| 1. Neurocrine Biosciences, Inc. | | 2.2% |
2. ServiceNow, Inc. | | 2.1 |
3. SBA Communications Corp.-Class A | | 2.1 |
4. Dollar Tree, Inc. | | 2.0 |
5. Constellation Brands, Inc.- Class A | | 2.0 |
6. E*TRADE Financial Corp. | | 1.7 |
7. Wynn Resorts Ltd. | | 1.7 |
8. CoStar Group Inc. | | 1.7 |
9. Equinix, Inc. | | 1.7 |
10. Amphenol Corp.-Class A | | 1.6 |
| | |
| Total Net Assets | | $231.6 million |
| |
| Total Number of Holdings* | | 86 |
The Fund’s holdings are subject to change, and there is no assurance that the Fund will continue to hold any particular security.
*Excluding money market fund holdings.
Data presented here are as of December 31, 2017.
Invesco V.I. Mid Cap Growth Fund
care sector. Fund holdings in the life science tools and the health care equipment, supplies and providers industries detracted from relative performance. Biotechnology company INC Research Holdings was a notable detractor from Fund performance. The stock lagged the overall market after finalizing the acquisition of Inventiv (not a Fund holding) in the third quarter of the year. However, we view the acquisition positively.
During the year, the Fund produced a return greater than 30% within the IT sector but underperformed its style-spe-cific benchmark. Relative performance in the sector was driven by underperfor-mance in the semiconductors and communications equipment industries. From an individual holdings perspective, F5 Networks was a notable detractor from Fund performance. The software developer’s stock declined during the year after it lowered forward guidance due to customer hesitation in choosing its cloud architecture and whether they would opt for a public, private or a hybrid type.
The Fund also underperformed its style-specific benchmark in the consumer discretionary sector. Underperformance in the household durables industry was the leading detractor from relative results in the sector. The leading individual detractor in the sector was Newell Brands, a consumer goods company known for several well-known brands, including Gra-co, Paper Mate and Sharpie. The stock declined late in the year after the company reduced its earnings outlook due to higher input costs as a result of Hurricane Harvey and increased spending on product innovation. We sold our position in Newell Brands before the close of the reporting period.
At the end of the reporting period, the IT, health care and financials sectors were the largest overweight allocations relative to the style-specific benchmark. In contrast, the largest underweight allocations were in the consumer discretionary, industrials and materials sectors. Near-term economic growth seems to be decelerating despite US consumer and business confidence being at a decades-long high and historically low unemployment data. Given this scenario, we are seeking opportunities in companies that are taking share within their respective industries. Though we anticipate a possible slowdown in the economy, we continue to prudently balance the Fund between dynamic growth opportunities and more durable growth opportunities.
We thank you for your commitment to Invesco V.I. Mid Cap Growth Fund.
1 Source: US Federal Reserve
The views and opinions expressed in management’s discussion of Fund performance are those of Invesco Advisers, Inc. These views and opinions are subject to change at any time based on factors such as market and economic conditions. These views and opinions may not be relied upon as investment advice or recommendations, or as an offer for a particular security. The information is not a complete analysis of every aspect of any market, country, industry, security or the Fund. Statements of fact are from sources considered reliable, but Invesco Advisers, Inc. makes no representation or warranty as to their completeness or accuracy. Although historical performance is no guarantee of future results, these insights may help you understand our investment management philosophy.
See important Fund and, if applicable, index disclosures later in this report.
| | |
 | | Jim Leach Chartered Financial Analyst, Portfolio Manager, is lead manager of Invesco V.I. Mid Cap Growth Fund. |
| He joined Invesco in 2011. Mr. Leach earned a BS in mechanical engineering from the University of California and an MBA from New York University Stern School of Business. |
| | |
 | | Elizabeth Bernstein Portfolio Manager, is manager of Invesco V.I. Mid Cap Growth Fund. She joined Invesco in 2012. Ms. Bernstein |
| earned a BA degree in history, cum laude, from the University of Pennsylvania and an MBA from the University of Michigan – Ross School of Business with an emphasis in strategy and finance. |
Invesco V.I. Mid Cap Growth Fund
Your Fund’s Long-Term Performance
Results of a $10,000 Investment – Oldest Share Class(es)
Fund and index data from 12/31/07
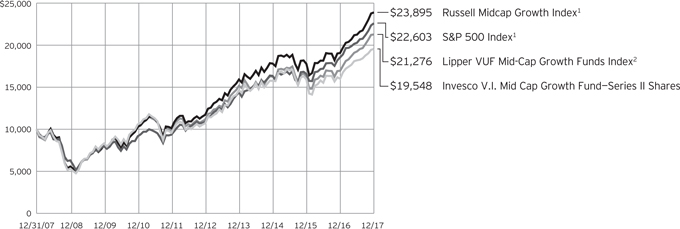
| 1 | Source: FactSet Research Systems Inc. |
Past performance cannot guarantee
comparable future results.
| | | | | |
| Average Annual Total Returns |
As of 12/31/17 | | | | | |
| |
| Series I Shares | | | | | |
| 10 Years | | | | 7.09 | % |
| 5 Years | | | | 13.08 | |
| 1 Year | | | | 22.49 | |
| |
Series II Shares | | | | | |
| Inception (9/25/00) | | | | 1.65 | % |
| 10 Years | | | | 6.93 | |
| 5 Years | | | | 12.80 | |
| 1 Year | | | | 22.14 | |
Effective June 1, 2010, Class II shares of the predecessor fund, Van Kampen Life Investment Trust Mid Cap Growth Portfolio, advised by Van Kampen Asset Management were reorganized into Series II shares, of Invesco Van Kampen V.I. Mid Cap Growth Fund (renamed Invesco V.I. Mid Cap Growth Fund on April 29, 2013). Returns shown above, prior to June 1, 2010, for Series II shares are blended returns of the predecessor fund and Invesco V.I. Mid Cap Growth Fund. Share class returns will differ from the predecessor fund because of different expenses.
Series I shares incepted on June 1, 2010. Series I share performance shown prior to that date is that of the predecessor fund’s Class II shares and includes the 12b-1 fees applicable to the predecessor fund’s Class II shares.
The performance data quoted represent past performance and cannot guarantee comparable future results; current performance may be lower or higher. Please contact your variable product issuer or financial adviser for the most recent month-end variable product performance. Performance figures reflect Fund expenses, reinvested distributions and changes in net asset value. Investment return and principal value will fluctuate so that you may have a gain or loss when you sell shares.
The total annual Fund operating expense ratio set forth in the most recent Fund prospectus as of the date of this report for Series I and Series II shares was 1.03% and 1.28%, respectively. The expense ratios presented above may vary from the expense ratios presented in other sections of this report that are based on expenses incurred during the period covered by this report.
Invesco V.I. Mid Cap Growth Fund, a series portfolio of AIM Variable Insurance Funds (Invesco Variable Insurance Funds), is currently offered through insurance companies issuing variable products. You cannot purchase shares of the Fund directly. Performance figures given represent the Fund and are not intended to reflect
actual variable product values. They do not reflect sales charges, expenses and fees assessed in connection with a variable product. Sales charges, expenses and fees, which are determined by the variable product issuers, will vary and will lower the total return.
The most recent month-end performance at the Fund level, excluding variable product charges, is available at 800 451 4246. As mentioned above, for the most recent month-end performance including variable product charges, please contact your variable product issuer or financial adviser.
Fund performance reflects any applicable fee waivers and/or expense reimbursements. Had the adviser not waived fees and/or reimbursed expenses currently or in the past, returns would have been lower. See current prospectus for more information.
Invesco V.I. Mid Cap Growth Fund
Invesco V.I. Mid Cap Growth Fund’s investment objective is to seek capital growth.
| ∎ | | Unless otherwise stated, information presented in this report is as of December 31, 2017, and is based on total net assets. |
| ∎ | | Unless otherwise noted, all data provided by Invesco. |
Principal risks of investing
in the Fund
Foreign securities risk. The Fund’s foreign investments may be adversely affected by political and social instability, changes in economic or taxation policies, difficulty in enforcing obligations, decreased liquidity or increased volatility. Foreign investments also involve the risk of the possible seizure, nationalization or expropriation of the issuer or foreign deposits (in which the Fund could lose its entire investments in a certain market) and the possible adoption of foreign governmental restrictions such as exchange controls. Unless the Fund has hedged its foreign securities risk, foreign securities risk also involves the risk of negative foreign currency rate fluctuations, which may cause the value of securities denominated in such foreign currency (or other instruments through which the Fund has exposure to foreign currencies) to decline in value. Currency exchange rates may fluctuate significantly over short periods of time. Currency hedging strategies, if used, are not always successful.
Growth investing risk. Growth stocks tend to be more expensive relative to the issuing company’s earnings or assets compared with other types of stock. As a result, they tend to be more sensitive to changes in, or investors’ expectations of, the issuing company’s earnings and can be more volatile.
Management risk. The Fund is actively managed and depends heavily on the Adviser’s judgment about markets, interest rates or the attractiveness, relative values, liquidity, or potential appreciation of particular investments made for the Fund’s portfolio. The Fund could experience losses if these judgments prove to be incorrect. Additionally, legislative, regulatory, or tax developments may adversely affect management of the Fund and, therefore, the ability of the Fund to achieve its investment objective.
Market risk. The market values of the Fund’s investments, and therefore the value of the Fund’s shares, will go up and down, sometimes rapidly or unpredictably. Market risk may affect a single issuer, industry or section of the economy, or it may affect the market as a whole. Individual stock prices tend to go up and down more dramatically than those of certain other types of investments, such as bonds. During a general downturn in
the financial markets, multiple asset classes may decline in value. When markets perform well, there can be no assurance that specific investments held by the Fund will rise in value.
Mid-capitalization companies risk. Mid-capitalization companies tend to be more vulnerable to changing market conditions and may have more limited product lines and markets, less experienced management and fewer financial resources than larger companies. These companies’ securities may be more volatile and less liquid than those of more established companies, and their returns may vary, sometimes significantly, from the overall securities market.
Sector focus risk. The Fund may from time to time invest a significant amount of its assets (i.e. over 25%) in one market sector or group of related industries. In this event, the Fund’s performance will depend to a greater extent on the overall condition of the sector or group of industries and there is increased risk that the Fund will lose significant value if conditions adversely affect that sector or group of industries.
About indexes used in this report
The S&P 500® Index is an unmanaged index considered representative of the US stock market.
The Russell Midcap® Growth Index is an unmanaged index considered representative of mid-cap growth stocks. The Russell Midcap Growth Index is a trademark/service mark of the Frank Russell Co. Russell® is a trademark of the Frank Russell Co.
The Lipper VUF Mid-Cap Growth Funds Index is an unmanaged index considered representative of mid-cap growth variable insurance underlying funds tracked by Lipper.
The Fund is not managed to track the performance of any particular index, including the index(es) described here, and consequently, the performance of the Fund may deviate significantly from the performance of the index(es).
A direct investment cannot be made in an index. Unless otherwise indicated, index results include reinvested dividends, and they do not reflect sales charges. Performance of the peer group, if applicable, reflects fund expenses; performance of a market index does not.
Other information
The returns shown in management’s discussion of Fund performance are based on net asset values calculated for shareholder transactions. Generally accepted accounting principles require adjustments to be made to the net assets of the Fund at period end for financial reporting purposes, and as such, the net asset values for shareholder transactions and the returns based on those net asset values may differ from the net asset values and returns reported in the Financial Highlights. Additionally, the returns and net asset values shown throughout this report are at the Fund level only and do not include variable product issuer charges. If such charges were included, the total returns would be lower.
Industry classifications used in this report are generally according to the Global Industry Classification Standard, which was developed by and is the exclusive property and a service mark of MSCI Inc. and Standard & Poor’s.
Invesco V.I. Mid Cap Growth Fund
Schedule of Investments(a)
December 31, 2017
| | | | | | | | |
| | | Shares | | | Value | |
Common Stocks & Other Equity Interests–99.96% | |
| Aerospace & Defense–2.15% | |
Huntington Ingalls Industries, Inc. | | | 7,276 | | | $ | 1,714,953 | |
Raytheon Co. | | | 17,341 | | | | 3,257,507 | |
| | | | | | | | 4,972,460 | |
|
| Airlines–0.92% | |
Alaska Air Group, Inc. | | | 28,877 | | | | 2,122,748 | |
|
| Alternative Carriers–1.15% | |
Zayo Group Holdings, Inc.(b) | | | 72,704 | | | | 2,675,507 | |
|
| Apparel Retail–1.52% | |
Burlington Stores, Inc.(b) | | | 28,528 | | | | 3,509,800 | |
|
| Application Software–5.00% | |
Cadence Design Systems, Inc.(b) | | | 47,706 | | | | 1,995,065 | |
Guidewire Software Inc.(b) | | | 44,321 | | | | 3,291,278 | |
SS&C Technologies Holdings, Inc. | | | 83,881 | | | | 3,395,503 | |
Tyler Technologies, Inc.(b) | | | 16,387 | | | | 2,901,318 | |
| | | | | | | | 11,583,164 | |
|
| Auto Parts & Equipment–1.10% | |
Aptiv PLC | | | 30,019 | | | | 2,546,512 | |
|
| Biotechnology–4.28% | |
BioMarin Pharmaceutical Inc.(b) | | | 40,599 | | | | 3,620,213 | |
Neurocrine Biosciences, Inc.(b) | | | 64,453 | | | | 5,000,908 | |
TESARO, Inc.(b) | | | 15,585 | | | | 1,291,529 | |
| | | | | | | | 9,912,650 | |
|
| Building Products–4.85% | |
A.O. Smith Corp. | | | 39,700 | | | | 2,432,816 | |
Allegion PLC | | | 18,790 | | | | 1,494,932 | |
American Woodmark Corp.(b) | | | 12,453 | | | | 1,622,003 | |
Builders FirstSource, Inc.(b) | | | 28,581 | | | | 622,780 | |
Masco Corp. | | | 70,265 | | | | 3,087,444 | |
Owens Corning | | | 21,359 | | | | 1,963,747 | |
| | | | | | | | 11,223,722 | |
|
| Casinos & Gaming–1.68% | |
Wynn Resorts Ltd. | | | 23,152 | | | | 3,903,196 | |
|
| Communications Equipment–1.12% | |
F5 Networks, Inc.(b) | | | 19,799 | | | | 2,598,025 | |
|
| Construction & Engineering–0.77% | |
Quanta Services, Inc.(b) | | | 45,908 | | | | 1,795,462 | |
|
| Construction Machinery & Heavy Trucks–0.59% | |
WABCO Holdings Inc.(b) | | | 9,459 | | | | 1,357,367 | |
|
| Construction Materials–1.51% | |
Summit Materials, Inc.–Class A(b) | | | 111,107 | | | | 3,493,205 | |
|
| Data Processing & Outsourced Services–5.91% | |
Black Knight, Inc.(b) | | | 81,862 | | | | 3,614,207 | |
Broadridge Financial Solutions, Inc. | | | 31,181 | | | | 2,824,375 | |
| | | | | | | | |
| | | Shares | | | Value | |
| Data Processing & Outsourced Services–(continued) | |
Fidelity National Information Services, Inc. | | | 40,112 | | | $ | 3,774,138 | |
Vantiv, Inc.–Class A(b) | | | 47,389 | | | | 3,485,461 | |
| | | | | | | | 13,698,181 | |
|
| Distillers & Vintners–1.96% | |
Constellation Brands, Inc.–Class A | | | 19,892 | | | | 4,546,714 | |
|
| Diversified Chemicals–0.93% | |
Chemours Co. (The) | | | 43,136 | | | | 2,159,388 | |
|
| Electrical Components & Equipment–0.91% | |
Acuity Brands, Inc. | | | 11,938 | | | | 2,101,088 | |
|
| Electronic Components–1.63% | |
Amphenol Corp.–Class A | | | 43,103 | | | | 3,784,443 | |
|
| Electronic Equipment & Instruments–0.50% | |
FLIR Systems, Inc. | | | 25,023 | | | | 1,166,572 | |
|
| Electronic Manufacturing Services–1.12% | |
Flex Ltd.(b) | | | 143,806 | | | | 2,587,070 | |
|
| Environmental & Facilities Services–0.89% | |
Republic Services, Inc. | | | 30,433 | | | | 2,057,575 | |
|
| Financial Exchanges & Data–4.48% | |
Intercontinental Exchange, Inc. | | | 35,388 | | | | 2,496,977 | |
London Stock Exchange Group PLC (United Kingdom) | | | 41,280 | | | | 2,113,920 | |
MarketAxess Holdings, Inc. | | | 17,312 | | | | 3,492,696 | |
S&P Global Inc. | | | 13,398 | | | | 2,269,621 | |
| | | | | | | | 10,373,214 | |
|
| General Merchandise Stores–1.98% | |
Dollar Tree, Inc.(b) | | | 42,797 | | | | 4,592,546 | |
|
| Health Care Equipment–5.91% | |
Boston Scientific Corp.(b) | | | 131,437 | | | | 3,258,323 | |
DexCom Inc.(b) | | | 41,374 | | | | 2,374,454 | |
Hologic, Inc.(b) | | | 73,267 | | | | 3,132,165 | |
LivaNova PLC(b) | | | 19,997 | | | | 1,598,160 | |
Penumbra, Inc.(b) | | | 35,252 | | | | 3,317,213 | |
| | | | | | | | 13,680,315 | |
|
| Home Entertainment Software–2.05% | |
Electronic Arts Inc.(b) | | | 30,221 | | | | 3,175,018 | |
Nintendo Co., Ltd. (Japan) | | | 4,300 | | | | 1,565,493 | |
| | | | | | | | 4,740,511 | |
|
| Homebuilding–0.67% | |
D.R. Horton, Inc. | | | 30,470 | | | | 1,556,103 | |
|
| Hotels, Resorts & Cruise Lines–1.84% | |
Hilton Worldwide Holdings Inc. | | | 25,280 | | | | 2,018,861 | |
Royal Caribbean Cruises Ltd. | | | 18,817 | | | | 2,244,492 | |
| | | | | | | | 4,263,353 | |
See accompanying Notes to Financial Statements which are an integral part of the financial statements.
Invesco V.I. Mid Cap Growth Fund
| | | | | | | | |
| | | Shares | | | Value | |
| Industrial Conglomerates–0.75% | |
Roper Technologies, Inc. | | | 6,709 | | | $ | 1,737,631 | |
|
| Industrial Machinery–2.18% | |
John Bean Technologies Corp. | | | 11,346 | | | | 1,257,137 | |
Stanley Black & Decker Inc. | | | 22,295 | | | | 3,783,238 | |
| | | | | | | | 5,040,375 | |
|
| Insurance Brokers–1.15% | |
Brown & Brown, Inc. | | | 51,576 | | | | 2,654,101 | |
|
| Internet Software & Services–3.95% | |
CoStar Group Inc.(b) | | | 13,052 | | | | 3,875,791 | |
GoDaddy, Inc.–Class A(b) | | | 48,911 | | | | 2,459,245 | |
LogMeIn, Inc. | | | 24,588 | | | | 2,815,326 | |
| | | | | | | | 9,150,362 | |
|
| Investment Banking & Brokerage–2.89% | |
E*TRADE Financial Corp.(b) | | | 80,185 | | | | 3,974,770 | |
TD Ameritrade Holding Corp. | | | 53,322 | | | | 2,726,354 | |
| | | | | | | | 6,701,124 | |
|
| IT Consulting & Other Services–1.90% | |
DXC Technology Co. | | | 18,015 | | | | 1,709,624 | |
Gartner, Inc.(b) | | | 21,901 | | | | 2,697,108 | |
| | | | | | | | 4,406,732 | |
|
| Life Sciences Tools & Services–1.92% | |
INC Research Holdings, Inc.–Class A(b) | | | 47,934 | | | | 2,089,923 | |
Mettler-Toledo International Inc.(b) | | | 3,816 | | | | 2,364,088 | |
| | | | | | | | 4,454,011 | |
|
| Managed Health Care–2.73% | |
Centene Corp.(b) | | | 33,889 | | | | 3,418,722 | |
Humana Inc. | | | 11,700 | | | | 2,902,419 | |
| | | | | | | | 6,321,141 | |
|
| Metal & Glass Containers–1.06% | |
Berry Global Group, Inc.(b) | | | 41,832 | | | | 2,454,283 | |
|
| Movies & Entertainment–1.13% | |
Cinemark Holdings, Inc. | | | 75,370 | | | | 2,624,383 | |
|
| Oil & Gas Equipment & Services–1.22% | |
Halliburton Co. | | | 57,630 | | | | 2,816,378 | |
|
| Oil & Gas Exploration & Production–1.36% | |
Diamondback Energy Inc.(b) | | | 24,953 | | | | 3,150,316 | |
|
| Oil & Gas Storage & Transportation–1.15% | |
Cheniere Energy, Inc.(b) | | | 49,427 | | | | 2,661,150 | |
|
| Packaged Foods & Meats–1.47% | |
Pinnacle Foods Inc. | | | 57,368 | | | | 3,411,675 | |
| | | | | | | | |
| | | Shares | | | Value | |
| Pharmaceuticals–0.61% | |
Pacira Pharmaceuticals, Inc.(b) | | | 31,134 | | | $ | 1,421,267 | |
|
| Railroads–1.33% | |
Genesee & Wyoming Inc.–Class A(b) | | | 39,264 | | | | 3,091,255 | |
|
| Regional Banks–0.84% | |
Zions Bancorp | | | 38,461 | | | | 1,954,973 | |
|
| Restaurants–1.26% | |
Domino’s Pizza, Inc. | | | 15,436 | | | | 2,916,787 | |
|
| Semiconductor Equipment–0.60% | |
Entegris Inc. | | | 45,707 | | | | 1,391,778 | |
|
| Semiconductors–4.32% | |
Cirrus Logic, Inc.(b) | | | 24,516 | | | | 1,271,400 | |
Microchip Technology Inc. | | | 37,222 | | | | 3,271,069 | |
Microsemi Corp.(b) | | | 53,473 | | | | 2,761,881 | |
Qorvo, Inc.(b) | | | 40,487 | | | | 2,696,434 | |
| | | | | | | | 10,000,784 | |
|
| Specialized Consumer Services–0.77% | |
ServiceMaster Global Holdings, Inc.(b) | | | 34,568 | | | | 1,772,301 | |
|
| Specialized REIT’s–3.75% | |
Equinix, Inc. | | | 8,485 | | | | 3,845,572 | |
SBA Communications Corp.–Class A(b) | | | 29,659 | | | | 4,845,094 | |
| | | | | | | | 8,690,666 | |
|
| Specialty Chemicals–1.28% | |
Sherwin-Williams Co. (The) | | | 7,242 | | | | 2,969,510 | |
|
| Systems Software–2.10% | |
ServiceNow, Inc.(b) | | | 37,317 | | | | 4,865,764 | |
|
| Technology Hardware, Storage & Peripherals–0.82% | |
NetApp, Inc. | | | 34,318 | | | | 1,898,472 | |
Total Common Stocks & Other Equity Interests
(Cost $169,308,076) | | | | 231,558,110 | |
|
Money Market Funds–0.00% | |
Invesco Government & Agency
Portfolio–Institutional Class, 1.18%(c) | | | 1,410 | | | | 1,410 | |
Invesco Treasury Portfolio–Institutional Class, 1.17%(c) | | | 1,612 | | | | 1,612 | |
Total Money Market Funds
(Cost $3,022) | | | | 3,022 | |
TOTAL INVESTMENTS IN SECURITIES–99.96%
(Cost $169,311,098) | | | | 231,561,132 | |
OTHER ASSETS LESS LIABILITIES–0.04% | | | | 82,651 | |
NET ASSETS–100.00% | | | $ | 231,643,783 | |
Investment Abbreviations:
| | |
| REIT | | – Estate Investment Trust |
Notes to Schedule of Investments:
| (a) | Industry and/or sector classifications used in this report are generally according to the Global Industry Classification Standard, which was developed by and is the exclusive property and a service mark of MSCI Inc. and Standard & Poor’s. |
| (b) | Non-income producing security. |
| (c) | The money market fund and the Fund are affiliated by having the same investment adviser. The rate shown is the 7-day SEC standardized yield as of December 31, 2017. |
See accompanying Notes to Financial Statements which are an integral part of the financial statements.
Invesco V.I. Mid Cap Growth Fund
Statement of Assets and Liabilities
December 31, 2017
Statement of Operations
For the year ended December 31, 2017
| | | | |
Assets: | | | | |
Investments in securities, at value (Cost $169,308,076) | | $ | 231,558,110 | |
Investments in affiliated money market funds, at value and cost | | | 3,022 | |
Cash | | | 6,788 | |
Foreign currencies, at value (Cost $5,113) | | | 5,169 | |
Receivable for: | | | | |
Investments sold | | | 405,618 | |
Fund shares sold | | | 69,657 | |
Dividends | | | 76,428 | |
Investment for trustee deferred compensation and retirement plans | | | 124,279 | |
Other assets | | | 6,648 | |
Total assets | | | 232,255,719 | |
| |
Liabilities: | | | | |
Payable for: | | | | |
Investments purchased | | | 95,286 | |
Fund shares reacquired | | | 192,583 | |
Accrued fees to affiliates | | | 161,189 | |
Accrued trustees’ and officers’ fees and benefits | | | 5,109 | |
Accrued other operating expenses | | | 23,500 | |
Trustee deferred compensation and retirement plans | | | 134,269 | |
Total liabilities | | | 611,936 | |
Net assets applicable to shares outstanding | | $ | 231,643,783 | |
| |
Net assets consist of: | | | | |
Shares of beneficial interest | | $ | 147,396,842 | |
Undistributed net investment income (loss) | | | (139,546 | ) |
Undistributed net realized gain | | | 22,136,397 | |
Net unrealized appreciation | | | 62,250,090 | |
| | | $ | 231,643,783 | |
| |
Net Assets: | | | | |
Series I | | $ | 109,197,115 | |
Series II | | $ | 122,446,668 | |
|
Shares outstanding, no par value,
with an unlimited number of shares authorized: | |
Series I | | | 19,425,864 | |
Series II | | | 22,146,423 | |
Series I: | | | | |
Net asset value per share | | $ | 5.62 | |
Series II: | | | | |
Net asset value per share | | $ | 5.53 | |
| | | | |
Investment income: | | | | |
Dividends | | $ | 1,471,817 | |
Dividends from affiliated money market funds (includes securities lending income of $8,551) | | | 31,631 | |
Total investment income | | | 1,503,448 | |
| |
Expenses: | | | | |
Advisory fees | | | 1,713,891 | |
Administrative services fees | | | 399,825 | |
Custodian fees | | | 11,559 | |
Distribution fees — Series II | | | 304,435 | |
Transfer agent fees | | | 48,783 | |
Trustees’ and officers’ fees and benefits | | | 26,041 | |
Reports to shareholders | | | 30,663 | |
Professional services fees | | | 43,209 | |
Other | | | 4,525 | |
Total expenses | | | 2,582,931 | |
Less: Fees waived | | | (3,338 | ) |
Net expenses | | | 2,579,593 | |
Net investment income (loss) | | | (1,076,145 | ) |
| |
Realized and unrealized gain (loss) from: | | | | |
Net realized gain (loss) from: | | | | |
Investment securities (includes net gains (losses) from securities sold to affiliates of $(19,096)) | | | 24,189,862 | |
Foreign currencies | | | (9,157 | ) |
| | | | 24,180,705 | |
Change in net unrealized appreciation of: | | | | |
Investment securities | | | 22,465,894 | |
Foreign currencies | | | 56 | |
| | | | 22,465,950 | |
Net realized and unrealized gain | | | 46,646,655 | |
Net increase in net assets resulting from operations | | $ | 45,570,510 | |
See accompanying Notes to Financial Statements which are an integral part of the financial statements.
Invesco V.I. Mid Cap Growth Fund
Statement of Changes in Net Assets
For the years ended December 31, 2017 and 2016
| | | | | | | | |
| | | 2017 | | | 2016 | |
Operations: | | | | | | | | |
Net investment income (loss) | | $ | (1,076,145 | ) | | $ | (1,268,599 | ) |
Net realized gain | | | 24,180,705 | | | | 13,767,777 | |
Change in net unrealized appreciation (depreciation) | | | 22,465,950 | | | | (12,121,567 | ) |
Net increase in net assets resulting from operations | | | 45,570,510 | | | | 377,611 | |
| | |
Distributions to shareholders from net realized gains: | | | | | | | | |
Series l | | | (6,675,715 | ) | | | (10,165,462 | ) |
Series ll | | | (7,683,442 | ) | | | (14,237,965 | ) |
Total distributions from net realized gains | | | (14,359,157 | ) | | | (24,403,427 | ) |
| | |
Share transactions–net: | | | | | | | | |
Series l | | | (2,907,769 | ) | | | 3,417,783 | |
Series ll | | | (8,386,056 | ) | | | (29,982,096 | ) |
Net increase (decrease) in net assets resulting from share transactions | | | (11,293,825 | ) | | | (26,564,313 | ) |
Net increase (decrease) in net assets | | | 19,917,528 | | | | (50,590,129 | ) |
| | |
Net assets: | | | | | | | | |
Beginning of year | | | 211,726,255 | | | | 262,316,384 | |
End of year (includes undistributed net investment income (loss) of $(139,546) and $(122,052), respectively) | | $ | 231,643,783 | | | $ | 211,726,255 | |
Notes to Financial Statements
December 31, 2017
NOTE 1—Significant Accounting Policies
Invesco V.I. Mid Cap Growth Fund (the “Fund”) is a series portfolio of AIM Variable Insurance Funds (Invesco Variable Insurance Funds) (the “Trust”). The Trust is a Delaware statutory trust registered under the Investment Company Act of 1940, as amended (the “1940 Act”), as an open-end series management investment company consisting of twenty-four separate portfolios, (each constituting a “Fund”). The assets, liabilities and operations of each portfolio are accounted for separately. Information presented in these financial statements pertains only to the Fund. Matters affecting each Fund or class will be voted on exclusively by the shareholders of such Fund or class. Current Securities and Exchange Commission (“SEC”) guidance, however, requires participating insurance companies offering separate accounts to vote shares proportionally in accordance with the instructions of the contract owners whose investments are funded by shares of each Fund or class.
The Fund’s investment objective is to seek capital growth.
The Fund currently offers two classes of shares, Series I and Series II, both of which are offered to insurance company separate accounts funding variable annuity contracts and variable life insurance policies (“variable products”).
The Fund is an investment company and accordingly follows the investment company accounting and reporting guidance in accordance with Financial Accounting Standards Board Accounting Standards Codification Topic 946, Financial Services – Investment Companies.
The following is a summary of the significant accounting policies followed by the Fund in the preparation of its financial statements.
| A. | Security Valuations — Securities, including restricted securities, are valued according to the following policy. |
A security listed or traded on an exchange (except convertible securities) is valued at its last sales price or official closing price as of the close of the customary trading session on the exchange where the security is principally traded, or lacking any sales or official closing price on a particular day, the security may be valued at the closing bid price on that day. Securities traded in the over-the-counter market are valued based on prices furnished by independent pricing services or market makers. When such securities are valued by an independent pricing service they may be considered fair valued. Futures contracts are valued at the final settlement price set by an exchange on which they are principally traded. Listed options are valued at the mean between the last bid and asked prices from the exchange on which they are principally traded. Options not listed on an exchange are valued by an independent source at the mean between the last bid and asked prices. For purposes of determining net asset value (“NAV”) per share, futures and option contracts generally are valued 15 minutes after the close of the customary trading session of the New York Stock Exchange (“NYSE”).
Investments in open-end and closed-end registered investment companies that do not trade on an exchange are valued at the end-of-day net asset value per share. Investments in open-end and closed-end registered investment companies that trade on an exchange are valued at the last sales price or official closing price as of the close of the customary trading session on the exchange where the security is principally traded.
Debt obligations (including convertible securities) and unlisted equities are fair valued using an evaluated quote provided by an independent pricing service. Evaluated quotes provided by the pricing service may be determined without exclusive reliance on quoted prices, and may reflect appropriate factors such as institution-size trading in similar groups of securities, developments related to specific securities, dividend rate (for unlisted equities), yield (for debt obligations), quality, type of issue, coupon rate (for debt obligations), maturity (for debt obligations), individual
Invesco V.I. Mid Cap Growth Fund
trading characteristics and other market data. Pricing services generally value debt obligations assuming orderly transactions of institutional round lot size, but a fund may hold or transact in the same securities in smaller, odd lot sizes. Odd lots often trade at lower prices than institutional round lots. Debt obligations are subject to interest rate and credit risks. In addition, all debt obligations involve some risk of default with respect to interest and/or principal payments.
Foreign securities’ (including foreign exchange contracts) prices are converted into U.S. dollar amounts using the applicable exchange rates as of the close of the NYSE. If market quotations are available and reliable for foreign exchange-traded equity securities, the securities will be valued at the market quotations. Because trading hours for certain foreign securities end before the close of the NYSE, closing market quotations may become unreliable. If between the time trading ends on a particular security and the close of the customary trading session on the NYSE, events occur that the investment adviser determines are significant and make the closing price unreliable, the Fund may fair value the security. If the event is likely to have affected the closing price of the security, the security will be valued at fair value in good faith using procedures approved by the Board of Trustees. Adjustments to closing prices to reflect fair value may also be based on a screening process of an independent pricing service to indicate the degree of certainty, based on historical data, that the closing price in the principal market where a foreign security trades is not the current value as of the close of the NYSE. Foreign securities’ prices meeting the approved degree of certainty that the price is not reflective of current value will be priced at the indication of fair value from the independent pricing service. Multiple factors may be considered by the independent pricing service in determining adjustments to reflect fair value and may include information relating to sector indices, American Depositary Receipts and domestic and foreign index futures. Foreign securities may have additional risks including exchange rate changes, potential for sharply devalued currencies and high inflation, political and economic upheaval, the relative lack of issuer information, relatively low market liquidity and the potential lack of strict financial and accounting controls and standards.
Securities for which market prices are not provided by any of the above methods may be valued based upon quotes furnished by independent sources. The last bid price may be used to value equity securities. The mean between the last bid and asked prices is used to value debt obligations, including corporate loans.
Securities for which market quotations are not readily available or became unreliable are valued at fair value as determined in good faith by or under the supervision of the Trust’s officers following procedures approved by the Board of Trustees. Issuer specific events, market trends, bid/asked quotes of brokers and information providers and other market data may be reviewed in the course of making a good faith determination of a security’s fair value.
The Fund may invest in securities that are subject to interest rate risk, meaning the risk that the prices will generally fall as interest rates rise and, conversely, the prices will generally rise as interest rates fall. Specific securities differ in their sensitivity to changes in interest rates depending on their individual characteristics. Changes in interest rates may result in increased market volatility, which may affect the value and/or liquidity of certain Fund investments.
Valuations change in response to many factors including the historical and prospective earnings of the issuer, the value of the issuer’s assets, general economic conditions, interest rates, investor perceptions and market liquidity. Because of the inherent uncertainties of valuation, the values reflected in the financial statements may materially differ from the value received upon actual sale of those investments.
| B. | Securities Transactions and Investment Income — Securities transactions are accounted for on a trade date basis. Realized gains or losses on sales are computed on the basis of specific identification of the securities sold. Interest income (net of withholding tax, if any) is recorded on the accrual basis from settlement date. Dividend income (net of withholding tax, if any) is recorded on the ex-dividend date. |
The Fund may periodically participate in litigation related to Fund investments. As such, the Fund may receive proceeds from litigation settlements. Any proceeds received are included in the Statement of Operations as realized gain (loss) for investments no longer held and as unrealized gain (loss) for investments still held.
Brokerage commissions and mark ups are considered transaction costs and are recorded as an increase to the cost basis of securities purchased and/or a reduction of proceeds on a sale of securities. Such transaction costs are included in the determination of net realized and unrealized gain (loss) from investment securities reported in the Statement of Operations and the Statement of Changes in Net Assets and the net realized and unrealized gains (losses) on securities per share in the Financial Highlights. Transaction costs are included in the calculation of the Fund’s net asset value and, accordingly, they reduce the Fund’s total returns. These transaction costs are not considered operating expenses and are not reflected in net investment income reported in the Statement of Operations and the Statement of Changes in Net Assets, or the net investment income per share and the ratios of expenses and net investment income reported in the Financial Highlights, nor are they limited by any expense limitation arrangements between the Fund and the investment adviser.
The Fund allocates income and realized and unrealized capital gains and losses to a class based on the relative net assets of each class.
| C. | Country Determination — For the purposes of making investment selection decisions and presentation in the Schedule of Investments, the investment adviser may determine the country in which an issuer is located and/or credit risk exposure based on various factors. These factors include the laws of the country under which the issuer is organized, where the issuer maintains a principal office, the country in which the issuer derives 50% or more of its total revenues and the country that has the primary market for the issuer’s securities, as well as other criteria. Among the other criteria that may be evaluated for making this determination are the country in which the issuer maintains 50% or more of its assets, the type of security, financial guarantees and enhancements, the nature of the collateral and the sponsor organization. Country of issuer and/or credit risk exposure has been determined to be the United States of America, unless otherwise noted. |
| D. | Distributions — Distributions from net investment income and net realized capital gain, if any, are generally declared and paid to separate accounts of participating insurance companies annually and recorded on the ex-dividend date. |
| E. | Federal Income Taxes — The Fund intends to comply with the requirements of Subchapter M of the Internal Revenue Code of 1986, as amended (the “Internal Revenue Code”), necessary to qualify as a regulated investment company and to distribute substantially all of the Fund’s taxable earnings to shareholders. As such, the Fund will not be subject to federal income taxes on otherwise taxable income (including net realized capital gain) that is distributed to shareholders. Therefore, no provision for federal income taxes is recorded in the financial statements. |
The Fund recognizes the tax benefits of uncertain tax positions only when the position is more likely than not to be sustained. Management has analyzed the Fund’s uncertain tax positions and concluded that no liability for unrecognized tax benefits should be recorded related to uncertain tax positions. Management is not aware of any tax positions for which it is reasonably possible that the total amounts of unrecognized tax benefits will change materially in the next 12 months.
Invesco V.I. Mid Cap Growth Fund
The Fund files tax returns in the U.S. Federal jurisdiction and certain other jurisdictions. Generally, the Fund is subject to examinations by such taxing authorities for up to three years after the filing of the return for the tax period.
| F. | Expenses — Fees provided for under the Rule 12b-1 plan of a particular class of the Fund and which are directly attributable to that class are charged to the operations of such class. All other expenses are allocated among the classes based on relative net assets. |
| G. | Accounting Estimates — The preparation of financial statements in conformity with accounting principles generally accepted in the United States of America (“GAAP”) requires management to make estimates and assumptions that affect the reported amounts of assets and liabilities at the date of the financial statements and the reported amounts of revenues and expenses during the reporting period including estimates and assumptions related to taxation. Actual results could differ from those estimates by a significant amount. In addition, the Fund monitors for material events or transactions that may occur or become known after the period-end date and before the date the financial statements are released to print. |
| H. | Indemnifications — Under the Trust’s organizational documents, each Trustee, officer, employee or other agent of the Trust is indemnified against certain liabilities that may arise out of the performance of their duties to the Fund. Additionally, in the normal course of business, the Fund enters into contracts, including the Fund’s servicing agreements, that contain a variety of indemnification clauses. The Fund’s maximum exposure under these arrangements is unknown as this would involve future claims that may be made against the Fund that have not yet occurred. The risk of material loss as a result of such indemnification claims is considered remote. |
| I. | Securities Lending — The Fund may lend portfolio securities having a market value up to one-third of the Fund’s total assets. Such loans are secured by collateral equal to no less than the market value of the loaned securities determined daily by the securities lending provider. Such collateral will be cash or debt securities issued or guaranteed by the U.S. Government or any of its sponsored agencies. Cash collateral received in connection with these loans is invested in short-term money market instruments or affiliated money market funds and is shown as such on the Schedule of Investments. The Fund bears the risk of loss with respect to the investment of collateral. It is the Fund’s policy to obtain additional collateral from or return excess collateral to the borrower by the end of the next business day, following the valuation date of the securities loaned. Therefore, the value of the collateral held may be temporarily less than the value of the securities on loan. When loaning securities, the Fund retains certain benefits of owning the securities, including the economic equivalent of dividends or interest generated by the security. Lending securities entails a risk of loss to the Fund if, and to the extent that, the market value of the securities loaned were to increase and the borrower did not increase the collateral accordingly, and the borrower failed to return the securities. The securities loaned are subject to termination at the option of the borrower or the Fund. Upon termination, the borrower will return to the Fund the securities loaned and the Fund will return the collateral. Upon the failure of the borrower to return the securities, collateral may be liquidated and the securities may be purchased on the open market to replace the loaned securities. The Fund could experience delays and costs in gaining access to the collateral and the securities may lose value during the delay which could result in potential losses to the Fund. Some of these losses may be indemnified by the lending agent. The Fund bears the risk of any deficiency in the amount of the collateral available for return to the borrower due to any loss on the collateral invested. Dividends received on cash collateral investments for securities lending transactions, which are net of compensation to counterparties, are included in Dividends from affiliated money market funds on the Statement of Operations. The aggregate value of securities out on loan, if any, is shown as a footnote on the Statement of Assets and Liabilities. |
| J. | Foreign Currency Translations — Foreign currency is valued at the close of the NYSE based on quotations posted by banks and major currency dealers. Portfolio securities and other assets and liabilities denominated in foreign currencies are translated into U.S. dollar amounts at date of valuation. Purchases and sales of portfolio securities (net of foreign taxes withheld on disposition) and income items denominated in foreign currencies are translated into U.S. dollar amounts on the respective dates of such transactions. The Fund does not separately account for the portion of the results of operations resulting from changes in foreign exchange rates on investments and the fluctuations arising from changes in market prices of securities held. The combined results of changes in foreign exchange rates and the fluctuation of market prices on investments (net of estimated foreign tax withholding) are included with the net realized and unrealized gain or loss from investments in the Statement of Operations. Reported net realized foreign currency gains or losses arise from (1) sales of foreign currencies, (2) currency gains or losses realized between the trade and settlement dates on securities transactions, and (3) the difference between the amounts of dividends, interest, and foreign withholding taxes recorded on the Fund’s books and the U.S. dollar equivalent of the amounts actually received or paid. Net unrealized foreign currency gains and losses arise from changes in the fair values of assets and liabilities, other than investments in securities at fiscal period end, resulting from changes in exchange rates. |
The Fund may invest in foreign securities, which may be subject to foreign taxes on income, gains on investments or currency repatriation, a portion of which may be recoverable. Foreign taxes, if any, are recorded based on the tax regulations and rates that exist in the foreign markets in which the Fund invests and are shown in the Statement of Operations.
| K. | Forward Foreign Currency Contracts — The Fund may engage in foreign currency transactions either on a spot (i.e. for prompt delivery and settlement) basis, or through forward foreign currency contracts, to manage or minimize currency or exchange rate risk. |
The Fund may also enter into forward foreign currency contracts for the purchase or sale of a security denominated in a foreign currency in order to “lock in” the U.S. dollar price of that security, or the Fund may also enter into forward foreign currency contracts that do not provide for physical settlement of the two currencies, but instead are settled by a single cash payment calculated as the difference between the agreed upon exchange rate and the spot rate at settlement based upon an agreed upon notional amount (non-deliverable forwards). The Fund will set aside liquid assets in an amount equal to the daily mark-to-market obligation for forward foreign currency contracts.
A forward foreign currency contract is an obligation between two parties (“Counterparties”) to purchase or sell a specific currency for an agreed-upon price at a future date. The use of forward foreign currency contracts does not eliminate fluctuations in the price of the underlying securities the Fund owns or intends to acquire but establishes a rate of exchange in advance. Fluctuations in the value of these contracts are measured by the difference in the contract date and reporting date exchange rates and are recorded as unrealized appreciation (depreciation) until the contracts are closed. When the contracts are closed, realized gains (losses) are recorded. Realized and unrealized gains (losses) on the contracts are included in the Statement of Operations. The primary risks associated with forward foreign currency contracts include failure of the Counterparty to meet the terms of the contract and the value of the foreign currency changing unfavorably. These risks may be in excess of the amounts reflected in the Statement of Assets and Liabilities.
Invesco V.I. Mid Cap Growth Fund
NOTE 2—Advisory Fees and Other Fees Paid to Affiliates
The Trust has entered into a master investment advisory agreement with Invesco Advisers, Inc. (the “Adviser” or “Invesco”). Under the terms of the investment advisory agreement, the Fund accrues daily and pays monthly an advisory fee to the Adviser based on the annual rate of the Fund’s average daily net assets as follows:
| | | | |
| Average Daily Net Assets | | Rate | |
First $500 million | | | 0.75% | |
Next $500 million | | | 0.70% | |
Over $1 billion | | | 0.65% | |
For the year ended December 31, 2017, the effective advisory fees incurred by the Fund was 0.75%.
Under the terms of a master sub-advisory agreement between the Adviser and each of Invesco Asset Management Deutschland GmbH, Invesco Asset Management Limited, Invesco Asset Management (Japan) Limited, Invesco Hong Kong Limited, Invesco Senior Secured Management, Inc. and Invesco Canada Ltd. and separate sub-advisory agreements with Invesco PowerShares Capital Management LLC and Invesco Asset Management (India) Private Limited (collectively, the “Affiliated Sub-Advisers”) the Adviser, not the Fund, will pay 40% of the fees paid to the Adviser to any such Affiliated Sub-Adviser(s) that provide(s) discretionary investment management services to the Fund based on the percentage of assets allocated to such Affiliated Sub-Adviser(s).
The Adviser has contractually agreed, through at least June 30, 2018, to waive advisory fees and/or reimburse expenses of all shares to the extent necessary to limit total annual fund operating expenses after fee waiver and/or expense reimbursement (excluding certain items discussed below) of Series I shares to 2.00% and Series II shares to 2.25% of average daily net assets (the “expense limits”). In determining the Adviser’s obligation to waive advisory fees and/or reimburse expenses, the following expenses are not taken into account, and could cause the total annual fund operating expenses after fee waiver and/or expense reimbursement to exceed the numbers reflected above: (1) interest; (2) taxes; (3) dividend expense on short sales; (4) extraordinary or non-routine items, including litigation expenses; and (5) expenses that the Fund has incurred but did not actually pay because of an expense offset arrangement. Unless Invesco continues the fee waiver agreement, it will terminate on June 30, 2018. During its term, the fee waiver agreement cannot be terminated or amended to increase expense limits or reduce the advisory fee waiver without approval of the Board of Trustees. The Adviser did not waive fees and/or reimburse expenses during the period under these expense limits.
Further, the Adviser has contractually agreed, through at least June 30, 2019, to waive the advisory fee payable by the Fund in an amount equal to 100% of the net advisory fees the Adviser receives from the affiliated money market funds on investments by the Fund of uninvested cash (excluding investments of cash collateral from securities lending) in such affiliated money market funds.
For the year ended December 31, 2017, the Adviser waived advisory fees of $3,338.
The Trust has entered into a master administrative services agreement with Invesco pursuant to which the Fund has agreed to pay Invesco a fee for costs incurred in providing accounting services and fund administrative services to the Fund and to reimburse Invesco for fees paid to insurance companies that have agreed to provide certain administrative services to the Fund. These administrative services provided by the insurance companies may include, among other things: maintenance of master accounts with the Fund; tracking, recording and transmitting net purchase and redemption orders for Fund shares; maintaining and preserving records related to the purchase, redemption and other account activity of variable product owners; distributing copies of Fund documents such as prospectuses, proxy materials and periodic reports, to variable product owners, and responding to inquiries from variable product owners about the Fund. Pursuant to such agreement, for the year ended December 31, 2017, Invesco was paid $57,559 for accounting and fund administrative services and was reimbursed $342,266 for fees paid to insurance companies.
The Trust has entered into a transfer agency and service agreement with Invesco Investment Services, Inc. (“IIS”) pursuant to which the Fund has agreed to pay IIS a fee for providing transfer agency and shareholder services to the Fund and reimburse IIS for certain expenses incurred by IIS in the course of providing such services. For the year ended December 31, 2017, expenses incurred under the agreement are shown in the Statement of Operations as Transfer agent fees.
The Trust has entered into a master distribution agreement with Invesco Distributors, Inc. (“IDI”) to serve as the distributor for the Fund. The Trust has adopted a plan pursuant to Rule 12b-1 under the 1940 Act with respect to the Fund’s Series II shares (the “Plan”). The Fund, pursuant to the Plan, pays IDI compensation at the annual rate of 0.25% of the Fund’s average daily net assets of Series II shares. The fees are accrued daily and paid monthly. Of the Plan payments, up to 0.25% of the average daily net assets of the Series II shares may be paid to insurance companies who furnish continuing personal shareholder services to customers who purchase and own Series II shares of the Fund. For the year ended December 31, 2017, expenses incurred under the Plan are detailed in the Statement of Operations as Distribution fees.
For the year ended December 31, 2017, the Fund incurred $1,949 in brokerage commissions with Invesco Capital Markets, Inc., an affiliate of the Adviser and IDI, for portfolio transactions executed on behalf of the Fund.
Certain officers and trustees of the Trust are officers and directors of the Adviser, IIS and/or IDI.
NOTE 3—Additional Valuation Information
GAAP defines fair value as the price that would be received to sell an asset or paid to transfer a liability in an orderly transaction between market participants at the measurement date, under current market conditions. GAAP establishes a hierarchy that prioritizes the inputs to valuation methods, giving the highest priority to readily available unadjusted quoted prices in an active market for identical assets (Level 1) and the lowest priority to significant unobservable inputs (Level 3), generally when market prices are not readily available or are unreliable. Based on the valuation inputs, the securities or other investments are tiered into one of three levels. Changes in valuation methods may result in transfers in or out of an investment’s assigned level:
| | Level 1 — | Prices are determined using quoted prices in an active market for identical assets. |
| | Level 2 — | Prices are determined using other significant observable inputs. Observable inputs are inputs that other market participants may use in pricing a security. These may include quoted prices for similar securities, interest rates, prepayment speeds, credit risk, yield curves, loss severities, default rates, discount rates, volatilities and others. |
| | Level 3 — | Prices are determined using significant unobservable inputs. In situations where quoted prices or observable inputs are unavailable (for example, when there is little or no market activity for an investment at the end of the period), unobservable inputs may be used. Unobservable inputs reflect the Fund’s own assumptions about the factors market participants would use in determining fair value of the securities or instruments and would be based on the best available information. |
Invesco V.I. Mid Cap Growth Fund
The following is a summary of the tiered valuation input levels, as of December 31, 2017. The level assigned to the securities valuations may not be an indication of the risk or liquidity associated with investing in those securities. Because of the inherent uncertainties of valuation, the values reflected in the financial statements may materially differ from the value received upon actual sale of those investments.
The Fund’s policy is to recognize transfers in and out of the valuation levels as of the end of the reporting period. During the year ended December 31, 2017, there were no material transfers between valuation levels.
| | | | | | | | | | | | | | | | |
| | | Level 1 | | | Level 2 | | | Level 3 | | | Total | |
| Investment in Securities | | | | | | | | | | | | |
Common Stocks & Other Equity Interests | | $ | 229,992,617 | | | $ | 1,565,493 | | | $ | — | | | $ | 231,558,110 | |
Money Market Funds | | | 3,022 | | | | — | | | | — | | | | 3,022 | |
Total Investments | | $ | 229,995,639 | | | $ | 1,565,493 | | | $ | — | | | $ | 231,561,132 | |
NOTE 4—Security Transactions with Affiliated Funds
The Fund is permitted to purchase or sell securities from or to certain other Invesco Funds under specified conditions outlined in procedures adopted by the Board of Trustees of the Trust. The procedures have been designed to ensure that any purchase or sale of securities by the Fund from or to another fund or portfolio that is or could be considered an affiliate by virtue of having a common investment adviser (or affiliated investment advisers), common Trustees and/or common officers complies with Rule 17a-7 of the 1940 Act. Further, as defined under the procedures, each transaction is effected at the current market price. Pursuant to these procedures, for the year ended December 31, 2017, the Fund engaged in securities sales of $176,372, which resulted in net realized gains (losses) of $(19,096).
NOTE 5—Trustees’ and Officers’ Fees and Benefits
Trustees’ and Officers’ Fees and Benefits include amounts accrued by the Fund to pay remuneration to certain Trustees and Officers of the Fund. Trustees have the option to defer compensation payable by the Fund, and Trustees’ and Officers’ Fees and Benefits also include amounts accrued by the Fund to fund such deferred compensation amounts. Those Trustees who defer compensation have the option to select various Invesco Funds in which their deferral accounts shall be deemed to be invested. Finally, certain current Trustees were eligible to participate in a retirement plan that provided for benefits to be paid upon retirement to Trustees over a period of time based on the number of years of service. The Fund may have certain former Trustees who also participate in a retirement plan and receive benefits under such plan. Trustees’ and Officers’ Fees and Benefits include amounts accrued by the Fund to fund such retirement benefits. Obligations under the deferred compensation and retirement plans represent unsecured claims against the general assets of the Fund.
NOTE 6—Cash Balances
The Fund is permitted to temporarily carry a negative or overdrawn balance in its account with State Street Bank and Trust Company, the custodian bank. Such balances, if any at period-end, are shown in the Statement of Assets and Liabilities under the payable caption Amount due custodian. To compensate the custodian bank for such overdrafts, the overdrawn Fund may either (1) leave funds as a compensating balance in the account so the custodian bank can be compensated by earning the additional interest; or (2) compensate by paying the custodian bank at a rate agreed upon by the custodian bank and Invesco, not to exceed the contractually agreed upon rate.
NOTE 7—Distributions to Shareholders and Tax Components of Net Assets
Tax Character of Distributions to Shareholders Paid During the Fiscal Years Ended December 31, 2017 and 2016:
| | | | | | | | |
| | | 2017 | | | 2016 | |
Long-term capital gain | | $ | 14,359,157 | | | $ | 24,403,427 | |
Tax Components of Net Assets at Period-End:
| | | | |
| | | 2017 | |
Undistributed long-term gain | | $ | 23,382,162 | |
Net unrealized appreciation — investments | | | 61,004,270 | |
Net unrealized appreciation (depreciation) — foreign currencies | | | (26,359 | ) |
Temporary book/tax differences | | | (113,132 | ) |
Shares of beneficial interest | | | 147,396,842 | |
Total net assets | | $ | 231,643,783 | |
The difference between book-basis and tax-basis unrealized appreciation (depreciation) is due to differences in the timing of recognition of gains and losses on investments for tax and book purposes. The Fund’s net unrealized appreciation difference is attributable primarily to wash sales.
The temporary book/tax differences are a result of timing differences between book and tax recognition of income and/or expenses. The Fund’s temporary book/tax differences are the result of the trustee deferral of compensation and retirement plan benefits.
Capital loss carryforward is calculated and reported as of a specific date. Results of transactions and other activity after that date may affect the amount of capital loss carryforward actually available for the Fund to utilize. Capital losses generated in years beginning after December 22, 2010 can be carried forward for an unlimited period, whereas previous losses expire in eight tax years. Capital losses with an expiration period may not be used to offset capital gains until all net capital losses without an expiration date have been utilized. Capital loss carryforwards with no expiration date will retain their character as either short-term or long-term capital losses instead of as short-term capital losses as under prior law. The ability to utilize capital loss carryforwards in the future may be limited under the Internal Revenue Code and related regulations based on the results of future transactions.
Invesco V.I. Mid Cap Growth Fund
The Fund does not have a capital loss carryforward as of December 31, 2017.
NOTE 8—Investment Transactions
The aggregate amount of investment securities (other than short-term securities, U.S. Treasury obligations and money market funds, if any) purchased and sold by the Fund during the year ended December 31, 2017 was $103,963,003 and $128,739,123, respectively. Cost of investments, including any derivatives, on a tax basis includes the adjustments for financial reporting purposes as of the most recently completed federal income tax reporting period-end.
| | | | |
| Unrealized Appreciation (Depreciation) of Investments on a Tax Basis | |
Aggregate unrealized appreciation of investments | | $ | 64,051,856 | |
Aggregate unrealized (depreciation) of investments | | | (3,047,586 | ) |
Net unrealized appreciation of investments | | $ | 61,004,270 | |
Cost of investments for tax purposes is $170,556,862.
NOTE 9—Reclassification of Permanent Differences
Primarily as a result of differing book/tax treatment of net operating losses, on December 31, 2017, undistributed net investment income (loss) was increased by $1,058,651, undistributed net realized gain was decreased by $767,906 and shares of beneficial interest was decreased by $290,745. This reclassification had no effect on the net assets of the Fund.
NOTE 10—Share Information
| | | | | | | | | | | | | | | | |
| | | Summary of Share Activity | |
| | | Years ended December 31, | |
| | | 2017(a) | | | 2016 | |
| | | Shares | | | Amount | | | Shares | | | Amount | |
Sold: | | | | | | | | | | | | | | | | |
Series I | | | 2,110,516 | | | $ | 11,337,794 | | | | 3,420,749 | | | $ | 17,586,771 | |
Series II | | | 1,772,258 | | | | 9,394,698 | | | | 4,122,162 | | | | 21,135,860 | |
| | | | |
Issued as reinvestment of dividends: | | | | | | | | | | | | | | | | |
Series I | | | 1,252,479 | | | | 6,675,715 | | | | 2,033,092 | | | | 10,165,462 | |
Series II | | | 1,463,513 | | | | 7,683,442 | | | | 2,882,179 | | | | 14,237,965 | |
| | | | |
Reacquired: | | | | | | | | | | | | | | | | |
Series I | | | (3,864,213 | ) | | | (20,921,278 | ) | | | (4,780,869 | ) | | | (24,334,450 | ) |
Series II | | | (4,767,695 | ) | | | (25,464,196 | ) | | | (13,091,408 | ) | | | (65,355,921 | ) |
Net increase (decrease) in share activity | | | (2,033,142 | ) | | $ | (11,293,825 | ) | | | (5,414,095 | ) | | $ | (26,564,313 | ) |
| (a) | There are entities that are record owners of more than 5% of the outstanding shares of the Fund and in the aggregate own 55% of the outstanding shares of the Fund. The Fund and the Fund’s principal underwriter or adviser, are parties to participation agreements with these entities whereby these entities sell units of interest in separate accounts funding variable products that are invested in the Fund. The Fund, Invesco and/or Invesco affiliates may make payments to these entities, which are considered to be related to the Fund, for providing services to the Fund, Invesco and/or Invesco affiliates including but not limited to services such as, securities brokerage, third party record keeping and account servicing and administrative services. The Fund has no knowledge as to whether all or any portion of the shares owned of record by these entities are also owned beneficially. |
Invesco V.I. Mid Cap Growth Fund
NOTE 11—Financial Highlights
The following schedule presents financial highlights for a share of the Fund outstanding throughout the periods indicated.
| | | | | | | | | | | | | | | | | | | | | | | | | | | | | | | | | | | | | | | | | | | | | | | | | | | | | | | | |
| | | Net asset
value,
beginning
of period | | | Net
investment
income
(loss)(a) | | | Net gains
on securities
(both
realized and
unrealized) | | | Total from
investment
operations | | | Dividends
from net
investment
income | | | Distributions
from net
realized
gains | | | Total
distributions | | | Net asset
value, end
of period | | | Total
return(b) | | | Net assets,
end of period
(000’s omitted) | | | Ratio of
expenses
to average
net assets
with fee waivers
and/or expenses
absorbed | | | Ratio of
expenses
to average net
assets without
fee waivers
and/or expenses
absorbed | | | Ratio of net
investment
income (loss)
to average
net assets | | | Portfolio
turnover(c) | |
Series I | | | | | | | | | | | | | | | | | | | | | | | | | | | | | | | | | | | | | | | | | | | | | | | | | | | | | | | | |
Year ended 12/31/17 | | $ | 4.89 | | | $ | (0.02 | ) | | $ | 1.10 | | | $ | 1.08 | | | $ | — | | | $ | (0.35 | ) | | $ | (0.35 | ) | | $ | 5.62 | | | | 22.49 | % | | $ | 109,197 | | | | 1.00 | %(d) | | | 1.00 | %(d) | | | (0.34 | )%(d) | | | 46 | % |
Year ended 12/31/16 | | | 5.38 | | | | (0.02 | ) | | | 0.07 | | | | 0.05 | | | | — | | | | (0.54 | ) | | | (0.54 | ) | | | 4.89 | | | | 0.76 | | | | 97,444 | | | | 1.03 | | | | 1.03 | | | | (0.39 | ) | | | 60 | |
Year ended 12/31/15 | | | 5.78 | | | | (0.02 | ) | | | 0.08 | | | | 0.06 | | | | — | | | | (0.46 | ) | | | (0.46 | ) | | | 5.38 | | | | 1.21 | | | | 103,632 | | | | 1.07 | | | | 1.07 | | | | (0.33 | ) | | | 62 | |
Year ended 12/31/14 | | | 5.35 | | | | (0.02 | ) | | | 0.45 | | | | 0.43 | | | | — | | | | — | | | | — | | | | 5.78 | | | | 8.04 | | | | 106,390 | | | | 1.07 | | | | 1.07 | | | | (0.36 | ) | | | 71 | |
Year ended 12/31/13 | | | 3.92 | | | | (0.02 | ) | | | 1.47 | | | | 1.45 | | | | (0.02 | ) | | | — | | | | (0.02 | ) | | | 5.35 | | | | 37.01 | | | | 115,319 | | | | 1.08 | | | | 1.08 | | | | (0.41 | ) | | | 76 | |
Series II | | | | | | | | | | | | | | | | | | | | | | | | | | | | | | | | | | | | | | | | | | | | | | | | | | | | | | | | |
Year ended 12/31/17 | | | 4.83 | | | | (0.03 | ) | | | 1.08 | | | | 1.05 | | | | — | | | | (0.35 | ) | | | (0.35 | ) | | | 5.53 | | | | 22.14 | | | | 122,447 | | | | 1.25 | (d) | | | 1.25 | (d) | | | (0.59 | )(d) | | | 46 | |
Year ended 12/31/16 | | | 5.33 | | | | (0.03 | ) | | | 0.07 | | | | 0.04 | | | | — | | | | (0.54 | ) | | | (0.54 | ) | | | 4.83 | | | | 0.57 | | | | 114,282 | | | | 1.28 | | | | 1.28 | | | | (0.64 | ) | | | 60 | |
Year ended 12/31/15 | | | 5.74 | | | | (0.03 | ) | | | 0.08 | | | | 0.05 | | | | — | | | | (0.46 | ) | | | (0.46 | ) | | | 5.33 | | | | 1.04 | | | | 158,684 | | | | 1.32 | | | | 1.32 | | | | (0.58 | ) | | | 62 | |
Year ended 12/31/14 | | | 5.33 | | | | (0.03 | ) | | | 0.44 | | | | 0.41 | | | | — | | | | — | | | | — | | | | 5.74 | | | | 7.69 | | | | 162,299 | | | | 1.32 | | | | 1.32 | | | | (0.61 | ) | | | 71 | |
Year ended 12/31/13 | | | 3.91 | | | | (0.03 | ) | | | 1.46 | | | | 1.43 | | | | (0.01 | ) | | | — | | | | (0.01 | ) | | | 5.33 | | | | 36.60 | | | | 172,478 | | | | 1.33 | | | | 1.33 | | | | (0.66 | ) | | | 76 | |
| (a) | Calculated using average shares outstanding. |
| (b) | Includes adjustments in accordance with accounting principles generally accepted in the United States of America and as such, the net asset value for financial reporting purposes and the returns based upon those net asset values may differ from the net asset value and returns for shareholder transactions. Total returns are not annualized for periods less than one year, if applicable, and do not reflect charges assessed in connection with a variable product, which if included would reduce total returns. |
| (c) | Portfolio turnover is calculated at the fund level and is not annualized for periods less than one year, if applicable. |
| (d) | Ratios are based on average daily net assets (000’s omitted) of $106,745 and $121,774 for Series I and Series II shares, respectively. |
Invesco V.I. Mid Cap Growth Fund
Report of Independent Registered Public Accounting Firm
To the Board of Trustees of AIM Variable Insurance Funds (Invesco Variable Insurance Funds) and Shareholders of Invesco V.I. Mid Cap Growth Fund
Opinion on the Financial Statements
We have audited the accompanying statement of assets and liabilities, including the schedule of investments, of Invesco V.I. Mid Cap Growth Fund (one of the funds constituting AIM Variable Insurance Funds (Invesco Variable Insurance Funds), hereafter referred to as the “Fund”) as of December 31, 2017, the related statement of operations for the year ended December 31, 2017, the statement of changes in net assets for each of the two years in the period ended December 31, 2017, including the related notes, and the financial highlights for each of the five years in the period ended December 31, 2017 (collectively referred to as the “financial statements”). In our opinion, the financial statements present fairly, in all material respects, the financial position of the Fund as of December 31, 2017, the results of its operations for the year then ended, the changes in its net assets for each of the two years in the period ended December 31, 2017 and the financial highlights for each of the five years in the period ended December 31, 2017 in conformity with accounting principles generally accepted in the United States of America.
Basis for Opinion
These financial statements are the responsibility of the Fund’s management. Our responsibility is to express an opinion on the Fund’s financial statements based on our audits. We are a public accounting firm registered with the Public Company Accounting Oversight Board (United States) (“PCAOB”) and are required to be independent with respect to the Fund in accordance with the U.S. federal securities laws and the applicable rules and regulations of the Securities and Exchange Commission and the PCAOB.
We conducted our audits of these financial statements in accordance with the standards of the PCAOB. Those standards require that we plan and perform the audit to obtain reasonable assurance about whether the financial statements are free of material misstatement, whether due to error or fraud.
Our audits included performing procedures to assess the risks of material misstatement of the financial statements, whether due to error or fraud, and performing procedures that respond to those risks. Such procedures included examining, on a test basis, evidence regarding the amounts and disclosures in the financial statements. Our audits also included evaluating the accounting principles used and significant estimates made by management, as well as evaluating the overall presentation of the financial statements. Our procedures included confirmation of securities owned as of December 31, 2017 by correspondence with the custodian, transfer agent and brokers; when replies were not received from brokers, we performed other auditing procedures. We believe that our audits provide a reasonable basis for our opinion.
PricewaterhouseCoopers LLP
Houston, TX
February 14, 2018
We have served as the auditor of one or more of the investment companies in the Invesco/PowerShares group of investment companies since at least 1995. We have not determined the specific year we began serving as auditor.
Invesco V.I. Mid Cap Growth Fund
Calculating your ongoing Fund expenses
Example
As a shareholder of the Fund, you incur ongoing costs, including management fees; distribution and/or service fees (12b-1); and other Fund expenses. This example is intended to help you understand your ongoing costs (in dollars) of investing in the Fund and to compare these costs with ongoing costs of investing in other mutual funds. The example is based on an investment of $1,000 invested at the beginning of the period and held for the entire period July 1, 2017 through December 31, 2017.
The actual and hypothetical expenses in the examples below do not represent the effect of any fees or other expenses assessed in connection with a variable product; if they did, the expenses shown would be higher while the ending account values shown would be lower.
Actual expenses
The table below provides information about actual account values and actual expenses. You may use the information in this table, together with the amount you invested, to estimate the expenses that you paid over the period. Simply divide your account value by $1,000 (for example, an $8,600 account value divided by $1,000 = 8.6), then multiply the result by the number in the table under the heading entitled “Actual Expenses Paid During Period” to estimate the expenses you paid on your account during this period.
Hypothetical example for comparison purposes
The table below also provides information about hypothetical account values and hypothetical expenses based on the Fund’s actual expense ratio and an assumed rate of return of 5% per year before expenses, which is not the Fund’s actual return.
The hypothetical account values and expenses may not be used to estimate the actual ending account balance or expenses you paid for the period. You may use this information to compare the ongoing costs of investing in the Fund and other funds. To do so, compare this 5% hypothetical example with the 5% hypothetical examples that appear in the shareholder reports of the other funds.
Please note that the expenses shown in the table are meant to highlight your ongoing costs. Therefore, the hypothetical information is useful in comparing ongoing costs, and will not help you determine the relative total costs of owning different funds.
| | | | | | | | | | | | | | | | | | | | | | | | |
| Class | | Beginning
Account Value
(07/01/17) | | | ACTUAL | | | HYPOTHETICAL (5% annual return before
expenses) | | | Annualized
Expense
Ratio | |
| | | Ending
Account Value
(12/31/17)1 | | | Expenses
Paid During
Period2 | | | Ending
Account Value
(12/31/17) | | | Expenses
Paid During
Period2 | | |
| Series I | | $ | 1,000.00 | | | $ | 1,075.40 | | | $ | 5.18 | | | $ | 1,020.21 | | | $ | 5.04 | | | | 0.99 | % |
| Series II | | | 1,000.00 | | | | 1,074.60 | | | | 6.48 | | | | 1,018.95 | | | | 6.31 | | | | 1.24 | |
| 1 | The actual ending account value is based on the actual total return of the Fund for the period July 1, 2017 through December 31, 2017, after actual expenses and will differ from the hypothetical ending account value which is based on the Fund’s expense ratio and a hypothetical annual return of 5% before expenses. |
| 2 | Expenses are equal to the Fund’s annualized expense ratio as indicated above multiplied by the average account value over the period, multiplied by 184/365 to reflect the most recent fiscal half year. |
Invesco V.I. Mid Cap Growth Fund
Tax Information
Form 1099-DIV, Form 1042-S and other year-end tax information provide shareholders with actual calendar year amounts that should be included in their tax returns. Shareholders should consult their tax advisors.
The following distribution information is being provided as required by the Internal Revenue Code or to meet a specific state’s requirement.
The Fund designates the following amounts or, if subsequently determined to be different, the maximum amount allowable for its fiscal year ended December 31, 2017:
| | | | |
Federal and State Income Tax | |
Long-Term Capital Gain Distributions | | $ | 14,359,157 | |
Corporate Dividends Received Deduction* | | | 0.00 | % |
U.S. Treasury Obligations* | | | 0.00 | % |
| | * | The above percentages are based on ordinary income dividends paid to shareholders during the Fund’s fiscal year. |
Invesco V.I. Mid Cap Growth Fund
Trustees and Officers
The address of each trustee and officer is AIM Variable Insurance Funds (Invesco Variable Insurance Funds) (the “Trust”), 11 Greenway Plaza, Suite 1000, Houston, Texas 77046-1173. The trustees serve for the life of the Trust, subject to their earlier death, incapacitation, resignation, retirement or removal as more specifically provided in the Trust’s organizational documents. Each officer serves for a one year term or until their successors are elected and qualified. Column two below includes length of time served with predecessor entities, if any.
| | | | | | | | |
Name, Year of Birth and
Position(s) Held with the Trust | | Trustee and/
or Officer Since | | Principal Occupation(s)
During Past 5 Years | | Number of
Funds in Fund
Complex
Overseen by
Trustee | | Other Directorship(s)
Held by Trustee During
Past 5 Years |
| Interested Persons | | | | | | | | |
Martin L. Flanagan1 — 1960 Trustee | | 2007 | | Executive Director, Chief Executive Officer and President, Invesco Ltd. (ultimate parent of Invesco and a global investment management firm); Trustee, The Invesco Funds; Vice Chair, Investment Company Institute; and Member of Executive Board, SMU Cox School of Business Formerly: Advisor to the Board, Invesco Advisers, Inc. (formerly known as Invesco Institutional (N.A.), Inc.); Chairman and Chief Executive Officer, Invesco Advisers, Inc. (registered investment adviser); Director, Chairman, Chief Executive Officer and President, Invesco Holding Company (US), Inc. (formerly IVZ Inc.) (holding company), Invesco Group Services, Inc. (service provider) and Invesco North American Holdings, Inc. (holding company); Director, Chief Executive Officer and President, Invesco Holding Company Limited (parent of Invesco and a global investment management firm); Director, Invesco Ltd.; Chairman, Investment Company Institute and President, Co-Chief Executive Officer, Co-President, Chief Operating Officer and Chief Financial Officer, Franklin Resources, Inc. (global investment management organization) | | 158 | | None |
Philip A. Taylor2 — 1954 Trustee and Senior Vice President | | 2006 | | Head of the Americas and Senior Managing Director, Invesco Ltd.; Director, Invesco Advisers, Inc. (formerly known as Invesco Institutional (N.A.), Inc.) (registered investment adviser); Director, Chairman, Chief Executive Officer and President, Invesco Management Group, Inc. (formerly known as Invesco Aim Management Group, Inc.) (financial services holding company); Director and Chairman, Invesco Investment Services, Inc. (formerly known as Invesco Aim Investment Services, Inc.) (registered transfer agent); Chief Executive Officer, Invesco Corporate Class Inc. (corporate mutual fund company); Director, Chairman and Chief Executive Officer, Invesco Canada Ltd. (formerly known as Invesco Trimark Ltd./Invesco Trimark Ltèe) (registered investment adviser and registered transfer agent); Trustee and Senior Vice President, The Invesco Funds; Director, Invesco Investment Advisers LLC (formerly known as Van Kampen Asset Management). Formerly: Co-Chairman, Co-President and Co-Chief Executive Officer, Invesco Advisers, Inc. (formerly known as Invesco Institutional (N.A.), Inc.) (registered investment adviser); Director, Chief Executive Officer and President, Van Kampen Exchange Corp; President and Principal Executive Officer, The Invesco Funds (other than AIM Treasurer’s Series Trust (Invesco Treasurer’s Series Trust), Short-Term Investments Trust and Invesco Management Trust); Executive Vice President, The Invesco Funds (AIM Treasurer’s Series Trust (Invesco Treasurer’s Series Trust), Short-Term Investments Trust and Invesco Management Trust only); Director and President, INVESCO Funds Group, Inc. (registered investment adviser and registered transfer agent); Director and Chairman, IVZ Distributors, Inc. (formerly known as INVESCO Distributors, Inc.) (registered broker dealer); Director, President and Chairman, Invesco Inc. (holding company), Invesco Canada Holdings Inc. (holding company), Trimark Investments Ltd./Placements Trimark Ltèe and Invesco Financial Services Ltd/Services Financiers Invesco Ltèe; Chief Executive Officer, Invesco Canada Fund Inc. (corporate mutual fund company); Director and Chairman, Van Kampen Investor Services Inc.; Director, Chief Executive Officer and President, 1371 Preferred Inc. (holding company) and Van Kampen Investments Inc.; Director and President, AIM GP Canada Inc. (general partner for limited partnerships) and Van Kampen Advisors, Inc.; Director and Chief Executive Officer, Invesco Trimark Dealer Inc. (registered broker dealer); Director, Invesco Distributors, Inc. (formerly known as Invesco Aim Distributors, Inc.) (registered broker dealer); Manager, Invesco PowerShares Capital Management LLC; Director, Chief Executive Officer and President, Invesco Advisers, Inc.; Director, Chairman, Chief Executive Officer and President, Invesco Aim Capital Management, Inc.; President, Invesco Trimark Dealer Inc. and Invesco Trimark Ltd./Invesco Trimark Ltèe; Director and President, AIM Trimark Corporate Class Inc. and AIM Trimark Canada Fund Inc.; Senior Managing Director, Invesco Holding Company Limited; Director and Chairman, Fund Management Company (former registered broker dealer); President and Principal Executive Officer, The Invesco Funds (AIM Treasurer’s Series Trust (Invesco Treasurer’s Series Trust), and Short-Term Investments Trust only); President, AIM Trimark Global Fund Inc. and AIM Trimark Canada Fund Inc. | | 158 | | None |
| 1 | Mr. Flanagan is considered an interested person (within the meaning of Section 2(a)(19) of the 1940 Act) of the Trust because he is an officer of the Adviser to the Trust, and an officer and a director of Invesco Ltd., ultimate parent of the Adviser. |
| 2 | Mr. Taylor is considered an interested person (within the meaning of Section 2(a)(19) of the 1940 Act) of the Trust because he is an officer and a director of the Adviser. |
Invesco V.I. Mid Cap Growth Fund
Trustees and Officers—(continued)
| | | | | | | | |
Name, Year of Birth and
Position(s) Held with the Trust | | Trustee and/
or Officer Since | | Principal Occupation(s)
During Past 5 Years | | Number of
Funds in Fund
Complex
Overseen by
Trustee | | Other Directorship(s)
Held by Trustee During
Past 5 Years |
| Independent Trustees | | | | | | | | |
Bruce L. Crockett — 1944 Trustee and Chair | | 1993 | | Chairman, Crockett Technologies Associates (technology consulting company) Formerly: Director, Captaris (unified messaging provider); Director, President and Chief Executive Officer, COMSAT Corporation; Chairman, Board of Governors of INTELSAT (international communications company); ACE Limited (insurance company); Independent Directors Council and Investment Company Institute: Member of the Audit Committee, Investment Company Institute; Member of the Executive Committee and Chair of the Governance Committee, Independent Directors Council | | 158 | | Director and Chairman of the Audit Committee, ALPS (Attorneys Liability Protection Society) (insurance company); Director and Member of the Audit Committee and Compensation Committee, Ferroglobe PLC (metallurgical company) |
David C. Arch — 1945 Trustee | | 2010 | | Chairman of Blistex Inc. (consumer health care products manufacturer); Member, World Presidents’ Organization | | 158 | | Board member of the Illinois Manufacturers’ Association |
Jack M. Fields — 1952 Trustee | | 1997 | | Chief Executive Officer, Twenty First Century Group, Inc. (government affairs company); and Chairman, Discovery Learning Alliance (non-profit) Formerly: Owner and Chief Executive Officer, Dos Angeles Ranch L.P. (cattle, hunting, corporate entertainment); Director, Insperity, Inc. (formerly known as Administaff) (human resources provider); Chief Executive Officer, Texana Timber LP (sustainable forestry company); Director of Cross Timbers Quail Research Ranch (non-profit); and member of the U.S. House of Representatives | | 158 | | None |
Cynthia Hostetler — 1962 Trustee | | 2017 | | Non-Executive Director and Trustee of a number of public and private business corporations Formerly: Head of Investment Funds and Private Equity, Overseas Private Investment Corporation; President, First Manhattan Bancorporation, Inc.; Attorney, Simpson Thacher & Bartlett LLP | | 158 | | Vulcan Materials Company (construction materials company); Trilinc Global Impact Fund; Aberdeen Investment Funds (4 portfolios); Artio Global Investment LLC (mutual fund complex); Edgen Group, Inc. (specialized energy and infrastructure products distributor) |
Eli Jones — 1961 Trustee | | 2016 | | Professor and Dean, Mays Business School — Texas A&M University Formerly: Professor and Dean, Walton College of Business, University of Arkansas and E.J. Ourso College of Business, Louisiana State University; Director, Arvest Bank | | 158 | | Insperity, Inc. (formerly known as Administaff) (human resources provider) |
Prema Mathai-Davis — 1950 Trustee | | 1998 | | Retired. | | 158 | | None |
Teresa M. Ressel — 1962 Trustee | | 2017 | | Non-executive director and trustee of a number of public and private business corporations Formerly: Chief Financial Officer, Olayan America, The Olayan Group (international investor/commercial/industrial); Chief Executive Officer, UBS Securities LLC; Group Chief Operating Officer, Americas, UBS AG; Assistant Secretary for Management & Budget and CFO, US Department of the Treasury | | 158 | | Atlantic Power Corporation (power generation company); ON Semiconductor Corp. (semiconductor supplier) |
Ann Barnett Stern — 1957 Trustee | | 2017 | | President and Chief Executive Officer, Houston Endowment Inc. (private philanthropic institution) Formerly: Executive Vice President and General Counsel, Texas Children’s Hospital; Attorney, Beck, Redden and Secrest, LLP; Business Law Instructor, University of St. Thomas; Attorney, Andrews & Kurth LLP | | 158 | | Federal Reserve Bank of Dallas |
Raymond Stickel, Jr. — 1944 Trustee | | 2005 | | Retired. Formerly: Director, Mainstay VP Series Funds, Inc. (25 portfolios); Partner, Deloitte & Touche | | 158 | | None |
Robert C. Troccoli — 1949 Trustee | | 2016 | | Adjunct Professor, University of Denver — Daniels College of Business Formerly: Senior Partner, KPMG LLP | | 158 | | None |
Christopher L. Wilson — 1957 Trustee | | 2017 | | Non-executive director and trustee of a number of public and private business corporations Formerly: Managing Partner, CT2, LLC (investing and consulting firm); President/Chief Executive Officer, Columbia Funds, Bank of America Corporation; President/Chief Executive Officer, CDC IXIS Asset Management Services, Inc.; Principal & Director of Operations, Scudder Funds, Scudder, Stevens & Clark, Inc.; Assistant Vice President, Fidelity Investments | | 158 | | TD Asset Management USA Inc. (mutual fund complex) (22 portfolios); ISO New England, Inc. (non-profit organization managing regional electricity market) |
Invesco V.I. Mid Cap Growth Fund
Trustees and Officers—(continued)
| | | | | | | | |
Name, Year of Birth and
Position(s) Held with the Trust | | Trustee and/
or Officer Since | | Principal Occupation(s)
During Past 5 Years | | Number of
Funds in Fund
Complex
Overseen by
Trustee | | Other Directorship(s)
Held by Trustee During
Past 5 Years |
| Other Officers | | | | | | | | |
Sheri Morris — 1964 President, Principal Executive Officer and Treasurer | | 1999 | | President, Principal Executive Officer and Treasurer, The Invesco Funds; Vice President, Invesco Advisers, Inc. (formerly known as Invesco Institutional (N.A.), Inc.) (registered investment adviser); and Vice President, PowerShares Exchange-Traded Fund Trust, PowerShares Exchange-Traded Fund Trust II, PowerShares India Exchange-Traded Fund Trust, PowerShares Actively Managed Exchange-Traded Fund Trust, PowerShares Actively Managed Exchange-Traded Commodity Fund Trust and PowerShares Exchange-Traded Self-Indexed Fund Trust Formerly: Vice President and Principal Financial Officer, The Invesco Funds; Vice President, Invesco Aim Advisers, Inc., Invesco Aim Capital Management, Inc. and Invesco Aim Private Asset Management, Inc.; Assistant Vice President and Assistant Treasurer, The Invesco Funds and Assistant Vice President, Invesco Advisers, Inc., Invesco Aim Capital Management, Inc. and Invesco Aim Private Asset Management, Inc.; and Treasurer, PowerShares Exchange-Traded Fund Trust, PowerShares Exchange-Traded Fund Trust II, PowerShares India Exchange-Traded Fund Trust and PowerShares Actively Managed Exchange-Traded Fund Trust | | N/A | | N/A |
Russell C. Burk — 1958 Senior Vice President and Senior Officer | | 2005 | | Senior Vice President and Senior Officer, The Invesco Funds | | N/A | | N/A |
John M. Zerr — 1962 Senior Vice President, Chief Legal Officer and Secretary | | 2006 | | Director, Senior Vice President, Secretary and General Counsel, Invesco Management Group, Inc. (formerly known as Invesco AIM Management Group, Inc.); Senior Vice President, Invesco Advisers, Inc. (formerly known as Invesco Institutional (N.A.), Inc.) (registered investment adviser); Senior Vice President and Secretary, Invesco Distributors, Inc. (formerly known as Invesco AIM Distributors, Inc.); Director, Vice President and Secretary, Invesco Investment Services, Inc. (formerly known as Invesco AIM Investment Services, Inc.) Senior Vice President, Chief Legal Officer and Secretary, The Invesco Funds; Managing Director, Invesco PowerShares Capital Management LLC; Director, Secretary and General Counsel, Invesco Investment Advisers LLC (formerly known as Van Kampen Asset Management); Secretary and General Counsel, Invesco Capital Markets, Inc. (formerly known as Van Kampen Funds Inc.) and Chief Legal Officer, PowerShares Exchange-Traded Fund Trust, PowerShares Exchange-Traded Fund Trust II, PowerShares India Exchange-Traded Fund Trust, PowerShares Actively Managed Exchange-Traded Fund Trust, PowerShares Actively Managed Exchange-Traded Commodity Fund Trust and PowerShares Exchange-Traded Self-Indexed Fund Trust; Manager and Secretary, Invesco Indexing LLC Formerly: Director, Secretary, General Counsel and Senior Vice President, Van Kampen Exchange Corp.; Director, Vice President and Secretary, IVZ Distributors, Inc. (formerly known as INVESCO Distributors, Inc.); Director and Vice President, INVESCO Funds Group, Inc.; Director and Vice President, Van Kampen Advisors Inc.; Director, Vice President, Secretary and General Counsel, Van Kampen Investor Services Inc.; Director, Invesco Distributors, Inc. (formerly known as Invesco AIM Distributors, Inc.); Director, Senior Vice President, General Counsel and Secretary, Invesco AIM Advisers, Inc. and Van Kampen Investments Inc.; Director, Vice President and Secretary, Fund Management Company; Director, Senior Vice President, Secretary, General Counsel and Vice President, Invesco AIM Capital Management, Inc.; Chief Operating Officer and General Counsel, Liberty Ridge Capital, Inc. (an investment adviser); Vice President and Secretary, PBHG Funds (an investment company) and PBHG Insurance Series Fund (an investment company); Chief Operating Officer, General Counsel and Secretary, Old Mutual Investment Partners (a broker-dealer); General Counsel and Secretary, Old Mutual Fund Services (an administrator) and Old Mutual Shareholder Services (a shareholder servicing center); Executive Vice President, General Counsel and Secretary, Old Mutual Capital, Inc. (an investment adviser); and Vice President and Secretary, Old Mutual Advisors Funds (an investment company) | | N/A | | N/A |
Gregory G. McGreevey — 1962 Senior Vice President | | 2012 | | Senior Managing Director, Invesco Ltd.; Director, Chairman, President, and Chief Executive Officer, Invesco Advisers, Inc. (formerly known as Invesco Institutional (N.A.), Inc.) (registered investment adviser); Senior Vice President, Invesco Management Group, Inc.; Director, Invesco Mortgage Capital, Inc. and Invesco Senior Secured Management, Inc.; and Senior Vice President, The Invesco Funds Formerly: Assistant Vice President, The Invesco Funds | | N/A | | N/A |
Kelli Gallegos — 1970 Vice President, Principal Financial Officer and Assistant Treasurer | | 2008 | | Vice President, Principal Financial Officer and Assistant Treasurer, The Invesco Funds; Assistant Treasurer, Invesco PowerShares Capital Management LLC, PowerShares Exchange-Traded Fund Trust, PowerShares Exchange-Traded Fund Trust II, PowerShares India Exchange-Traded Fund Trust, PowerShares Actively Managed Exchange-Traded Fund Trust, PowerShares Actively Managed Exchange-Traded Commodity Fund Trust and PowerShares Exchange-Traded Self-Indexed Fund Trust Formerly: Assistant Vice President, The Invesco Funds | | N/A | | N/A |
Invesco V.I. Mid Cap Growth Fund
Trustees and Officers—(continued)
| | | | | | | | |
Name, Year of Birth and
Position(s) Held with the Trust | | Trustee and/
or Officer Since | | Principal Occupation(s)
During Past 5 Years | | Number of
Funds in Fund
Complex
Overseen by
Trustee | | Other Directorship(s)
Held by Trustee During
Past 5 Years |
| Other Officers—(continued) | | | | | | | | |
Tracy Sullivan — 1962 Vice President, Chief Tax Officer and Assistant Treasurer | | 2008 | | Vice President, Chief Tax Officer and Assistant Treasurer, The Invesco Funds; Assistant Treasurer, Invesco PowerShares Capital Management LLC, PowerShares Exchange-Traded Fund Trust, PowerShares Exchange-Traded Fund Trust II, PowerShares India Exchange-Traded Fund Trust, PowerShares Actively Managed Exchange-Traded Fund Trust, PowerShares Actively Managed Exchange-Traded Commodity Fund Trust and PowerShares Exchange-Traded Self-Indexed Fund Trust Formerly: Assistant Vice President, The Invesco Funds | | N/A | | N/A |
Crissie M. Wisdom — 1969 Anti-Money Laundering Compliance Officer | | 2013 | | Anti-Money Laundering Compliance Officer, Invesco Advisers, Inc. (formerly known as Invesco Institutional (N.A.), Inc.) (registered investment adviser), Invesco Capital Markets, Inc. (formerly known as Van Kampen Funds Inc.), Invesco Distributors, Inc., Invesco Investment Services, Inc., Invesco Management Group, Inc., The Invesco Funds, and PowerShares Exchange-Traded Fund Trust, PowerShares Exchange-Traded Fund Trust II, PowerShares India Exchange-Traded Fund Trust, PowerShares Actively Managed Exchange-Traded Fund Trust, PowerShares Actively Managed Exchange-Traded Commodity Fund Trust and PowerShares Exchange-Traded Self-Indexed Fund Trust; Anti-Money Laundering Compliance Officer and Bank Secrecy Act Officer, INVESCO National Trust Company and Invesco Trust Company; and Fraud Prevention Manager and Controls and Risk Analysis Manager for Invesco Investment Services, Inc. Formerly: Anti-Money Laundering Compliance Officer, Van Kampen Exchange Corp. | | N/A | | N/A |
Robert R. Leveille — 1969 Chief Compliance Officer | | 2016 | | Chief Compliance Officer, Invesco Advisers, Inc. (registered investment adviser); and Chief Compliance Officer, The Invesco Funds Formerly: Chief Compliance Officer, Putnam Investments and the Putnam Funds | | N/A | | N/A |
The Statement of Additional Information of the Trust includes additional information about the Fund’s Trustees and is available upon request, without charge, by calling 1.800.959.4246. Please refer to the Fund’s Statement of Additional Information for information on the Fund’s sub-advisers.
| | | | | | |
Office of the Fund 11 Greenway Plaza, Suite 1000 Houston, TX 77046-1173 | | Investment Adviser Invesco Advisers, Inc. 1555 Peachtree Street, N.E. Atlanta, GA 30309 | | Distributor Invesco Distributors, Inc. 11 Greenway Plaza, Suite 1000 Houston, TX 77046-1173 | | Auditors PricewaterhouseCoopers LLP 1000 Louisiana Street, Suite 5800 Houston, TX 77002-5678 |
| | | |
| | | | | | |
Counsel to the Fund Stradley Ronon Stevens & Young, LLP 2005 Market Street, Suite 2600 Philadelphia, PA 19103-7018 | | Counsel to the Independent Trustees Goodwin Procter LLP 901 New York Avenue, N.W. Washington, D.C. 20001 | | Transfer Agent Invesco Investment Services, Inc. 11 Greenway Plaza, Suite 1000 Houston, TX 77046-1173 | | Custodian State Street Bank and Trust Company 225 Franklin Street Boston, MA 02110-2801 |
Invesco V.I. Mid Cap Growth Fund
| | | | |
| | |
 | | Annual Report to Shareholders | | December 31, 2017 |
| | |
| | Invesco V.I. S&P 500 Index Fund |

| | |
| | The Fund provides a complete list of its holdings four times in each fiscal year, at the quarter-ends. For the second and fourth quarters, the lists appear in the Fund’s semiannual and annual reports to shareholders. For the first and third quarters, the Fund files the lists with the Securities and Exchange Commission (SEC) on Form N-Q. The Fund’s Form N-Q filings are available on the SEC website, sec.gov. Copies of the Fund’s Forms N-Q may be reviewed and copied at the SEC Public Reference Room in Washington, D.C. You can obtain information on the operation of the Public Reference Room, including information about duplicating fee charges, by calling 202 551 8090 or 800 732 0330, or by electronic request at the following email address: publicinfo@sec.gov. The SEC file numbers for the Fund are 811-07452 and 033-57340. The Fund’s most recent portfolio holdings, as filed on Form N-Q, have also been made available to insurance companies issuing variable annuity contracts and variable life insurance policies (“variable products”) that invest in the Fund. A description of the policies and procedures that the Fund uses to determine how to vote proxies relating to portfolio securities is available without charge, upon request, from our Client Services department at 800 959 4246 or at invesco.com/proxyguidelines. The information is also available on the SEC website, sec.gov. Information regarding how the Fund voted proxies related to its portfolio securities during the most recent 12-month period ended June 30 is available at invesco.com/ proxysearch. The information is also available on the SEC website, sec.gov. Invesco Advisers, Inc. is an investment adviser; it provides investment advisory services to individual and institutional clients and does not sell securities. Invesco Distributors, Inc. is the US distributor for Invesco Ltd.’s retail mutual funds, exchange-traded funds and institutional money market funds. Both are wholly owned, indirect subsidiaries of Invesco Ltd. This report must be accompanied or preceded by a currently effective Fund prospectus and variable product prospectus, which contain more complete information, including sales charges and expenses. Investors should read each carefully before investing. NOT FDIC INSURED | MAY LOSE VALUE | NO BANK GUARANTEE Invesco Distributors, Inc. MS-VISPI-AR-1 02082018 0807 |
Management’s Discussion of Fund Performance
Performance summary
For the year ended December 31, 2017, Series I shares of Invesco V.I. S&P 500 Index Fund (the Fund) underperformed the Fund’s broad market/style-specific index, the S&P 500 Index.
Your Fund’s long-term performance appears later in this report.
Fund vs. Indexes
Total returns, 12/31/16 to 12/31/17, excluding variable product issuer charges.
If variable product issuer charges were included, returns would be lower.
| | | | | |
Series I Shares | | | | 21.26 | % |
Series II Shares | | | | 21.00 | |
S&P 500 Index▼ (Broad Market/Style-Specific Index) | | | | 21.83 | |
Lipper VUF S&P 500 Funds Index∎ (Peer Group Index) | | | | 21.28 | |
Source(s): ▼FactSet Research Systems Inc.; ∎Lipper Inc. | | | | | |
Market conditions and your Fund
Despite highly destructive hurricanes that threatened to derail a years-long economic recovery, the US economy continued to expand throughout the year ended December 31, 2017. Gross domestic product – the value of all goods and services produced in the US – expanded in the first three quarters of 2017. Inflation remained subdued even as unemployment continued its multiyear decline.
Given signs of an improving economy, the US Federal Reserve (the Fed) raised interest rates three times during the reporting period, most recently in December 2017; each rate hike was 25 basis points.1 (A basis point is 0.01%.) The Fed pledged that “realized and expected economic conditions relative to its objectives of maximum employment and 2 percent inflation” will guide its future actions. At the close of the reporting period, Fed policy remained accommodative, and the fed funds target rate stood at a range of 1.25% to 1.50% – 75 basis points higher than at the start of the reporting period.1
Higher inventories and a worsening outlook caused oil prices and many
energy stocks to decline during the first half of 2017. However, oil prices rose significantly in the second half of the reporting period as expectations for lower supplies increased, partly due to continued OPEC production cuts, in the face of strengthening demand.
Major US stock market indexes repeatedly hit all-time highs throughout the reporting period. The stock market rally that began after the 2016 presidential election continued throughout the reporting period, fueled by generally positive economic data, strong corporate earnings and improved consumer confidence. Finally, after much debate in Congress, a tax reform bill was signed into law in December 2017. While its enactment further strengthened stocks, its effect on the US economy remains uncertain.
Invesco V.I. S&P 500 Index Fund invests in stocks in approximately the same proportion as they are represented in the S&P 500 Index. During the reporting period, the sectors that contributed the most to overall Fund performance were the information technology (IT), financials, health care and consumer discretionary sectors. The energy and telecommunication
services sectors delivered negative returns and detracted from Fund performance.
Four of the five top contributors for the reporting period were from the IT sector. The largest contributor to overall Fund performance was Apple. Apple benefited from a strong IT sector and continued demand for its core products. Microsoft, Facebook and Alphabet (the parent company of Google) were other strong performers in the sector. Amazon.com was also a top contributor. The stock continued its strong run as the company continued to take market share. The internet retailer also surprised analysts when it earned 52 cents per share in the third quarter of the year versus a Thomson Reuters’ consensus of 3 cents.2
The energy sector detracted from absolute Fund performance during the reporting period. Several energy holdings were key detractors including, Exxon Mobil, Schlumberger and Anadarko Petroleum. Volatile oil prices hampered these companies’ ability to deliver positive returns.
General Electric was the largest individual detractor from Fund performance. The company struggled with structural problems that were amplified as a released turnaround plan fell short of the sweeping reset of the business model/ portfolio needed.
Please note, the Fund’s strategy is principally implemented through equity investments, but the Fund may also use S&P 500 futures contracts, which are derivative instruments used to gain exposure to the equity market. During the reporting period, the Fund invested in S&P 500 futures contracts, which generated a positive return and which contributed to Fund performance. Derivatives can be a cost-effective way to gain exposure to asset classes. However, derivatives may
| | |
Portfolio Composition |
By sector | % of total net assets |
| | |
| |
| Information Technology | | 23.6% |
| Financials | | 14.7 |
| Health Care | | 13.6 |
| Consumer Discretionary | | 12.1 |
| industrials | | 10.2 |
| Consumer Staples | | 8.1 |
| Energy | | 6.0 |
| Materials | | 3.0 |
| Real Estate | | 2.9 |
| Utilities | | 2.9 |
Telecommunication Services | | 2.0 |
Money Market Funds Plus Other Assets Less Liabilities | | 0.9 |
| | |
Top 10 Equity Holdings* |
% of total net assets |
| |
| 1. Apple Inc. | | 3.8% |
2. Microsoft Corp. | | 2.9 |
3. Amazon.com, Inc. | | 2.0 |
4. Facebook, Inc.-Class A | | 1.8 |
5. Berkshire Hathaway Inc.-Class B | | 1.7 |
6. Johnson & Johnson | | 1.6 |
7. JPMorgan Chase & Co. | | 1.6 |
8. Exxon Mobil Corp. | | 1.5 |
9. Alphabet Inc.-Class C | | 1.4 |
10. Alphabet Inc.-Class A | | 1.4 |
| | |
Total Net Assets | | $93.5 million |
| |
| Total Number of Holdings* | | 504 |
The Fund’s holdings are subject to change, and there is no assurance that the Fund will continue to hold any particular security.
*Excluding money market fund holdings.
Data presented here are as of December 31, 2017.
Invesco V.I. S&P 500 Index Fund
amplify traditional investment risks through the creation of leverage and may be less liquid than traditional securities.
We welcome new investors who joined the Fund during the year and thank you for your investment in Invesco V.I. S&P 500 Index Fund.
| 1 | Source: US Federal Reserve |
The views and opinions expressed in management’s discussion of Fund performance are those of Invesco Advisers, Inc. These views and opinions are subject to change at any time based on factors such as market and economic conditions. These views and opinions may not be relied upon as investment advice or recommendations, or as an offer for a particular security. The information is not a complete analysis of every aspect of any market, country, industry, security or the Fund. Statements of fact are from sources considered reliable, but Invesco Advisers, Inc. makes no representation or warranty as to their completeness or accuracy. Although historical performance is no guarantee of future results, these insights may help you understand our investment management philosophy.
See important Fund and, if applicable, index disclosures later in this report.
| | |
 | | Anthony Munchak Chartered Financial Analyst, Portfolio Manager, is manager of Invesco V.I. S&P 500 Index Fund. He joined |
| Invesco in 2000. Mr. Munchak earned a BS and an MS in finance from Boston College and an MBA from Bentley College. |
| | |
 | | Glen Murphy Chartered Financial Analyst, Portfolio Manager, is manager of Invesco V.I. S&P 500 Index Fund. He joined |
| Invesco in 1995. Mr. Murphy earned a BA from the University of Massachusetts at Amherst and an MS in finance from Boston College. |
| | |
 | | Francis Orlando Chartered Financial Analyst, Portfolio Manager, is manager of Invesco V.I. S&P 500 Index Fund. He joined |
| Invesco in 1987. Mr. Orlando earned a BA in business administration from Merrimack College and an MBA from Boston University. |
| | |
 | | Daniel Tsai Chartered Financial Analyst, Portfolio Manager, is manager of Invesco V.I. S&P 500 Index Fund. He joined |
| Invesco in 2000. Mr. Tsai earned a BS in mechanical engineering from National Taiwan University, an MS in mechanical engineering from the University of Michigan and an MS in computer science from Wayne State University. |
| | |
 | | Anne Unflat Portfolio Manager, is manager of Invesco V.I. S&P 500 Index Fund. She joined Invesco in 1988. Ms. Unflat earned |
| a BA in economics from Queens College and an MBA in finance from St. John’s University. |
| | |
 | | Donna Chapman Wilson Portfolio Manager and Director of Portfolio Management, is manager of Invesco V.I. |
| S&P 500 Index Fund. She joined Invesco in 1997. Ms. Chapman Wilson earned a BA in economics from Hampton University and an MBA in finance from the Wharton School of the University of Pennsylvania. |
Invesco V.I. S&P 500 Index Fund
Your Fund’s Long-Term Performance
Results of a $10,000 Investment – Oldest Share Class(es)
Fund and index data from 12/31/07
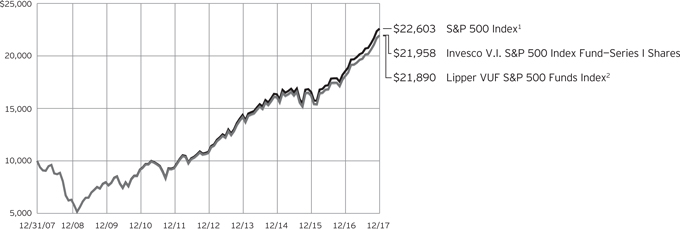
| 1 | Source: FactSet Research Systems Inc. |
Past performance cannot guarantee
comparable future results.
| | | | | |
Average Annual Total Returns |
As of 12/31/17 | | | | | |
| |
| Series I Shares | | | | | |
| Inception (5/18/98) | | | | 6.25% | |
| 10 Years | | | | 8.18 | |
| 5 Years | | | | 15.33 | |
| 1 Year | | | | 21.26 | |
| |
| Series II Shares | | | | | |
| Inception (6/5/00) | | | | 4.92% | |
| 10 Years | | | | 7.91 | |
| 5 Years | | | | 15.04 | |
| 1 Year | | | | 21.00 | |
Effective June 1, 2010, Class X and Class Y shares of the predecessor fund, Morgan Stanley Variable Investment S&P 500 Index Portfolio advised by Morgan Stanley Investment Advisors Inc. were reorganized into Series I and Series II shares, respectively, of Invesco V.I. S&P 500 Index Fund. Returns shown above, prior to June 1, 2010, for Series I and Series II shares are blended returns of the predecessor fund and Invesco V.I. S&P 500 Index Fund. Share class returns will differ from the predecessor fund because of different expenses.
The performance data quoted represent past performance and cannot guarantee comparable future results; current performance may be
lower or higher. Please contact your variable product issuer or financial adviser for the most recent month-end variable product performance. Performance figures reflect Fund expenses, reinvested distributions and changes in net asset value. Investment return and principal value will fluctuate so that you may have a gain or loss when you sell shares.
The total annual Fund operating expense ratio set forth in the most recent Fund prospectus as of the date of this report for Series I and Series II shares was 0.41% and 0.66%, respectively. The expense ratios presented above may vary from the expense ratios presented in other sections of this report that are based on expenses incurred during the period covered by this report.
Invesco V.I. S&P 500 Index Fund, a series portfolio of AIM Variable Insurance Funds (Invesco Variable Insurance Funds), is currently offered through insurance companies issuing variable products. You cannot purchase shares of the Fund directly. Performance figures given represent the Fund and are not intended to reflect actual variable product values. They do not reflect sales charges, expenses and
fees assessed in connection with a variable product. Sales charges, expenses and fees, which are determined by the variable product issuers, will vary and will lower the total return.
The most recent month-end performance at the Fund level, excluding variable product charges, is available at 800 451 4246. As mentioned above, for the most recent month-end performance including variable product charges, please contact your variable product issuer or financial adviser.
Fund performance reflects any applicable fee waivers and/or expense reimbursements. Had the adviser not waived fees and/or reimbursed expenses currently or in the past, returns would have been lower. See current prospectus for more information.
Invesco V.I. S&P 500 Index Fund
Invesco V.I. S&P 500 Index Fund’s investment objective is to provide investment results that, before expenses, correspond to the total return (i.e., the combination of capital changes and income) of the Standard & Poor’s® 500 Composite Stock Price Index.
| ∎ | Unless otherwise stated, information presented in this report is as of December 31, 2017, and is based on total net assets. |
| ∎ | Unless otherwise noted, all data provided by Invesco. |
Principal risks of investing in the Fund
Depositary receipts risk. Investing in depositary receipts involves the same risks as direct investments in foreign securities. In addition, the underlying issuers of certain depositary receipts are under no obligation to distribute shareholder communications or pass through any voting rights with respect to the deposited securities to the holders of such receipts. The Fund may therefore receive less timely information or have less control than if it invested directly in the foreign issuer.
Derivatives risk. The value of a derivative instrument depends largely on (and is derived from) the value of an underlying security, currency, commodity, interest rate, index or other asset (each referred to as an underlying asset). In addition to risks relating to the underlying assets, the use of derivatives may include other, possibly greater, risks, including counterparty, leverage and liquidity risks. Counterparty risk is the risk that the counterparty to the derivative contract will default on its obligation to pay the Fund the amount owed or otherwise perform under the derivative contract. Derivatives create leverage risk because they do not require payment up front equal to the economic exposure created by owning the derivative. As a result, an adverse change in the value of the underlying asset could result in the Fund sustaining a loss that is substantially greater than the amount invested in the derivative, which may make the Fund’s returns more volatile and increase the risk of loss. Derivative instruments may also be less liquid than more traditional investments and the Fund may be unable to sell or close out its derivative positions at a desirable time or price. This risk may be more acute under adverse market conditions, during which the Fund may be most in need of liquidating its derivative positions. Derivatives may also be harder to value, less tax efficient and subject to changing government regulation that could impact the Fund’s ability to use certain derivatives or their cost. Also, derivatives used for hedging or to gain or limit exposure to a particular market segment may not provide the expected benefits, particularly during adverse market conditions.
Emerging markets securities risk.
Emerging markets (also referred to as
developing markets) are generally subject to greater market volatility, political, social and economic instability, uncertain trading markets and more governmental limitations on foreign investment than more developed markets. In addition, companies operating in emerging markets may be subject to lower trading volume and greater price fluctuations than companies in more developed markets. Securities law and the enforcement of systems of taxation in many emerging market countries may change quickly and unpredictably. In addition, investments in emerging markets securities may also be subject to additional transaction costs, delays in settlement procedures, and lack of timely information.
Foreign securities risk. The Fund’s foreign investments may be adversely affected by political and social instability, changes in economic or taxation policies, difficulty in enforcing obligations, decreased liquidity or increased volatility. Foreign investments also involve the risk of the possible seizure, nationalization or expropriation of the issuer or foreign deposits (in which the Fund could lose its entire investments in a certain market) and the possible adoption of foreign governmental restrictions such as exchange controls. Unless the Fund has hedged its foreign securities risk, foreign securities risk also involves the risk of negative foreign currency rate fluctuations, which may cause the value of securities denominated in such foreign currency (or other instruments through which the Fund has exposure to foreign currencies) to decline in value. Currency exchange rates may fluctuate significantly over short periods of time. Currency hedging strategies, if used, are not always successful.
Indexing risk. The Fund is operated as a passively managed index fund and, therefore, the adverse performance of a particular security necessarily will not result in the elimination of the security from the Fund’s portfolio. Ordinarily, the Adviser will not sell the Fund’s portfolio securities except to reflect additions or deletions of the securities that comprise the Index, or as may be necessary to raise cash to pay Fund shareholders who sell Fund shares. As such, the Fund will be negatively affected by declines in the securities represented by the Index. Also, there is no guarantee that the Adviser will be able to correlate the Fund’s performance with that of the Index.
Market risk. The market values of the Fund’s investments, and therefore the value of the Fund’s shares, will go up and down, sometimes rapidly or unpredictably. Market risk may affect a single issuer, industry or section of the economy, or it may affect the market as a whole. Individual stock prices tend to go up and down more dramatically than those of certain other types of investments, such as bonds. During a general downturn in the financial markets, multiple asset classes may decline in value. When markets perform well, there can be no assurance that specific investments held by the Fund will rise in value.
About indexes used in this report
The S&P 500® Index is an unmanaged index considered representative of the US stock market.
The Lipper VUF S&P 500 Funds Index is an unmanaged index considered representative of S&P 500 variable insurance underlying funds tracked by Lipper.
A direct investment cannot be made in an index. Unless otherwise indicated, index results include reinvested dividends, and they do not reflect sales charges. Performance of the peer group, if applicable, reflects fund expenses; performance of a market index does not.
Other information
The returns shown in management’s discussion of Fund performance are based on net asset values calculated for shareholder transactions. Generally accepted accounting principles require adjustments to be made to the net assets of the Fund at period end for financial reporting purposes, and as such, the net asset values for shareholder transactions and the returns based on those net asset values may differ from the net asset values and returns reported in the Financial Highlights. Additionally, the returns and net asset values shown throughout this report are at the Fund level only and do not include variable product issuer charges. If such charges were included, the total returns would be lower.
Industry classifications used in this report are generally according to the Global Industry Classification Standard, which was developed by and is the exclusive property and a service mark of MSCI Inc. and Standard & Poor’s.
Invesco V.I. S&P 500 Index Fund
Schedule of Investments(a)
December 31, 2017
| | | | | | | | |
| | | Shares | | | Value | |
Common Stocks & Other Equity Interests–99.10% | |
| Advertising–0.11% | |
Interpublic Group of Cos., Inc. (The) | | | 1,547 | | | $ | 31,187 | |
Omnicom Group Inc. | | | 943 | | | | 68,679 | |
| | | | | | | | 99,866 | |
|
| Aerospace & Defense–2.60% | |
Arconic Inc. | | | 1,728 | | | | 47,088 | |
Boeing Co. (The) | | | 2,273 | | | | 670,330 | |
General Dynamics Corp. | | | 1,127 | | | | 229,288 | |
Harris Corp. | | | 489 | | | | 69,267 | |
L3 Technologies, Inc. | | | 319 | | | | 63,114 | |
Lockheed Martin Corp. | | | 1,013 | | | | 325,224 | |
Northrop Grumman Corp. | | | 706 | | | | 216,678 | |
Raytheon Co. | | | 1,174 | | | | 220,536 | |
Rockwell Collins, Inc. | | | 663 | | | | 89,916 | |
Textron Inc. | | | 1,082 | | | | 61,230 | |
TransDigm Group, Inc. | | | 196 | | | | 53,826 | |
United Technologies Corp. | | | 3,015 | | | | 384,624 | |
| | | | | | | | 2,431,121 | |
|
| Agricultural & Farm Machinery–0.22% | |
Deere & Co. | | | 1,298 | | | | 203,150 | |
|
| Agricultural Products–0.10% | |
Archer-Daniels-Midland Co. | | | 2,271 | | | | 91,022 | |
|
| Air Freight & Logistics–0.73% | |
C.H. Robinson Worldwide, Inc.(b) | | | 573 | | | | 51,049 | |
Expeditors International of Washington, Inc. | | | 721 | | | | 46,641 | |
FedEx Corp. | | | 1,001 | | | | 249,790 | |
United Parcel Service, Inc.–Class B | | | 2,789 | | | | 332,309 | |
| | | | | | | | 679,789 | |
|
| Airlines–0.52% | |
Alaska Air Group, Inc. | | | 499 | | | | 36,681 | |
American Airlines Group Inc. | | | 1,729 | | | | 89,960 | |
Delta Air Lines, Inc. | | | 2,663 | | | | 149,128 | |
Southwest Airlines Co. | | | 2,217 | | | | 145,103 | |
United Continental Holdings Inc.(c) | | | 1,022 | | | | 68,883 | |
| | | | | | | | 489,755 | |
|
| Alternative Carriers–0.07% | |
CenturyLink Inc. | | | 3,974 | | | | 66,286 | |
|
| Apparel Retail–0.47% | |
Foot Locker, Inc. | | | 506 | | | | 23,721 | |
Gap, Inc. (The) | | | 884 | | | | 30,109 | |
L Brands, Inc. | | | 1,002 | | | | 60,341 | |
Ross Stores, Inc. | | | 1,565 | | | | 125,591 | |
TJX Cos., Inc. (The) | | | 2,583 | | | | 197,496 | |
| | | | | | | | 437,258 | |
| | | | | | | | |
| | | Shares | | | Value | |
| Apparel, Accessories & Luxury Goods–0.33% | |
Hanesbrands, Inc.(b) | | | 1,480 | | | $ | 30,947 | |
Michael Kors Holdings Ltd.(c) | | | 619 | | | | 38,966 | |
PVH Corp. | | | 315 | | | | 43,221 | |
Ralph Lauren Corp. | | | 225 | | | | 23,330 | |
Tapestry, Inc. | | | 1,155 | | | | 51,086 | |
Under Armour, Inc.–Class A(b)(c) | | | 770 | | | | 11,111 | |
Under Armour, Inc.–Class C(b)(c) | | | 722 | | | | 9,617 | |
VF Corp. | | | 1,335 | | | | 98,790 | |
| | | | | | | | 307,068 | |
|
| Application Software–1.16% | |
Adobe Systems Inc.(c) | | | 2,001 | | | | 350,655 | |
ANSYS, Inc.(c) | | | 343 | | | | 50,624 | |
Autodesk, Inc.(c) | | | 895 | | | | 93,823 | |
Cadence Design Systems, Inc.(c) | | | 1,145 | | | | 47,884 | |
Citrix Systems, Inc.(c) | | | 580 | | | | 51,040 | |
Intuit Inc. | | | 986 | | | | 155,571 | |
salesforce.com, inc.(c) | | | 2,792 | | | | 285,426 | |
Synopsys, Inc.(c) | | | 613 | | | | 52,252 | |
| | | | | | | | 1,087,275 | |
|
| Asset Management & Custody Banks–1.16% | |
Affiliated Managers Group, Inc. | | | 227 | | | | 46,592 | |
Ameriprise Financial, Inc. | | | 600 | | | | 101,682 | |
Bank of New York Mellon Corp. (The) | | | 4,158 | | | | 223,950 | |
BlackRock, Inc. | | | 500 | | | | 256,855 | |
Franklin Resources, Inc. | | | 1,345 | | | | 58,279 | |
Invesco Ltd.(d) | | | 1,663 | | | | 60,766 | |
Northern Trust Corp. | | | 877 | | | | 87,603 | |
State Street Corp. | | | 1,505 | | | | 146,903 | |
T. Rowe Price Group Inc. | | | 982 | | | | 103,041 | |
| | | | | | | | 1,085,671 | |
|
| Auto Parts & Equipment–0.14% | |
Aptiv PLC | | | 1,090 | | | | 92,465 | |
BorgWarner, Inc. | | | 810 | | | | 41,383 | |
| | | | | | | | 133,848 | |
|
| Automobile Manufacturers–0.44% | |
Ford Motor Co. | | | 15,846 | | | | 197,917 | |
General Motors Co. | | | 5,191 | | | | 212,779 | |
| | | | | | | | 410,696 | |
|
| Automotive Retail–0.26% | |
Advance Auto Parts, Inc. | | | 301 | | | | 30,006 | |
AutoZone, Inc.(c) | | | 110 | | | | 78,251 | |
CarMax, Inc.(c) | | | 748 | | | | 47,969 | |
O’Reilly Automotive, Inc.(c) | | | 344 | | | | 82,746 | |
| | | | | | | | 238,972 | |
See accompanying Notes to Financial Statements which are an integral part of the financial statements.
Invesco V.I. S&P 500 Index Fund
| | | | | | | | |
| | | Shares | | | Value | |
| Biotechnology–2.75% | |
AbbVie Inc. | | | 6,473 | | | $ | 626,004 | |
Alexion Pharmaceuticals, Inc.(c) | | | 912 | | | | 109,066 | |
Amgen Inc. | | | 2,947 | | | | 512,483 | |
Biogen Inc.(c) | | | 862 | | | | 274,607 | |
Celgene Corp.(c) | | | 3,200 | | | | 333,952 | |
Gilead Sciences, Inc. | | | 5,304 | | | | 379,979 | |
Incyte Corp.(c) | | | 711 | | | | 67,339 | |
Regeneron Pharmaceuticals, Inc.(c) | | | 313 | | | | 117,675 | |
Vertex Pharmaceuticals Inc.(c) | | | 1,030 | | | | 154,356 | |
| | | | | | | | 2,575,461 | |
|
| Brewers–0.07% | |
Molson Coors Brewing Co.–Class B | | | 754 | | | | 61,881 | |
|
| Broadcasting–0.16% | |
CBS Corp.–Class B | | | 1,488 | | | | 87,792 | |
Discovery Communications, Inc.–Class A(b)(c) | | | 625 | | | | 13,987 | |
Discovery Communications, Inc.–Class C(c) | | | 810 | | | | 17,148 | |
Scripps Networks Interactive Inc.–Class A | | | 399 | | | | 34,067 | |
| | | | | | | | 152,994 | |
|
| Building Products–0.33% | |
A.O. Smith Corp. | | | 598 | | | | 36,646 | |
Allegion PLC | | | 397 | | | | 31,585 | |
Fortune Brands Home & Security, Inc. | | | 625 | | | | 42,775 | |
Johnson Controls International PLC | | | 3,758 | | | | 143,217 | |
Masco Corp. | | | 1,277 | | | | 56,111 | |
| | | | | | | | 310,334 | |
|
| Cable & Satellite–1.14% | |
Charter Communications, Inc.–Class A(c) | | | 787 | | | | 264,401 | |
Comcast Corp.–Class A | | | 18,945 | | | | 758,747 | |
DISH Network Corp.–Class A(c) | | | 930 | | | | 44,407 | |
| | | | | | | | 1,067,555 | |
|
| Casinos & Gaming–0.13% | |
MGM Resorts International | | | 2,069 | | | | 69,084 | |
Wynn Resorts Ltd. | | | 324 | | | | 54,623 | |
| | | | | | | | 123,707 | |
|
| Commodity Chemicals–0.15% | |
LyondellBasell Industries N.V.–Class A | | | 1,312 | | | | 144,740 | |
|
| Communications Equipment–0.97% | |
Cisco Systems, Inc. | | | 20,079 | | | | 769,026 | |
F5 Networks, Inc.(c) | | | 259 | | | | 33,986 | |
Juniper Networks, Inc. | | | 1,555 | | | | 44,317 | |
Motorola Solutions, Inc. | | | 664 | | | | 59,986 | |
| | | | | | | | 907,315 | |
|
| Computer & Electronics Retail–0.08% | |
Best Buy Co., Inc. | | | 1,032 | | | | 70,661 | |
|
| Construction & Engineering–0.09% | |
Fluor Corp. | | | 571 | | | | 29,492 | |
Jacobs Engineering Group Inc. | | | 502 | | | | 33,112 | |
| | | | | | | | |
| | | Shares | | | Value | |
| Construction & Engineering–(continued) | |
Quanta Services, Inc.(c) | | | 638 | | | $ | 24,952 | |
| | | | | | | | 87,556 | |
|
| Construction Machinery & Heavy Trucks–0.64% | |
Caterpillar Inc. | | | 2,417 | | | | 380,871 | |
Cummins Inc. | | | 633 | | | | 111,813 | |
PACCAR Inc. | | | 1,436 | | | | 102,071 | |
| | | | | | | | 594,755 | |
|
| Construction Materials–0.13% | |
Martin Marietta Materials, Inc. | | | 256 | | | | 56,586 | |
Vulcan Materials Co. | | | 540 | | | | 69,320 | |
| | | | | | | | 125,906 | |
|
| Consumer Electronics–0.03% | |
Garmin Ltd. | | | 462 | | | | 27,521 | |
|
| Consumer Finance–0.78% | |
American Express Co. | | | 2,925 | | | | 290,482 | |
Capital One Financial Corp. | | | 1,978 | | | | 196,969 | |
Discover Financial Services | | | 1,475 | | | | 113,457 | |
Navient Corp. | | | 1,078 | | | | 14,359 | |
Synchrony Financial | | | 2,987 | | | | 115,328 | |
| | | | | | | | 730,595 | |
|
| Copper–0.11% | |
Freeport-McMoRan Inc.(c) | | | 5,504 | | | | 104,356 | |
|
| Data Processing & Outsourced Services–2.66% | |
Alliance Data Systems Corp. | | | 194 | | | | 49,175 | |
Automatic Data Processing, Inc. | | | 1,800 | | | | 210,942 | |
Fidelity National Information Services, Inc. | | | 1,359 | | | | 127,868 | |
Fiserv, Inc.(c) | | | 846 | | | | 110,936 | |
Global Payments Inc. | | | 645 | | | | 64,655 | |
Mastercard Inc.–Class A | | | 3,769 | | | | 570,476 | |
Paychex, Inc. | | | 1,307 | | | | 88,981 | |
PayPal Holdings, Inc.(c) | | | 4,588 | | | | 337,769 | |
Total System Services, Inc. | | | 691 | | | | 54,651 | |
Visa Inc.–Class A | | | 7,365 | | | | 839,757 | |
Western Union Co. (The) | | | 1,852 | | | | 35,206 | |
| | | | | | | | 2,490,416 | |
|
| Department Stores–0.10% | |
Kohl’s Corp. | | | 684 | | | | 37,093 | |
Macy’s, Inc. | | | 1,237 | | | | 31,160 | |
Nordstrom, Inc. | | | 471 | | | | 22,316 | |
| | | | | | | | 90,569 | |
|
| Distillers & Vintners–0.23% | |
Brown-Forman Corp.–Class B | | | 795 | | | | 54,593 | |
Constellation Brands, Inc.–Class A | | | 702 | | | | 160,456 | |
| | | | | | | | 215,049 | |
|
| Distributors–0.12% | |
Genuine Parts Co. | | | 599 | | | | 56,911 | |
LKQ Corp.(c) | | | 1,255 | | | | 51,041 | |
| | | | | | | | 107,952 | |
See accompanying Notes to Financial Statements which are an integral part of the financial statements.
Invesco V.I. S&P 500 Index Fund
| | | | | | | | |
| | | Shares | | | Value | |
| Diversified Banks–5.24% | |
Bank of America Corp. | | | 39,400 | | | $ | 1,163,088 | |
Citigroup Inc. | | | 10,738 | | | | 799,015 | |
JPMorgan Chase & Co. | | | 14,093 | | | | 1,507,105 | |
U.S. Bancorp | | | 6,396 | | | | 342,698 | |
Wells Fargo & Co. | | | 18,000 | | | | 1,092,060 | |
| | | | | | | | 4,903,966 | |
|
| Diversified Chemicals–0.78% | |
DowDuPont Inc. | | | 9,503 | | | | 676,804 | |
Eastman Chemical Co. | | | 591 | | | | 54,750 | |
| | | | | | | | 731,554 | |
|
| Diversified Support Services–0.06% | |
Cintas Corp. | | | 348 | | | | 54,229 | |
|
| Drug Retail–0.59% | |
CVS Health Corp. | | | 4,113 | | | | 298,193 | |
Walgreens Boots Alliance, Inc. | | | 3,526 | | | | 256,058 | |
| | | | | | | | 554,251 | |
|
| Electric Utilities–1.79% | |
Alliant Energy Corp. | | | 951 | | | | 40,522 | |
American Electric Power Co., Inc. | | | 2,011 | | | | 147,949 | |
Duke Energy Corp. | | | 2,841 | | | | 238,956 | |
Edison International | | | 1,332 | | | | 84,236 | |
Entergy Corp. | | | 733 | | | | 59,659 | |
Eversource Energy | | | 1,295 | | | | 81,818 | |
Exelon Corp. | | | 3,907 | | | | 153,975 | |
FirstEnergy Corp. | | | 1,817 | | | | 55,637 | |
NextEra Energy, Inc. | | | 1,914 | | | | 298,948 | |
PG&E Corp. | | | 2,097 | | | | 94,009 | |
Pinnacle West Capital Corp. | | | 453 | | | | 38,587 | |
PPL Corp. | | | 2,773 | | | | 85,824 | |
Southern Co. (The) | | | 4,072 | | | | 195,822 | |
Xcel Energy, Inc. | | | 2,076 | | | | 99,876 | |
| | | | | | | | 1,675,818 | |
|
| Electrical Components & Equipment–0.56% | |
Acuity Brands, Inc. | | | 174 | | | | 30,624 | |
AMETEK, Inc. | | | 943 | | | | 68,339 | |
Eaton Corp. PLC | | | 1,789 | | | | 141,349 | |
Emerson Electric Co. | | | 2,617 | | | | 182,379 | |
Rockwell Automation, Inc. | | | 524 | | | | 102,887 | |
| | | | | | | | 525,578 | |
|
| Electronic Components–0.24% | |
Amphenol Corp.–Class A | | | 1,248 | | | | 109,574 | |
Corning Inc. | | | 3,529 | | | | 112,893 | |
| | | | | | | | 222,467 | |
|
| Electronic Equipment & Instruments–0.03% | |
FLIR Systems, Inc. | | | 575 | | | | 26,806 | |
|
| Electronic Manufacturing Services–0.15% | |
TE Connectivity Ltd. | | | 1,427 | | | | 135,622 | |
| | | | | | | | |
| | | Shares | | | Value | |
| Environmental & Facilities Services–0.24% | |
Republic Services, Inc. | | | 936 | | | $ | 63,283 | |
Stericycle, Inc.(c) | | | 348 | | | | 23,661 | |
Waste Management, Inc. | | | 1,621 | | | | 139,892 | |
| | | | | | | | 226,836 | |
|
| Fertilizers & Agricultural Chemicals–0.36% | |
CF Industries Holdings, Inc. | | | 947 | | | | 40,285 | |
FMC Corp. | | | 544 | | | | 51,495 | |
Monsanto Co. | | | 1,783 | | | | 208,219 | |
Mosaic Co. (The) | | | 1,424 | | | | 36,540 | |
| | | | | | | | 336,539 | |
|
| Financial Exchanges & Data–0.79% | |
Cboe Global Markets, Inc. | | | 460 | | | | 57,311 | |
CME Group Inc.–Class A | | | 1,389 | | | | 202,863 | |
Intercontinental Exchange, Inc. | | | 2,376 | | | | 167,651 | |
Moody’s Corp. | | | 678 | | | | 100,080 | |
Nasdaq, Inc. | | | 485 | | | | 37,263 | |
S&P Global Inc. | | | 1,035 | | | | 175,329 | |
| | | | | | | | 740,497 | |
|
| Food Distributors–0.13% | |
Sysco Corp. | | | 1,946 | | | | 118,181 | |
|
| Food Retail–0.11% | |
Kroger Co. (The) | | | 3,612 | | | | 99,149 | |
|
| Footwear–0.36% | |
NIKE, Inc.–Class B | | | 5,336 | | | | 333,767 | |
|
| General Merchandise Stores–0.37% | |
Dollar General Corp. | | | 1,064 | | | | 98,963 | |
Dollar Tree, Inc.(c) | | | 968 | | | | 103,896 | |
Target Corp. | | | 2,207 | | | | 144,007 | |
| | | | | | | | 346,866 | |
|
| Gold–0.09% | |
Newmont Mining Corp. | | | 2,180 | | | | 81,794 | |
|
| Health Care Distributors–0.35% | |
AmerisourceBergen Corp. | | | 655 | | | | 60,142 | |
Cardinal Health, Inc. | | | 1,293 | | | | 79,222 | |
Henry Schein, Inc.(c) | | | 648 | | | | 45,282 | |
McKesson Corp. | | | 846 | | | | 131,934 | |
Patterson Cos. Inc. | | | 346 | | | | 12,501 | |
| | | | | | | | 329,081 | |
|
| Health Care Equipment–2.50% | |
Abbott Laboratories | | | 7,069 | | | | 403,428 | |
Baxter International Inc. | | | 2,050 | | | | 132,512 | |
Becton, Dickinson and Co. | | | 1,080 | | | | 231,244 | |
Boston Scientific Corp.(c) | | | 5,599 | | | | 138,799 | |
Danaher Corp. | | | 2,486 | | | | 230,751 | |
Edwards Lifesciences Corp.(c) | | | 863 | | | | 97,269 | |
Hologic, Inc.(c) | | | 1,119 | | | | 47,837 | |
IDEXX Laboratories, Inc.(c) | | | 353 | | | | 55,202 | |
See accompanying Notes to Financial Statements which are an integral part of the financial statements.
Invesco V.I. S&P 500 Index Fund
| | | | | | | | |
| | | Shares | | | Value | |
| Health Care Equipment–(continued) | |
Intuitive Surgical, Inc.(c) | | | 456 | | | $ | 166,413 | |
Medtronic PLC | | | 5,497 | | | | 443,883 | |
ResMed Inc. | | | 575 | | | | 48,697 | |
Stryker Corp. | | | 1,306 | | | | 202,221 | |
Varian Medical Systems, Inc.(c) | | | 374 | | | | 41,570 | |
Zimmer Biomet Holdings, Inc. | | | 826 | | | | 99,673 | |
| | | | | | | | 2,339,499 | |
|
| Health Care Facilities–0.15% | |
HCA Healthcare, Inc.(c) | | | 1,150 | | | | 101,016 | |
Universal Health Services, Inc.–Class B | | | 360 | | | | 40,806 | |
| | | | | | | | 141,822 | |
|
| Health Care REIT’s–0.25% | |
HCP, Inc. | | | 1,917 | | | | 49,995 | |
Ventas, Inc. | | | 1,456 | | | | 87,375 | |
Welltower Inc. | | | 1,508 | | | | 96,165 | |
| | | | | | | | 233,535 | |
|
| Health Care Services–0.38% | |
DaVita Inc.(c) | | | 624 | | | | 45,084 | |
Envision Healthcare Corp.(c) | | | 489 | | | | 16,900 | |
Express Scripts Holding Co.(c) | | | 2,300 | | | | 171,672 | |
Laboratory Corp. of America Holdings(c) | | | 415 | | | | 66,196 | |
Quest Diagnostics Inc. | | | 553 | | | | 54,465 | |
| | | | | | | | 354,317 | |
|
| Health Care Supplies–0.18% | |
Align Technology, Inc.(c) | | | 294 | | | | 65,324 | |
Cooper Cos., Inc. (The) | | | 203 | | | | 44,230 | |
DENTSPLY SIRONA Inc. | | | 938 | | | | 61,748 | |
| | | | | | | | 171,302 | |
|
| Health Care Technology–0.09% | |
Cerner Corp.(c) | | | 1,287 | | | | 86,731 | |
|
| Home Entertainment Software–0.35% | |
Activision Blizzard, Inc. | | | 3,070 | | | | 194,392 | |
Electronic Arts Inc.(c) | | | 1,250 | | | | 131,325 | |
| | | | | | | | 325,717 | |
|
| Home Furnishings–0.10% | |
Leggett & Platt, Inc. | | | 551 | | | | 26,299 | |
Mohawk Industries, Inc.(c) | | | 257 | | | | 70,907 | |
| | | | | | | | 97,206 | |
|
| Home Improvement Retail–1.30% | |
Home Depot, Inc. (The) | | | 4,742 | | | | 898,751 | |
Lowe’s Cos., Inc. | | | 3,382 | | | | 314,323 | |
| | | | | | | | 1,213,074 | |
|
| Homebuilding–0.17% | |
D.R. Horton, Inc. | | | 1,392 | | | | 71,089 | |
Lennar Corp.–Class A | | | 830 | | | | 52,489 | |
PulteGroup Inc. | | | 1,098 | | | | 36,509 | |
| | | | | | | | 160,087 | |
| | | | | | | | |
| | | Shares | | | Value | |
| Hotel and Resort REIT’s–0.06% | |
Host Hotels & Resorts Inc. | | | 3,019 | | | $ | 59,927 | |
|
| Hotels, Resorts & Cruise Lines–0.55% | |
Carnival Corp. | | | 1,667 | | | | 110,639 | |
Hilton Worldwide Holdings Inc. | | | 834 | | | | 66,603 | |
Marriott International Inc.–Class A | | | 1,243 | | | | 168,712 | |
Norwegian Cruise Line Holdings Ltd.(c) | | | 723 | | | | 38,500 | |
Royal Caribbean Cruises Ltd. | | | 703 | | | | 83,854 | |
Wyndham Worldwide Corp. | | | 410 | | | | 47,507 | |
| | | | | | | | 515,815 | |
|
| Household Appliances–0.05% | |
Whirlpool Corp. | | | 297 | | | | 50,086 | |
|
| Household Products–1.63% | |
Church & Dwight Co., Inc. | | | 1,019 | | | | 51,123 | |
Clorox Co. (The) | | | 527 | | | | 78,386 | |
Colgate-Palmolive Co. | | | 3,566 | | | | 269,055 | |
Kimberly-Clark Corp. | | | 1,427 | | | | 172,182 | |
Procter & Gamble Co. (The) | | | 10,348 | | | | 950,774 | |
| | | | | | | | 1,521,520 | |
|
| Housewares & Specialties–0.07% | |
Newell Brands, Inc. | | | 2,004 | | | | 61,924 | |
|
| Human Resource & Employment Services–0.03% | |
Robert Half International, Inc. | | | 515 | | | | 28,603 | |
|
| Hypermarkets & Super Centers–0.98% | |
Costco Wholesale Corp. | | | 1,774 | | | | 330,177 | |
Wal-Mart Stores, Inc. | | | 5,944 | | | | 586,970 | |
| | | | | | | | 917,147 | |
|
| Independent Power Producers & Energy Traders–0.07% | |
AES Corp. (The) | | | 2,644 | | | | 28,635 | |
NRG Energy, Inc. | | | 1,248 | | | | 35,543 | |
| | | | | | | | 64,178 | |
|
| Industrial Conglomerates–1.89% | |
3M Co. | | | 2,423 | | | | 570,302 | |
General Electric Co.(e) | | | 35,223 | | | | 614,641 | |
Honeywell International Inc. | | | 3,093 | | | | 474,342 | |
Roper Technologies, Inc. | | | 417 | | | | 108,003 | |
| | | | | | | | 1,767,288 | |
|
| Industrial Gases–0.35% | |
Air Products and Chemicals, Inc. | | | 890 | | | | 146,031 | |
Praxair, Inc. | | | 1,169 | | | | 180,821 | |
| | | | | | | | 326,852 | |
|
| Industrial Machinery–0.89% | |
Dover Corp. | | | 635 | | | | 64,129 | |
Flowserve Corp. | | | 533 | | | | 22,455 | |
Fortive Corp. | | | 1,246 | | | | 90,148 | |
Illinois Tool Works Inc. | | | 1,252 | | | | 208,896 | |
Ingersoll-Rand PLC | | | 1,014 | | | | 90,439 | |
See accompanying Notes to Financial Statements which are an integral part of the financial statements.
Invesco V.I. S&P 500 Index Fund
| | | | | | | | |
| | | Shares | | | Value | |
| Industrial Machinery–(continued) | |
Parker-Hannifin Corp. | | | 543 | | | $ | 108,372 | |
Pentair PLC (United Kingdom) | | | 670 | | | | 47,315 | |
Snap-on Inc. | | | 230 | | | | 40,089 | |
Stanley Black & Decker Inc. | | | 625 | | | | 106,056 | |
Xylem, Inc. | | | 733 | | | | 49,991 | |
| | | | | | | | 827,890 | |
|
| Industrial REIT’s–0.19% | |
Duke Realty Corp. | | | 1,445 | | | | 39,319 | |
Prologis, Inc. | | | 2,175 | | | | 140,309 | |
| | | | | | | | 179,628 | |
|
| Insurance Brokers–0.46% | |
Aon PLC | | | 1,014 | | | | 135,876 | |
Arthur J. Gallagher & Co. | | | 749 | | | | 47,397 | |
Marsh & McLennan Cos., Inc. | | | 2,072 | | | | 168,640 | |
Willis Towers Watson PLC | | | 535 | | | | 80,619 | |
| | | | | | | | 432,532 | |
|
| Integrated Oil & Gas–2.82% | |
Chevron Corp. | | | 7,713 | | | | 965,590 | |
Exxon Mobil Corp. | | | 17,210 | | | | 1,439,444 | |
Occidental Petroleum Corp. | | | 3,107 | | | | 228,862 | |
| | | | | | | | 2,633,896 | |
|
| Integrated Telecommunication Services–1.97% | |
AT&T Inc. | | | 24,938 | | | | 969,590 | |
Verizon Communications Inc. | | | 16,569 | | | | 876,997 | |
| | | | | | | | 1,846,587 | |
|
| Internet & Direct Marketing Retail–2.84% | |
Amazon.com, Inc.(c) | | | 1,623 | | | | 1,898,050 | |
Expedia, Inc. | | | 498 | | | | 59,645 | |
Netflix Inc.(c) | | | 1,757 | | | | 337,274 | |
Priceline Group Inc. (The)(c) | | | 197 | | | | 342,335 | |
TripAdvisor Inc.(b)(c) | | | 460 | | | | 15,851 | |
| | | | | | | | 2,653,155 | |
|
| Internet Software & Services–4.81% | |
Akamai Technologies, Inc.(c) | | | 700 | | | | 45,528 | |
Alphabet Inc.–Class A(c) | | | 1,210 | | | | 1,274,614 | |
Alphabet Inc.–Class C(c) | | | 1,226 | | | | 1,282,886 | |
eBay Inc.(c) | | | 3,944 | | | | 148,847 | |
Facebook, Inc.–Class A(c) | | | 9,690 | | | | 1,709,897 | |
VeriSign, Inc.(b)(c) | | | 350 | | | | 40,054 | |
| | | | | | | | 4,501,826 | |
|
| Investment Banking & Brokerage–1.08% | |
Charles Schwab Corp. (The) | | | 4,845 | | | | 248,888 | |
E*TRADE Financial Corp.(c) | | | 1,099 | | | | 54,477 | |
Goldman Sachs Group, Inc. (The) | | | 1,421 | | | | 362,014 | |
Morgan Stanley | | | 5,653 | | | | 296,613 | |
Raymond James Financial, Inc. | | | 524 | | | | 46,793 | |
| | | | | | | | 1,008,785 | |
| | | | | | | | |
| | | Shares | | | Value | |
| IT Consulting & Other Services–1.35% | |
Accenture PLC–Class A | | | 2,510 | | | $ | 384,256 | |
Cognizant Technology Solutions Corp.–Class A | | | 2,394 | | | | 170,022 | |
CSRA Inc. | | | 681 | | | | 20,375 | |
DXC Technology Co. | | | 1,163 | | | | 110,369 | |
Gartner, Inc.(c) | | | 369 | | | | 45,442 | |
International Business Machines Corp. | | | 3,492 | | | | 535,743 | |
| | | | | | | | 1,266,207 | |
|
| Leisure Products–0.07% | |
Hasbro, Inc. | | | 459 | | | | 41,719 | |
Mattel, Inc.(b) | | | 1,429 | | | | 21,978 | |
| | | | | | | | 63,697 | |
|
| Life & Health Insurance–0.87% | |
Aflac, Inc. | | | 1,596 | | | | 140,097 | |
Brighthouse Financial, Inc.(c) | | | 391 | | | | 22,928 | |
Lincoln National Corp. | | | 888 | | | | 68,260 | |
MetLife, Inc. | | | 4,273 | | | | 216,043 | |
Principal Financial Group, Inc. | | | 1,098 | | | | 77,475 | |
Prudential Financial, Inc. | | | 1,721 | | | | 197,881 | |
Torchmark Corp. | | | 441 | | | | 40,003 | |
Unum Group | | | 911 | | | | 50,005 | |
| | | | | | | | 812,692 | |
|
| Life Sciences Tools & Services–0.80% | |
Agilent Technologies, Inc. | | | 1,313 | | | | 87,931 | |
Illumina, Inc.(c) | | | 596 | | | | 130,220 | |
IQVIA Holdings Inc.(c) | | | 590 | | | | 57,761 | |
Mettler-Toledo International Inc.(c) | | | 104 | | | | 64,430 | |
PerkinElmer, Inc. | | | 447 | | | | 32,685 | |
Thermo Fisher Scientific, Inc. | | | 1,628 | | | | 309,125 | |
Waters Corp.(c) | | | 325 | | | | 62,787 | |
| | | | | | | | 744,939 | |
|
| Managed Health Care–1.88% | |
Aetna Inc. | | | 1,323 | | | | 238,656 | |
Anthem, Inc. | | | 1,042 | | | | 234,460 | |
Centene Corp.(c) | | | 704 | | | | 71,020 | |
Cigna Corp. | | | 1,001 | | | | 203,293 | |
Humana Inc. | | | 579 | | | | 143,633 | |
UnitedHealth Group Inc. | | | 3,935 | | | | 867,510 | |
| | | | | | | | 1,758,572 | |
|
| Metal & Glass Containers–0.06% | |
Ball Corp. | | | 1,438 | | | | 54,428 | |
|
| Motorcycle Manufacturers–0.04% | |
Harley-Davidson, Inc.(b) | | | 683 | | | | 34,751 | |
|
| Movies & Entertainment–1.29% | |
Time Warner Inc. | | | 3,161 | | | | 289,137 | |
Twenty-First Century Fox, Inc.–Class A | | | 4,293 | | | | 148,237 | |
Twenty-First Century Fox, Inc.–Class B | | | 1,783 | | | | 60,836 | |
Viacom Inc.–Class B | | | 1,432 | | | | 44,120 | |
Walt Disney Co. (The) | | | 6,134 | | | | 659,466 | |
| | | | | | | | 1,201,796 | |
See accompanying Notes to Financial Statements which are an integral part of the financial statements.
Invesco V.I. S&P 500 Index Fund
| | | | | | | | |
| | | Shares | | | Value | |
| Multi-Line Insurance–0.40% | |
American International Group, Inc. | | | 3,651 | | | $ | 217,527 | |
Assurant, Inc. | | | 219 | | | | 22,084 | |
Hartford Financial Services Group, Inc. (The) | | | 1,448 | | | | 81,493 | |
Loews Corp. | | | 1,128 | | | | 56,434 | |
| | | | | | | | 377,538 | |
|
| Multi-Sector Holdings–1.69% | |
Berkshire Hathaway Inc.–Class B(c) | | | 7,815 | | | | 1,549,089 | |
Leucadia National Corp. | | | 1,273 | | | | 33,722 | |
| | | | | | | | 1,582,811 | |
|
| Multi-Utilities–0.99% | |
Ameren Corp. | | | 991 | | | | 58,459 | |
CenterPoint Energy, Inc. | | | 1,762 | | | | 49,970 | |
CMS Energy Corp. | | | 1,152 | | | | 54,489 | |
Consolidated Edison, Inc. | | | 1,266 | | | | 107,547 | |
Dominion Energy, Inc. | | | 2,612 | | | | 211,729 | |
DTE Energy Co. | | | 733 | | | | 80,234 | |
NiSource Inc. | | | 1,367 | | | | 35,091 | |
Public Service Enterprise Group Inc. | | | 2,068 | | | | 106,502 | |
SCANA Corp. | | | 596 | | | | 23,709 | |
Sempra Energy | | | 1,026 | | | | 109,700 | |
WEC Energy Group, Inc. | | | 1,290 | | | | 85,695 | |
| | | | | | | | 923,125 | |
|
| Office REIT’s–0.24% | |
Alexandria Real Estate Equities, Inc. | | | 385 | | | | 50,277 | |
Boston Properties, Inc. | | | 630 | | | | 81,919 | |
SL Green Realty Corp. | | | 398 | | | | 40,170 | |
Vornado Realty Trust | | | 704 | | | | 55,039 | |
| | | | | | | | 227,405 | |
|
| Oil & Gas Drilling–0.03% | |
Helmerich & Payne, Inc.(b) | | | 443 | | | | 28,636 | |
|
| Oil & Gas Equipment & Services–0.77% | |
Baker Hughes, a GE Co. | | | 1,750 | | | | 55,370 | |
Halliburton Co. | | | 3,550 | | | | 173,488 | |
National Oilwell Varco Inc. | | | 1,554 | | | | 55,975 | |
Schlumberger Ltd. | | | 5,626 | | | | 379,136 | |
TechnipFMC PLC (United Kingdom) | | | 1,796 | | | | 56,233 | |
| | | | | | | | 720,202 | |
|
| Oil & Gas Exploration & Production–1.48% | |
Anadarko Petroleum Corp. | | | 2,222 | | | | 119,188 | |
Apache Corp. | | | 1,557 | | | | 65,737 | |
Cabot Oil & Gas Corp. | | | 1,891 | | | | 54,083 | |
Chesapeake Energy Corp.(b)(c) | | | 3,690 | | | | 14,612 | |
Cimarex Energy Co. | | | 386 | | | | 47,096 | |
Concho Resources Inc.(c) | | | 607 | | | | 91,183 | |
ConocoPhillips | | | 4,855 | | | | 266,491 | |
Devon Energy Corp. | | | 2,150 | | | | 89,010 | |
EOG Resources, Inc. | | | 2,348 | | | | 253,373 | |
EQT Corp. | | | 1,000 | | | | 56,920 | |
| | | | | | | | |
| | | Shares | | | Value | |
| Oil & Gas Exploration & Production–(continued) | |
Hess Corp. | | | 1,104 | | | $ | 52,407 | |
Marathon Oil Corp. | | | 3,477 | | | | 58,866 | |
Newfield Exploration Co.(c) | | | 814 | | | | 25,665 | |
Noble Energy, Inc. | | | 1,989 | | | | 57,959 | |
Pioneer Natural Resources Co. | | | 695 | | | | 120,131 | |
Range Resources Corp. | | | 942 | | | | 16,070 | |
| | | | | | | | 1,388,791 | |
|
| Oil & Gas Refining & Marketing–0.57% | |
Andeavor | | | 589 | | | | 67,346 | |
Marathon Petroleum Corp. | | | 1,970 | | | | 129,981 | |
Phillips 66 | | | 1,744 | | | | 176,406 | |
Valero Energy Corp. | | | 1,776 | | | | 163,232 | |
| | | | | | | | 536,965 | |
|
| Oil & Gas Storage & Transportation–0.35% | |
Kinder Morgan, Inc. | | | 7,854 | | | | 141,922 | |
ONEOK, Inc. | | | 1,553 | | | | 83,008 | |
Williams Cos., Inc. (The) | | | 3,349 | | | | 102,111 | |
| | | | | | | | 327,041 | |
|
| Packaged Foods & Meats–1.14% | |
Campbell Soup Co.(b) | | | 792 | | | | 38,103 | |
Conagra Brands, Inc. | | | 1,658 | | | | 62,457 | |
General Mills, Inc. | | | 2,308 | | | | 136,841 | |
Hershey Co. (The) | | | 577 | | | | 65,495 | |
Hormel Foods Corp.(b) | | | 1,093 | | | | 39,774 | |
JM Smucker Co. (The) | | | 460 | | | | 57,150 | |
Kellogg Co. | | | 1,015 | | | | 69,000 | |
Kraft Heinz Co. (The) | | | 2,424 | | | | 188,490 | |
McCormick & Co., Inc. | | | 495 | | | | 50,446 | |
Mondelez International, Inc.–Class A | | | 6,063 | | | | 259,497 | |
Tyson Foods, Inc.–Class A | | | 1,208 | | | | 97,933 | |
| | | | | | | | 1,065,186 | |
|
| Paper Packaging–0.31% | |
Avery Dennison Corp. | | | 360 | | | | 41,349 | |
International Paper Co. | | | 1,688 | | | | 97,803 | |
Packaging Corp. of America | | | 382 | | | | 46,050 | |
Sealed Air Corp. | | | 732 | | | | 36,088 | |
WestRock Co. | | | 1,038 | | | | 65,612 | |
| | | | | | | | 286,902 | |
|
| Personal Products–0.17% | |
Coty Inc.–Class A | | | 1,896 | | | | 37,711 | |
Estee Lauder Cos. Inc. (The)–Class A | | | 915 | | | | 116,425 | |
| | | | | | | | 154,136 | |
|
| Pharmaceuticals–4.56% | |
Allergan PLC | | | 1,349 | | | | 220,669 | |
Bristol-Myers Squibb Co. | | | 6,647 | | | | 407,328 | |
Eli Lilly and Co. | | | 3,934 | | | | 332,266 | |
Johnson & Johnson | | | 10,911 | | | | 1,524,485 | |
Merck & Co., Inc. | | | 11,109 | | | | 625,104 | |
See accompanying Notes to Financial Statements which are an integral part of the financial statements.
Invesco V.I. S&P 500 Index Fund
| | | | | | | | |
| | | Shares | | | Value | |
| Pharmaceuticals–(continued) | |
Mylan N.V.(c) | | | 2,193 | | | $ | 92,786 | |
Perrigo Co. PLC | | | 531 | | | | 46,282 | |
Pfizer Inc. | | | 24,210 | | | | 876,886 | |
Zoetis Inc. | | | 1,978 | | | | 142,495 | |
| | | | | | | | 4,268,301 | |
|
| Property & Casualty Insurance–0.85% | |
Allstate Corp. (The) | | | 1,456 | | | | 152,458 | |
Chubb Ltd. | | | 1,885 | | | | 275,455 | |
Cincinnati Financial Corp. | | | 609 | | | | 45,657 | |
Progressive Corp. (The) | | | 2,380 | | | | 134,041 | |
Travelers Cos., Inc. (The) | | | 1,111 | | | | 150,696 | |
XL Group Ltd. (Bermuda) | | | 1,054 | | | | 37,059 | |
| | | | | | | | 795,366 | |
|
| Publishing–0.04% | |
News Corp.–Class A | | | 1,602 | | | | 25,968 | |
News Corp.–Class B | | | 543 | | | | 9,014 | |
| | | | | | | | 34,982 | |
|
| Railroads–0.90% | |
CSX Corp. | | | 3,629 | | | | 199,631 | |
Kansas City Southern | | | 419 | | | | 44,087 | |
Norfolk Southern Corp. | | | 1,162 | | | | 168,374 | |
Union Pacific Corp. | | | 3,196 | | | | 428,584 | |
| | | | | | | | 840,676 | |
|
| Real Estate Services–0.06% | |
CBRE Group, Inc.–Class A(c) | | | 1,229 | | | | 53,228 | |
|
| Regional Banks–1.28% | |
BB&T Corp. | | | 3,187 | | | | 158,458 | |
Citizens Financial Group, Inc. | | | 1,997 | | | | 83,834 | |
Comerica Inc. | | | 718 | | | | 62,330 | |
Fifth Third Bancorp | | | 2,865 | | | | 86,924 | |
Huntington Bancshares Inc. | | | 4,438 | | | | 64,617 | |
KeyCorp | | | 4,337 | | | | 87,477 | |
M&T Bank Corp. | | | 610 | | | | 104,304 | |
People’s United Financial, Inc. | | | 1,384 | | | | 25,881 | |
PNC Financial Services Group, Inc. (The) | | | 1,932 | | | | 278,768 | |
Regions Financial Corp. | | | 4,711 | | | | 81,406 | |
SunTrust Banks, Inc. | | | 1,933 | | | | 124,852 | |
Zions Bancorp. | | | 826 | | | | 41,986 | |
| | | | | | | | 1,200,837 | |
|
| Reinsurance–0.04% | |
Everest Re Group, Ltd. | | | 167 | | | | 36,950 | |
|
| Research & Consulting Services–0.25% | |
Equifax Inc. | | | 491 | | | | 57,899 | |
IHS Markit Ltd.(c) | | | 1,485 | | | | 67,048 | |
Nielsen Holdings PLC | | | 1,373 | | | | 49,977 | |
Verisk Analytics, Inc.–Class A(c) | | | 634 | | | | 60,864 | |
| | | | | | | | 235,788 | |
| | | | | | | | |
| | | Shares | | | Value | |
| Residential REIT’s–0.40% | |
Apartment Investment & Management Co.–Class A | | | 655 | | | $ | 28,630 | |
AvalonBay Communities, Inc. | | | 564 | | | | 100,623 | |
Equity Residential | | | 1,501 | | | | 95,719 | |
Essex Property Trust, Inc. | | | 269 | | | | 64,929 | |
Mid-America Apartment Communities, Inc. | | | 463 | | | | 46,559 | |
UDR, Inc. | | | 1,086 | | | | 41,833 | |
| | | | | | | | 378,293 | |
|
| Restaurants–1.15% | |
Chipotle Mexican Grill, Inc.(c) | | | 103 | | | | 29,770 | |
Darden Restaurants, Inc. | | | 501 | | | | 48,106 | |
McDonald’s Corp. | | | 3,237 | | | | 557,152 | |
Starbucks Corp. | | | 5,778 | | | | 331,831 | |
Yum! Brands, Inc. | | | 1,367 | | | | 111,561 | |
| | | | | | | | 1,078,420 | |
|
| Retail REIT’s–0.52% | |
Federal Realty Investment Trust | | | 294 | | | | 39,046 | |
GGP Inc. | | | 2,561 | | | | 59,902 | |
Kimco Realty Corp. | | | 1,764 | | | | 32,016 | |
Macerich Co. (The) | | | 453 | | | | 29,753 | |
Realty Income Corp. | | | 1,144 | | | | 65,231 | |
Regency Centers Corp. | | | 600 | | | | 41,508 | |
Simon Property Group, Inc. | | | 1,262 | | | | 216,736 | |
| | | | | | | | 484,192 | |
|
| Semiconductor Equipment–0.44% | |
Applied Materials, Inc. | | | 4,352 | | | | 222,474 | |
KLA-Tencor Corp. | | | 640 | | | | 67,245 | |
Lam Research Corp. | | | 663 | | | | 122,038 | |
| | | | | | | | 411,757 | |
|
| Semiconductors–3.42% | |
Advanced Micro Devices, Inc.(b)(c) | | | 3,358 | | | | 34,520 | |
Analog Devices, Inc. | | | 1,503 | | | | 133,812 | |
Broadcom Ltd. | | | 1,650 | | | | 423,885 | |
Intel Corp. | | | 19,008 | | | | 877,409 | |
Microchip Technology Inc. | | | 951 | | | | 83,574 | |
Micron Technology, Inc.(c) | | | 4,683 | | | | 192,565 | |
NVIDIA Corp. | | | 2,461 | | | | 476,203 | |
Qorvo, Inc.(c) | | | 516 | | | | 34,366 | |
QUALCOMM Inc. | | | 5,987 | | | | 383,288 | |
Skyworks Solutions, Inc. | | | 750 | | | | 71,212 | |
Texas Instruments Inc. | | | 4,002 | | | | 417,969 | |
Xilinx, Inc. | | | 1,016 | | | | 68,499 | |
| | | | | | | | 3,197,302 | |
|
| Soft Drinks–1.69% | |
Coca-Cola Co. (The) | | | 15,574 | | | | 714,535 | |
Dr Pepper Snapple Group, Inc. | | | 742 | | | | 72,018 | |
Monster Beverage Corp.(c) | | | 1,671 | | | | 105,758 | |
PepsiCo, Inc. | | | 5,775 | | | | 692,538 | |
| | | | | | | | 1,584,849 | |
See accompanying Notes to Financial Statements which are an integral part of the financial statements.
Invesco V.I. S&P 500 Index Fund
| | | | | | | | |
| | | Shares | | | Value | |
| Specialized Consumer Services–0.02% | |
H&R Block, Inc. | | | 877 | | | $ | 22,995 | |
|
| Specialized REIT’s–1.14% | |
American Tower Corp.–Class A | | | 1,741 | | | | 248,388 | |
Crown Castle International Corp. | | | 1,649 | | | | 183,056 | |
Digital Realty Trust, Inc. | | | 836 | | | | 95,220 | |
Equinix, Inc. | | | 317 | | | | 143,671 | |
Extra Space Storage Inc. | | | 510 | | | | 44,600 | |
Iron Mountain Inc. | | | 1,080 | | | | 40,748 | |
Public Storage | | | 611 | | | | 127,699 | |
SBA Communications Corp.–Class A(c) | | | 476 | | | | 77,759 | |
Weyerhaeuser Co. | | | 3,079 | | | | 108,566 | |
| | | | | | | | 1,069,707 | |
|
| Specialty Chemicals–0.54% | |
Albemarle Corp. | | | 451 | | | | 57,678 | |
Ecolab Inc. | | | 1,055 | | | | 141,560 | |
International Flavors & Fragrances Inc. | | | 322 | | | | 49,141 | |
PPG Industries, Inc. | | | 1,033 | | | | 120,675 | |
Sherwin-Williams Co. (The) | | | 335 | | | | 137,363 | |
| | | | | | | | 506,417 | |
|
| Specialty Stores–0.16% | |
Signet Jewelers Ltd.(b) | | | 251 | | | | 14,194 | |
Tiffany & Co. | | | 414 | | | | 43,035 | |
Tractor Supply Co. | | | 509 | | | | 38,048 | |
Ulta Beauty, Inc.(c) | | | 237 | | | | 53,008 | |
| | | | | | | | 148,285 | |
|
| Steel–0.09% | |
Nucor Corp. | | | 1,306 | | | | 83,035 | |
|
| Systems Software–3.71% | |
CA, Inc. | | | 1,291 | | | | 42,964 | |
Microsoft Corp. | | | 31,334 | | | | 2,680,310 | |
Oracle Corp. | | | 12,374 | | | | 585,043 | |
Red Hat, Inc.(c) | | | 725 | | | | 87,073 | |
Symantec Corp. | | | 2,540 | | | | 71,272 | |
| | | | | | | | 3,466,662 | |
|
| Technology Hardware, Storage & Peripherals–4.27% | |
Apple Inc. | | | 20,853 | | | | 3,528,953 | |
Hewlett Packard Enterprise Co. | | | 6,477 | | | | 93,010 | |
HP Inc. | | | 6,828 | | | | 143,456 | |
NetApp, Inc. | | | 1,102 | | | | 60,963 | |
Seagate Technology PLC(b) | | | 1,175 | | | | 49,162 | |
| | | | | | | | |
| | | Shares | | | Value | |
| Technology Hardware, Storage & Peripherals–(continued) | |
Western Digital Corp. | | | 1,205 | | | $ | 95,834 | |
Xerox Corp. | | | 897 | | | | 26,147 | |
| | | | | | | | 3,997,525 | |
|
| Tires & Rubber–0.04% | |
Goodyear Tire & Rubber Co. (The) | | | 1,029 | | | | 33,247 | |
|
| Tobacco–1.30% | |
Altria Group, Inc. | | | 7,742 | | | | 552,856 | |
Philip Morris International Inc. | | | 6,308 | | | | 666,440 | |
| | | | | | | | 1,219,296 | |
|
| Trading Companies & Distributors–0.19% | |
Fastenal Co. | | | 1,177 | | | | 64,370 | |
United Rentals, Inc.(c) | | | 344 | | | | 59,137 | |
W.W. Grainger, Inc. | | | 209 | | | | 49,376 | |
| | | | | | | | 172,883 | |
|
| Trucking–0.04% | |
J.B. Hunt Transport Services, Inc. | | | 355 | | | | 40,818 | |
|
| Water Utilities–0.07% | |
American Water Works Co., Inc. | | | 728 | | | | 66,605 | |
Total Common Stocks & Other Equity Interests
(Cost $28,472,056) | | | | 92,699,266 | |
|
Money Market Funds–1.25% | |
Invesco Government & Agency Portfolio– Institutional Class, 1.18%(f) | | | 408,202 | | | | 408,202 | |
Invesco Liquid Assets Portfolio–Institutional Class, 1.40%(f) | | | 291,546 | | | | 291,575 | |
Invesco Treasury Portfolio–Institutional Class, 1.17%(f) | | | 466,516 | | | | 466,516 | |
Total Money Market Funds
(Cost $1,166,293) | | | | 1,166,293 | |
TOTAL INVESTMENTS IN SECURITIES (excluding investments purchased with cash collateral from securities on loan)–100.35% (Cost $29,638,349) | | | | 93,865,559 | |
|
Investments Purchased with Cash
Collateral from Securities on Loan | |
| Money Market Funds–0.37% | |
Invesco Government & Agency Portfolio–Institutional Class, 1.18% (Cost $348,137)(f)(g) | | | 348,137 | | | | 348,137 | |
TOTAL INVESTMENTS IN SECURITIES–100.72% (Cost $29,986,486) | | | | 94,213,696 | |
OTHER ASSETS LESS LIABILITIES–(0.72)% | | | | (673,610 | ) |
NET ASSETS–100.00% | | | $ | 93,540,086 | |
Investment Abbreviations:
| | |
| REIT | | – Real Estate Investment Trust |
See accompanying Notes to Financial Statements which are an integral part of the financial statements.
Invesco V.I. S&P 500 Index Fund
Notes to Schedule of Investments:
| (a) | Industry and/or sector classifications used in this report are generally according to the Global Industry Classification Standard, which was developed by and is the exclusive property and a service mark of MSCI Inc. and Standard & Poor’s. |
| (b) | All or a portion of this security was out on loan at December 31, 2017. |
| (c) | Non-income producing security. |
| (d) | The Fund’s Adviser is a subsidiary of Invesco Ltd. and therefore, Invesco Ltd. is considered to be affiliated with the Fund. The value of this security as of December 31, 2017 represented less than 1% of the Fund’s Net Assets. See Note 5. |
| (e) | All or a portion of the value was pledged as collateral to cover margin requirements for open futures contracts. See Note 1J. |
| (f) | The money market fund and the Fund are affiliated by having the same investment adviser. The rate shown is the 7-day SEC standardized yield as of December 31, 2017. |
| (g) | The security has been segregated to satisfy the commitment to return the cash collateral received in securities lending transactions upon the borrower’s return of the securities loaned. See Note 1I. |
| | | | | | | | | | | | | | | | | | | | |
| Open Futures Contracts — Equity Risk | |
| Long Futures Contracts | | Number of Contracts | | | Expiration
Month | | | Notional
Value | | | Value | | | Unrealized
Appreciation | |
E-Mini S&P 500 Index | | | 10 | | | | March–2018 | | | $ | 1,338,000 | | | $ | 5,887 | | | $ | 5,887 | |
See accompanying Notes to Financial Statements which are an integral part of the financial statements.
Invesco V.I. S&P 500 Index Fund
Statement of Assets and Liabilities
December 31, 2017
Statement of Operations
For the year ended December 31, 2017
| | | | |
Assets: | | | | |
Investments, at value (Cost $28,432,110) | | $ | 92,638,500 | |
Investments in affiliates, at value (Cost $1,554,376) | | | 1,575,196 | |
Cash | | | 665 | |
Receivable for: | | | | |
Investments sold | | | 98,195 | |
Fund shares sold | | | 1,010 | |
Dividends | | | 95,243 | |
Investment for trustee deferred compensation and retirement plans | | | 36,027 | |
Total assets | | | 94,444,836 | |
| |
Liabilities: | | | | |
Other Investments: | | | | |
Variation margin – futures contracts | | | 4,767 | |
Payable for: | | | | |
Investments purchased | | | 32,208 | |
Collateral upon return of securities loaned | | | 348,137 | |
Fund shares reacquired | | | 374,360 | |
Accrued fees to affiliates | | | 69,711 | |
Accrued trustees’ and officers’ fees and benefits | | | 768 | |
Accrued other operating expenses | | | 32,373 | |
Trustee deferred compensation and retirement plans | | | 42,426 | |
Total liabilities | | | 904,750 | |
Net assets applicable to shares outstanding | | $ | 93,540,086 | |
| |
Net assets consist of: | | | | |
Shares of beneficial interest | | $ | 24,182,193 | |
Undistributed net investment income | | | 1,177,613 | |
Undistributed net realized gain | | | 3,947,183 | |
Net unrealized appreciation | | | 64,233,097 | |
| | | $ | 93,540,086 | |
| |
Net Assets: | | | | |
Series I | | $ | 38,450,462 | |
Series II | | $ | 55,089,624 | |
|
Shares outstanding, no par value,
with an unlimited number of shares authorized: | |
Series I | | | 2,074,588 | |
Series II | | | 2,989,129 | |
Series I: | | | | |
Net asset value per share | | $ | 18.53 | |
Series II: | | | | |
Net asset value per share | | $ | 18.43 | |
| * | At December 31, 2017, securities with an aggregate value of $336,006 were on loan to brokers. |
| | | | |
Investment income: | | | | |
Dividends | | $ | 1,747,381 | |
Dividends from affiliates (includes securities lending income of $429) | | | 9,871 | |
Total investment income | | | 1,757,252 | |
| |
Expenses: | | | | |
Advisory fees | | | 108,507 | |
Administrative services fees | | | 194,400 | |
Custodian fees | | | 15,484 | |
Distribution fees — Series II | | | 134,204 | |
Transfer agent fees | | | 4,152 | |
Trustees’ and officers’ fees and benefits | | | 22,070 | |
Licensing fees | | | 18,085 | |
Reports to shareholders | | | 18,677 | |
Professional services fees | | | 44,255 | |
Other | | | 11,773 | |
Total expenses | | | 571,607 | |
Less: Fees waived | | | (1,075 | ) |
Net expenses | | | 570,532 | |
Net investment income | | | 1,186,720 | |
| |
Realized and unrealized gain from: | | | | |
Net realized gain from: | | | | |
Investment securities | | | 6,582,476 | |
Futures contracts | | | 189,177 | |
| | | | 6,771,653 | |
Change in net unrealized appreciation of: | | | | |
Investment securities | | | 9,357,910 | |
Futures contracts | | | 10,834 | |
| | | | 9,368,744 | |
Net realized and unrealized gain | | | 16,140,397 | |
Net increase in net assets resulting from operations | | $ | 17,327,117 | |
See accompanying Notes to Financial Statements which are an integral part of the financial statements.
Invesco V.I. S&P 500 Index Fund
Statement of Changes in Net Assets
For the years ended December 31, 2017 and 2016
| | | | | | | | |
| | | 2017 | | | 2016 | |
Operations: | | | | | | | | |
Net investment income | | $ | 1,186,720 | | | $ | 1,467,704 | |
Net realized gain | | | 6,771,653 | | | | 7,393,025 | |
Change in net unrealized appreciation | | | 9,368,744 | | | | 278,400 | |
Net increase in net assets resulting from operations | | | 17,327,117 | | | | 9,139,129 | |
| | |
Distributions to shareholders from net investment income: | | | | | | | | |
Series I | | | (599,367 | ) | | | (593,221 | ) |
Series ll | | | (759,177 | ) | | | (788,172 | ) |
Total distributions from net investment income | | | (1,358,544 | ) | | | (1,381,393 | ) |
| | |
Distributions to shareholders from net realized gains: | | | | | | | | |
Series l | | | (2,671,157 | ) | | | (2,594,662 | ) |
Series ll | | | (3,981,717 | ) | | | (4,107,826 | ) |
Total distributions from net realized gains | | | (6,652,874 | ) | | | (6,702,488 | ) |
| | |
Share transactions–net: | | | | | | | | |
Series l | | | (189,787 | ) | | | (1,302,813 | ) |
Series ll | | | (2,610,593 | ) | | | (6,582,220 | ) |
Net increase (decrease) in net assets resulting from share transactions | | | (2,800,380 | ) | | | (7,885,033 | ) |
Net increase (decrease) in net assets | | | 6,515,319 | | | | (6,829,785 | ) |
| | |
Net assets: | | | | | | | | |
Beginning of year | | | 87,024,767 | | | | 93,854,552 | |
End of year (includes undistributed net investment income of $1,177,613 and $1,320,667, respectively) | | $ | 93,540,086 | | | $ | 87,024,767 | |
Notes to Financial Statements
December 31, 2017
NOTE 1—Significant Accounting Policies
Invesco V.I. S&P 500 Index Fund (the “Fund”) is a series portfolio of AIM Variable Insurance Funds (Invesco Variable Insurance Funds) (the “Trust”). The Trust is a Delaware statutory trust registered under the Investment Company Act of 1940, as amended (the “1940 Act”), as an open-end series management investment company consisting of twenty-four separate portfolios, (each constituting a “Fund”). The assets, liabilities and operations of each portfolio are accounted for separately. Information presented in these financial statements pertains only to the Fund. Matters affecting each Fund or class will be voted on exclusively by the shareholders of such Fund or class. Current Securities and Exchange Commission (“SEC”) guidance, however, requires participating insurance companies offering separate accounts to vote shares proportionally in accordance with the instructions of the contract owners whose investments are funded by shares of each Fund or class.
The Fund’s investment objective is to provide investment results that, before expenses, correspond to the total return (i.e., the combination of capital changes and income) of the Standard & Poor’s 500® Composite Stock Price Index.
The Fund currently offers two classes of shares, Series I and Series II, both of which are offered to insurance company separate accounts funding variable annuity contracts and variable life insurance policies (“variable products”).
The Fund is an investment company and accordingly follows the investment company accounting and reporting guidance in accordance with Financial Accounting Standards Board Accounting Standards Codification Topic 946, Financial Services — Investment Companies.
The following is a summary of the significant accounting policies followed by the Fund in the preparation of its financial statements.
| A. | Security Valuations — Securities, including restricted securities, are valued according to the following policy. |
A security listed or traded on an exchange (except convertible securities) is valued at its last sales price or official closing price as of the close of the customary trading session on the exchange where the security is principally traded, or lacking any sales or official closing price on a particular day, the security may be valued at the closing bid price on that day. Securities traded in the over-the-counter market are valued based on prices furnished by independent pricing services or market makers. When such securities are valued by an independent pricing service they may be considered fair valued. Futures contracts are valued at the final settlement price set by an exchange on which they are principally traded. Listed options are valued at the mean between the last bid and asked prices from the exchange on which they are principally traded. Options not listed on an exchange are valued by an independent source at the mean between the last bid and asked prices. For purposes of determining net asset value (“NAV”) per share, futures and option contracts generally are valued 15 minutes after the close of the customary trading session of the New York Stock Exchange (“NYSE”).
Invesco V.I. S&P 500 Index Fund
Investments in open-end and closed-end registered investment companies that do not trade on an exchange are valued at the end-of-day net asset value per share. Investments in open-end and closed-end registered investment companies that trade on an exchange are valued at the last sales price or official closing price as of the close of the customary trading session on the exchange where the security is principally traded.
Debt obligations (including convertible securities) and unlisted equities are fair valued using an evaluated quote provided by an independent pricing service. Evaluated quotes provided by the pricing service may be determined without exclusive reliance on quoted prices, and may reflect appropriate factors such as institution-size trading in similar groups of securities, developments related to specific securities, dividend rate (for unlisted equities), yield (for debt obligations), quality, type of issue, coupon rate (for debt obligations), maturity (for debt obligations), individual trading characteristics and other market data. Pricing services generally value debt obligations assuming orderly transactions of institutional round lot size, but a fund may hold or transact in the same securities in smaller, odd lot sizes. Odd lots often trade at lower prices than institutional round lots. Debt obligations are subject to interest rate and credit risks. In addition, all debt obligations involve some risk of default with respect to interest and/or principal payments.
Foreign securities’ (including foreign exchange contracts) prices are converted into U.S. dollar amounts using the applicable exchange rates as of the close of the NYSE. If market quotations are available and reliable for foreign exchange-traded equity securities, the securities will be valued at the market quotations. Because trading hours for certain foreign securities end before the close of the NYSE, closing market quotations may become unreliable. If between the time trading ends on a particular security and the close of the customary trading session on the NYSE, events occur that the investment adviser determines are significant and make the closing price unreliable, the Fund may fair value the security. If the event is likely to have affected the closing price of the security, the security will be valued at fair value in good faith using procedures approved by the Board of Trustees. Adjustments to closing prices to reflect fair value may also be based on a screening process of an independent pricing service to indicate the degree of certainty, based on historical data, that the closing price in the principal market where a foreign security trades is not the current value as of the close of the NYSE. Foreign securities’ prices meeting the approved degree of certainty that the price is not reflective of current value will be priced at the indication of fair value from the independent pricing service. Multiple factors may be considered by the independent pricing service in determining adjustments to reflect fair value and may include information relating to sector indices, American Depositary Receipts and domestic and foreign index futures. Foreign securities may have additional risks including exchange rate changes, potential for sharply devalued currencies and high inflation, political and economic upheaval, the relative lack of issuer information, relatively low market liquidity and the potential lack of strict financial and accounting controls and standards.
Securities for which market prices are not provided by any of the above methods may be valued based upon quotes furnished by independent sources. The last bid price may be used to value equity securities. The mean between the last bid and asked prices is used to value debt obligations, including corporate loans.
Securities for which market quotations are not readily available or became unreliable are valued at fair value as determined in good faith by or under the supervision of the Trust’s officers following procedures approved by the Board of Trustees. Issuer specific events, market trends, bid/asked quotes of brokers and information providers and other market data may be reviewed in the course of making a good faith determination of a security’s fair value.
The Fund may invest in securities that are subject to interest rate risk, meaning the risk that the prices will generally fall as interest rates rise and, conversely, the prices will generally rise as interest rates fall. Specific securities differ in their sensitivity to changes in interest rates depending on their individual characteristics. Changes in interest rates may result in increased market volatility, which may affect the value and/or liquidity of certain Fund investments.
Valuations change in response to many factors including the historical and prospective earnings of the issuer, the value of the issuer’s assets, general economic conditions, interest rates, investor perceptions and market liquidity. Because of the inherent uncertainties of valuation, the values reflected in the financial statements may materially differ from the value received upon actual sale of those investments.
| B. | Securities Transactions and Investment Income — Securities transactions are accounted for on a trade date basis. Realized gains or losses on sales are computed on the basis of specific identification of the securities sold. Interest income (net of withholding tax, if any) is recorded on the accrual basis from settlement date. Dividend income (net of withholding tax, if any) is recorded on the ex-dividend date. |
The Fund may periodically participate in litigation related to Fund investments. As such, the Fund may receive proceeds from litigation settlements. Any proceeds received are included in the Statement of Operations as realized gain (loss) for investments no longer held and as unrealized gain (loss) for investments still held.
Brokerage commissions and mark ups are considered transaction costs and are recorded as an increase to the cost basis of securities purchased and/or a reduction of proceeds on a sale of securities. Such transaction costs are included in the determination of net realized and unrealized gain (loss) from investment securities reported in the Statement of Operations and the Statement of Changes in Net Assets and the net realized and unrealized gains (losses) on securities per share in the Financial Highlights. Transaction costs are included in the calculation of the Fund’s net asset value and, accordingly, they reduce the Fund’s total returns. These transaction costs are not considered operating expenses and are not reflected in net investment income reported in the Statement of Operations and the Statement of Changes in Net Assets, or the net investment income per share and the ratios of expenses and net investment income reported in the Financial Highlights, nor are they limited by any expense limitation arrangements between the Fund and the investment adviser.
The Fund allocates income and realized and unrealized capital gains and losses to a class based on the relative net assets of each class.
| C. | Country Determination — For the purposes of making investment selection decisions and presentation in the Schedule of Investments, the investment adviser may determine the country in which an issuer is located and/or credit risk exposure based on various factors. These factors include the laws of the country under which the issuer is organized, where the issuer maintains a principal office, the country in which the issuer derives 50% or more of its total revenues and the country that has the primary market for the issuer’s securities, as well as other criteria. Among the other criteria that may be evaluated for making this determination are the country in which the issuer maintains 50% or more of its assets, the type of security, financial guarantees and enhancements, the nature of the collateral and the sponsor organization. Country of issuer and/or credit risk exposure has been determined to be the United States of America, unless otherwise noted. |
| D. | Distributions — Distributions from net investment income and net realized capital gain, if any, are generally declared and paid to separate accounts of participating insurance companies annually and recorded on the ex-dividend date. |
Invesco V.I. S&P 500 Index Fund
| E. | Federal Income Taxes — The Fund intends to comply with the requirements of Subchapter M of the Internal Revenue Code of 1986, as amended (the “Internal Revenue Code”), necessary to qualify as a regulated investment company and to distribute substantially all of the Fund’s taxable earnings to shareholders. As such, the Fund will not be subject to federal income taxes on otherwise taxable income (including net realized capital gain) that is distributed to shareholders. Therefore, no provision for federal income taxes is recorded in the financial statements. |
The Fund recognizes the tax benefits of uncertain tax positions only when the position is more likely than not to be sustained. Management has analyzed the Fund’s uncertain tax positions and concluded that no liability for unrecognized tax benefits should be recorded related to uncertain tax positions. Management is not aware of any tax positions for which it is reasonably possible that the total amounts of unrecognized tax benefits will change materially in the next 12 months.
The Fund files tax returns in the U.S. Federal jurisdiction and certain other jurisdictions. Generally, the Fund is subject to examinations by such taxing authorities for up to three years after the filing of the return for the tax period.
| F. | Expenses — Fees provided for under the Rule 12b-1 plan of a particular class of the Fund and which are directly attributable to that class are charged to the operations of such class. All other expenses are allocated among the classes based on relative net assets. |
| G. | Accounting Estimates — The preparation of financial statements in conformity with accounting principles generally accepted in the United States of America (“GAAP”) requires management to make estimates and assumptions that affect the reported amounts of assets and liabilities at the date of the financial statements and the reported amounts of revenues and expenses during the reporting period including estimates and assumptions related to taxation. Actual results could differ from those estimates by a significant amount. In addition, the Fund monitors for material events or transactions that may occur or become known after the period-end date and before the date the financial statements are released to print. |
| H. | Indemnifications — Under the Trust’s organizational documents, each Trustee, officer, employee or other agent of the Trust is indemnified against certain liabilities that may arise out of the performance of their duties to the Fund. Additionally, in the normal course of business, the Fund enters into contracts, including the Fund’s servicing agreements, that contain a variety of indemnification clauses. The Fund’s maximum exposure under these arrangements is unknown as this would involve future claims that may be made against the Fund that have not yet occurred. The risk of material loss as a result of such indemnification claims is considered remote. |
| I. | Securities Lending — The Fund may lend portfolio securities having a market value up to one-third of the Fund’s total assets. Such loans are secured by collateral equal to no less than the market value of the loaned securities determined daily by the securities lending provider. Such collateral will be cash or debt securities issued or guaranteed by the U.S. Government or any of its sponsored agencies. Cash collateral received in connection with these loans is invested in short-term money market instruments or affiliated money market funds and is shown as such on the Schedule of Investments. The Fund bears the risk of loss with respect to the investment of collateral. It is the Fund’s policy to obtain additional collateral from or return excess collateral to the borrower by the end of the next business day, following the valuation date of the securities loaned. Therefore, the value of the collateral held may be temporarily less than the value of the securities on loan. When loaning securities, the Fund retains certain benefits of owning the securities, including the economic equivalent of dividends or interest generated by the security. Lending securities entails a risk of loss to the Fund if, and to the extent that, the market value of the securities loaned were to increase and the borrower did not increase the collateral accordingly, and the borrower failed to return the securities. The securities loaned are subject to termination at the option of the borrower or the Fund. Upon termination, the borrower will return to the Fund the securities loaned and the Fund will return the collateral. Upon the failure of the borrower to return the securities, collateral may be liquidated and the securities may be purchased on the open market to replace the loaned securities. The Fund could experience delays and costs in gaining access to the collateral and the securities may lose value during the delay which could result in potential losses to the Fund. Some of these losses may be indemnified by the lending agent. The Fund bears the risk of any deficiency in the amount of the collateral available for return to the borrower due to any loss on the collateral invested. Dividends received on cash collateral investments for securities lending transactions, which are net of compensation to counterparties, are included in Dividends from affiliated money market funds on the Statement of Operations. The aggregate value of securities out on loan, if any, is shown as a footnote on the Statement of Assets and Liabilities. |
| J. | Futures Contracts — The Fund may enter into futures contracts to manage exposure to interest rate, equity and market price movements and/or currency risks. A futures contract is an agreement between two parties (“Counterparties”) to purchase or sell a specified underlying security, currency or commodity (or delivery of a cash settlement price, in the case of an index future) for a fixed price at a future date. The Fund currently invests only in exchange-traded futures and they are standardized as to maturity date and underlying financial instrument. Initial margin deposits required upon entering into futures contracts are satisfied by the segregation of specific securities or cash as collateral at the futures commission merchant (broker). During the period the futures contracts are open, changes in the value of the contracts are recognized as unrealized gains or losses by recalculating the value of the contracts on a daily basis. Subsequent or variation margin payments are received or made depending upon whether unrealized gains or losses are incurred. These amounts are reflected as receivables or payables on the Statement of Assets and Liabilities. When the contracts are closed or expire, the Fund recognizes a realized gain or loss equal to the difference between the proceeds from, or cost of, the closing transaction and the Fund’s basis in the contract. The net realized gain (loss) and the change in unrealized gain (loss) on futures contracts held during the period is included on the Statement of Operations. The primary risks associated with futures contracts are market risk and the absence of a liquid secondary market. If the Fund were unable to liquidate a futures contract and/or enter into an offsetting closing transaction, the Fund would continue to be subject to market risk with respect to the value of the contracts and continue to be required to maintain the margin deposits on the futures contracts. Futures contracts have minimal Counterparty risk since the exchange’s clearinghouse, as Counterparty to all exchange-traded futures, guarantees the futures against default. Risks may exceed amounts recognized in the Statement of Assets and Liabilities. |
| K. | Collateral — To the extent the Fund has designated or segregated a security as collateral and that security is subsequently sold, it is the Fund’s practice to replace such collateral no later than the next business day. |
Invesco V.I. S&P 500 Index Fund
NOTE 2—Advisory Fees and Other Fees Paid to Affiliates
The Trust has entered into a master investment advisory agreement with Invesco Advisers, Inc. (the “Adviser” or “Invesco”). Under the terms of the investment advisory agreement, the Fund accrues daily and pays monthly an advisory fee to the Adviser based on the annual rate of the Fund’s average daily net assets as follows:
| | | | |
| Average Daily Net Assets | | Rate | |
First $2 billion | | | 0.12% | |
Over $2 billion | | | 0.10% | |
For the year ended December 31, 2017, the effective advisory fees incurred by the Fund was 0.12%.
Under the terms of a master sub-advisory agreement between the Adviser and each of Invesco Asset Management Deutschland GmbH, Invesco Asset Management Limited, Invesco Asset Management (Japan) Limited, Invesco Hong Kong Limited, Invesco Senior Secured Management, Inc. and Invesco Canada Ltd. and separate sub-advisory agreements with Invesco PowerShares Capital Management LLC and Invesco Asset Management (India) Private Limited (collectively, the “Affiliated Sub-Advisers”) the Adviser, not the Fund, will pay 40% of the fees paid to the Adviser to any such Affiliated Sub-Adviser(s) that provide(s) discretionary investment management services to the Fund based on the percentage of assets allocated to such Affiliated Sub-Adviser(s).
The Adviser has contractually agreed, through at least June 30, 2018, to waive advisory fees and/or reimburse expenses of all shares to the extent necessary to limit total annual fund operating expenses after fee waiver and/or expense reimbursement (excluding certain items discussed below) of Series I shares to 2.00% and Series II shares to 2.25% of average daily net assets (the “expense limits”). In determining the Adviser’s obligation to waive advisory fees and/or reimburse expenses, the following expenses are not taken into account, and could cause the total annual fund operating expenses after fee waiver and/or expense reimbursement to exceed the numbers reflected above: (1) interest; (2) taxes; (3) dividend expense on short sales; (4) extraordinary or non-routine items, including litigation expenses; and (5) expenses that the Fund has incurred but did not actually pay because of an expense offset arrangement. Unless Invesco continues the fee waiver agreement, it will terminate on June 30, 2018. During its term, the fee waiver agreement cannot be terminated or amended to increase expense limits or reduce the advisory fee waiver without approval of the Board of Trustees. The Adviser did not waive fees and/or reimburse expenses during the period under these expense limits.
Further, the Adviser has contractually agreed, through at least June 30, 2019, to waive the advisory fee payable by the Fund in an amount equal to 100% of the net advisory fees the Adviser receives from the affiliated money market funds on investments by the Fund of uninvested cash in such affiliated money market funds.
For the year ended December 31, 2017, the Adviser waived advisory fees of $1,075.
The Trust has entered into a master administrative services agreement with Invesco pursuant to which the Fund has agreed to pay Invesco a fee for costs incurred in providing accounting services and fund administrative services to the Fund and to reimburse Invesco for fees paid to insurance companies that have agreed to provide certain administrative services to the Fund. These administrative services provided by the insurance companies may include, among other things: maintenance of master accounts with the Fund; tracking, recording and transmitting net purchase and redemption orders for Fund shares; maintaining and preserving records related to the purchase, redemption and other account activity of variable product owners; distributing copies of Fund documents such as prospectuses, proxy materials and periodic reports, to variable product owners, and responding to inquiries from variable product owners about the Fund. Pursuant to such agreement, for the year ended December 31, 2017, Invesco was paid $50,000 for accounting and fund administrative services and was reimbursed $144,400 for fees paid to insurance companies.
The Trust has entered into a transfer agency and service agreement with Invesco Investment Services, Inc. (“IIS”) pursuant to which the Fund has agreed to pay IIS a fee for providing transfer agency and shareholder services to the Fund and reimburse IIS for certain expenses incurred by IIS in the course of providing such services. For the year ended December 31, 2017, expenses incurred under the agreement are shown in the Statement of Operations as Transfer agent fees.
The Trust has entered into a master distribution agreement with Invesco Distributors, Inc. (“IDI”) to serve as the distributor for the Fund. The Trust has adopted a plan pursuant to Rule 12b-1 under the 1940 Act with respect to the Fund’s Series II shares (the “Plan”). The Fund, pursuant to the Plan, pays IDI compensation at the annual rate of 0.25% of the Fund’s average daily net assets of Series II shares. The fees are accrued daily and paid monthly. Of the Plan payments, up to 0.25% of the average daily net assets of the Series II shares may be paid to insurance companies who furnish continuing personal shareholder services to customers who purchase and own Series II shares of the Fund. For the year ended December 31, 2017, expenses incurred under the Plan are detailed in the Statement of Operations as Distribution fees.
Certain officers and trustees of the Trust are officers and directors of the Adviser, IIS and/or IDI.
NOTE 3—Additional Valuation Information
GAAP defines fair value as the price that would be received to sell an asset or paid to transfer a liability in an orderly transaction between market participants at the measurement date, under current market conditions. GAAP establishes a hierarchy that prioritizes the inputs to valuation methods, giving the highest priority to readily available unadjusted quoted prices in an active market for identical assets (Level 1) and the lowest priority to significant unobservable inputs (Level 3), generally when market prices are not readily available or are unreliable. Based on the valuation inputs, the securities or other investments are tiered into one of three levels. Changes in valuation methods may result in transfers in or out of an investment’s assigned level:
| | Level 1 — | Prices are determined using quoted prices in an active market for identical assets. |
| | Level 2 — | Prices are determined using other significant observable inputs. Observable inputs are inputs that other market participants may use in pricing a security. These may include quoted prices for similar securities, interest rates, prepayment speeds, credit risk, yield curves, loss severities, default rates, discount rates, volatilities and others. |
| | Level 3 — | Prices are determined using significant unobservable inputs. In situations where quoted prices or observable inputs are unavailable (for example, when there is little or no market activity for an investment at the end of the period), unobservable inputs may be used. Unobservable inputs reflect the Fund’s own assumptions about the factors market participants would use in determining fair value of the securities or instruments and would be based on the best available information. |
Invesco V.I. S&P 500 Index Fund
The following is a summary of the tiered valuation input levels, as of December 31, 2017. The level assigned to the securities valuations may not be an indication of the risk or liquidity associated with investing in those securities. Because of the inherent uncertainties of valuation, the values reflected in the financial statements may materially differ from the value received upon actual sale of those investments.
The Fund’s policy is to recognize transfers in and out of the valuation levels as of the end of the reporting period. During the year ended December 31, 2017, there were no material transfers between valuation levels.
| | | | | | | | | | | | | | | | |
| | | Level 1 | | | Level 2 | | | Level 3 | | | Total | |
| Investments in Securities | | | | | | | | | | | | |
Common Stocks & Other Equity Interests | | $ | 92,699,266 | | | $ | — | | | $ | — | | | $ | 92,699,266 | |
Money Market Funds | | | 1,514,430 | | | | — | | | | — | | | | 1,514,430 | |
Total Investments in Securities | | | 94,213,696 | | | | — | | | | — | | | | 94,213,696 | |
| Other Investments — Assets* | | | | | | | | | | | | |
Futures Contracts* | | | 5,887 | | | | — | | | | — | | | | 5,887 | |
Total Investments | | $ | 94,219,583 | | | $ | — | | | $ | — | | | $ | 94,219,583 | |
| * | Unrealized appreciation. |
NOTE 4—Derivative Investments
The Fund may enter into an International Swaps and Derivatives Association Master Agreement (“ISDA Master Agreement”) under which a fund may trade OTC derivatives. An OTC transaction entered into under an ISDA Master Agreement typically involves a collateral posting arrangement, payment netting provisions and close-out netting provisions. These netting provisions allow for reduction of credit risk through netting of contractual obligations. The enforceability of the netting provisions of the ISDA Master Agreement depends on the governing law of the ISDA Master Agreement, among other factors.
For financial reporting purposes, the Fund does not offset OTC derivative assets or liabilities that are subject to ISDA Master Agreements in the Statement of Assets and Liabilities.
Value of Derivative Investments at Period-End
The table below summarizes the value of the Fund’s derivative investments, detailed by primary risk exposure, held as of December 31, 2017:
| | | | |
| | | Value | |
| Derivative Assets | | Equity Risk | |
Unrealized appreciation on futures contracts — Exchange-Traded(a) | | $ | 5,887 | |
Derivatives not subject to master netting agreements | | | (5,887 | ) |
Total Derivative Assets subject to master netting agreements | | $ | — | |
| (a) | Only current day’s variation margin receivable (payable) is reported within the Statement of Assets and Liabilities. |
Effect of Derivative Investments for the year ended December 31, 2017
The table below summarizes the gains (losses) on derivative investments, detailed by primary risk exposure, recognized in earnings during the period:
| | | | |
| | | Location of Gain on
Statement of Operations | |
| | | Equity Risk | |
Realized Gain: | | | | |
Futures contracts | | $ | 189,177 | |
Change in Net Unrealized Appreciation: | | | | |
Futures contracts | | | 10,834 | |
Total | | $ | 200,011 | |
The table below summarizes the average notional value of futures contracts outstanding during the period.
| | | | |
| | | Futures
Contracts | |
Average notional value | | $ | 1,127,774 | |
NOTE 5—Investments in Affiliates
The Fund’s Adviser is a subsidiary of Invesco Ltd. and therefore, Invesco Ltd. is considered to be affiliated with the Fund. The following is a summary of the transactions in, and earnings from, investments in Invesco Ltd. for the year ended December 31, 2017.
| | | | | | | | | | | | | | | | | | | | | | | | | | | | |
| | | Value
12/31/16 | | | Purchases
at Cost | | | Proceeds
from Sales | | | Change in
Unrealized
Appreciation | | | Realized
Gain | | | Value
12/31/17 | | | Dividend
Income | |
Invesco Ltd. | | $ | 55,643 | | | $ | — | | | $ | (5,594 | ) | | $ | 9,525 | | | $ | 1,192 | | | $ | 60,766 | | | $ | 1,996 | |
Invesco V.I. S&P 500 Index Fund
NOTE 6—Trustees’ and Officers’ Fees and Benefits
Trustees’ and Officers’ Fees and Benefits include amounts accrued by the Fund to pay remuneration to certain Trustees and Officers of the Fund. Trustees have the option to defer compensation payable by the Fund, and Trustees’ and Officers’ Fees and Benefits also include amounts accrued by the Fund to fund such deferred compensation amounts. Those Trustees who defer compensation have the option to select various Invesco Funds in which their deferral accounts shall be deemed to be invested. Finally, certain current Trustees were eligible to participate in a retirement plan that provided for benefits to be paid upon retirement to Trustees over a period of time based on the number of years of service. The Fund may have certain former Trustees who also participate in a retirement plan and receive benefits under such plan. Trustees’ and Officers’ Fees and Benefits include amounts accrued by the Fund to fund such retirement benefits. Obligations under the deferred compensation and retirement plans represent unsecured claims against the general assets of the Fund.
NOTE 7—Cash Balances
The Fund is permitted to temporarily carry a negative or overdrawn balance in its account with State Street Bank and Trust Company, the custodian bank. Such balances, if any at period-end, are shown in the Statement of Assets and Liabilities under the payable caption Amount due custodian. To compensate the custodian bank for such overdrafts, the overdrawn Fund may either (1) leave funds as a compensating balance in the account so the custodian bank can be compensated by earning the additional interest; or (2) compensate by paying the custodian bank at a rate agreed upon by the custodian bank and Invesco, not to exceed the contractually agreed upon rate.
NOTE 8—Distributions to Shareholders and Tax Components of Net Assets
Tax Character of Distributions to Shareholders Paid During the Fiscal Years Ended December 31, 2017 and 2016:
| | | | | | | | |
| | | 2017 | | | 2016 | |
Ordinary income | | $ | 1,438,937 | | | $ | 1,381,393 | |
Long-term capital gain | | | 6,572,481 | | | | 6,702,488 | |
Total distributions | | $ | 8,011,418 | | | $ | 8,083,881 | |
Tax Components of Net Assets at Period-End:
| | | | |
| | | 2017 | |
Undistributed ordinary income | | $ | 1,342,841 | |
Undistributed long-term gain | | | 6,214,273 | |
Net unrealized appreciation — investments | | | 61,836,445 | |
Temporary book/tax differences | | | (35,666 | ) |
Shares of beneficial interest | | | 24,182,193 | |
Total net assets | | $ | 93,540,086 | |
The difference between book-basis and tax-basis unrealized appreciation (depreciation) is due to differences in the timing of recognition of gains and losses on investments for tax and book purposes. The Fund’s net unrealized appreciation difference is attributable primarily to wash sales.
The temporary book/tax differences are a result of timing differences between book and tax recognition of income and/or expenses. The Fund’s temporary book/tax differences are the result of the trustee deferral of compensation and retirement plan benefits.
Capital loss carryforward is calculated and reported as of a specific date. Results of transactions and other activity after that date may affect the amount of capital loss carryforward actually available for the Fund to utilize. Capital losses generated in years beginning after December 22, 2010 can be carried forward for an unlimited period, whereas previous losses expire in eight tax years. Capital losses with an expiration period may not be used to offset capital gains until all net capital losses without an expiration date have been utilized. Capital loss carryforwards with no expiration date will retain their character as either short-term or long-term capital losses instead of as short-term capital losses as under prior law. The ability to utilize capital loss carryforwards in the future may be limited under the Internal Revenue Code and related regulations based on the results of future transactions.
The Fund does not have a capital loss carryforward as of December 31, 2017.
NOTE 9—Investment Transactions
The aggregate amount of investment securities (other than short-term securities, U.S. Treasury obligations and money market funds, if any) purchased and sold by the Fund during the year ended December 31, 2017 was $2,529,894 and $12,174,305, respectively. Cost of investments, including any derivatives, on a tax basis includes the adjustments for financial reporting purposes as of the most recently completed federal income tax reporting period-end.
| | | | |
| Unrealized Appreciation (Depreciation) of Investments on a Tax Basis | |
Aggregate unrealized appreciation of investments | | $ | 62,605,453 | |
Aggregate unrealized (depreciation) of investments | | | (769,008 | ) |
Net unrealized appreciation of investments | | $ | 61,836,445 | |
Cost of investments for tax purposes is $32,383,138.
Invesco V.I. S&P 500 Index Fund
NOTE 10—Reclassification of Permanent Differences
Primarily as a result of differing book/tax treatment of real estate investment trusts, on December 31, 2017, undistributed net investment income was increased by $28,770, undistributed net realized gain was decreased by $28,095 and shares of beneficial interest was decreased by $675. This reclassification had no effect on the net assets of the Fund.
NOTE 11—Share Information
| | | | | | | | | | | | | | | | |
| | | Summary of Share Activity | |
| | | Years ended December 31, | |
| | | 2017(a) | | | 2016 | |
| | | Shares | | | Amount | | | Shares | | | Amount | |
Sold: | | | | | | | | | | | | | | | | |
Series I | | | 84,246 | | | $ | 1,475,450 | | | | 48,001 | | | $ | 796,342 | |
Series II | | | 155,899 | | | | 2,840,138 | | | | 177,111 | | | | 2,959,359 | |
| | | | |
Issued as reinvestment of dividends: | | | | | | | | | | | | | | | | |
Series I | | | 189,428 | | | | 3,269,530 | | | | 196,239 | | | | 3,186,916 | |
Series II | | | 275,954 | | | | 4,740,894 | | | | 302,783 | | | | 4,895,999 | |
| | | | |
Reacquired: | | | | | | | | | | | | | | | | |
Series I | | | (273,913 | ) | | | (4,934,767 | ) | | | (316,145 | ) | | | (5,286,071 | ) |
Series II | | | (570,729 | ) | | | (10,191,625 | ) | | | (884,680 | ) | | | (14,437,578 | ) |
Net increase (decrease) in share activity | | | (139,115 | ) | | $ | (2,800,380 | ) | | | (476,691 | ) | | $ | (7,885,033 | ) |
| (a) | There are entities that are record owners of more than 5% of the outstanding shares of the Fund and in the aggregate own 92% of the outstanding shares of the Fund. The Fund and the Fund’s principal underwriter or adviser, are parties to participation agreements with these entities whereby these entities sell units of interest in separate accounts funding variable products that are invested in the Fund. The Fund, Invesco and/or Invesco affiliates may make payments to these entities, which are considered to be related to the Fund, for providing services to the Fund, Invesco and/or Invesco affiliates including but not limited to services such as, securities brokerage, third party record keeping and account servicing and administrative services. The Fund has no knowledge as to whether all or any portion of the shares owned of record by these entities are also owned beneficially. |
NOTE 12—Financial Highlights
The following schedule presents financial highlights for a share of the Fund outstanding throughout the periods indicated.
| | | | | | | | | | | | | | | | | | | | | | | | | | | | | | | | | | | | | | | | | | | | | | | | | | | | | | | | |
| | | Net asset
value,
beginning
of period | | | Net
investment
income(a) | | | Net gains
(losses)
on securities
(both
realized and
unrealized) | | | Total from
investment
operations | | | Dividends
from net
investment
income | | | Distributions
from net
realized
gains | | | Total
distributions | | | Net asset
value, end
of period | | | Total
return(b) | | | Net assets,
end of period
(000’s omitted) | | | Ratio of
expenses
to average
net assets
with fee waivers
and/or expenses
absorbed | | | Ratio of
expenses
to average net
assets without
fee waivers
and/or expenses
absorbed | | | Ratio of net
investment
income
to average
net assets | | | Portfolio
turnover(c) | |
Series I | | | | | | | | | | | | | | | | | | | | | | | | | | | | | | | | | | | | | | | | | | | | | | | | | | | | | | | | |
Year ended 12/31/17 | | $ | 16.78 | | | $ | 0.26 | | | $ | 3.18 | | | $ | 3.44 | | | $ | (0.31 | ) | | $ | (1.38 | ) | | $ | (1.69 | ) | | $ | 18.53 | | | | 21.26 | % | | $ | 38,450 | | | | 0.48 | %(d) | | | 0.48 | %(d) | | | 1.46 | %(d) | | | 3 | % |
Year ended 12/31/16 | | | 16.58 | | | | 0.30 | | | | 1.55 | | | | 1.85 | | | | (0.31 | ) | | | (1.34 | ) | | | (1.65 | ) | | | 16.78 | | | | 11.45 | | | | 34,812 | | | | 0.41 | | | | 0.41 | | | | 1.81 | | | | 4 | |
Year ended 12/31/15 | | | 18.52 | | | | 0.30 | | | | (0.24 | ) | | | 0.06 | | | | (0.33 | ) | | | (1.67 | ) | | | (2.00 | ) | | | 16.58 | | | | 1.03 | | | | 35,586 | | | | 0.41 | | | | 0.41 | | | | 1.66 | | | | 7 | |
Year ended 12/31/14 | | | 16.66 | | | | 0.28 | | | | 1.92 | | | | 2.20 | | | | (0.34 | ) | | | – | | | | (0.34 | ) | | | 18.52 | | | | 13.32 | | | | 37,685 | | | | 0.41 | | | | 0.41 | | | | 1.62 | | | | 3 | |
Year ended 12/31/13 | | | 12.89 | | | | 0.24 | | | | 3.84 | | | | 4.08 | | | | (0.31 | ) | | | – | | | | (0.31 | ) | | | 16.66 | | | | 31.91 | | | | 36,853 | | | | 0.41 | | | | 0.41 | | | | 1.63 | | | | 4 | |
Series II | |
Year ended 12/31/17 | | | 16.69 | | | | 0.22 | | | | 3.17 | | | | 3.39 | | | | (0.27 | ) | | | (1.38 | ) | | | (1.65 | ) | | | 18.43 | | | | 21.00 | | | | 55,090 | | | | 0.73 | (d) | | | 0.73 | (d) | | | 1.21 | (d) | | | 3 | |
Year ended 12/31/16 | | | 16.49 | | | | 0.26 | | | | 1.54 | | | | 1.80 | | | | (0.26 | ) | | | (1.34 | ) | | | (1.60 | ) | | | 16.69 | | | | 11.20 | | | | 52,212 | | | | 0.66 | | | | 0.66 | | | | 1.56 | | | | 4 | |
Year ended 12/31/15 | | | 18.43 | | | | 0.25 | | | | (0.24 | ) | | | 0.01 | | | | (0.28 | ) | | | (1.67 | ) | | | (1.95 | ) | | | 16.49 | | | | 0.72 | | | | 58,268 | | | | 0.66 | | | | 0.66 | | | | 1.41 | | | | 7 | |
Year ended 12/31/14 | | | 16.58 | | | | 0.24 | | | | 1.90 | | | | 2.14 | | | | (0.29 | ) | | | – | | | | (0.29 | ) | | | 18.43 | | | | 13.02 | | | | 63,667 | | | | 0.66 | | | | 0.66 | | | | 1.37 | | | | 3 | |
Year ended 12/31/13 | | | 12.83 | | | | 0.20 | | | | 3.82 | | | | 4.02 | | | | (0.27 | ) | | | – | | | | (0.27 | ) | | | 16.58 | | | | 31.55 | | | | 67,793 | | | | 0.66 | | | | 0.66 | | | | 1.38 | | | | 4 | |
| (a) | Calculated using average shares outstanding. |
| (b) | Includes adjustments in accordance with accounting principles generally accepted in the United States of America and as such, the net asset value for financial reporting purposes and the returns based upon those net asset values may differ from the net asset value and returns for shareholder transactions. Total returns are not annualized for periods less than one year, if applicable, and do not reflect charges assessed in connection with a variable product, which if included would reduce total returns. |
| (c) | Portfolio turnover is calculated at the fund level and is not annualized for periods less than one year, if applicable. |
| (d) | Ratios are based on average daily net assets (000’s omitted) of $36,742 and $53,681 for Series I and Series II shares, respectively. |
Invesco V.I. S&P 500 Index Fund
Report of Independent Registered Public Accounting Firm
To the Board of Trustees of AIM Variable Insurance Funds (Invesco Variable Insurance Funds)
and Shareholders of Invesco V.I. S&P 500 Index Fund
Opinion on the Financial Statements
We have audited the accompanying statement of assets and liabilities, including the schedule of investments, of Invesco V.I. S&P 500 Index Fund (one of the funds constituting AIM Variable Insurance Funds (Invesco Variable Insurance Funds), hereafter referred to as the “Fund”) as of December 31, 2017, the related statement of operations for the year ended December 31, 2017, the statement of changes in net assets for each of the two years in the period ended December 31, 2017, including the related notes, and the financial highlights for each of the five years in the period ended December 31, 2017 (collectively referred to as the “financial statements”). In our opinion, the financial statements present fairly, in all material respects, the financial position of the Fund as of December 31, 2017, the results of its operations for the year then ended, the changes in its net assets for each of the two years in the period ended December 31, 2017 and the financial highlights for each of the five years in the period ended December 31, 2017 in conformity with accounting principles generally accepted in the United States of America.
Basis for Opinion
These financial statements are the responsibility of the Fund’s management. Our responsibility is to express an opinion on the Fund’s financial statements based on our audits. We are a public accounting firm registered with the Public Company Accounting Oversight Board (United States) (“PCAOB”) and are required to be independent with respect to the Fund in accordance with the U.S. federal securities laws and the applicable rules and regulations of the Securities and Exchange Commission and the PCAOB.
We conducted our audits of these financial statements in accordance with the standards of the PCAOB. Those standards require that we plan and perform the audit to obtain reasonable assurance about whether the financial statements are free of material misstatement, whether due to error or fraud.
Our audits included performing procedures to assess the risks of material misstatement of the financial statements, whether due to error or fraud, and performing procedures that respond to those risks. Such procedures included examining, on a test basis, evidence regarding the amounts and disclosures in the financial statements. Our audits also included evaluating the accounting principles used and significant estimates made by management, as well as evaluating the overall presentation of the financial statements. Our procedures included confirmation of securities owned as of December 31, 2017 by correspondence with the custodian, transfer agent and brokers; when replies were not received from brokers, we performed other auditing procedures. We believe that our audits provide a reasonable basis for our opinion.
PricewaterhouseCoopers LLP
Houston, TX
February 14, 2018
We have served as the auditor of one or more of the investment companies in the Invesco/PowerShares group of investment companies since at least 1995. We have not determined the specific year we began serving as auditor.
Invesco V.I. S&P 500 Index Fund
Calculating your ongoing Fund expenses
Example
As a shareholder of the Fund, you incur ongoing costs, including management fees; distribution and/or service fees (12b-1); and other Fund expenses. This example is intended to help you understand your ongoing costs (in dollars) of investing in the Fund and to compare these costs with ongoing costs of investing in other mutual funds. The example is based on an investment of $1,000 invested at the beginning of the period and held for the entire period July 1, 2017 through December 31, 2017.
The actual and hypothetical expenses in the examples below do not represent the effect of any fees or other expenses assessed in connection with a variable product; if they did, the expenses shown would be higher while the ending account values shown would be lower.
Actual expenses
The table below provides information about actual account values and actual expenses. You may use the information in this table, together with the amount you invested, to estimate the expenses that you paid over the period. Simply divide your account value by $1,000 (for example, an $8,600 account value divided by $1,000 = 8.6), then multiply the result by the number in the table under the heading entitled “Actual Expenses Paid During Period” to estimate the expenses you paid on your account during this period.
Hypothetical example for comparison purposes
The table below also provides information about hypothetical account values and hypothetical expenses based on the Fund’s actual expense ratio and an assumed rate of return of 5% per year before expenses, which is not the Fund’s actual return.
The hypothetical account values and expenses may not be used to estimate the actual ending account balance or expenses you paid for the period. You may use this information to compare the ongoing costs of investing in the Fund and other funds. To do so, compare this 5% hypothetical example with the 5% hypothetical examples that appear in the shareholder reports of the other funds.
Please note that the expenses shown in the table are meant to highlight your ongoing costs. Therefore, the hypothetical information is useful in comparing ongoing costs, and will not help you determine the relative total costs of owning different funds.
| | | | | | | | | | | | | | | | | | | | | | | | |
Class | | Beginning
Account Value
(07/01/17) | | | ACTUAL | | | HYPOTHETICAL
(5% annual return before expenses) | | | Annualized
Expense Ratio | |
| | | Ending
Account Value
(12/31/17)1 | | | Expenses
Paid During
Period2 | | | Ending
Account Value
(12/31/17) | | | Expenses
Paid During
Period2 | | |
| Series I | | $ | 1,000.00 | | | $ | 1,111.80 | | | $ | 2.50 | | | $ | 1,022.84 | | | $ | 2.40 | | | | 0.47 | % |
| Series II | | | 1,000.00 | | | | 1,110.20 | | | | 3.83 | | | | 1,021.58 | | | | 3.67 | | | | 0.72 | |
| 1 | The actual ending account value is based on the actual total return of the Fund for the period July 1, 2017 through December 31, 2017, after actual expenses and will differ from the hypothetical ending account value which is based on the Fund’s expense ratio and a hypothetical annual return of 5% before expenses. |
| 2 | Expenses are equal to the Fund’s annualized expense ratio as indicated above multiplied by the average account value over the period, multiplied by 184/365 to reflect the most recent fiscal half year. |
Invesco V.I. S&P 500 Index Fund
Tax Information
Form 1099-DIV, Form 1042-S and other year-end tax information provide shareholders with actual calendar year amounts that should be included in their tax returns. Shareholders should consult their tax advisors.
The following distribution information is being provided as required by the Internal Revenue Code or to meet a specific state’s requirement.
The Fund designates the following amounts or, if subsequently determined to be different, the maximum amount allowable for its fiscal year ended December 31, 2017:
| | | | |
Federal and State Income Tax | |
Long-Term Capital Gain Distributions | | $ | 6,572,481 | |
Corporate Dividends Received Deduction* | | | 100 | % |
U.S. Treasury Obligations* | | | 0.00 | % |
| | * | The above percentages are based on ordinary income dividends paid to shareholders during the Fund’s fiscal year. |
Invesco V.I. S&P 500 Index Fund
Trustees and Officers
The address of each trustee and officer is AIM Variable Insurance Funds (Invesco Variable Insurance Funds) (the “Trust”), 11 Greenway Plaza, Suite 1000, Houston, Texas 77046-1173. The trustees serve for the life of the Trust, subject to their earlier death, incapacitation, resignation, retirement or removal as more specifically provided in the Trust’s organizational documents. Each officer serves for a one year term or until their successors are elected and qualified. Column two below includes length of time served with predecessor entities, if any.
| | | | | | | | |
Name, Year of Birth and
Position(s) Held with the Trust | | Trustee and/
or Officer Since | | Principal Occupation(s)
During Past 5 Years | | Number of
Funds in Fund
Complex
Overseen by
Trustee | | Other Directorship(s)
Held by Trustee During
Past 5 Years |
| Interested Persons | | | | | | | | |
Martin L. Flanagan1 — 1960 Trustee | | 2007 | | Executive Director, Chief Executive Officer and President, Invesco Ltd. (ultimate parent of Invesco and a global investment management firm); Trustee, The Invesco Funds; Vice Chair, Investment Company Institute; and Member of Executive Board, SMU Cox School of Business Formerly: Advisor to the Board, Invesco Advisers, Inc. (formerly known as Invesco Institutional (N.A.), Inc.); Chairman and Chief Executive Officer, Invesco Advisers, Inc. (registered investment adviser); Director, Chairman, Chief Executive Officer and President, Invesco Holding Company (US), Inc. (formerly IVZ Inc.) (holding company), Invesco Group Services, Inc. (service provider) and Invesco North American Holdings, Inc. (holding company); Director, Chief Executive Officer and President, Invesco Holding Company Limited (parent of Invesco and a global investment management firm); Director, Invesco Ltd.; Chairman, Investment Company Institute and President, Co-Chief Executive Officer, Co-President, Chief Operating Officer and Chief Financial Officer, Franklin Resources, Inc. (global investment management organization) | | 158 | | None |
Philip A. Taylor2 — 1954 Trustee and Senior Vice President | | 2006 | | Head of the Americas and Senior Managing Director, Invesco Ltd.; Director, Invesco Advisers, Inc. (formerly known as Invesco Institutional (N.A.), Inc.) (registered investment adviser); Director, Chairman, Chief Executive Officer and President, Invesco Management Group, Inc. (formerly known as Invesco Aim Management Group, Inc.) (financial services holding company); Director and Chairman, Invesco Investment Services, Inc. (formerly known as Invesco Aim Investment Services, Inc.) (registered transfer agent); Chief Executive Officer, Invesco Corporate Class Inc. (corporate mutual fund company); Director, Chairman and Chief Executive Officer, Invesco Canada Ltd. (formerly known as Invesco Trimark Ltd./Invesco Trimark Ltèe) (registered investment adviser and registered transfer agent); Trustee and Senior Vice President, The Invesco Funds; Director, Invesco Investment Advisers LLC (formerly known as Van Kampen Asset Management). Formerly: Co-Chairman, Co-President and Co-Chief Executive Officer, Invesco Advisers, Inc. (formerly known as Invesco Institutional (N.A.), Inc.) (registered investment adviser); Director, Chief Executive Officer and President, Van Kampen Exchange Corp; President and Principal Executive Officer, The Invesco Funds (other than AIM Treasurer’s Series Trust (Invesco Treasurer’s Series Trust), Short-Term Investments Trust and Invesco Management Trust); Executive Vice President, The Invesco Funds (AIM Treasurer’s Series Trust (Invesco Treasurer’s Series Trust), Short-Term Investments Trust and Invesco Management Trust only); Director and President, INVESCO Funds Group, Inc. (registered investment adviser and registered transfer agent); Director and Chairman, IVZ Distributors, Inc. (formerly known as INVESCO Distributors, Inc.) (registered broker dealer); Director, President and Chairman, Invesco Inc. (holding company), Invesco Canada Holdings Inc. (holding company), Trimark Investments Ltd./Placements Trimark Ltèe and Invesco Financial Services Ltd/Services Financiers Invesco Ltèe; Chief Executive Officer, Invesco Canada Fund Inc. (corporate mutual fund company); Director and Chairman, Van Kampen Investor Services Inc.; Director, Chief Executive Officer and President, 1371 Preferred Inc. (holding company) and Van Kampen Investments Inc.; Director and President, AIM GP Canada Inc. (general partner for limited partnerships) and Van Kampen Advisors, Inc.; Director and Chief Executive Officer, Invesco Trimark Dealer Inc. (registered broker dealer); Director, Invesco Distributors, Inc. (formerly known as Invesco Aim Distributors, Inc.) (registered broker dealer); Manager, Invesco PowerShares Capital Management LLC; Director, Chief Executive Officer and President, Invesco Advisers, Inc.; Director, Chairman, Chief Executive Officer and President, Invesco Aim Capital Management, Inc.; President, Invesco Trimark Dealer Inc. and Invesco Trimark Ltd./Invesco Trimark Ltèe; Director and President, AIM Trimark Corporate Class Inc. and AIM Trimark Canada Fund Inc.; Senior Managing Director, Invesco Holding Company Limited; Director and Chairman, Fund Management Company (former registered broker dealer); President and Principal Executive Officer, The Invesco Funds (AIM Treasurer’s Series Trust (Invesco Treasurer’s Series Trust), and Short-Term Investments Trust only); President, AIM Trimark Global Fund Inc. and AIM Trimark Canada Fund Inc. | | 158 | | None |
| 1 | Mr. Flanagan is considered an interested person (within the meaning of Section 2(a)(19) of the 1940 Act) of the Trust because he is an officer of the Adviser to the Trust, and an officer and a director of Invesco Ltd., ultimate parent of the Adviser. |
| 2 | Mr. Taylor is considered an interested person (within the meaning of Section 2(a)(19) of the 1940 Act) of the Trust because he is an officer and a director of the Adviser. |
Invesco V.I. S&P 500 Index Fund
Trustees and Officers—(continued)
| | | | | | | | |
Name, Year of Birth and
Position(s) Held with the Trust | | Trustee and/
or Officer Since | | Principal Occupation(s)
During Past 5 Years | | Number of
Funds in Fund
Complex
Overseen by
Trustee | | Other Directorship(s)
Held by Trustee During
Past 5 Years |
| Independent Trustees | | | | | | | | |
Bruce L. Crockett — 1944 Trustee and Chair | | 1993 | | Chairman, Crockett Technologies Associates (technology consulting company) Formerly: Director, Captaris (unified messaging provider); Director, President and Chief Executive Officer, COMSAT Corporation; Chairman, Board of Governors of INTELSAT (international communications company); ACE Limited (insurance company); Independent Directors Council and Investment Company Institute: Member of the Audit Committee, Investment Company Institute; Member of the Executive Committee and Chair of the Governance Committee, Independent Directors Council | | 158 | | Director and Chairman of the Audit Committee, ALPS (Attorneys Liability Protection Society) (insurance company); Director and Member of the Audit Committee and Compensation Committee, Ferroglobe PLC (metallurgical company) |
David C. Arch — 1945 Trustee | | 2010 | | Chairman of Blistex Inc. (consumer health care products manufacturer); Member, World Presidents’ Organization | | 158 | | Board member of the Illinois Manufacturers’ Association |
Jack M. Fields — 1952 Trustee | | 1997 | | Chief Executive Officer, Twenty First Century Group, Inc. (government affairs company); and Chairman, Discovery Learning Alliance (non-profit) Formerly: Owner and Chief Executive Officer, Dos Angeles Ranch L.P. (cattle, hunting, corporate entertainment); Director, Insperity, Inc. (formerly known as Administaff) (human resources provider); Chief Executive Officer, Texana Timber LP (sustainable forestry company); Director of Cross Timbers Quail Research Ranch (non-profit); and member of the U.S. House of Representatives | | 158 | | None |
Cynthia Hostetler — 1962 Trustee | | 2017 | | Non-Executive Director and Trustee of a number of public and private business corporations Formerly: Head of Investment Funds and Private Equity, Overseas Private Investment Corporation; President, First Manhattan Bancorporation, Inc.; Attorney, Simpson Thacher & Bartlett LLP | | 158 | | Vulcan Materials Company (construction materials company); Trilinc Global Impact Fund; Aberdeen Investment Funds (4 portfolios); Artio Global Investment LLC (mutual fund complex); Edgen Group, Inc. (specialized energy and infrastructure products distributor) |
Eli Jones — 1961 Trustee | | 2016 | | Professor and Dean, Mays Business School — Texas A&M University Formerly: Professor and Dean, Walton College of Business, University of Arkansas and E.J. Ourso College of Business, Louisiana State University; Director, Arvest Bank | | 158 | | Insperity, Inc. (formerly known as Administaff) (human resources provider) |
Prema Mathai-Davis — 1950 Trustee | | 1998 | | Retired. | | 158 | | None |
Teresa M. Ressel — 1962 Trustee | | 2017 | | Non-executive director and trustee of a number of public and private business corporations Formerly: Chief Financial Officer, Olayan America, The Olayan Group (international investor/commercial/industrial); Chief Executive Officer, UBS Securities LLC; Group Chief Operating Officer, Americas, UBS AG; Assistant Secretary for Management & Budget and CFO, US Department of the Treasury | | 158 | | Atlantic Power Corporation (power generation company); ON Semiconductor Corp. (semiconductor supplier) |
Ann Barnett Stern — 1957 Trustee | | 2017 | | President and Chief Executive Officer, Houston Endowment Inc. (private philanthropic institution) Formerly: Executive Vice President and General Counsel, Texas Children’s Hospital; Attorney, Beck, Redden and Secrest, LLP; Business Law Instructor, University of St. Thomas; Attorney, Andrews & Kurth LLP | | 158 | | Federal Reserve Bank of Dallas |
Raymond Stickel, Jr. — 1944 Trustee | | 2005 | | Retired. Formerly: Director, Mainstay VP Series Funds, Inc. (25 portfolios); Partner, Deloitte & Touche | | 158 | | None |
Robert C. Troccoli — 1949 Trustee | | 2016 | | Adjunct Professor, University of Denver — Daniels College of Business Formerly: Senior Partner, KPMG LLP | | 158 | | None |
Christopher L. Wilson — 1957 Trustee | | 2017 | | Non-executive director and trustee of a number of public and private business corporations Formerly: Managing Partner, CT2, LLC (investing and consulting firm); President/Chief Executive Officer, Columbia Funds, Bank of America Corporation; President/Chief Executive Officer, CDC IXIS Asset Management Services, Inc.; Principal & Director of Operations, Scudder Funds, Scudder, Stevens & Clark, Inc.; Assistant Vice President, Fidelity Investments | | 158 | | TD Asset Management USA Inc. (mutual fund complex) (22 portfolios); ISO New England, Inc. (non-profit organization managing regional electricity market) |
Invesco V.I. S&P 500 Index Fund
Trustees and Officers—(continued)
| | | | | | | | |
Name, Year of Birth and
Position(s) Held with the Trust | | Trustee and/
or Officer Since | | Principal Occupation(s)
During Past 5 Years | | Number of
Funds in Fund
Complex
Overseen by
Trustee | | Other Directorship(s)
Held by Trustee During
Past 5 Years |
| Other Officers | | | | | | | | |
Sheri Morris — 1964 President, Principal Executive Officer and Treasurer | | 1999 | | President, Principal Executive Officer and Treasurer, The Invesco Funds; Vice President, Invesco Advisers, Inc. (formerly known as Invesco Institutional (N.A.), Inc.) (registered investment adviser); and Vice President, PowerShares Exchange-Traded Fund Trust, PowerShares Exchange-Traded Fund Trust II, PowerShares India Exchange-Traded Fund Trust, PowerShares Actively Managed Exchange-Traded Fund Trust, PowerShares Actively Managed Exchange-Traded Commodity Fund Trust and PowerShares Exchange-Traded Self-Indexed Fund Trust Formerly: Vice President and Principal Financial Officer, The Invesco Funds; Vice President, Invesco Aim Advisers, Inc., Invesco Aim Capital Management, Inc. and Invesco Aim Private Asset Management, Inc.; Assistant Vice President and Assistant Treasurer, The Invesco Funds and Assistant Vice President, Invesco Advisers, Inc., Invesco Aim Capital Management, Inc. and Invesco Aim Private Asset Management, Inc.; and Treasurer, PowerShares Exchange-Traded Fund Trust, PowerShares Exchange-Traded Fund Trust II, PowerShares India Exchange-Traded Fund Trust and PowerShares Actively Managed Exchange-Traded Fund Trust | | N/A | | N/A |
Russell C. Burk — 1958 Senior Vice President and Senior Officer | | 2005 | | Senior Vice President and Senior Officer, The Invesco Funds | | N/A | | N/A |
John M. Zerr — 1962 Senior Vice President, Chief Legal Officer and Secretary | | 2006 | | Director, Senior Vice President, Secretary and General Counsel, Invesco Management Group, Inc. (formerly known as Invesco AIM Management Group, Inc.); Senior Vice President, Invesco Advisers, Inc. (formerly known as Invesco Institutional (N.A.), Inc.) (registered investment adviser); Senior Vice President and Secretary, Invesco Distributors, Inc. (formerly known as Invesco AIM Distributors, Inc.); Director, Vice President and Secretary, Invesco Investment Services, Inc. (formerly known as Invesco AIM Investment Services, Inc.) Senior Vice President, Chief Legal Officer and Secretary, The Invesco Funds; Managing Director, Invesco PowerShares Capital Management LLC; Director, Secretary and General Counsel, Invesco Investment Advisers LLC (formerly known as Van Kampen Asset Management); Secretary and General Counsel, Invesco Capital Markets, Inc. (formerly known as Van Kampen Funds Inc.) and Chief Legal Officer, PowerShares Exchange-Traded Fund Trust, PowerShares Exchange-Traded Fund Trust II, PowerShares India Exchange-Traded Fund Trust, PowerShares Actively Managed Exchange-Traded Fund Trust, PowerShares Actively Managed Exchange-Traded Commodity Fund Trust and PowerShares Exchange-Traded Self-Indexed Fund Trust; Manager and Secretary, Invesco Indexing LLC Formerly: Director, Secretary, General Counsel and Senior Vice President, Van Kampen Exchange Corp.; Director, Vice President and Secretary, IVZ Distributors, Inc. (formerly known as INVESCO Distributors, Inc.); Director and Vice President, INVESCO Funds Group, Inc.; Director and Vice President, Van Kampen Advisors Inc.; Director, Vice President, Secretary and General Counsel, Van Kampen Investor Services Inc.; Director, Invesco Distributors, Inc. (formerly known as Invesco AIM Distributors, Inc.); Director, Senior Vice President, General Counsel and Secretary, Invesco AIM Advisers, Inc. and Van Kampen Investments Inc.; Director, Vice President and Secretary, Fund Management Company; Director, Senior Vice President, Secretary, General Counsel and Vice President, Invesco AIM Capital Management, Inc.; Chief Operating Officer and General Counsel, Liberty Ridge Capital, Inc. (an investment adviser); Vice President and Secretary, PBHG Funds (an investment company) and PBHG Insurance Series Fund (an investment company); Chief Operating Officer, General Counsel and Secretary, Old Mutual Investment Partners (a broker-dealer); General Counsel and Secretary, Old Mutual Fund Services (an administrator) and Old Mutual Shareholder Services (a shareholder servicing center); Executive Vice President, General Counsel and Secretary, Old Mutual Capital, Inc. (an investment adviser); and Vice President and Secretary, Old Mutual Advisors Funds (an investment company) | | N/A | | N/A |
Gregory G. McGreevey — 1962 Senior Vice President | | 2012 | | Senior Managing Director, Invesco Ltd.; Director, Chairman, President, and Chief Executive Officer, Invesco Advisers, Inc. (formerly known as Invesco Institutional (N.A.), Inc.) (registered investment adviser); Senior Vice President, Invesco Management Group, Inc.; Director, Invesco Mortgage Capital, Inc. and Invesco Senior Secured Management, Inc.; and Senior Vice President, The Invesco Funds Formerly: Assistant Vice President, The Invesco Funds | | N/A | | N/A |
Kelli Gallegos — 1970 Vice President, Principal Financial Officer and Assistant Treasurer | | 2008 | | Vice President, Principal Financial Officer and Assistant Treasurer, The Invesco Funds; Assistant Treasurer, Invesco PowerShares Capital Management LLC, PowerShares Exchange-Traded Fund Trust, PowerShares Exchange-Traded Fund Trust II, PowerShares India Exchange-Traded Fund Trust, PowerShares Actively Managed Exchange-Traded Fund Trust, PowerShares Actively Managed Exchange-Traded Commodity Fund Trust and PowerShares Exchange-Traded Self-Indexed Fund Trust Formerly: Assistant Vice President, The Invesco Funds | | N/A | | N/A |
Invesco V.I. S&P 500 Index Fund
Trustees and Officers—(continued)
| | | | | | | | |
Name, Year of Birth and
Position(s) Held with the Trust | | Trustee and/
or Officer Since | | Principal Occupation(s)
During Past 5 Years | | Number of
Funds in Fund
Complex
Overseen by
Trustee | | Other Directorship(s)
Held by Trustee During
Past 5 Years |
| Other Officers—(continued) | | | | | | | | |
Tracy Sullivan — 1962 Vice President, Chief Tax Officer and Assistant Treasurer | | 2008 | | Vice President, Chief Tax Officer and Assistant Treasurer, The Invesco Funds; Assistant Treasurer, Invesco PowerShares Capital Management LLC, PowerShares Exchange-Traded Fund Trust, PowerShares Exchange-Traded Fund Trust II, PowerShares India Exchange-Traded Fund Trust, PowerShares Actively Managed Exchange-Traded Fund Trust, PowerShares Actively Managed Exchange-Traded Commodity Fund Trust and PowerShares Exchange-Traded Self-Indexed Fund Trust Formerly: Assistant Vice President, The Invesco Funds | | N/A | | N/A |
Crissie M. Wisdom — 1969 Anti-Money Laundering Compliance Officer | | 2013 | | Anti-Money Laundering Compliance Officer, Invesco Advisers, Inc. (formerly known as Invesco Institutional (N.A.), Inc.) (registered investment adviser), Invesco Capital Markets, Inc. (formerly known as Van Kampen Funds Inc.), Invesco Distributors, Inc., Invesco Investment Services, Inc., Invesco Management Group, Inc., The Invesco Funds, and PowerShares Exchange-Traded Fund Trust, PowerShares Exchange-Traded Fund Trust II, PowerShares India Exchange-Traded Fund Trust, PowerShares Actively Managed Exchange-Traded Fund Trust, PowerShares Actively Managed Exchange-Traded Commodity Fund Trust and PowerShares Exchange-Traded Self-Indexed Fund Trust; Anti-Money Laundering Compliance Officer and Bank Secrecy Act Officer, INVESCO National Trust Company and Invesco Trust Company; and Fraud Prevention Manager and Controls and Risk Analysis Manager for Invesco Investment Services, Inc. Formerly: Anti-Money Laundering Compliance Officer, Van Kampen Exchange Corp. | | N/A | | N/A |
Robert R. Leveille — 1969 Chief Compliance Officer | | 2016 | | Chief Compliance Officer, Invesco Advisers, Inc. (registered investment adviser); and Chief Compliance Officer, The Invesco Funds Formerly: Chief Compliance Officer, Putnam Investments and the Putnam Funds | | N/A | | N/A |
The Statement of Additional Information of the Trust includes additional information about the Fund’s Trustees and is available upon request, without charge, by calling 1.800.959.4246. Please refer to the Fund’s Statement of Additional Information for information on the Fund’s sub-advisers.
| | | | | | |
Office of the Fund 11 Greenway Plaza, Suite 1000 Houston, TX 77046-1173 | | Investment Adviser Invesco Advisers, Inc. 1555 Peachtree Street, N.E. Atlanta, GA 30309 | | Distributor Invesco Distributors, Inc. 11 Greenway Plaza, Suite 1000 Houston, TX 77046-1173 | | Auditors PricewaterhouseCoopers LLP 1000 Louisiana Street, Suite 5800 Houston, TX 77002-5678 |
| | | |
| | | | | | |
Counsel to the Fund Stradley Ronon Stevens & Young, LLP 2005 Market Street, Suite 2600 Philadelphia, PA 19103-7018 | | Counsel to the Independent Trustees Goodwin Procter LLP 901 New York Avenue, N.W. Washington, D.C. 20001 | | Transfer Agent Invesco Investment Services, Inc. 11 Greenway Plaza, Suite 1000 Houston, TX 77046-1173 | | Custodian State Street Bank and Trust Company 225 Franklin Street Boston, MA 02110-2801 |
Invesco V.I. S&P 500 Index Fund
| | | | |
| | |
 | | Annual Report to Shareholders | | December 31, 2017 |
| | |
| | Invesco V.I. Small Cap Equity Fund |

| | |
| | The Fund provides a complete list of its holdings four times in each fiscal year, at the quarter-ends. For the second and fourth quarters, the lists appear in the Fund’s semiannual and annual reports to shareholders. For the first and third quarters, the Fund files the lists with the Securities and Exchange Commission (SEC) on Form N-Q. The Fund’s Form N-Q filings are available on the SEC website, sec.gov. Copies of the Fund’s Forms N-Q may be reviewed and copied at the SEC Public Reference Room in Washington, D.C. You can obtain information on the operation of the Public Reference Room, including information about duplicating fee charges, by calling 202 551 8090 or 800 732 0330, or by electronic request at the following email address: publicinfo@sec.gov. The SEC file numbers for the Fund are 811-07452 and 033-57340. The Fund’s most recent portfolio holdings, as filed on Form N-Q, have also been made available to insurance companies issuing variable annuity contracts and variable life insurance policies (“variable products”) that invest in the Fund. A description of the policies and procedures that the Fund uses to determine how to vote proxies relating to portfolio securities is available without charge, upon request, from our Client Services department at 800 959 4246 or at invesco.com/proxyguidelines. The information is also available on the SEC website, sec.gov. Information regarding how the Fund voted proxies related to its portfolio securities during the most recent 12-month period ended June 30 is available at invesco.com/ proxysearch. The information is also available on the SEC website, sec.gov. Invesco Advisers, Inc. is an investment adviser; it provides investment advisory services to individual and institutional clients and does not sell securities. Invesco Distributors, Inc. is the US distributor for Invesco Ltd.’s retail mutual funds, exchange-traded funds and institutional money market funds. Both are wholly owned, indirect subsidiaries of Invesco Ltd. This report must be accompanied or preceded by a currently effective Fund prospectus and variable product prospectus, which contain more complete information, including sales charges and expenses. Investors should read each carefully before investing. NOT FDIC INSURED | MAY LOSE VALUE | NO BANK GUARANTEE |
| |
| | Invesco Distributors, Inc. VISCE-AR-1 02072018 1108 |
Management’s Discussion of Fund Performance
Performance summary
For the year ended December 31, 2017, Series I shares of Invesco V.I. Small Cap Equity Fund (the Fund) underperformed the Russell 2000 Index, the Fund’s style-specific index.
Your Fund’s long-term performance appears later in this report.
Fund vs. Indexes
Total returns, 12/31/16 to 12/31/17, excluding variable product issuer charges.
If variable product issuer charges were included, returns would be lower.
| | | | | |
| Series I Shares | | | | 14.06% | |
| Series II Shares | | | | 13.73 | |
| S&P 500 Index▼ (Broad Market Index) | | | | 21.83 | |
| Russell 2000 Index▼ (Style-Specific Index) | | | | 14.65 | |
| Lipper VUF Small-Cap Core Funds Index∎ (Peer Group Index) | | | | 13.49 | |
Source(s): ▼FactSet Research Systems Inc.; ∎Lipper Inc. | | | | | |
Market conditions and your Fund
Despite highly destructive hurricanes that threatened to derail a years-long economic recovery, the US economy continued to expand throughout the year ended December 31, 2017. Gross domestic product – the value of all goods and services produced in the US – expanded in the first three quarters of 2017. Inflation remained subdued even as unemployment continued its multiyear decline.
Given signs of an improving economy, the US Federal Reserve (the Fed) raised interest rates three times during the reporting period, most recently in December 2017; each rate hike was 25 basis points.1 (A basis point is 0.01%.) The Fed pledged that “realized and expected economic conditions relative to its objectives of maximum employment and 2 percent inflation” will guide its future actions. At the close of the reporting period, Fed policy remained accommodative, and the fed funds target rate stood at a range of 1.25% to 1.50% – 75 basis points higher than at the start of the reporting period.1
Higher inventories and a worsening outlook caused oil prices and many energy stocks to decline during the first half of 2017. However, oil prices rose significantly in the second half of the reporting period as expectations for lower supplies increased, partly due to continued OPEC production cuts, and demand began normalizing.
Major US stock market indexes repeatedly hit all-time highs throughout the reporting period. The stock market rally that began after the 2016 presidential election continued throughout the reporting period, fueled by generally positive economic data, strong corporate earnings and improved consumer confidence. Finally, after much debate in Congress, a tax reform bill was signed into law in December 2017. While its enactment further strengthened stocks, its effect on the US economy remained uncertain.
Within this environment, the Fund’s high-quality portfolio posted a double-digit positive return, yet modestly underperformed the Russell 2000 index. The Fund outperformed its style-specific index in the information technology (IT), financials, consumer discretionary,
industrials, real estate and telecommunication services sectors. However, these contributions were offset by under-performance in the health care, energy, materials and utilities sectors. The Fund’s modest cash positon in the rising market also detracted from relative results.
During the year, stock selection in the IT sector contributed to Fund performance relative to the style-specific index. Take-Two Interactive Software, an entertainment software developer, was a notable contributor to Fund performance. The company was boosted by solid quarterly results, as well as sales from its Grand Theft Auto game franchise. Photonics manufacturer Coherent also contributed to Fund performance. The company’s stock rose on better-than-expected results helped by organic light-emitting diode (OLED) adoption in consumer electronics.
Stock selection in the financials sector was also a contributor to relative performance during the year. E*TRADE Financial was the leading contributor to performance in the sector. The company benefited from higher trade volumes and customer account balance growth. The stock price also rallied late in the year as passage of tax reform legislation appeared more likely to lower the company’s tax rate.
Stock selection in the consumer discretionary sector aided Fund performance relative to the style-specific index. Boyd Gaming, a gaming and hospitality company in Nevada, contributed to Fund performance as the stock price rose on better-than-expected earnings and recent acquisitions in the Las Vegas area. Penn National Gaming, a gaming operator in Pennsylvania, contributed to relative performance, as well. The company’s stock price was driven by more favorable visitation and better-than-expected spending patterns.
| | |
Portfolio Composition |
By sector | | % of total net assets |
| |
| Financials | | 20.7% |
| Information Technology | | 18.9 |
| Industrials | | 18.6 |
| Consumer Discretionary | | 12.6 |
| Health Care | | 11.3 |
| Energy | | 5.0 |
| Materials | | 4.9 |
| Real Estate | | 3.5 |
| Consumer Staples | | 1.4 |
| Telecommunication Services | | 1.3 |
| Utilities | | 1.3 |
| Money Market Funds | | |
| Plus Other Assets Less Liabilities | | 0.5 |
| | |
Top 10 Equity Holdings* |
% of total net assets |
| |
1. Coherent, Inc. | | 1.8% |
2. E*TRADE Financial Corp. | | 1.7 |
3. Albany International Corp.-Class A | | 1.6 |
4. Take-Two Interactive Software, Inc. | | 1.6 |
5. SPX Corp. | | 1.6 |
6. Blackbaud, Inc. | | 1.5 |
7. Trex Co., Inc. | | 1.5 |
8. Neurocrine Biosciences, Inc. | | 1.5 |
9. Zebra Technologies Corp.- Class A | | 1.4 |
10. BWX Technologies, Inc. | | 1.4 |
| | |
Total Net Assets | | $306.8 million |
| |
| Total Number of Holdings* | | 96 |
The Fund’s holdings are subject to change, and there is no assurance that the Fund will continue to hold any particular security.
* Excluding money market fund holdings.
Data presented here are as of December 31, 2017.
Invesco V.I. Small Cap Equity Fund
Conversely, despite posting a solid return in the health care sector, the Fund underperformed its style-specific index. On the positive side, Fund holdings in the pharmaceuticals industry contributed to relative performance. Supernus Pharmaceuticals, a pharmaceutical company focused on treatments for the central nervous system, was a notable contributor to performance in the sector. In contrast, the Fund’s slight underweight exposure to the biotechnology industry was a notable detractor during the year. The health care equipment and supplies industry also detracted from relative performance. Analogic, a medical imaging company, was the leading detractor in the industry. The stock declined on un-derwhelming results in its ultra-sound business and the loss of a key customer. We sold the holding during the year.
Overweight exposure to the energy sector detracted from Fund performance relative to the style-specific index. The energy sector was the benchmark’s worst-performing sector during the reporting period as crude oil prices declined on concerns over increasing US energy supplies and fears that the OPEC cuts enacted in November 2016 would not be continued after June 2017. Despite OPEC members eventually agreeing to extend the cuts in May and a sharp rally in oil prices in the fourth quarter, the sector still has yet to fully recover. The Fund’s holdings were not immune to the decline in the sector. Superior Energy Services was a notable detractor from Fund performance within the sector. The company was hurt early in the year by lower-than-expected margins in its US land-based and Gulf of Mexico operations.
Fund holdings in the materials sector detracted from relative performance, as well. Underperformance within the sector was primarily due to the Fund owning more defensive names relative to the style-specific index and the Fund’s underweight exposure to the chemicals industry. Minerals Technologies and Sensient Technologies were the leading detractors from relative performance in the sector.
All changes to positioning are based on our bottom-up stock selection process. Our portfolio construction process acts as a risk control and ensures the portfolio is aligned with small-cap market sector exposure within modest over- and underweights. Our long-term investment horizon leads to relatively low turnover.
The traditional business cycle recovery has not fully materialized, as evidenced by several years of mixed results, depending on which sector we evaluate. However, it is possible this is just a very slow normalization, and there is some evidence we may yet see a more classic recovery and a reacceleration in growth. Due to the uncertain economic outlook, we continue to balance the Fund with a mix of long-term secular growth opportunities and cyclical growth opportunities that have strong valuation support.
Thank you for your commitment to Invesco V.I. Small Cap Equity Fund and for sharing our long-term investment horizon.
| 1 | Source: US Federal Reserve |
The views and opinions expressed in management’s discussion of Fund performance are those of Invesco Advisers, Inc. These views and opinions are subject to change at any time based on factors such as market and economic conditions. These views and opinions may not be relied upon as investment advice or recommendations, or as an offer for a particular security. The information is not a complete analysis of every aspect of any market, country, industry, security or the Fund. Statements of fact are from sources considered reliable, but Invesco Advisers, Inc. makes no representation or warranty as to their completeness or accuracy. Although historical performance is no guarantee of future results, these insights may help you understand our investment management philosophy.
See important Fund and, if applicable, index disclosures later in this report.
| | |
 | | Juan Hartsfield Chartered Financial Analyst, Portfolio Manager, is lead manager of Invesco V.I. Small Cap Equity Fund. |
| He joined Invesco in 2004. Mr. Hartsfield earned a BS in petroleum engineering from The University of Texas at Austin and an MBA from the University of Michigan. |
| |
 | | Davis Paddock Chartered Financial Analyst, Portfolio Manager, is manager of Invesco V.I. Small Cap Equity Fund. He joined |
| Invesco in 2001. Mr. Paddock earned a BA and an MBA from The University of Texas at Austin. |
Invesco V.I. Small Cap Equity Fund
Your Fund’s Long-Term Performance
Results of a $10,000 Investment – Oldest Share Class(es)
Fund and index data from 12/31/07
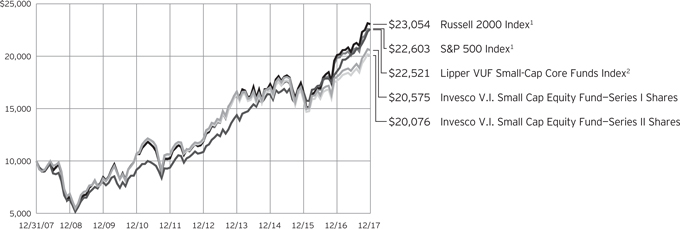
| 1 | Source: FactSet Research Systems Inc. |
Past performance cannot guarantee
comparable future results.
| | | | | |
| Average Annual Total Returns | | |
As of 12/31/17 | | | | | |
| |
| Series I Shares | | | | | |
| Inception (8/29/03) | | | | 8.97% | |
| 10 Years | | | | 7.48 | |
| 5 Years | | | | 11.19 | |
| 1 Year | | | | 14.06 | |
| |
| Series II Shares | | | | | |
| Inception (8/29/03) | | | | 8.71% | |
| 10 Years | | | | 7.22 | |
| 5 Years | | | | 10.90 | |
| 1 Year | | | | 13.73 | |
The performance of the Fund’s Series I and Series II share classes will differ primarily due to different class expenses.
The performance data quoted represent past performance and cannot guarantee comparable future results; current performance may be lower or higher. Please contact your variable product issuer or financial adviser for the most recent month-end variable product performance. Performance figures reflect Fund expenses, reinvested distributions and
changes in net asset value. Investment return and principal value will fluctuate so that you may have a gain or loss when you sell shares.
The total annual Fund operating expense ratio set forth in the most recent Fund prospectus as of the date of this report for Series I and Series II shares was 0.96% and 1.21%, respectively. The expense ratios presented above may vary from the expense ratios presented in other sections of this report that are based on expenses incurred during the period covered by this report.
Invesco V.I. Small Cap Equity Fund, a series portfolio of AIM Variable Insurance Funds (Invesco Variable Insurance Funds), is currently offered through insurance companies issuing variable products. You cannot purchase shares of the Fund directly. Performance figures given represent the Fund and are not intended to reflect actual variable product values. They do not reflect sales charges, expenses and
fees assessed in connection with a variable product. Sales charges, expenses and fees, which are determined by the variable product issuers, will vary and will lower the total return.
The most recent month-end performance at the Fund level, excluding variable product charges, is available at 800 451 4246. As mentioned above, for the most recent month-end performance including variable product charges, please contact your variable product issuer or financial adviser.
Fund performance reflects any applicable fee waivers and/or expense reimbursements. Had the adviser not waived fees and/or reimbursed expenses currently or in the past, returns would have been lower. See current prospectus for more information.
Invesco V.I. Small Cap Equity Fund
Invesco V.I. Small Cap Equity Fund’s investment objective is long-term growth of capital.
| ∎ | | Unless otherwise stated, information presented in this report is as of December 31, 2017, and is based on total net assets. |
| ∎ | | Unless otherwise noted, all data provided by Invesco. |
Principal risks of investing in the Fund
Foreign securities risk. The Fund’s foreign investments may be adversely affected by political and social instability, changes in economic or taxation policies, difficulty in enforcing obligations, decreased liquidity or increased volatility. Foreign investments also involve the risk of the possible seizure, nationalization or expropriation of the issuer or foreign deposits (in which the Fund could lose its entire investments in a certain market) and the possible adoption of foreign governmental restrictions such as exchange controls. Unless the Fund has hedged its foreign securities risk, foreign securities risk also involves the risk of negative foreign currency rate fluctuations, which may cause the value of securities denominated in such foreign currency (or other instruments through which the Fund has exposure to foreign currencies) to decline in value. Currency exchange rates may fluctuate significantly over short periods of time. Currency hedging strategies, if used, are not always successful.
Management risk. The Fund is actively managed and depends heavily on the Adviser’s judgment about markets, interest rates or the attractiveness, relative values, liquidity, or potential appreciation of particular investments made for the Fund’s portfolio. The Fund could experience losses if these judgments prove to be incorrect. Additionally, legislative, regulatory, or tax developments may adversely affect management of the Fund and, therefore, the ability of the Fund to achieve its investment objective.
Market risk. The market values of the Fund’s investments, and therefore the value of the Fund’s shares, will go up and down, sometimes rapidly or unpredictably. Market risk may affect a single issuer, industry or section of the economy, or it may affect the market as a whole. Individual stock prices tend to go up and down more dramatically than those of certain other types of investments, such as bonds. During a general downturn in the financial markets, multiple asset classes may decline in value. When markets perform well, there can be no assurance that specific investments held by the Fund will rise in value.
Small- and mid-capitalization companies risks. Small-and mid-capitalization companies tend to be more vulnerable to changing market conditions, may have little or no operating history or track record of success, and may have more limited product lines and markets, less experienced management and fewer financial resources than larger companies. These companies’ securities may be more volatile and less liquid than those of more established companies, and their returns may vary, sometimes significantly, from the overall securities market.
About indexes used in this report
The S&P 500® Index is an unmanaged index considered representative of the US stock market.
The Russell 2000® Index is an unmanaged index considered representative of small-cap stocks. The Russell 2000 Index is a trademark/service mark of the Frank Russell Co. Russell® is a trademark of the Frank Russell Co.
The Lipper VUF Small-Cap Core Funds Index is an unmanaged index considered representative of small-cap core variable insurance underlying funds tracked by Lipper.
The Fund is not managed to track the performance of any particular index, including the index(es) described here, and consequently, the performance of the Fund may deviate significantly from the performance of the index(es).
A direct investment cannot be made in an index. Unless otherwise indicated, index results include reinvested dividends, and they do not reflect sales charges. Performance of the peer group, if applicable, reflects fund expenses; performance of a market index does not.
Other information
The returns shown in management’s discussion of Fund performance are based on net asset values calculated for shareholder transactions. Generally accepted accounting principles require adjustments to be made to the net assets of the Fund at period end for financial reporting purposes, and as such, the net asset values for shareholder transactions and the returns based on those net asset values may differ from the net asset values and returns reported in the Financial
Highlights. Additionally, the returns and net asset values shown throughout this report are at the Fund level only and do not include variable product issuer charges. If such charges were included, the total returns would be lower.
Industry classifications used in this report are generally according to the Global Industry Classification Standard, which was developed by and is the exclusive property and a service mark of MSCI Inc. and Standard & Poor’s.
Invesco V.I. Small Cap Equity Fund
Schedule of Investments(a)
December 31, 2017
| | | | | | | | |
| | | Shares | | | Value | |
Common Stocks & Other Equity Interests–99.48% | |
| Aerospace & Defense–1.42% | |
BWX Technologies, Inc. | | | 72,074 | | | $ | 4,359,756 | |
|
| Air Freight & Logistics–1.07% | |
Forward Air Corp. | | | 57,145 | | | | 3,282,409 | |
|
| Alternative Carriers–1.25% | |
Iridium Communications Inc.(b)(c) | | | 324,934 | | | | 3,834,221 | |
|
| Apparel Retail–0.96% | |
American Eagle Outfitters, Inc. | | | 156,610 | | | | 2,944,268 | |
|
| Application Software–1.48% | |
Blackbaud, Inc. | | | 47,972 | | | | 4,532,874 | |
|
| Auto Parts & Equipment–1.27% | |
Visteon Corp.(c) | | | 31,167 | | | | 3,900,238 | |
|
| Biotechnology–3.10% | |
Array BioPharma Inc.(c) | | | 246,789 | | | | 3,158,899 | |
Neurocrine Biosciences, Inc.(c) | | | 57,287 | | | | 4,444,898 | |
Retrophin, Inc.(c) | | | 90,662 | | | | 1,910,249 | |
| | | | | | | | 9,514,046 | |
|
| Building Products–2.35% | |
Apogee Enterprises, Inc. | | | 60,157 | | | | 2,750,980 | |
Trex Co., Inc.(c) | | | 41,092 | | | | 4,453,962 | |
| | | | | | | | 7,204,942 | |
|
| Casinos & Gaming–2.38% | |
Boyd Gaming Corp. | | | 114,240 | | | | 4,004,112 | |
Penn National Gaming, Inc.(c) | | | 105,661 | | | | 3,310,359 | |
| | | | | | | | 7,314,471 | |
|
| Construction & Engineering–1.99% | |
Dycom Industries, Inc.(c) | | | 30,043 | | | | 3,347,691 | |
Primoris Services Corp. | | | 101,956 | | | | 2,772,184 | |
| | | | | | | | 6,119,875 | |
|
| Construction Materials–1.03% | |
Eagle Materials Inc. | | | 27,802 | | | | 3,149,967 | |
|
| Consumer Finance–0.93% | |
SLM Corp.(c) | | | 252,163 | | | | 2,849,442 | |
|
| Data Processing & Outsourced Services–3.00% | |
Euronet Worldwide, Inc.(c) | | | 32,164 | | | | 2,710,460 | |
Genpact Ltd. | | | 100,244 | | | | 3,181,745 | |
Jack Henry & Associates, Inc. | | | 28,211 | | | | 3,299,558 | |
| | | | | | | | 9,191,763 | |
|
| Diversified Support Services–0.85% | |
Mobile Mini, Inc. | | | 76,004 | | | | 2,622,138 | |
| | | | | | | | |
| | | Shares | | | Value | |
| Electrical Components & Equipment–1.86% | �� |
EnerSys | | | 39,950 | | | $ | 2,781,719 | |
Generac Holdings, Inc.(c) | | | 59,329 | | | | 2,937,972 | |
| | | | | | | | 5,719,691 | |
|
| Electronic Components–0.93% | |
Belden Inc. | | | 37,060 | | | | 2,859,920 | |
|
| Electronic Equipment & Instruments–5.44% | |
Coherent, Inc.(c) | | | 19,187 | | | | 5,414,955 | |
FLIR Systems, Inc. | | | 81,532 | | | | 3,801,022 | |
National Instruments Corp. | | | 73,988 | | | | 3,080,121 | |
Zebra Technologies Corp.–Class A (c) | | | 42,209 | | | | 4,381,294 | |
| | | | | | | | 16,677,392 | |
|
| Environmental & Facilities Services–2.27% | |
ABM Industries Inc. | | | 71,043 | | | | 2,679,742 | |
Waste Connections, Inc. (Canada) | | | 60,564 | | | | 4,296,410 | |
| | | | | | | | 6,976,152 | |
|
| Gas Utilities–1.25% | |
UGI Corp. | | | 81,747 | | | | 3,838,022 | |
|
| General Merchandise Stores–0.96% | |
Big Lots, Inc. | | | 52,405 | | | | 2,942,541 | |
|
| Health Care Equipment–3.55% | |
Hill-Rom Holdings, Inc. | | | 41,253 | | | | 3,477,215 | |
Nevro Corp.(c) | | | 31,944 | | | | 2,205,414 | |
STERIS plc | | | 34,585 | | | | 3,025,150 | |
Wright Medical Group N.V.(c) | | | 98,518 | | | | 2,187,100 | |
| | | | | | | | 10,894,879 | |
|
| Health Care Facilities–0.53% | |
Acadia Healthcare Co., Inc.(c) | | | 50,134 | | | | 1,635,872 | |
|
| Health Care REIT’s–0.84% | |
Healthcare Trust of America, Inc.–Class A | | | 85,855 | | | | 2,565,586 | |
|
| Health Care Supplies–0.95% | |
Lantheus Holdings, Inc.(c) | | | 142,236 | | | | 2,908,726 | |
|
| Home Entertainment Software–1.61% | |
Take-Two Interactive Software, Inc.(c) | | | 44,970 | | | | 4,936,807 | |
|
| Home Furnishings–0.22% | |
La-Z-Boy Inc. | | | 21,272 | | | | 663,686 | |
|
| Homebuilding–0.87% | |
Beazer Homes USA, Inc.(c) | | | 138,595 | | | | 2,662,410 | |
|
| Household Appliances–1.05% | |
Helen of Troy Ltd.(c) | | | 33,398 | | | | 3,217,897 | |
|
| Industrial Machinery–3.19% | |
Albany International Corp.–Class A | | | 81,055 | | | | 4,980,830 | |
SPX Corp.(c) | | | 152,665 | | | | 4,792,154 | |
| | | | | | | | 9,772,984 | |
See accompanying Notes to Financial Statements which are an integral part of the financial statements.
Invesco V.I. Small Cap Equity Fund
| | | | | | | | |
| | | Shares | | | Value | |
| Internet Software & Services–0.99% | |
Instructure Inc.(c) | | | 91,786 | | | $ | 3,038,117 | |
|
| Investment Banking & Brokerage–3.90% | |
E*TRADE Financial Corp.(c) | | | 103,709 | | | | 5,140,855 | |
Lazard Ltd.–Class A | | | 68,106 | | | | 3,575,565 | |
Piper Jaffray Cos. | | | 37,636 | | | | 3,246,105 | |
| | | | | | | | 11,962,525 | |
|
| Life & Health Insurance–1.21% | |
CNO Financial Group, Inc. | | | 150,697 | | | | 3,720,709 | |
|
| Life Sciences Tools & Services–0.81% | |
Cambrex Corp.(c) | | | 51,475 | | | | 2,470,800 | |
|
| Managed Health Care–0.48% | |
HealthEquity, Inc.(c) | | | 31,549 | | | | 1,472,076 | |
|
| Multi-Line Insurance–2.05% | |
American Financial Group, Inc. | | | 28,924 | | | | 3,139,411 | |
Horace Mann Educators Corp. | | | 71,302 | | | | 3,144,418 | |
| | | | | | | | 6,283,829 | |
|
| Office REIT’s–0.93% | |
Highwoods Properties, Inc. | | | 55,880 | | | | 2,844,851 | |
|
| Oil & Gas Equipment & Services–1.20% | |
Forum Energy Technologies Inc.(c) | | | 144,439 | | | | 2,246,026 | |
Superior Energy Services, Inc.(c) | | | 150,612 | | | | 1,450,394 | |
| | | | | | | | 3,696,420 | |
|
| Oil & Gas Exploration & Production–3.81% | |
Energen Corp.(c) | | | 58,439 | | | | 3,364,333 | |
Newfield Exploration Co.(c) | | | 74,809 | | | | 2,358,728 | |
Parsley Energy, Inc.–Class A (c) | | | 77,613 | | | | 2,284,927 | |
RSP Permian, Inc.(c) | | | 90,403 | | | | 3,677,594 | |
| | | | | | | | 11,685,582 | |
|
| Packaged Foods & Meats–1.38% | |
Pinnacle Foods Inc. | | | 47,937 | | | | 2,850,814 | |
TreeHouse Foods, Inc.(c) | | | 27,946 | | | | 1,382,209 | |
| | | | | | | | 4,233,023 | |
|
| Paper Packaging–0.98% | |
Graphic Packaging Holding Co. | | | 193,742 | | | | 2,993,314 | |
|
| Pharmaceuticals–1.89% | |
Phibro Animal Health Corp.–Class A | | | 80,981 | | | | 2,712,863 | |
Supernus Pharmaceuticals Inc.(c) | | | 77,156 | | | | 3,074,667 | |
| | | | | | | | 5,787,530 | |
|
| Property & Casualty Insurance–3.03% | |
Argo Group International Holdings, Ltd. | | | 48,982 | | | | 3,019,740 | |
Aspen Insurance Holdings Ltd. (Bermuda) | | | 58,870 | | | | 2,390,122 | |
Hanover Insurance Group Inc. (The) | | | 35,909 | | | | 3,881,045 | |
| | | | | | | | 9,290,907 | |
|
| Real Estate Operating Companies–0.64% | |
Kennedy-Wilson Holdings Inc. | | | 113,755 | | | | 1,973,649 | |
| | | | | | | | |
| | | Shares | | | Value | |
| Regional Banks–9.59% | |
Bank of the Ozarks, Inc. | | | 68,212 | | | $ | 3,304,871 | |
BankUnited, Inc. | | | 78,368 | | | | 3,191,145 | |
Great Western Bancorp, Inc. | | | 89,572 | | | | 3,564,966 | |
IBERIABANK Corp. | | | 43,583 | | | | 3,377,682 | |
Pinnacle Financial Partners, Inc. | | | 50,303 | | | | 3,335,089 | |
Synovus Financial Corp. | | | 87,896 | | | | 4,213,734 | |
Webster Financial Corp. | | | 73,804 | | | | 4,144,833 | |
Western Alliance Bancorp(c) | | | 75,450 | | | | 4,271,979 | |
| | | | | | | | 29,404,299 | |
|
| Restaurants–1.73% | |
Papa John’s International, Inc. | | | 39,189 | | | | 2,198,895 | |
Wendy’s Co. (The) | | | 189,180 | | | | 3,106,335 | |
| | | | | | | | 5,305,230 | |
|
| Semiconductor Equipment–1.11% | |
Teradyne, Inc. | | | 81,382 | | | | 3,407,464 | |
|
| Semiconductors–2.59% | |
MACOM Technology Solutions Holdings, Inc.(b) (c) | | | 61,600 | | | | 2,004,464 | |
Microsemi Corp.(c) | | | 83,642 | | | | 4,320,109 | |
Power Integrations, Inc. | | | 21,920 | | | | 1,612,216 | |
| | | | | | | | 7,936,789 | |
|
| Specialized Consumer Services–1.27% | |
ServiceMaster Global Holdings, Inc.(c) | | | 75,945 | | | | 3,893,700 | |
|
| Specialized REIT’s–1.09% | |
CubeSmart | | | 115,826 | | | | 3,349,688 | |
|
| Specialty Chemicals–2.94% | |
Minerals Technologies Inc. | | | 43,104 | | | | 2,967,710 | |
PolyOne Corp. | | | 78,827 | | | | 3,428,975 | |
Sensient Technologies Corp. | | | 36,057 | | | | 2,637,570 | |
| | | | | | | | 9,034,255 | |
|
| Specialty Stores–1.02% | |
Michaels Cos., Inc. (The)(c) | | | 129,113 | | | | 3,123,244 | |
|
| Systems Software–0.85% | |
CommVault Systems, Inc.(c) | | | 49,953 | | | | 2,622,533 | |
|
| Technology Distributors–0.91% | |
Tech Data Corp.(c) | | | 28,423 | | | | 2,784,601 | |
|
| Tires & Rubber–0.85% | |
Cooper Tire & Rubber Co. | | | 73,818 | | | | 2,609,466 | |
|
| Trading Companies & Distributors–1.05% | |
Univar Inc.(c) | | | 104,016 | | | | 3,220,335 | |
|
| Trucking–2.58% | |
Knight-Swift Transportation Holdings Inc. | | | 81,809 | | | | 3,576,690 | |
Old Dominion Freight Line, Inc. | | | 32,917 | | | | 4,330,231 | |
| | | | | | | | 7,906,921 | |
Total Common Stocks & Other Equity Interests
(Cost $227,663,374) | | | | 305,144,832 | |
See accompanying Notes to Financial Statements which are an integral part of the financial statements.
Invesco V.I. Small Cap Equity Fund
| | | | | | | | |
| | | Shares | | | Value | |
Money Market Funds–0.16% | |
Invesco Government & Agency Portfolio–Institutional
Class, 1.18%(d) | | | 174,200 | | | $ | 174,200 | |
Invesco Liquid Assets Portfolio–Institutional
Class, 1.40%(d) | | | 124,340 | | | | 124,352 | |
Invesco Treasury Portfolio–Institutional
Class, 1.17%(d) | | | 199,086 | | | | 199,086 | |
Total Money Market Funds
(Cost $497,638) | | | | 497,638 | |
TOTAL INVESTMENTS IN SECURITIES (excluding investments purchased with cash collateral from securities on loan)–99.64% (Cost $228,161,012) | | | | 305,642,470 | |
| | | | | | | | |
| | | Shares | | | Value | |
Investments Purchased with Cash Collateral from Securities on Loan | | | | | |
Money Market Funds–1.47% | |
Invesco Government & Agency
Portfolio–Institutional Class, 1.18% (Cost $4,512,487)(d)(e) | | | 4,512,487 | | | $ | 4,512,487 | |
TOTAL INVESTMENTS IN SECURITIES–101.11% (Cost $232,673,499) | | | | 310,154,957 | |
OTHER ASSETS LESS LIABILITIES–(1.11)% | | | | (3,400,660 | ) |
NET ASSETS–100.00% | | | $ | 306,754,297 | |
Investment Abbreviations:
| | |
| REIT | | – Real Estate Investment Trust |
Notes to Schedule of Investments:
| (a) | Industry and/or sector classifications used in this report are generally according to the Global Industry Classification Standard, which was developed by and is the exclusive property and a service mark of MSCI Inc. and Standard & Poor’s. |
| (b) | All or a portion of this security was out on loan at December 31, 2017. |
| (c) | Non-income producing security. |
| (d) | The money market fund and the Fund are affiliated by having the same investment adviser. The rate shown is the 7-day SEC standardized yield as of December 31, 2017. |
| (e) | The security has been segregated to satisfy the commitment to return the cash collateral received in securities lending transactions upon the borrower’s return of the securities loaned. See Note 1I. |
See accompanying Notes to Financial Statements which are an integral part of the financial statements.
Invesco V.I. Small Cap Equity Fund
Statement of Assets and Liabilities
December 31, 2017
Statement of Operations
For the year ended December 31, 2017
| | | | |
Assets: | | | | |
Investments in securities, at value (Cost $227,663,374)* | | $ | 305,144,832 | |
Investments in affiliated money market funds, at value and cost | | | 5,010,125 | |
Receivable for: | | | | |
Investments sold | | | 1,187,744 | |
Fund shares sold | | | 146,058 | |
Dividends | | | 208,662 | |
Investment for trustee deferred compensation and retirement plans | | | 80,265 | |
Total assets | | | 311,777,686 | |
| |
Liabilities: | | | | |
Payable for: | | | | |
Collateral upon return of securities loaned | | | 4,512,487 | |
Fund shares reacquired | | | 176,482 | |
Accrued fees to affiliates | | | 213,656 | |
Accrued trustees’ and officers’ fees and benefits | | | 679 | |
Accrued other operating expenses | | | 30,361 | |
Trustee deferred compensation and retirement plans | | | 89,724 | |
Total liabilities | | | 5,023,389 | |
Net assets applicable to shares outstanding | | $ | 306,754,297 | |
| |
Net assets consist of: | | | | |
Shares of beneficial interest | | $ | 210,918,576 | |
Undistributed net investment income (loss) | | | (76,130 | ) |
Undistributed net realized gain | | | 18,430,393 | |
Net unrealized appreciation | | | 77,481,458 | |
| | | $ | 306,754,297 | |
| |
Net Assets: | | | | |
Series I | | $ | 149,404,967 | |
Series II | | $ | 157,349,330 | |
|
Shares outstanding, no par value,
with an unlimited number of shares authorized: | |
Series I | | | 7,463,658 | |
Series II | | | 8,261,049 | |
Series I: | | | | |
Net asset value per share | | $ | 20.02 | |
Series II: | | | | |
Net asset value per share | | $ | 19.05 | |
| * | At December 31, 2017, securities with an aggregate value of $4,418,304 were on loan to brokers. |
| | | | |
Investment income: | | | | |
Dividends (net of foreign withholding taxes of $4,692) | | $ | 2,824,507 | |
Dividends from affiliated money market funds (includes securities lending income of $7,432) | | | 39,620 | |
Total investment income | | | 2,864,127 | |
| |
Expenses: | | | | |
Advisory fees | | | 2,256,696 | |
Administrative services fees | | | 524,812 | |
Custodian fees | | | 14,047 | |
Distribution fees — Series II | | | 375,997 | |
Transfer agent fees | | | 33,116 | |
Trustees’ and officers’ fees and benefits | | | 25,170 | |
Reports to shareholders | | | 40,071 | |
Professional services fees | | | 43,738 | |
Other | | | 5,596 | |
Total expenses | | | 3,319,243 | |
Less: Fees waived | | | (5,324 | ) |
Net expenses | | | 3,313,919 | |
Net investment income (loss) | | | (449,792 | ) |
| |
Realized and unrealized gain from: | | | | |
Net realized gain from investment securities (includes net gains from securities sold to affiliates of $1,043,508) | | | 19,070,078 | |
Change in net unrealized appreciation of investment securities | | | 20,825,514 | |
Net realized and unrealized gain | | | 39,895,592 | |
Net increase in net assets resulting from operations | | $ | 39,445,800 | |
See accompanying Notes to Financial Statements which are an integral part of the financial statements.
Invesco V.I. Small Cap Equity Fund
Statement of Changes in Net Assets
For the years ended December 31, 2017 and 2016
| | | | | | | | |
| | | 2017 | | | 2016 | |
Operations: | | | | | | | | |
Net investment income (loss) | | $ | (449,792 | ) | | $ | (207,323 | ) |
Net realized gain | | | 19,070,078 | | | | 13,816,268 | |
Change in net unrealized appreciation | | | 20,825,514 | | | | 20,760,134 | |
Net increase in net assets resulting from operations | | | 39,445,800 | | | | 34,369,079 | |
| | |
Distributions to shareholders from net realized gains: | | | | | | | | |
Series l | | | (6,502,386 | ) | | | (11,226,305 | ) |
Series ll | | | (7,130,030 | ) | | | (10,517,748 | ) |
Total distributions from net realized gains | | | (13,632,416 | ) | | | (21,744,053 | ) |
| | |
Share transactions–net: | | | | | | | | |
Series l | | | (25,705,703 | ) | | | (11,957,409 | ) |
Series ll | | | (3,963,272 | ) | | | 14,920,964 | |
Net increase (decrease) in net assets resulting from share transactions | | | (29,668,975 | ) | | | 2,963,555 | |
Net increase (decrease) in net assets | | | (3,855,591 | ) | | | 15,588,581 | |
| | |
Net assets: | | | | | | | | |
Beginning of year | | | 310,609,888 | | | | 295,021,307 | |
End of year (includes undistributed net investment income (loss) of $(76,130) and $(80,448), respectively) | | $ | 306,754,297 | | | $ | 310,609,888 | |
Notes to Financial Statements
December 31, 2017
NOTE 1—Significant Accounting Policies
Invesco V.I. Small Cap Equity Fund (the “Fund”) is a series portfolio of AIM Variable Insurance Funds (Invesco Variable Insurance Funds) (the “Trust”). The Trust is a Delaware statutory trust registered under the Investment Company Act of 1940, as amended (the “1940 Act”), as an open-end series management investment company consisting of twenty-four separate portfolios, (each constituting a “Fund”). The assets, liabilities and operations of each portfolio are accounted for separately. Information presented in these financial statements pertains only to the Fund. Matters affecting each Fund or class will be voted on exclusively by the shareholders of such Fund or class. Current Securities and Exchange Commission (“SEC”) guidance, however, requires participating insurance companies offering separate accounts to vote shares proportionally in accordance with the instructions of the contract owners whose investments are funded by shares of each Fund or class.
The Fund’s investment objective is long-term growth of capital.
The Fund currently offers two classes of shares, Series I and Series II, both of which are offered to insurance company separate accounts funding variable annuity contracts and variable life insurance policies (“variable products”).
The Fund is an investment company and accordingly follows the investment company accounting and reporting guidance in accordance with Financial Accounting Standards Board Accounting Standards Codification Topic 946, Financial Services — Investment Companies.
The following is a summary of the significant accounting policies followed by the Fund in the preparation of its financial statements.
| A. | Security Valuations — Securities, including restricted securities, are valued according to the following policy. |
A security listed or traded on an exchange (except convertible securities) is valued at its last sales price or official closing price as of the close of the customary trading session on the exchange where the security is principally traded, or lacking any sales or official closing price on a particular day, the security may be valued at the closing bid price on that day. Securities traded in the over-the-counter market are valued based on prices furnished by independent pricing services or market makers. When such securities are valued by an independent pricing service they may be considered fair valued. Futures contracts are valued at the final settlement price set by an exchange on which they are principally traded. Listed options are valued at the mean between the last bid and asked prices from the exchange on which they are principally traded. Options not listed on an exchange are valued by an independent source at the mean between the last bid and asked prices. For purposes of determining net asset value (“NAV”) per share, futures and option contracts generally are valued 15 minutes after the close of the customary trading session of the New York Stock Exchange (“NYSE”).
Investments in open-end and closed-end registered investment companies that do not trade on an exchange are valued at the end-of-day net asset value per share. Investments in open-end and closed-end registered investment companies that trade on an exchange are valued at the last sales price or official closing price as of the close of the customary trading session on the exchange where the security is principally traded.
Debt obligations (including convertible securities) and unlisted equities are fair valued using an evaluated quote provided by an independent pricing service. Evaluated quotes provided by the pricing service may be determined without exclusive reliance on quoted prices, and may reflect appropriate factors such as institution-size trading in similar groups of securities, developments related to specific securities, dividend rate (for unlisted equities), yield (for debt obligations), quality, type of issue, coupon rate (for debt obligations), maturity (for debt obligations), individual trading characteristics and other market data. Pricing services generally value debt obligations assuming orderly transactions of institutional round lot size, but a fund may hold or transact in the same securities in smaller, odd lot sizes. Odd lots often trade at lower prices than
Invesco V.I. Small Cap Equity Fund
institutional round lots. Debt obligations are subject to interest rate and credit risks. In addition, all debt obligations involve some risk of default with respect to interest and/or principal payments.
Foreign securities’ (including foreign exchange contracts) prices are converted into U.S. dollar amounts using the applicable exchange rates as of the close of the NYSE. If market quotations are available and reliable for foreign exchange-traded equity securities, the securities will be valued at the market quotations. Because trading hours for certain foreign securities end before the close of the NYSE, closing market quotations may become unreliable. If between the time trading ends on a particular security and the close of the customary trading session on the NYSE, events occur that the investment adviser determines are significant and make the closing price unreliable, the Fund may fair value the security. If the event is likely to have affected the closing price of the security, the security will be valued at fair value in good faith using procedures approved by the Board of Trustees. Adjustments to closing prices to reflect fair value may also be based on a screening process of an independent pricing service to indicate the degree of certainty, based on historical data, that the closing price in the principal market where a foreign security trades is not the current value as of the close of the NYSE. Foreign securities’ prices meeting the approved degree of certainty that the price is not reflective of current value will be priced at the indication of fair value from the independent pricing service. Multiple factors may be considered by the independent pricing service in determining adjustments to reflect fair value and may include information relating to sector indices, American Depositary Receipts and domestic and foreign index futures. Foreign securities may have additional risks including exchange rate changes, potential for sharply devalued currencies and high inflation, political and economic upheaval, the relative lack of issuer information, relatively low market liquidity and the potential lack of strict financial and accounting controls and standards.
Securities for which market prices are not provided by any of the above methods may be valued based upon quotes furnished by independent sources. The last bid price may be used to value equity securities. The mean between the last bid and asked prices is used to value debt obligations, including corporate loans.
Securities for which market quotations are not readily available or became unreliable are valued at fair value as determined in good faith by or under the supervision of the Trust’s officers following procedures approved by the Board of Trustees. Issuer specific events, market trends, bid/asked quotes of brokers and information providers and other market data may be reviewed in the course of making a good faith determination of a security’s fair value.
The Fund may invest in securities that are subject to interest rate risk, meaning the risk that the prices will generally fall as interest rates rise and, conversely, the prices will generally rise as interest rates fall. Specific securities differ in their sensitivity to changes in interest rates depending on their individual characteristics. Changes in interest rates may result in increased market volatility, which may affect the value and/or liquidity of certain Fund investments.
Valuations change in response to many factors including the historical and prospective earnings of the issuer, the value of the issuer’s assets, general economic conditions, interest rates, investor perceptions and market liquidity. Because of the inherent uncertainties of valuation, the values reflected in the financial statements may materially differ from the value received upon actual sale of those investments.
| B. | Securities Transactions and Investment Income — Securities transactions are accounted for on a trade date basis. Realized gains or losses on sales are computed on the basis of specific identification of the securities sold. Interest income (net of withholding tax, if any) is recorded on the accrual basis from settlement date. Dividend income (net of withholding tax, if any) is recorded on the ex-dividend date. |
The Fund may periodically participate in litigation related to Fund investments. As such, the Fund may receive proceeds from litigation settlements. Any proceeds received are included in the Statement of Operations as realized gain (loss) for investments no longer held and as unrealized gain (loss) for investments still held.
Brokerage commissions and mark ups are considered transaction costs and are recorded as an increase to the cost basis of securities purchased and/or a reduction of proceeds on a sale of securities. Such transaction costs are included in the determination of net realized and unrealized gain (loss) from investment securities reported in the Statement of Operations and the Statement of Changes in Net Assets and the net realized and unrealized gains (losses) on securities per share in the Financial Highlights. Transaction costs are included in the calculation of the Fund’s net asset value and, accordingly, they reduce the Fund’s total returns. These transaction costs are not considered operating expenses and are not reflected in net investment income reported in the Statement of Operations and the Statement of Changes in Net Assets, or the net investment income per share and the ratios of expenses and net investment income reported in the Financial Highlights, nor are they limited by any expense limitation arrangements between the Fund and the investment adviser.
The Fund allocates income and realized and unrealized capital gains and losses to a class based on the relative net assets of each class.
| C. | Country Determination — For the purposes of making investment selection decisions and presentation in the Schedule of Investments, the investment adviser may determine the country in which an issuer is located and/or credit risk exposure based on various factors. These factors include the laws of the country under which the issuer is organized, where the issuer maintains a principal office, the country in which the issuer derives 50% or more of its total revenues and the country that has the primary market for the issuer’s securities, as well as other criteria. Among the other criteria that may be evaluated for making this determination are the country in which the issuer maintains 50% or more of its assets, the type of security, financial guarantees and enhancements, the nature of the collateral and the sponsor organization. Country of issuer and/or credit risk exposure has been determined to be the United States of America, unless otherwise noted. |
| D. | Distributions — Distributions from net investment income and net realized capital gain, if any, are generally declared and paid to separate accounts of participating insurance companies annually and recorded on the ex-dividend date. |
| E. | Federal Income Taxes — The Fund intends to comply with the requirements of Subchapter M of the Internal Revenue Code of 1986, as amended (the “Internal Revenue Code”), necessary to qualify as a regulated investment company and to distribute substantially all of the Fund’s taxable earnings to shareholders. As such, the Fund will not be subject to federal income taxes on otherwise taxable income (including net realized capital gain) that is distributed to shareholders. Therefore, no provision for federal income taxes is recorded in the financial statements. |
The Fund recognizes the tax benefits of uncertain tax positions only when the position is more likely than not to be sustained. Management has analyzed the Fund’s uncertain tax positions and concluded that no liability for unrecognized tax benefits should be recorded related to uncertain tax positions. Management is not aware of any tax positions for which it is reasonably possible that the total amounts of unrecognized tax benefits will change materially in the next 12 months.
The Fund files tax returns in the U.S. Federal jurisdiction and certain other jurisdictions. Generally, the Fund is subject to examinations by such taxing authorities for up to three years after the filing of the return for the tax period.
Invesco V.I. Small Cap Equity Fund
| F. | Expenses — Fees provided for under the Rule 12b-1 plan of a particular class of the Fund and which are directly attributable to that class are charged to the operations of such class. All other expenses are allocated among the classes based on relative net assets. |
| G. | Accounting Estimates — The preparation of financial statements in conformity with accounting principles generally accepted in the United States of America (“GAAP”) requires management to make estimates and assumptions that affect the reported amounts of assets and liabilities at the date of the financial statements and the reported amounts of revenues and expenses during the reporting period including estimates and assumptions related to taxation. Actual results could differ from those estimates by a significant amount. In addition, the Fund monitors for material events or transactions that may occur or become known after the period-end date and before the date the financial statements are released to print. |
| H. | Indemnifications — Under the Trust’s organizational documents, each Trustee, officer, employee or other agent of the Trust is indemnified against certain liabilities that may arise out of the performance of their duties to the Fund. Additionally, in the normal course of business, the Fund enters into contracts, including the Fund’s servicing agreements, that contain a variety of indemnification clauses. The Fund’s maximum exposure under these arrangements is unknown as this would involve future claims that may be made against the Fund that have not yet occurred. The risk of material loss as a result of such indemnification claims is considered remote. |
| I. | Securities Lending — The Fund may lend portfolio securities having a market value up to one-third of the Fund’s total assets. Such loans are secured by collateral equal to no less than the market value of the loaned securities determined daily by the securities lending provider. Such collateral will be cash or debt securities issued or guaranteed by the U.S. Government or any of its sponsored agencies. Cash collateral received in connection with these loans is invested in short-term money market instruments or affiliated money market funds and is shown as such on the Schedule of Investments. The Fund bears the risk of loss with respect to the investment of collateral. It is the Fund’s policy to obtain additional collateral from or return excess collateral to the borrower by the end of the next business day, following the valuation date of the securities loaned. Therefore, the value of the collateral held may be temporarily less than the value of the securities on loan. When loaning securities, the Fund retains certain benefits of owning the securities, including the economic equivalent of dividends or interest generated by the security. Lending securities entails a risk of loss to the Fund if, and to the extent that, the market value of the securities loaned were to increase and the borrower did not increase the collateral accordingly, and the borrower failed to return the securities. The securities loaned are subject to termination at the option of the borrower or the Fund. Upon termination, the borrower will return to the Fund the securities loaned and the Fund will return the collateral. Upon the failure of the borrower to return the securities, collateral may be liquidated and the securities may be purchased on the open market to replace the loaned securities. The Fund could experience delays and costs in gaining access to the collateral and the securities may lose value during the delay which could result in potential losses to the Fund. Some of these losses may be indemnified by the lending agent. The Fund bears the risk of any deficiency in the amount of the collateral available for return to the borrower due to any loss on the collateral invested. Dividends received on cash collateral investments for securities lending transactions, which are net of compensation to counterparties, are included in Dividends from affiliated money market funds on the Statement of Operations. The aggregate value of securities out on loan, if any, is shown as a footnote on the Statement of Assets and Liabilities. |
NOTE 2—Advisory Fees and Other Fees Paid to Affiliates
The Trust has entered into a master investment advisory agreement with Invesco Advisers, Inc. (the “Adviser” or “Invesco”). Under the terms of the investment advisory agreement, the Fund accrues daily and pays monthly an advisory fee to the Adviser based on the annual rate of the Fund’s average daily net assets as follows:
| | | | | | | | |
| Average Daily Net Assets | | Rate | |
First $250 million | | | 0 | .745% | | | | |
Next $250 million | | | 0 | .73% | | | | |
Next $500 million | | | 0 | .715% | | | | |
Next $1.5 billion | | | 0 | .70% | | | | |
Next $2.5 billion | | | 0 | .685% | | | | |
Next $2.5 billion | | | 0 | .67% | | | | |
Next $2.5 billion | | | 0 | .655% | | | | |
Over $10 billion | | | 0 | .64% | | | | |
For the year ended December 31, 2017, the effective advisory fees incurred by the Fund was 0.74%.
Under the terms of a master sub-advisory agreement between the Adviser and each of Invesco Asset Management Deutschland GmbH, Invesco Asset Management Limited, Invesco Asset Management (Japan) Limited, Invesco Hong Kong Limited, Invesco Senior Secured Management, Inc. and Invesco Canada Ltd. and separate sub-advisory agreements with Invesco PowerShares Capital Management LLC and Invesco Asset Management (India) Private Limited (collectively, the “Affiliated Sub-Advisers”) the Adviser, not the Fund, will pay 40% of the fees paid to the Adviser to any such Affiliated Sub-Adviser(s) that provide(s) discretionary investment management services to the Fund based on the percentage of assets allocated to such Affiliated Sub-Adviser(s).
The Adviser has contractually agreed, through at least June 30, 2018, to waive advisory fees and/or reimburse expenses to the extent necessary to limit total annual fund operating expenses after fee waiver and/or expense reimbursement (excluding certain items discussed below) of Series I shares to 2.00% and Series II shares to 2.25% of average daily net assets (the “expense limits”). In determining the Adviser’s obligation to waive advisory fees and/or reimburse expenses, the following expenses are not taken into account, and could cause the total annual fund operating expenses after fee waiver and/or expense reimbursement to exceed the numbers reflected above: (1) interest; (2) taxes; (3) dividend expense on short sales; (4) extraordinary or non-routine items, including litigation expenses; and (5) expenses that the Fund has incurred but did not actually pay because of an expense offset arrangement. Unless Invesco continues the fee waiver agreement, it will terminate on June 30, 2018. During its term, the fee waiver agreement cannot be terminated or amended to increase expense limits or reduce the advisory fee waiver without approval of the Board of Trustees. The Adviser did not waive fees and/or reimburse expenses during the period under these expense limits.
Invesco V.I. Small Cap Equity Fund
Further, the Adviser has contractually agreed, through at least June 30, 2019, to waive the advisory fee payable by the Fund in an amount equal to 100% of the net advisory fees the Adviser receives from the affiliated money market funds on investments by the Fund of uninvested cash (excluding investments of cash collateral from securities lending) in such affiliated money market funds.
For the year ended December 31, 2017, the Adviser waived advisory fees of $5,324.
The Trust has entered into a master administrative services agreement with Invesco pursuant to which the Fund has agreed to pay Invesco a fee for costs incurred in providing accounting services and fund administrative services to the Fund and to reimburse Invesco for fees paid to insurance companies that have agreed to provide certain administrative services to the Fund. These administrative services provided by the insurance companies may include, among other things: maintenance of master accounts with the Fund; tracking, recording and transmitting net purchase and redemption orders for Fund shares; maintaining and preserving records related to the purchase, redemption and other account activity of variable product owners; distributing copies of Fund documents such as prospectuses, proxy materials and periodic reports, to variable product owners, and responding to inquiries from variable product owners about the Fund. Pursuant to such agreement, for the year ended December 31, 2017, Invesco was paid $74,920 for accounting and fund administrative services and was reimbursed $449,892 for fees paid to insurance companies.
The Trust has entered into a transfer agency and service agreement with Invesco Investment Services, Inc. (“IIS”) pursuant to which the Fund has agreed to pay IIS a fee for providing transfer agency and shareholder services to the Fund and reimburse IIS for certain expenses incurred by IIS in the course of providing such services. For the year ended December 31, 2017, expenses incurred under the agreement are shown in the Statement of Operations as Transfer agent fees.
The Trust has entered into a master distribution agreement with Invesco Distributors, Inc. (“IDI”) to serve as the distributor for the Fund. The Trust has adopted a plan pursuant to Rule 12b-1 under the 1940 Act with respect to the Fund’s Series II shares (the “Plan”). The Fund, pursuant to the Plan, pays IDI compensation at the annual rate of 0.25% of the Fund’s average daily net assets of Series II shares. The fees are accrued daily and paid monthly. Of the Plan payments, up to 0.25% of the average daily net assets of the Series II shares may be paid to insurance companies who furnish continuing personal shareholder services to customers who purchase and own Series II shares of the Fund. For the year ended December 31, 2017, expenses incurred under the Plan are detailed in the Statement of Operations as Distribution fees.
For the year ended December 31, 2017, the Fund incurred $2,972 in brokerage commissions with Invesco Capital Markets, Inc., an affiliate of the Adviser and IDI, for portfolio transactions executed on behalf of the Fund.
Certain officers and trustees of the Trust are officers and directors of the Adviser, IIS and/or IDI.
NOTE 3—Additional Valuation Information
GAAP defines fair value as the price that would be received to sell an asset or paid to transfer a liability in an orderly transaction between market participants at the measurement date, under current market conditions. GAAP establishes a hierarchy that prioritizes the inputs to valuation methods, giving the highest priority to readily available unadjusted quoted prices in an active market for identical assets (Level 1) and the lowest priority to significant unobservable inputs (Level 3), generally when market prices are not readily available or are unreliable. Based on the valuation inputs, the securities or other investments are tiered into one of three levels. Changes in valuation methods may result in transfers in or out of an investment’s assigned level:
| | Level 1 — | Prices are determined using quoted prices in an active market for identical assets. |
| | Level 2 — | Prices are determined using other significant observable inputs. Observable inputs are inputs that other market participants may use in pricing a security. These may include quoted prices for similar securities, interest rates, prepayment speeds, credit risk, yield curves, loss severities, default rates, discount rates, volatilities and others. |
| | Level 3 — | Prices are determined using significant unobservable inputs. In situations where quoted prices or observable inputs are unavailable (for example, when there is little or no market activity for an investment at the end of the period), unobservable inputs may be used. Unobservable inputs reflect the Fund’s own assumptions about the factors market participants would use in determining fair value of the securities or instruments and would be based on the best available information. |
As of December 31, 2017, all of the securities in this Fund were valued based on Level 1 inputs (see the Schedule of Investments for security categories). The level assigned to the securities valuations may not be an indication of the risk or liquidity associated with investing in those securities. Because of the inherent uncertainties of valuation, the values reflected in the financial statements may materially differ from the value received upon actual sale of those investments.
The Fund’s policy is to recognize transfers in and out of the valuation levels as of the end of the reporting period. During the year ended December 31, 2017, there were no material transfers between valuation levels.
NOTE 4—Security Transactions with Affiliated Funds
The Fund is permitted to purchase or sell securities from or to certain other Invesco Funds under specified conditions outlined in procedures adopted by the Board of Trustees of the Trust. The procedures have been designed to ensure that any purchase or sale of securities by the Fund from or to another fund or portfolio that is or could be considered an affiliate by virtue of having a common investment adviser (or affiliated investment advisers), common Trustees and/or common officers complies with Rule 17a-7 of the 1940 Act. Further, as defined under the procedures, each transaction is effected at the current market price. Pursuant to these procedures, for the year ended December 31, 2017, the Fund engaged in securities sales of $6,563,385, which resulted in net realized gains of $1,043,508.
Invesco V.I. Small Cap Equity Fund
NOTE 5—Trustees’ and Officers’ Fees and Benefits
Trustees’ and Officers’ Fees and Benefits include amounts accrued by the Fund to pay remuneration to certain Trustees and Officers of the Fund. Trustees have the option to defer compensation payable by the Fund, and Trustees’ and Officers’ Fees and Benefits also include amounts accrued by the Fund to fund such deferred compensation amounts. Those Trustees who defer compensation have the option to select various Invesco Funds in which their deferral accounts shall be deemed to be invested. Finally, certain current Trustees were eligible to participate in a retirement plan that provided for benefits to be paid upon retirement to Trustees over a period of time based on the number of years of service. The Fund may have certain former Trustees who also participate in a retirement plan and receive benefits under such plan. Trustees’ and Officers’ Fees and Benefits include amounts accrued by the Fund to fund such retirement benefits. Obligations under the deferred compensation and retirement plans represent unsecured claims against the general assets of the Fund.
NOTE 6—Cash Balances
The Fund is permitted to temporarily carry a negative or overdrawn balance in its account with State Street Bank and Trust Company, the custodian bank. Such balances, if any at period-end, are shown in the Statement of Assets and Liabilities under the payable caption Amount due custodian. To compensate the custodian bank for such overdrafts, the overdrawn Fund may either (1) leave funds as a compensating balance in the account so the custodian bank can be compensated by earning the additional interest; or (2) compensate by paying the custodian bank at a rate agreed upon by the custodian bank and Invesco, not to exceed the contractually agreed upon rate.
NOTE 7—Distributions to Shareholders and Tax Components of Net Assets
Tax Character of Distributions to Shareholders Paid During the Fiscal Years Ended December 31, 2017 and 2016:
| | | | | | | | |
| | | 2017 | | | 2016 | |
Ordinary income | | $ | — | | | $ | 1,089,693 | |
Long-term capital gain | | | 13,632,416 | | | | 20,654,360 | |
Total distributions | | $ | 13,632,416 | | | $ | 21,744,053 | |
Tax Components of Net Assets at Period-End:
| | | | |
| | | 2017 | |
Undistributed ordinary income | | $ | 4,133,141 | |
Undistributed long-term gain | | | 14,349,764 | |
Net unrealized appreciation — investments | | | 77,428,946 | |
Temporary book/tax differences | | | (76,130 | ) |
Shares of beneficial interest | | | 210,918,576 | |
Total net assets | | $ | 306,754,297 | |
The difference between book-basis and tax-basis unrealized appreciation (depreciation) is due to differences in the timing of recognition of gains and losses on investments for tax and book purposes. The Fund’s net unrealized appreciation difference is attributable primarily to wash sales.
The temporary book/tax differences are a result of timing differences between book and tax recognition of income and/or expenses. The Fund’s temporary book/tax differences are the result of the trustee deferral of compensation and retirement plan benefits.
Capital loss carryforward is calculated and reported as of a specific date. Results of transactions and other activity after that date may affect the amount of capital loss carryforward actually available for the Fund to utilize. Capital losses generated in years beginning after December 22, 2010 can be carried forward for an unlimited period, whereas previous losses expire in eight tax years. Capital losses with an expiration period may not be used to offset capital gains until all net capital losses without an expiration date have been utilized. Capital loss carryforwards with no expiration date will retain their character as either short-term or long-term capital losses instead of as short-term capital losses as under prior law. The ability to utilize capital loss carryforwards in the future may be limited under the Internal Revenue Code and related regulations based on the results of future transactions.
The Fund does not have a capital loss carryforward as of December 31, 2017.
Invesco V.I. Small Cap Equity Fund
NOTE 8—Investment Transactions
The aggregate amount of investment securities (other than short-term securities, U.S. Treasury obligations and money market funds, if any) purchased and sold by the Fund during the year ended December 31, 2017 was $60,283,932 and $103,165,378, respectively. Cost of investments, including any derivatives, on a tax basis includes the adjustments for financial reporting purposes as of the most recently completed federal income tax reporting period-end.
| | | | |
| Unrealized Appreciation (Depreciation) of Investments on a Tax Basis | |
Aggregate unrealized appreciation of investments | | $ | 86,915,479 | |
Aggregate unrealized (depreciation) of investments | | | (9,486,533 | ) |
Net unrealized appreciation of investments | | $ | 77,428,946 | |
Cost of investments for tax purposes is $232,726,011. | | | | |
NOTE 9—Reclassification of Permanent Differences
Primarily as a result of differing book/tax treatment of net operating losses, on December 31, 2017, undistributed net investment income (loss) was increased by $454,110 and undistributed net realized gain was decreased by $454,110. This reclassification had no effect on the net assets of the Fund.
NOTE 10—Share Information
| | | | | | | | | | | | | | | | |
| | | Summary of Share Activity | |
| | | Years ended December 31, | |
| | | 2017(a) | | | 2016 | |
| | | Shares | | | Amount | | | Shares | | | Amount | |
Sold: | | | | | | | | | | | | | | | | |
Series I | | | 746,673 | | | $ | 14,287,755 | | | | 1,273,851 | | | $ | 21,861,494 | |
Series II | | | 553,660 | | | | 10,143,965 | | | | 1,640,615 | | | | 27,600,516 | |
| | | | |
Issued as reinvestment of dividends: | | | | | | | | | | | | | | | | |
Series I | | | 346,979 | | | | 6,502,386 | | | | 639,312 | | | | 11,226,305 | |
Series II | | | 399,666 | | | | 7,130,030 | | | | 626,056 | | | | 10,517,748 | |
| | | | |
Reacquired: | | | | | | | | | | | | | | | | |
Series I | | | (2,427,148 | ) | | | (46,495,844 | ) | | | (2,550,489 | ) | | | (45,045,208 | ) |
Series II | | | (1,162,843 | ) | | | (21,237,267 | ) | | | (1,379,733 | ) | | | (23,197,300 | ) |
Net increase (decrease) in share activity | | | (1,543,013 | ) | | $ | (29,668,975 | ) | | | 249,612 | | | $ | 2,963,555 | |
| (a) | There are entities that are record owners of more than 5% of the outstanding shares of the Fund and in the aggregate own 68% of the outstanding shares of the Fund. The Fund and the Fund’s principal underwriter or adviser, are parties to participation agreements with these entities whereby these entities sell units of interest in separate accounts funding variable products that are invested in the Fund. The Fund, Invesco and/or Invesco affiliates may make payments to these entities, which are considered to be related to the Fund, for providing services to the Fund, Invesco and/or Invesco affiliates including but not limited to services such as, securities brokerage, third party record keeping and account servicing and administrative services. The Fund has no knowledge as to whether all or any portion of the shares owned of record by these entities are also owned beneficially. |
Invesco V.I. Small Cap Equity Fund
NOTE 11—Financial Highlights
The following schedule presents financial highlights for a share of the Fund outstanding throughout the periods indicated.
| | | | | | | | | | | | | | | | | | | | | | | | | | | | | | | | | | | | | | | | | | | | | | | | | | | | | | | | |
| | | Net asset
value,
beginning
of period | | | Net
investment
income
(loss)(a) | | | Net gains
(losses)
on securities
(both
realized and
unrealized) | | | Total from
investment
operations | | | Dividends
from net
investment
income | | | Distributions
from net
realized
gains | | | Total
distributions | | | Net asset
value, end
of period | | | Total
return(b) | | | Net assets,
end of period
(000’s omitted) | | | Ratio of
expenses
to average net assets
with fee waivers
and/or expenses
absorbed | | | Ratio of
expenses
to average net
assets without
fee waivers
and/or expenses
absorbed | | | Ratio of net
investment
income
(loss)
to average
net assets | | | Portfolio
turnover(c) | |
Series I | | | | | | | | | | | | | | | | | | | | | | | | | | | | | | | | | | | | | | | | | | | | | | | | | | | | | | | | |
Year ended 12/31/17 | | $ | 18.38 | | | $ | (0.01 | ) | | $ | 2.53 | | | $ | 2.52 | | | $ | — | | | $ | (0.88 | ) | | $ | (0.88 | ) | | $ | 20.02 | | | | 14.06 | % | | $ | 149,405 | | | | 0.97 | %(d) | | | 0.97 | %(d) | | | (0.02 | )%(d) | | | 20 | % |
Year ended 12/31/16 | | | 17.64 | | | | 0.01 | | | | 2.06 | | | | 2.07 | | | | — | | | | (1.33 | ) | | | (1.33 | ) | | | 18.38 | | | | 12.06 | | | | 161,727 | | | | 1.01 | | | | 1.01 | | | | 0.04 | | | | 37 | |
Year ended 12/31/15 | | | 23.64 | | | | 0.00 | | | | (1.27 | ) | | | (1.27 | ) | | | — | | | | (4.73 | ) | | | (4.73 | ) | | | 17.64 | | | | (5.52 | ) | | | 166,407 | | | | 1.04 | | | | 1.04 | | | | 0.02 | | | | 31 | |
Year ended 12/31/14 | | | 25.44 | | | | (0.04 | ) | | | 0.47 | | | | 0.43 | | | | — | | | | (2.23 | ) | | | (2.23 | ) | | | 23.64 | | | | 2.36 | | | | 203,963 | | | | 1.05 | | | | 1.05 | | | | (0.17 | ) | | | 45 | |
Year ended 12/31/13 | | | 18.69 | | | | (0.04 | ) | | | 7.02 | | | | 6.98 | | | | (0.00 | ) | | | (0.23 | ) | | | (0.23 | ) | | | 25.44 | | | | 37.47 | | | | 262,261 | | | | 1.05 | | | | 1.05 | | | | (0.17 | ) | | | 35 | |
Series II | | | | | | | | | | | | | | | | | | | | | | | | | | | | | | | | | | | | | | | | | | | | | | | | | | | | | | | | |
Year ended 12/31/17 | | | 17.58 | | | | (0.05 | ) | | | 2.40 | | | | 2.35 | | | | — | | | | (0.88 | ) | | | (0.88 | ) | | | 19.05 | | | | 13.73 | | | | 157,349 | | | | 1.22 | (d) | | | 1.22 | (d) | | | (0.27 | )(d) | | | 20 | |
Year ended 12/31/16 | | | 16.96 | | | | (0.03 | ) | | | 1.98 | | | | 1.95 | | | | — | | | | (1.33 | ) | | | (1.33 | ) | | | 17.58 | | | | 11.84 | | | | 148,883 | | | | 1.26 | | | | 1.26 | | | | (0.21 | ) | | | 37 | |
Year ended 12/31/15 | | | 22.97 | | | | (0.05 | ) | | | (1.23 | ) | | | (1.28 | ) | | | — | | | | (4.73 | ) | | | (4.73 | ) | | | 16.96 | | | | (5.74 | ) | | | 128,614 | | | | 1.29 | | | | 1.29 | | | | (0.23 | ) | | | 31 | |
Year ended 12/31/14 | | | 24.85 | | | | (0.10 | ) | | | 0.45 | | | | 0.35 | | | | — | | | | (2.23 | ) | | | (2.23 | ) | | | 22.97 | | | | 2.08 | | | | 145,505 | | | | 1.30 | | | | 1.30 | | | | (0.42 | ) | | | 45 | |
Year ended 12/31/13 | | | 18.31 | | | | (0.09 | ) | | | 6.86 | | | | 6.77 | | | | — | | | | (0.23 | ) | | | (0.23 | ) | | | 24.85 | | | | 37.08 | | | | 134,526 | | | | 1.30 | | | | 1.30 | | | | (0.42 | ) | | | 35 | |
| (a) | Calculated using average shares outstanding. |
| (b) | Includes adjustments in accordance with accounting principles generally accepted in the United States of America and as such, the net asset value for financial reporting purposes and the returns based upon those net asset values may differ from the net asset value and returns for shareholder transactions. Total returns are not annualized for periods less than one year, if applicable, and do not reflect charges assessed in connection with a variable product, which if included would reduce total returns. |
| (c) | Portfolio turnover is calculated at the fund level and is not annualized for periods less than one year, if applicable. |
| (d) | Ratios are based on average daily net assets (000’s omitted) of $153,601 and $150,399 for Series I and Series II shares, respectively. |
Invesco V.I. Small Cap Equity Fund
Report of Independent Registered Public Accounting Firm
To the Board of Trustees of AIM Variable Insurance Funds (Invesco Variable Insurance Funds) and Shareholders of Invesco V.I. Small Cap Equity Fund
Opinion on the Financial Statements
We have audited the accompanying statement of assets and liabilities, including the schedule of investments, of Invesco V.I. Small Cap Equity Fund (one of the funds constituting AIM Variable Insurance Funds (Invesco Variable Insurance Funds), hereafter referred to as the “Fund”) as of December 31, 2017, the related statement of operations for the year ended December 31, 2017, the statement of changes in net assets for each of the two years in the period ended December 31, 2017, including the related notes, and the financial highlights for each of the five years in the period ended December 31, 2017 (collectively referred to as the “financial statements”). In our opinion, the financial statements present fairly, in all material respects, the financial position of the Fund as of December 31, 2017, the results of its operations for the year then ended, the changes in its net assets for each of the two years in the period ended December 31, 2017 and the financial highlights for each of the five years in the period ended December 31, 2017 in conformity with accounting principles generally accepted in the United States of America.
Basis for Opinion
These financial statements are the responsibility of the Fund’s management. Our responsibility is to express an opinion on the Fund’s financial statements based on our audits. We are a public accounting firm registered with the Public Company Accounting Oversight Board (United States) (“PCAOB”) and are required to be independent with respect to the Fund in accordance with the U.S. federal securities laws and the applicable rules and regulations of the Securities and Exchange Commission and the PCAOB.
We conducted our audits of these financial statements in accordance with the standards of the PCAOB. Those standards require that we plan and perform the audit to obtain reasonable assurance about whether the financial statements are free of material misstatement, whether due to error or fraud.
Our audits included performing procedures to assess the risks of material misstatement of the financial statements, whether due to error or fraud, and performing procedures that respond to those risks. Such procedures included examining, on a test basis, evidence regarding the amounts and disclosures in the financial statements. Our audits also included evaluating the accounting principles used and significant estimates made by management, as well as evaluating the overall presentation of the financial statements. Our procedures included confirmation of securities owned as of December 31, 2017 by correspondence with the custodian, transfer agent and brokers; when replies were not received from brokers, we performed other auditing procedures. We believe that our audits provide a reasonable basis for our opinion.
PricewaterhouseCoopers LLP
Houston, TX
February 14, 2018
We have served as the auditor of one or more of the investment companies in the Invesco/PowerShares group of investment companies since at least 1995. We have not determined the specific year we began serving as auditor.
Invesco V.I. Small Cap Equity Fund
Calculating your ongoing Fund expenses
Example
As a shareholder of the Fund, you incur ongoing costs, including management fees; distribution and/or service fees (12b-1); and other Fund expenses. This example is intended to help you understand your ongoing costs (in dollars) of investing in the Fund and to compare these costs with ongoing costs of investing in other mutual funds. The example is based on an investment of $1,000 invested at the beginning of the period and held for the entire period July 1, 2017 through December 31, 2017.
The actual and hypothetical expenses in the examples below do not represent the effect of any fees or other expenses assessed in connection with a variable product; if they did, the expenses shown would be higher while the ending account values shown would be lower.
Actual expenses
The table below provides information about actual account values and actual expenses. You may use the information in this table, together with the amount you invested, to estimate the expenses that you paid over the period. Simply divide your account value by $1,000 (for example, an $8,600 account value divided by $1,000 = 8.6), then multiply the result by the number in the table under the heading entitled “Actual Expenses Paid During Period” to estimate the expenses you paid on your account during this period.
Hypothetical example for comparison purposes
The table below also provides information about hypothetical account values and hypothetical expenses based on the Fund’s actual expense ratio and an assumed rate of return of 5% per year before expenses, which is not the Fund’s actual return.
The hypothetical account values and expenses may not be used to estimate the actual ending account balance or expenses you paid for the period. You may use this information to compare the ongoing costs of investing in the Fund and other funds. To do so, compare this 5% hypothetical example with the 5% hypothetical examples that appear in the shareholder reports of the other funds.
Please note that the expenses shown in the table are meant to highlight your ongoing costs. Therefore, the hypothetical information is useful in comparing ongoing costs, and will not help you determine the relative total costs of owning different funds.
| | | | | | | | | | | | | | | | | | | | | | | | |
| Class | | Beginning
Account Value
(07/01/17) | | | ACTUAL | | | HYPOTHETICAL (5% annual return before expenses) | | | Annualized
Expense Ratio | |
| | | Ending
Account Value
(12/31/17)1 | | | Expenses
Paid During
Period2 | | | Ending
Account Value
(12/31/17) | | | Expenses
Paid During
Period2 | | |
| Series I | | $ | 1,000.00 | | | $ | 1,085.60 | | | $ | 5.05 | | | $ | 1,020.37 | | | $ | 4.89 | | | | 0.96 | % |
| Series II | | | 1,000.00 | | | | 1,084.20 | | | | 6.36 | | | | 1,019.11 | | | | 6.16 | | | | 1.21 | |
| 1 | The actual ending account value is based on the actual total return of the Fund for the period July 1, 2017 through December 31, 2017, after actual expenses and will differ from the hypothetical ending account value which is based on the Fund’s expense ratio and a hypothetical annual return of 5% before expenses. |
| 2 | Expenses are equal to the Fund’s annualized expense ratio as indicated above multiplied by the average account value over the period, multiplied by 184/365 to reflect the most recent fiscal half year. |
Invesco V.I. Small Cap Equity Fund
Tax Information
Form 1099-DIV, Form 1042-S and other year-end tax information provide shareholders with actual calendar year amounts that should be included in their tax returns. Shareholders should consult their tax advisors.
The following distribution information is being provided as required by the Internal Revenue Code or to meet a specific state’s requirement.
The Fund designates the following amounts or, if subsequently determined to be different, the maximum amount allowable for its fiscal year ended December 31, 2017:
| | | | |
Federal and State Income Tax | |
Long-Term Capital Gain Distributions | | $ | 13,632,416 | |
Corporate Dividends Received Deduction* | | | 0 | % |
U.S. Treasury Obligations* | | | 0 | % |
| | * | The above percentages are based on ordinary income dividends paid to shareholders during the Fund’s fiscal year. |
Invesco V.I. Small Cap Equity Fund
Trustees and Officers
The address of each trustee and officer is AIM Variable Insurance Funds (Invesco Variable Insurance Funds) (the “Trust”), 11 Greenway Plaza, Suite 1000, Houston, Texas 77046-1173. The trustees serve for the life of the Trust, subject to their earlier death, incapacitation, resignation, retirement or removal as more specifically provided in the Trust’s organizational documents. Each officer serves for a one year term or until their successors are elected and qualified. Column two below includes length of time served with predecessor entities, if any.
| | | | | | | | |
Name, Year of Birth and
Position(s) Held with the Trust | | Trustee and/
or Officer Since | | Principal Occupation(s)
During Past 5 Years | | Number of
Funds in Fund
Complex
Overseen by
Trustee | | Other Directorship(s)
Held by Trustee During
Past 5 Years |
| Interested Persons | | | | | | | | |
Martin L. Flanagan1 — 1960 Trustee | | 2007 | | Executive Director, Chief Executive Officer and President, Invesco Ltd. (ultimate parent of Invesco and a global investment management firm); Trustee, The Invesco Funds; Vice Chair, Investment Company Institute; and Member of Executive Board, SMU Cox School of Business Formerly: Advisor to the Board, Invesco Advisers, Inc. (formerly known as Invesco Institutional (N.A.), Inc.); Chairman and Chief Executive Officer, Invesco Advisers, Inc. (registered investment adviser); Director, Chairman, Chief Executive Officer and President, Invesco Holding Company (US), Inc. (formerly IVZ Inc.) (holding company), Invesco Group Services, Inc. (service provider) and Invesco North American Holdings, Inc. (holding company); Director, Chief Executive Officer and President, Invesco Holding Company Limited (parent of Invesco and a global investment management firm); Director, Invesco Ltd.; Chairman, Investment Company Institute and President, Co-Chief Executive Officer, Co-President, Chief Operating Officer and Chief Financial Officer, Franklin Resources, Inc. (global investment management organization) | | 158 | | None |
Philip A. Taylor2 — 1954 Trustee and Senior Vice President | | 2006 | | Head of the Americas and Senior Managing Director, Invesco Ltd.; Director, Invesco Advisers, Inc. (formerly known as Invesco Institutional (N.A.), Inc.) (registered investment adviser); Director, Chairman, Chief Executive Officer and President, Invesco Management Group, Inc. (formerly known as Invesco Aim Management Group, Inc.) (financial services holding company); Director and Chairman, Invesco Investment Services, Inc. (formerly known as Invesco Aim Investment Services, Inc.) (registered transfer agent); Chief Executive Officer, Invesco Corporate Class Inc. (corporate mutual fund company); Director, Chairman and Chief Executive Officer, Invesco Canada Ltd. (formerly known as Invesco Trimark Ltd./Invesco Trimark Ltèe) (registered investment adviser and registered transfer agent); Trustee and Senior Vice President, The Invesco Funds; Director, Invesco Investment Advisers LLC (formerly known as Van Kampen Asset Management). Formerly: Co-Chairman, Co-President and Co-Chief Executive Officer, Invesco Advisers, Inc. (formerly known as Invesco Institutional (N.A.), Inc.) (registered investment adviser); Director, Chief Executive Officer and President, Van Kampen Exchange Corp; President and Principal Executive Officer, The Invesco Funds (other than AIM Treasurer’s Series Trust (Invesco Treasurer’s Series Trust), Short-Term Investments Trust and Invesco Management Trust); Executive Vice President, The Invesco Funds (AIM Treasurer’s Series Trust (Invesco Treasurer’s Series Trust), Short-Term Investments Trust and Invesco Management Trust only); Director and President, INVESCO Funds Group, Inc. (registered investment adviser and registered transfer agent); Director and Chairman, IVZ Distributors, Inc. (formerly known as INVESCO Distributors, Inc.) (registered broker dealer); Director, President and Chairman, Invesco Inc. (holding company), Invesco Canada Holdings Inc. (holding company), Trimark Investments Ltd./Placements Trimark Ltèe and Invesco Financial Services Ltd/Services Financiers Invesco Ltèe; Chief Executive Officer, Invesco Canada Fund Inc. (corporate mutual fund company); Director and Chairman, Van Kampen Investor Services Inc.; Director, Chief Executive Officer and President, 1371 Preferred Inc. (holding company) and Van Kampen Investments Inc.; Director and President, AIM GP Canada Inc. (general partner for limited partnerships) and Van Kampen Advisors, Inc.; Director and Chief Executive Officer, Invesco Trimark Dealer Inc. (registered broker dealer); Director, Invesco Distributors, Inc. (formerly known as Invesco Aim Distributors, Inc.) (registered broker dealer); Manager, Invesco PowerShares Capital Management LLC; Director, Chief Executive Officer and President, Invesco Advisers, Inc.; Director, Chairman, Chief Executive Officer and President, Invesco Aim Capital Management, Inc.; President, Invesco Trimark Dealer Inc. and Invesco Trimark Ltd./Invesco Trimark Ltèe; Director and President, AIM Trimark Corporate Class Inc. and AIM Trimark Canada Fund Inc.; Senior Managing Director, Invesco Holding Company Limited; Director and Chairman, Fund Management Company (former registered broker dealer); President and Principal Executive Officer, The Invesco Funds (AIM Treasurer’s Series Trust (Invesco Treasurer’s Series Trust), and Short-Term Investments Trust only); President, AIM Trimark Global Fund Inc. and AIM Trimark Canada Fund Inc. | | 158 | | None |
| 1 | Mr. Flanagan is considered an interested person (within the meaning of Section 2(a)(19) of the 1940 Act) of the Trust because he is an officer of the Adviser to the Trust, and an officer and a director of Invesco Ltd., ultimate parent of the Adviser. |
| 2 | Mr. Taylor is considered an interested person (within the meaning of Section 2(a)(19) of the 1940 Act) of the Trust because he is an officer and a director of the Adviser. |
Invesco V.I. Small Cap Equity Fund
Trustees and Officers—(continued)
| | | | | | | | |
Name, Year of Birth and
Position(s) Held with the Trust | | Trustee and/
or Officer Since | | Principal Occupation(s)
During Past 5 Years | | Number of
Funds in Fund
Complex
Overseen by
Trustee | | Other Directorship(s)
Held by Trustee During
Past 5 Years |
| Independent Trustees | | | | | | | | |
Bruce L. Crockett — 1944 Trustee and Chair | | 1993 | | Chairman, Crockett Technologies Associates (technology consulting company) Formerly: Director, Captaris (unified messaging provider); Director, President and Chief Executive Officer, COMSAT Corporation; Chairman, Board of Governors of INTELSAT (international communications company); ACE Limited (insurance company); Independent Directors Council and Investment Company Institute: Member of the Audit Committee, Investment Company Institute; Member of the Executive Committee and Chair of the Governance Committee, Independent Directors Council | | 158 | | Director and Chairman of the Audit Committee, ALPS (Attorneys Liability Protection Society) (insurance company); Director and Member of the Audit Committee and Compensation Committee, Ferroglobe PLC (metallurgical company) |
David C. Arch — 1945 Trustee | | 2010 | | Chairman of Blistex Inc. (consumer health care products manufacturer); Member, World Presidents’ Organization | | 158 | | Board member of the Illinois Manufacturers’ Association |
Jack M. Fields — 1952 Trustee | | 1997 | | Chief Executive Officer, Twenty First Century Group, Inc. (government affairs company); and Chairman, Discovery Learning Alliance (non-profit) Formerly: Owner and Chief Executive Officer, Dos Angeles Ranch L.P. (cattle, hunting, corporate entertainment); Director, Insperity, Inc. (formerly known as Administaff) (human resources provider); Chief Executive Officer, Texana Timber LP (sustainable forestry company); Director of Cross Timbers Quail Research Ranch (non-profit); and member of the U.S. House of Representatives | | 158 | | None |
Cynthia Hostetler — 1962 Trustee | | 2017 | | Non-Executive Director and Trustee of a number of public and private business corporations Formerly: Head of Investment Funds and Private Equity, Overseas Private Investment Corporation; President, First Manhattan Bancorporation, Inc.; Attorney, Simpson Thacher & Bartlett LLP | | 158 | | Vulcan Materials Company (construction materials company); Trilinc Global Impact Fund; Aberdeen Investment Funds (4 portfolios); Artio Global Investment LLC (mutual fund complex); Edgen Group, Inc. (specialized energy and infrastructure products distributor) |
Eli Jones — 1961 Trustee | | 2016 | | Professor and Dean, Mays Business School — Texas A&M University Formerly: Professor and Dean, Walton College of Business, University of Arkansas and E.J. Ourso College of Business, Louisiana State University; Director, Arvest Bank | | 158 | | Insperity, Inc. (formerly known as Administaff) (human resources provider) |
Prema Mathai-Davis — 1950 Trustee | | 1998 | | Retired. | | 158 | | None |
Teresa M. Ressel — 1962 Trustee | | 2017 | | Non-executive director and trustee of a number of public and private business corporations Formerly: Chief Financial Officer, Olayan America, The Olayan Group (international investor/commercial/industrial); Chief Executive Officer, UBS Securities LLC; Group Chief Operating Officer, Americas, UBS AG; Assistant Secretary for Management & Budget and CFO, US Department of the Treasury | | 158 | | Atlantic Power Corporation (power generation company); ON Semiconductor Corp. (semiconductor supplier) |
Ann Barnett Stern — 1957 Trustee | | 2017 | | President and Chief Executive Officer, Houston Endowment Inc. (private philanthropic institution) Formerly: Executive Vice President and General Counsel, Texas Children’s Hospital; Attorney, Beck, Redden and Secrest, LLP; Business Law Instructor, University of St. Thomas; Attorney, Andrews & Kurth LLP | | 158 | | Federal Reserve Bank of Dallas |
Raymond Stickel, Jr. — 1944 Trustee | | 2005 | | Retired. Formerly: Director, Mainstay VP Series Funds, Inc. (25 portfolios); Partner, Deloitte & Touche | | 158 | | None |
Robert C. Troccoli — 1949 Trustee | | 2016 | | Adjunct Professor, University of Denver — Daniels College of Business Formerly: Senior Partner, KPMG LLP | | 158 | | None |
Christopher L. Wilson — 1957 Trustee | | 2017 | | Non-executive director and trustee of a number of public and private business corporations Formerly: Managing Partner, CT2, LLC (investing and consulting firm); President/Chief Executive Officer, Columbia Funds, Bank of America Corporation; President/Chief Executive Officer, CDC IXIS Asset Management Services, Inc.; Principal & Director of Operations, Scudder Funds, Scudder, Stevens & Clark, Inc.; Assistant Vice President, Fidelity Investments | | 158 | | TD Asset Management USA Inc. (mutual fund complex) (22 portfolios); ISO New England, Inc. (non-profit organization managing regional electricity market) |
Invesco V.I. Small Cap Equity Fund
Trustees and Officers—(continued)
| | | | | | | | |
Name, Year of Birth and
Position(s) Held with the Trust | | Trustee and/
or Officer Since | | Principal Occupation(s)
During Past 5 Years | | Number of
Funds in Fund
Complex
Overseen by
Trustee | | Other Directorship(s)
Held by Trustee During
Past 5 Years |
| Other Officers | | | | | | | | |
Sheri Morris — 1964 President, Principal Executive Officer and Treasurer | | 1999 | | President, Principal Executive Officer and Treasurer, The Invesco Funds; Vice President, Invesco Advisers, Inc. (formerly known as Invesco Institutional (N.A.), Inc.) (registered investment adviser); and Vice President, PowerShares Exchange-Traded Fund Trust, PowerShares Exchange-Traded Fund Trust II, PowerShares India Exchange-Traded Fund Trust, PowerShares Actively Managed Exchange-Traded Fund Trust, PowerShares Actively Managed Exchange-Traded Commodity Fund Trust and PowerShares Exchange-Traded Self-Indexed Fund Trust Formerly: Vice President and Principal Financial Officer, The Invesco Funds; Vice President, Invesco Aim Advisers, Inc., Invesco Aim Capital Management, Inc. and Invesco Aim Private Asset Management, Inc.; Assistant Vice President and Assistant Treasurer, The Invesco Funds and Assistant Vice President, Invesco Advisers, Inc., Invesco Aim Capital Management, Inc. and Invesco Aim Private Asset Management, Inc.; and Treasurer, PowerShares Exchange-Traded Fund Trust, PowerShares Exchange-Traded Fund Trust II, PowerShares India Exchange-Traded Fund Trust and PowerShares Actively Managed Exchange-Traded Fund Trust | | N/A | | N/A |
Russell C. Burk — 1958 Senior Vice President and Senior Officer | | 2005 | | Senior Vice President and Senior Officer, The Invesco Funds | | N/A | | N/A |
John M. Zerr — 1962 Senior Vice President, Chief Legal Officer and Secretary | | 2006 | | Director, Senior Vice President, Secretary and General Counsel, Invesco Management Group, Inc. (formerly known as Invesco AIM Management Group, Inc.); Senior Vice President, Invesco Advisers, Inc. (formerly known as Invesco Institutional (N.A.), Inc.) (registered investment adviser); Senior Vice President and Secretary, Invesco Distributors, Inc. (formerly known as Invesco AIM Distributors, Inc.); Director, Vice President and Secretary, Invesco Investment Services, Inc. (formerly known as Invesco AIM Investment Services, Inc.) Senior Vice President, Chief Legal Officer and Secretary, The Invesco Funds; Managing Director, Invesco PowerShares Capital Management LLC; Director, Secretary and General Counsel, Invesco Investment Advisers LLC (formerly known as Van Kampen Asset Management); Secretary and General Counsel, Invesco Capital Markets, Inc. (formerly known as Van Kampen Funds Inc.) and Chief Legal Officer, PowerShares Exchange-Traded Fund Trust, PowerShares Exchange-Traded Fund Trust II, PowerShares India Exchange-Traded Fund Trust, PowerShares Actively Managed Exchange-Traded Fund Trust, PowerShares Actively Managed Exchange-Traded Commodity Fund Trust and PowerShares Exchange-Traded Self-Indexed Fund Trust; Manager and Secretary, Invesco Indexing LLC Formerly: Director, Secretary, General Counsel and Senior Vice President, Van Kampen Exchange Corp.; Director, Vice President and Secretary, IVZ Distributors, Inc. (formerly known as INVESCO Distributors, Inc.); Director and Vice President, INVESCO Funds Group, Inc.; Director and Vice President, Van Kampen Advisors Inc.; Director, Vice President, Secretary and General Counsel, Van Kampen Investor Services Inc.; Director, Invesco Distributors, Inc. (formerly known as Invesco AIM Distributors, Inc.); Director, Senior Vice President, General Counsel and Secretary, Invesco AIM Advisers, Inc. and Van Kampen Investments Inc.; Director, Vice President and Secretary, Fund Management Company; Director, Senior Vice President, Secretary, General Counsel and Vice President, Invesco AIM Capital Management, Inc.; Chief Operating Officer and General Counsel, Liberty Ridge Capital, Inc. (an investment adviser); Vice President and Secretary, PBHG Funds (an investment company) and PBHG Insurance Series Fund (an investment company); Chief Operating Officer, General Counsel and Secretary, Old Mutual Investment Partners (a broker-dealer); General Counsel and Secretary, Old Mutual Fund Services (an administrator) and Old Mutual Shareholder Services (a shareholder servicing center); Executive Vice President, General Counsel and Secretary, Old Mutual Capital, Inc. (an investment adviser); and Vice President and Secretary, Old Mutual Advisors Funds (an investment company) | | N/A | | N/A |
Gregory G. McGreevey — 1962 Senior Vice President | | 2012 | | Senior Managing Director, Invesco Ltd.; Director, Chairman, President, and Chief Executive Officer, Invesco Advisers, Inc. (formerly known as Invesco Institutional (N.A.), Inc.) (registered investment adviser); Senior Vice President, Invesco Management Group, Inc.; Director, Invesco Mortgage Capital, Inc. and Invesco Senior Secured Management, Inc.; and Senior Vice President, The Invesco Funds Formerly: Assistant Vice President, The Invesco Funds | | N/A | | N/A |
Kelli Gallegos — 1970 Vice President, Principal Financial Officer and Assistant Treasurer | | 2008 | | Vice President, Principal Financial Officer and Assistant Treasurer, The Invesco Funds; Assistant Treasurer, Invesco PowerShares Capital Management LLC, PowerShares Exchange-Traded Fund Trust, PowerShares Exchange-Traded Fund Trust II, PowerShares India Exchange-Traded Fund Trust, PowerShares Actively Managed Exchange-Traded Fund Trust, PowerShares Actively Managed Exchange-Traded Commodity Fund Trust and PowerShares Exchange-Traded Self-Indexed Fund Trust Formerly: Assistant Vice President, The Invesco Funds | | N/A | | N/A |
Invesco V.I. Small Cap Equity Fund
Trustees and Officers—(continued)
| | | | | | | | |
Name, Year of Birth and
Position(s) Held with the Trust | | Trustee and/
or Officer Since | | Principal Occupation(s)
During Past 5 Years | | Number of
Funds in Fund
Complex
Overseen by
Trustee | | Other Directorship(s)
Held by Trustee During
Past 5 Years |
| Other Officers—(continued) | | | | | | | | |
Tracy Sullivan — 1962 Vice President, Chief Tax Officer and Assistant Treasurer | | 2008 | | Vice President, Chief Tax Officer and Assistant Treasurer, The Invesco Funds; Assistant Treasurer, Invesco PowerShares Capital Management LLC, PowerShares Exchange-Traded Fund Trust, PowerShares Exchange-Traded Fund Trust II, PowerShares India Exchange-Traded Fund Trust, PowerShares Actively Managed Exchange-Traded Fund Trust, PowerShares Actively Managed Exchange-Traded Commodity Fund Trust and PowerShares Exchange-Traded Self-Indexed Fund Trust Formerly: Assistant Vice President, The Invesco Funds | | N/A | | N/A |
Crissie M. Wisdom — 1969 Anti-Money Laundering Compliance Officer | | 2013 | | Anti-Money Laundering Compliance Officer, Invesco Advisers, Inc. (formerly known as Invesco Institutional (N.A.), Inc.) (registered investment adviser), Invesco Capital Markets, Inc. (formerly known as Van Kampen Funds Inc.), Invesco Distributors, Inc., Invesco Investment Services, Inc., Invesco Management Group, Inc., The Invesco Funds, and PowerShares Exchange-Traded Fund Trust, PowerShares Exchange-Traded Fund Trust II, PowerShares India Exchange-Traded Fund Trust, PowerShares Actively Managed Exchange-Traded Fund Trust, PowerShares Actively Managed Exchange-Traded Commodity Fund Trust and PowerShares Exchange-Traded Self-Indexed Fund Trust; Anti-Money Laundering Compliance Officer and Bank Secrecy Act Officer, INVESCO National Trust Company and Invesco Trust Company; and Fraud Prevention Manager and Controls and Risk Analysis Manager for Invesco Investment Services, Inc. Formerly: Anti-Money Laundering Compliance Officer, Van Kampen Exchange Corp. | | N/A | | N/A |
Robert R. Leveille — 1969 Chief Compliance Officer | | 2016 | | Chief Compliance Officer, Invesco Advisers, Inc. (registered investment adviser); and Chief Compliance Officer, The Invesco Funds Formerly: Chief Compliance Officer, Putnam Investments and the Putnam Funds | | N/A | | N/A |
The Statement of Additional Information of the Trust includes additional information about the Fund’s Trustees and is available upon request, without charge, by calling 1.800.959.4246. Please refer to the Fund’s Statement of Additional Information for information on the Fund’s sub-advisers.
| | | | | | |
Office of the Fund 11 Greenway Plaza, Suite 1000 Houston, TX 77046-1173 | | Investment Adviser Invesco Advisers, Inc. 1555 Peachtree Street, N.E. Atlanta, GA 30309 | | Distributor Invesco Distributors, Inc. 11 Greenway Plaza, Suite 1000 Houston, TX 77046-1173 | | Auditors PricewaterhouseCoopers LLP 1000 Louisiana Street, Suite 5800 Houston, TX 77002-5678 |
| | | |
| | | | | | |
Counsel to the Fund Stradley Ronon Stevens & Young, LLP 2005 Market Street, Suite 2600 Philadelphia, PA 19103-7018 | | Counsel to the Independent Trustees Goodwin Procter LLP 901 New York Avenue, N.W. Washington, D.C. 20001 | | Transfer Agent Invesco Investment Services, Inc. 11 Greenway Plaza, Suite 1000 Houston, TX 77046-1173 | | Custodian State Street Bank and Trust Company 225 Franklin Street Boston, MA 02110-2801 |
Invesco V.I. Small Cap Equity Fund
| | | | |
| | |
 | | Annual Report to Shareholders | | December 31, 2017 |
| | |
| | Invesco V.I. Technology Fund |

| | |
| | The Fund provides a complete list of its holdings four times in each fiscal year, at the quarter-ends. For the second and fourth quarters, the lists appear in the Fund’s semiannual and annual reports to shareholders. For the first and third quarters, the Fund files the lists with the Securities and Exchange Commission (SEC) on Form N-Q. The Fund’s Form N-Q filings are available on the SEC website, sec.gov. Copies of the Fund’s Forms N-Q may be reviewed and copied at the SEC Public Reference Room in Washington, D.C. You can obtain information on the operation of the Public Reference Room, including information about duplicating fee charges, by calling 202 551 8090 or 800 732 0330, or by electronic request at the following email address: publicinfo@sec.gov. The SEC file numbers for the Fund are 811-07452 and 033-57340. The Fund’s most recent portfolio holdings, as filed on Form N-Q, have also been made available to insurance companies issuing variable annuity contracts and variable life insurance policies (“variable products”) that invest in the Fund. A description of the policies and procedures that the Fund uses to determine how to vote proxies relating to portfolio securities is available without charge, upon request, from our Client Services department at 800 959 4246 or at invesco.com/proxyguidelines. The information is also available on the SEC website, sec.gov. Information regarding how the Fund voted proxies related to its portfolio securities during the most recent 12-month period ended June 30 is available at invesco.com/ proxysearch. The information is also available on the SEC website, sec.gov. Invesco Advisers, Inc. is an investment adviser; it provides investment advisory services to individual and institutional clients and does not sell securities. Invesco Distributors, Inc. is the US distributor for Invesco Ltd.’s retail mutual funds, exchange-traded funds and institutional money market funds. Both are wholly owned, indirect subsidiaries of Invesco Ltd. This report must be accompanied or preceded by a currently effective Fund prospectus and variable product prospectus, which contain more complete information, including sales charges and expenses. Investors should read each carefully before investing. NOT FDIC INSURED | MAY LOSE VALUE | NO BANK GUARANTEE |
| |
| | Invesco Distributors, Inc. I-VITEC-AR-1 02072018 1548 |
Management’s Discussion of Fund Performance
Performance summary
For the year ended December 31, 2017, Series I shares of Invesco V.I. Technology Fund (the Fund) outperformed the NASDAQ Composite Index, the Fund’s broad market/style-specific benchmark.
Your Fund’s long-term performance appears later in this report.
Fund vs. Indexes
Total returns, 12/31/16 to 12/31/17, excluding variable product issuer charges.
If variable product issuer charges were included, returns would be lower.
| | | | | |
| Series I Shares | | | | 35.13 | % |
| Series II Shares | | | | 34.74 | |
| NASDAQ Composite Index▼ (Broad Market/ Style-Specific Index) | | | | 29.64 | |
| Lipper VUF Science & Technology Funds Classification Average∎ (Peer Group) | | | | 33.40 | |
Source(s): ▼FactSet Research Systems Inc.; ∎Lipper Inc. | | | | | |
Market conditions and your Fund
Despite highly destructive hurricanes that threatened to derail a years-long economic recovery, the US economy continued to expand throughout the year ended December 31, 2017. Gross domestic product – the value of all goods and services produced in the US – expanded in the first three quarters of 2017. Inflation remained subdued even as unemployment continued its multiyear decline.
Given signs of an improving economy, the US Federal Reserve (the Fed) raised interest rates three times during the reporting period, most recently in December 2017; each rate hike was 25 basis points.1 (A basis point is 0.01%.) The Fed pledged that “realized and expected economic conditions relative to its objectives of maximum employment and 2 percent inflation” will guide its future actions. At the close of the reporting period, Fed policy remained accommodative, and the fed funds target rate stood at a range of 1.25% to 1.50% – 75 basis points higher than at the start of the reporting period.1
Higher inventories and a worsening outlook caused oil prices and many energy stocks to decline during the first half of 2017. However, oil prices rose significantly in the second half of the reporting
period as expectations for lower supplies increased, partly due to continued OPEC production cuts, and demand began normalizing.
Major US stock market indexes repeatedly hit all-time highs throughout the reporting period. The stock market rally that began after the 2016 presidential election continued throughout the reporting period, fueled by generally positive economic data, strong corporate earnings and improved consumer confidence. Finally, after much debate in Congress, a tax reform bill was signed into law in December 2017. While its enactment further strengthened stocks, its effect on the US economy remained uncertain.
In this market environment, the Fund outperformed its broad market/style-specific benchmark, the NASDAQ Composite Index over the reporting period. Relative outperformance was driven by security selection in and overweight exposure to the software industry. Additional contributors to relative performance came from stock selection in the internet software and services and household durables industries. In contrast, stock selection in the biotechnology, wireless telecommunication services, pharmaceuticals and media industries detracted from both absolute and relative Fund performance. Slight
underweight exposure to the biotechnology industry and overweight exposure to the wireless telecommunication services and pharmaceuticals industries detracted from relative performance, as well.
From an individual securities perspective, the leading contributor to Fund performance relative to the broad market/style-specific benchmark was Amazon.com. After a short pause in the second half of 2016, the company’s stock price rose throughout 2017 on better-than-expected quarterly results as Amazon continued to take market share in the retail space. The acquisition of Whole Foods (not a Fund holding) also aided the company’s performance during the year. Alibaba Group Holdings, an e-commerce and entertainment software developer based in China, was a notable contributor to Fund performance. During the year, the company benefited from better-than-expected growth driven by its video and social networking platforms. Video game developers had a strong year due to new catalysts, such as mobile processing power and downloadable content. Take-Two Interactive Software, an entertainment software developer, was a significant contributor to Fund performance. The company was boosted by solid quarterly results, as well as sales from its Grand Theft Auto franchise. Consumer demand for new downloadable content within games has been better than expected and boosted the company’s stock price. In addition, anticipation for new game releases in 2018 – Red Dead 2, Borderlands, NBA 2K, and potentially an NBA eSports league – aided Take-Two’s performance.
Conversely, Sprint was the leading detractor from Fund performance relative to the broad market/style-specific benchmark during the year. The company’s stock price declined late in the year due to uncertainty around a potential merger with T-Mobile (not a Fund holding). We sold our position in Sprint before the
| | |
| Portfolio Composition |
By sector | % of total net assets |
| | |
| |
| Information Technology | | 66.6% |
| Consumer Discretionary | | 16.3 |
| Health Care | | 12.6 |
| Industrials | | 2.8 |
| Consumer Staples | | 1.0 |
Money Market Funds Plus Other Assets Less Liabilities | | 0.7 |
| | |
| Top 10 Equity Holdings* |
% of total net assets |
| |
| 1. Amazon.com, Inc. | | 8.0% |
2. Apple Inc. | | 7.2 |
3. Alphabet Inc.-Class A | | 5.3 |
�� 4. Facebook, Inc.-Class A | | 4.9 |
5. Microsoft Corp. | | 4.5 |
6. Alibaba Group Holding Ltd.-ADR | | 4.4 |
7. Nintendo Co., Ltd. | | 3.7 |
8. Sony Corp. | | 3.6 |
9. Take-Two Interactive Software, Inc. | | 3.2 |
10. UnitedHealth Group Inc. | | 3.0 |
| | |
| Total Net Assets | | $122.8 million |
| |
| Total Number of Holdings* | | 44 |
The Fund’s holdings are subject to change, and there is no assurance that the Fund will continue to hold any particular security.
*Excluding money market fund holdings.
Data presented here are as of December 31, 2017.
Invesco V.I. Technology Fund
close of the reporting period. Satellite television provider Dish Network also detracted from Fund performance. The company was negatively affected by views that its unused spectrum may be less valuable than expected. Speculation that Dish Network may be a potential merger partner helped the stock earlier in the year; however, the lack of any merger or acquisition news from the company during the third quarter also weighed on the stock. We sold our position in Dish Network before the close of the reporting period. Pharmaceutical giant Allergan was a notable detractor from Fund performance, as well. Shares of the company were negatively affected in the second half of the year as a result of an unfavorable federal court decision on patent protections for Restasis, one of its top-selling drugs. We sold our position in Allergan before the close of the reporting period.
At the end of the reporting period, the Fund’s largest overweight allocations relative to the NASDAQ Composite Index were in the software, internet software and services, household durables and information technology services industries. By contrast, the Fund’s largest underweight allocations were in the commercial banks and biotechnology industries, as well as the hotels, restaurants and leisure industry.
During the year, the Fund emphasized growth technology, including biopharmaceuticals, and de-emphasized mature technology. The Fund favors innovation, transformative technology and opportunities which we expect to take market share from mature companies, including the game-changing technologies of mobile, security, cloud and biopharmaceuticals. We remain optimistic about technology spending given strong corporate balance sheets and companies’ need to invest in more robust security solutions and for future growth. In our opinion, the increased pace of health care innovation will continue to drive attractive long-term growth rates due to successful mapping of the human genome and recent productivity improvements, both of which have fostered faster and more effective targeting of promising therapeutics. We attempt to harness multiyear secular trends, which may benefit long-term investors regardless of near-term economic strength.
We thank you for your commitment to Invesco V.I. Technology Fund.
| 1 | Source: US Federal Reserve |
The views and opinions expressed in management’s discussion of Fund performance are those of Invesco Advisers, Inc. These views and opinions are subject to change at any time based on factors such as market and economic conditions. These views and opinions may not be relied upon as investment advice or recommendations, or as an offer for a particular security. The information is not a complete analysis of every aspect of any market, country, industry, security or the Fund. Statements of fact are from sources considered reliable, but Invesco Advisers, Inc. makes no representation or warranty as to their completeness or accuracy. Although historical performance is no guarantee of future results, these insights may help you understand our investment management philosophy.
See important Fund and, if applicable, index disclosures later in this report.
| | |
 | | Erik Voss Chartered Financial Analyst, Portfolio Manager, is lead manager of Invesco V.I. Technology Fund. He |
| joined Invesco in 2010. Mr. Voss earned a BS in mathematics and an MS in finance from the University of Wisconsin. |
| | |
 | | Janet Luby Chartered Financial Analyst, Portfolio Manager, is manager of Invesco V.I. Technology Fund. She joined |
| Invesco in 2011. Ms. Luby earned a BBA in finance from Texas A&M University. She is also a Certified Public Accountant. |
Invesco V.I. Technology Fund
Your Fund’s Long-Term Performance
Results of a $10,000 Investment – Oldest Share Class(es)
Fund and index data from 12/31/07
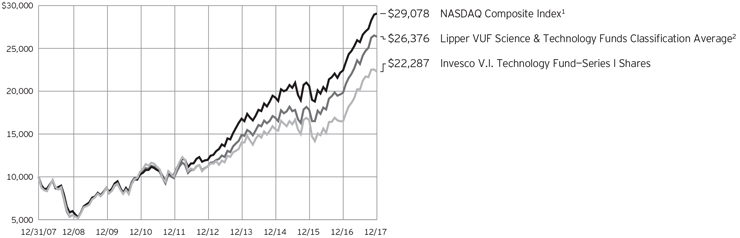
| 1 | Source: FactSet Research Systems Inc. |
Past performance cannot guarantee
comparable future results.
| | | | | |
| Average Annual Total Returns |
As of 12/31/17 | | | | | |
| |
| Series I Shares | | | | | |
| Inception (5/20/97) | | | | 6.11 | % |
| 10 Years | | | | 8.34 | |
| 5 Years | | | | 14.76 | |
| 1 Year | | | | 35.13 | |
| |
| Series II Shares | | | | | |
| Inception (4/30/04) | | | | 8.17 | % |
| 10 Years | | | | 8.06 | |
| 5 Years | | | | 14.47 | |
| 1 Year | | | | 34.74 | |
The performance of the Fund’s Series I and Series II share classes will differ primarily due to different class expenses.
The performance data quoted represent past performance and cannot guarantee comparable future results; current performance may be lower or higher. Please contact your variable product issuer or financial adviser for the most recent month-end variable product performance. Performance figures reflect Fund expenses, reinvested distributions and changes in net asset value. Investment return and principal value will fluctuate so that you may have a gain or loss when you sell shares.
The total annual Fund operating expense ratio set forth in the most recent Fund prospectus as of the date of this report for Series I and Series II shares was 1.05% and 1.30%, respectively. The expense ratios presented above may vary from the expense ratios presented in other sections of this report that are based on expenses incurred during the period covered by this report.
Invesco V.I. Technology Fund, a series portfolio of AIM Variable Insurance Funds (Invesco Variable Insurance Funds), is currently offered through insurance companies issuing variable products. You cannot purchase shares of the Fund directly. Performance figures given represent the Fund and are not intended to reflect actual variable product values. They do not reflect sales charges, expenses and fees assessed in connection with a variable product. Sales charges, expenses and fees, which are determined by the variable product issuers, will vary and will lower the total return.
The most recent month-end performance at the Fund level, excluding variable product charges, is available at 800 451 4246. As mentioned above, for the most recent month-end performance
including variable product charges, please contact your variable product issuer or financial adviser.
Fund performance reflects any applicable fee waivers and/or expense reimbursements. Had the adviser not waived fees and/or reimbursed expenses currently or in the past, returns would have been lower. See current prospectus for more information.
Invesco V.I. Technology Fund
Invesco V.I. Technology Fund’s investment objective is long-term growth of capital.
| ∎ | | Unless otherwise stated, information presented in this report is as of December 31, 2017, and is based on total net assets. |
| ∎ | | Unless otherwise noted, all data provided by Invesco. |
Principal risks of investing in the Fund
Depositary receipts risk. Investing in depositary receipts involves the same risks as direct investments in foreign securities. In addition, the underlying issuers of certain depositary receipts are under no obligation to distribute shareholder communications or pass through any voting rights with respect to the deposited securities to the holders of such receipts. The Fund may therefore receive less timely information or have less control than if it invested directly in the foreign issuer.
Derivatives risk. The value of a derivative instrument depends largely on (and is derived from) the value of an underlying security, currency, commodity, interest rate, index or other asset (each referred to as an underlying asset). In addition to risks relating to the underlying assets, the use of derivatives may include other, possibly greater, risks, including counterparty, leverage and liquidity risks. Counterparty risk is the risk that the counterparty to the derivative contract will default on its obligation to pay the Fund the amount owed or otherwise perform under the derivative contract. Derivatives create leverage risk because they do not require payment up front equal to the economic exposure created by owning the derivative. As a result, an adverse change in the value of the underlying asset could result in the Fund sustaining a loss that is substantially greater than the amount invested in the derivative, which may make the Fund’s returns more volatile and increase the risk of loss. Derivative instruments may also be less liquid than more traditional investments and the Fund may be unable to sell or close out its derivative positions at a desirable time or price. This risk may be more acute under adverse market conditions, during which the Fund may be most in need of liquidating its derivative positions. Derivatives may also be harder to value, less tax efficient and subject to changing government regulation that could impact the Fund’s ability to use certain derivatives or their cost. Also, derivatives used for hedging or to gain or limit exposure to a particular market segment may not provide the expected benefits, particularly during adverse market conditions.
Emerging markets securities risk. Emerging markets (also referred to as developing markets) are generally subject
to greater market volatility, political, social and economic instability, uncertain trading markets and more governmental limitations on foreign investment than more developed markets. In addition, companies operating in emerging markets may be subject to lower trading volume and greater price fluctuations than companies in more developed markets. Securities law and the enforcement of systems of taxation in many emerging market countries may change quickly and unpredictably. In addition, investments in emerging markets securities may also be subject to additional transaction costs, delays in settlement procedures, and lack of timely information.
Foreign securities risk. The Fund’s foreign investments may be adversely affected by political and social instability, changes in economic or taxation policies, difficulty in enforcing obligations, decreased liquidity or increased volatility. Foreign investments also involve the risk of the possible seizure, nationalization or expropriation of the issuer or foreign deposits (in which the Fund could lose its entire investments in a certain market) and the possible adoption of foreign governmental restrictions such as exchange controls. Unless the Fund has hedged its foreign securities risk, foreign securities risk also involves the risk of negative foreign currency rate fluctuations, which may cause the value of securities denominated in such foreign currency (or other instruments through which the Fund has exposure to foreign currencies) to decline in value. Currency exchange rates may fluctuate significantly over short periods of time. Currency hedging strategies, if used, are not always successful.
Growth investing risk. Growth stocks tend to be more expensive relative to the issuing company’s earnings or assets compared with other types of stock. As a result, they tend to be more sensitive to changes in, or investors’ expectations of, the issuing company’s earnings and can be more volatile.
Management risk. The Fund is actively managed and depends heavily on the Adviser’s judgment about markets, interest rates or the attractiveness, relative values, liquidity, or potential appreciation of particular investments made for the Fund’s portfolio. The Fund could experience losses if these judgments prove to be incorrect. Additionally, legislative, regulatory, or tax developments may
adversely affect management of the Fund and, therefore, the ability of the Fund to achieve its investment objective.
Market risk. The market values of the Fund’s investments, and therefore the value of the Fund’s shares, will go up and down, sometimes rapidly or unpredictably. Market risk may affect a single issuer, industry or section of the economy, or it may affect the market as a whole. Individual stock prices tend to go up and down more dramatically than those of certain other types of investments, such as bonds. During a general downturn in the financial markets, multiple asset classes may decline in value. When markets perform well, there can be no assurance that specific investments held by the Fund will rise in value.
Mid-capitalization companies risk. Mid-capitalization companies tend to be more vulnerable to changing market conditions and may have more limited product lines and markets, less experienced management and fewer financial resources than larger companies. These companies’ securities may be more volatile and less liquid than those of more established companies, and their returns may vary, sometimes significantly, from the overall securities market.
Technology sector risk. The Fund will concentrate its investments in the securities of issuers engaged primarily in technology-related industries. Technology companies are subject to intense competition, rapid obsolescence of their products, issues with obtaining financing or regulatory approvals, product incompatibility, changing consumer preferences, high required corporate capital expenditure for research and development or infrastructure and development of new products, each of which make the prices of securities issued by these companies more volatile.
Invesco V.I. Technology Fund
About indexes used in this report
The NASDAQ Composite Index is a broad-based, market index of the common stocks and similar securities listed on the Nasdaq stock market.
The Lipper VUF Science & Technology Funds Classification Average represents an average of all variable insurance underlying funds in the Lipper Science & Technology Funds classification.
The Fund is not managed to track the performance of any particular index, including the index(es) described here, and consequently, the performance of the Fund may deviate significantly from the performance of the index(es).
A direct investment cannot be made in an index. Unless otherwise indicated, index results include reinvested dividends, and they do not reflect sales charges. Performance of the peer group, if applicable, reflects fund expenses; performance of a market index does not.
Other information
CPA® and Certified Public Accountant® are trademarks owned by the American Institute of Certified Public Accountants.
The returns shown in management’s discussion of Fund performance are based on net asset values calculated for shareholder transactions. Generally accepted accounting principles require adjustments to be made to the net assets of the Fund at period end for financial reporting purposes, and as such, the net asset values for shareholder transactions and the returns based on those net asset values may differ from the net asset values and returns reported in the Financial Highlights. Additionally, the returns and net asset values shown throughout this report are at the Fund level only and do not include variable product issuer charges. If such charges were included, the total returns would be lower.
Industry classifications used in this report are generally according to the Global Industry Classification Standard, which was developed by and is the exclusive property and a service mark of MSCI Inc. and Standard & Poor’s.
Invesco V.I. Technology Fund
Schedule of Investments(a)
December 31, 2017
| | | | | | | | |
| | | Shares | | | Value | |
Common Stocks & Other Equity Interests–99.30% | |
| Aerospace & Defense–2.20% | |
Raytheon Co. | | | 14,384 | | | $ | 2,702,034 | |
|
| Application Software–1.96% | |
salesforce.com, inc.(b) | | | 23,487 | | | | 2,401,076 | |
|
| Biotechnology–5.36% | |
Alexion Pharmaceuticals, Inc.(b) | | | 10,130 | | | | 1,211,447 | |
Amgen Inc. | | | 7,644 | | | | 1,329,292 | |
BioMarin Pharmaceutical Inc.(b) | | | 16,091 | | | | 1,434,834 | |
Celgene Corp.(b) | | | 24,947 | | | | 2,603,469 | |
| | | | | | | | 6,579,042 | |
|
| Cable & Satellite–2.88% | |
Charter Communications, Inc.–Class A(b) | | | 5,444 | | | | 1,828,966 | |
Comcast Corp.–Class A | | | 42,487 | | | | 1,701,605 | |
| | | | | | | | 3,530,571 | |
|
| Communications Equipment–3.53% | |
Cisco Systems, Inc. | | | 81,244 | | | | 3,111,645 | |
Palo Alto Networks, Inc.(b) | | | 8,407 | | | | 1,218,511 | |
| | | | | | | | 4,330,156 | |
|
| Consumer Electronics–3.59% | |
Sony Corp. (Japan) | | | 98,200 | | | | 4,411,243 | |
|
| Data Processing & Outsourced Services–6.05% | |
First Data Corp.–Class A(b) | | | 76,644 | | | | 1,280,721 | |
Mastercard Inc.–Class A | | | 19,804 | | | | 2,997,533 | |
Visa Inc.–Class A | | | 27,634 | | | | 3,150,829 | |
| | | | | | | | 7,429,083 | |
|
| Electronic Equipment & Instruments–0.70% | |
Keysight Technologies, Inc.(b) | | | 20,695 | | | | 860,912 | |
|
| Health Care Equipment–2.29% | |
Intuitive Surgical, Inc.(b) | | | 4,427 | | | | 1,615,589 | |
Stryker Corp. | | | 7,764 | | | | 1,202,178 | |
| | | | | | | | 2,817,767 | |
|
| Home Entertainment Software–14.65% | |
Activision Blizzard, Inc. | | | 39,739 | | | | 2,516,273 | |
Electronic Arts Inc.(b) | | | 29,327 | | | | 3,081,095 | |
Nintendo Co., Ltd. (Japan) | | | 12,500 | | | | 4,550,852 | |
Sea Ltd.–ADR (Singapore)(b)(c) | | | 98,302 | | | | 1,310,366 | |
Take-Two Interactive Software, Inc.(b) | | | 35,725 | | | | 3,921,890 | |
UbiSoft Entertainment S.A. (France)(b) | | | 33,902 | | | | 2,608,934 | |
| | | | | | | | 17,989,410 | |
|
| Internet & Direct Marketing Retail–9.87% | |
Amazon.com, Inc.(b) | | | 8,427 | | | | 9,855,124 | |
Netflix Inc.(b) | | | 4,680 | | | | 898,373 | |
Priceline Group Inc. (The)(b) | | | 784 | | | | 1,362,388 | |
| | | | | | | | 12,115,885 | |
| | | | | | | | |
| | | Shares | | | Value | |
| Internet Software & Services–16.56% | |
Alibaba Group Holding Ltd.–ADR (China)(b) | | | 31,133 | | | $ | 5,368,263 | |
Alphabet Inc.–Class A(b) | | | 6,113 | | | | 6,439,434 | |
Alphabet Inc.–Class C(b) | | | 1,808 | | | | 1,891,891 | |
Baidu, Inc.–ADR (China)(b) | | | 2,574 | | | | 602,857 | |
Facebook, Inc.–Class A(b) | | | 34,177 | | | | 6,030,874 | |
| | | | | | | | 20,333,319 | |
|
| Life Sciences Tools & Services–1.99% | |
IQVIA Holdings Inc.(b) | | | 11,937 | | | | 1,168,632 | |
Thermo Fisher Scientific, Inc. | | | 6,687 | | | | 1,269,728 | |
| | | | | | | | 2,438,360 | |
|
| Managed Health Care–2.98% | |
UnitedHealth Group Inc. | | | 16,588 | | | | 3,656,990 | |
|
| Research & Consulting Services–0.54% | |
Equifax Inc. | | | 5,641 | | | | 665,187 | |
|
| Semiconductor Equipment–4.00% | |
Applied Materials, Inc. | | | 48,062 | | | | 2,456,929 | |
ASML Holding N.V.–New York Shares (Netherlands) | | | 14,151 | | | | 2,459,727 | |
| | | | | | | | 4,916,656 | |
|
| Semiconductors–6.39% | |
Broadcom Ltd. | | | 13,996 | | | | 3,595,572 | |
Integrated Device Technology, Inc.(b) | | | 95,079 | | | | 2,826,699 | |
NVIDIA Corp. | | | 7,377 | | | | 1,427,450 | |
| | | | | | | | 7,849,721 | |
|
| Systems Software–5.54% | |
Microsoft Corp. | | | 65,214 | | | | 5,578,405 | |
ServiceNow, Inc.(b) | | | 9,387 | | | | 1,223,971 | |
| | | | | | | | 6,802,376 | |
|
| Technology Hardware, Storage & Peripherals–7.20% | |
Apple Inc. | | | 52,239 | | | | 8,840,406 | |
|
| Tobacco–1.02% | |
Philip Morris International Inc. | | | 11,891 | | | | 1,256,284 | |
Total Common Stocks & Other Equity Interests
(Cost $67,021,869) | | | | 121,926,478 | |
|
Money Market Funds–0.78% | |
Invesco Government & Agency Portfolio–Institutional Class, 1.18%(d) | | | 337,797 | | | | 337,797 | |
Invesco Liquid Assets Portfolio–Institutional Class, 1.40%(d) | | | 241,259 | | | | 241,283 | |
Invesco Treasury Portfolio–Institutional Class, 1.17%(d) | | | 386,053 | | | | 386,053 | |
Total Money Market Funds
(Cost $965,133) | | | | 965,133 | |
TOTAL INVESTMENTS IN SECURITIES (excluding investments purchased with cash collateral from securities on loan)–100.08%
(Cost $67,987,002) | | | | 122,891,611 | |
See accompanying Notes to Financial Statements which are an integral part of the financial statements.
Invesco V.I. Technology Fund
| | | | | | | | |
| | | Shares | | | Value | |
Investments Purchased with Cash Collateral from Securities on Loan | | | | | |
Money Market Funds–0.84% | |
Invesco Government & Agency Portfolio–Institutional Class, 1.18%
(Cost $1,032,164)(d)(e) | | | 1,032,164 | | | $ | 1,032,164 | |
TOTAL INVESTMENTS IN SECURITIES–100.92% (Cost $69,019,166) | | | | 123,923,775 | |
OTHER ASSETS LESS LIABILITIES–(0.92)% | | | | (1,132,966 | ) |
NET ASSETS–100.00% | | | | | | $ | 122,790,809 | |
Investment Abbreviations:
| | |
| ADR | | – American Depositary Receipt |
Notes to Schedule of Investments:
| (a) | Industry and/or sector classifications used in this report are generally according to the Global Industry Classification Standard, which was developed by and is the exclusive property and a service mark of MSCI Inc. and Standard & Poor’s. |
| (b) | Non-income producing security. |
| (c) | All or a portion of this security was out on loan at December 31, 2017. |
| (d) | The money market fund and the Fund are affiliated by having the same investment adviser. The rate shown is the 7-day SEC standardized yield as of December 31, 2017. |
| (e) | The security has been segregated to satisfy the commitment to return the cash collateral received in securities lending transactions upon the borrower’s return of the securities loaned. See Note 1I. |
See accompanying Notes to Financial Statements which are an integral part of the financial statements.
Invesco V.I. Technology Fund
Statement of Assets and Liabilities
December 31, 2017
Statement of Operations
For the year ended December 31, 2017
| | | | |
Assets: | | | | |
Investments in securities, at value (Cost $67,021,869)* | | $ | 121,926,478 | |
Investments in affiliated money market funds, at value and cost | | | 1,997,297 | |
Foreign currencies, at value (Cost $361) | | | 362 | |
Receivable for: | | | | |
Fund shares sold | | | 38,285 | |
Dividends | | | 11,240 | |
Investment for trustee deferred compensation and retirement plans | | | 68,947 | |
Total assets | | | 124,042,609 | |
| |
Liabilities: | | | | |
Payable for: | | | | |
Collateral upon return of securities loaned | | | 1,032,164 | |
Fund shares reacquired | | | 48,012 | |
Accrued fees to affiliates | | | 55,076 | |
Accrued trustees’ and officers’ fees and benefits | | | 780 | |
Accrued other operating expenses | | | 40,340 | |
Trustee deferred compensation and retirement plans | | | 75,428 | |
Total liabilities | | | 1,251,800 | |
Net assets applicable to shares outstanding | | $ | 122,790,809 | |
| |
Net assets consist of: | | | | |
Shares of beneficial interest | | $ | 62,361,548 | |
Undistributed net investment income (loss) | | | (63,172 | ) |
Undistributed net realized gain | | | 5,587,824 | |
Net unrealized appreciation | | | 54,904,609 | |
| | | $ | 122,790,809 | |
Net Assets: | | | | |
Series I | | $ | 113,351,930 | |
Series II | | $ | 9,438,879 | |
|
Shares outstanding, no par value,
with an unlimited number of shares authorized: | |
Series I | | | 4,934,781 | |
Series II | | | 431,140 | |
Series I: | | | | |
Net asset value per share | | $ | 22.97 | |
Series II: | | | | |
Net asset value per share | | $ | 21.89 | |
| * | At December 31, 2017, securities with an aggregate value of $982,768 were on loan to brokers. |
| | | | |
Investment income: | | | | |
Dividends (net of foreign withholding taxes of $8,847) | | $ | 735,779 | |
Dividends from affiliated money market funds (includes securities lending income of $14) | | | 8,664 | |
Total investment income | | | 744,443 | |
| |
Expenses: | | | | |
Advisory fees | | | 862,140 | |
Administrative services fees | | | 220,760 | |
Custodian fees | | | 14,921 | |
Distribution fees — Series II | | | 20,993 | |
Transfer agent fees | | | 29,128 | |
Trustees’ and officers’ fees and benefits | | | 22,467 | |
Reports to shareholders | | | 20,118 | |
Professional services fees | | | 48,883 | |
Other | | | 2,578 | |
Total expenses | | | 1,241,988 | |
Less: Fees waived | | | (1,311 | ) |
Net expenses | | | 1,240,677 | |
Net investment income (loss) | | | (496,234 | ) |
| |
Realized and unrealized gain (loss) from: | | | | |
Net realized gain from: | | | | |
Investment securities (includes net gains from securities sold to affiliates of $76,004) | | | 6,456,716 | |
Foreign currencies | | | 1,613 | |
| | | | 6,458,329 | |
Change in net unrealized appreciation (depreciation) of: | | | | |
Investment securities | | | 26,955,827 | |
Foreign currencies | | | (51 | ) |
| | | | 26,955,776 | |
Net realized and unrealized gain | | | 33,414,105 | |
Net increase in net assets resulting from operations | | $ | 32,917,871 | |
See accompanying Notes to Financial Statements which are an integral part of the financial statements.
Invesco V.I. Technology Fund
Statement of Changes in Net Assets
For the years ended December 31, 2017 and 2016
| | | | | | | | |
| | | 2017 | | | 2016 | |
Operations: | | | | | | | | |
Net investment income (loss) | | $ | (496,234 | ) | | $ | (347,526 | ) |
Net realized gain | | | 6,458,329 | | | | 5,928,606 | |
Change in net unrealized appreciation (depreciation) | | | 26,955,776 | | | | (7,410,264 | ) |
Net increase (decrease) in net assets resulting from operations | | | 32,917,871 | | | | (1,829,184 | ) |
| | |
Distributions to shareholders from net realized gains: | | | | | | | | |
Series l | | | (5,644,440 | ) | | | (4,059,433 | ) |
Series ll | | | (458,282 | ) | | | (343,483 | ) |
Total distributions from net realized gains | | | (6,102,722 | ) | | | (4,402,916 | ) |
| | |
Share transactions–net: | | | | | | | | |
Series l | | | 814,302 | | | | (13,847,236 | ) |
Series ll | | | 729,904 | | | | (789,246 | ) |
Net increase (decrease) in net assets resulting from share transactions | | | 1,544,206 | | | | (14,636,482 | ) |
Net increase (decrease) in net assets | | | 28,359,355 | | | | (20,868,582 | ) |
| | |
Net assets: | | | | | | | | |
Beginning of year | | | 94,431,454 | | | | 115,300,036 | |
End of year (includes undistributed net investment income (loss) of $(63,172) and $(67,249), respectively) | | $ | 122,790,809 | | | $ | 94,431,454 | |
Notes to Financial Statements
December 31, 2017
NOTE 1—Significant Accounting Policies
Invesco V.I. Technology Fund (the “Fund”) is a series portfolio of AIM Variable Insurance Funds (Invesco Variable Insurance Funds) (the “Trust”). The Trust is a Delaware statutory trust registered under the Investment Company Act of 1940, as amended (the “1940 Act”), as an open-end series management investment company consisting of twenty-four separate portfolios, (each constituting a “Fund”). The assets, liabilities and operations of each portfolio are accounted for separately. Information presented in these financial statements pertains only to the Fund. Matters affecting each Fund or class will be voted on exclusively by the shareholders of such Fund or class. Current Securities and Exchange Commission (“SEC”) guidance, however, requires participating insurance companies offering separate accounts to vote shares proportionally in accordance with the instructions of the contract owners whose investments are funded by shares of each Fund or class.
The Fund’s investment objective is long-term growth of capital.
The Fund currently offers two classes of shares, Series I and Series II, both of which are offered to insurance company separate accounts funding variable annuity contracts and variable life insurance policies (“variable products”).
The Fund is an investment company and accordingly follows the investment company accounting and reporting guidance in accordance with Financial Accounting Standards Board Accounting Standards Codification Topic 946, Financial Services — Investment Companies.
The following is a summary of the significant accounting policies followed by the Fund in the preparation of its financial statements.
| A. | Security Valuations — Securities, including restricted securities, are valued according to the following policy. |
A security listed or traded on an exchange (except convertible securities) is valued at its last sales price or official closing price as of the close of the customary trading session on the exchange where the security is principally traded, or lacking any sales or official closing price on a particular day, the security may be valued at the closing bid price on that day. Securities traded in the over-the-counter market are valued based on prices furnished by independent pricing services or market makers. When such securities are valued by an independent pricing service they may be considered fair valued. Futures contracts are valued at the final settlement price set by an exchange on which they are principally traded. Listed options are valued at the mean between the last bid and asked prices from the exchange on which they are principally traded. Options not listed on an exchange are valued by an independent source at the mean between the last bid and asked prices. For purposes of determining net asset value (“NAV”) per share, futures and option contracts generally are valued 15 minutes after the close of the customary trading session of the New York Stock Exchange (“NYSE”).
Investments in open-end and closed-end registered investment companies that do not trade on an exchange are valued at the end-of-day net asset value per share. Investments in open-end and closed-end registered investment companies that trade on an exchange are valued at the last sales price or official closing price as of the close of the customary trading session on the exchange where the security is principally traded.
Debt obligations (including convertible securities) and unlisted equities are fair valued using an evaluated quote provided by an independent pricing service. Evaluated quotes provided by the pricing service may be determined without exclusive reliance on quoted prices, and may reflect appropriate factors such as institution-size trading in similar groups of securities, developments related to specific securities, dividend rate (for unlisted equities), yield (for debt obligations), quality, type of issue, coupon rate (for debt obligations), maturity (for debt obligations), individual trading characteristics and other market data. Pricing services generally value debt obligations assuming orderly transactions of institutional
Invesco V.I. Technology Fund
round lot size, but a fund may hold or transact in the same securities in smaller, odd lot sizes. Odd lots often trade at lower prices than institutional round lots. Debt obligations are subject to interest rate and credit risks. In addition, all debt obligations involve some risk of default with respect to interest and/or principal payments.
Foreign securities’ (including foreign exchange contracts) prices are converted into U.S. dollar amounts using the applicable exchange rates as of the close of the NYSE. If market quotations are available and reliable for foreign exchange-traded equity securities, the securities will be valued at the market quotations. Because trading hours for certain foreign securities end before the close of the NYSE, closing market quotations may become unreliable. If between the time trading ends on a particular security and the close of the customary trading session on the NYSE, events occur that the investment adviser determines are significant and make the closing price unreliable, the Fund may fair value the security. If the event is likely to have affected the closing price of the security, the security will be valued at fair value in good faith using procedures approved by the Board of Trustees. Adjustments to closing prices to reflect fair value may also be based on a screening process of an independent pricing service to indicate the degree of certainty, based on historical data, that the closing price in the principal market where a foreign security trades is not the current value as of the close of the NYSE. Foreign securities’ prices meeting the approved degree of certainty that the price is not reflective of current value will be priced at the indication of fair value from the independent pricing service. Multiple factors may be considered by the independent pricing service in determining adjustments to reflect fair value and may include information relating to sector indices, American Depositary Receipts and domestic and foreign index futures. Foreign securities may have additional risks including exchange rate changes, potential for sharply devalued currencies and high inflation, political and economic upheaval, the relative lack of issuer information, relatively low market liquidity and the potential lack of strict financial and accounting controls and standards.
Securities for which market prices are not provided by any of the above methods may be valued based upon quotes furnished by independent sources. The last bid price may be used to value equity securities. The mean between the last bid and asked prices is used to value debt obligations, including corporate loans.
Securities for which market quotations are not readily available or became unreliable are valued at fair value as determined in good faith by or under the supervision of the Trust’s officers following procedures approved by the Board of Trustees. Issuer specific events, market trends, bid/asked quotes of brokers and information providers and other market data may be reviewed in the course of making a good faith determination of a security’s fair value.
The Fund may invest in securities that are subject to interest rate risk, meaning the risk that the prices will generally fall as interest rates rise and, conversely, the prices will generally rise as interest rates fall. Specific securities differ in their sensitivity to changes in interest rates depending on their individual characteristics. Changes in interest rates may result in increased market volatility, which may affect the value and/or liquidity of certain Fund investments.
Valuations change in response to many factors including the historical and prospective earnings of the issuer, the value of the issuer’s assets, general economic conditions, interest rates, investor perceptions and market liquidity. Because of the inherent uncertainties of valuation, the values reflected in the financial statements may materially differ from the value received upon actual sale of those investments.
| B. | Securities Transactions and Investment Income — Securities transactions are accounted for on a trade date basis. Realized gains or losses on sales are computed on the basis of specific identification of the securities sold. Interest income (net of withholding tax, if any) is recorded on the accrual basis from settlement date. Dividend income (net of withholding tax, if any) is recorded on the ex-dividend date. |
The Fund may periodically participate in litigation related to Fund investments. As such, the Fund may receive proceeds from litigation settlements. Any proceeds received are included in the Statement of Operations as realized gain (loss) for investments no longer held and as unrealized gain (loss) for investments still held.
Brokerage commissions and mark ups are considered transaction costs and are recorded as an increase to the cost basis of securities purchased and/or a reduction of proceeds on a sale of securities. Such transaction costs are included in the determination of net realized and unrealized gain (loss) from investment securities reported in the Statement of Operations and the Statement of Changes in Net Assets and the net realized and unrealized gains (losses) on securities per share in the Financial Highlights. Transaction costs are included in the calculation of the Fund’s net asset value and, accordingly, they reduce the Fund’s total returns. These transaction costs are not considered operating expenses and are not reflected in net investment income reported in the Statement of Operations and the Statement of Changes in Net Assets, or the net investment income per share and the ratios of expenses and net investment income reported in the Financial Highlights, nor are they limited by any expense limitation arrangements between the Fund and the investment adviser.
The Fund allocates income and realized and unrealized capital gains and losses to a class based on the relative net assets of each class.
| C. | Country Determination — For the purposes of making investment selection decisions and presentation in the Schedule of Investments, the investment adviser may determine the country in which an issuer is located and/or credit risk exposure based on various factors. These factors include the laws of the country under which the issuer is organized, where the issuer maintains a principal office, the country in which the issuer derives 50% or more of its total revenues and the country that has the primary market for the issuer’s securities, as well as other criteria. Among the other criteria that may be evaluated for making this determination are the country in which the issuer maintains 50% or more of its assets, the type of security, financial guarantees and enhancements, the nature of the collateral and the sponsor organization. Country of issuer and/or credit risk exposure has been determined to be the United States of America, unless otherwise noted. |
| D. | Distributions — Distributions from net investment income and net realized capital gain, if any, are generally declared and paid to separate accounts of participating insurance companies annually and recorded on the ex-dividend date. |
| E. | Federal Income Taxes — The Fund intends to comply with the requirements of Subchapter M of the Internal Revenue Code of 1986, as amended (the “Internal Revenue Code”), necessary to qualify as a regulated investment company and to distribute substantially all of the Fund’s taxable earnings to shareholders. As such, the Fund will not be subject to federal income taxes on otherwise taxable income (including net realized capital gain) that is distributed to shareholders. Therefore, no provision for federal income taxes is recorded in the financial statements. |
The Fund recognizes the tax benefits of uncertain tax positions only when the position is more likely than not to be sustained. Management has analyzed the Fund’s uncertain tax positions and concluded that no liability for unrecognized tax benefits should be recorded related to uncertain tax positions. Management is not aware of any tax positions for which it is reasonably possible that the total amounts of unrecognized tax benefits will change materially in the next 12 months.
Invesco V.I. Technology Fund
The Fund files tax returns in the U.S. Federal jurisdiction and certain other jurisdictions. Generally, the Fund is subject to examinations by such taxing authorities for up to three years after the filing of the return for the tax period.
| F. | Expenses — Fees provided for under the Rule 12b-1 plan of a particular class of the Fund and which are directly attributable to that class are charged to the operations of such class. All other expenses are allocated among the classes based on relative net assets. |
| G. | Accounting Estimates — The preparation of financial statements in conformity with accounting principles generally accepted in the United States of America (“GAAP”) requires management to make estimates and assumptions that affect the reported amounts of assets and liabilities at the date of the financial statements and the reported amounts of revenues and expenses during the reporting period including estimates and assumptions related to taxation. Actual results could differ from those estimates by a significant amount. In addition, the Fund monitors for material events or transactions that may occur or become known after the period-end date and before the date the financial statements are released to print. |
| H. | Indemnifications — Under the Trust’s organizational documents, each Trustee, officer, employee or other agent of the Trust is indemnified against certain liabilities that may arise out of the performance of their duties to the Fund. Additionally, in the normal course of business, the Fund enters into contracts, including the Fund’s servicing agreements, that contain a variety of indemnification clauses. The Fund’s maximum exposure under these arrangements is unknown as this would involve future claims that may be made against the Fund that have not yet occurred. The risk of material loss as a result of such indemnification claims is considered remote. |
| I. | Securities Lending — The Fund may lend portfolio securities having a market value up to one-third of the Fund’s total assets. Such loans are secured by collateral equal to no less than the market value of the loaned securities determined daily by the securities lending provider. Such collateral will be cash or debt securities issued or guaranteed by the U.S. Government or any of its sponsored agencies. Cash collateral received in connection with these loans is invested in short-term money market instruments or affiliated money market funds and is shown as such on the Schedule of Investments. The Fund bears the risk of loss with respect to the investment of collateral. It is the Fund’s policy to obtain additional collateral from or return excess collateral to the borrower by the end of the next business day, following the valuation date of the securities loaned. Therefore, the value of the collateral held may be temporarily less than the value of the securities on loan. When loaning securities, the Fund retains certain benefits of owning the securities, including the economic equivalent of dividends or interest generated by the security. Lending securities entails a risk of loss to the Fund if, and to the extent that, the market value of the securities loaned were to increase and the borrower did not increase the collateral accordingly, and the borrower failed to return the securities. The securities loaned are subject to termination at the option of the borrower or the Fund. Upon termination, the borrower will return to the Fund the securities loaned and the Fund will return the collateral. Upon the failure of the borrower to return the securities, collateral may be liquidated and the securities may be purchased on the open market to replace the loaned securities. The Fund could experience delays and costs in gaining access to the collateral and the securities may lose value during the delay which could result in potential losses to the Fund. Some of these losses may be indemnified by the lending agent. The Fund bears the risk of any deficiency in the amount of the collateral available for return to the borrower due to any loss on the collateral invested. Dividends received on cash collateral investments for securities lending transactions, which are net of compensation to counterparties, are included in Dividends from affiliated money market funds on the Statement of Operations. The aggregate value of securities out on loan, if any, is shown as a footnote on the Statement of Assets and Liabilities. |
| J. | Foreign Currency Translations — Foreign currency is valued at the close of the NYSE based on quotations posted by banks and major currency dealers. Portfolio securities and other assets and liabilities denominated in foreign currencies are translated into U.S. dollar amounts at date of valuation. Purchases and sales of portfolio securities (net of foreign taxes withheld on disposition) and income items denominated in foreign currencies are translated into U.S. dollar amounts on the respective dates of such transactions. The Fund does not separately account for the portion of the results of operations resulting from changes in foreign exchange rates on investments and the fluctuations arising from changes in market prices of securities held. The combined results of changes in foreign exchange rates and the fluctuation of market prices on investments (net of estimated foreign tax withholding) are included with the net realized and unrealized gain or loss from investments in the Statement of Operations. Reported net realized foreign currency gains or losses arise from (1) sales of foreign currencies, (2) currency gains or losses realized between the trade and settlement dates on securities transactions, and (3) the difference between the amounts of dividends, interest, and foreign withholding taxes recorded on the Fund’s books and the U.S. dollar equivalent of the amounts actually received or paid. Net unrealized foreign currency gains and losses arise from changes in the fair values of assets and liabilities, other than investments in securities at fiscal period end, resulting from changes in exchange rates. |
The Fund may invest in foreign securities, which may be subject to foreign taxes on income, gains on investments or currency repatriation, a portion of which may be recoverable. Foreign taxes, if any, are recorded based on the tax regulations and rates that exist in the foreign markets in which the Fund invests and are shown in the Statement of Operations.
| K. | Forward Foreign Currency Contracts — The Fund may engage in foreign currency transactions either on a spot (i.e. for prompt delivery and settlement) basis, or through forward foreign currency contracts, to manage or minimize currency or exchange rate risk. |
The Fund may also enter into forward foreign currency contracts for the purchase or sale of a security denominated in a foreign currency in order to “lock in” the U.S. dollar price of that security, or the Fund may also enter into forward foreign currency contracts that do not provide for physical settlement of the two currencies, but instead are settled by a single cash payment calculated as the difference between the agreed upon exchange rate and the spot rate at settlement based upon an agreed upon notional amount (non-deliverable forwards). The Fund will set aside liquid assets in an amount equal to the daily mark-to-market obligation for forward foreign currency contracts.
A forward foreign currency contract is an obligation between two parties (“Counterparties”) to purchase or sell a specific currency for an agreed-upon price at a future date. The use of forward foreign currency contracts does not eliminate fluctuations in the price of the underlying securities the Fund owns or intends to acquire but establishes a rate of exchange in advance. Fluctuations in the value of these contracts are measured by the difference in the contract date and reporting date exchange rates and are recorded as unrealized appreciation (depreciation) until the contracts are closed. When the contracts are closed, realized gains (losses) are recorded. Realized and unrealized gains (losses) on the contracts are included in the Statement of Operations. The primary risks associated with forward foreign currency contracts include failure of the Counterparty to meet the terms of the contract and the value of the foreign currency changing unfavorably. These risks may be in excess of the amounts reflected in the Statement of Assets and Liabilities.
Invesco V.I. Technology Fund
| L. | Other Risks — The Fund’s investments are concentrated in a comparatively narrow segment of the economy, which may make the Fund more volatile. |
Many products and services offered in technology-related industries are subject to rapid obsolescence, which may lower the value of the issuers in this sector.
NOTE 2—Advisory Fees and Other Fees Paid to Affiliates
The Trust has entered into a master investment advisory agreement with Invesco Advisers, Inc. (the “Adviser” or “Invesco”). Under the terms of the investment advisory agreement, the Fund accrues daily and pays monthly an advisory fee to the Adviser based on the annual rate of the Fund’s average daily net assets as follows:
| | | | |
| Average Daily Net Assets | | Rate | |
First $250 million | | | 0.75% | |
Next $250 million | | | 0.74% | |
Next $500 million | | | 0.73% | |
Next $1.5 billion | | | 0.72% | |
Next $2.5 billion | | | 0.71% | |
Next $2.5 billion | | | 0.70% | |
Next $2.5 billion | | | 0.69% | |
Over $10 billion | | | 0.68% | |
For the year ended December 31, 2017, the effective advisory fees incurred by the Fund was 0.75%.
Under the terms of a master sub-advisory agreement between the Adviser and each of Invesco Asset Management Deutschland GmbH, Invesco Asset Management Limited, Invesco Asset Management (Japan) Limited, Invesco Hong Kong Limited, Invesco Senior Secured Management, Inc. and Invesco Canada Ltd. and separate sub-advisory agreements with Invesco PowerShares Capital Management LLC and Invesco Asset Management (India) Private Limited (collectively, the “Affiliated Sub-Advisers”) the Adviser, not the Fund, will pay 40% of the fees paid to the Adviser to any such Affiliated Sub-Adviser(s) that provide(s) discretionary investment management services to the Fund based on the percentage of assets allocated to such Affiliated Sub-Adviser(s).
The Adviser has contractually agreed, through at least June 30, 2018, to waive advisory fees and/or reimburse expenses to the extent necessary to limit total annual fund operating expenses after fee waiver and/or expense reimbursement (excluding certain items discussed below) of Series I shares to 2.00% and Series II shares to 2.25% of average daily net assets (the “expense limits”). In determining the Adviser’s obligation to waive advisory fees and/or reimburse expenses, the following expenses are not taken into account, and could cause the total annual fund operating expenses after fee waiver and/or expense reimbursement to exceed the numbers reflected above: (1) interest; (2) taxes; (3) dividend expense on short sales; (4) extraordinary or non-routine items, including litigation expenses; and (5) expenses that the Fund has incurred but did not actually pay because of an expense offset arrangement. Unless Invesco continues the fee waiver agreement, it will terminate on June 30, 2018. During its term, the fee waiver agreement cannot be terminated or amended to increase expense limits or reduce the advisory fee waiver without approval of the Board of Trustees. The Adviser did not waive fees and/or reimburse expenses during the period under these expense limits.
Further, the Adviser has contractually agreed, through at least June 30, 2019, to waive the advisory fee payable by the Fund in an amount equal to 100% of the net advisory fees the Adviser receives from the affiliated money market funds on investments by the Fund of uninvested cash in such affiliated money market funds.
For the year ended December 31, 2017, the Adviser waived advisory fees of $1,311.
The Trust has entered into a master administrative services agreement with Invesco pursuant to which the Fund has agreed to pay Invesco a fee for costs incurred in providing accounting services and fund administrative services to the Fund and to reimburse Invesco for fees paid to insurance companies that have agreed to provide certain administrative services to the Fund. These administrative services provided by the insurance companies may include, among other things: maintenance of master accounts with the Fund; tracking, recording and transmitting net purchase and redemption orders for Fund shares; maintaining and preserving records related to the purchase, redemption and other account activity of variable product owners; distributing copies of Fund documents such as prospectuses, proxy materials and periodic reports, to variable product owners, and responding to inquiries from variable product owners about the Fund. Pursuant to such agreement, for the year ended December 31, 2017, Invesco was paid $50,000 for accounting and fund administrative services and was reimbursed $170,760 for fees paid to insurance companies.
The Trust has entered into a transfer agency and service agreement with Invesco Investment Services, Inc. (“IIS”) pursuant to which the Fund has agreed to pay IIS a fee for providing transfer agency and shareholder services to the Fund and reimburse IIS for certain expenses incurred by IIS in the course of providing such services. For the year ended December 31, 2017, expenses incurred under the agreement are shown in the Statement of Operations as Transfer agent fees.
The Trust has entered into a master distribution agreement with Invesco Distributors, Inc. (“IDI”) to serve as the distributor for the Fund. The Trust has adopted a plan pursuant to Rule 12b-1 under the 1940 Act with respect to the Fund’s Series II shares (the “Plan”). The Fund, pursuant to the Plan, pays IDI compensation at the annual rate of 0.25% of the Fund’s average daily net assets of Series II shares. The fees are accrued daily and paid monthly. Of the Plan payments, up to 0.25% of the average daily net assets of the Series II shares may be paid to insurance companies who furnish continuing personal shareholder services to customers who purchase and own Series II shares of the Fund. For the year ended December 31, 2017, expenses incurred under the Plan are detailed in the Statement of Operations as Distribution fees.
For the year ended December 31, 2017, the Fund incurred $1,845 in brokerage commissions with Invesco Capital Markets, Inc., an affiliate of the Adviser and IDI, for portfolio transactions executed on behalf of the Fund.
Certain officers and trustees of the Trust are officers and directors of the Adviser, IIS and/or IDI.
Invesco V.I. Technology Fund
NOTE 3—Additional Valuation Information
GAAP defines fair value as the price that would be received to sell an asset or paid to transfer a liability in an orderly transaction between market participants at the measurement date, under current market conditions. GAAP establishes a hierarchy that prioritizes the inputs to valuation methods, giving the highest priority to readily available unadjusted quoted prices in an active market for identical assets (Level 1) and the lowest priority to significant unobservable inputs (Level 3), generally when market prices are not readily available or are unreliable. Based on the valuation inputs, the securities or other investments are tiered into one of three levels. Changes in valuation methods may result in transfers in or out of an investment’s assigned level:
| | Level 1 — | Prices are determined using quoted prices in an active market for identical assets. |
| | Level 2 — | Prices are determined using other significant observable inputs. Observable inputs are inputs that other market participants may use in pricing a security. These may include quoted prices for similar securities, interest rates, prepayment speeds, credit risk, yield curves, loss severities, default rates, discount rates, volatilities and others. |
| | Level 3 — | Prices are determined using significant unobservable inputs. In situations where quoted prices or observable inputs are unavailable (for example, when there is little or no market activity for an investment at the end of the period), unobservable inputs may be used. Unobservable inputs reflect the Fund’s own assumptions about the factors market participants would use in determining fair value of the securities or instruments and would be based on the best available information. |
The following is a summary of the tiered valuation input levels, as of December 31, 2017. The level assigned to the securities valuations may not be an indication of the risk or liquidity associated with investing in those securities. Because of the inherent uncertainties of valuation, the values reflected in the financial statements may materially differ from the value received upon actual sale of those investments.
The Fund’s policy is to recognize transfers in and out of the valuation levels as of the end of the reporting period. During the year ended December 31, 2017, there were no material transfers between valuation levels.
| | | | | | | | | | | | | | | | |
| | | Level 1 | | | Level 2 | | | Level 3 | | | Total | |
Investments in Securities | | | | | | | | | | | | | | | | |
Common Stocks & Other Equity Interests | | $ | 112,964,383 | | | $ | 8,962,095 | | | $ | — | | | $ | 121,926,478 | |
Money Market Funds | | | 1,997,297 | | | | — | | | | — | | | | 1,997,297 | |
Total Investments | | $ | 114,961,680 | | | $ | 8,962,095 | | | $ | — | | | $ | 123,923,775 | |
NOTE 4—Security Transactions with Affiliated Funds
The Fund is permitted to purchase or sell securities from or to certain other Invesco Funds under specified conditions outlined in procedures adopted by the Board of Trustees of the Trust. The procedures have been designed to ensure that any purchase or sale of securities by the Fund from or to another fund or portfolio that is or could be considered an affiliate by virtue of having a common investment adviser (or affiliated investment advisers), common Trustees and/or common officers complies with Rule 17a-7 of the 1940 Act. Further, as defined under the procedures, each transaction is effected at the current market price. Pursuant to these procedures, for the year ended December 31, 2017, the Fund engaged in securities sales of $605,398, which resulted in net realized gains of $76,004.
NOTE 5—Trustees’ and Officers’ Fees and Benefits
Trustees’ and Officers’ Fees and Benefits include amounts accrued by the Fund to pay remuneration to certain Trustees and Officers of the Fund. Trustees have the option to defer compensation payable by the Fund, and Trustees’ and Officers’ Fees and Benefits also include amounts accrued by the Fund to fund such deferred compensation amounts. Those Trustees who defer compensation have the option to select various Invesco Funds in which their deferral accounts shall be deemed to be invested. Finally, certain current Trustees were eligible to participate in a retirement plan that provided for benefits to be paid upon retirement to Trustees over a period of time based on the number of years of service. The Fund may have certain former Trustees who also participate in a retirement plan and receive benefits under such plan. Trustees’ and Officers’ Fees and Benefits include amounts accrued by the Fund to fund such retirement benefits. Obligations under the deferred compensation and retirement plans represent unsecured claims against the general assets of the Fund.
NOTE 6—Cash Balances
The Fund is permitted to temporarily carry a negative or overdrawn balance in its account with State Street Bank and Trust Company, the custodian bank. Such balances, if any at period-end, are shown in the Statement of Assets and Liabilities under the payable caption Amount due custodian. To compensate the custodian bank for such overdrafts, the overdrawn Fund may either (1) leave funds as a compensating balance in the account so the custodian bank can be compensated by earning the additional interest; or (2) compensate by paying the custodian bank at a rate agreed upon by the custodian bank and Invesco, not to exceed the contractually agreed upon rate.
Invesco V.I. Technology Fund
NOTE 7—Distributions to Shareholders and Tax Components of Net Assets
Tax Character of Distributions to Shareholders Paid During the Fiscal Years Ended December 31, 2017 and 2016:
| | | | | | | | |
| | | 2017 | | | 2016 | |
Long-term capital gain | | $ | 6,102,722 | | | $ | 4,402,916 | |
Tax Components of Net Assets at Period-End:
| | | | |
| | | 2017 | |
Undistributed ordinary income | | $ | 1,229,123 | |
Undistributed long-term gain | | | 4,599,196 | |
Net unrealized appreciation — investments | | | 54,664,114 | |
Temporary book/tax differences | | | (63,172 | ) |
Shares of beneficial interest | | | 62,361,548 | |
Total net assets | | $ | 122,790,809 | |
The difference between book-basis and tax-basis unrealized appreciation (depreciation) is due to differences in the timing of recognition of gains and losses on investments for tax and book purposes. The Fund’s net unrealized appreciation difference is attributable primarily to wash sales.
The temporary book/tax differences are a result of timing differences between book and tax recognition of income and/or expenses. The Fund’s temporary book/tax differences are the result of the trustee deferral of compensation and retirement plan benefits.
Capital loss carryforward is calculated and reported as of a specific date. Results of transactions and other activity after that date may affect the amount of capital loss carryforward actually available for the Fund to utilize. Capital losses generated in years beginning after December 22, 2010 can be carried forward for an unlimited period, whereas previous losses expire in eight tax years. Capital losses with an expiration period may not be used to offset capital gains until all net capital losses without an expiration date have been utilized. Capital loss carryforwards with no expiration date will retain their character as either short-term or long-term capital losses instead of as short-term capital losses as under prior law. The ability to utilize capital loss carryforwards in the future may be limited under the Internal Revenue Code and related regulations based on the results of future transactions.
The Fund does not have a capital loss carryforward as of December 31, 2017.
NOTE 8—Investment Transactions
The aggregate amount of investment securities (other than short-term securities, U.S. Treasury obligations and money market funds, if any) purchased and sold by the Fund during the year ended December 31, 2017 was $48,958,039 and $54,613,591, respectively. Cost of investments, including any derivatives, on a tax basis includes the adjustments for financial reporting purposes as of the most recently completed federal income tax reporting period-end.
| | | | |
| Unrealized Appreciation (Depreciation) of Investments on a Tax Basis | | | |
Aggregate unrealized appreciation of investments | | $ | 55,232,435 | |
Aggregate unrealized (depreciation) of investments | | | (568,321 | ) |
Net unrealized appreciation of investments | | $ | 54,664,114 | |
Cost of investments for tax purposes is $69,259,661.
NOTE 9—Reclassification of Permanent Differences
Primarily as a result of differing book/tax treatment of net operating losses, on December 31, 2017, undistributed net investment income (loss) was increased by $500,311 and undistributed net realized gain was decreased by $500,311. This reclassification had no effect on the net assets of the Fund.
Invesco V.I. Technology Fund
NOTE 10—Share Information
| | | | | | | | | | | | | | | | |
| | | Summary of Share Activity | |
| | | Years ended December 31, | |
| | | 2017(a) | | | 2016 | |
| | | Shares | | | Amount | | | Shares | | | Amount | |
Sold: | | | | | | | | | | | | | | | | |
Series I | | | 997,886 | | | $ | 21,692,361 | | | | 459,692 | | | $ | 7,989,025 | |
Series II | | | 66,105 | | | | 1,382,819 | | | | 28,944 | | | | 482,623 | |
| | | | |
Issued as reinvestment of dividends: | | | | | | | | | | | | | | | | |
Series I | | | 253,797 | | | | 5,644,440 | | | | 220,142 | | | | 4,059,433 | |
Series II | | | 21,607 | | | | 458,282 | | | | 19,439 | | | | 343,483 | |
| | | | |
Reacquired: | | | | | | | | | | | | | | | | |
Series I | | | (1,214,728 | ) | | | (26,522,499 | ) | | | (1,477,788 | ) | | | (25,895,694 | ) |
Series II | | | (53,315 | ) | | | (1,111,197 | ) | | | (95,643 | ) | | | (1,615,352 | ) |
Net increase (decrease) in share activity | | | 71,352 | | | $ | 1,544,206 | | | | (845,214 | ) | | $ | (14,636,482 | ) |
| (a) | There are entities that are record owners of more than 5% of the outstanding shares of the Fund and in the aggregate own 60% of the outstanding shares of the Fund. The Fund and the Fund’s principal underwriter or adviser, are parties to participation agreements with these entities whereby these entities sell units of interest in separate accounts funding variable products that are invested in the Fund. The Fund, Invesco and/or Invesco affiliates may make payments to these entities, which are considered to be related to the Fund, for providing services to the Fund, Invesco and/or Invesco affiliates including but not limited to services such as, securities brokerage, third party record keeping and account servicing and administrative services. The Fund has no knowledge as to whether all or any portion of the shares owned of record by these entities are also owned beneficially. |
NOTE 11—Financial Highlights
The following schedule presents financial highlights for a share of the Fund outstanding throughout the periods indicated.
| | | | | | | | | | | | | | | | | | | | | | | | | | | | | | | | | | | | | | | | | | | | | | | | |
| | | Net asset value, beginning
of period | | | Net investment income
(loss)(a) | | | Net gains (losses) on securities (both realized and unrealized) | | | Total from investment operations | | | Distributions from net
realized
gains | | | Net asset
value, end of period | | | Total return(b) | | | Net assets,
end of period (000’s omitted) | | | Ratio of expenses to average net assets
with fee waivers and/or expenses absorbed | | | Ratio of expenses to average net
assets without
fee waivers
and/or expenses absorbed | | | Ratio of net investment
income (loss) to average net assets | | | Portfolio turnover(c) | |
Series I | | | | | | | | | | | | | | | | | | | | | | | | | | | | | | | | | | | | | | | | | | | | | | | | |
Year ended 12/31/17 | | $ | 17.89 | | | $ | (0.09 | ) | | $ | 6.34 | | | $ | 6.25 | | | $ | (1.17 | ) | | $ | 22.97 | | | | 35.13 | % | | $ | 113,352 | | | | 1.06 | %(d) | | | 1.06 | %(d) | | | (0.41 | )%(d) | | | 43 | % |
Year ended 12/31/16 | | | 18.83 | | | | (0.06 | ) | | | (0.06 | ) | | | (0.12 | ) | | | (0.82 | ) | | | 17.89 | | | | (0.76 | ) | | | 87,632 | | | | 1.10 | | | | 1.10 | | | | (0.33 | ) | | | 52 | |
Year ended 12/31/15 | | | 19.75 | | | | (0.11 | ) | | | 1.29 | | | | 1.18 | | | | (2.10 | ) | | | 18.83 | | | | 6.82 | | | | 107,257 | | | | 1.15 | | | | 1.15 | | | | (0.53 | ) | | | 61 | |
Year ended 12/31/14 | | | 19.42 | | | | (0.13 | ) | | | 2.20 | | | | 2.07 | | | | (1.74 | ) | | | 19.75 | | | | 11.05 | | | | 104,556 | | | | 1.16 | | | | 1.16 | | | | (0.65 | ) | | | 77 | |
Year ended 12/31/13 | | | 16.87 | | | | (0.07 | ) | | | 4.19 | | | | 4.12 | | | | (1.57 | ) | | | 19.42 | | | | 25.14 | | | | 103,151 | | | | 1.17 | | | | 1.17 | | | | (0.40 | ) | | | 45 | |
Series II | | | | | | | | | | | | | | | | | | | | | | | | | | | | | | | | | | | | | | | | | | | | | | | | |
Year ended 12/31/17 | | | 17.14 | | | | (0.14 | ) | | | 6.06 | | | | 5.92 | | | | (1.17 | ) | | | 21.89 | | | | 34.74 | | | | 9,439 | | | | 1.31 | (d) | | | 1.31 | (d) | | | (0.66 | )(d) | | | 43 | |
Year ended 12/31/16 | | | 18.12 | | | | (0.10 | ) | | | (0.06 | ) | | | (0.16 | ) | | | (0.82 | ) | | | 17.14 | | | | (1.01 | ) | | | 6,799 | | | | 1.35 | | | | 1.35 | | | | (0.58 | ) | | | 52 | |
Year ended 12/31/15 | | | 19.13 | | | | (0.15 | ) | | | 1.24 | | | | 1.09 | | | | (2.10 | ) | | | 18.12 | | | | 6.56 | | | | 8,043 | | | | 1.40 | | | | 1.40 | | | | (0.78 | ) | | | 61 | |
Year ended 12/31/14 | | | 18.90 | | | | (0.17 | ) | | | 2.14 | | | | 1.97 | | | | (1.74 | ) | | | 19.13 | | | | 10.82 | | | | 4,775 | | | | 1.41 | | | | 1.41 | | | | (0.90 | ) | | | 77 | |
Year ended 12/31/13 | | | 16.50 | | | | (0.12 | ) | | | 4.09 | | | | 3.97 | | | | (1.57 | ) | | | 18.90 | | | | 24.79 | | | | 3,200 | | | | 1.42 | | | | 1.42 | | | | (0.65 | ) | | | 45 | |
| (a) | Calculated using average shares outstanding. |
| (b) | Includes adjustments in accordance with accounting principles generally accepted in the United States of America and as such, the net asset value for financial reporting purposes and the returns based upon those net asset values may differ from the net asset value and returns for shareholder transactions. Total returns are not annualized for periods less than one year, if applicable, and do not reflect charges assessed in connection with a variable product, which if included would reduce total returns. |
| (c) | Portfolio turnover is calculated at the fund level and is not annualized for periods less than one year, if applicable. |
| (d) | Ratios are based on average daily net assets (000’s omitted) of $106,555 and $8,397 for Series I and Series II shares, respectively. |
Invesco V.I. Technology Fund
Report of Independent Registered Public Accounting Firm
To the Board of Trustees of AIM Variable Insurance Funds
(Invesco Variable Insurance Funds) and Shareholders of Invesco V.I. Technology Fund
Opinion on the Financial Statements
We have audited the accompanying statement of assets and liabilities, including the schedule of investments, of Invesco V.I. Technology Fund (one of the funds constituting AIM Variable Insurance Funds (Invesco Variable Insurance Funds), hereafter referred to as the “Fund”) as of December 31, 2017, the related statement of operations for the year ended December 31, 2017, the statement of changes in net assets for each of the two years in the period ended December 31, 2017, including the related notes, and the financial highlights for each of the five years in the period ended December 31, 2017 (collectively referred to as the “financial statements”). In our opinion, the financial statements present fairly, in all material respects, the financial position of the Fund as of December 31, 2017, the results of its operations for the year then ended, the changes in its net assets for each of the two years in the period ended December 31, 2017 and the financial highlights for each of the five years in the period ended December 31, 2017 in conformity with accounting principles generally accepted in the United States of America.
Basis for Opinion
These financial statements are the responsibility of the Fund’s management. Our responsibility is to express an opinion on the Fund’s financial statements based on our audits. We are a public accounting firm registered with the Public Company Accounting Oversight Board (United States) (“PCAOB”) and are required to be independent with respect to the Fund in accordance with the U.S. federal securities laws and the applicable rules and regulations of the Securities and Exchange Commission and the PCAOB.
We conducted our audits of these financial statements in accordance with the standards of the PCAOB. Those standards require that we plan and perform the audit to obtain reasonable assurance about whether the financial statements are free of material misstatement, whether due to error or fraud.
Our audits included performing procedures to assess the risks of material misstatement of the financial statements, whether due to error or fraud, and performing procedures that respond to those risks. Such procedures included examining, on a test basis, evidence regarding the amounts and disclosures in the financial statements. Our audits also included evaluating the accounting principles used and significant estimates made by management, as well as evaluating the overall presentation of the financial statements. Our procedures included confirmation of securities owned as of December 31, 2017 by correspondence with the custodian, transfer agent and brokers; when replies were not received from brokers, we performed other auditing procedures. We believe that our audits provide a reasonable basis for our opinion.
PricewaterhouseCoopers LLP
Houston, TX
February 14, 2018
We have served as the auditor of one or more of the investment companies in the Invesco/PowerShares group of investment companies since at least 1995. We have not determined the specific year we began serving as such auditor.
Invesco V.I. Technology Fund
Calculating your ongoing Fund expenses
Example
As a shareholder of the Fund, you incur ongoing costs, including management fees; distribution and/or service fees (12b-1); and other Fund expenses. This example is intended to help you understand your ongoing costs (in dollars) of investing in the Fund and to compare these costs with ongoing costs of investing in other mutual funds. The example is based on an investment of $1,000 invested at the beginning of the period and held for the entire period July 1, 2017 through December 31, 2017.
The actual and hypothetical expenses in the examples below do not represent the effect of any fees or other expenses assessed in connection with a variable product; if they did, the expenses shown would be higher while the ending account values shown would be lower.
Actual expenses
The table below provides information about actual account values and actual expenses. You may use the information in this table, together with the amount you invested, to estimate the expenses that you paid over the period. Simply divide your account value by $1,000 (for example, an $8,600 account value divided by $1,000 = 8.6), then multiply the result by the number in the table under the heading entitled “Actual Expenses Paid During Period” to estimate the expenses you paid on your account during this period.
Hypothetical example for comparison purposes
The table below also provides information about hypothetical account values and hypothetical expenses based on the Fund’s actual expense ratio and an assumed rate of return of 5% per year before expenses, which is not the Fund’s actual return.
The hypothetical account values and expenses may not be used to estimate the actual ending account balance or expenses you paid for the period. You may use this information to compare the ongoing costs of investing in the Fund and other funds. To do so, compare this 5% hypothetical example with the 5% hypothetical examples that appear in the shareholder reports of the other funds.
Please note that the expenses shown in the table are meant to highlight your ongoing costs. Therefore, the hypothetical information is useful in comparing ongoing costs, and will not help you determine the relative total costs of owning different funds.
| | | | | | | | | | | | | | | | | | | | | | | | |
| Class | | Beginning Account Value (07/01/17) | | | ACTUAL | | | HYPOTHETICAL
(5% annual return before
expenses) | | | Annualized Expense Ratio | |
| | | Ending Account Value (12/31/17)1 | | | Expenses
Paid During
Period2 | | | Ending Account Value (12/31/17) | | | Expenses
Paid During Period2 | | |
| Series I | | $ | 1,000.00 | | | $ | 1,102.90 | | | $ | 5.57 | | | $ | 1,019.91 | | | $ | 5.35 | | | | 1.05 | % |
| Series II | | | 1,000.00 | | | | 1,101.30 | | | | 6.89 | | | | 1,018.65 | | | | 6.61 | | | | 1.30 | |
| 1 | The actual ending account value is based on the actual total return of the Fund for the period July 1, 2017 through December 31, 2017, after actual expenses and will differ from the hypothetical ending account value which is based on the Fund’s expense ratio and a hypothetical annual return of 5% before expenses. |
| 2 | Expenses are equal to the Fund’s annualized expense ratio as indicated above multiplied by the average account value over the period, multiplied by 184/365 to reflect the most recent fiscal half year. |
Invesco V.I. Technology Fund
Tax Information
Form 1099-DIV, Form 1042-S and other year-end tax information provide shareholders with actual calendar year amounts that should be included in their tax returns. Shareholders should consult their tax advisors.
The following distribution information is being provided as required by the Internal Revenue Code or to meet a specific state’s requirement.
The Fund designates the following amounts or, if subsequently determined to be different, the maximum amount allowable for its fiscal year ended December 31, 2017:
| | | | |
Federal and State Income Tax | |
Long-Term Capital Gain Distributions | | $ | 6,102,722 | |
Corporate Dividends Received Deduction* | | | 0.00 | % |
U.S. Treasury Obligations* | | | 0.00 | % |
| | * | The above percentages are based on ordinary income dividends paid to shareholders during the Fund’s fiscal year. |
Invesco V.I. Technology Fund
Trustees and Officers
The address of each trustee and officer is AIM Variable Insurance Funds (Invesco Variable Insurance Funds) (the “Trust”), 11 Greenway Plaza, Suite 1000, Houston, Texas 77046-1173. The trustees serve for the life of the Trust, subject to their earlier death, incapacitation, resignation, retirement or removal as more specifically provided in the Trust’s organizational documents. Each officer serves for a one year term or until their successors are elected and qualified. Column two below includes length of time served with predecessor entities, if any.
| | | | | | | | |
Name, Year of Birth and
Position(s) Held with the Trust | | Trustee and/
or Officer Since | | Principal Occupation(s)
During Past 5 Years | | Number of
Funds in Fund
Complex
Overseen by
Trustee | | Other Directorship(s)
Held by Trustee During
Past 5 Years |
| Interested Persons | | | | | | | | |
Martin L. Flanagan1 — 1960 Trustee | | 2007 | | Executive Director, Chief Executive Officer and President, Invesco Ltd. (ultimate parent of Invesco and a global investment management firm); Trustee, The Invesco Funds; Vice Chair, Investment Company Institute; and Member of Executive Board, SMU Cox School of Business Formerly: Advisor to the Board, Invesco Advisers, Inc. (formerly known as Invesco Institutional (N.A.), Inc.); Chairman and Chief Executive Officer, Invesco Advisers, Inc. (registered investment adviser); Director, Chairman, Chief Executive Officer and President, Invesco Holding Company (US), Inc. (formerly IVZ Inc.) (holding company), Invesco Group Services, Inc. (service provider) and Invesco North American Holdings, Inc. (holding company); Director, Chief Executive Officer and President, Invesco Holding Company Limited (parent of Invesco and a global investment management firm); Director, Invesco Ltd.; Chairman, Investment Company Institute and President, Co-Chief Executive Officer, Co-President, Chief Operating Officer and Chief Financial Officer, Franklin Resources, Inc. (global investment management organization) | | 158 | | None |
Philip A. Taylor2 — 1954 Trustee and Senior Vice President | | 2006 | | Head of the Americas and Senior Managing Director, Invesco Ltd.; Director, Invesco Advisers, Inc. (formerly known as Invesco Institutional (N.A.), Inc.) (registered investment adviser); Director, Chairman, Chief Executive Officer and President, Invesco Management Group, Inc. (formerly known as Invesco Aim Management Group, Inc.) (financial services holding company); Director and Chairman, Invesco Investment Services, Inc. (formerly known as Invesco Aim Investment Services, Inc.) (registered transfer agent); Chief Executive Officer, Invesco Corporate Class Inc. (corporate mutual fund company); Director, Chairman and Chief Executive Officer, Invesco Canada Ltd. (formerly known as Invesco Trimark Ltd./Invesco Trimark Ltèe) (registered investment adviser and registered transfer agent); Trustee and Senior Vice President, The Invesco Funds; Director, Invesco Investment Advisers LLC (formerly known as Van Kampen Asset Management). Formerly: Co-Chairman, Co-President and Co-Chief Executive Officer, Invesco Advisers, Inc. (formerly known as Invesco Institutional (N.A.), Inc.) (registered investment adviser); Director, Chief Executive Officer and President, Van Kampen Exchange Corp; President and Principal Executive Officer, The Invesco Funds (other than AIM Treasurer’s Series Trust (Invesco Treasurer’s Series Trust), Short-Term Investments Trust and Invesco Management Trust); Executive Vice President, The Invesco Funds (AIM Treasurer’s Series Trust (Invesco Treasurer’s Series Trust), Short-Term Investments Trust and Invesco Management Trust only); Director and President, INVESCO Funds Group, Inc. (registered investment adviser and registered transfer agent); Director and Chairman, IVZ Distributors, Inc. (formerly known as INVESCO Distributors, Inc.) (registered broker dealer); Director, President and Chairman, Invesco Inc. (holding company), Invesco Canada Holdings Inc. (holding company), Trimark Investments Ltd./Placements Trimark Ltèe and Invesco Financial Services Ltd/Services Financiers Invesco Ltèe; Chief Executive Officer, Invesco Canada Fund Inc. (corporate mutual fund company); Director and Chairman, Van Kampen Investor Services Inc.; Director, Chief Executive Officer and President, 1371 Preferred Inc. (holding company) and Van Kampen Investments Inc.; Director and President, AIM GP Canada Inc. (general partner for limited partnerships) and Van Kampen Advisors, Inc.; Director and Chief Executive Officer, Invesco Trimark Dealer Inc. (registered broker dealer); Director, Invesco Distributors, Inc. (formerly known as Invesco Aim Distributors, Inc.) (registered broker dealer); Manager, Invesco PowerShares Capital Management LLC; Director, Chief Executive Officer and President, Invesco Advisers, Inc.; Director, Chairman, Chief Executive Officer and President, Invesco Aim Capital Management, Inc.; President, Invesco Trimark Dealer Inc. and Invesco Trimark Ltd./Invesco Trimark Ltèe; Director and President, AIM Trimark Corporate Class Inc. and AIM Trimark Canada Fund Inc.; Senior Managing Director, Invesco Holding Company Limited; Director and Chairman, Fund Management Company (former registered broker dealer); President and Principal Executive Officer, The Invesco Funds (AIM Treasurer’s Series Trust (Invesco Treasurer’s Series Trust), and Short-Term Investments Trust only); President, AIM Trimark Global Fund Inc. and AIM Trimark Canada Fund Inc. | | 158 | | None |
| 1 | Mr. Flanagan is considered an interested person (within the meaning of Section 2(a)(19) of the 1940 Act) of the Trust because he is an officer of the Adviser to the Trust, and an officer and a director of Invesco Ltd., ultimate parent of the Adviser. |
| 2 | Mr. Taylor is considered an interested person (within the meaning of Section 2(a)(19) of the 1940 Act) of the Trust because he is an officer and a director of the Adviser. |
Invesco V.I. Technology Fund
Trustees and Officers—(continued)
| | | | | | | | |
Name, Year of Birth and
Position(s) Held with the Trust | | Trustee and/
or Officer Since | | Principal Occupation(s)
During Past 5 Years | | Number of
Funds in Fund
Complex
Overseen by
Trustee | | Other Directorship(s)
Held by Trustee During
Past 5 Years |
| Independent Trustees | | | | | | | | |
Bruce L. Crockett — 1944 Trustee and Chair | | 1993 | | Chairman, Crockett Technologies Associates (technology consulting company) Formerly: Director, Captaris (unified messaging provider); Director, President and Chief Executive Officer, COMSAT Corporation; Chairman, Board of Governors of INTELSAT (international communications company); ACE Limited (insurance company); Independent Directors Council and Investment Company Institute: Member of the Audit Committee, Investment Company Institute; Member of the Executive Committee and Chair of the Governance Committee, Independent Directors Council | | 158 | | Director and Chairman of the Audit Committee, ALPS (Attorneys Liability Protection Society) (insurance company); Director and Member of the Audit Committee and Compensation Committee, Ferroglobe PLC (metallurgical company) |
David C. Arch — 1945 Trustee | | 2010 | | Chairman of Blistex Inc. (consumer health care products manufacturer); Member, World Presidents’ Organization | | 158 | | Board member of the Illinois Manufacturers’ Association |
Jack M. Fields — 1952 Trustee | | 1997 | | Chief Executive Officer, Twenty First Century Group, Inc. (government affairs company); and Chairman, Discovery Learning Alliance (non-profit) Formerly: Owner and Chief Executive Officer, Dos Angeles Ranch L.P. (cattle, hunting, corporate entertainment); Director, Insperity, Inc. (formerly known as Administaff) (human resources provider); Chief Executive Officer, Texana Timber LP (sustainable forestry company); Director of Cross Timbers Quail Research Ranch (non-profit); and member of the U.S. House of Representatives | | 158 | | None |
Cynthia Hostetler — 1962 Trustee | | 2017 | | Non-Executive Director and Trustee of a number of public and private business corporations Formerly: Head of Investment Funds and Private Equity, Overseas Private Investment Corporation; President, First Manhattan Bancorporation, Inc.; Attorney, Simpson Thacher & Bartlett LLP | | 158 | | Vulcan Materials Company (construction materials company); Trilinc Global Impact Fund; Aberdeen Investment Funds (4 portfolios); Artio Global Investment LLC (mutual fund complex); Edgen Group, Inc. (specialized energy and infrastructure products distributor) |
Eli Jones — 1961 Trustee | | 2016 | | Professor and Dean, Mays Business School — Texas A&M University Formerly: Professor and Dean, Walton College of Business, University of Arkansas and E.J. Ourso College of Business, Louisiana State University; Director, Arvest Bank | | 158 | | Insperity, Inc. (formerly known as Administaff) (human resources provider) |
Prema Mathai-Davis — 1950 Trustee | | 1998 | | Retired. | | 158 | | None |
Teresa M. Ressel — 1962 Trustee | | 2017 | | Non-executive director and trustee of a number of public and private business corporations Formerly: Chief Financial Officer, Olayan America, The Olayan Group (international investor/commercial/industrial); Chief Executive Officer, UBS Securities LLC; Group Chief Operating Officer, Americas, UBS AG; Assistant Secretary for Management & Budget and CFO, US Department of the Treasury | | 158 | | Atlantic Power Corporation (power generation company); ON Semiconductor Corp. (semiconductor supplier) |
Ann Barnett Stern — 1957 Trustee | | 2017 | | President and Chief Executive Officer, Houston Endowment Inc. (private philanthropic institution) Formerly: Executive Vice President and General Counsel, Texas Children’s Hospital; Attorney, Beck, Redden and Secrest, LLP; Business Law Instructor, University of St. Thomas; Attorney, Andrews & Kurth LLP | | 158 | | Federal Reserve Bank of Dallas |
Raymond Stickel, Jr. — 1944 Trustee | | 2005 | | Retired. Formerly: Director, Mainstay VP Series Funds, Inc. (25 portfolios); Partner, Deloitte & Touche | | 158 | | None |
Robert C. Troccoli — 1949 Trustee | | 2016 | | Adjunct Professor, University of Denver — Daniels College of Business Formerly: Senior Partner, KPMG LLP | | 158 | | None |
Christopher L. Wilson — 1957 Trustee | | 2017 | | Non-executive director and trustee of a number of public and private business corporations Formerly: Managing Partner, CT2, LLC (investing and consulting firm); President/Chief Executive Officer, Columbia Funds, Bank of America Corporation; President/Chief Executive Officer, CDC IXIS Asset Management Services, Inc.; Principal & Director of Operations, Scudder Funds, Scudder, Stevens & Clark, Inc.; Assistant Vice President, Fidelity Investments | | 158 | | TD Asset Management USA Inc. (mutual fund complex) (22 portfolios); ISO New England, Inc. (non-profit organization managing regional electricity market) |
Invesco V.I. Technology Fund
Trustees and Officers—(continued)
| | | | | | | | |
Name, Year of Birth and
Position(s) Held with the Trust | | Trustee and/
or Officer Since | | Principal Occupation(s)
During Past 5 Years | | Number of
Funds in Fund
Complex
Overseen by
Trustee | | Other Directorship(s)
Held by Trustee During
Past 5 Years |
| Other Officers | | | | | | | | |
Sheri Morris — 1964 President, Principal Executive Officer and Treasurer | | 1999 | | President, Principal Executive Officer and Treasurer, The Invesco Funds; Vice President, Invesco Advisers, Inc. (formerly known as Invesco Institutional (N.A.), Inc.) (registered investment adviser); and Vice President, PowerShares Exchange-Traded Fund Trust, PowerShares Exchange-Traded Fund Trust II, PowerShares India Exchange-Traded Fund Trust, PowerShares Actively Managed Exchange-Traded Fund Trust, PowerShares Actively Managed Exchange-Traded Commodity Fund Trust and PowerShares Exchange-Traded Self-Indexed Fund Trust Formerly: Vice President and Principal Financial Officer, The Invesco Funds; Vice President, Invesco Aim Advisers, Inc., Invesco Aim Capital Management, Inc. and Invesco Aim Private Asset Management, Inc.; Assistant Vice President and Assistant Treasurer, The Invesco Funds and Assistant Vice President, Invesco Advisers, Inc., Invesco Aim Capital Management, Inc. and Invesco Aim Private Asset Management, Inc.; and Treasurer, PowerShares Exchange-Traded Fund Trust, PowerShares Exchange-Traded Fund Trust II, PowerShares India Exchange-Traded Fund Trust and PowerShares Actively Managed Exchange-Traded Fund Trust | | N/A | | N/A |
Russell C. Burk — 1958 Senior Vice President and Senior Officer | | 2005 | | Senior Vice President and Senior Officer, The Invesco Funds | | N/A | | N/A |
John M. Zerr — 1962 Senior Vice President, Chief Legal Officer and Secretary | | 2006 | | Director, Senior Vice President, Secretary and General Counsel, Invesco Management Group, Inc. (formerly known as Invesco AIM Management Group, Inc.); Senior Vice President, Invesco Advisers, Inc. (formerly known as Invesco Institutional (N.A.), Inc.) (registered investment adviser); Senior Vice President and Secretary, Invesco Distributors, Inc. (formerly known as Invesco AIM Distributors, Inc.); Director, Vice President and Secretary, Invesco Investment Services, Inc. (formerly known as Invesco AIM Investment Services, Inc.) Senior Vice President, Chief Legal Officer and Secretary, The Invesco Funds; Managing Director, Invesco PowerShares Capital Management LLC; Director, Secretary and General Counsel, Invesco Investment Advisers LLC (formerly known as Van Kampen Asset Management); Secretary and General Counsel, Invesco Capital Markets, Inc. (formerly known as Van Kampen Funds Inc.) and Chief Legal Officer, PowerShares Exchange-Traded Fund Trust, PowerShares Exchange-Traded Fund Trust II, PowerShares India Exchange-Traded Fund Trust, PowerShares Actively Managed Exchange-Traded Fund Trust, PowerShares Actively Managed Exchange-Traded Commodity Fund Trust and PowerShares Exchange-Traded Self-Indexed Fund Trust; Manager and Secretary, Invesco Indexing LLC Formerly: Director, Secretary, General Counsel and Senior Vice President, Van Kampen Exchange Corp.; Director, Vice President and Secretary, IVZ Distributors, Inc. (formerly known as INVESCO Distributors, Inc.); Director and Vice President, INVESCO Funds Group, Inc.; Director and Vice President, Van Kampen Advisors Inc.; Director, Vice President, Secretary and General Counsel, Van Kampen Investor Services Inc.; Director, Invesco Distributors, Inc. (formerly known as Invesco AIM Distributors, Inc.); Director, Senior Vice President, General Counsel and Secretary, Invesco AIM Advisers, Inc. and Van Kampen Investments Inc.; Director, Vice President and Secretary, Fund Management Company; Director, Senior Vice President, Secretary, General Counsel and Vice President, Invesco AIM Capital Management, Inc.; Chief Operating Officer and General Counsel, Liberty Ridge Capital, Inc. (an investment adviser); Vice President and Secretary, PBHG Funds (an investment company) and PBHG Insurance Series Fund (an investment company); Chief Operating Officer, General Counsel and Secretary, Old Mutual Investment Partners (a broker-dealer); General Counsel and Secretary, Old Mutual Fund Services (an administrator) and Old Mutual Shareholder Services (a shareholder servicing center); Executive Vice President, General Counsel and Secretary, Old Mutual Capital, Inc. (an investment adviser); and Vice President and Secretary, Old Mutual Advisors Funds (an investment company) | | N/A | | N/A |
Gregory G. McGreevey — 1962 Senior Vice President | | 2012 | | Senior Managing Director, Invesco Ltd.; Director, Chairman, President, and Chief Executive Officer, Invesco Advisers, Inc. (formerly known as Invesco Institutional (N.A.), Inc.) (registered investment adviser); Senior Vice President, Invesco Management Group, Inc.; Director, Invesco Mortgage Capital, Inc. and Invesco Senior Secured Management, Inc.; and Senior Vice President, The Invesco Funds Formerly: Assistant Vice President, The Invesco Funds | | N/A | | N/A |
Kelli Gallegos — 1970 Vice President, Principal Financial Officer and Assistant Treasurer | | 2008 | | Vice President, Principal Financial Officer and Assistant Treasurer, The Invesco Funds; Assistant Treasurer, Invesco PowerShares Capital Management LLC, PowerShares Exchange-Traded Fund Trust, PowerShares Exchange-Traded Fund Trust II, PowerShares India Exchange-Traded Fund Trust, PowerShares Actively Managed Exchange-Traded Fund Trust, PowerShares Actively Managed Exchange-Traded Commodity Fund Trust and PowerShares Exchange-Traded Self-Indexed Fund Trust Formerly: Assistant Vice President, The Invesco Funds | | N/A | | N/A |
Invesco V.I. Technology Fund
Trustees and Officers—(continued)
| | | | | | | | |
Name, Year of Birth and
Position(s) Held with the Trust | | Trustee and/
or Officer Since | | Principal Occupation(s)
During Past 5 Years | | Number of
Funds in Fund
Complex
Overseen by
Trustee | | Other Directorship(s)
Held by Trustee During
Past 5 Years |
| Other Officers—(continued) | | | | | | | | |
Tracy Sullivan — 1962 Vice President, Chief Tax Officer and Assistant Treasurer | | 2008 | | Vice President, Chief Tax Officer and Assistant Treasurer, The Invesco Funds; Assistant Treasurer, Invesco PowerShares Capital Management LLC, PowerShares Exchange-Traded Fund Trust, PowerShares Exchange-Traded Fund Trust II, PowerShares India Exchange-Traded Fund Trust, PowerShares Actively Managed Exchange-Traded Fund Trust, PowerShares Actively Managed Exchange-Traded Commodity Fund Trust and PowerShares Exchange-Traded Self-Indexed Fund Trust Formerly: Assistant Vice President, The Invesco Funds | | N/A | | N/A |
Crissie M. Wisdom — 1969 Anti-Money Laundering Compliance Officer | | 2013 | | Anti-Money Laundering Compliance Officer, Invesco Advisers, Inc. (formerly known as Invesco Institutional (N.A.), Inc.) (registered investment adviser), Invesco Capital Markets, Inc. (formerly known as Van Kampen Funds Inc.), Invesco Distributors, Inc., Invesco Investment Services, Inc., Invesco Management Group, Inc., The Invesco Funds, and PowerShares Exchange-Traded Fund Trust, PowerShares Exchange-Traded Fund Trust II, PowerShares India Exchange-Traded Fund Trust, PowerShares Actively Managed Exchange-Traded Fund Trust, PowerShares Actively Managed Exchange-Traded Commodity Fund Trust and PowerShares Exchange-Traded Self-Indexed Fund Trust; Anti-Money Laundering Compliance Officer and Bank Secrecy Act Officer, INVESCO National Trust Company and Invesco Trust Company; and Fraud Prevention Manager and Controls and Risk Analysis Manager for Invesco Investment Services, Inc. Formerly: Anti-Money Laundering Compliance Officer, Van Kampen Exchange Corp. | | N/A | | N/A |
Robert R. Leveille — 1969 Chief Compliance Officer | | 2016 | | Chief Compliance Officer, Invesco Advisers, Inc. (registered investment adviser); and Chief Compliance Officer, The Invesco Funds Formerly: Chief Compliance Officer, Putnam Investments and the Putnam Funds | | N/A | | N/A |
The Statement of Additional Information of the Trust includes additional information about the Fund’s Trustees and is available upon request, without charge, by calling 1.800.959.4246. Please refer to the Fund’s Statement of Additional Information for information on the Fund’s sub-advisers.
| | | | | | |
Office of the Fund 11 Greenway Plaza, Suite 1000 Houston, TX 77046-1173 | | Investment Adviser Invesco Advisers, Inc. 1555 Peachtree Street, N.E. Atlanta, GA 30309 | | Distributor Invesco Distributors, Inc. 11 Greenway Plaza, Suite 1000 Houston, TX 77046-1173 | | Auditors PricewaterhouseCoopers LLP 1000 Louisiana Street, Suite 5800 Houston, TX 77002-5678 |
| | | |
| | | | | | |
Counsel to the Fund Stradley Ronon Stevens & Young, LLP 2005 Market Street, Suite 2600 Philadelphia, PA 19103-7018 | | Counsel to the Independent Trustees Goodwin Procter LLP 901 New York Avenue, N.W. Washington, D.C. 20001 | | Transfer Agent Invesco Investment Services, Inc. 11 Greenway Plaza, Suite 1000 Houston, TX 77046-1173 | | Custodian State Street Bank and Trust Company 225 Franklin Street Boston, MA 02110-2801 |
Invesco V.I. Technology Fund
| | | | |
| | |
 | | Annual Report to Shareholders | | December 31, 2017 |
| | |
| | Invesco V.I. Value Opportunities Fund |

| | |
| | The Fund provides a complete list of its holdings four times in each fiscal year, at the quarter-ends. For the second and fourth quarters, the lists appear in the Fund’s semiannual and annual reports to shareholders. For the first and third quarters, the Fund files the lists with the Securities and Exchange Commission (SEC) on Form N-Q. The Fund’s Form N-Q filings are available on the SEC website, sec.gov. Copies of the Fund’s Forms N-Q may be reviewed and copied at the SEC Public Reference Room in Washington, D.C. You can obtain information on the operation of the Public Reference Room, including information about duplicating fee charges, by calling 202 551 8090 or 800 732 0330, or by electronic request at the following email address: publicinfo@sec.gov. The SEC file numbers for the Fund are 811-07452 and 033-57340. The Fund’s most recent portfolio holdings, as filed on Form N-Q, have also been made available to insurance companies issuing variable annuity contracts and variable life insurance policies (“variable products”) that invest in the Fund. A description of the policies and procedures that the Fund uses to determine how to vote proxies relating to portfolio securities is available without charge, upon request, from our Client Services department at 800 959 4246 or at invesco.com/proxyguidelines. The information is also available on the SEC website, sec.gov. Information regarding how the Fund voted proxies related to its portfolio securities during the most recent 12-month period ended June 30 is available at invesco.com/ proxysearch. The information is also available on the SEC website, sec.gov. Invesco Advisers, Inc. is an investment adviser; it provides investment advisory services to individual and institutional clients and does not sell securities. Invesco Distributors, Inc. is the US distributor for Invesco Ltd.’s retail mutual funds, exchange-traded funds and institutional money market funds. Both are wholly owned, indirect subsidiaries of Invesco Ltd. This report must be accompanied or preceded by a currently effective Fund prospectus and variable product prospectus, which contain more complete information, including sales charges and expenses. Investors should read each carefully before investing. NOT FDIC INSURED | MAY LOSE VALUE | NO BANK GUARANTEE |
| |
| | Invesco Distributors, Inc. VK-VIVOPP-AR-1 02072018 1206 |
Management’s Discussion of Fund Performance
Performance summary
For the year ended December 31, 2017, Series I shares of Invesco V.I. Value Opportunities Fund (the Fund) outperformed the S&P 1500 Value Index, the Fund’s style-specific benchmark.
Your Fund’s long-term performance appears later in this report.
Fund vs. Indexes
Total returns, 12/31/16 to 12/31/17, excluding variable product issuer charges.
If variable product issuer charges were included, returns would be lower.
| | | | | |
| Series I Shares* | | | | 17.44 | % |
| Series II Shares* | | | | 17.23 | |
| S&P 500 Index◆ (Broad Market Index) | | | | 21.83 | |
| S&P 1500 Value Index◆ (Style-Specific Index) | | | | 14.99 | |
| Lipper VUF Multi-Cap Value Funds Index∎ (Peer Group Index) | | | | 14.66 | |
Source(s): ▼FactSet Research Systems Inc.; ∎Lipper Inc. *Performance includes litigation proceeds. Had these proceeds not been received, total returns would have been lower. | | | | | |
Market conditions and your Fund
Despite highly destructive hurricanes that threatened to derail a years-long economic recovery, the US economy continued to expand throughout the year ended December 31, 2017. Gross domestic product – the value of all goods and services produced in the US – expanded in the first three quarters of 2017. Inflation remained subdued even as unemployment continued its multiyear decline.
Given signs of an improving economy, the US Federal Reserve (the Fed) raised interest rates three times during the reporting period, most recently in December 2017; each rate hike was 25 basis points.1 (A basis point is 0.01%.) The Fed pledged that “realized and expected economic conditions relative to its objectives of maximum employment and 2 percent inflation” will guide its future actions. At the close of the reporting period, Fed policy remained accommodative, and the fed funds target rate stood at a range of
1.25% to 1.50% – 75 basis points higher than at the start of the reporting period.1 Higher inventories and a worsening outlook caused oil prices and many energy stocks to decline during the first half of 2017. However, oil prices rose significantly in the second half of the reporting period as expectations for lower supplies increased, partly due to continued OPEC production cuts, and demand began normalizing.
Major US stock market indexes repeatedly hit all-time highs throughout the reporting period. The stock market rally that began after the 2016 presidential election continued throughout the reporting period, fueled by generally positive economic data, strong corporate earnings and improved consumer confidence. Finally, after much debate in Congress, a tax reform bill was signed into law in December 2017. While its enactment further strengthened stocks, its effect on the US economy remained uncertain.
During the year, we continued to use our intrinsic value strategy, seeking to create wealth by maintaining a long-term investment horizon and investing in companies that were selling at a significant discount to our estimate of their intrinsic value. We believe intrinsic value represents the fair economic worth of the business. Since our application of this strategy is highly disciplined and relatively unique, it is important to understand the benefits and limitations of our process. First, the investment strategy is intended to preserve your capital while growing it at above-market rates over the long term. Second, our investments have little in common with popular stock market indexes and most of our peers. And third, the Fund’s short-term relative performance will naturally be different from stock market indexes and peers and have little information value since we typically structure the Fund’s portfolio significantly differently than these benchmarks.
Drivers of Fund performance were mainly stock-specific during the reporting period. Financial services companies LPL Financial Holdings and Affiliated Managers Group were among the largest contributors to Fund performance. Shares of these companies rose along with the financials sector during the year. Auto parts company Dana contributed to the Fund’s performance relative to the style-specific benchmark. Dana is a world leader in providing highly-engineered solutions for passenger vehicles, commercial trucks and the off-highway market. Shares of the company rose during the year as the outlook for its end markets improved and the company reported strong financial results.
| | |
| Portfolio Composition |
By sector | % of total net assets |
| | | | | |
| |
| Financials | | | | 43.1% | |
| Health Care | | | | 21.5 | |
| Consumer Discretionary | | | | 11.1 | |
| Information Technology | | | | 9.0 | |
| Industrials | | | | 8.4 | |
| Materials | | | | 2.4 | |
| Real Estate | | | | 2.3 | |
| Energy | | | | 1.1 | |
| Money Market Funds | | | | | |
| Plus Other Assets Less Liabilities | | | | 1.1 | |
|
| Top 10 Equity Holdings* |
% of total net assets |
| | |
| |
1. AECOM | | 4.1% |
2. McKesson Corp. | | 4.0 |
3. JPMorgan Chase & Co. | | 4.0 |
4. Synchrony Financial | | 3.9 |
5. SLM Corp. | | 3.7 |
6. Citigroup Inc. | | 3.7 |
7. Cardinal Health, Inc. | | 3.5 |
8. LPL Financial Holdings, Inc. | | 3.5 |
9. Bank of America Corp. | | 3.4 |
10. Mylan N.V. | | 3.2 |
| | |
| Total Net Assets | | $122.6 million |
| |
| Total Number of Holdings* | | 41 |
The Fund’s holdings are subject to change, and there is no assurance that the Fund will continue to hold any particular security.
*Excluding money market fund holdings.
Data presented here are as of December 31, 2017.
Invesco V.I. Value Opportunities Fund
Property and casualty insurance company AmTrust Financial Services was the largest detractor from the Fund’s performance relative to the style-specific benchmark during the year. AmTrust’s stock price declined after the company restated historical financial statements and increased its loss reserves during the reporting period. Oil and gas exploration and production company Apache was a large detractor from absolute Fund performance. The company’s share price declined, along with the energy sector during the year. Health care sector holding Cardinal Health is a leading distributor of products to health care providers. The company’s stock price declined during the year as it faced near-term profit pressure from the impact of declining generic drug prices and integration issues from a recent acquisition.
We believe the single most important indicator of how the Fund is positioned for potential future success is not our recent investment results nor popular statistical measures, but rather the difference between current market prices and the Fund’s estimated intrinsic value – the aggregate business value of the portfolio based on our estimate of intrinsic value for each individual holding.
At the end of the year, the difference between the market price and the estimated intrinsic value of the Fund was attractive, according to our estimation. While there is no assurance that market value will ever reflect our estimate of the Fund’s intrinsic value, we believe the gap between price and estimated intrinsic value may provide above-average capital appreciation.
We will continue to work hard to protect and grow the Fund’s estimated intrinsic value. We thank you for your investment and for sharing our long-term investment perspective.
1 Source: US Federal Reserve
The views and opinions expressed in management’s discussion of Fund performance are those of Invesco Advisers, Inc. These views and opinions are subject to change at any time based on factors such as market and economic conditions. These views and opinions may not be relied upon as investment advice or recommendations, or as an offer for a particular security. The information is not a complete analysis of every aspect of any market, country, industry, security or the Fund. Statements of fact are from sources considered reliable, but Invesco Advisers, Inc. makes no representation or warranty as to their completeness or accuracy. Although historical performance is no guarantee of future results, these insights may help you understand our investment management philosophy.
See important Fund and, if applicable, index disclosures later in this report.
| | |
 | | R. Canon Coleman II Chartered Financial Analyst, Portfolio Manager, is lead manager of Invesco V.I. Value Opportunities |
Fund. He joined Invesco in 1999. Mr. Coleman earned a BS and an MS in accounting from the University of Florida. He also earned an MBA from the Wharton School of the University of Pennsylvania.
| | |
 | | Jonathan Edwards Chartered Financial Analyst, Portfolio Manager, is lead manager of Invesco V.I. Value Opportunities |
Fund. He joined Invesco in 2001. Mr. Edwards earned a BS in economics from Texas A&M University and an MBA from The University of Texas at
Austin.
| | |
 | | Jonathan Mueller Chartered Financial Analyst, Portfolio Manager, is manager of Invesco V.I. Value Opportunities Fund. |
He joined Invesco in 2001. Mr. Mueller earned a BBA in accounting from Texas Christian University and an MBA in finance from The University of Texas at Austin. He is also a Certified Public Accountant.
Invesco V.I. Value Opportunities Fund
Your Fund’s Long-Term Performance
Results of a $10,000 Investment – Oldest Share Class(es)
Fund and index data from 12/31/07
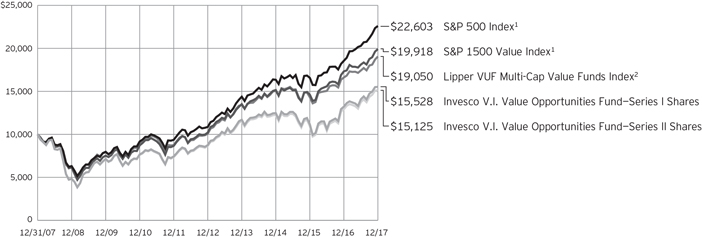
| 1 | Source: FactSet Research Systems Inc. |
Past performance cannot guarantee
comparable future results.
| | | | | |
| Average Annual Total Returns |
As of 12/31/17 | | | | | |
| |
| Series I Shares | | | | | |
| Inception (9/10/01) | | | | 5.06 | % |
| 10 Years | | | | 4.50 | |
| 5 Years | | | | 12.17 | |
| 1 Year | | | | 17.44 | |
| |
| Series II Shares | | | | | |
| Inception (9/10/01) | | | | 4.80 | % |
| 10 Years | | | | 4.22 | |
| 5 Years | | | | 11.86 | |
| 1 Year | | | | 17.23 | |
| Performance includes litigation proceeds. Had these proceeds not been received, total returns would have been lower. | |
The performance of the Fund’s Series I and Series II share classes will differ primarily due to different class expenses.
The performance data quoted represent past performance and cannot guarantee comparable future results; current performance may be lower or higher. Please contact your variable product issuer or financial adviser for the most recent month-end variable product performance. Performance figures reflect Fund expenses, reinvested distributions and changes in
net asset value. Investment return and principal value will fluctuate so that you may have a gain or loss when you sell shares.
The net annual Fund operating expense ratio set forth in the most recent Fund prospectus as of the date of this report for Series I and Series II shares was 0.98% and 1.23%, respectively.1 The total annual Fund operating expense ratio set forth in the most recent Fund prospectus as of the date of this report for Series I and Series II shares was 0.99% and 1.24%, respectively. The expense ratios presented above may vary from the expense ratios presented in other sections of this report that are based on expenses incurred during the period covered by this report.
Invesco V.I. Value Opportunities Fund, a series portfolio of AIM Variable Insurance Funds (Invesco Variable Insurance Funds), is currently offered through insurance companies issuing variable products. You cannot purchase shares of the Fund directly. Performance figures given represent the Fund and are not intended to reflect
actual variable product values. They do not reflect sales charges, expenses and fees assessed in connection with a variable product. Sales charges, expenses and fees, which are determined by the variable product issuers, will vary and will lower the total return.
The most recent month-end performance at the Fund level, excluding variable product charges, is available at 800 451 4246. As mentioned above, for the most recent month-end performance including variable product charges, please contact your variable product issuer or financial adviser.
Fund performance reflects any applicable fee waivers and/or expense reimbursements. Had the adviser not waived fees and/or reimbursed expenses currently or in the past, returns would have been lower. See current prospectus for more information.
| 1 | Total annual Fund operating expenses after any contractual fee waivers and/or expense reimbursements by the adviser in effect through at least June 30, 2019. See current prospectus for more information. |
Invesco V.I. Value Opportunities Fund
Invesco V.I. Value Opportunities Fund’s investment objective is long-term growth of capital.
| ∎ | | Unless otherwise stated, information presented in this report is as of December 31, 2017, and is based on total net assets. |
| ∎ | | Unless otherwise noted, all data provided by Invesco. |
Principal risks of investing in the Fund
Convertible securities risk. The market values of convertible securities are affected by market interest rates, the risk of actual issuer default on interest or principal payments and the value of the underlying common stock into which the convertible security may be converted. Additionally, a convertible security is subject to the same types of market and issuer risks as apply to the underlying common stock. In addition, certain convertible securities are subject to involuntary conversions and may undergo principal write-downs upon the occurrence of certain triggering events, and, as a result, are subject to an increased risk of loss. Convertible securities may be rated below investment grade.
Depositary receipts risk. Investing in depositary receipts involves the same risks as direct investments in foreign securities. In addition, the underlying issuers of certain depositary receipts are under no obligation to distribute shareholder communications or pass through any voting rights with respect to the deposited securities to the holders of such receipts. The Fund may therefore receive less timely information or have less control than if it invested directly in the foreign issuer.
Derivatives risk. The value of a derivative instrument depends largely on (and is derived from) the value of an underlying security, currency, commodity, interest rate, index or other asset (each referred to as an underlying asset). In addition to risks relating to the underlying assets, the use of derivatives may include other, possibly greater, risks, including counterparty, leverage and liquidity risks. Counterparty risk is the risk that the counterparty to the derivative contract will default on its obligation to pay the Fund the amount owed or otherwise perform under the derivative contract. Derivatives create leverage risk because they do not require payment up front equal to the economic exposure created by owning the derivative. As a result, an adverse change in the value of the underlying asset could result in the Fund sustaining a loss that is substantially greater than the amount invested in the derivative, which may make the Fund’s
returns more volatile and increase the risk of loss. Derivative instruments may also be less liquid than more traditional investments and the Fund may be unable to sell or close out its derivative positions at a desirable time or price. This risk may be more acute under adverse market conditions, during which the Fund may be most in need of liquidating its derivative positions. Derivatives may also be harder to value, less tax efficient and subject to changing government regulation that could impact the Fund’s ability to use certain derivatives or their cost. Also, derivatives used for hedging or to gain or limit exposure to a particular market segment may not provide the expected benefits, particularly during adverse market conditions.
Emerging markets securities risk. Emerging markets (also referred to as developing markets) are generally subject to greater market volatility, political, social and economic instability, uncertain trading markets and more governmental limitations on foreign investment than more developed markets. In addition, companies operating in emerging markets may be subject to lower trading volume and greater price fluctuations than companies in more developed markets. Securities law and the enforcement of systems of taxation in many emerging market countries may change quickly and unpredictably. In addition, investments in emerging markets securities may also be subject to additional transaction costs, delays in settlement procedures, and lack of timely information.
Foreign securities risk. The Fund’s foreign investments may be adversely affected by political and social instability, changes in economic or taxation policies, difficulty in enforcing obligations, decreased liquidity or increased volatility. Foreign investments also involve the risk of the possible seizure, nationalization or expropriation of the issuer or foreign deposits (in which the Fund could lose its entire investments in a certain market) and the possible adoption of foreign governmental restrictions such as exchange controls. Unless the Fund has hedged its foreign securities risk, foreign securities risk also involves the risk of negative foreign currency rate fluctuations, which may cause the value of securities denominated in such foreign currency (or other
instruments through which the Fund has exposure to foreign currencies) to decline in value. Currency exchange rates may fluctuate significantly over short periods of time. Currency hedging strategies, if used, are not always successful.
Initial public offerings (IPO) risk. The prices of IPO securities often fluctuate more than prices of securities of companies with longer trading histories and sometimes experience significant price drops shortly after their initial issuance. In addition, companies offering securities in IPOs may have less experienced management or limited operating histories.
Management risk. The Fund is actively managed and depends heavily on the Adviser’s judgment about markets, interest rates or the attractiveness, relative values, liquidity, or potential appreciation of particular investments made for the Fund’s portfolio. The Fund could experience losses if these judgments prove to be incorrect. Additionally, legislative, regulatory, or tax developments may adversely affect management of the Fund and, therefore, the ability of the Fund to achieve its investment objective.
Market risk. The market values of the Fund’s investments, and therefore the value of the Fund’s shares, will go up and down, sometimes rapidly or unpredictably. Market risk may affect a single issuer, industry or section of the economy, or it may affect the market as a whole. Individual stock prices tend to go up and down more dramatically than those of certain other types of investments, such as bonds. During a general downturn in the financial markets, multiple asset classes may decline in value. When markets perform well, there can be no assurance that specific investments held by the Fund will rise in value.
Preferred securities risk. Preferred securities are subject to issuer-specific and market risks applicable generally to equity securities. Preferred securities also may be subordinated to bonds or other debt instruments, subjecting them to a greater risk of non-payment, may be less liquid than many other securities, such as common stocks, and generally offer no voting rights with respect to the issuer.
Real estate investment trust risk/real estate risk. Investments in real estate related instruments may be affected by economic, legal, cultural, environmental
Invesco V.I. Value Opportunities Fund
or technological factors that affect property values, rents or occupancies of real estate related to the Fund’s holdings. Shares of real estate related companies, which tend to be small- and mid-cap companies, may be more volatile and less liquid.
Sector focus risk. The Fund may from time to time invest a significant amount of its assets (i.e. over 25%) in one market sector or group of related industries. In this event, the Fund’s performance will depend to a greater extent on the overall condition of the sector or group of industries and there is increased risk that the Fund will lose significant value if conditions adversely affect that sector or group of industries.
Small- and mid-capitalization companies risks. Small- and mid-capitalization companies tend to be more vulnerable to changing market conditions, may have little or no operating history or track record of success, and may have more limited product lines and markets, less experienced management and fewer financial resources than larger companies. These companies’ securities may be more volatile and less liquid than those of more established companies, and their returns may vary, sometimes significantly, from the overall securities market.
Unseasoned issuer risk. Investments in unseasoned companies or companies with special circumstances often involve much greater risks than are inherent in other types of investments and securities of such companies may be more likely to experience fluctuations in price. In addition, investments made in anticipation of future events may, if the events are delayed or never achieved, cause stock prices to fall.
Value investing style risk. A value investing style subjects the Fund to the risk that the valuations never improve or that the returns on value equity securities are less than returns on other styles of investing or the overall stock market.
About indexes used in this report
The S&P 500® Index is an unmanaged index considered representative of the US stock market.
The S&P 1500® Value Index combines the value stocks of the S&P 500, S&P MidCap 400 and the S&P SmallCap 600 indexes.
The Lipper VUF Multi-Cap Value Funds Index is an unmanaged index considered representative of multicap value variable insurance underlying funds tracked by Lipper.
The S&P MidCap 400® Index seeks to track the performance of mid-cap US equities.
The S&P SmallCap 600® Index measures the small-cap segment of the US equity market.
The Fund is not managed to track the performance of any particular index, including the index(es) described here, and consequently, the performance of the Fund may deviate significantly from the performance of the index(es).
A direct investment cannot be made in an index. Unless otherwise indicated, index results include reinvested dividends, and they do not reflect sales charges. Performance of the peer group, if applicable, reflects fund expenses; performance of a market index does not.
Other information
The returns shown in management’s discussion of Fund performance are based on net asset values calculated for shareholder transactions. Generally accepted accounting principles require adjustments to be made to the net assets of the Fund at period end for financial reporting purposes, and as such, the net asset values for shareholder transactions and the returns based on those net asset values may differ from the net asset values and returns reported in the Financial Highlights. Additionally, the returns and net asset values shown throughout this report are at the Fund level only and do not include variable product issuer charges. If such charges were included, the total returns would be lower.
Industry classifications used in this report are generally according to the Global Industry Classification Standard, which was developed by and is the exclusive property and a service mark of MSCI Inc. and Standard & Poor’s.
Invesco V.I. Value Opportunities Fund
Schedule of Investments(a)
December 31, 2017
| | | | | | | | |
| | | Shares | | | Value | |
Common Stocks–98.86% | |
| Advertising–2.76% | |
Interpublic Group of Cos., Inc. (The) | | | 62,700 | | | $ | 1,264,032 | |
Omnicom Group Inc. | | | 29,115 | | | | 2,120,445 | |
| | | | | | | | 3,384,477 | |
|
| Agricultural & Farm Machinery–0.54% | |
AGCO Corp. | | | 9,189 | | | | 656,370 | |
|
| Asset Management & Custody Banks–4.48% | |
Affiliated Managers Group, Inc. | | | 19,140 | | | | 3,928,485 | |
SEI Investments Co. | | | 21,800 | | | | 1,566,548 | |
| | | | | | | | 5,495,033 | |
|
| Auto Parts & Equipment–2.06% | |
Dana Inc. | | | 79,027 | | | | 2,529,654 | |
|
| Construction & Engineering–4.08% | |
AECOM(b) | | | 134,504 | | | | 4,996,824 | |
|
| Consumer Finance–7.58% | |
SLM Corp.(b) | | | 399,000 | | | | 4,508,700 | |
Synchrony Financial | | | 123,832 | | | | 4,781,154 | |
| | | | | | | | 9,289,854 | |
|
| Diversified Banks–11.02% | |
Bank of America Corp. | | | 141,502 | | | | 4,177,139 | |
Citigroup Inc. | | | 60,272 | | | | 4,484,840 | |
JPMorgan Chase & Co. | | | 45,260 | | | | 4,840,104 | |
| | | | | | | | 13,502,083 | |
|
| Electronic Components–2.73% | |
Belden Inc. | | | 43,356 | | | | 3,345,783 | |
|
| Electronic Equipment & Instruments–2.86% | |
FLIR Systems, Inc. | | | 75,100 | | | | 3,501,162 | |
|
| Electronic Manufacturing Services–0.71% | |
Flex Ltd.(b) | | | 48,265 | | | | 868,287 | |
|
| Health Care Distributors–7.44% | |
Cardinal Health, Inc. | | | 69,200 | | | | 4,239,884 | |
McKesson Corp. | | | 31,300 | | | | 4,881,235 | |
| | | | | | | | 9,121,119 | |
|
| Health Care Facilities–4.86% | |
Acadia Healthcare Co., Inc.(b) | | | 97,500 | | | | 3,181,425 | |
Brookdale Senior Living Inc.(b) | | | 286,151 | | | | 2,775,665 | |
| | | | | | | | 5,957,090 | |
|
| Homebuilding–1.27% | |
D.R. Horton, Inc. | | | 30,600 | | | | 1,562,742 | |
|
| Hotels, Resorts & Cruise Lines–2.19% | |
Norwegian Cruise Line Holdings Ltd.(b) | | | 50,400 | | | | 2,683,800 | |
| | | | | | | | |
| | | Shares | | | Value | |
| Industrial Machinery–2.24% | |
ITT Inc. | | | 51,500 | | | $ | 2,748,555 | |
|
| Investment Banking & Brokerage–7.84% | |
E*TRADE Financial Corp.(b) | | | 54,300 | | | | 2,691,651 | |
LPL Financial Holdings, Inc. | | | 73,993 | | | | 4,227,960 | |
TD Ameritrade Holding Corp. | | | 52,700 | | | | 2,694,551 | |
| | | | | | | | 9,614,162 | |
|
| Leisure Products–2.84% | |
Mattel, Inc. | | | 226,700 | | | | 3,486,646 | |
|
| Life & Health Insurance–3.62% | |
Aflac, Inc. | | | 14,934 | | | | 1,310,907 | |
MetLife, Inc. | | | 61,817 | | | | 3,125,467 | |
| | | | | | | | 4,436,374 | |
|
| Managed Health Care–4.64% | |
Anthem, Inc. | | | 17,600 | | | | 3,960,176 | |
Cigna Corp. | | | 8,500 | | | | 1,726,265 | |
| | | | | | | | 5,686,441 | |
|
| Oil & Gas Exploration & Production–1.11% | |
Apache Corp. | | | 32,100 | | | | 1,355,262 | |
|
| Pharmaceuticals–4.55% | |
Mylan N.V.(b) | | | 93,600 | | | | 3,960,216 | |
Novartis AG (Switzerland) | | | 19,052 | | | | 1,611,295 | |
| | | | | | | | 5,571,511 | |
|
| Property & Casualty Insurance–2.97% | |
AmTrust Financial Services, Inc. | | | 362,017 | | | | 3,645,511 | |
|
| Real Estate Services–2.31% | |
Realogy Holdings Corp. | | | 106,713 | | | | 2,827,894 | |
|
| Regional Banks–2.08% | |
SVB Financial Group(b) | | | 10,900 | | | | 2,548,093 | |
|
| Research & Consulting Services–1.51% | |
Dun & Bradstreet Corp. (The) | | | 15,602 | | | | 1,847,433 | |
|
| Steel–2.38% | |
Allegheny Technologies, Inc.(b) | | | 121,100 | | | | 2,923,354 | |
|
| Systems Software–2.73% | |
Oracle Corp. | | | 70,695 | | | | 3,342,460 | |
|
| Thrifts & Mortgage Finance–3.46% | |
MGIC Investment Corp.(b) | | | 145,521 | | | | 2,053,301 | |
Radian Group Inc. | | | 105,976 | | | | 2,184,166 | |
| | | | | | | | 4,237,467 | |
Total Common Stocks
(Cost $92,067,502) | | | | 121,165,441 | |
See accompanying Notes to Financial Statements which are an integral part of the financial statements.
Invesco V.I. Value Opportunities Fund
| | | | | | | | |
| | | Shares | | | Value | |
Money Market Funds–1.17% | |
Invesco Government & Agency
Portfolio– Institutional Class, 1.18%(c) | | | 501,969 | | | $ | 501,969 | |
Invesco Liquid Assets
Portfolio–Institutional Class, 1.40%(c) | | | 358,437 | | | | 358,473 | |
Invesco Treasury Portfolio–Institutional Class, 1.17%(c) | | | 573,678 | | | | 573,678 | |
Total Money Market Funds
(Cost $1,434,143) | | | | 1,434,120 | |
TOTAL INVESTMENTS IN SECURITIES–100.03% (Cost $93,501,645) | | | | | | | 122,599,561 | |
OTHER ASSETS LESS LIABILITIES–(0.03)% | | | | | | | (39,589 | ) |
NET ASSETS–100.00% | | | | | | $ | 122,559,972 | |
Notes to Schedule of Investments:
| (a) | Industry and/or sector classifications used in this report are generally according to the Global Industry Classification Standard, which was developed by and is the exclusive property and a service mark of MSCI Inc. and Standard & Poor’s. |
| (b) | Non-income producing security. |
| (c) | The money market fund and the Fund are affiliated by having the same investment adviser. The rate shown is the 7-day SEC standardized yield as of December 31, 2017. |
See accompanying Notes to Financial Statements which are an integral part of the financial statements.
Invesco V.I. Value Opportunities Fund
Statement of Assets and Liabilities
December 31, 2017
Statement of Operations
For the year ended December 31, 2017
| | | | |
Assets: | | | | |
Investments in securities, at value (Cost $92,067,502) | | $ | 121,165,441 | |
Investments in affiliated money market funds, at value (Cost $1,434,143) | | | 1,434,120 | |
Foreign currencies, at value (Cost $3,295) | | | 3,448 | |
Receivable for: | | | | |
Fund shares sold | | | 6,010 | |
Dividends | | | 158,581 | |
Investment for trustee deferred compensation and retirement plans | | | 115,054 | |
Total assets | | | 122,882,654 | |
| |
Liabilities: | | | | |
Payable for: | | | | |
Fund shares reacquired | | | 90,760 | |
Accrued fees to affiliates | | | 68,664 | |
Accrued trustees’ and officers’ fees and benefits | | | 622 | |
Accrued other operating expenses | | | 36,782 | |
Trustee deferred compensation and retirement plans | | | 125,854 | |
Total liabilities | | | 322,682 | |
Net assets applicable to shares outstanding | | $ | 122,559,972 | |
| |
Net assets consist of: | | | | |
Shares of beneficial interest | | $ | 83,912,657 | |
Undistributed net investment income | | | 134,447 | |
Undistributed net realized gain | | | 9,414,154 | |
Net unrealized appreciation | | | 29,098,714 | |
| | | $ | 122,559,972 | |
| |
Net Assets: | | | | |
Series I | | $ | 87,231,832 | |
Series II | | $ | 35,328,140 | |
|
Shares outstanding, no par value,
with an unlimited number of shares authorized: | |
Series I | | | 11,511,005 | |
Series II | | | 4,672,647 | |
Series I: | | | | |
Net asset value per share | | $ | 7.58 | |
Series II: | | | | |
Net asset value per share | | $ | 7.56 | |
| | | | |
Investment income: | | | | |
Dividends (net of foreign withholding taxes of $9,465) | | $ | 1,669,288 | |
Dividends from affiliated money market funds | | | 24,078 | |
Total investment income | | | 1,693,366 | |
| |
Expenses: | | | | |
Advisory fees | | | 917,797 | |
Administrative services fees | | | 246,951 | |
Custodian fees | | | 13,164 | |
Distribution fees — Series II | | | 117,594 | |
Transfer agent fees | | | 25,935 | |
Trustees’ and officers’ fees and benefits | | | 22,337 | |
Reports to shareholders | | | 23,385 | |
Professional services fees | | | 47,204 | |
Other | | | 1,419 | |
Total expenses | | | 1,415,786 | |
Less: Fees waived | | | (3,717 | ) |
Net expenses | | | 1,412,069 | |
Net investment income | | | 281,297 | |
| |
Realized and unrealized gain (loss) from: | | | | |
Net realized gain (loss) from: | | | | |
Investment securities | | | 11,545,263 | |
Foreign currencies | | | (2,327 | ) |
| | | | 11,542,936 | |
Change in net unrealized appreciation of: | | | | |
Investment securities | | | 8,195,002 | |
Foreign currencies | | | 5,591 | |
| | | | 8,200,593 | |
Net realized and unrealized gain | | | 19,743,529 | |
Net increase in net assets resulting from operations | | $ | 20,024,826 | |
See accompanying Notes to Financial Statements which are an integral part of the financial statements.
Invesco V.I. Value Opportunities Fund
Statement of Changes in Net Assets
For the years ended December 31, 2017 and 2016
| | | | | | | | |
| | | 2017 | | | 2016 | |
Operations: | | | | | | | | |
Net investment income | | $ | 281,297 | | | $ | 416,610 | |
Net realized gain (loss) | | | 11,542,936 | | | | (1,597,460 | ) |
Change in net unrealized appreciation | | | 8,200,593 | | | | 22,968,571 | |
Net increase in net assets resulting from operations | | | 20,024,826 | | | | 21,787,721 | |
| | |
Distributions to shareholders from net investment income: | | | | | | | | |
Series I | | | (326,616 | ) | | | (313,905 | ) |
Series ll | | | (5,339 | ) | | | (39,335 | ) |
Total distributions from net investment income | | | (331,955 | ) | | | (353,240 | ) |
| | |
Distributions to shareholders from net realized gains: | | | | | | | | |
Series l | | | — | | | | (23,395,971 | ) |
Series ll | | | — | | | | (15,462,579 | ) |
Total distributions from net realized gains | | | — | | | | (38,858,550 | ) |
| | |
Share transactions–net: | | | | | | | | |
Series l | | | (11,866,628 | ) | | | 12,374,483 | |
Series ll | | | (25,426,253 | ) | | | 6,433,390 | |
Net increase (decrease) in net assets resulting from share transactions | | | (37,292,881 | ) | | | 18,807,873 | |
Net increase (decrease) in net assets | | | (17,600,010 | ) | | | 1,383,804 | |
| | |
Net assets: | | | | | | | | |
Beginning of year | | | 140,159,982 | | | | 138,776,178 | |
End of year (includes undistributed net investment income of $134,447 and $186,627, respectively) | | $ | 122,559,972 | | | $ | 140,159,982 | |
Notes to Financial Statements
December 31, 2017
NOTE 1—Significant Accounting Policies
Invesco V.I. Value Opportunities Fund (the “Fund”) is a series portfolio of AIM Variable Insurance Funds (Invesco Variable Insurance Funds) (the “Trust”). The Trust is a Delaware statutory trust registered under the Investment Company Act of 1940, as amended (the “1940 Act”), as an open-end series management investment company consisting of twenty-four separate portfolios, (each constituting a “Fund”). The assets, liabilities and operations of each portfolio are accounted for separately. Information presented in these financial statements pertains only to the Fund. Matters affecting each Fund or class will be voted on exclusively by the shareholders of such Fund or class. Current Securities and Exchange Commission (“SEC”) guidance, however, requires participating insurance companies offering separate accounts to vote shares proportionally in accordance with the instructions of the contract owners whose investments are funded by shares of each Fund or class.
The Fund’s investment objective is long-term growth of capital.
The Fund currently offers two classes of shares, Series I and Series II, both of which are offered to insurance company separate accounts funding variable annuity contracts and variable life insurance policies (“variable products”).
The Fund is an investment company and accordingly follows the investment company accounting and reporting guidance in accordance with Financial Accounting Standards Board Accounting Standards Codification Topic 946, Financial Services — Investment Companies.
The following is a summary of the significant accounting policies followed by the Fund in the preparation of its financial statements.
| A. | Security Valuations — Securities, including restricted securities, are valued according to the following policy. |
A security listed or traded on an exchange (except convertible securities) is valued at its last sales price or official closing price as of the close of the customary trading session on the exchange where the security is principally traded, or lacking any sales or official closing price on a particular day, the security may be valued at the closing bid price on that day. Securities traded in the over-the-counter market are valued based on prices furnished by independent pricing services or market makers. When such securities are valued by an independent pricing service they may be considered fair valued. Futures contracts are valued at the final settlement price set by an exchange on which they are principally traded. Listed options are valued at the mean between the last bid and asked prices from the exchange on which they are principally traded. Options not listed on an exchange are valued by an independent source at the mean between the last bid and asked prices. For purposes of determining net asset value (“NAV”) per share, futures and option contracts generally are valued 15 minutes after the close of the customary trading session of the New York Stock Exchange (“NYSE”).
Investments in open-end and closed-end registered investment companies that do not trade on an exchange are valued at the end-of-day net asset value per share. Investments in open-end and closed-end registered investment companies that trade on an exchange are valued at the last sales price or official closing price as of the close of the customary trading session on the exchange where the security is principally traded.
Invesco V.I. Value Opportunities Fund
Debt obligations (including convertible securities) and unlisted equities are fair valued using an evaluated quote provided by an independent pricing service. Evaluated quotes provided by the pricing service may be determined without exclusive reliance on quoted prices, and may reflect appropriate factors such as institution-size trading in similar groups of securities, developments related to specific securities, dividend rate (for unlisted equities), yield (for debt obligations), quality, type of issue, coupon rate (for debt obligations), maturity (for debt obligations), individual trading characteristics and other market data. Pricing services generally value debt obligations assuming orderly transactions of institutional round lot size, but a fund may hold or transact in the same securities in smaller, odd lot sizes. Odd lots often trade at lower prices than institutional round lots. Debt obligations are subject to interest rate and credit risks. In addition, all debt obligations involve some risk of default with respect to interest and/or principal payments.
Foreign securities’ (including foreign exchange contracts) prices are converted into U.S. dollar amounts using the applicable exchange rates as of the close of the NYSE. If market quotations are available and reliable for foreign exchange-traded equity securities, the securities will be valued at the market quotations. Because trading hours for certain foreign securities end before the close of the NYSE, closing market quotations may become unreliable. If between the time trading ends on a particular security and the close of the customary trading session on the NYSE, events occur that the investment adviser determines are significant and make the closing price unreliable, the Fund may fair value the security. If the event is likely to have affected the closing price of the security, the security will be valued at fair value in good faith using procedures approved by the Board of Trustees.
Adjustments to closing prices to reflect fair value may also be based on a screening process of an independent pricing service to indicate the degree of certainty, based on historical data, that the closing price in the principal market where a foreign security trades is not the current value as of the close of the NYSE. Foreign securities’ prices meeting the approved degree of certainty that the price is not reflective of current value will be priced at the indication of fair value from the independent pricing service. Multiple factors may be considered by the independent pricing service in determining adjustments to reflect fair value and may include information relating to sector indices, American Depositary Receipts and domestic and foreign index futures. Foreign securities may have additional risks including exchange rate changes, potential for sharply devalued currencies and high inflation, political and economic upheaval, the relative lack of issuer information, relatively low market liquidity and the potential lack of strict financial and accounting controls and standards.
Securities for which market prices are not provided by any of the above methods may be valued based upon quotes furnished by independent sources. The last bid price may be used to value equity securities. The mean between the last bid and asked prices is used to value debt obligations, including corporate loans.
Securities for which market quotations are not readily available or became unreliable are valued at fair value as determined in good faith by or under the supervision of the Trust’s officers following procedures approved by the Board of Trustees. Issuer specific events, market trends, bid/asked quotes of brokers and information providers and other market data may be reviewed in the course of making a good faith determination of a security’s fair value.
The Fund may invest in securities that are subject to interest rate risk, meaning the risk that the prices will generally fall as interest rates rise and, conversely, the prices will generally rise as interest rates fall. Specific securities differ in their sensitivity to changes in interest rates depending on their individual characteristics. Changes in interest rates may result in increased market volatility, which may affect the value and/or liquidity of certain Fund investments.
Valuations change in response to many factors including the historical and prospective earnings of the issuer, the value of the issuer’s assets, general economic conditions, interest rates, investor perceptions and market liquidity. Because of the inherent uncertainties of valuation, the values reflected in the financial statements may materially differ from the value received upon actual sale of those investments.
| B. | Securities Transactions and Investment Income — Securities transactions are accounted for on a trade date basis. Realized gains or losses on sales are computed on the basis of specific identification of the securities sold. Interest income (net of withholding tax, if any) is recorded on the accrual basis from settlement date. Dividend income (net of withholding tax, if any) is recorded on the ex-dividend date. |
The Fund may periodically participate in litigation related to Fund investments. As such, the Fund may receive proceeds from litigation settlements. Any proceeds received are included in the Statement of Operations as realized gain (loss) for investments no longer held and as unrealized gain (loss) for investments still held.
Brokerage commissions and mark ups are considered transaction costs and are recorded as an increase to the cost basis of securities purchased and/or a reduction of proceeds on a sale of securities. Such transaction costs are included in the determination of net realized and unrealized gain (loss) from investment securities reported in the Statement of Operations and the Statement of Changes in Net Assets and the net realized and unrealized gains (losses) on securities per share in the Financial Highlights. Transaction costs are included in the calculation of the Fund’s net asset value and, accordingly, they reduce the Fund’s total returns. These transaction costs are not considered operating expenses and are not reflected in net investment income reported in the Statement of Operations and the Statement of Changes in Net Assets, or the net investment income per share and the ratios of expenses and net investment income reported in the Financial Highlights, nor are they limited by any expense limitation arrangements between the Fund and the investment adviser.
The Fund allocates income and realized and unrealized capital gains and losses to a class based on the relative net assets of each class.
| C. | Country Determination — For the purposes of making investment selection decisions and presentation in the Schedule of Investments, the investment adviser may determine the country in which an issuer is located and/or credit risk exposure based on various factors. These factors include the laws of the country under which the issuer is organized, where the issuer maintains a principal office, the country in which the issuer derives 50% or more of its total revenues and the country that has the primary market for the issuer’s securities, as well as other criteria. Among the other criteria that may be evaluated for making this determination are the country in which the issuer maintains 50% or more of its assets, the type of security, financial guarantees and enhancements, the nature of the collateral and the sponsor organization. Country of issuer and/or credit risk exposure has been determined to be the United States of America, unless otherwise noted. |
| D. | Distributions — Distributions from net investment income and net realized capital gain, if any, are generally declared and paid to separate accounts of participating insurance companies annually and recorded on the ex-dividend date. |
| E. | Federal Income Taxes — The Fund intends to comply with the requirements of Subchapter M of the Internal Revenue Code of 1986, as amended (the “Internal Revenue Code”), necessary to qualify as a regulated investment company and to distribute substantially all of the Fund’s |
Invesco V.I. Value Opportunities Fund
| | taxable earnings to shareholders. As such, the Fund will not be subject to federal income taxes on otherwise taxable income (including net realized capital gain) that is distributed to shareholders. Therefore, no provision for federal income taxes is recorded in the financial statements. |
The Fund recognizes the tax benefits of uncertain tax positions only when the position is more likely than not to be sustained. Management has analyzed the Fund’s uncertain tax positions and concluded that no liability for unrecognized tax benefits should be recorded related to uncertain tax positions. Management is not aware of any tax positions for which it is reasonably possible that the total amounts of unrecognized tax benefits will change materially in the next 12 months.
The Fund files tax returns in the U.S. Federal jurisdiction and certain other jurisdictions. Generally, the Fund is subject to examinations by such taxing authorities for up to three years after the filing of the return for the tax period.
| F. | Expenses — Fees provided for under the Rule 12b-1 plan of a particular class of the Fund and which are directly attributable to that class are charged to the operations of such class. All other expenses are allocated among the classes based on relative net assets. |
| G. | Accounting Estimates — The preparation of financial statements in conformity with accounting principles generally accepted in the United States of America (“GAAP”) requires management to make estimates and assumptions that affect the reported amounts of assets and liabilities at the date of the financial statements and the reported amounts of revenues and expenses during the reporting period including estimates and assumptions related to taxation. Actual results could differ from those estimates by a significant amount. In addition, the Fund monitors for material events or transactions that may occur or become known after the period-end date and before the date the financial statements are released to print. |
| H. | Indemnifications — Under the Trust’s organizational documents, each Trustee, officer, employee or other agent of the Trust is indemnified against certain liabilities that may arise out of the performance of their duties to the Fund. Additionally, in the normal course of business, the Fund enters into contracts, including the Fund’s servicing agreements, that contain a variety of indemnification clauses. The Fund’s maximum exposure under these arrangements is unknown as this would involve future claims that may be made against the Fund that have not yet occurred. The risk of material loss as a result of such indemnification claims is considered remote. |
| I. | Foreign Currency Translations — Foreign currency is valued at the close of the NYSE based on quotations posted by banks and major currency dealers. Portfolio securities and other assets and liabilities denominated in foreign currencies are translated into U.S. dollar amounts at date of valuation. Purchases and sales of portfolio securities (net of foreign taxes withheld on disposition) and income items denominated in foreign currencies are translated into U.S. dollar amounts on the respective dates of such transactions. The Fund does not separately account for the portion of the results of operations resulting from changes in foreign exchange rates on investments and the fluctuations arising from changes in market prices of securities held. The combined results of changes in foreign exchange rates and the fluctuation of market prices on investments (net of estimated foreign tax withholding) are included with the net realized and unrealized gain or loss from investments in the Statement of Operations. Reported net realized foreign currency gains or losses arise from (1) sales of foreign currencies, (2) currency gains or losses realized between the trade and settlement dates on securities transactions, and (3) the difference between the amounts of dividends, interest, and foreign withholding taxes recorded on the Fund’s books and the U.S. dollar equivalent of the amounts actually received or paid. Net unrealized foreign currency gains and losses arise from changes in the fair values of assets and liabilities, other than investments in securities at fiscal period end, resulting from changes in exchange rates. |
The Fund may invest in foreign securities, which may be subject to foreign taxes on income, gains on investments or currency repatriation, a portion of which may be recoverable. Foreign taxes, if any, are recorded based on the tax regulations and rates that exist in the foreign markets in which the Fund invests and are shown in the Statement of Operations.
| J. | Forward Foreign Currency Contracts — The Fund may engage in foreign currency transactions either on a spot (i.e. for prompt delivery and settlement) basis, or through forward foreign currency contracts, to manage or minimize currency or exchange rate risk. |
The Fund may also enter into forward foreign currency contracts for the purchase or sale of a security denominated in a foreign currency in order to “lock in” the U.S. dollar price of that security, or the Fund may also enter into forward foreign currency contracts that do not provide for physical settlement of the two currencies, but instead are settled by a single cash payment calculated as the difference between the agreed upon exchange rate and the spot rate at settlement based upon an agreed upon notional amount (non-deliverable forwards). The Fund will set aside liquid assets in an amount equal to the daily mark-to-market obligation for forward foreign currency contracts.
A forward foreign currency contract is an obligation between two parties (“Counterparties”) to purchase or sell a specific currency for an agreed-upon price at a future date. The use of forward foreign currency contracts does not eliminate fluctuations in the price of the underlying securities the Fund owns or intends to acquire but establishes a rate of exchange in advance. Fluctuations in the value of these contracts are measured by the difference in the contract date and reporting date exchange rates and are recorded as unrealized appreciation (depreciation) until the contracts are closed. When the contracts are closed, realized gains (losses) are recorded. Realized and unrealized gains (losses) on the contracts are included in the Statement of Operations. The primary risks associated with forward foreign currency contracts include failure of the Counterparty to meet the terms of the contract and the value of the foreign currency changing unfavorably. These risks may be in excess of the amounts reflected in the Statement of Assets and Liabilities.
Invesco V.I. Value Opportunities Fund
NOTE 2—Advisory Fees and Other Fees Paid to Affiliates
The Trust has entered into a master investment advisory agreement with Invesco Advisers, Inc. (the “Adviser” or “Invesco”). Under the terms of the investment advisory agreement, the Fund accrues daily and pays monthly an advisory fee to the Adviser based on the annual rate of the Fund’s average daily net assets as follows:
| | | | | | | | |
| Average Daily Net Assets | | Rate | |
First $250 million | | | 0 | .695% | | | | |
Next $250 million | | | 0 | .67% | | | | |
Next $500 million | | | 0 | .645% | | | | |
Next $1.5 billion | | | 0 | .62% | | | | |
Next $2.5 billion | | | 0 | .595% | | | | |
Next $2.5 billion | | | 0 | .57% | | | | |
Next $2.5 billion | | | 0 | .545% | | | | |
Over $10 billion | | | 0 | .52% | | | | |
For the year ended December 31, 2017, the effective advisory fees incurred by the Fund was 0.695%.
Under the terms of a master sub-advisory agreement between the Adviser and each of Invesco Asset Management Deutschland GmbH, Invesco Asset Management Limited, Invesco Asset Management (Japan) Limited, Invesco Hong Kong Limited, Invesco Senior Secured Management, Inc. and Invesco Canada Ltd. and separate sub-advisory agreements with Invesco PowerShares Capital Management LLC and Invesco Asset Management (India) Private Limited (collectively, the “Affiliated Sub-Advisers”) the Adviser, not the Fund, will pay 40% of the fees paid to the Adviser to any such Affiliated Sub-Adviser(s) that provide(s) discretionary investment management services to the Fund based on the percentage of assets allocated to such Affiliated Sub-Adviser(s).
The Adviser has contractually agreed, through at least June 30, 2018, to waive advisory fees and/or reimburse expenses of all shares to the extent necessary to limit total annual fund operating expenses after fee waiver and/or expense reimbursement (excluding certain items discussed below) of Series I shares to 2.00% and Series II shares to 2.25% of average daily net assets (the “expense limits”). In determining the Adviser’s obligation to waive advisory fees and/or reimburse expenses, the following expenses are not taken into account, and could cause the total annual fund operating expenses after fee waiver and/or expense reimbursement to exceed the numbers reflected above: (1) interest; (2) taxes; (3) dividend expense on short sales; (4) extraordinary or non-routine items, including litigation expenses; and (5) expenses that the Fund has incurred but did not actually pay because of an expense offset arrangement. Unless Invesco continues the fee waiver agreement, it will terminate on June 30, 2018. During its term, the fee waiver agreement cannot be terminated or amended to increase expense limits or reduce the advisory fee waiver without approval of the Board of Trustees. The Adviser did not waive fees and/or reimburse expenses during the period under these expense limits.
Further, the Adviser has contractually agreed, through at least June 30, 2019, to waive the advisory fee payable by the Fund in an amount equal to 100% of the net advisory fees the Adviser receives from the affiliated money market funds on investments by the Fund of uninvested cash (excluding investments of cash collateral from securities lending) in such affiliated money market funds.
For the year ended December 31, 2017, the Adviser waived advisory fees of $3,717.
The Trust has entered into a master administrative services agreement with Invesco pursuant to which the Fund has agreed to pay Invesco a fee for costs incurred in providing accounting services and fund administrative services to the Fund and to reimburse Invesco for fees paid to insurance companies that have agreed to provide certain administrative services to the Fund. These administrative services provided by the insurance companies may include, among other things: maintenance of master accounts with the Fund; tracking, recording and transmitting net purchase and redemption orders for Fund shares; maintaining and preserving records related to the purchase, redemption and other account activity of variable product owners; distributing copies of Fund documents such as prospectuses, proxy materials and periodic reports, to variable product owners, and responding to inquiries from variable product owners about the Fund. Pursuant to such agreement, for the year ended December 31, 2017, Invesco was paid $50,000 for accounting and fund administrative services and was reimbursed $196,951 for fees paid to insurance companies.
The Trust has entered into a transfer agency and service agreement with Invesco Investment Services, Inc. (“IIS”) pursuant to which the Fund has agreed to pay IIS a fee for providing transfer agency and shareholder services to the Fund and reimburse IIS for certain expenses incurred by IIS in the course of providing such services. For the year ended December 31, 2017, expenses incurred under the agreement are shown in the Statement of Operations as Transfer agent fees.
The Trust has entered into a master distribution agreement with Invesco Distributors, Inc. (“IDI”) to serve as the distributor for the Fund. The Trust has adopted a plan pursuant to Rule 12b-1 under the 1940 Act with respect to the Fund’s Series II shares (the “Plan”). The Fund, pursuant to the Plan, pays IDI compensation at the annual rate of 0.25% of the Fund’s average daily net assets of Series II shares. The fees are accrued daily and paid monthly. Of the Plan payments, up to 0.25% of the average daily net assets of the Series II shares may be paid to insurance companies who furnish continuing personal shareholder services to customers who purchase and own Series II shares of the Fund. For the year ended December 31, 2017, expenses incurred under the Plan are detailed in the Statement of Operations as Distribution fees.
For the year ended December 31, 2017, the Fund incurred $4,643 in brokerage commissions with Invesco Capital Markets, Inc., an affiliate of the Adviser and IDI, for portfolio transactions executed on behalf of the Fund.
Certain officers and trustees of the Trust are officers and directors of the Adviser, IIS and/or IDI.
Invesco V.I. Value Opportunities Fund
NOTE 3—Additional Valuation Information
GAAP defines fair value as the price that would be received to sell an asset or paid to transfer a liability in an orderly transaction between market participants at the measurement date, under current market conditions. GAAP establishes a hierarchy that prioritizes the inputs to valuation methods, giving the highest priority to readily available unadjusted quoted prices in an active market for identical assets (Level 1) and the lowest priority to significant unobservable inputs (Level 3), generally when market prices are not readily available or are unreliable. Based on the valuation inputs, the securities or other investments are tiered into one of three levels. Changes in valuation methods may result in transfers in or out of an investment’s assigned level:
| | Level 1 — | Prices are determined using quoted prices in an active market for identical assets. |
| | Level 2 — | Prices are determined using other significant observable inputs. Observable inputs are inputs that other market participants may use in pricing a security. These may include quoted prices for similar securities, interest rates, prepayment speeds, credit risk, yield curves, loss severities, default rates, discount rates, volatilities and others. |
| | Level 3 — | Prices are determined using significant unobservable inputs. In situations where quoted prices or observable inputs are unavailable (for example, when there is little or no market activity for an investment at the end of the period), unobservable inputs may be used. Unobservable inputs reflect the Fund’s own assumptions about the factors market participants would use in determining fair value of the securities or instruments and would be based on the best available information. |
As of December 31, 2017, all of the securities in this Fund were valued based on Level 1 inputs (see the Schedule of Investments for security categories). The level assigned to the securities valuations may not be an indication of the risk or liquidity associated with investing in those securities. Because of the inherent uncertainties of valuation, the values reflected in the financial statements may materially differ from the value received upon actual sale of those investments.
The Fund’s policy is to recognize transfers in and out of the valuation levels as of the end of the reporting period. During the year ended December 31, 2017, there were no material transfers between valuation levels.
NOTE 4—Trustees’ and Officers’ Fees and Benefits
Trustees’ and Officers’ Fees and Benefits include amounts accrued by the Fund to pay remuneration to certain Trustees and Officers of the Fund. Trustees have the option to defer compensation payable by the Fund, and Trustees’ and Officers’ Fees and Benefits also include amounts accrued by the Fund to fund such deferred compensation amounts. Those Trustees who defer compensation have the option to select various Invesco Funds in which their deferral accounts shall be deemed to be invested. Finally, certain current Trustees were eligible to participate in a retirement plan that provided for benefits to be paid upon retirement to Trustees over a period of time based on the number of years of service. The Fund may have certain former Trustees who also participate in a retirement plan and receive benefits under such plan. Trustees’ and Officers’ Fees and Benefits include amounts accrued by the Fund to fund such retirement benefits. Obligations under the deferred compensation and retirement plans represent unsecured claims against the general assets of the Fund.
NOTE 5—Cash Balances
The Fund is permitted to temporarily carry a negative or overdrawn balance in its account with State Street Bank and Trust Company, the custodian bank. Such balances, if any at period-end, are shown in the Statement of Assets and Liabilities under the payable caption Amount due custodian. To compensate the custodian bank for such overdrafts, the overdrawn Fund may either (1) leave funds as a compensating balance in the account so the custodian bank can be compensated by earning the additional interest; or (2) compensate by paying the custodian bank at a rate agreed upon by the custodian bank and Invesco, not to exceed the contractually agreed upon rate.
Invesco V.I. Value Opportunities Fund
NOTE 6—Distributions to Shareholders and Tax Components of Net Assets
Tax Character of Distributions to Shareholders Paid During the Fiscal Years Ended December 31, 2017 and 2016:
| | | | | | | | |
| | | 2017 | | | 2016 | |
Ordinary income | | $ | 331,955 | | | $ | 615,315 | |
Long-term capital gain | | | — | | | | 38,596,475 | |
Total distributions | | $ | 331,955 | | | $ | 39,211,790 | |
Tax Components of Net Assets at Period-End:
| | | | |
| | | 2017 | |
Undistributed ordinary income | | $ | 1,025,352 | |
Undistributed long-term gain | | | 9,348,002 | |
Net unrealized appreciation — investments | | | 28,381,920 | |
Net unrealized appreciation — foreign currencies | | | 798 | |
Temporary book/tax differences | | | (108,757 | ) |
Shares of beneficial interest | | | 83,912,657 | |
Total net assets | | $ | 122,559,972 | |
The difference between book-basis and tax-basis unrealized appreciation (depreciation) is due to differences in the timing of recognition of gains and losses on investments for tax and book purposes. The Fund’s net unrealized appreciation difference is attributable primarily to wash sales.
The temporary book/tax differences are a result of timing differences between book and tax recognition of income and/or expenses. The Fund’s temporary book/tax differences are the result of the trustee deferral of compensation and retirement plan benefits.
Capital loss carryforward is calculated and reported as of a specific date. Results of transactions and other activity after that date may affect the amount of capital loss carryforward actually available for the Fund to utilize. Capital losses generated in years beginning after December 22, 2010 can be carried forward for an unlimited period, whereas previous losses expire in eight tax years. Capital losses with an expiration period may not be used to offset capital gains until all net capital losses without an expiration date have been utilized. Capital loss carryforwards with no expiration date will retain their character as either short-term or long-term capital losses instead of as short-term capital losses as under prior law. The ability to utilize capital loss carryforwards in the future may be limited under the Internal Revenue Code and related regulations based on the results of future transactions.
The Fund does not have a capital loss carryforward as of December 31, 2017.
NOTE 7—Investment Transactions
The aggregate amount of investment securities (other than short-term securities, U.S. Treasury obligations and money market funds, if any) purchased and sold by the Fund during the year ended December 31, 2017 was $35,500,933 and $70,184,048, respectively. Cost of investments, including any derivatives, on a tax basis includes the adjustments for financial reporting purposes as of the most recently completed federal income tax reporting period-end.
| | | | |
| Unrealized Appreciation (Depreciation) of Investments on a Tax Basis | |
Aggregate unrealized appreciation of investments | | $ | 34,738,733 | |
Aggregate unrealized (depreciation) of investments | | | (6,356,813 | ) |
Net unrealized appreciation of investments | | $ | 28,381,920 | |
Cost of investments for tax purposes is $94,217,641.
NOTE 8—Reclassification of Permanent Differences
Primarily as a result of differing book/tax treatment of foreign currency transactions and fair fund settlement, on December 31, 2017, undistributed net investment income was decreased by $1,522 and undistributed net realized gain was increased by $1,522. This reclassification had no effect on the net assets of the Fund.
Invesco V.I. Value Opportunities Fund
NOTE 9—Share Information
| | | | | | | | | | | | | | | | |
| | | Summary of Share Activity | |
| | | Years ended December 31, | |
| | | 2017(a) | | | 2016 | |
| | | Shares | | | Amount | | | Shares | | | Amount | |
Sold: | | | | | | | | | | | | | | | | |
Series I | | | 691,703 | | | $ | 4,815,992 | | | | 639,701 | | | $ | 4,362,558 | |
Series II | | | 249,911 | | | | 1,718,280 | | | | 159,359 | | | | 1,120,628 | |
| | | | |
Issued as reinvestment of dividends: | | | | | | | | | | | | | | | | |
Series I | | | 46,527 | | | | 326,616 | | | | 4,109,164 | | | | 23,709,875 | |
Series II | | | 762 | | | | 5,339 | | | | 2,691,304 | | | | 15,501,915 | |
| | | | |
Reacquired: | | | | | | | | | | | | | | | | |
Series I | | | (2,465,512 | ) | | | (17,009,236 | ) | | | (2,235,453 | ) | | | (15,697,950 | ) |
Series II | | | (4,012,341 | ) | | | (27,149,872 | ) | | | (1,457,745 | ) | | | (10,189,153 | ) |
Net increase (decrease) in share activity | | | (5,488,950 | ) | | $ | (37,292,881 | ) | | | 3,906,330 | | | $ | 18,807,873 | |
| (a) | There are entities that are record owners of more than 5% of the outstanding shares of the Fund and in the aggregate own 61% of the outstanding shares of the Fund. The Fund and the Fund’s principal underwriter or adviser, are parties to participation agreements with these entities whereby these entities sell units of interest in separate accounts funding variable products that are invested in the Fund. The Fund, Invesco and/or Invesco affiliates may make payments to these entities, which are considered to be related to the Fund, for providing services to the Fund, Invesco and/or Invesco affiliates including but not limited to services such as, securities brokerage, third party record keeping and account servicing and administrative services. The Fund has no knowledge as to whether all or any portion of the shares owned of record by these entities are also owned beneficially. |
NOTE 10—Financial Highlights
The following schedule presents financial highlights for a share of the Fund outstanding throughout the periods indicated.
| | | | | | | | | | | | | | | | | | | | | | | | | | | | | | | | | | | | | | | | | | | | | | | | | | | | | | | | |
| | | Net asset
value,
beginning
of period | | | Net
investment
income(a) | | | Net gains
(losses)
on securities
(both
realized and
unrealized) | | | Total from
investment
operations | | | Dividends
from net
investment
income | | | Distributions
from net
realized
gains | | | Total
distributions | | | Net asset
value, end
of period | | | Total
return(b) | | | Net assets,
end of period
(000’s omitted) | | | Ratio of
expenses
to average net assets
with fee waivers
and/or expenses
absorbed | | | Ratio of
expenses
to average net
assets without
fee waivers
and/or expenses
absorbed | | | Ratio of net
investment
income
to average
net assets | | | Portfolio
turnover(c) | |
Series I | |
Year ended 12/31/17 | | $ | 6.48 | | | $ | 0.02 | | | $ | 1.11 | (d) | | $ | 1.13 | | | $ | (0.03 | ) | | $ | — | | | $ | (0.03 | ) | | $ | 7.58 | | | | 17.44 | %(d) | | $ | 87,232 | | | | 0.98 | %(e) | | | 0.98 | %(e) | | | 0.30 | %(e) | | | 28 | % |
Year ended 12/31/16 | | | 7.82 | | | | 0.03 | | | | 1.10 | | | | 1.13 | | | | (0.03 | ) | | | (2.44 | ) | | | (2.47 | ) | | | 6.48 | | | | 18.34 | | | | 85,722 | | | | 1.01 | | | | 1.02 | | | | 0.43 | | | | 36 | |
Year ended 12/31/15 | | | 9.84 | | | | 0.05 | | | | (1.09 | ) | | | (1.04 | ) | | | (0.26 | ) | | | (0.72 | ) | | | (0.98 | ) | | | 7.82 | | | | (10.40 | ) | | | 83,889 | | | | 1.04 | | | | 1.04 | | | | 0.51 | | | | 82 | |
Year ended 12/31/14 | | | 9.36 | | | | 0.18 | (f) | | | 0.44 | | | | 0.62 | | | | (0.14 | ) | | | — | | | | (0.14 | ) | | | 9.84 | | | | 6.62 | | | | 110,865 | | | | 1.03 | | | | 1.04 | | | | 1.87 | (f) | | | 15 | |
Year ended 12/31/13 | | | 7.10 | | | | 0.10 | | | | 2.28 | | | | 2.38 | | | | (0.12 | ) | | | — | | | | (0.12 | ) | | | 9.36 | | | | 33.75 | | | | 130,146 | | | | 1.01 | | | | 1.02 | | | | 1.24 | | | | 17 | |
Series II | | | | | | | | | | | | | | | | | | | | | | | | | | | | | | | | | | | | | | | | | | | | | | | | | | | | | | | | |
Year ended 12/31/17 | | | 6.45 | | | | 0.00 | | | | 1.11 | (d) | | | 1.11 | | | | 0.00 | | | | — | | | | 0.00 | | | | 7.56 | | | | 17.23 | (d) | | | 35,328 | | | | 1.23 | (e) | | | 1.23 | (e) | | | 0.05 | (e) | | | 28 | |
Year ended 12/31/16 | | | 7.79 | | | | 0.01 | | | | 1.10 | | | | 1.11 | | | | (0.01 | ) | | | (2.44 | ) | | | (2.45 | ) | | | 6.45 | | | | 17.92 | | | | 54,438 | | | | 1.26 | | | | 1.27 | | | | 0.18 | | | | 36 | |
Year ended 12/31/15 | | | 9.79 | | | | 0.02 | | | | (1.08 | ) | | | (1.06 | ) | | | (0.22 | ) | | | (0.72 | ) | | | (0.94 | ) | | | 7.79 | | | | (10.65 | ) | | | 54,887 | | | | 1.29 | | | | 1.29 | | | | 0.26 | | | | 82 | |
Year ended 12/31/14 | | | 9.31 | | | | 0.15 | (f) | | | 0.44 | | | | 0.59 | | | | (0.11 | ) | | | — | | | | (0.11 | ) | | | 9.79 | | | | 6.39 | | | | 80,217 | | | | 1.28 | | | | 1.29 | | | | 1.62 | (f) | | | 15 | |
Year ended 12/31/13 | | | 7.07 | | | | 0.08 | | | | 2.26 | | | | 2.34 | | | | (0.10 | ) | | | — | | | | (0.10 | ) | | | 9.31 | | | | 33.27 | | | | 103,800 | | | | 1.26 | | | | 1.27 | | | | 0.99 | | | | 17 | |
| (a) | Calculated using average shares outstanding. |
| (b) | Includes adjustments in accordance with accounting principles generally accepted in the United States of America and as such, the net asset value for financial reporting purposes and the returns based upon those net asset values may differ from the net asset value and returns for shareholder transactions. Total returns are not annualized for periods less than one year, if applicable, and do not reflect charges assessed in connection with a variable product, which if included would reduce total returns. |
| (c) | Portfolio turnover is calculated at the fund level and is not annualized for periods less than one year, if applicable. |
| (d) | Includes litigation proceeds received during the period. Had these litigation proceeds not been received, Net gains (losses) on securities (both realized and unrealized) per share would have been $1.09 and $1.09. Total returns would have been lower. |
| (e) | Ratios are based on average daily net assets (000’s omitted) of $85,019 and $47,038 for Series I and Series II shares, respectively. |
| (f) | Net Investment income per share and the ratio of net investment income to average net assets include significant dividends received during the year ended December 31, 2014. Net Investment income per share and the ratio of net investment income to average net assets excluding the significant dividends are $0.12 and 1.23% and $0.09 and 0.98% for Series I and Series II, respectively. |
Invesco V.I. Value Opportunities Fund
Report of Independent Registered Public Accounting Firm
To the Board of Trustees of AIM Variable Insurance Funds (Invesco Variable Insurance Funds)
and Shareholders of Invesco V.I. Value Opportunities Fund
Opinion on the Financial Statements
We have audited the accompanying statement of assets and liabilities, including the schedule of investments, of Invesco V.I. Value Opportunities Fund (one of the funds constituting AIM Variable Insurance Funds (Invesco Variable Insurance Funds), hereafter referred to as the “Fund”) as of December 31, 2017, the related statement of operations for the year ended December 31, 2017, the statement of changes in net assets for each of the two years in the period ended December 31, 2017, including the related notes, and the financial highlights for each of the five years in the period ended December 31, 2017 (collectively referred to as the “financial statements”). In our opinion, the financial statements present fairly, in all material respects, the financial position of the Fund as of December 31, 2017, the results of its operations for the year then ended, the changes in its net assets for each of the two years in the period ended December 31, 2017 and the financial highlights for each of the five years in the period ended December 31, 2017 in conformity with accounting principles generally accepted in the United States of America.
Basis for Opinion
These financial statements are the responsibility of the Fund’s management. Our responsibility is to express an opinion on the Fund’s financial statements based on our audits. We are a public accounting firm registered with the Public Company Accounting Oversight Board (United States) (“PCAOB”) and are required to be independent with respect to the Fund in accordance with the U.S. federal securities laws and the applicable rules and regulations of the Securities and Exchange Commission and the PCAOB.
We conducted our audits of these financial statements in accordance with the standards of the PCAOB. Those standards require that we plan and perform the audit to obtain reasonable assurance about whether the financial statements are free of material misstatement, whether due to error or fraud.
Our audits included performing procedures to assess the risks of material misstatement of the financial statements, whether due to error or fraud, and performing procedures that respond to those risks. Such procedures included examining, on a test basis, evidence regarding the amounts and disclosures in the financial statements. Our audits also included evaluating the accounting principles used and significant estimates made by management, as well as evaluating the overall presentation of the financial statements. Our procedures included confirmation of securities owned as of December 31, 2017 by correspondence with the custodian and transfer agent. We believe that our audits provide a reasonable basis for our opinion.
PricewaterhouseCoopers LLP
Houston, TX
February 14, 2018
We have served as the auditor of one or more of the investment companies in the Invesco/PowerShares group of investment companies since at least 1995. We have not determined the specific year we began serving as auditor.
Invesco V.I. Value Opportunities Fund
Calculating your ongoing Fund expenses
Example
As a shareholder of the Fund, you incur ongoing costs, including management fees; distribution and/or service fees (12b-1); and other Fund expenses. This example is intended to help you understand your ongoing costs (in dollars) of investing in the Fund and to compare these costs with ongoing costs of investing in other mutual funds. The example is based on an investment of $1,000 invested at the beginning of the period and held for the entire period July 1, 2017 through December 31, 2017.
The actual and hypothetical expenses in the examples below do not represent the effect of any fees or other expenses assessed in connection with a variable product; if they did, the expenses shown would be higher while the ending account values shown would be lower.
Actual expenses
The table below provides information about actual account values and actual expenses. You may use the information in this table, together with the amount you invested, to estimate the expenses that you paid over the period. Simply divide your account value by $1,000 (for example, an $8,600 account value divided by $1,000 = 8.6), then multiply the result by the number in the table under the heading entitled “Actual Expenses Paid During Period” to estimate the expenses you paid on your account during this period.
Hypothetical example for comparison purposes
The table below also provides information about hypothetical account values and hypothetical expenses based on the Fund’s actual expense ratio and an assumed rate of return of 5% per year before expenses, which is not the Fund’s actual return.
The hypothetical account values and expenses may not be used to estimate the actual ending account balance or expenses you paid for the period. You may use this information to compare the ongoing costs of investing in the Fund and other funds. To do so, compare this 5% hypothetical example with the 5% hypothetical examples that appear in the shareholder reports of the other funds.
Please note that the expenses shown in the table are meant to highlight your ongoing costs. Therefore, the hypothetical information is useful in comparing ongoing costs, and will not help you determine the relative total costs of owning different funds.
| | | | | | | | | | | | | | | | | | | | | | | | |
| Class | | Beginning
Account Value
(07/01/17) | | | ACTUAL | | | HYPOTHETICAL (5% annual return before expenses) | | | Annualized
Expense Ratio | |
| | | Ending
Account Value
(12/31/17)1 | | | Expenses
Paid During
Period2 | | | Ending
Account Value
(12/31/17) | | | Expenses
Paid During
Period2 | | |
| Series I | | $ | 1,000.00 | | | $ | 1,102.90 | | | $ | 5.19 | | | $ | 1,020.27 | | | $ | 4.99 | | | | 0.98 | % |
| Series II | | | 1,000.00 | | | | 1,100.60 | | | | 6.51 | | | | 1,019.00 | | | | 6.26 | | | | 1.23 | |
| 1 | The actual ending account value is based on the actual total return of the Fund for the period July 1, 2017 through December 31, 2017, after actual expenses and will differ from the hypothetical ending account value which is based on the Fund’s expense ratio and a hypothetical annual return of 5% before expenses. |
| 2 | Expenses are equal to the Fund’s annualized expense ratio as indicated above multiplied by the average account value over the period, multiplied by 184/365 to reflect the most recent fiscal half year. |
Invesco V.I. Value Opportunities Fund
Tax Information
Form 1099-DIV, Form 1042-S and other year-end tax information provide shareholders with actual calendar year amounts that should be included in their tax returns. Shareholders should consult their tax advisors.
The following distribution information is being provided as required by the Internal Revenue Code or to meet a specific state’s requirement.
The Fund designates the following amounts or, if subsequently determined to be different, the maximum amount allowable for its fiscal year ended December 31, 2017:
| | | | |
Federal and State Income Tax | |
Corporate Dividends Received Deduction* | | | 100 | % |
U.S. Treasury Obligations* | | | 0 | % |
| | * | The above percentages are based on ordinary income dividends paid to shareholders during the Fund’s fiscal year. |
Invesco V.I. Value Opportunities Fund
Trustees and Officers
The address of each trustee and officer is AIM Variable Insurance Funds (Invesco Variable Insurance Funds) (the “Trust”), 11 Greenway Plaza, Suite 1000, Houston, Texas 77046-1173. The trustees serve for the life of the Trust, subject to their earlier death, incapacitation, resignation, retirement or removal as more specifically provided in the Trust’s organizational documents. Each officer serves for a one year term or until their successors are elected and qualified. Column two below includes length of time served with predecessor entities, if any.
| | | | | | | | |
Name, Year of Birth and
Position(s) Held with the Trust | | Trustee and/
or Officer Since | | Principal Occupation(s)
During Past 5 Years | | Number of
Funds in Fund
Complex
Overseen by
Trustee | | Other Directorship(s)
Held by Trustee During
Past 5 Years |
| Interested Persons | | | | | | | | |
Martin L. Flanagan1 — 1960 Trustee | | 2007 | | Executive Director, Chief Executive Officer and President, Invesco Ltd. (ultimate parent of Invesco and a global investment management firm); Trustee, The Invesco Funds; Vice Chair, Investment Company Institute; and Member of Executive Board, SMU Cox School of Business Formerly: Advisor to the Board, Invesco Advisers, Inc. (formerly known as Invesco Institutional (N.A.), Inc.); Chairman and Chief Executive Officer, Invesco Advisers, Inc. (registered investment adviser); Director, Chairman, Chief Executive Officer and President, Invesco Holding Company (US), Inc. (formerly IVZ Inc.) (holding company), Invesco Group Services, Inc. (service provider) and Invesco North American Holdings, Inc. (holding company); Director, Chief Executive Officer and President, Invesco Holding Company Limited (parent of Invesco and a global investment management firm); Director, Invesco Ltd.; Chairman, Investment Company Institute and President, Co-Chief Executive Officer, Co-President, Chief Operating Officer and Chief Financial Officer, Franklin Resources, Inc. (global investment management organization) | | 158 | | None |
Philip A. Taylor2 — 1954 Trustee and Senior Vice President | | 2006 | | Head of the Americas and Senior Managing Director, Invesco Ltd.; Director, Invesco Advisers, Inc. (formerly known as Invesco Institutional (N.A.), Inc.) (registered investment adviser); Director, Chairman, Chief Executive Officer and President, Invesco Management Group, Inc. (formerly known as Invesco Aim Management Group, Inc.) (financial services holding company); Director and Chairman, Invesco Investment Services, Inc. (formerly known as Invesco Aim Investment Services, Inc.) (registered transfer agent); Chief Executive Officer, Invesco Corporate Class Inc. (corporate mutual fund company); Director, Chairman and Chief Executive Officer, Invesco Canada Ltd. (formerly known as Invesco Trimark Ltd./Invesco Trimark Ltèe) (registered investment adviser and registered transfer agent); Trustee and Senior Vice President, The Invesco Funds; Director, Invesco Investment Advisers LLC (formerly known as Van Kampen Asset Management). Formerly: Co-Chairman, Co-President and Co-Chief Executive Officer, Invesco Advisers, Inc. (formerly known as Invesco Institutional (N.A.), Inc.) (registered investment adviser); Director, Chief Executive Officer and President, Van Kampen Exchange Corp; President and Principal Executive Officer, The Invesco Funds (other than AIM Treasurer’s Series Trust (Invesco Treasurer’s Series Trust), Short-Term Investments Trust and Invesco Management Trust); Executive Vice President, The Invesco Funds (AIM Treasurer’s Series Trust (Invesco Treasurer’s Series Trust), Short-Term Investments Trust and Invesco Management Trust only); Director and President, INVESCO Funds Group, Inc. (registered investment adviser and registered transfer agent); Director and Chairman, IVZ Distributors, Inc. (formerly known as INVESCO Distributors, Inc.) (registered broker dealer); Director, President and Chairman, Invesco Inc. (holding company), Invesco Canada Holdings Inc. (holding company), Trimark Investments Ltd./Placements Trimark Ltèe and Invesco Financial Services Ltd/Services Financiers Invesco Ltèe; Chief Executive Officer, Invesco Canada Fund Inc. (corporate mutual fund company); Director and Chairman, Van Kampen Investor Services Inc.; Director, Chief Executive Officer and President, 1371 Preferred Inc. (holding company) and Van Kampen Investments Inc.; Director and President, AIM GP Canada Inc. (general partner for limited partnerships) and Van Kampen Advisors, Inc.; Director and Chief Executive Officer, Invesco Trimark Dealer Inc. (registered broker dealer); Director, Invesco Distributors, Inc. (formerly known as Invesco Aim Distributors, Inc.) (registered broker dealer); Manager, Invesco PowerShares Capital Management LLC; Director, Chief Executive Officer and President, Invesco Advisers, Inc.; Director, Chairman, Chief Executive Officer and President, Invesco Aim Capital Management, Inc.; President, Invesco Trimark Dealer Inc. and Invesco Trimark Ltd./Invesco Trimark Ltèe; Director and President, AIM Trimark Corporate Class Inc. and AIM Trimark Canada Fund Inc.; Senior Managing Director, Invesco Holding Company Limited; Director and Chairman, Fund Management Company (former registered broker dealer); President and Principal Executive Officer, The Invesco Funds (AIM Treasurer’s Series Trust (Invesco Treasurer’s Series Trust), and Short-Term Investments Trust only); President, AIM Trimark Global Fund Inc. and AIM Trimark Canada Fund Inc. | | 158 | | None |
| 1 | Mr. Flanagan is considered an interested person (within the meaning of Section 2(a)(19) of the 1940 Act) of the Trust because he is an officer of the Adviser to the Trust, and an officer and a director of Invesco Ltd., ultimate parent of the Adviser. |
| 2 | Mr. Taylor is considered an interested person (within the meaning of Section 2(a)(19) of the 1940 Act) of the Trust because he is an officer and a director of the Adviser. |
Invesco V.I. Value Opportunities Fund
Trustees and Officers—(continued)
| | | | | | | | |
Name, Year of Birth and
Position(s) Held with the Trust | | Trustee and/
or Officer Since | | Principal Occupation(s)
During Past 5 Years | | Number of
Funds in Fund
Complex
Overseen by
Trustee | | Other Directorship(s)
Held by Trustee During
Past 5 Years |
| Independent Trustees | | | | | | | | |
Bruce L. Crockett — 1944 Trustee and Chair | | 1993 | | Chairman, Crockett Technologies Associates (technology consulting company) Formerly: Director, Captaris (unified messaging provider); Director, President and Chief Executive Officer, COMSAT Corporation; Chairman, Board of Governors of INTELSAT (international communications company); ACE Limited (insurance company); Independent Directors Council and Investment Company Institute: Member of the Audit Committee, Investment Company Institute; Member of the Executive Committee and Chair of the Governance Committee, Independent Directors Council | | 158 | | Director and Chairman of the Audit Committee, ALPS (Attorneys Liability Protection Society) (insurance company); Director and Member of the Audit Committee and Compensation Committee, Ferroglobe PLC (metallurgical company) |
David C. Arch — 1945 Trustee | | 2010 | | Chairman of Blistex Inc. (consumer health care products manufacturer); Member, World Presidents’ Organization | | 158 | | Board member of the Illinois Manufacturers’ Association |
Jack M. Fields — 1952 Trustee | | 1997 | | Chief Executive Officer, Twenty First Century Group, Inc. (government affairs company); and Chairman, Discovery Learning Alliance (non-profit) Formerly: Owner and Chief Executive Officer, Dos Angeles Ranch L.P. (cattle, hunting, corporate entertainment); Director, Insperity, Inc. (formerly known as Administaff) (human resources provider); Chief Executive Officer, Texana Timber LP (sustainable forestry company); Director of Cross Timbers Quail Research Ranch (non-profit); and member of the U.S. House of Representatives | | 158 | | None |
Cynthia Hostetler — 1962 Trustee | | 2017 | | Non-Executive Director and Trustee of a number of public and private business corporations Formerly: Head of Investment Funds and Private Equity, Overseas Private Investment Corporation; President, First Manhattan Bancorporation, Inc.; Attorney, Simpson Thacher & Bartlett LLP | | 158 | | Vulcan Materials Company (construction materials company); Trilinc Global Impact Fund; Aberdeen Investment Funds (4 portfolios); Artio Global Investment LLC (mutual fund complex); Edgen Group, Inc. (specialized energy and infrastructure products distributor) |
Eli Jones — 1961 Trustee | | 2016 | | Professor and Dean, Mays Business School — Texas A&M University Formerly: Professor and Dean, Walton College of Business, University of Arkansas and E.J. Ourso College of Business, Louisiana State University; Director, Arvest Bank | | 158 | | Insperity, Inc. (formerly known as Administaff) (human resources provider) |
Prema Mathai-Davis — 1950 Trustee | | 1998 | | Retired. | | 158 | | None |
Teresa M. Ressel — 1962 Trustee | | 2017 | | Non-executive director and trustee of a number of public and private business corporations Formerly: Chief Financial Officer, Olayan America, The Olayan Group (international investor/commercial/industrial); Chief Executive Officer, UBS Securities LLC; Group Chief Operating Officer, Americas, UBS AG; Assistant Secretary for Management & Budget and CFO, US Department of the Treasury | | 158 | | Atlantic Power Corporation (power generation company); ON Semiconductor Corp. (semiconductor supplier) |
Ann Barnett Stern — 1957 Trustee | | 2017 | | President and Chief Executive Officer, Houston Endowment Inc. (private philanthropic institution) Formerly: Executive Vice President and General Counsel, Texas Children’s Hospital; Attorney, Beck, Redden and Secrest, LLP; Business Law Instructor, University of St. Thomas; Attorney, Andrews & Kurth LLP | | 158 | | Federal Reserve Bank of Dallas |
Raymond Stickel, Jr. — 1944 Trustee | | 2005 | | Retired. Formerly: Director, Mainstay VP Series Funds, Inc. (25 portfolios); Partner, Deloitte & Touche | | 158 | | None |
Robert C. Troccoli — 1949 Trustee | | 2016 | | Adjunct Professor, University of Denver — Daniels College of Business Formerly: Senior Partner, KPMG LLP | | 158 | | None |
Christopher L. Wilson — 1957 Trustee | | 2017 | | Non-executive director and trustee of a number of public and private business corporations Formerly: Managing Partner, CT2, LLC (investing and consulting firm); President/Chief Executive Officer, Columbia Funds, Bank of America Corporation; President/Chief Executive Officer, CDC IXIS Asset Management Services, Inc.; Principal & Director of Operations, Scudder Funds, Scudder, Stevens & Clark, Inc.; Assistant Vice President, Fidelity Investments | | 158 | | TD Asset Management USA Inc. (mutual fund complex) (22 portfolios); ISO New England, Inc. (non-profit organization managing regional electricity market) |
Invesco V.I. Value Opportunities Fund
Trustees and Officers—(continued)
| | | | | | | | |
Name, Year of Birth and
Position(s) Held with the Trust | | Trustee and/
or Officer Since | | Principal Occupation(s)
During Past 5 Years | | Number of
Funds in Fund
Complex
Overseen by
Trustee | | Other Directorship(s)
Held by Trustee During
Past 5 Years |
| Other Officers | | | | | | | | |
Sheri Morris — 1964 President, Principal Executive Officer and Treasurer | | 1999 | | President, Principal Executive Officer and Treasurer, The Invesco Funds; Vice President, Invesco Advisers, Inc. (formerly known as Invesco Institutional (N.A.), Inc.) (registered investment adviser); and Vice President, PowerShares Exchange-Traded Fund Trust, PowerShares Exchange-Traded Fund Trust II, PowerShares India Exchange-Traded Fund Trust, PowerShares Actively Managed Exchange-Traded Fund Trust, PowerShares Actively Managed Exchange-Traded Commodity Fund Trust and PowerShares Exchange-Traded Self-Indexed Fund Trust Formerly: Vice President and Principal Financial Officer, The Invesco Funds; Vice President, Invesco Aim Advisers, Inc., Invesco Aim Capital Management, Inc. and Invesco Aim Private Asset Management, Inc.; Assistant Vice President and Assistant Treasurer, The Invesco Funds and Assistant Vice President, Invesco Advisers, Inc., Invesco Aim Capital Management, Inc. and Invesco Aim Private Asset Management, Inc.; and Treasurer, PowerShares Exchange-Traded Fund Trust, PowerShares Exchange-Traded Fund Trust II, PowerShares India Exchange-Traded Fund Trust and PowerShares Actively Managed Exchange-Traded Fund Trust | | N/A | | N/A |
Russell C. Burk — 1958 Senior Vice President and Senior Officer | | 2005 | | Senior Vice President and Senior Officer, The Invesco Funds | | N/A | | N/A |
John M. Zerr — 1962 Senior Vice President, Chief Legal Officer and Secretary | | 2006 | | Director, Senior Vice President, Secretary and General Counsel, Invesco Management Group, Inc. (formerly known as Invesco AIM Management Group, Inc.); Senior Vice President, Invesco Advisers, Inc. (formerly known as Invesco Institutional (N.A.), Inc.) (registered investment adviser); Senior Vice President and Secretary, Invesco Distributors, Inc. (formerly known as Invesco AIM Distributors, Inc.); Director, Vice President and Secretary, Invesco Investment Services, Inc. (formerly known as Invesco AIM Investment Services, Inc.) Senior Vice President, Chief Legal Officer and Secretary, The Invesco Funds; Managing Director, Invesco PowerShares Capital Management LLC; Director, Secretary and General Counsel, Invesco Investment Advisers LLC (formerly known as Van Kampen Asset Management); Secretary and General Counsel, Invesco Capital Markets, Inc. (formerly known as Van Kampen Funds Inc.) and Chief Legal Officer, PowerShares Exchange-Traded Fund Trust, PowerShares Exchange-Traded Fund Trust II, PowerShares India Exchange-Traded Fund Trust, PowerShares Actively Managed Exchange-Traded Fund Trust, PowerShares Actively Managed Exchange-Traded Commodity Fund Trust and PowerShares Exchange-Traded Self-Indexed Fund Trust; Manager and Secretary, Invesco Indexing LLC Formerly: Director, Secretary, General Counsel and Senior Vice President, Van Kampen Exchange Corp.; Director, Vice President and Secretary, IVZ Distributors, Inc. (formerly known as INVESCO Distributors, Inc.); Director and Vice President, INVESCO Funds Group, Inc.; Director and Vice President, Van Kampen Advisors Inc.; Director, Vice President, Secretary and General Counsel, Van Kampen Investor Services Inc.; Director, Invesco Distributors, Inc. (formerly known as Invesco AIM Distributors, Inc.); Director, Senior Vice President, General Counsel and Secretary, Invesco AIM Advisers, Inc. and Van Kampen Investments Inc.; Director, Vice President and Secretary, Fund Management Company; Director, Senior Vice President, Secretary, General Counsel and Vice President, Invesco AIM Capital Management, Inc.; Chief Operating Officer and General Counsel, Liberty Ridge Capital, Inc. (an investment adviser); Vice President and Secretary, PBHG Funds (an investment company) and PBHG Insurance Series Fund (an investment company); Chief Operating Officer, General Counsel and Secretary, Old Mutual Investment Partners (a broker-dealer); General Counsel and Secretary, Old Mutual Fund Services (an administrator) and Old Mutual Shareholder Services (a shareholder servicing center); Executive Vice President, General Counsel and Secretary, Old Mutual Capital, Inc. (an investment adviser); and Vice President and Secretary, Old Mutual Advisors Funds (an investment company) | | N/A | | N/A |
Gregory G. McGreevey — 1962 Senior Vice President | | 2012 | | Senior Managing Director, Invesco Ltd.; Director, Chairman, President, and Chief Executive Officer, Invesco Advisers, Inc. (formerly known as Invesco Institutional (N.A.), Inc.) (registered investment adviser); Senior Vice President, Invesco Management Group, Inc.; Director, Invesco Mortgage Capital, Inc. and Invesco Senior Secured Management, Inc.; and Senior Vice President, The Invesco Funds Formerly: Assistant Vice President, The Invesco Funds | | N/A | | N/A |
Kelli Gallegos — 1970 Vice President, Principal Financial Officer and Assistant Treasurer | | 2008 | | Vice President, Principal Financial Officer and Assistant Treasurer, The Invesco Funds; Assistant Treasurer, Invesco PowerShares Capital Management LLC, PowerShares Exchange-Traded Fund Trust, PowerShares Exchange-Traded Fund Trust II, PowerShares India Exchange-Traded Fund Trust, PowerShares Actively Managed Exchange-Traded Fund Trust, PowerShares Actively Managed Exchange-Traded Commodity Fund Trust and PowerShares Exchange-Traded Self-Indexed Fund Trust Formerly: Assistant Vice President, The Invesco Funds | | N/A | | N/A |
Invesco V.I. Value Opportunities Fund
Trustees and Officers—(continued)
| | | | | | | | |
Name, Year of Birth and
Position(s) Held with the Trust | | Trustee and/
or Officer Since | | Principal Occupation(s)
During Past 5 Years | | Number of
Funds in Fund
Complex
Overseen by
Trustee | | Other Directorship(s)
Held by Trustee During
Past 5 Years |
| Other Officers—(continued) | | | | | | | | |
Tracy Sullivan — 1962 Vice President, Chief Tax Officer and Assistant Treasurer | | 2008 | | Vice President, Chief Tax Officer and Assistant Treasurer, The Invesco Funds; Assistant Treasurer, Invesco PowerShares Capital Management LLC, PowerShares Exchange-Traded Fund Trust, PowerShares Exchange-Traded Fund Trust II, PowerShares India Exchange-Traded Fund Trust, PowerShares Actively Managed Exchange-Traded Fund Trust, PowerShares Actively Managed Exchange-Traded Commodity Fund Trust and PowerShares Exchange-Traded Self-Indexed Fund Trust Formerly: Assistant Vice President, The Invesco Funds | | N/A | | N/A |
Crissie M. Wisdom — 1969 Anti-Money Laundering Compliance Officer | | 2013 | | Anti-Money Laundering Compliance Officer, Invesco Advisers, Inc. (formerly known as Invesco Institutional (N.A.), Inc.) (registered investment adviser), Invesco Capital Markets, Inc. (formerly known as Van Kampen Funds Inc.), Invesco Distributors, Inc., Invesco Investment Services, Inc., Invesco Management Group, Inc., The Invesco Funds, and PowerShares Exchange-Traded Fund Trust, PowerShares Exchange-Traded Fund Trust II, PowerShares India Exchange-Traded Fund Trust, PowerShares Actively Managed Exchange-Traded Fund Trust, PowerShares Actively Managed Exchange-Traded Commodity Fund Trust and PowerShares Exchange-Traded Self-Indexed Fund Trust; Anti-Money Laundering Compliance Officer and Bank Secrecy Act Officer, INVESCO National Trust Company and Invesco Trust Company; and Fraud Prevention Manager and Controls and Risk Analysis Manager for Invesco Investment Services, Inc. Formerly: Anti-Money Laundering Compliance Officer, Van Kampen Exchange Corp. | | N/A | | N/A |
Robert R. Leveille — 1969 Chief Compliance Officer | | 2016 | | Chief Compliance Officer, Invesco Advisers, Inc. (registered investment adviser); and Chief Compliance Officer, The Invesco Funds Formerly: Chief Compliance Officer, Putnam Investments and the Putnam Funds | | N/A | | N/A |
The Statement of Additional Information of the Trust includes additional information about the Fund’s Trustees and is available upon request, without charge, by calling 1.800.959.4246. Please refer to the Fund’s Statement of Additional Information for information on the Fund’s sub-advisers.
| | | | | | |
Office of the Fund 11 Greenway Plaza, Suite 1000 Houston, TX 77046-1173 | | Investment Adviser Invesco Advisers, Inc. 1555 Peachtree Street, N.E. Atlanta, GA 30309 | | Distributor Invesco Distributors, Inc. 11 Greenway Plaza, Suite 1000 Houston, TX 77046-1173 | | Auditors PricewaterhouseCoopers LLP 1000 Louisiana Street, Suite 5800 Houston, TX 77002-5678 |
| | | |
| | | | | | |
Counsel to the Fund Stradley Ronon Stevens & Young, LLP 2005 Market Street, Suite 2600 Philadelphia, PA 19103-7018 | | Counsel to the Independent Trustees Goodwin Procter LLP 901 New York Avenue, N.W. Washington, D.C. 20001 | | Transfer Agent Invesco Investment Services, Inc. 11 Greenway Plaza, Suite 1000 Houston, TX 77046-1173 | | Custodian State Street Bank and Trust Company 225 Franklin Street Boston, MA 02110-2801 |
Invesco V.I. Value Opportunities Fund
There were no amendments to the Code of Ethics (the “Code”) that applies to the Registrant’s Principal Executive Officer (“PEO”) and Principal Financial Officer (“PFO”) during the period covered by the report. The Registrant did not grant any waivers, including implicit waivers, from any provisions of the Code to the PEO or PFO during the period covered by this report.
| ITEM 3. | AUDIT COMMITTEE FINANCIAL EXPERT. |
The Board of Trustees has determined that the Registrant has at least one audit committee financial expert serving on its Audit Committee. The Audit Committee financial expert is Raymond Stickel, Jr. Mr. Stickel is “independent” within the meaning of that term as used in Form N-CSR.
| ITEM 4. | PRINCIPAL ACCOUNTANT FEES AND SERVICES. |
PricewaterhouseCoopers LLP informed the Trust that it has identified an issue related to its independence under Rule 2-01(c)(1)(ii)(A) of Regulation S-X (referred to as the Loan Rule). The Loan Rule prohibits accounting firms, such as PricewaterhouseCoopers LLP, from being deemed independent if they have certain financial relationships with their audit clients or certain affiliates of those clients. The Trust is required under various securities laws to have its financial statements audited by an independent accounting firm.
The Loan Rule specifically provides that an accounting firm would not be independent if it or certain affiliates and covered persons receives a loan from a lender that is a record or beneficial owner of more than ten percent of an audit client’s equity securities (referred to as a “more than ten percent owner”). For purposes of the Loan Rule, audit clients include the Funds as well as all registered investment companies advised by the Adviser and its affiliates, including other subsidiaries of the Adviser’s parent company, Invesco Ltd. (collectively, the Invesco Fund Complex). PricewaterhouseCoopers LLP informed the Trust it and certain affiliates and covered persons have relationships with lenders who hold, as record owner, more than ten percent of the shares of certain funds within the Invesco Fund Complex, which may implicate the Loan Rule.
On June 20, 2016, the SEC Staff issued a “no-action” letter to another mutual fund complex (see Fidelity Management & Research Company et al., No-Action Letter) related to the audit independence issue described above. In that letter, the SEC confirmed that it would not recommend enforcement action against a fund that relied on audit services performed by an audit firm that was not in compliance with the Loan Rule in certain specified circumstances. In connection with prior independence determinations, PricewaterhouseCoopers LLP communicated, as contemplated by the no-action letter, that it believes that it remains objective and impartial and that a reasonable investor possessing all the facts would conclude that PricewaterhouseCoopers LLP is able to exhibit the requisite objectivity and impartiality to report on the Funds’ financial statements as the independent registered public accounting firm. PricewaterhouseCoopers LLP also represented that it has complied with PCAOB Rule 3526(b)(1) and (2), which are conditions to the Funds relying on the no action letter, and affirmed that it is an independent accountant within the meaning of PCAOB Rule 3520. Therefore, the Adviser, the Funds and PricewaterhouseCoopers LLP concluded that PricewaterhouseCoopers LLP could continue as the Funds’ independent registered public accounting firm. The Invesco Fund Complex relied upon the no-action letter in reaching this conclusion.
If in the future the independence of PricewaterhouseCoopers LLP is called into question under the Loan Rule by circumstances that are not addressed in the SEC’s no-action letter, the Funds will need to take other action in order for the Funds’ filings with the SEC containing financial statements to be deemed compliant with applicable securities laws. Such additional actions could result in additional costs, impair the ability of the Funds to issue new shares or have other material adverse effects on the Funds. The SEC no-action relief was initially set to expire 18 months from issuance but has been extended by the SEC without an expiration date, except that the no-action letter will be withdrawn upon the effectiveness of any amendments to the Loan Rule designed to address the concerns expressed in the letter.
(a) to (d)
Fees Billed by PWC Related to the Registrant
PWC billed the Registrant aggregate fees for services rendered to the Registrant for the last two fiscal years as follows:
| | | | | | | | |
| | | Fees Billed for
Services
Rendered to the
Registrant for
fiscal year end | | | Fees Billed for
Services Rendered
to the Registrant
for fiscal year end | |
| | | 2017 | | | 2016 | |
Audit Fees | | $ | 592,375 | | | $ | 569,575 | |
Audit-Related Fees | | $ | 0 | | | $ | 0 | |
Tax Fees(1) | | $ | 149,984 | | | $ | 146,702 | |
All Other Fees | | $ | 0 | | | $ | 0 | |
| | | | | | | | |
Total Fees | | $ | 742,359 | | | $ | 716,277 | |
(g) PWC billed the Registrant aggregate non-audit fees of $149,984 for the fiscal year ended 2017, and $146,702 for the fiscal year ended 2016, for non-audit services rendered to the Registrant.
| (1) | Tax fees for the fiscal year end December 31, 2017 includes fees billed for reviewing tax returns and/or services related to tax compliance. Tax fees for fiscal year end December 31, 2016 includes fees billed for reviewing tax returns and/or services related to tax compliance. |
Fees Billed by PWC Related to Invesco and Invesco Affiliates
PWC billed Invesco Advisers, Inc. (“Invesco”), the Registrant’s adviser, and any entity controlling, controlled by or under common control with Invesco that provides ongoing services to the Registrant (“Invesco Affiliates”) aggregate fees for pre-approved non-audit services rendered to Invesco and Invesco Affiliates for the last two fiscal years as follows:
| | | | | | | | |
| | | Fees Billed for
Non-Audit
Services Rendered
to Invesco and
Invesco Affiliates
for fiscal year end
2017 That Were
Required
to be Pre-
Approved
by the Registrant’s
Audit Committee | | | Fees Billed for
Non-Audit
Services Rendered
to Invesco and
Invesco Affiliates
for fiscal year end
2016 That Were
Required
to be Pre-
Approved
by the Registrant’s
Audit Committee | |
Audit-Related Fees | | $ | 662,000 | | | $ | 635,000 | |
Tax Fees | | $ | 0 | | | $ | 0 | |
All Other Fees | | $ | 1,006,000 | | | $ | 2,432,000 | |
| | | | | | | | |
Total Fees(1) | | $ | 1,668,000 | | | $ | 3,067,000 | |
| (1) | Audit-Related fees for the year end 2017 include fees billed related to reviewing controls at a service organization. Audit-Related fees for the year end 2016 include fees billed related to reviewing controls at a service organization. |
All other fees for the year end 2017 include fees billed related to the assessments for certain of the company’s risk management tools, current state analysis against regulatory requirements and identification of structural and organizational alternatives, informed by industry practices, for certain of the company’s administrative activities and functions. All other fees for the year end 2016 include fees billed related to the identification of structural and organizational alternatives, informed by industry practices, for certain of the company’s administrative activities and functions.
(e)(2) There were no amounts that were pre-approved by the Audit Committee pursuant to the de minimus exception under Rule 2-01 of Regulation S-X.
(f) Not applicable.
(g) Including the fees for services not required to be pre-approved by the registrant’s audit committee, PWC billed Invesco and Invesco Affiliates aggregate non-audit fees of $4,496,000 for the fiscal year ended December 31, 2017, and $5,763,000 for the fiscal year ended December 31, 2016, for non-audit services rendered to Invesco and Invesco Affiliates.
PWC provided audit services to the Investment Company complex of approximately $23 million.
(h) The Audit Committee also has considered whether the provision of non-audit services that were rendered to Invesco and Invesco Affiliates that were not required to be pre-approved pursuant to SEC regulations, if any, is compatible with maintaining PWC’s independence.
(e)(1)
PRE-APPROVAL OF AUDIT AND NON-AUDIT SERVICES
POLICIES AND PROCEDURES
As adopted by the Audit Committees
of the Invesco Funds (the “Funds”)
Last Amended May 4, 2016
| | I. | Statement of Principles |
The Audit Committees (the “Audit Committee”) of the Boards of Trustees of the Funds (the “Board”) have adopted these policies and procedures (the “Procedures”) with respect to the pre-approval of audit and non-audit services to be provided by the Funds’ independent auditor (the “Auditor”) to the Funds, and to the Funds’ investment adviser(s) and any entity controlling, controlled by, or under common control with the investment adviser(s) that provides ongoing services to the Funds (collectively, “Service Affiliates”).
Under Section 202 of the Sarbanes-Oxley Act of 2002, all audit and non-audit services provided to the Funds by the Auditor must be preapproved by the Audit Committee. Rule 2-01 of Regulation S-X requires that the Audit Committee also pre-approve a Service Affiliate’s engagement of the Auditor for non-audit services if the engagement relates directly to the operations and financial reporting of the Funds (a “Service Affiliate’s Covered Engagement”).
These Procedures set forth the procedures and the conditions pursuant to which the Audit Committee may pre-approve audit and non-audit services for the Funds and a Service Affiliate’s Covered Engagement pursuant to rules and regulations of the Securities and Exchange Commission (“SEC”) and other organizations and regulatory bodies applicable to the Funds (“Applicable Rules”).1 They address both general pre-approvals without consideration of specific case-by-case services (“general pre-approvals”) and pre-approvals on a case-by-case basis (“specific pre-approvals”). Any services requiring pre-approval that are not within the scope of general pre-approvals hereunder are subject to specific pre-approval. These Procedures also address the delegation by the Audit Committee of pre-approval authority to the Audit Committee Chair or Vice Chair.
| | II. | Pre-Approval of Fund Audit Services |
The annual Fund audit services engagement, including terms and fees, is subject to specific pre-approval by the Audit Committee. Audit services include the annual financial statement audit and other procedures required to be performed by an independent auditor to be able to form an opinion on the Funds’ financial statements. The Audit Committee will receive, review and consider sufficient information concerning a proposed Fund audit engagement to make a reasonable evaluation of the Auditor’s qualifications and independence. The Audit Committee will oversee the Fund audit services engagement as necessary, including approving any changes in terms, audit scope, conditions and fees.
In addition to approving the Fund audit services engagement at least annually and specifically approving any changes, the Audit Committee may generally or specifically pre-approve engagements for other audit services, which are those services that only an independent auditor reasonably can provide. Other audit services may include services associated with SEC registration statements, periodic reports and other documents filed with the SEC.
| | III. | General and Specific Pre-Approval of Non-Audit Fund Services |
| 1 | Applicable Rules include, for example, New York Stock Exchange (“NYSE”) rules applicable to closed-end funds managed by Invesco and listed on NYSE. |
The Audit Committee will consider, at least annually, the list of General Pre-Approved Non-Audit Services which list may be terminated or modified at any time by the Audit Committee. To inform the Audit Committee’s review and approval of General Pre-Approved Non-Audit Services, the Funds’ Treasurer (or his or her designee) and Auditor shall provide such information regarding independence or other matters as the Audit Committee may request.
Any services or fee ranges that are not within the scope of General Pre-Approved Non-Audit Services have not received general pre-approval and require specific pre-approval. Each request for specific pre-approval by the Audit Committee for services to be provided by the Auditor to the Funds must be submitted to the Audit Committee by the Funds’ Treasurer (or his or her designee) and must include detailed information about the services to be provided, the fees or fee ranges to be charged, and other relevant information sufficient to allow the Audit Committee to consider whether to pre-approve such engagement, including evaluating whether the provision of such services will impair the independence of the Auditor and is otherwise consistent with Applicable Rules.
| | IV. | Non-Audit Service Types |
The Audit Committee may provide either general or specific pre-approval of audit-related, tax or other services, each as described in more detail below.
“Audit-related services” are assurance and related services that are reasonably related to the performance of the audit or review of the Fund’s financial statements or that are traditionally performed by an independent auditor. Audit-related services include, among others, accounting consultations related to accounting, financial reporting or disclosure matters not classified as “Audit services”; assistance with understanding and implementing new accounting and financial reporting guidance from rulemaking authorities; services related to mergers, acquisitions or dispositions; compliance with ratings agency requirements and interfund lending activities; and assistance with internal control reporting requirements.
“Tax services” include, but are not limited to, the review and signing of the Funds’ federal tax returns, the review of required distributions by the Funds and consultations regarding tax matters such as the tax treatment of new investments or the impact of new regulations. The Audit Committee will not approve proposed services of the Auditor which the Audit Committee believes are to be provided in connection with a service or transaction initially recommended by the Auditor, the sole business purpose of which may be tax avoidance and the tax treatment of which may not be supported in the Internal Revenue Code and related regulations. The Audit Committee will consult with the Funds’ Treasurer (or his or her designee) and may consult with outside counsel or advisers as necessary to ensure the consistency of tax services rendered by the Auditor with the foregoing policy. The Auditor shall not represent any Fund or any Service Affiliate before a tax court, district court or federal court of claims.
Each request to provide tax services under either the general or specific pre-approval of the Audit Committee will include a description from the Auditor in writing of (i) the scope of the service, the fee structure for the engagement, and any side letter or other amendment to the engagement letter, or any other agreement (whether oral, written, or otherwise) between the Auditor and the Funds, relating to the service; and (ii) any compensation arrangement or other agreement, such as a referral agreement, a referral fee or fee-sharing arrangement, between the Auditor (or an affiliate of the Auditor) and any person (other than the Funds or Service Affiliates receiving the services) with respect to the promoting, marketing, or recommending of a transaction covered by the service. The Auditor will also discuss with
the Audit Committee the potential effects of the services on the independence of the Auditor, and document the substance of its discussion with the Audit Committee.
The Audit Committee may pre-approve other non-audit services so long as the Audit Committee believes that the service will not impair the independence of the Auditor. Appendix I includes a list of services that the Auditor is prohibited from performing by the SEC rules. Appendix I also includes a list of services that would impair the Auditor’s independence unless the Audit Committee reasonably concludes that the results of the services will not be subject to audit procedures during an audit of the Funds’ financial statements.
| | V. | Pre-Approval of Service Affiliate’s Covered Engagements |
Rule 2-01 of Regulation S-X requires that the Audit Committee pre-approve a Service Affiliate’s engagement of the Auditor for non-audit services if the engagement relates directly to the operations and financial reporting of the Funds, defined above as a “Service Affiliate’s Covered Engagement”.
The Audit Committee may provide either general or specific pre-approval of any Service Affiliate’s Covered Engagement, including for audit-related, tax or other services, as described above, if the Audit Committee believes that the provision of the services to a Service Affiliate will not impair the independence of the Auditor with respect to the Funds. Any Service Affiliate’s Covered Engagements that are not within the scope of General Pre-Approved Non-Audit Services have not received general pre-approval and require specific pre-approval.
Each request for specific pre-approval by the Audit Committee of a Service Affiliate’s Covered Engagement must be submitted to the Audit Committee by the Funds’ Treasurer (or his or her designee) and must include detailed information about the services to be provided, the fees or fee ranges to be charged, a description of the current status of the pre-approval process involving other audit committees in the Invesco investment company complex (as defined in Rule 2-201 of Regulation S-X) with respect to the proposed engagement, and other relevant information sufficient to allow the Audit Committee to consider whether the provision of such services will impair the independence of the Auditor from the Funds. Additionally, the Funds’ Treasurer (or his or her designee) and the Auditor will provide the Audit Committee with a statement that the proposed engagement requires pre-approval by the Audit Committee, the proposed engagement, in their view, will not impair the independence of the Auditor and is consistent with Applicable Rules, and the description of the proposed engagement provided to the Audit Committee is consistent with that presented to or approved by the Invesco audit committee.
Information about all Service Affiliate engagements of the Auditor for non-audit services, whether or not subject to pre-approval by the Audit Committee, shall be provided to the Audit Committee at least quarterly, to allow the Audit Committee to consider whether the provision of such services is compatible with maintaining the Auditor’s independence from the Funds. The Funds’ Treasurer and Auditor shall provide the Audit Committee with sufficiently detailed information about the scope of services provided and the fees for such services, to ensure that the Audit Committee can adequately consider whether the provision of such services is compatible with maintaining the Auditor’s independence from the Funds.
| | VI. | Pre-Approved Fee Levels or Established Amounts |
Pre-approved fee levels or ranges for audit and non-audit services to be provided by the Auditor to the Funds, and for a Service Affiliate’s Covered Engagement, under general pre-approval or specific pre-approval will be set periodically by the Audit Committee. Any proposed fees exceeding 110% of the maximum pre-approved fee levels or ranges for such services or engagements will be promptly presented
to the Audit Committee and will require specific pre-approval by the Audit Committee before payment of any additional fees is made.
The Audit Committee may from time to time delegate specific pre-approval authority to its Chair and/or Vice Chair, so that the Chair or, in his or her absence, Vice Chair may grant specific pre-approval for audit and non-audit services by the Auditor to the Funds and/or a Service Affiliate’s Covered Engagement between Audit Committee meetings. Any such delegation shall be reflected in resolutions adopted by the Audit Committee and may include such limitations as to dollar amount(s) and/or scope of service(s) as the Audit Committee may choose to impose. Any such delegation shall not preclude the Chair or Vice Chair from declining, on a case by case basis, to exercise his or her delegated authority and instead convening the Audit Committee to consider and pre-approve any proposed services or engagements.
Notwithstanding the foregoing, any non-audit services to be provided to the Funds for which the fees are estimated to exceed $500,000 and any Service Affiliate’s Covered Engagement for which the fees are estimated to exceed $500,000 must be pre-approved by the Audit Committee and may not be delegated to the Chair or Vice Chair.
| | VIII. | Compliance with Procedures |
Notwithstanding anything herein to the contrary, failure to pre-approve any services or engagements that are not required to be pre-approved pursuant to the de minimis exception provided for in Rule 2-01(c)(7)(i)(C) of Regulation S-X shall not constitute a violation of these Procedures. The Audit Committee has designated the Funds’ Treasurer to ensure services and engagements are pre-approved in compliance with these Procedures. The Funds’ Treasurer will immediately report to the Chair of the Audit Committee, or the Vice Chair in his or her absence, any breach of these Procedures that comes to the attention of the Funds’ Treasurer or any services or engagements that are not required to be pre-approved pursuant to the de minimis exception provided for in Rule 2-01(c)(7)(i)(C) of Regulation S-X.
On at least an annual basis, the Auditor will provide the Audit Committee with a summary of all non-audit services provided to any entity in the investment company complex (as defined in section 2-01(f)(14) of Regulation S-X, including the Funds and Service Affiliates) that were not pre-approved, including the nature of services provided and the associated fees.
| | IX. | Amendments to Procedures |
All material amendments to these Procedures must be approved in advance by the Audit Committee. Non-material amendments to these Procedures may be made by the Legal and Compliance Departments and will be reported to the Audit Committee at the next regularly scheduled meeting of the Audit Committee.
Appendix I
Non-Audit Services That May Impair the Auditor’s Independence
The Auditor is not independent if, at any point during the audit and professional engagement, the Auditor provides the following non-audit services:
| | • | | Broker-dealer, investment adviser, or investment banking services; |
| | • | | Expert services unrelated to the audit; |
| | • | | Any service or product provided for a contingent fee or a commission; |
| | • | | Services related to marketing, planning, or opining in favor of the tax treatment of confidential transactions or aggressive tax position transactions, a significant purpose of which is tax avoidance; |
| | • | | Tax services for persons in financial reporting oversight roles at the Fund; and |
| | • | | Any other service that the Public Company Oversight Board determines by regulation is impermissible. |
An Auditor is not independent if, at any point during the audit and professional engagement, the Auditor provides the following non-audit services unless it is reasonable to conclude that the results of the services will not be subject to audit procedures during an audit of the Funds’ financial statements:
| | • | | Bookkeeping or other services related to the accounting records or financial statements of the audit client; |
| | • | | Financial information systems design and implementation; |
| | • | | Appraisal or valuation services, fairness opinions, or contribution-in-kind reports; |
| | • | | Actuarial services; and |
| | • | | Internal audit outsourcing services. |
| ITEM 5. | AUDIT COMMITTEE OF LISTED REGISTRANTS. |
Not applicable.
| ITEM 6. | SCHEDULE OF INVESTMENTS. |
Investments in securities of unaffiliated issuers is included as part of the reports to stockholders filed under Item 1 of this Form.
| ITEM 7. | DISCLOSURE OF PROXY VOTING POLICIES AND PROCEDURES FOR CLOSED-END MANAGEMENT INVESTMENT COMPANIES. |
Not applicable.
| ITEM 8. | PORTFOLIO MANAGERS OF CLOSED-END MANAGEMENT COMPANIES. |
Not applicable.
| ITEM 9. | PURCHASES OF EQUITY SECURITIES BY CLOSED-END MANAGEMENT INVESTMENT COMPANY AND AFFILIATED PURCHASERS. |
Not applicable.
| ITEM 10. | SUBMISSION OF MATTERS TO A VOTE OF SECURITY HOLDERS. |
None
| ITEM 11. | CONTROLS AND PROCEDURES. |
| (a) | As of February 14, 2018, an evaluation was performed under the supervision and with the participation of the officers of the Registrant, including the PEO and PFO, to assess the effectiveness of the Registrant’s disclosure controls and procedures, as that term is defined in Rule 30a-3(c) under the Investment Company Act of 1940 (the “Act”), as amended. Based on that evaluation, the Registrant’s officers, including the PEO and PFO, concluded that, as of February 14, 2018, the Registrant’s disclosure controls and procedures were reasonably designed to ensure: (1) that information required to be disclosed by the Registrant on Form N-CSR is recorded, processed, summarized and reported within the time periods specified by the rules and forms of the Securities and Exchange Commission; and (2) that material information relating to the Registrant is made known to the PEO and PFO as appropriate to allow timely decisions regarding required disclosure. |
| (b) | There have been no changes in the Registrant’s internal control over financial reporting (as defined in Rule 30a-3(d) under the Act) that occurred during the second fiscal quarter of the period covered by this report that have materially affected, or are reasonably likely to materially affect, the Registrant’s internal control over financial reporting. |
| ITEM 12. | DISCLOSURE OF SECURITIES LENDING ACTIVITIES FOR CLOSED-END MANAGEMENT INVESTMENT COMPANIES. |
Not applicable.
| | |
| 13(a) (1) | | Code of Ethics. |
| |
| 13(a) (2) | | Certifications of principal executive officer and principal financial officer as required by Rule 30a-2(a) under the Investment Company Act of 1940. |
| |
| 13(a) (3) | | Not applicable. |
| |
| 13(a) (4) | | Not applicable. |
SIGNATURES
Pursuant to the requirements of the Securities Exchange Act of 1934 and the Investment Company Act of 1940, the Registrant has duly caused this report to be signed on its behalf by the undersigned, thereunto duly authorized.
Registrant: AIM Variable Insurance Funds (Invesco Variable Insurance Funds)
| | |
| By: | | /s/ Sheri Morris |
| | Sheri Morris |
| | Principal Executive Officer |
| |
Date: | | February 23, 2018 |
Pursuant to the requirements of the Securities and Exchange Act of 1934 and the Investment Company Act of 1940, this report has been signed below by the following persons on behalf of the Registrant and in the capacities and on the dates indicated.
| | |
By: | | /s/ Sheri Morris |
| | Sheri Morris |
| | Principal Executive Officer |
| |
Date: | | February 23, 2018 |
| |
By: | | /s/ Kelli Gallegos |
| | Kelli Gallegos |
| | Principal Financial Officer |
| |
Date: | | February 23, 2018 |
EXHIBIT INDEX
| | |
| 13(a) (1) | | Code of Ethics. |
| |
| 13(a) (2) | | Certifications of principal executive officer and principal financial officer as required by Rule 30a-2(a) under the Investment Company Act of 1940. |
| |
| 13(a) (3) | | Not applicable. |
| |
| 13(a) (4) | | Not applicable. |